Embed Size (px)
Citation preview

© 2005 International Monetary Fund July 2005 IMF Country Report No. 05/247
[Month, Day], 2001 August 2, 2001 January 29, 2001 [Month, Day], 2001 August 2, 2001
Democratic Republic of Timor-Leste: Poverty Reduction Strategy Paper—National Development Plan, Road Map for Implementation of National Development Plan, Overview of Sector Investment
Programs—Strategies and Priorities for the Medium Term
Poverty Reduction Strategy Papers (PRSPs) are prepared by member countries in broad consultation with stakeholders and development partners, including the staffs of the World Bank and the IMF. Updated every three years with annual progress reports, they describe the country's macroeconomic, structural, and social policies in support of growth and poverty reduction, as well as associated external financing needs and major sources of financing. This country document for the Democratic Republic of Timor-Leste, dated April 2005, is being made available on the IMF website by agreement with the member country as a service to users of the IMF website.
To assist the IMF in evaluating the publication policy, reader comments are invited and may be sent by e-mail to [email protected].
Copies of this report are available to the public from
International Monetary Fund • Publication Services 700 19th Street, N.W. • Washington, D.C. 20431
Telephone: (202) 623-7430 • Telefax: (202) 623-7201 E-mail: [email protected] • Internet: http://www.imf.org
Price: $15.00 a copy
International Monetary Fund
Washington, D.C.


NATIONAL DEVELOPMENT PLAN
Planning CommissionDili
May 2002
After independence on 20 May 2002, the draft Plan will bepresented to the Parliament for consideration and adoption.
i
Table of Contents
LIST OF ACRONYMS AND GLOSSARY...........................................................................................III
Foreword.......................................................................................................................................VI
Foreword......................................................................................................................................VII
VISION......................................................................................................................................... VIII
EXECUTIVE SUMMARYINTRODUCTION .......................................................................................................................... 1DEVELOPMENT STRATEGY......................................................................................................... 1POVERTY REDUCTION STRATEGY .............................................................................................. 2CAPACITY BUILDING FOR PLAN IMPLEMENTATION ................................................................... 3MONITORING, EVALUATION, AND PLANNING REVIEW .............................................................. 5MACROECONOMICS AND PUBLIC FINANCE POLICY FRAMEWORK.............................................. 5MEDIUM TERM ECONOMIC AND FINANCING OUTLOOK ............................................................. 6POLITICAL DEVELOPMENT, FOREIGN RELATIONS, DEFENCE AND SECURITY............................. 7POVERTY REDUCTION, RURAL AND REGIONAL DEVELOPMENT................................................. 8HUMAN DEVELOPMENT: EDUCATION AND HEALTH .................................................................. 9AGRICULTURE, FISHERIES AND FORESTRY .............................................................................. 10NATURAL RESOURCES AND ENVIRONMENT ............................................................................. 11INDUSTRY, TRADE AND THE PRIVATE SECTOR......................................................................... 11INFRASTRUCTURE .................................................................................................................... 12
PART 1 VISION AND STRATEGIES
1. INTRODUCTIONBACKGROUND.......................................................................................................................... 14THE PLANNING PROCESS.......................................................................................................... 14ORGANIZATION OF THE DOCUMENT........................................................................................ 15
2. VISION, GOALS, PRINCIPLES AND INDICATORSTHE LAND AND THE PEOPLE.................................................................................................... 17THE ECONOMY......................................................................................................................... 18THE DEVELOPMENT VISION ..................................................................................................... 19DEVELOPMENT GOALS............................................................................................................. 20GUIDING PRINCIPLES ............................................................................................................... 21KEY DEVELOPMENT INDICATORS ............................................................................................ 23
3. THE DEVELOPMENT STRATEGYINTRODUCTION ........................................................................................................................ 24THE DEVELOPMENT STRATEGY ............................................................................................... 25
Poverty Reduction............................................................................................................. 25Gender Mainstreaming and Empowerment of Women .................................................... 25Human Resources Development ....................................................................................... 26Language and Communication ......................................................................................... 27Transforming Subsistence Production into a Market-based Economy............................. 27Improving Productivity and Modernising Production ...................................................... 28Creating an Enabling Environment for the Private Sector to Flourish ............................. 28Managing Public Finances ................................................................................................ 29

ii
Administration of Oil and Gas Revenues ......................................................................... 30GOVERNANCE AND MACROECONOMIC MANAGEMENT............................................................ 30
Governance ....................................................................................................................... 30Macroeconomic Management........................................................................................... 30
4. POVERTY REDUCTION STRATEGYINTRODUCTION ........................................................................................................................ 32POVERTY IN EAST TIMOR ........................................................................................................ 33CAUSES OF POVERTY ............................................................................................................... 34CONSEQUENCES OF POVERTY .................................................................................................. 35POVERTY REDUCTION STRATEGY............................................................................................ 36
Opportunities for Economic Participation ........................................................................ 37Basic Social Services ........................................................................................................ 38Security ............................................................................................................................. 38Empowerment ................................................................................................................... 40
CONCLUSIONS.......................................................................................................................... 41
5. CAPACITY BUILDING FOR PLAN IMPLEMENTATIONINTRODUCTION ........................................................................................................................ 42GOVERNMENT AND GOVERNANCE .......................................................................................... 42DECENTRALISATION ................................................................................................................ 44EMPLOYMENT.......................................................................................................................... 44EDUCATION AND LITERACY..................................................................................................... 44HEALTH ................................................................................................................................... 45INFRASTRUCTURE .................................................................................................................... 45THE JUDICIARY........................................................................................................................ 45CONCLUSION ........................................................................................................................... 46
6. MONITORING, EVALUATION, AND REVIEWINTRODUCTION ........................................................................................................................ 47MONITORING PERFORMANCE AND OBJECTIVES....................................................................... 48
Monitoring at the National Level...................................................................................... 49Sector-level Monitoring.................................................................................................... 50Program-level Monitoring ................................................................................................ 50Project-level Monitoring................................................................................................... 50
EVALUATION OF PERFORMANCE RESULTS............................................................................... 51Planned Objectives ........................................................................................................... 51Measurable Benchmarks................................................................................................... 52Methods of Analysis ......................................................................................................... 52Correction Process ............................................................................................................ 53
PLANNING REVIEW .................................................................................................................. 54INSTITUTIONAL SETTING: MODEL OF PLANNING, MONITORING AND EVALUATION ................ 54CONCLUSIONS.......................................................................................................................... 55
PART 2 ECONOMIC OUTLOOK.......................................................................................... 57
7. MACROECONOMIC POLICY FRAMEWORKVISION ..................................................................................................................................... 58INTRODUCTION ........................................................................................................................ 58GOALS ..................................................................................................................................... 59
General Goals ................................................................................................................... 59Macroeconomic Goals ...................................................................................................... 59Public Finance/Fiscal Goals.............................................................................................. 59

iii
GUIDING PRINCIPLES ............................................................................................................... 59CONSTRAINTS .......................................................................................................................... 60OVERVIEW OF POLICY CHALLENGES ....................................................................................... 61GOALS, POLICY ACTIONS AND PERFORMANCE INDICATORS.................................................... 62
Goal No. 1: Institutional Strengthening ............................................................................ 62Goal No. 2: Poverty Reduction ......................................................................................... 62Goal No. 3: Pursuit of Economic Growth......................................................................... 63Goal No. 4: Pursuit of Low Inflation ................................................................................ 64Goal No. 5: Pursuit of more employment ......................................................................... 65Goal No. 6: Pursuit of stronger banking and finance sector ............................................. 65Goal No. 7: Pursuit of a stronger external sector .............................................................. 66Goal No. 8: Pursuit of improved revenue collections....................................................... 67Goal No. 9: maximise collections and savings from timor sea revenues ......................... 67Goal No. 10: pursue creative and effective expenditure programs................................... 68Goal No. 11: pursue appropriate deficit and financing policies ....................................... 68
SUMMARY OF PROGRAMS / PROJECTS SPECIFIC TO MACROECONOMICS
/ PUBLIC FINANCE SECTOR....................................................................................................... 70
8. MEDIUM TERM ECONOMIC AND FINANCING OUTLOOKINTRODUCTION ........................................................................................................................ 72ECONOMIC GROWTH................................................................................................................ 73EMPLOYMENT/UNEMPLOYMENT.............................................................................................. 75PRICES AND WAGES................................................................................................................. 77FISCAL/BUDGET....................................................................................................................... 78
Domestic Revenues........................................................................................................... 78Timor Sea Oil and Gas Revenues ..................................................................................... 78Total Expenditures ............................................................................................................ 80Recurrent and Capital / Development Shares of Total Combined Sources Expenditure.. 82Financing the Deficit and Aid........................................................................................... 86
BANKING AND FINANCE........................................................................................................... 87EXTERNAL/BALANCE OF PAYMENTS........................................................................................ 87TWO CRITICAL FINANCING ISSUES........................................................................................... 88PROPOSED MANAGEMENT APPROACHES AND OUTLOOK FOR OIL AND GAS REVENUES .......... 89
Introduction....................................................................................................................... 89Proposed Management Approaches.................................................................................. 89Financial Outlook.............................................................................................................. 91
AID MANAGEMENT POLICY AND THE PREFERRED FORWARD ODA PROGRAM........................ 91CFET Budget Support....................................................................................................... 91Aid Policy ......................................................................................................................... 92Future ODA Programs and Projects.................................................................................. 93
PART 3 STRATEGIES FOR NATIONAL DEVELOPMENT: SECTORALPLANS .................................................................................................................. 105
9. POLITICAL DEVELOPMENT, FOREIGN RELATIONS, DEFENCE AND SECURITYVISION ................................................................................................................................... 106INTRODUCTION ...................................................................................................................... 106GOALS ................................................................................................................................... 107OBJECTIVES ........................................................................................................................... 108GUIDING PRINCIPLES ............................................................................................................. 109
iv
KEY DEVELOPMENT INDICATORS .......................................................................................... 111Parliament ....................................................................................................................... 111Public Administration ..................................................................................................... 111Security and Defence Forces .......................................................................................... 111Foreign Affairs................................................................................................................ 111Public Prosecution and Defence ..................................................................................... 111Ombudsman’s Office...................................................................................................... 111Promotion of Gender Equality........................................................................................ 112Media .............................................................................................................................. 112Civil Society ................................................................................................................... 112
PROBLEMS AND CONSTRAINTS .............................................................................................. 112General constraints: ........................................................................................................ 112More specific constraints: ............................................................................................... 113
STRATEGIES........................................................................................................................... 113POLICIES ................................................................................................................................ 114
General Policies .............................................................................................................. 114Public Administration and Democratisation Policies ..................................................... 114Security and Defence Forces .......................................................................................... 115External Relations........................................................................................................... 115Justice, Human Rights and Gender Equality .................................................................. 115
PROGRAMS ............................................................................................................................ 116Public Administration and Governance.......................................................................... 116
Transparent governance ......................................................................................................................116Institutional Development....................................................................................................................117Decentralisation and Participation .....................................................................................................117
Media Development........................................................................................................ 117Security and Defence Forces .......................................................................................... 117
Defence program .................................................................................................................................117Police and Security Service Programs.................................................................................................117
External Relations........................................................................................................... 118Capacity Building Program ............................................................................................ 118
Policy Development Program..............................................................................................................118Action Program....................................................................................................................................118
Justice, Human Rights and Gender Equality .................................................................. 118Institutional Development Program.....................................................................................................119Legislative Program ............................................................................................................................119Reconciliation Program.......................................................................................................................119Rights and Equality Program ..............................................................................................................119
10. POVERTY REDUCTION, RURAL AND REGIONAL DEVELOPMENTVISION ................................................................................................................................... 121INTRODUCTION ...................................................................................................................... 121
Poverty Reduction........................................................................................................... 121Rural Development ......................................................................................................... 122Regional Development ................................................................................................... 122
GOALS ................................................................................................................................... 123GUIDING PRINCIPLES ............................................................................................................. 124KEY DEVELOPMENT INDICATORS .......................................................................................... 125PROBLEMS AND CONSTRAINTS .............................................................................................. 125
Resource Constraints ...................................................................................................... 125Social Aspects................................................................................................................. 126Gender aspects ................................................................................................................ 126Capacity .......................................................................................................................... 126Infrastructure................................................................................................................... 127

v
Rural-urban and regional disparities ............................................................................... 127Private sector................................................................................................................... 127Governance ..................................................................................................................... 127
STRATEGIES AND POLICIES INCLUDING PROGRAMS AND PROJECTS ....................................... 128POVERTY REDUCTION............................................................................................................ 128
Creating economic opportunities .................................................................................... 128Providing social services................................................................................................. 130Enhancing security including disaster preparedness and safety nets .............................. 130
Security.................................................................................................................................................130Disaster preparedness..........................................................................................................................131Vulnerable groups................................................................................................................................132Empowering the people........................................................................................................................133Gender dimensions...............................................................................................................................134
RURAL DEVELOPMENT........................................................................................................... 135REGIONAL DEVELOPMENT ..................................................................................................... 137CIVIL SERVICE........................................................................................................................ 138
Immigration Service........................................................................................................ 140National Archives ........................................................................................................... 140Labour ............................................................................................................................. 141
11. SOCIAL AND HUMAN DEVELOPMENT:EDUCATION AND HEALTHVISION ................................................................................................................................... 143BACKGROUND AND STATUS................................................................................................... 143
Education ........................................................................................................................ 143Health .............................................................................................................................. 144Gender ............................................................................................................................. 145
GOALS ................................................................................................................................... 145GUIDING PRINCIPLES ............................................................................................................. 145KEY DEVELOPMENT INDICATORS .......................................................................................... 146
Education ........................................................................................................................ 146Health .............................................................................................................................. 146Labour ............................................................................................................................. 147Economic, Social and Culture......................................................................................... 147Gender Equality .............................................................................................................. 147
PROBLEMS AND CONSTRAINTS............................................................................................... 148Problems And Constraints Common To Both Sectors.................................................... 148
Literacy ................................................................................................................................................148Culture .................................................................................................................................................148Poverty .................................................................................................................................................148Poor nutrition.......................................................................................................................................148Infrastructure .......................................................................................................................................149Quality of services................................................................................................................................149Resource constraints ............................................................................................................................149Legal Framework .................................................................................................................................149Gender related issues ...........................................................................................................................149Sector Specific Problems And Constraints...........................................................................................149Education .............................................................................................................................................149Health...................................................................................................................................................151
OBJECTIVES ........................................................................................................................... 152Education ........................................................................................................................ 152Health .............................................................................................................................. 153
POLICIES ................................................................................................................................ 154Education ........................................................................................................................ 154Health .............................................................................................................................. 154
STRATEGIES ........................................................................................................................... 155

vi
Overall Strategies.............................................................................................................155Education............................................................................................................................................. 155Health .................................................................................................................................................. 155Gender ................................................................................................................................................. 155
Specific Strategies............................................................................................................156Education............................................................................................................................................. 156Health .................................................................................................................................................. 157
PROGRAMS AND PROJECTS .................................................................................................... 160Education ........................................................................................................................ 160
Program 1: Expand Access and Improve Internal Efficiency..............................................................160Program 2: Improve the Quality of Education ....................................................................................160Program 3: Build Internal Management Capacity and Improve Services Delivery ............................161Program 4: Non-Formal Education and Adult Literacy......................................................................161Program 5: Develop Tertiary Education .............................................................................................162Program 6: Promote East Timorese Culture and the Arts...................................................................162Program 7: Promote Youth Welfare ....................................................................................................162Program 8: Promote Physical Education and School Sports ..............................................................162
Program Priorities ........................................................................................................... 163Health.............................................................................................................................. 163
Program 1: Child Health .....................................................................................................................163Program 2: Maternal Health ...............................................................................................................163Program 3: Reproductive Health.........................................................................................................163Program 4: Health Promotion.............................................................................................................163Program 5: Communicable Diseases Control, including:...................................................................163Program 6: Environmental and Occupational Health.........................................................................164Program 7: Specialised Services Programs ........................................................................................164Program 8: Medical Supplies Program...............................................................................................164Program 9: Laboratory Services .........................................................................................................164Program 10: Health Facilities Rehabilitation and Development ........................................................164Program 11: District Health Services .................................................................................................164Program 12: Health Sector and Management Programs ....................................................................164Program 13: Health Policy and Planning Development .....................................................................164Program 14: Support to Administration and Finance functions..........................................................165
The Second Health Sector Rehabilitation and Development Project ..........................................................165PERFORMANCE INDICATORS .................................................................................................. 166
Gender Mainstreaming ................................................................................................... 169
12. AGRICULTURE, FISHERIES AND FORESTRYVISION.................................................................................................................................... 171INTRODUCTION ...................................................................................................................... 171
Poverty and the Agriculture Sector................................................................................. 172MISSION................................................................................................................................. 174GOALS ................................................................................................................................... 174GUIDING PRINCIPLES ............................................................................................................. 175
Sustainability .................................................................................................................. 175Efficiency........................................................................................................................ 175Equity.............................................................................................................................. 175Self-reliance .................................................................................................................... 175Values ............................................................................................................................. 175Participatory Development ............................................................................................. 175
KEY DEVELOPMENT INDICATORS .......................................................................................... 175PROBLEMS AND CONSTRAINTS.............................................................................................. 176
Capacity .......................................................................................................................... 176Management and Entrepreneurial Skills......................................................................... 176Data and Information ...................................................................................................... 177Financial Resources ........................................................................................................ 177Poor Transport, Communication, Marketing and Processing Infrastructure .................. 177

vii
Low Productivity............................................................................................................. 177Poor Quality Produce ...................................................................................................... 177State of Irrigation Schemes ............................................................................................. 177Land Tenure .................................................................................................................... 177Comparative Advantage and Diversity ........................................................................... 178Fisheries Legislation and Management........................................................................... 178Forest Degradation.......................................................................................................... 178Forestry Legislation ........................................................................................................ 178Quarantine ....................................................................................................................... 178
STRATEGIC POLICY DIRECTIONS............................................................................................ 178PROGRAMS AND PROJECTS ..................................................................................................... 179
Mission Statement........................................................................................................... 180Problems, Goals and Policies.......................................................................................... 180Crop Production Division ............................................................................................... 181
Program 1: Enhancement of Food Crops Production....................................................................181Program 2: Enhancement of Horticultural Crop Production ........................................................182Program 3: Enhancement of Industrial Crops Production ............................................................182Program 4: Support to Farmers’ Associations ................................................................................183Program 5: Crop Protection ............................................................................................................183
Livestock Division .......................................................................................................... 184Program 1: Development of Livestock Production ........................................................................184Program 2: Prevention and Eradication of Livestock Diseases.....................................................184
Irrigation Division........................................................................................................... 185Program 1: Rehabilitation of Existing Irrigation Schemes................................................................185Program 2: Establishment of Rural Water Harvesting Systems ........................................................186Program 3: Maintenance and Repair Work .......................................................................................186
Performance Targets ....................................................................................................... 186Program 4: Sector Management Recovery and Development........................................................186
Department of fisheries and marine environment........................................................... 187Mission Statement........................................................................................................... 187Problems, Goals and Policies.......................................................................................... 187
Program 1: Fisheries and Marine Environment Management ..........................................................189Program 2: Fisheries Industry Development .....................................................................................189Program 3: Aquaculture ....................................................................................................................189
Measurement ................................................................................................................... 190Department of forestry .................................................................................................... 190Mission Statement........................................................................................................... 190Problems, Goals and Policies.......................................................................................... 190
Program 1: Reforestation and Forest Rehabilitation.........................................................................191Performance Targets ....................................................................................................... 192
Program 3: Forest Production and Utilisation...................................................................................193Research And Extension Centre ..................................................................................... 193
Program 1: Research and Laboratory .................................................................................................194Program 2: Information and Extension ...............................................................................................194Program 3: Geographic Information System.......................................................................................195
Cadastral Unit ................................................................................................................. 195Program 1: Geography and Cadastre.................................................................................................196
Policy and Planning Unit ................................................................................................ 196Program/Projects ............................................................................................................. 200APPENDIX 12.1: OVERVIEW OF DONOR FUNDED PROJECTS IN THEAGRICULTURE SECTOR ............................................................................................ 205
TFET PROJECT 1 OVERVIEW................................................................................................... 205BILATERAL PROJECTS OVERVIEW.......................................................................................... 206MULTILATERAL PROJECTS OVERVIEW................................................................................... 209

viii
13. NATURAL RESOURCES AND ENVIRONMENTVISION ................................................................................................................................... 210INTRODUCTION ...................................................................................................................... 210
Poverty, Natural Resources and Environment ................................................................ 211MISSION................................................................................................................................. 212GOALS ................................................................................................................................... 212GUIDING PRINCIPLES ............................................................................................................. 213
Sustainability .................................................................................................................. 213Efficiency........................................................................................................................ 213Equity.............................................................................................................................. 213
KEY DEVELOPMENT INDICATORS .......................................................................................... 213Department of Natural and Mineral Resources .............................................................. 213Division of Environment ................................................................................................ 213
PROBLEMS AND CONSTRAINTS.............................................................................................. 214Capacity .......................................................................................................................... 214Legal and Regulatory Frameworks................................................................................. 214Data and Information ...................................................................................................... 214Financial Resources ........................................................................................................ 214Acknowledgment and Independence .............................................................................. 214
GOALS OF EACH AGENCY ..................................................................................................... 215Department of Natural and Mineral Resources .............................................................. 215Division of Environment ................................................................................................ 215
POLICIES ................................................................................................................................ 216Department of Natural and Mineral Resources .............................................................. 216Division of Environment ................................................................................................ 216
PROGRAMS AND PROJECTS.................................................................................................... 217Department of natural resources and Minerals ................................................................217
Program 1: Institutional and Capacity Building............................................................................217Program 2: Enabling Legal and Regulatory Framework ..............................................................218Program 3: Sectoral Development and Promotion........................................................................218
Division of environment ..................................................................................................219Program 1: Environmental Governance Framework for East Timor.................................................219Project 1: Development & implementation of environmental legislation............................................220Project 2: Policy development for catchments and coasts...................................................................220Project 3: Development of National Environmental Policy.................................................................220Program 1: Environmental Governance Framework for East Timor ............................................220
Department of Natural Resources & Minerals ................................................................222Division of Environment .................................................................................................223
14. INDUSTRY, TRADE AND THE PRIVATE SECTORVISION ................................................................................................................................... 224INTRODUCTION ...................................................................................................................... 224WORKING GROUP RESULTS ................................................................................................... 227
Key Development Indicators for the Five-year Plan: ..................................................... 228Issues and Constraints..................................................................................................... 228
OFFICE OF THE DIRECTOR-GENERAL (ODG) – OVERVIEW................................................... 230OFFICE OF THE DIRECTOR-GENERAL– PROGRAM SUMMARY ................................................ 230
Programs of the ODG ......................................................................................................230Key Objectives:............................................................................................................... 230Key Strategies: ................................................................................................................ 231
Program 1: Coordination of Divisional Promotions ...........................................................................231Program 2: Coordination of Policy and Regulatory Development......................................................231Program 3: Institutional Capacity Building ........................................................................................232
OFFICE OF THE DIRECTOR-GENERAL – OBJECTIVES .............................................................. 232

ix
OFFICE OF THE DIRECTOR-GENERAL – STRATEGIES .............................................................. 232OFFICE OF THE DIRECTOR-GENERAL – PROGRAMS AND PROJECTS........................................ 233
Program 1: Coordination of Divisional Promotions ...........................................................................233Program 2: Coordination of Policy and Regulatory Development......................................................233Program 3: Institutional Capacity Building.........................................................................................234
OFFICE OF THE DIRECTOR-GENERAL – PERFORMANCE INDICATORS ..................................... 235DIVISION OF INDUSTRY (DOI) – OVERVIEW........................................................................... 235DIVISION OF INDUSTRY - PROGRAM SUMMARY ..................................................................... 236
Programs of the DoI........................................................................................................ 236Objectives: ...................................................................................................................... 236Strategies:........................................................................................................................ 237
Program 1: Industrial Development ....................................................................................................237Program 2: Policy and Regulatory Development ................................................................................237Program 3: Divisional Training and Development..............................................................................237Program 4: Micro-enterprise and SME Development .........................................................................238
DIVISION OF INDUSTRY - OBJECTIVES.................................................................................... 238DIVISION OF INDUSTRY - STRATEGIES ................................................................................... 238DIVISION OF INDUSTRY – PROGRAMS AND PROJECTS ............................................................ 239
Program 1: Industry Promotion...........................................................................................................239Program 2: Policy and Regulatory Development. ...............................................................................240Program 3: Divisional Training and Development..............................................................................240Program 4: Micro-enterprise and SME Development. ........................................................................240
DIVISION OF INDUSTRY – PERFORMANCE INDICATORS .......................................................... 241Objectives........................................................................................................................ 241Performance Indicators ................................................................................................... 241
DIVISION OF INVESTMENT – OVERVIEW................................................................................ 242DIVISION OF INVESTMENT – PROGRAMMATIC SUMMARY ...................................................... 243
Programs of the DI.......................................................................................................... 243Objectives: ...................................................................................................................... 243Strategies:........................................................................................................................ 243
Program 1: Investment Promotion.......................................................................................................244Program 2: Policy and Regulatory Development ................................................................................244Program 3: Divisional Training and Development..............................................................................244Program 4: Foreign Investment Management .....................................................................................244
DIVISION OF INVESTMENT - OBJECTIVES ............................................................................... 244DIVISION OF INVESTMENT - STRATEGIES................................................................................ 245DIVISION OF INVESTMENT – PROGRAMS AND PROJECTS ........................................................ 245
Program 1: Investment Promotion.......................................................................................................246Program 2: Policy and Regulatory Development ................................................................................246Program 3: Training and Development ...............................................................................................247Program 4: Foreign Investment Management .....................................................................................247
DIVISION OF INVESTMENT – PERFORMANCE INDICATORS...................................................... 248DIVISION OF TOURISM – OVERVIEW ...................................................................................... 249DIVISION OF TOURISM – PROGRAM SUMMARY ...................................................................... 249
Programs of the DT......................................................................................................... 249Objectives: ...................................................................................................................... 249Strategies:........................................................................................................................ 250
Program 1: Tourism Promotion...........................................................................................................250Program 2: Policy and Regulatory Development ................................................................................250Program 3: Divisional Training and Development..............................................................................251
DIVISION OF TOURISM - OBJECTIVES ..................................................................................... 251DIVISION OF TOURISM - STRATEGIES ..................................................................................... 251DIVISION OF TOURISM – PROGRAMS AND PROJECTS.............................................................. 252
Program 1: Tourism Promotion...........................................................................................................252Program 2: Policy and Regulatory Development ................................................................................252Program 3: Divisional Training and Development..............................................................................253

x
DIVISION OF TOURISM – PERFORMANCE INDICATORS ........................................................... 254DIVISION OF TRADE - OVERVIEW .......................................................................................... 255DIVISION OF TRADE – PROGRAM SUMMARY ......................................................................... 256
Programs of the Division of Trade ..................................................................................256Objectives: ...................................................................................................................... 256Strategies:........................................................................................................................ 256
Program 1: Trade Promotion ..............................................................................................................256Program 2: Policy and Regulatory Development ................................................................................257Program 3: Divisional Training Development ....................................................................................257
DIVISION OF TRADE - OBJECTIVES......................................................................................... 257DIVISION OF TRADE - STRATEGIES ........................................................................................ 258DIVISION OF TRADE – PROGRAMS AND PROJECTS ................................................................. 258
Program 1: Trade Promotion ..............................................................................................................258Program 2: Policy and Regulatory Development. ...............................................................................259Program 3: Divisional Training and Development .............................................................................260Program 4: Business Registration. ......................................................................................................260
DIVISION OF TRADE – PERFORMANCE INDICATORS ............................................................... 262
15. INFRASTRUCTUREVISION ................................................................................................................................... 263INTRODUCTION ...................................................................................................................... 263MAJOR GOALS OF INFRASTRUCTURE ..................................................................................... 264GUIDING PRINCIPLES FOR DEVELOPMENT ............................................................................. 265DIRECTOR-GENERAL, DEPARTMENT OF WATER & PUBLIC WORKS (MINISTRY FOR WATER AND
PUBLIC WORKS) .................................................................................................................... 265PUBLIC WORKS DIVISION ...................................................................................................... 266
Public Works Objectives ................................................................................................ 266Constraints, Problems, and Issues................................................................................... 267Public Works Strategies.................................................................................................. 267Public Works Programs & Projects ................................................................................ 268
Program 1: Institution Building..........................................................................................................268Program 2: Urban Planning...............................................................................................................268Program 3: Slums Improvement .........................................................................................................269Program 4: Provision of Government Buildings ................................................................................269Program 5: Public Education and Training .......................................................................................269
ROADS, BRIDGES AND FLOOD CONTROL DIVISION................................................................ 271DRBFC Objectives ......................................................................................................... 271Constraints, Problems and Issues.................................................................................... 271DRBFC Strategies........................................................................................................... 272DRBFC Programs & Projects ......................................................................................... 273
Program 1: Road & Bridge Rehabilitation and Maintenance ............................................................273Program 2: Flood Control and Erosion Prevention...........................................................................274
WATER AND SANITATION DIVISION....................................................................................... 275WSS Division Objectives ............................................................................................... 275Constraints, Problems and Issues.................................................................................... 276WSS Division Strategies................................................................................................. 276WSS Division Programs and Projects ............................................................................ 277
Program 1: Institution and Capacity Building ...................................................................................277Program 2: Urban Water Supply........................................................................................................278Program 3: Urban Sanitation.............................................................................................................278Program 4: Community Water and Sanitation ...................................................................................279Program 5: Water & Sanitation Support and Public Safety ...............................................................279
RESEARCH AND DEVELOPMENT DIVISION ............................................................................. 281Research and Development Division Objectives............................................................ 281Constraints, Problems and Issues.................................................................................... 281

xi
Research and Development Division Strategies ............................................................. 281Research and Development Division Programs and Projects ......................................... 282
Program 1: Development of Appropriate Technology ........................................................................282Program 2: Material and Construction Testing..................................................................................282
DIVISION OF ENERGY (MINISTRY OF ECONOMIC AFFAIRS & PLANNING) .............................. 284Division of Energy Objectives ........................................................................................ 284Division of Energy Constraints, Problems and Issues .................................................... 285Division of Energy Strategies ......................................................................................... 285Division of Energy Programs and Projects ..................................................................... 286
Program 1: Institutional Development................................................................................................286Program 2: Improvement of Services..................................................................................................286Program 3: Capacity Building ............................................................................................................287
DEPARTMENT OF COMMUNICATIONS AND TRANSPORT.......................................................... 288DIVISION OF LAND TRANSPORTATION ................................................................................... 288
Division of Land Transportation Objectives................................................................... 288Constraints, Problems and Issues.................................................................................... 289Division of Transportation Strategies ............................................................................. 290Division of Transportation Programs and Projects ......................................................... 290
Program 1: Institutional and Staff Development ................................................................................290Program 2: Traffic Management ........................................................................................................290Program 3: Vehicular Regulation and Safety .....................................................................................291
DIVISION OF SEA TRANSPORTATION ...................................................................................... 292Division of Sea Transportation Objectives ..................................................................... 293Constraints, Problems and Issues.................................................................................... 293Division of Sea Transportation Strategies ...................................................................... 294Division of Sea Transportation Programs and Projects .................................................. 294
Program 1: Institutional Development................................................................................................294Program 2: Port Rehabilitation and Development .............................................................................295Program 3: Port Services....................................................................................................................295Program 4: Capacity Building ............................................................................................................295
DIVISION OF CIVIL AVIATION ................................................................................................ 297Division of Civil Aviation Objectives ............................................................................ 298Constraints, Problems and Issues.................................................................................... 298Division of Civil Aviation Strategies.............................................................................. 298Division of Civil Aviation Programs and Projects.......................................................... 299
Program 1: Institutional Development................................................................................................299Program 2: Comoro Airport Operations ............................................................................................299Program 3: Improvement of National Services...................................................................................300Program 4: Capacity Building ............................................................................................................300
TELECOMMUNICATIONS (SUB-SECTOR TO DIVISION OF TELECOMMUNICATIONS AND POST) . 302Telecommunications Objectives ..................................................................................... 302Constraints, Problems and Issues.................................................................................... 303Telecommunications Strategies ...................................................................................... 303Telecommunications Programs and Projects .................................................................. 304
Program 1: Regulation........................................................................................................................304Program 2: Telecommunications Operations .....................................................................................304Program 3: Capacity Building ............................................................................................................304
POSTAL SERVICES (SUB-SECTOR TO DIVISION OF TELECOMMUNICATIONS AND POST) .......... 305Postal Services Objectives .............................................................................................. 306Constraints, Problems and Issues.................................................................................... 306Postal Services Strategies................................................................................................ 307Postal Services Programs and Projects ........................................................................... 307
Program 1: Restoration and Development..........................................................................................307Program 2: Human Resource Capacity ..............................................................................................307Program 3: Innovations and Expansion..............................................................................................308
DIVISION OF METEOROLOGY ................................................................................................. 309

xii
Division of Meteorology Objectives............................................................................... 309Constraints, Problems and Issues.................................................................................... 310Division of Meteorology Strategies ................................................................................ 310Division of Meteorology Programs and Projects............................................................ 311
Program 1: Operational Infrastructure ..............................................................................................311Program 2: Capacity Building............................................................................................................311

xiii
LIST OF ACRONYMS AND GLOSSARY
ABBREVIATION WORD DEFINITION
ADB Asian Development Bank
ARP Agricultural Rehabilitation Project
ASCs Agriculture Service Centres
ASEAN Association of South-East Asian Nations
AusAID Australian Agency for International Development
BDCs Business Development Centres
BDP Bilateral Development Projects
BOT Build, Operate and Transfer
BPA Banking and Payments Authority
BRN Business Registration Unit
CCCS Consultative Commission for Civil Society on Development
CFET Consolidated Fund for East Timor
CGIAR Consultative Group for International Agriculture Research
CHCs Community Health Centres
CIDA Canadian International Development Agency
Clandestinos Members of Clandestine Resistance Network
CoC Chambers of Commerce
COM Council of Ministers
CPLP Community of Portuguese Speaking Nations
DAL Deptartment of Agriculture and Livestock
DI Division of Investment
DLP Distance Learning Program
DNMR Department of Natural and Mineral Resources
DoE Division of Environment
DoF Department of Forestry
DoI Division of Industry
DoL Division of Labour
DoT Division of Trade
DRBFC Division of Roads, Bridges and Flood Control
DT Division of Tourism
EDTL Electricity Authority of East Timor
xiv
EIA Environmental Impact Assessment
ESCAP Economic and Social Commission for Asia and the Pacific
ESD Ecologically Sustainable Development
FALINTIL Armed Forces for the National Liberation of East Timor
FDI Foreign Direct Investment
FDTL East Timor Defence Force
FIL Foreign Investment Law
FME Department of Fisheries and Marine Environment
FY Financial Year
GDP Gross Domestic Product
GIS Geographic Information System
HIV/AIDS Human Immune Deficiency Virus/Acquired Immune Disease Syndrome
HRD Human Resources Development
ICAO International Civil Aviation Organisation
IEC Information, Education and Communication
IMCI Integrated Management of Childhood Illness
IMF International Monetary Fund
IT Information Technology
JPDA Joint Petroleum Development Area
LDCs Least Developed Countries
LPG Liquid Petroleum Gas
MAF Ministry of Agriculture and Fisheries
MCT Ministry of Communications and Transport
MDGs Millennium Development Goals
MEAD Ministry of Economic Affairs and Development
MFAC Ministry of Foreign Affairs and Cooperation
MoE Ministry of Education
MoF Ministry of Finance
MoH Ministry of Health
MoJ Ministry of Justice
MPFS Macroeconomics and Public Finance Sector
MTFF Medium Term Fiscal Framework
MWPW Ministry of Water and Public Works
NCBA National Cooperative Business Association
NEMP National Environmental Management Plan
NGO Non-government Organisation

xv
NICs Newly Industrialised Countries
NRM Natural Resources and Minerals
NTB National Tourism Board
ODG Office of Director-General
PA Poverty Assessment
PNA Protected Natural Area
PPA Participatory Potential Assessment
SEP Small Enterprise Project
SMEs Small and Medium Enterprises
SSTL Suco Survey of Timor Leste
STD Sexually Transmitted Disease
STI Sexually Transmitted Infections
TB Tuberculosis
TBA Traditional Birth Attendant
TEC Trade Exposition Centre
TERADP Timor Economic Rehabilitation and Development Project
TFET Trust Fund for East Timor
TLSS Timor Living Standard or Household Expenditure Survey
TSA Timor Sea Arrangement
UNAMET United Nations Mission to East Timor
UNTAET United Nations Transitional Administration in East Timor
UNDP United Nations Development Programme
UNICEF United Nations Children’s Fund
UNOPS United Nations Office of Projects Services
USAID United States Agency for International Development
VLW Village Livestock Worker
WB World Bank
WSS Water Supply and Sanitation Division
WTO World Trade Organisation

xvi
Foreword
Our National Development Plan charts an ambitious path to transform the lives of our people.The process of preparing the Plan gave thousands of East Timorese, from school children toelderly people, the opportunity to think about the kind of future they want for themselves and forfuture generations. For so many of them – in government, in civil society and in communities allover the country – it was the first chance they have had to share their aspirations with others andto think broadly about our nation’s development.
The vision which sprang from people’s participation in the planning process encapsulates all thatis fundamental to development – peace, security, freedom, tolerance, equity, improved health,education, access to jobs and food security. Making the vision real is a bold and challengingtask. It will require a sustained and combined effort from the public and private sectors and fromcivil society. It will also require the sustained help of our development partners – bilateral donorcountries, the United Nations family, the International Financial Institutions and non-governmentorganizations.
I am honoured to have led the consultation with our people which fed so directly into the Planand now, as President-elect, I am committed to ensuring that this Plan and all that it represents betranslated into actions that will transform people’s lives. In the year 2020, I hope that we willlook back with pride on the development path we followed from our Independence.
xvii
Foreword
As Chief Minister and Chair of the Planning Commission, I am privileged to have overseen theproduction of our country’s first National Development Plan.
This Plan is another milestone in our long journey to build our new nation. In this journey wehave faced many challenges, but none that we have failed to overcome. As full independenceapproaches we find our responsibilities increasing, and these bring with them a host of newdifficulties and new challenges. But I am confident that as a Government and as a people, wewill remain undaunted by the need to make hard choices. Our Plan reinforces this belief.
As our struggle for independence is transformed into our striving for development, we continueto honour all the sacrifices that have been made by our people to bring us to this moment in ourhistory, as we finally fulfil our destiny as a free people. The National Development Plandemonstrates that we remain faithful and true to the ideals that have for so long guided us,showing us the path we may follow to achieve our vision for the future of our nation.
Our planning for the medium-term will also enable donor agencies to effectively plan theirprograms for East Timor over the medium-term. As a Government we uphold principles ofaccountability and transparency, and the open, participatory and inclusive nature of our planningprocess is clear evidence of this. Moreover, just as the Government is keen to satisfy externalagency requirements for accountability, each of our departments is learning how better to satisfy,and be accountable to, its own clients – the people of East Timor – the public who ultimatelyown, use and benefit from services Government provides.
East Timor’s first National Development Plan reflects my Government’s absolute commitmentto involving all East Timorese in a planning process that will benefit all East Timorese. Over120 Government officials have worked tirelessly throughout the planning process, in what was tomany a new experience of learning by doing. Led by my team of Ministers, they examined, theyanalysed, they discussed and they debated the issues and problems now confronting East Timor.In the process of searching for solutions, we moved beyond the notion of looking for ways ofhow to better serve the public, to involving the public in the design of the service itself; the shapeof services that they will actually receive over the next five years. We invited representatives ofthe Church and members of Civil Society, national and international NGOs, the private sectorand public interests groups to become involved in a suite of National Sector and Cross-Sectorworkshops led by Government to help debate and formulate policy options, program prioritiesand implementation strategies for the National Development Plan.
Given the time-frame, what they have collectively accomplished is truly impressive. I mustcommend all involved and especially the Secretariat and staff of the Planning Commission. Inparticular, I pay tribute to our colleagues in the international community for their assistance.They stood by us in the past, and they stand with us now. I know we can rely on their friendshipand solidarity for many years to come as we all work together to develop our new nation.
Mari Alkatiri
1st May 2002

xviii
VVIISSIIOONN
FOR THE NEXT GENERATION, IN THE YEAR 2020
�� East Timor will be a democratic country with a vibrant traditional culture and asustainable environment;
�� It will be a prosperous society with adequate food, shelter and clothing for allpeople;
�� Communities will live in safety, with no discrimination;
�� People will be literate, knowledgeable and skilled. They will be healthy, andlive a long, productive life. They will actively participate in economic, socialand political development, promoting social equality and national unity;
�� People will no longer be isolated, because there will be good roads, transport,electricity, and communications in the towns and villages, in all regions of thecountry;
�� Production and employment will increase in all sectors – agriculture, fisheriesand forestry;
�� Living standards and services will improve for all East Timorese, and incomewill be fairly distributed;
�� Prices will be stable, and food supplies secure, based on sound management andsustainable utilization of natural resources;
�� The economy and finances of the state will be managed efficiently,transparently, and will be free from corruption; and
�� The state will be based on the rule of law. Government, private sector, civilsociety and community leaders will be fully responsible to those by whom theywere chosen or elected.

1
EXECUTIVE SUMMARY
INTRODUCTION
1 The first National Development Plan (the Plan) for East Timor is awatershed event in the history and development of the world’s newest nation. It isthe first time that the people of East Timor have voiced their views about thefuture of their nation, based on democratic ideals and self-determination. The Planhas been a participative process, involving constituents in every sector of theeconomy to identify the problems they face and to suggest solutions to thoseproblems. A vast number of people across the country participated in surveys andmeetings to help shape a “national vision” for the new country. A CountrywideConsultation was conducted to reach thousands of people in every district andwalk of life, resulting in the vision presented at the outset of this document
2. This planning document represents the views and efforts of thoseindividuals who came together as “working groups” assisted by teams of planningconsultants under the Planning Commission. It is important to emphasize that thePlan is the work of East Timorese people. For many, it is their first experience ofplanning on such a scale. It represents, therefore, the first important step in aprocess through which the development plan grows, matures, and improves overtime.
3. The people of East Timor have many expectations, but these focusstrongly on two over-riding development goals:
a) To reduce poverty in all sectors and regions of the nation, and
b) To promote economic growth that is equitable and sustainable,improving the health, education, and well being of everyone in EastTimor.
DEVELOPMENT STRATEGY
4. East Timor’s Development Strategy as described in this plan is to designprograms and pursue initiatives that systematically address its main developmentgoals. The first set of tasks during this early transition stage is to establishgovernment capabilities, enabling legislation, and the institutions required topursue development priorities. These are significant challenges that becomeunmistakably visible in each of the Plan sector strategies where the ministries andtheir directorates emphasize these priorities.
5. A second set of priority tasks is for every sector of government to pursuedevelopment activities that help reduce poverty. These are very ofteninterdependent with priorities of economic growth, through which the nation’sproductive capacity is strengthened to create new jobs and higher levels of earnedincome, and, in time, a vibrant middle class. As the Plan shows, many economicdevelopment plans cannot be implemented without legal foundations and

2
governance that ensures private sector opportunities with a national infrastructure to supportgrowth. Each sector addressed in the Plan has identified programs or projects that can helpalleviate poverty while also supporting economic development priorities.
6. A third set of priority tasks consists of an extensive list of barriers that face every sectorand all government agencies. These barriers are monetary, social, cultural, and structuralimpediments to economic growth and to the nation’s efforts to reduce poverty. Many sector-specific objectives are subsequently focused on reducing or eliminating these barriers, so thatprogressive development programs can be implemented.
7. The overall structure of the Development Strategy orchestrates these high-prioritydevelopment tasks, recognizing that they must be pursued concurrently. The Plan represents twophases of development. In the short-term, legislation and institutional capabilities will beaddressed, together with progress in infrastructure, education, and health. In the longer-term,development can accelerate on the basis of these foundations.
8. The short-term phase is also a time of fragile and uncertain development. It is a periodwhen funds are scarce, there are few industrial opportunities for growth or employment, demandon all government resources far outweighs the ability to supply, and questions of trade,investment, and foreign relations are unresolved. The nation will face its most severe challengesduring the early years after independence. The longer- term stage represents a time of promise,when oil and gas revenues may provide the monetary base required for sustained growth, andwhen the nation can emerge from its early adversities with a strong sense of hope.
9. As the Plan unfolds and the nation progresses, the plans, goals, and aspirations willchange, mature, and improve. The Plan therefore represents a starting point, particularly as itbegins to be implemented. This document emphasizes that the Plan itself is organic – alive andcapable of growing – yet only if government nurtures it and empowers people to take ownershipof their own development initiatives.
POVERTY REDUCTION STRATEGY
10. A Poverty Reduction Strategy is focused on improving the productivity of the poor byachieving strong economic growth within an enabling environment. This will catalyze andsustain contributions of the poor to national development. Government is faced with providingbasic social and economic services to the poor, nurturing and promoting their entrepreneurialinitiatives, and prohibiting discrimination based on gender, ethnic origin, language, orgeographic location. These issues recur throughout the Plan.
11. Because poor people in East Timor are engaged primarily in agriculture (includingfisheries and forestry), improving productivity in this sector is a high priority. Proposedinitiatives include rehabilitation and construction of irrigation systems and their improvedoperation, introduction of water harvesting techniques, wider distribution of improved seeds ofcereal crops, fruits and vegetables, improved livestock health, improved management of fishing,and sustainable management of forests and other natural resources. These initiatives will beundertaken with the participation of the communities that depend on them. Improvements inmarketing and infrastructure are also planned.
12. The micro-enterprise segment of society (a substantial part of the informal economy) hasbeen an important contributor to growth in developing nations. A large number of people workin micro-enterprises or pursue very small independent activities to subsist. Expansion of

3
opportunities and productivity improvements in this sector are crucial, not only for rural familiesbut for those in urban slums. Both dimensions of poverty are addressed in this plan, includingproposals for training, quality-improving technologies, support services, and micro-credit.
13. A critical requirement for poverty reduction is to strongly enhance opportunities in theformal private sector, where growth and employment can be achieved in manufacturing,construction, trade, transport, tourism, and many domestic services. Priority policies andlegislation are being formulated to improve the private sector and the ability of East Timor tosustain both domestic and foreign investment.
14 Poverty reduction cannot occur without the provision of infrastructure that includes aneffective network of roads and bridges, efficient seaports and airports, reliable electric power, atelecommunications system, and postal services. Agricultural and business developments arecrucially dependent on this infrastructure, and trade, tourism, and foreign investment cannot beencouraged without it. Consequently, a poverty reduction strategy is an integrated process thatrequires a pervasive effort by government and international donors who will play a major role inassisting East Timor’s development.
CAPACITY BUILDING FOR PLAN IMPLEMENTATION
15. Promoting economic growth to reduce poverty will require the government to facilitatethe delivery of basic social and economic services. This delivery will itself require enabling lawsand regulations, and the empowerment of the population through community management andparticipation.
16. Currently, East Timor needs virtually everything – infrastructure, technology, training,capital and access to markets. To build capacity to meet all these needs during the next five yearsis clearly impossible. Consequently, prioritising needs for capacity building is essential forplanning, as is the sequencing of the introduction of activities designed to provide these needs.
17. The Plan presents the main areas for capacity building and training, in several of itsprograms, in different sectors. These programs address both short-term implementation needsand capacity requirements for the coming years, at the central, district and local levels. Capacitybuilding will be based extensively on government partnerships with civil society organizations,the church, non-government organisations (NGOs), the private sector, traditional institutions,informal networks, and mutual-help groups, particularly at the village level.
18. Capacity building at the government level is crucial for East Timor. The vast majority ofcurrent civil servants are neither adequately experienced, nor trained for the roles they will haveto undertake. To address this problem, the former Cabinet endorsed a comprehensive ten-yearprogram for Governance and Public Sector Management developed by the National Planning andDevelopment Agency (NPDA) in 2001, with support from UNDP. The Plan builds on, anddevelops this program, by stressing the need to develop organizational and managerial valueswithin a framework that respects East Timorese cultural values, whilst pursuing open, costeffective and accountable systems of government.
19. The Plan sets out strategies for developing and strengthening institutions for the post-transition period. It outlines how capacity can be built to enable the Government to assist in thedevelopment of a market-based economy. For each sector, the plan also provides strategies forstrengthening capacities in policy development, co-ordination, and the core skills required formanagement. It shows how the East Timorese government can provide an enabling economicenvironment, deliver appropriate services, and establish relevant legal frameworks during the

4
post-independence period, outlining how capacity can be built within the civil service fordrafting legislation, developing policy and upgrading skills at different levels.
20. The need for political decentralization is stressed in East Timor’s Constitution. The Planrequires that capacity be built for this, through the provision of training for the administration ofregional offices in some of the ministries, backed up by regional coordinating bodies withrepresentatives from government, community groups, NGOs and civil society organizations. Tofurther these proposals, training is required to improve the management skills of district anddeputy district administrators, local development officers, and sub-district coordinators. Inaddition, at the suco level, there is a need to develop programs to increase village capacity forplan implementation, and to provide support for developing capacity in local training institutionsto provide sustainable assistance to local administrators. NGOs, church organizations and civilsociety groups can assist in this process, as well as developing civic education programs tofacilitate local communities to monitor plan outcomes, in relation to their original “vision”statements in the Countrywide Consultation.
21. Entrepreneurial, technical, and vocational skills are lacking in every sector of the EastTimorese economy. To meet their needs, the Plan argues for an extension of the current on-the-job training undertaken in informal economy workshops throughout the country, the design andimplementation of basic training programs by employers in the formal sector, and a furtherdevelopment of existing donor and church programs in vocational training. In addition,community-based training centres are to be set up in the countryside, to train people in the skillsneeded in the local informal economy, and to provide advice on employment.
22. Currently, standards of education in East Timor are among some of the lowest in theworld. Consequently, the Plan focuses on capacity building for reconstructing and developingthe education system – through prioritising strategies for teacher training, increasing primaryschool enrolment, improving retention rates, modernizing the curriculum, and enhancingcommunity involvement in the management of schools. In addition, one of the most difficulttasks for schools in the years ahead will be to extend both the use of Portuguese language and thestandardization of Tetun for use in schools. Again, the Plan offers programs and projects throughwhich this can be achieved. Most importantly, the Plan also details projects to design a literacymanual, to extend existing donor literacy campaigns, and to develop new campaigns forimplementation by the Ministry of Education.
23. Standards of health in East Timor are poor, and existing health provision is weak. Tobuild capacity in this area will be extremely difficult, and the focus necessarily will be on theprovision and delivery of services to meet basic needs. The Plan presents policies, and short andlonger-term strategies for this. It prioritises ongoing, long-term programs in child, maternal andreproductive health. It also focuses on current needs to build capacity for the provision ofsupport services and management systems for the delivery of these programs.
24. Infrastructure is in a poor state, and capacity in this sector is extremely weak. This is anissue of overarching importance for all sectors of the economy and society, since infrastructure isa key determinant of agricultural productivity, poverty reduction, investment, humandevelopment and government capacity to deliver services. The Plan specifies detailed programsfor building capacity in the key areas of water supply and sanitation, road reconstruction, and therestoration of basic transport and communication facilities. For the longer term, it specifiesprograms for the development of a sustainable power infrastructure, with an accompanyinginstitutional framework.

5
25. A crucial area for East Timor’s development is an effective judicial system. Developingthe judiciary will require rapid capacity building to prepare proposals for legislation and draftlegislation, in addition to preparing legal opinions and advice.
26. In most of the areas for capacity building outlined above, during the coming years, EastTimor will need continuing international support. At least in the short term, to further capacitybuilding and human resource development, there are positions which need to be filled byinternational advisers, working closely with local staff. For plan implementation, it is crucial thatthe knowledge and skills appropriate for the attainment of economic growth, poverty reductionand human development be transferred and developed in an East Timorese context.
MONITORING, EVALUATION, AND PLANNING REVIEW
27. The Plan is a starting point for a structured planning process that includes monitoring andevaluation as critical components of successful national development. Ensuring that policyobjectives are met – through program and project activities – requires adherence to a soundprocess of monitoring and evaluation. In addition, such a process meets the requirements ofgovernment, donors and other stakeholders for transparency and accountability. The mainoutcomes of strengthened monitoring and evaluation capabilities are improvements in projectimplementation and management, but most importantly, improvement in the Plan itself.
28. An institutional planning process is presented in this Plan as one that empowers thenation’s leaders with responsibility for strategic planning. The process itself must ensurecontinuity of monitoring and evaluation, provide timely feedback on actual performance, andprovide realistic analyses of what the nation faces in the coming years. This planning processalso will permit adaptation of the existing plan, its goals, objectives, and strategies.
29. The planning process should not be budget-driven nor subordinated to internationalfinancial mandates. Instead, it should address the social, economic, and human developmentpriorities of East Timor and, with appropriate diligence, consider what can be realisticallyaccomplished given budget constraints. Ministries and their directorates are part of this on-goingprocess with incremental annual action plans and achievable performance benchmarks. Aprocess of periodic monitoring and evaluation reporting is suggested with annual planningreviews under an independent government body overseeing implementation in co-operation withgovernment ministers, civil society organisations and the major stakeholders.
MACROECONOMICS AND PUBLIC FINANCE POLICY FRAMEWORK
30. The sector vision focuses on growth, employment, improved living standards and betterpublic services delivery. Sustaining the culture and environment are important. Sound andtransparent economic and financial management is essential.
31. The starting point for independent economic management is difficult and a period ofconsolidation is needed, particularly as the United Nations withdraws, before longer-termdevelopment is likely to take hold. The continuing support of donors in the transition phasebefore significant oil revenues begin to flow will be important.
32. Several core sector goals have been identified. These relate to: capacity building; povertyreduction; economic growth; low inflation; employment growth; a stronger banking sector;strengthening the external situation; improving revenues to enhance self reliance; effectively

6
managing oil revenues; responsibly managing budget expenditures; and effectively managingbudget financing, especially aid.
33. Broad guiding principles revolve around an open market economic system but withimportant strategic and regulatory roles for government. The private sector (includingagriculture) is provided with important responsibilities in the development effort. Provision ofequal opportunities and improving living standards are important. Preservation of theenvironment and traditions are also important. Economic management will be transparent andcorruption free.
34. Many constraints have been identified as needing to be addressed in the policyformulation stage. Without being exhaustive these include: coping with social and physicaldestruction; recognizing difficulties in transforming subsistence agriculture; limited experiencein economic management; low domestic revenue base; a very weak banking and credit sector; anincrease in wage levels under UNTAET along with a very strong US dollar has weakenedinternational competitiveness; the private sector is weak as is the institutional and legalenvironment in which it operates; education, health and infrastructure services all need bigimprovements to support the development effort.
35. A detailed policy matrix is presented where the eleven core goals are assigned policyactions and performance indicators to measure the success of policies over time. A full range ofmacro, micro and institutional policies will need to be effectively implemented if the sector goalsare to be achieved. Important policies that are set out include: budget policies (revenues;expenditures and financing); monetary and currency policies; wages policies; trade andinvestment policies; institutional and structural policies as well as capacity building initiatives.
36. The chapter concludes by setting out likely program and project funding for the sectorduring the plan. Significant additional resources are not called for and relatively speaking thesector should use less national resources over time. A large number of new project initiativeshave been set out, the great bulk of which relate to systems and human capacity buildingmeasures in the Ministry of Finance (MoF) and the Banking and Payments Authority (BPA).
MEDIUM TERM ECONOMIC AND FINANCING OUTLOOK
37. This chapter provides the medium term economic and financing outlook. Many plans failbecause they make unrealistic assessments of economic conditions and of domestic and foreignresources available. The links between medium term plans, budgets and economic policyframeworks are important ones. A base outlook for key components of the macro-economy ispresented and indicates:
a) Largely due to the phased withdrawal of UNTAET and TFET, economic growth isprojected to be negative in 2002 and 2003, before commencing recovery in 2004. Bythe end of the plan there are prospects for solid, broadly based growth of 6% p.a.;
b) The worst hit sectors during the downturn in late 2002/2003 are expected to beTransport, Communications, Trade, Hotels, Restaurants, Utilities, Construction,Finance, Rents, Business and Government Services;
c) The sharp contraction is a reflection on the recent economic management period andmakes a good argument for ongoing donor budget and project support to help smoothwhat will be a difficult transition;

7
d) Sharp reductions in formal unemployment will be challenging to achieve. Excludingagriculture, around 40,000 private sector jobs will need to be created over the courseof the plan if the open unemployment rate is to halve. Agricultural and informalemployment will remain important social safety nets;
e) Prices are expected to remain stable with inflation averaging 2% to 3% per annumPublic sector wage growth will be targeted at levels below that of inflation;
f) Domestic revenues while growing will remain small. For FYs 2003 and 2004, donorsare being asked to contribute around US$40 million per annum to recurrent andcapital budget support. Oil revenues are expected to strengthen sharply from FY 2005and to average almost US$100 million a year in the last 2 years of the Plan;
g) Total sources expenditure will contract sharply over the course of the plan as UN andTFET contributions withdraw. After rapid growth in FY 2003, CFET expendituresare targeted to grow smoothly at 8% per annum nominal for the remainder of thePlan.
38. The Plan asks donors to maintain bilateral projects at around US$75 million per annumthroughout the Plan period. This is higher than levels previously discussed but is critical both forshort-term economic management and long-term nation building. It also presents a case forsignificantly changing the composition of CFET expenditures over time, especially to find moreresources for the key plan priorities of agriculture, education, health and infrastructuredevelopment. During the plan the BPA will develop the capacity to manage an independentmonetary and currency policy.
39. Providing the stance of no public sector borrowing is maintained the external situationshould remain manageable with a reasonable build-up in oil revenues saved in the offshoreaccount (estimated to be US$84 million by end 2007).
40. The Plan presents policies for the planned utilization and saving of oil revenues so as topreserve capital and earnings values for future generations. It also outlines aid policies andapproaches to be pursued, which are critical both for short and medium term economic andfinancial management.
POLITICAL DEVELOPMENT, FOREIGN RELATIONS, DEFENCE AND SECURITY
41. The development of an effective administrative and governance structure to serve theneeds and interests of the people and the nation is one of the most critical national priorities.Given the existing environment the priority medium-term programs will have to be theestablishment and strengthening of the organs of state and of public administration, laying thefoundations of good governance, creating the avenues for popular and community participation,developing the legal and regulatory framework, building the human resources capacity for policyformulation and execution as well as service delivery, strengthening oversight institutions andfostering the press and civil society.
42. The Plan emphasizes that transparency in governance is essential, including developmentof public information programs for civil service, activities of Parliament, and functions of theministries. This will be reinforced by programs that reintroduce Portuguese and standardizeTetun as working languages of Parliament and public administration.

8
43. Decentralization and participation are critical to mobilize regional, community, and civilsociety organizations and entities. The Plan presents programs that will empower communitiesand strengthen grass-roots democracy. These are inclusive strategies that preserve theopportunity for everyone to have a voice in self-government.
44. The Plan also addresses civil priorities, such as identifying veterans and providingtraining and other assistance to re-integrate them into society. The plan underlines theimportance of utilizing networks of diaspora organizations to represent East Timorese interestsabroad.
45. The importance of a legislative agenda cannot be overstated as vital to the nation’s abilityto establish a society based on the rule of law, to foster domestic and foreign investment, tosupport private enterprise growth, and to protect the interests of the impoverished anddisadvantaged.
46. The Plan includes the creation of an Ombudsman’s office to raise the level of awarenessof citizens’ rights and respect for the law, to defend citizens from any abuse of power by publicadministration entities, and to safeguard against practices of corruption, nepotism and otherabuses of power.
47. Not least of all, the Plan articulates development of protective services through thecreation of refuge centres and support systems for victims of violence, and by creating programsfor assistance and training of youth and women, particularly those who have become displacedby conflicts and inequitable social barriers.
POVERTY REDUCTION, RURAL AND REGIONAL DEVELOPMENT
48. More than two fifths of East Timorese live in poverty. The poorest households are thosewith little land, and no education. They are most likely to be farmers and fishers. More thanthree-quarters of the population live in rural areas. Poverty also occurs unevenly, with thewestern and central areas being poorer than the eastern areas
49. The main goals of poverty reduction within the Plan are to achieve rapid economicgrowth to deliver training and health services, establish social safety nets, and create skilled andprofessional human resources for an effective use of labour. Rural development will beintegrated and regionally balanced, and governance for this development will be competent,efficient, accountable and transparent.
50. Rural and regional development will ensure the involvement of households andcommunities in all development activities in the villages. It will be integrated, equitable, andnon-discriminatory.
51. The main resource constraints for rural development are detailed in the Plan. They focuslargely on social and gender issues, but also list the main areas for capacity building, both withinthe Government and civil society organisations. Infrastructure constraints are viewed asparticularly severe, limiting access to markets. The private sector has no meaningful frameworkfor enabling rural development, and governance is restricted by limited co-ordination, inadequatetargeting, a lack of transparency, and limited accountability.
52. Based both on the overall strategy for poverty reduction, outlined in chapter four, and onthe mainstreaming of poverty in the Plan, the most important areas through which poverty can bereduced in the rural sector are presented and elaborated. Strategies are outlined for the creation of
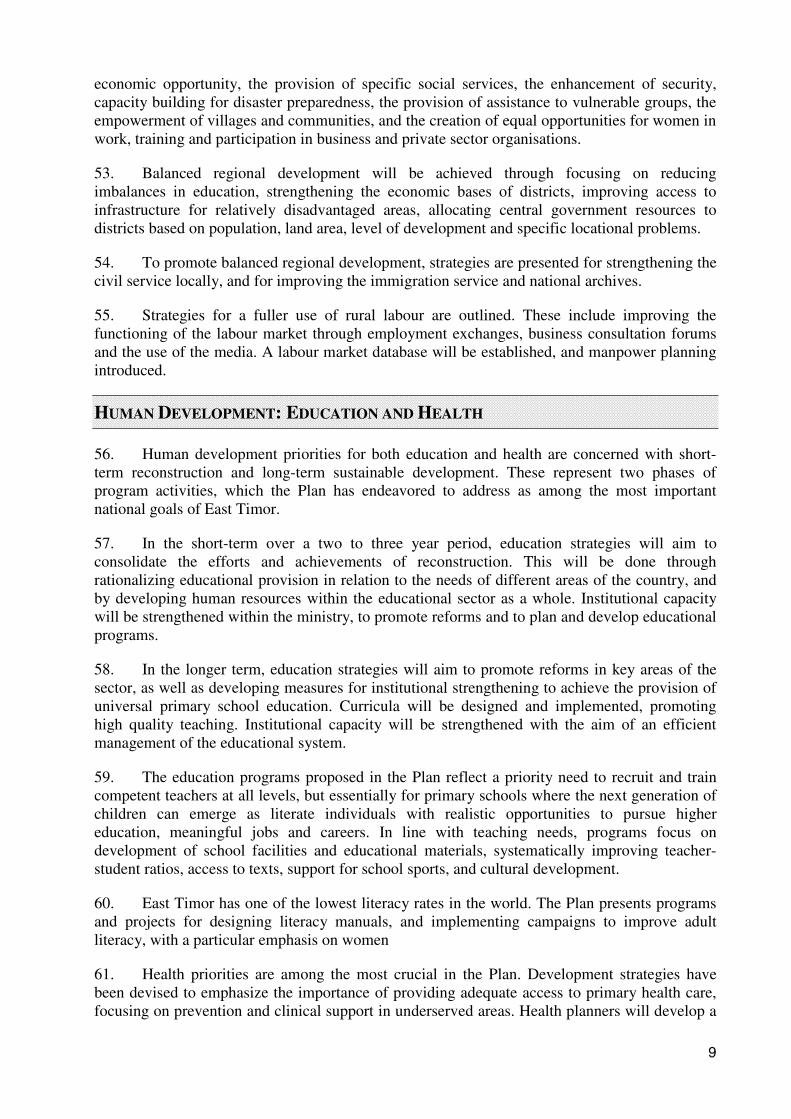
9
economic opportunity, the provision of specific social services, the enhancement of security,capacity building for disaster preparedness, the provision of assistance to vulnerable groups, theempowerment of villages and communities, and the creation of equal opportunities for women inwork, training and participation in business and private sector organisations.
53. Balanced regional development will be achieved through focusing on reducingimbalances in education, strengthening the economic bases of districts, improving access toinfrastructure for relatively disadvantaged areas, allocating central government resources todistricts based on population, land area, level of development and specific locational problems.
54. To promote balanced regional development, strategies are presented for strengthening thecivil service locally, and for improving the immigration service and national archives.
55. Strategies for a fuller use of rural labour are outlined. These include improving thefunctioning of the labour market through employment exchanges, business consultation forumsand the use of the media. A labour market database will be established, and manpower planningintroduced.
HUMAN DEVELOPMENT: EDUCATION AND HEALTH
56. Human development priorities for both education and health are concerned with short-term reconstruction and long-term sustainable development. These represent two phases ofprogram activities, which the Plan has endeavored to address as among the most importantnational goals of East Timor.
57. In the short-term over a two to three year period, education strategies will aim toconsolidate the efforts and achievements of reconstruction. This will be done throughrationalizing educational provision in relation to the needs of different areas of the country, andby developing human resources within the educational sector as a whole. Institutional capacitywill be strengthened within the ministry, to promote reforms and to plan and develop educationalprograms.
58. In the longer term, education strategies will aim to promote reforms in key areas of thesector, as well as developing measures for institutional strengthening to achieve the provision ofuniversal primary school education. Curricula will be designed and implemented, promotinghigh quality teaching. Institutional capacity will be strengthened with the aim of an efficientmanagement of the educational system.
59. The education programs proposed in the Plan reflect a priority need to recruit and traincompetent teachers at all levels, but essentially for primary schools where the next generation ofchildren can emerge as literate individuals with realistic opportunities to pursue highereducation, meaningful jobs and careers. In line with teaching needs, programs focus ondevelopment of school facilities and educational materials, systematically improving teacher-student ratios, access to texts, support for school sports, and cultural development.
60. East Timor has one of the lowest literacy rates in the world. The Plan presents programsand projects for designing literacy manuals, and implementing campaigns to improve adultliteracy, with a particular emphasis on women
61. Health priorities are among the most crucial in the Plan. Development strategies havebeen devised to emphasize the importance of providing adequate access to primary health care,focusing on prevention and clinical support in underserved areas. Health planners will develop a
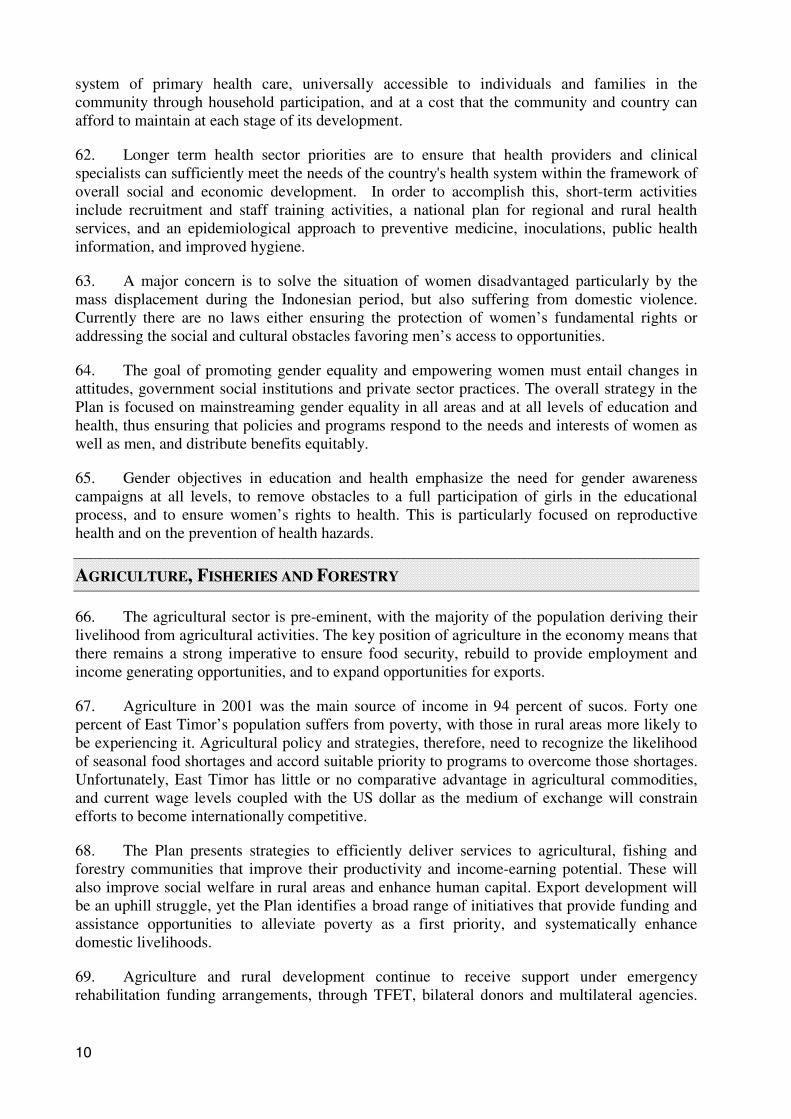
10
system of primary health care, universally accessible to individuals and families in thecommunity through household participation, and at a cost that the community and country canafford to maintain at each stage of its development.
62. Longer term health sector priorities are to ensure that health providers and clinicalspecialists can sufficiently meet the needs of the country's health system within the framework ofoverall social and economic development. In order to accomplish this, short-term activitiesinclude recruitment and staff training activities, a national plan for regional and rural healthservices, and an epidemiological approach to preventive medicine, inoculations, public healthinformation, and improved hygiene.
63. A major concern is to solve the situation of women disadvantaged particularly by themass displacement during the Indonesian period, but also suffering from domestic violence.Currently there are no laws either ensuring the protection of women’s fundamental rights oraddressing the social and cultural obstacles favoring men’s access to opportunities.
64. The goal of promoting gender equality and empowering women must entail changes inattitudes, government social institutions and private sector practices. The overall strategy in thePlan is focused on mainstreaming gender equality in all areas and at all levels of education andhealth, thus ensuring that policies and programs respond to the needs and interests of women aswell as men, and distribute benefits equitably.
65. Gender objectives in education and health emphasize the need for gender awarenesscampaigns at all levels, to remove obstacles to a full participation of girls in the educationalprocess, and to ensure women’s rights to health. This is particularly focused on reproductivehealth and on the prevention of health hazards.
AGRICULTURE, FISHERIES AND FORESTRY
66. The agricultural sector is pre-eminent, with the majority of the population deriving theirlivelihood from agricultural activities. The key position of agriculture in the economy means thatthere remains a strong imperative to ensure food security, rebuild to provide employment andincome generating opportunities, and to expand opportunities for exports.
67. Agriculture in 2001 was the main source of income in 94 percent of sucos. Forty onepercent of East Timor’s population suffers from poverty, with those in rural areas more likely tobe experiencing it. Agricultural policy and strategies, therefore, need to recognize the likelihoodof seasonal food shortages and accord suitable priority to programs to overcome those shortages.Unfortunately, East Timor has little or no comparative advantage in agricultural commodities,and current wage levels coupled with the US dollar as the medium of exchange will constrainefforts to become internationally competitive.
68. The Plan presents strategies to efficiently deliver services to agricultural, fishing andforestry communities that improve their productivity and income-earning potential. These willalso improve social welfare in rural areas and enhance human capital. Export development willbe an uphill struggle, yet the Plan identifies a broad range of initiatives that provide funding andassistance opportunities to alleviate poverty as a first priority, and systematically enhancedomestic livelihoods.
69. Agriculture and rural development continue to receive support under emergencyrehabilitation funding arrangements, through TFET, bilateral donors and multilateral agencies.

11
They are substantial, yet as the Plan illustrates, they are not sufficient to meet East Timor’spressing needs.
NATURAL RESOURCES AND ENVIRONMENT
70. East Timor is relatively poorly endowed with natural resources apart from the oil and gasreserves of the Timor Sea. Fishery stocks are poorly understood, but might also comprise animportant economic resource. Strategies proposed in the Plan recognize these limitations, butseek to develop sustainable domestic capabilities that optimize natural resources while alsoprotecting the natural environment.
71. Natural resource development, environmental interventions, and the primary goals ofpoverty reduction and economic growth are inextricably linked. These are addressed within thesector plans that include: (1) improvement in people’s health due to poor access to resources; (2)enhancement of the livelihoods of poor people, particularly in rural areas where they depend onland, water, forests and biodiversity; and (3) reduction of vulnerability to natural disasters suchas violent storms, floods and fires.
72. The Department of Natural and Mineral Resources is not an implementing agency, but itis the administrative authority for pursuing legislation relating to minerals, energy and extractiveindustries, and thereby regulating development to utilize the nation’s resources efficiently, whilstpreserving its environment.
73. Programs within the Plan reflect environmental and resource priorities, and the need toencourage private development without exploitation. This responsibility requires inter-ministrycooperation, particularly concerning oil and gas resources and the related infrastructure that isessential to support national development.
INDUSTRY, TRADE AND THE PRIVATE SECTOR
74. The programmatic initiatives of the sector are divided into five divisions, each concernedwith policy and regulatory priorities and capacity building that encourages private developmentof industry, investment, tourism and trade. Successful private sector development will be a keydriver of economic growth and poverty reduction. In the near-term, the principal role ofgovernment will be to provide the best possible enabling environment for private sectordevelopment.
75. The transition to economic independence will be the main challenge confrontinggovernment during the next five years. This is particularly true as international spending maydecline over the next few years, and revenues from oil and gas production in the Timor Sea maythen subsequently increase. Both of these changes pose risks and opportunities to private sectordevelopment. The Government has committed itself to a market-based economy, but during theearly years, this will be difficult to achieve without an open approach to foreign investment andforeign trade that will help build East Timor’s international competitiveness.
76. During the UNTAET period, government policy has successfully fostered a rapidrecovery of private investment and business activity, such that the supply of the vast majority ofgoods and services has been restored. Consequently, the first task of government in this sector isto continue this momentum and, in terms of early actions, provide positive signaling effects tothe market.

12
77. The largest portion of East Timor’s private sector is made up of its micro-enterprises andSMEs. Accordingly, their specific needs formed the backdrop of most of the policy optionsundertaken during the preparation of the Plan. Specific attention is given in the NDP to strategiesthat would most equitably distribute income and make available services to rural areas, thusaddressing the priority goal of poverty reduction. These strategies are linked to the need toincrease demand for domestic agricultural produce, and to improve domestic market linkagesthrough consistency and quality of supply.
INFRASTRUCTURE
78. Infrastructure is an issue of overarching importance to society. It includes the physicalcapabilities and service systems that provide the population with the essentials of electric power,water, sanitation, postal services, telecommunications, roads, air and sea transport facilities, andvarious support services. Infrastructure has perhaps the strongest cross-sectoral implications fornational development. Having an effective system of physical infrastructure and services iscrucial for agricultural productivity and poverty reduction, but it is also a key determinant ofbusiness investment, is vital to human development, and the foundation for private sectordevelopment.
79. Although significant progress has been made to restore infrastructure, the quality andlevel of services remain woefully inadequate. The infrastructure sector plan emphasizes nationalpriorities for economic development and a strong commitment to poverty reduction throughoutits department activities, but the first priority is to restore or establish required physicalcapabilities and public services.
80. This focus will not detract from efforts to meet the needs and aspirations of thosedisadvantaged by poverty, remoteness and difficulty of access to infrastructure services. On thecontrary, the ten divisions represented as the infrastructure sector in the Plan have systematicallyproposed programs that account for these needs.
81. The ultimate responsibility of each directorate is to provide a program of infrastructuredevelopment that ensures safe services, equitable prices, and maximum opportunities foreconomic development that improves human welfare. Most programs, however, are capitalintensive and the Plan presents alternatives for development, including private sector investment,foreign investment, build-operate-transfer (BOT) options, and public service contracts. Sectorstrategies are heavily reliant on these alternatives and on subsequent assistance from theinternational donor community.

13
PART 1
VISION AND STRATEGIES
Chapter 1. INTRODUCTION
Chapter 2. VISION, GOALS, PRINCIPLES AND INDICATORS
Chapter 3. THE DEVELOPMENT STRATEGY
Chapter 4. POVERTY REDUCTION STRATEGY
Chapter 5. CAPACITY BUILDING FOR PLAN
IMPLEMENTATION
Chapter 6. MONITORING, EVALUATION AND REVIEW

14
1. INTRODUCTION
“The people of East Timor prepared the National Development Plan. It belongs to them and reflects their values, needs, ideas, aspirations and
priorities.”
BACKGROUND
1.1 The release of the National Development Plan (the Plan) for the newnation of East Timor is a milestone in its history. It is the first time in more than450 years that the East Timorese have participated as free people in formulating atwenty-year vision, identifying key development challenges, and evolvingstrategies and programs of action for the next five years (2002 – 2007) to take thenation forward economically, socially, and politically. The Plan is not the end ofthe planning and development process; it is only the beginning. The importantwork of preparation and implementation of annual action plans, includingprograms and projects, has begun and will proceed during the next five years.
THE PLANNING PROCESS
1.2 The process of formulation of the Plan began in earnest in September2001, after the Second Transitional Government took office. A range of initiativesfrom the Government, civil society organizations and ordinary men and womenfed into the planning process. These included activities within (a) the PovertyAssessment; (b) the Countrywide Consultation undertaken by the ConsultativeCommission for Civil Society on Development (CCCS); (c) intensive work over aperiod of three months by Government officials in eight sector working groups,each chaired by the relevant Ministers; and (d) discussions and feedback at, andfollowing, a two-day stakeholder workshop on the Plan.
1.3 The Poverty Assessment (PA) comprised three components:
c) a Suco Survey (SSTL) covering all the sucos (villages) in the country,which compiled an inventory of existing social and physicalinfrastructure, the economic characteristics of each suco, and thecoverage of public services, based on information obtained from sucoand aldeia (hamlet) chiefs, teachers and other local leaders;
d) a Household Expenditure Survey (TLSS) which obtained informationfrom the members of a sample of 1,800 households spread throughoutthe country, and collected data on household demographics, housingand assets, household expenditures, agriculture and the labour market,basic health and education, subjective perceptions of poverty, incomesand social capital; and
e) a Participatory Potential Assessment (PPA) that assisted thecommunities in 48 aldeias in the 13 districts of the country to takestock of their assets, skills and strengths, identify the main challengesand priorities, and formulate strategies for tackling these within theircommunities.
15
f) The Plan draws upon the results of the PA.1 The SSTL Report was released inOctober 2001 whilst the reports on the PPA, the TLSS, and the composite PA(incorporating the findings from all three components), are expected to be publishedin mid-2002.
1.4 The Countrywide Consultation undertaken by the CCCS covered more than 38,000 EastTimorese citizens – men, women, secondary school students and youth. The consultationcaptured the twenty-year vision (to the year 2020), as well as current priorities, initiatives thepeople can take, and how they think civil society and the Government can address their concerns.The results are incorporated in the vision, goals and strategies as well as in the sectorinterventions of the Plan. A popular version of the Plan entitled “East Timor 2020 - Our Nation,Our Future” outlining the vision, priorities and expectations of the population is being releasedsimultaneously.
1.5 The eight working groups convened to work on the Plan involved more than 120 seniorofficials of the Government, including Ministers and Vice Ministers. They worked long days andweekends to formulate a homegrown Plan that takes into account the aspirations of the people,present realities and future prospects. Preparation of the State of the Nation Report has been thefirst major task accomplished by the working groups2. It enabled the East Timorese to take stockof the position in which the nation finds itself prior to its independence, and provides thebackdrop to the Plan. The working groups formulated a 20-year vision (to 2020), presenting thegoals, guiding principles, strategies, policies, programs, projects and legislation necessary for thecountry to move ahead with its development over the next five years. There was a high degree ofcongruence between the vision and priorities identified by the people in the CountrywideConsultation and those formulated by the working groups. The working papers of the groupswere presented by Ministers, and discussed at a two-day workshop for stakeholders, includingNGOs, civil society organisations, interest groups, the Church, political parties and donors. Thefeedback from the workshop has been incorporated into the Plan.
1.6 The people of East Timor prepared the Plan. It belongs to them, and reflects their values,needs, ideas, aspirations and priorities. It is an amalgamation of inputs from the variousstakeholders. The extent of citizen participation and the inclusive process adopted in preparingthe Plan are unique, especially for an incipient country. Most importantly, this process has beencrucial in building confidence and capacity among East Timorese Government officials, civilsociety organisations and communities.
ORGANIZATION OF THE DOCUMENT
1.7 The Plan provides a road map for the development of the country over the next five yearswithin a twenty-year perspective. It is presented in three parts. Chapters 2 to 6 comprising Part Iof the Plan provide an overview of the twenty-year vision, goals, strategies, and capacitydevelopment needs of East Timor, and monitoring, evaluation and review arrangements for thePlan. Part II presents a synopsis of the Macroeconomic Policy Framework and Medium-termEconomic and Financing Outlook in Chapters 7 and 8, which are prepared by the WorkingGroup on Macroeconomics and Public Finance. The remaining sector chapters prepared by theWorking Groups on Political Development, Foreign Relations, Defence and Security (Chapter
1 Only the preliminary results from the Household Expenditure Survey were available and fed into the Plan.
2 Unless otherwise specified all the figures quoted in the Plan are from the State of the Nation Report.

16
9), Poverty Reduction, Rural and Regional Development (Chapter 10), Social and HumanDevelopment: Education and Health (Chapter 11), Agriculture, Fisheries and Forestry (Chapter12), Minerals and Natural Resources and the Environment (Chapter 13), Industry, Trade and thePrivate Sector (Chapter 14), and Infrastructure (Chapter 15) form Part III of the Plan. The Planorganises and presents the outputs of the East Timorese as faithfully as possible.

17
2. VISION, GOALS, PRINCIPLES ANDINDICATORS
“The formulation of the Development Vision for the country to the year 2020 was carried out in full consultation with the people, civil society organisations
and government officials. The vision is an amalgamation of the inputs and tries to reflect accurately and fully the aspirations of all East Timorese”
THE LAND AND THE PEOPLE
2.1 East Timor is situated on the eastern part of the island of Timor, theeasternmost of the Lesser Sunda Islands. It is bordered on the west by theIndonesian province of Nusa Tenggara Timur (or West Timor). The Savu Sea andthe Strait of Wetar lie to the north of the island while Australia is to the south,about 500 kilometres across the Timor Sea. Also, the enclave of Oecussi in thewestern part of Timor Island is a part of the national territory of East Timor, as arethe islands of Ataúro and Jaco.
2.2 The country has a land area of approximately 14,610 square kilometres (sqkm), with a surprisingly varied topography and a diverse ecology. A core ofrugged hills and mountains form a mountainous spine that divides the northernpart of the country from the southern region. About 21% of the land is less than500 metres above sea level, 41% between 500 and 1,000 metres and the rest(35%) more than 1,000 metres above sea level, with the last including MountTatamailau at approximately 3,000 metres. Around 44% of the territory has aslope of approximately 40% which, combined with heavy rainfall, contributes tosoil erosion. The rainfall pattern is varied with the mountains receiving more rainthan the coastal plains. The southern region receives more rainfall (2,000millimetres or more) and has two harvests, while the northern part with less rain(between 500 to 1,000 millimetres) often has one harvest. The country is affectedby the periodic El Niño-related weather anomalies.
2.3 The climate is hot, with an average temperature of 21°C, and a highhumidity (about 80%). The dry months from May to October experience moderatewinds and slightly milder temperatures – about 18°C on the coastline and 10°C orlower in the mountains. During the monsoon season (November to April), therivers become torrents due to the extremely high rainfall in the mountains.
2.4 The country is organized into 13 districts, 67 postos (sub-districts), 498sucos (villages) and 2,336 aldeias (hamlets). The districts have been grouped intothree regions – the enclave district of Oecussi and the border districts of Bobonaroand Covalima forming the Western region, the districts of Aileu, Ainaro, Ermera,Liquica and Manufahi in the Central region, and the districts of Baucau, Lautem,Manatuto and Viqueque in the Eastern region – and the capital Dili. At present,the local government (administration) is organized at the district and sub-districtlevels although the traditional structures at the suco and aldeia levels continue viasuco and aldeia chiefs. The districts have District Administrators with a smallcomplement of staff and sub-district co-ordinators at the postos.
18
2.5 The last population census of East Timor Province was in 1990, and a population censusof the new country has yet to be conducted. The 1990 Census placed the population at 747,557,which included 47,000 non-East Timorese (mainly Indonesians from other provinces of whomalmost half were from West Timor). The rate of growth of population at about 2.5% per annumwas high compared to that in the rest of Indonesia. The capital, Dili, had more than 14% of thepopulation. The population density ranged from 48 persons per sq km in the Eastern region to 52in the Central region with Dili at 271 persons per sq km. Estimates from the 2001 Suco Surveyplace the population at about 790,000 in mid-2001, with females accounting for 49.75% of thetotal. This figure does not include the approximately 120,000 East Timorese who were then stillliving in refugee camps in Indonesian Timor, following the aftermath of the 1999 paramilitaryrampage. Since then, many of these refugees have returned to the country. In April 2002, some60,000 refugees remained in the camps, but many are returning, with the approach ofindependence. The proportion of the population in Dili appears to have increased considerably inrecent years, and unofficial estimates place it at more than 20% of the total. More than three-quarters of the population live in rural areas.
2.6 East Timor has a young population, with about 48.1% below the age of 17. This willplace a considerable demand on education and health services, at least for the next decade. Also,the relatively high fertility rate implies a continued high population growth rate in the nextdecade or more, unless policies are introduced for family planning and health education. Thelabour force participation rate is about 74% overall with that for women estimated to be morethan 50%. About three-quarters of those employed are in agriculture. Open unemployment, arecent phenomenon especially among youth, is in excess of 16%.
2.7 The ethno-linguistic diversity of the population is significant, with more than 30languages or dialects in use. The major local languages include Tetun, Mambae and Macassae,each spoken by more than 10% of the population. The main language, Tetun, is understood by alarge majority (about 80% according to some estimates) of the population, with about 40% ableto understand and use Indonesian, approximately 5% able to understand Portuguese, and about2% English. Indonesian was the working language for the government and the medium ofinstruction in schools during the more than 20 years of Indonesian rule. The new officiallanguages are Portuguese and Tetun, with Indonesian and English accorded the status of workinglanguages. This poses unique challenges of communication within the Government, between theGovernment and the people, and within the education system.
THE ECONOMY
2.8 The economy of East Timor was devastated by the 1999 violence. It has recoveredsomewhat in 2000, and further in 2001. The nominal gross domestic product or GDP, which is ameasure of the value of all goods and services produced in the country at prevailing prices, wasUS$321.2 million in 2000 (Boston Institute) and US$380.0 million in 2001 (IMF)3. The GDPdeclined by 2.1% in 1998 and 34% in 1999; but grew by 15% in 2000 and 18% in 2001. The sizeof the real economy (i.e. GDP at constant prices or adjusted for price inflation) in 2001 was onlyabout 88% of the 1997 level (IMF). Based on population data provided by the GovernmentStatistics Office, nominal per capita non-oil GDP was estimated at US$412 in 2000 and US$452
3 The estimates of GDP and population vary between different sources and may not be strictly comparable. One set of estimates are availablefrom the Boston Institute for Economic Studies (USA) and another from the International Monetary Fund (IMF).

19
in 2001 (IMF).4 This places East Timor in the low-income country category by internationalstandards.
2.9 In 2001, the output of the agricultural sector accounted for 26.5% of non-oil GDP, withmanufacturing industry at 2.5%, construction 13.3%, trade, hotels and restaurants 8.3%,transport and communications 7.4%, finance, rents and business services 6.3%, and Governmentservices 33.5%. Almost three-quarters of the labour force (73.8%) were employed in agricultureand 16.8% were openly unemployed. All other sectors combined employed less than 10% of thelabor force. Private consumption has been very high, reaching 100% of GDP in 2000, andprivate investment has been low. The large net external inflows (aid) played a significant part inthe financing of domestic consumption and investment in the two years.
2.10 Inflation was very high in 1998 (80%) and 1999 (140%), but decelerated in 2000 (20%),reaching a low 3% in 2001. Data on recent private sector wages is poor. However, evidence fromthe 2001 Suco Survey indicates that wages for the unskilled in the coffee industry may havetripled since 1999 from around US$1 a day to more than US$3 a day. Anecdotal evidencesuggests that these increases may have fed through into wage increases elsewhere in the privatesector, especially in skilled areas. Allowing for inflation, real wages probably have remained thesame since 1999.
THE DEVELOPMENT VISION
2.11 The formulation of the development vision for the country to the year 2020 was carriedout in full consultation with the people, civil society organizations and government officials. Thevision presented below is an amalgamation of their different inputs, and tries to reflect accuratelyand fully the aspirations of all East Timorese:
2.12 For the next generation, in the year 2020:
a) East Timor will be a democratic country with a vibrant traditional culture and asustainable environment;
b) It will be a prosperous society with adequate food, shelter and clothing for all people;
c) Communities will live in safety, with no discrimination;
d) People will be literate, knowledgeable and skilled. They will be healthy, and live along, productive life. They will actively participate in economic, social and politicaldevelopment, promoting social equality and national unity;
e) People will no longer be isolated, because there will be good roads, transport,electricity, and communications in the towns and villages, in all regions of thecountry;
f) Production and employment will increase in all sectors – agriculture, fisheries andforestry;
g) Living standards and services will improve for all East Timorese, and income will befairly distributed;
4 The GDP from oil and gas was estimated to be US$71.4 million in 2000 and US$63.9 million in 2001.
20
h) Prices will be stable, and food supplies secure, based on sound management andsustainable utilization of natural resources;
i) The economy and finances of the state will be managed efficiently, transparently, andwill be free from corruption; and
j) The state will be based on the rule of law. Government, private sector, civil societyand community leaders will be fully responsible to those by whom they were chosenor elected.
DEVELOPMENT GOALS
2.13 This vision is to be realized through the achievement of goals and development targets(quantitative and qualitative indicators). The Countrywide Consultation undertaken by the CCCSidentified education, health and agriculture as the population’s main priorities for thedevelopment of the country. Responding to the wishes of the people, the Government alsoaccords high priority to these sectors. The main goals include the following:
a) Improve the education, health and nutritional status of the people of East Timor;promote gender equality and the empowerment of women; improve the economic,social and cultural well being of individuals, families and communities in East Timor;create human resources that are skilled and professional in accordance with theinterests and talents in each field; and ensure equal opportunities to obtain work andeffective utilization of labour.
b) Transform the subsistence economy into a market economy; achieve food security;and protect the environment.
c) Achieve and sustain rapid economic growth, utilizing to the optimum the country’shuman, financial and natural resources; with low inflation and increased employmentadequate to cater to the growing labour force; a stronger banking and finance sector;maintain a competitive real exchange rate with more exports and less imports; createequitable business opportunities and increase incomes, especially in rural areas.
d) Reduce poverty among women and men; establish a social safety net to reduce theburden on those in society who are unable to work/help themselves.
e) Promote private initiatives, innovation and investments by creating enabling andsupportive environments - including policies, legislation and regulations, reliablesupplies of electricity, water, roads and transport, marketing and banking systems,and a competent, productive and disciplined labour force.
f) Secure and maintain the unity, territorial integrity and sovereignty of the nation;create and maintain durable internal peace, security and stability; prevent crime andinvolve the community in the reduction of crime; and make the country attractive andsafe to citizens and visitors.
g) Promote integrated rural development to generate remunerative employment andsustainable livelihoods, increase rural incomes, reduce poverty, accelerate economicgrowth and reduce the gap between rural and urban areas.

21
h) Promote an orderly development of cities and towns that are pleasant (e.g. with parksand playgrounds), not crowded, affordable and friendly to the environment.
i) Achieve balanced regional development to reduce poverty, improve the lives of EastTimorese in all regions, enhance and exploit complementarities between regions andagro-ecological areas, accelerate economic growth, and reduce regional disparities.
j) Achieve growth in government (budget) revenues to improve financial independence;effectively manage oil and gas revenues and savings to benefit present and futuregenerations; and ensure responsible, efficient and productive management ofgovernment (budget) expenditures to promote poverty reduction and growth.
k) Develop and administer an effective, accessible and impartial system of justice,which is prompt and transparent, and in conformity with the positive values andcultural heritage of East Timor; create an effective and independent system tooversee, monitor and remedy the potential excesses of the government and itsfunctionaries.
l) Strengthen an already robust civil society, and create opportunities for its constructiveengagement and participation in national life, and enhance the participation ofcitizens in public and national affairs.
m) Foster a culture of respect for human rights (particularly for women, children andother vulnerable groups, including the poor) and the rule of law; create public trust ina fair and just public administration; establish control mechanisms to monitor levelsof responsibility amongst government officials and public authorities.
n) Promote good governance through popular participation; a responsible and responsivegovernment including a lean, efficient, effective, accountable and transparent civilservice and effective, professional, non-political defence and police forces; adecentralized administration with simple and transparent norms, so that governanceand public administration is closer to the people; a socially responsible private sector;transparent and accountable civil society organizations; and a responsible,independent and effective media.
o) Foster a robust multiparty democratic system; establish and sustain a system ofchecks and balances between the judiciary, the legislature and the executive (i.e. theCourts, the Parliament, the Council of Ministers and the President).
p) Build and strengthen regional and international political, economic, scientific andcultural cooperation.
GUIDING PRINCIPLES
2.14 A number of principles have been identified to guide actions and progress in achievingthese goals. The important guiding principles adopted by the East Timorese are listed in thefollowing. As can be expected in such exercises, there is some overlap between the goals and theguiding principles.
a) Participation of all citizens in economic, social and political processes and activities.

22
b) Gender equality between women (girls) and men (boys) in access to opportunities,services, goods and privileges.
c) Equitable development between population groups (e.g. able-bodied and disabled,young and old, rich and poor and different ethnic groups) and areas (e.g. rural andurban, accessible and remote).
d) Equality and non-discrimination in access to jobs, other opportunities, goods, servicesand privileges, for diverse population groups in different areas.
e) Honesty, impartiality, professionalism, integrity, hard work, efficiency, transparencyand accountability in public service.
f) Respect for, and preservation of, the values and culture of the various groupscomprising East Timorese society.
g) Integrated development, ensuring synergies between different interventions togenerate benefits that are larger than the sum of the benefits of each intervention.
h) Cultural, religious and gender sensitivity.
i) Environmental, economic, social and political sustainability.
j) Democracy, sovereignty, respect for human rights and the rule of law, and equalitybefore the law.
k) Self-reliance, social solidarity, peace and national unity.
l) Creativity, innovation and quality.
2.15 A number of additional principles are to be adopted in the management of the economy,and for the overall development of the country. They are:
a) A market economic system with strategic and regulatory roles for Government,including the provision of social safety nets.
b) A strong role for the private sector in development.
c) A role for government to ensure that physical and social infrastructure and servicesare provided, and to provide a growth enabling policy and legal environment,including the maintenance of monetary and fiscal stability.
d) Effective, transparent and corruption free management of the economy and publicfinances.
e) Pursuing a fair and equitable economy and society with equal opportunities andimproved living standards for all.
f) Developing in ways that preserve the beautiful environment, traditions and customsof East Timor.

23
KEY DEVELOPMENT INDICATORS
2.16 The key development indicators have been identified by the East Timorese population.They include economic indicators, such as growth in income (aggregate and per capita GDP),inequality in income distribution, labour force participation and employment, and povertyincidence; social indicators including food availability, access to and use of education, health,water and sanitation services; indicators of security including personal and food security as wellas security from shocks and disasters; empowerment indicators such as the number of voluntarypeople’s associations and voting in elections; and indicators of gender equity and empowermentof women. A detailed list of the indicators is provided in Annex 2.1.
2.17 The indicators for East Timor draw upon those presented in the global MillenniumDevelopment Goals (MDGs) adopted by more than 175 countries at the United NationsMillennium Assembly in September 2000 (see Annex 2.2). The MDGs use 1990 as the baseyear, and build upon the targets adopted at previous UN Conferences including those onChildren, Environment, Food, Population, Social Development and Women. The Goals to beachieved by the year 2015 include:
a) reduction of poverty and hunger by half,
b) achievement of universal primary education with gender equality at all levels (i.e.primary, secondary and tertiary),
c) reduction of mortality of children under five years old by two-thirds, reduction ofmaternal mortality by three-quarters, and the halting and reversal of the incidence andspread of HIV/AIDS, malaria and other major diseases,
d) ensuring environmental sustainability,
e) reducing by half the proportion of people without access to safe drinking water,
f) improving significantly the lives of urban slum dwellers,
g) developing global partnerships for development,
h) developing and implementing strategies for decent and productive work for youth,
i) making available new technologies, especially information and communicationtechnologies, in cooperation with the private sector, and
j) addressing the special needs of the Least Developed Countries (LDCs) and smallisland states.

24
3. THE DEVELOPMENT STRATEGY
“....the overriding goals for the development of the country (East Timor) are to reduce poverty......and to promote rapid, equitable and sustainable economic growth.....”
INTRODUCTION
3.1 As an independent nation emerging from war and transition from the UN administration,East Timor faces many challenges and opportunities. It needs virtually everything. In the processof formulating the Plan, the Government has taken stock of the situation and identified nine keychallenges confronting the country in the State of the Nation Report.5 These key challenges are:
a) Helping the sizeable number of poor Timorese to help themselves, and to reducepoverty;
b) Improving the position of women to achieve gender parity;
c) Improving human resource capacities in the Government, private sector and civilsociety to manage and administer a nation state in the Twenty-first Century;
d) Sorting through the multitude of local languages in use and resultant communicationproblems, and facilitating an orderly and cost-effective transition to the new officiallanguages of Portuguese and Tetun;
e) Transforming the agrarian subsistence production to a market-based economy;
f) Improving productivity in all sectors through the introduction of appropriatetechnologies and practices, reducing risk and modernising production processes;
g) Creating an enabling environment for the private sector (including farmers,fishermen, small, medium and large investors and entrepreneurs, traders and others)to generate the jobs and economic growth necessary to improve the welfare of thepeople;
h) Managing public finances in an efficient and pragmatic way to enhance goodgovernance and attract adequate budgetary support from donor partners, to provideessential services during the next three to five years, until significant revenue flowsfrom the exploitation of oil and gas reserves begin to materialise; and
i) Sound administration and sustainable utilisation of the oil and gas revenues to benefitpresent and future generations of East Timorese.
3.2 The above challenges are in tune with the priority constraints identified by the people inthe PA during 2001 and the Countrywide Consultation undertaken by the CCCS in early 2002.These challenges underpin the strategy for national development during the next five years(2002/03 to 2006/07), which is seen as the first step towards achieving the twenty-yeardevelopment vision of the people of East Timor.
5 Planning Commission, The State of the Nation Report, Dili, East Timor, April 2002.

25
THE DEVELOPMENT STRATEGY
3.3 Through a participatory planning process, the people of East Timor determined that theoverriding goals for the development of their country are to reduce poverty in all sectors andregions, and to promote rapid, equitable and sustainable economic growth that reduces povertyand improves the well being of all the people.
3.4 Whilst these goals are clear, the question remains, “How to get there – how to achievethe goals and objectives?” The development strategy tells us, in broad terms, what the generalapproach will be, and how the goals and objectives will be achieved. The strategy helps decision-makers to focus on the main approaches to, and outcomes of, national development. Thedevelopment strategy for East Timor addresses the nine key challenges identified by the people.These challenges are to be met through the strategies outlined below. These strategies areelaborated in the relevant sector chapters.
Poverty Reduction
3.5 More than two-in-five East Timorese are living below the national poverty line ofUS$0.55 per capita per day. This poverty line has been set to fulfil the food requirement of 2,100kilocalories per day and other expenditures on education, health and housing, taking into accountnormal consumption patterns in the country. In addition to expenditure, the other dimensions ofpoverty as mirrored by social indicators reflect an equally austere picture. For example, literacylevels are low, access to and use of education services modest, and health services meagre,reflecting both supply and demand constraints. Considering the significant number of poorpeople and the central role of poverty reduction in the development strategy, a detailedpresentation of the poverty reduction strategy is provided in the next chapter.
Gender Mainstreaming and Empowerment of Women
3.6 Women constitute almost half the population of East Timor (49.75% according to the2001 Suco Survey). Women are key economic and social agents. They are also important actorsin caring for the young and the old, managing the household, and moulding the values andbehaviour of children who are the future leaders. The active participation of women in nationaldevelopment as equal partners with men is crucial for the overall improvement of the welfare ofthe people.
3.7 Many East Timorese do not yet seem to fully appreciate women's rights or to embracegender equality. Women (including girls) continue to be discriminated against in the ownershipof assets, access to social and economic services, and participation in making decisions affectingtheir lives. The prevalence of a multitude of traditional practices and the absence of statutorylaws make the identification and enforcement of women's rights difficult. The ingrainedorientation of men towards the traditional roles of women in East Timorese society needs to bechanged through education and sensitisation. A campaign of education and awareness raising ongender is essential, throughout the country and particularly in rural areas. Gender awareness andequity should be incorporated in school curricula. The print and audio-visual media should bemobilised to get the message across to all areas of the country.
3.8 East Timor has made a good start in recognising and promoting the role of women. Forexample, women constitute about 25% of the members of the Constituent Assembly (legislative

26
body).6 Drawing upon the recommendations of the Women’s Congress in 2000, the SecondTransitional Government of East Timor has included in the draft Civil Service Law a target of atleast 30% representation of women in the civil service and has already achieved 25%. Manywomen are active in civil society organizations including non-government organisations(NGOs). However, there is a traditional division of gender roles that does not always work to thepromotion of gender equality. Many activities in and outside the household are divided bygender including in farming. Women’s participation in petty trade has been traditionally animportant means to augment family income.
3.9 Gender parity appears to have been achieved in primary school enrolment. Yet the femaleparticipation rate in education at secondary and tertiary (including university) levels is low, andthe gender gap wide. Successful experiences from other developing countries could be drawnupon and adapted to suit the conditions in East Timor, to bridge this gap. Health facilities thatserve the specific needs of women need considerable improvement. Maternal health services arecritical not only for mothers but also for children. Resource allocation to these services isinadequate, and should be augmented. Women are at greater risk than men from HIV/AIDSbecause of their subordinate position within the household. The campaign to halt the spread ofHIV/AIDS should pay particular attention to the vulnerable situation of women, theirreproductive role in transmission of the virus to children, and to their special needs.
3.10 Recognising the importance of gender dimensions, the Second Transitional Governmentset up an Office for the Promotion of Equality, and appointed a Gender Adviser reportingdirectly to the Chief Minister. This has facilitated significant sensitisation and inputs into thegender dimensions of the Plan formulation process. Additionally, the Countrywide Consultationundertaken by the CCCS provided for consultation jointly, with women and men, and separatelywith women and with women’s groups, in order to capture fully women’s vision for theircountry, and their national priorities.7
3.11 Programs proposed in the Plan also include those on women’s economic empowerment.Gender dimensions are also incorporated in the Plan’s education and health programs. Therecently adopted Constitution has several provisions protecting the rights of women andpromoting gender equality. Formulation, adoption and enforcement of necessary statutory lawsprohibiting discrimination and violence against women and girls are planned. Civic and politicalleaders and opinion makers can set role model examples in their personal behaviour, promotinggender equity. After independence, the Government intends to ratify a series of internationalconventions including the Convention on Elimination of Discrimination of All Types AgainstWomen (CEDAW). Gender inequality is the surest way to transmit poverty to future generationsof men and women. Therefore, reducing gender inequality and enhancing women's productivitywill be integral elements of the country's development and poverty reduction strategies.
Human Resources Development
3.12 East Timor has human capacities, informal and formal institutions, and social andexchange arrangements, which have evolved over many years, and withstood the onslaught ofcolonialism and occupation. While these are well suited to the past circumstances, many are
6 In August 2001, 24 women were elected to the 88-member Constituent Assembly accounting for about 27% of the total. However, two womenmembers resigned since bringing down the proportion to 25%.
7 There is substantial agreement between women and men on the relative importance of education, health and agriculture – the top three prioritiesmentioned by the largest proportion of people consulted. However, there are significant differences on the other aspects. For example, womenoften mentioned “helping vulnerable groups” as the next priority while men ranked “roads and bridges”.
27
inadequate for managing and developing a modern nation state in the Twenty-first Century. Themodest capacity in the country is insufficient to meet its myriad needs. East Timorese in thegovernment, private sector and civil society will need to acquire new knowledge and developnew skills to administer a modern nation state and build a more diverse and developed economy.Yet it will be difficult to build the capacity to meet all these needs during the next decade.Consequently, prioritising needs for capacity building is essential for planning and planimplementation, as is the sequencing of the introduction of activities designed to provide theseneeds.
3.13 The Plan presents the main areas for capacity building and training in different sectors.Human resource development strategies focus on capacity building within the Government,private sector and civil society organizations, in such areas as management, supervisory skills,office management and administration, gender awareness and equity, human rights, informationtechnology, Portuguese language and translation. Training programs for district and village staffare also envisaged. Entrepreneurial, technical, and vocational skills are in short supply, and are tobe augmented through training programs and projects, including technical and vocationaltraining.
3.14 During the past two decades, a sizeable number of the youth have joined the struggle forindependence and missed the opportunity to attend school. The Plan visualises training programsfor these veterans and other youth to impart productive skills for wage or self-employment.
3.15 Training and capacity development through formal education programs in primary andsecondary schools and tertiary institutions are proposed to be expanded with particular attentionto increasing the participation of the poor and girls. Simultaneously, campaigns to improve adultliteracy and numeracy are envisaged, since these are crucial for productive employment andeconomic growth. In the health sector, capacity building is likely to be time consuming, costlyand difficult, and the focus necessarily will be on the provision and delivery of services to meetbasic health care needs. Similar efforts on strengthening capacity are visualised in other sectors.Capacity building efforts should go hand in hand with an efficient and effective utilization ofscarce human resources. (See Chapter 5 for more details on capacity building.)
Language and Communication
3.16 There are at least 30 local languages or dialects being used in different parts of thecountry. Almost 80% of the people of East Timor can speak or understand Tetun, with more than40% able to use Indonesian. Portuguese is understood by about 5% and only 2% can operate inEnglish. The Constitution formalised the adoption of Portuguese and Tetun as the officiallanguages with Indonesian and English to be used as working languages as long as needed. Thestrategies for improving proficiency in Portuguese include the introduction of the language as themedium of instruction in grades 1 to 3 and as a second language in grades 3 and above. This is toallow time for training of teachers and development of the curriculum and textbooks inPortuguese language. The process of introduction of the Portuguese language as the medium ofinstruction in grades 4 onwards will be gradual and flexible to allow for a smooth transition.Also, language training in Portuguese is to be provided to civil servants and promoted in theprivate sector and in civil society. Simultaneously, development of Tetun as a written languagefor daily use, and for judicial and technical purposes is being pursued. This is a pragmaticapproach to tackling a difficult challenge.

28
Transforming Subsistence Production into a Market-based Economy
3.17 East Timor is an agrarian society with a largely subsistence economy in which much ofthe production is consumed by producers (home consumption). About 76% of the people live inrural areas, and the poor among them account for 85% of the nation’s poor. Most of the ruralresidents depend on agriculture, and productivity in the sector is low. However, there is potentialto increase productivity and production, promote specialisation in niche commodities to take fulladvantage of the agro-ecological diversity, to enhance market exchange and expand exports. Inthe short and medium term, the sector is not only an important driver of economic growth, but isalso a key vehicle for poverty reduction in the rural areas. Recognising this, the Plan provides forintroduction of improved technologies and practices, enlarged support services, and betterfunctioning markets. There is a wealth of successful experiences in the Asia-Pacific region,showing how the agriculture sector could be mobilized to accelerate economic growth in theinitial stages of economic development, and transformed from a subsistence to a market-basedsystem. Additionally, integrated rural development is seen as a vehicle to supplement andaugment initiatives in the agriculture sector to transform the rural economy.
Improving Productivity and Modernising Production
3.18 Low-input low-output technologies and processes typify production in virtually everysector of the economy. They rely on locally available and often home-produced inputs. Emphasison risk minimisation is the norm for much of the production intended for home consumption,with only a small portion passing through market channels (see paragraph 3.17). Introduction ofproductivity enhancing technologies and processes is to be promoted through public supportservices (e.g. in agriculture) as well as through private and civil society initiatives (e.g. domesticand foreign direct investment and the promotion of micro, small and medium enterprises ininformal and formal production, and in the service sectors). East Timor is fortunate to haveaccess to modern off-the-shelf technologies in many sectors, ranging from agriculture toinformation technology. The initiatives put forward in the Plan visualise the adaptation andpropagation of technologies to suit the ecological, economic, social and cultural conditions ofEast Timorese society.
3.19 Modernisation of production requires markets both for the supply of inputs and for thesale of products and services. Strengthening existing markets and developing new markets isfeasible through improved infrastructure, reduction of transaction costs, improved access toinformation, and the promotion of competition. The important role of good infrastructureincluding roads and bridges, ports and airports, electricity and water supply, transport,telecommunications including radio, TV, telephone and internet and post are recognised. ThePlan provides for rehabilitation, improvement and construction of improved infrastructure topromote the modernisation of the economy and better serve the needs of the people.
Creating an Enabling Environment for the Private Sector to Flourish
3.20 The private sector in East Timor comprises among others farmers, fishermen, and micro,small and medium size entrepreneurs. It is in a nascent stage of development and needs anurturing environment to develop. Much of it has been geared to fulfil domestic consumptionneeds, and to serving the demands of the government during the past quarter century. Theprincipal role of the Government is shifting from driving the economy to create an enablingenvironment - including laws, regulations, and enforcement mechanisms (e.g. police, courts andother institutions) and arranging for the delivery of essential support services for the privatesector to gain confidence and strength, and to become the engine of economic growth. The Planincorporates measures to introduce enabling policies, laws, regulations and enforcement

29
mechanisms in such areas as land ownership, occupancy and lease/rental (tenancy), corporateand bankruptcy laws, banking and insurance, and appropriate security and enforcementmechanisms including well functioning civil and criminal courts and efficient police and securityservices. Initiatives to strengthen the capacity of the private sector, especially that of smallentrepreneurs, is visualized through pilot testing and the adoption of successful approaches inother countries (e.g. in micro finance, small and medium industries development and tourismservices).
3.21 The Government intends to strengthen the provision of essential infrastructure includingreliable electricity and water supply, telecommunications and transport through a combination ofpublic, private, civil society organisations and community partnerships. Already, the privatesector is the major actor in the provision of such services as transport, communications, agro-processing and manufacturing, tourism and hospitality services (e.g. hotels and restaurants), andmarketing, including the supply of inputs and sale of output. As it gains strength and matures, theprivate sector will play an increasingly important role in the provision of infrastructure,education and health services, side by side with the Government and civil society organisationsincluding the Church and NGOs. The Government will focus on its core functions, and willavoid involvement in commercial activities unless there is clear evidence that the private sectoris unable to provide essential goods and services (market failure), and that such non-provisionimpedes poverty reduction and economic growth.
Managing Public Finances
3.22 While the size of the Government will be smaller than in previous years, it will still havea critical role to play in managing public finances, ensuring the rule of law and good governance,and in implementing development priorities. In the short and medium-term, East Timor isconfronted with the twin problems of a limited capacity to raise domestic revenues and a relativelack of skilled human resources. Since the mid-1970s, many of the resources required forgovernment operations in the territory were provided by the central government in Jakarta andmore recently by the UN and other donors. The Government will have to tackle the dualproblems of a lean civil service8 that is not yet fully competent in government, and inadequateresources to fund all its priority programs. Effective management of the limited staff, and carefuland efficient use of the scarce financial resources must take centre stage in governance duringthe next few years.
3.23 Efforts to prioritise programs and spending during 2002/03 are already under way. Theexercise emphasises prioritisation and sequencing of expenditures and investments, and ensuringcomplementarities and synergies between programs to generate benefits that exceed the sum ofthose resulting from individual programs. A cross-sectoral approach should ensure efficientresource use, and generate commensurate benefits. At the same time the continual updating ofstrategies within sectors and agencies will be important. Also, a three-year medium term fiscalframework (MTFF) incorporating a results-based management approach is being developed foradoption.
3.24 By mid-2002, the departure of the bulk (about 70%) of the foreign personnel and thelocal counterparts engaged by UNTAET will leave a major gap in the capacity of the
8 The civil service strength (excluding the military and security forces and the police) is expected to reach about 12,000 by the end of 2002, whichis less than half of the approximately 28,000 under the Indonesian rule. The former is considered to be adequate (if fully competent and equipped)to perform government functions and is barely affordable by the country, given its present circumstances.

30
Government. To facilitate a more orderly transition, this gap is planned to be filled at leasttemporarily by about 300 foreign personnel with expertise in finance, management, developmentadministration and other technical fields. They are to be deployed in various line ministries(including the Ministry of Finance) and departments at the centre in Dili, and in the districts.This should ease the situation and allow time for building the capacity of the civil service in thenext twelve to eighteen months. The financial crunch on budget resources is expected to easesomewhat, once significant revenues from oil and gas begin to materialise.
Administration of Oil and Gas Revenues
3.25 The projected flow of significant oil and gas revenues currently expected to begin in2004/05 or shortly thereafter, is a blessing to the people of East Timor. It will allow them tomore fully address their development needs and priorities, further strengthen their humanresources, consolidate the gains achieved so far, accelerate and sustain economic growth, reducepoverty and improve the welfare of all East Timorese. According to present indications, the flowof significant oil and gas revenues is expected to be of limited duration – between 20 to 30 years– depending on the types of petroleum products extracted, world prices and new discoveries.Prudent management, saving, investment and utilization of the windfall in oil and gas revenuesprovides a valuable opportunity for East Timor to build its human, physical and economiccapacities, and graduate to a middle-income country. The thrust will be to utilise the resourcesfor the benefit of present and future generations of East Timorese, and curb the temptation tosquander the windfall in ostentatious consumption. The Government is already benefiting fromthe advice and assistance of Norway on the latter’s experience in managing petroleum revenuesin a sustainable way.
GOVERNANCE AND MACROECONOMIC MANAGEMENT
Governance
3.26 East Timor is fortunate in having a vibrant civil society and an enthusiastic people thatare eager to move on with nation building. However, development in East Timor is constrainedby a lack of appropriate legislation, regulations, institutions and other elements of a nationalgovernance structure. As indicated in the foregoing, the Development Strategy includes a focuson developing, as soon as possible, priority legal, institutional and governance structures thatsupport poverty reduction, gender mainstreaming, human resources development, private sectordevelopment and overall economic growth.
3.27 The strategy considers and incorporates the social and cultural values and normsunderpinning society. These include areas such as religion and the role of the Church, thecultural and social context in which productive, social and community activities occur, and theimpact of development on the natural environment. Emphasis will be accorded to strengtheningand maintaining an environment of peace and security. The development strategy will build uponthe extensive participation of the people in formulating their national vision and developmentpriorities. It will promote continued participation of the people in translating the Plan into action(implementation), monitoring and evaluation while seeking accountability from publicinstitutions and functionaries, the private sector, civil society organisations and the media.9
9 The baton of government will pass from UNTAET to the Government on 20 May 2002. Use of the future tense in this and other paragraphsshould be seen in this light.

31
Macroeconomic Management
3.28 Appropriate macroeconomic policies will underpin the development strategy. Thesepolicies will be designed and managed to be pro-poor. Examples of pro-poor policies include:10
a) equitable tax and revenue policies,
b) priority to public spending on services that are most used by the poor (e.g. primaryeducation, basic health care, rural water supply, and urban slum upgrading),
c) reducing rural urban gaps in access to, and affordability of, basic social services (e.g.education and health care) and essential economic services (e.g. extension,technology, training, credit and markets),
d) curbing price rises (low inflation),
e) ensuring banking, credit and microfinance services are available to all, including thepoor and women, and
f) implementing trade and investment policies that promote growth of production andemployment to benefit the poor.
3.29 All the macroeconomic policies (including fiscal policy, monetary policy, exchange ratepolicy, trade policy, investment policy and wages policy) will be framed as a consistent packagethat will promote growth and poverty reduction. The package will be designed to establish andstrengthen the international competitiveness of East Timor. The economy will be open to tradeand investment, with adequate safeguards to nurture and develop domestic industries that arecompetitive. The macroeconomic and sector policies will aim to promote the development of astrong and dynamic private sector, leading the growth process. Foreign investment will beencouraged, especially in sectors that contribute to strengthening East Timor’s economicinfrastructure and human skills and facilitate the transfer of technology.
3.30 In the initial stages, growth is likely to be led by labour-intensive activities andbusinesses employing unskilled and semi-skilled labour, particularly in the transformation ofagriculture. Macroeconomic policies will be conducive to moving to more mature stages ofgrowth, including high technology and high skills businesses, as investment demand and relevantskills emerge. The policies will be conducive to maintaining the competitiveness of East Timorwith its neighbours and in international markets. Higher domestic saving and investment will beencouraged. The banking and financial sectors will be developed to provide adequate services toall the people, and especially to rural residents, following prudent principles and practices.
10 The details on the macroeconomic policies are presented in the chapter on the Macroeconomic Framework.

32
4. POVERTY REDUCTION STRATEGY
“.....poverty reduction in East Timor should be seen primarily as a means to accelarate and sustain economic growth.”
INTRODUCTION
4.1 Poverty is multidimensional and manifests itself in different forms. It ismore than a problem of inadequate income. It includes a lack of access to basicsocial and essential economic services and life choices, including opportunities toparticipate in economic, social and political processes. The many characteristicsof poverty include malnutrition and illness, shortened lives, illiteracy, socialexclusion and the lack of appropriate means to improve one's situation. Thesedimensions may be experienced in different combinations. For example, men andwomen view and experience poverty differently. Often, women have less accessto, and control over, assets such as land and economic (e.g. credit and extension)and social services (e.g. education and healthcare), and limited participation indecision-making in and outside the household.11 Thus, gender inequality isconsidered to be one of the most important causes of poverty among women.
4.2 On a more general level, inequality can manifest itself in the ownership ofland, in the distribution of wealth and income, in access to economic and socialgoods and services as well as to remunerative jobs, in participation in social andpolitical processes, and in other life choices. Virtually all such inequalities arepresent in different combinations across regions and over time. They contribute topoverty and to the unequal distribution of income and the benefits ofdevelopment.
4.3 Consequently, poverty can be defined in both money (expenditure orincome) and human terms. However, many of the quantitative measures in use arebased on poverty lines defined in expenditure (income) terms, supplemented byother indicators on aspects such as access to and use of education (includingliteracy), health, water, sanitation and housing. Gender dimensions are alsoincorporated in poverty measurement. National poverty lines are constructedbased on data generated from household expenditure surveys covering a sample ofthe households in the country. The head-count ratio of poverty measuring theproportion of people below the poverty line in the total population is the mostcommonly used index. A poverty gap measure (the ratio or percentage of theamount required to bring the expenditures of the poor to the poverty line, relativeto the total expenditures of the poor at the poverty line) is used to measure theintensity of poverty.12
11 The ranking of development priorities may differ between men and women. For example, while the results of theCountrywide Consultation show almost complete agreement between men and women on the top three developmentpriorities (education, health and agriculture), significant differences emerge on ranking the other priorities. Also, thedifferences in ranking between men and women vary by district. For example, in Aileu which is one of the poorest districts,women ranked “helping vulnerable groups” while men indicated “roads and bridges” as the fourth priority.
12 For example, the poverty line in East Timor is US$0.55 per person per day and about 341,000 East Timorese are belowthe poverty line. Preliminary results from TLSS indicate the average expenditure of the poor to be $0.48 per person perday. Based on the above, the poverty gap is estimated to be about 13% [(0.55 – 0.48) x 341,000 ÷ (0.55 x 341,000)].
33
4.4 Understanding the causes and consequences of poverty are important to designappropriate means to address it. The poor are not a single homogenous group. People view andexperience poverty in different ways. The perceptions of the poor, their neighbours, communityleaders and local officials on poverty, the constraints faced by the poor, and the potential thatexists are valuable in understanding the situation on the ground. Often, these perspectives arecaptured through consultations, participatory appraisals, surveys and/or focus group discussionswith these groups, through participatory poverty (potential) assessments (PPAs).
POVERTY IN EAST TIMOR
4.5 The people of East Timor have survived harsh and difficult conditions and successfullyovercome both colonial and occupation regimes. Their rich experience in the political liberationof their country has been widely recognised. However, the stark reality is that the country is oneof the poorest in the region, with not only low income, but also poor performance on socialindicators such as, education, literacy and health. Thus, there is an urgent need for economic,social and cultural liberation to empower the people to exercise and enjoy fully their newfoundpolitical freedoms and rights.
4.6 Recognising the imperative of poverty reduction, the East Timor TransitionalAdministration (ETTA) in partnership with four donors13 undertook a poverty assessment during2001-02. The assessment comprised a survey of all the sucos (villages) in the country, a livingstandards measurement (or household expenditure) survey, and a PPA. Based on the preliminaryresults from the household expenditure survey undertaken in September 2001, a national povertyline at the equivalent of $0.55 per person per day was formulated. Around two-thirds of this wasallocated to food, sufficient to provide 2,100 kilocalories per day, and the rest to non-food itemsincluding education, health, clothing and housing. Using this benchmark, it was estimated thatabout 41% of the population fell below the poverty line, with the incidence higher in the ruralareas (46%) than in the urban centres (26%). The lowest poverty rate is in the urban centres ofDili and Baucau (14%).
4.7 The vast majority of the poor (85%) live in the rural areas. Of these, the poorest groupsare in households that have small landholdings or are headed by fishermen. Additionally,households with many children, or those with a large number of elderly or other dependentrelatives are most likely to be poor. Poverty incidence is higher among households headed bythose with no schooling, and it declines with a rise in the educational achievement (level) of thehousehold head.
4.8 Poverty in East Timor is also related to inequality in income distribution. The generallyused measure of inequality is the Gini-coefficient, which varies between 0 (absolute equality)and 1 (one person receives all the income). In 1995, the Gini-coefficient in East Timor was at0.363, which was higher than in some of the other poor provinces of Indonesia (see Table 1).This can be explained in part by the low productivity of agriculture, which reduced ruralincomes. Although three quarters (73%) of workers were employed in agriculture, they generatedless than one-third (around 30%) of the gross domestic product (GDP). Agricultural output perworker in East Timor during the mid-1990s was less than half that in most other provincesduring the Indonesian administration.
13 These are the Asian Development Bank, the World Bank, the United Nations Development Programme and the Japan InternationalCooperation Agency.

34
4.9 The majority of the urban workers were either employed by the government or otherservice providers and probably had earnings similar to those elsewhere in urban Indonesia. Thus,in the mid-1990s the per capita income in Dili was 73% higher than that for East Timor as awhole while that for the poorest district, Lautem, was 42% lower than the national average. Inother words, the per capita income in Dili was about three times that in Lautem. The departure ofIndonesian officials in 1999 was followed by an influx of foreign experts under UNTAET andother donor and NGO programs. As a result, the Gini-coefficient increased marginally to 0.37 in2001.14 This effect may be moderated somewhat after the scaling down of UNTAET operationsafter independence on 20 May 2002.
Table 4.1. Inequality and Agricultural Productivity, 199515
Gini-coefficient Agricultural output per worker(Rp. Millions)
East Timor 0.363 0.847
W. Nusa Tenggara 0.286 1.706
E. Nusa Tenggara 0.296 0.961
Maluku 0.269 2.026
Irian Jaya 0.386 2.007
4.10 An additional frequently used measure of inequality is the ratio of the proportion ofincome captured by the richest 20% of the population to that accruing to the poorest 20%. In1998, this ratio for East Timor was estimated to be about 3 by the Boston Institute forDeveloping Economies (USA). The inequality in income distribution in East Timor is consideredto be low to moderate as compared with that in other countries at a similar stage of development.
CAUSES OF POVERTY
4.11 The more apparent causes of poverty in East Timor include the following:
a) rapid population growth (estimated to be around 2.5% per annum),
b) lack of ownership and/or access to adequate productive assets, including land (forexample, 24% of the families owned less than 0.5 ha of agricultural land and 60%between 0.5 and 2.0 ha),
c) lack of productive skills (including literacy),
d) lack of remunerative employment or jobs (the open unemployment is more than 16%and especially high among the youth, and there may be significant underemploymentin the agriculture sector),
14 Preliminary estimate from the 2001 TLSS.
15 Reproduced from Booth, A. (2001), “Poverty, Equity and Living Standards in East Timor: Challenges for the New Nation,” in Hill, H. and J.Saldanha, East Timor: Development Challenges for the World’s Newest Nation, Institute of Southeast Asian Studies, Singapore, p. 244.
35
e) lack of or inadequate access to social and economic services (e.g. access to schoolingis low especially in the poorer districts, and the rural residents have to walk onaverage 70 minutes to reach the nearest health facility; and access to extensionservices low and markets difficult),
f) lack of information about the rights and obligations of citizens (this has beenimproving in the last two years),
g) political, social and economic turmoil, resulting particularly from the violence of1999,
h) discrimination, particularly against women, in the economic, social, political andlegal arenas,
i) natural shocks including drought, flood and fire,
j) unexpected death and illness, including Malaria, TB, and STD and HIV/AIDS,
k) manmade shocks such as revenge killings and violence, displacement andfear/insecurity,
l) social breakdown, including breakdown of marriage, family and social supportsystems, and
m) increase in the prices of basic necessities (e.g. food, clothing and fuel) and servicesparticularly during 1999-2000, partly resulting from introduction of the US dollar.
4.12 Some of these causes may be accentuated by poverty thereby creating a vicious circle.
CONSEQUENCES OF POVERTY
4.13 The effects of poverty on the poor are degrading and devastating, especially for womenand children. The consequences of poverty are also detrimental to society. These include thefollowing:
a) the meagre resources of the poor are not adequate to subsist, let alone to save andinvest,
b) the poor are forced to over-exploit renewable and non-renewable resources (e.g.forests including mangroves) for sheer survival, thereby contributing toenvironmental degradation,
c) the sub-optimal development of the productive potential of the poor, women andother vulnerable groups, results in a reduction or loss of their full contribution toeconomic growth and social development, and
d) the poor may impose negative externalities such as crime, spread of diseases, socialunrest, and political instability.16
16 Environmental degradation is another negative externality mentioned already.

36
4.14 Poverty reduction should be addressed through policies and programs that helpredistribute the growing assets and opportunities, income, services and choices to the poor.Disaffection of the poor and the disadvantaged may lead to social unrest and political instability,in addition to economic disruption. Therefore, poverty reduction is not only sound economics butalso good politics. East Timor can ill afford to ignore the potential and aspirations of its poor andwomen.
POVERTY REDUCTION STRATEGY
4.15 Economic growth and poverty reduction are the overall goals of the development of EastTimor. The people – including farmers, fishermen, traders, labourers, workers, and micro, smalland large investors – are the main actors that generate economic growth through their innovation,skills and work. The Government is primarily a facilitator in this process. The assets and effortsof the poor are necessary for the country to accelerate its economic growth, and to sustaindevelopment. This is all the more significant, since the poor constitute more than two-fifths ofthe population. The East and Southeast Asian countries mobilised the efforts of all their peoples– rich and poor, men and women, skilled and unskilled – in order to generate and sustain rapideconomic growth and achieve the status of newly industrialised countries (NICs). They treatedtheir people as their most valuable resource. This is an important lesson from which East Timorcould benefit. Indeed, during the PPA in November – December 2001 and the CountrywideConsultation undertaken by the CCCS in January – February 2002, the people of East Timorwanted to convey the important message to the Government that they should be seen as an assetrather than a liability.
4.16 A large majority of the poor people in East Timor is capable of contributing to thecountry’s economic growth and development.17 The challenge is to provide the enablingenvironment for them to participate in, and partake of the benefits of development, whileassisting the few that cannot help themselves. Thus, poverty reduction in East Timor should beseen primarily as a means to accelerate and sustain economic growth. The Poverty ReductionStrategy of the country is formulated on the basis of this approach. It is understood that rapideconomic growth is a prerequisite for sustained poverty reduction in East Timor. The mainelements of the Poverty Reduction Strategy comprise the following:
a) Create an enabling environment to generate opportunities for the economicparticipation of the poor, improving their productivity and enhancing their incomes;
b) Provide and/or encourage and help others to provide basic social services to the pooron affordable terms;
c) Provide or help to provide security of person and property, and protection fromunforeseen shocks and disasters (vulnerability), including food security at both thehousehold and national levels; and
d) Empower the poor and other vulnerable groups through popular participation indeciding upon and managing development in their aldeias, sucos, postos, districts andthe country.
17 Only a small minority (including orphans, the disabled, widows, and other vulnerable groups) require either temporarily or on a continuingbasis direct transfers of income or other help to lead a reasonable life by the standards of the East Timorese society.

37
4.17 Elaboration of these four elements of the strategy and their links with activitiesundertaken in the various planning sectors are illustrated in the following sections:
Opportunities for Economic Participation
4.18 The experiences of the Asian NICs show that the initial thrust for rapid economic growthemanated from the agricultural sector, especially from productivity improvements in small-scaleagriculture. About three-quarters of the labour force in East Timor is dependent on small-scaleagriculture, and improving their productivity is critical for accelerating the country’s economicgrowth. Almost half of this labour force is poor, and a majority of the poor are women.
4.19 The poor in East Timor are engaged primarily in agriculture – in cultivating crops, animalhusbandry, fisheries and forestry. Improving productivity in the sector is recognized as a highpriority. Traditionally, East Timorese farming families have attempted to minimize risks fromcrop failure due to adverse weather or other unforeseen events through the practice ofintercropping and low seeding rates.18 Other approaches to risk minimisation such as the use ofdrought resistant varieties, improved water use including irrigation management, and highyielding crop varieties are feasible. Proposed initiatives for this within the Plan includerehabilitation and construction of irrigation systems and their improved operation, introductionof water harvesting techniques, wider distribution of improved seeds of crops, fruits andvegetables, protection of livestock, improved fishing and sustainable management of forest andother natural resources, through community participation. Improvements in marketing andinfrastructure are also planned. Provision of support services is expected to materialize throughpublic and private initiatives in agriculture, and in other sectors.
4.20 The informal sector has been an important contributor to growth in the Asian NICs.Alongside agriculture, a large proportion of the employed in East Timor are dependent on theinformal sector, in both the urban and rural areas,19 and a majority of them may be poor.Consequently, increasing opportunities and improving productivity in this sector are crucial forenhancing the country’s economic performance and reducing poverty. Initiatives proposed in thePlan include training, introduction of appropriate technologies, and other support servicesincluding the supply of micro credit.
4.21 A third important area is the formal private sector, in manufacturing, construction andreal estate, trade, transport, tourism, and financial and other services. Priority policies andlegislation are being drafted to improve the policy environment, and to encourage both domesticand foreign private investment in the country.
4.22 A fourth area is the provision of infrastructure – including roads and bridges, ports andairport(s), electricity, telecommunications and postal services. These are critical for themovement of people and goods, an orderly and efficient functioning of markets, and for asustainable development of the country. A number of interventions are proposed to improve thecountry’s infrastructure, drawing primarily upon aid resources.
18 For example, many small farmers grow three or more crops (e.g. sweet potato, maize and beans) on the same plot of land simultaneously.
19 For example, a 1993 survey by BPS, the Indonesian statistical agency, showed that about a third of the farm household income came from off-farm sources including wage income and self-employment in manufacturing, trade, transport, other transfers (e.g. pensions), etc. (Cited in Booth,A. (2001), “Poverty, Equity and Living Standards in East Timor: Challenges for the New Nation,” in Hill, H. and J. Saldanha, East Timor:Development Challenges for the World’s Newest Nation, Institute of Southeast Asian Studies, Singapore, p. 249.)

38
4.23 The final area relates to macroeconomic policies and the management of public finances,including public expenditure allocation. In this area, pro-poor macroeconomic and publicexpenditure policies will be implemented.20
Basic Social Services
4.24 Enhanced access to and use of basic social services is an urgent need in East Timor.Almost half the adult population is illiterate, with women considerably disadvantaged relative tomen. Whilst access to schooling improved considerably during the Indonesian period, whencompared with the latter years of Portuguese rule, the quality of teaching and learning was low.Currently, about a third of children are not enrolled in primary school, and up to 20% of thosereported as enrolled do not attend classes. Access to and use of public health services is minimal,due to the inadequate number of trained personnel, facilities, medicines and supplies (supplyconstraints), coupled with poor access and cost (demand constraints). For example, in the ruralareas, reaching the nearest health facility requires - on average - a 70 minute walk. Afterreaching the facility, there is no guarantee that a doctor and/or nurse will be available.Additionally, each visit costs about two dollars (US$2). Access to safe water and sanitation isalso low, and the quality of much of the housing stock is inadequate.21
4.25 The provision and effective use of basic social services is an important means to breakthe poverty cycle. Education and literacy are prerequisites for introduction and adoption ofmodern productivity enhancing technologies. The Plan incorporates programs to improve schoolparticipation rates, especially for children from poor families, and to improve the quality ofteaching and learning. Adult literacy programs are also proposed. Evidence from other countriesshows that education of girls and women have multiple benefits, affecting their welfare, and thatof their children, families and future generations. The delivery of basic health care is to beimproved by addressing both the supply and demand constraints. These are key ingredients forimproving not only the productivity of the population but also the welfare of the society.
4.26 Ensuring access to, and affordability of basic social services is an important task for theGovernment. This does not mean that the Government should deliver all the services. As inmany countries in the region, NGOs and religious organizations in East Timor have beeninvolved in the delivery of some of the basic social services. The Church is prominent ineducation, some NGOs have been involved in healthcare delivery (until mid-2001), and othersare involved in supporting community water supply and sanitation. The private sector has alsobeen active in the delivery of services to those who can pay in other countries. For example,almost half the health services in the Philippines are delivered by private clinics and hospitals.
4.27 Under present circumstances in East Timor, the delivery of quality primary, juniorsecondary and senior secondary schooling, and primary health care (including preventive caresuch as immunization and health, hygiene education and curative care) are given priority withinthe Plan. With regard to water supply and sanitation, the overall approach is to address theprovision of the services in urban areas on a cost recovery basis, whilst community ownershipand operation is the norm in rural areas. The challenge is to build partnerships and strengthencomplementarities between public and private entities – in this case mainly with the Church and
20 The UN World Summit for Social Development (Copenhagen, March 1995) recommended the adoption of the 20/20 Compact formobilisation of resources for financing basic social services. The basic social services include primary education and adult literacy, basichealthcare, safe water and sanitation. These services are considered essential for combating the worst manifestations of poverty and deprivationand improve human development. The Compact calls for devoting at least 20% of public expenditures (government budget) and 20% of ODA toproviding basic social services.
21 The phenomenal destruction of property in the 1999 violence greatly reduced the modest stock of relatively better quality housing.

39
the NGOs – to deliver services to the population at large, and to the poor in particular, withgender equity.
Security
4.28 The third element of the Poverty Reduction Strategy, is concerned with ensuring thesecurity of person and property (against violence, destruction and theft), food security, livelihoodor job security, and protection against unforeseen calamities - including natural disasters such asfloods and droughts, as well as economic shocks and political and social disturbances. Securityof person and property has been a major concern for many East Timorese families during muchof the 25 year occupation, and particularly in September 1999. The security situation hasimproved considerably since September 1999. Proposals are included in the Plan to consolidate,improve and sustain the current relatively stable and peaceful situation in the country, with theparticipation of its constituent communities. Interventions include precautionary measures(monitoring/intelligence), police and law enforcement activities, and efforts to promotereconciliation and reintegration of refugees and other groups at risk.
4.29 Food security is an important concern for the population in general, and for the poor inparticular. The findings from the 2001 SSTL and the TLSS show severe stress in foodavailability during December and January – the lean months preceding the harvesting of maizeand rice, the major food crops – with significant stress during November and February. Copingstrategies mentioned by the people include reducing consumption (eating two meals a dayinstead of three), substituting maize for rice and cassava and sweet potato for food grains, sellinglivestock, and borrowing from relatives and friends. There have been some improvements innational food security in the last two years resulting from better harvests of rice and maize.However, food security is still a major concern at the household level.
4.30 Interventions outlined in the Plan for the agriculture sector will enable a consolidationand further improvement in overall food availability in the country. They will also contribute toimproving food security at the household level. Further targeted interventions may be necessaryto strengthen food security at the community and household levels, including strengtheningtraditional community structures such as caring and sharing arrangements. However, it isimportant to recognise that food scarcities may adversely affect all households in a poorcommunity, and there may not be enough to share and alleviate the hunger. Often children andwomen are at greater risk. This takes on increased significance when viewed in the context ofalmost half the children in the country being underweight, and a quarter malnourished. Examplesof interventions included in the Plan at the program level include school feeding and thedistribution of milk and food supplements to pregnant and lactating women. Continuation of thecurrent practice of augmenting food availability through imports in the short and medium-term,and timely distribution to vulnerable groups is also envisaged.
4.31 Insecurity of livelihood or employment is pervasive in the traditional, informal andformal sectors.22 This can arise from lack of recognition of ownership and tenancy of agriculturalland, from traditional access to such resources as forests, or other public lands for collection offood, fodder and other products, and from delineation and lease or sale of common propertyresources (e.g. fishing grounds and pastures). In most cases, it is the poor and vulnerable that areat risk. The proposed legal frameworks and policies on agricultural land, fisheries and forestryshould minimize such risks. Additionally, employment arrangements in the informal and formal
22 Also, open unemployment is in excess of 16% of the labour force with a much higher rate among youth and veterans who participated in thestruggle for independence. A significant proportion of the labour in rural areas may be underemployed.

40
sectors for unskilled (and often poor) labourers may be insecure, due to economic or marketdevelopments (e.g. cheap imports) or other events, with unscrupulous employers exploitingworkers for long hours of menial work with low wages. Some protection of the workforce interms of fair wages and working conditions is envisaged, without these creating disincentives foremployment.
4.32 Security from natural and man-made disasters is a further dimension that needs to beaddressed. There is a wealth of experience on these aspects in other countries in the region, andin other regions of the world. It includes disaster forecasting, preparedness, prevention andmitigation. Employment in public works, including community maintenance of roads, is alreadybeing implemented in East Timor. Other initiatives in this direction are proposed in the Plan.They stress the importance of community involvement and the strengthening of communityresilience, in addition to material help from the Government, donors and NGOs. Theseinterventions and arrangements may be refined, based on experience during the first two to threeyears of plan implementation.
4.33 Security from economic shocks is an area that also needs attention. One of the moresignificant, imminent economic shocks is the scaling down of UNTAET operations, and thedeparture of a large number of foreign staff. This will be felt not only in the urban areas of Diliand other district towns, but also in the hinterlands that provided goods and services toforeigners. Some short-term and medium-term training and employment measures arecontemplated to cushion the adverse impacts of the UNTAET contraction.
Empowerment
4.34 The fourth dimension, empowerment, embraces the provision of “voice”, and theparticipation of the poor in making decisions about their future and the future of theircommunities, on economic, social, cultural and political issues.
4.35 As the experiences in the formulation of the Plan demonstrate, popular participation is awidely accepted norm in present day East Timor. Many initiatives proposed in the Plan intend toconsolidate and build upon this enthusiasm. Examples include community decision-making andmanagement of water supply, infrastructure and natural resources. Successful examples ofcommunity management of schools and health facilities in other countries should be drawn uponin piloting and testing similar approaches in East Timor.
4.36 Decentralisation is an important means to ensure the sustained participation of the peoplein general, and the poor and women in particular, in local affairs. The degree of decentralisationcan be at three levels: deconcentration, delegation and devolution.23 For example, prior to 1999,“deconcentration” was the rule, with the central government delegating responsibility forimplementation of policies and programs decided by Jakarta to administrators at the local level.It was a top-down system with little room for decision making at the local level or the flow ofinformation from the bottom up, let alone people’s participation. Delegation involves thetransfer of some decisions and functions to local organisations including those at the villagelevel. For example, the ongoing Community Empowerment Project (CEP) delegatesresponsibility for a number of decisions and functions to elected Village Development Councils.The Plan aims to build upon the experiences and lessons learned in the CEP, and to expand andreplicate the more successful approaches in other areas. Devolution is the next level ofdecentralisation, and involves the transfer of significant authority for decision-making, finance
23 UNDP, East Timor Human Development Report 2002, second draft, Dili, April 2002.

41
and management to elected local governments, often with the power to impose taxes and raiserevenues. Significant capacity building at the local level is a prerequisite for the introduction ofdevolution. This is a gradual process, which the Government intends to pursue.
4.37 Informed participation of the people requires civic education and improvements ineducation and communication. The recent highly successful experience of voter educationresulting in high levels of participation in the Presidential election - with a turnout of more than86% of eligible voters - is an excellent example of civic education, which can be replicated inother areas. Civil society organisations, including the Church, have been important facilitators inthe voter education process. School curriculum development is expected to incorporate civiceducation. Also, separate programs on civic education are to be promoted through the massmedia, in partnership with civil society organisations.
4.38 The challenge of formulating and implementing an information, education andcommunication (IEC) strategy focusing on all the people is recognised. This is critical forinforming and educating the people on the roles, functions and activities of the different organsof the Government, donors, NGOs and other civil society organisations. At the same time, viablechannels need to be evolved to facilitate the flow of information from the people on the groundto policy makers, other Government functionaries and other stakeholders. This is especiallyimportant for the poor, women and other vulnerable groups. In this regard, theinstitutionalisation of the recent successful political and popular participation and consultationapproaches may be appropriate. The Plan incorporates initiatives that go some distance in thisdirection (e.g. information and education on the role and activities of the Parliament,organisation of communities and provision of audio visual equipment). It is necessary toexamine the initial experiences in the different sectors in formulating the IEC strategy and indesigning appropriate coordination mechanisms.
CONCLUSIONS
4.39 The implication of the preceding analysis is that improving the productivity of the poor isessential for East Timor’s economic growth. It should be an integral part of the interventions inall the sectors of the economy to achieve and sustain rapid economic growth and improvementsin the welfare of all Timorese. Creating an enabling environment for catalysing and sustainingthe contribution of the poor to national development is an important task for the Government. Itwill entail both providing, and helping others provide basic social and essential economicservices to the poor, nurturing and promoting the entrepreneurial initiatives of the poor, andprohibiting discrimination based on gender, ethnic origin, language, or geographic location.
4.40 Enforcing the rule of law, creating a secure environment, and a sound management offiscal and monetary affairs are important ingredients for economic growth and overalldevelopment. Discretionary decision-making must give way to rule-based procedures, withreduced opportunities for corruption and favouritism. The role of Government should be limitedto providing those essential services that the private sector and civil society organizations are notin a position to deliver. These are important ingredients for poverty eradication, gender equityand economic advancement of the country.
4.41 In particular, there is a need to link closely governance and poverty reduction, to enablethe people to seek solutions to their development problems, and to exploit all availableopportunities. East Timor must create a conducive political, social, economic and legalenvironment for the poor to mobilise their resources, to realise their potential, and to buildsustainable livelihoods.

42
5. CAPACITY BUILDING FOR PLANIMPLEMENTATION
“East Timorese in the government, private sector and civil society will need to acquire new knowledge and develop new skills to administer a modern nation
state, and to build a more diverse, developed economy.”
INTRODUCTION
5.1 Promoting economic growth to reduce poverty will require theGovernment to facilitate the delivery of basic social and economic services. Thisdelivery will itself require enabling laws and regulations, and the empowerment ofthe population through community management and participation.
5.2 To build capacity to meet East Timor’s significant needs in infrastructure,technology, training, capital and access to markets during the next five years isclearly impossible. Consequently, prioritizing needs for capacity building isessential for planning and plan implementation, as is the sequencing of theintroduction of activities designed to provide these needs. East Timorese in thegovernment, private sector and civil society, will need to acquire new knowledgeand develop new skills to administer a modern nation state, and to build a morediverse, developed economy.
5.3 In this process, criteria for prioritization should centre on the importanceof capacity building for essential, sustainable, and affordable service delivery. It isvital that the most crucial areas for capacity building be agreed at the earliest stageof plan implementation. The Plan presents the main areas for capacity buildingand training, in several of its programs, in different sectors. These programsaddress both short-term implementation needs, and capacity requirements for themedium term at the central, district and local levels. They recognize a crucialpoint: that capacity building will have to be based extensively on governmentpartnerships with civil society organizations, the church, NGOs and the privatesector. Additionally, capacity building must take into account the roles performedby existing traditional institutions, informal networks, and mutual-help groups,particularly at the village level. These were critical in maintaining communitiesduring the struggle for freedom, and will continue to play an important part incapacity building at the local level.
5.4 On the basis of these requirements, several areas are prioritized in thePlan. These can be summarized, as follows:
GOVERNMENT AND GOVERNANCE
5.5 Capacity building at the government level is crucial for East Timor.During the Indonesian period, limited indigenous expertise was developed insenior and middle management, supervisory level skills, and in officemanagement and administration. Additionally, many of the East Timorese trainedin these areas left the country during 1999, and have not returned. Consequently,as outlined in The State of the Nation Report, the vast majority of current civil

43
servants are neither adequately experienced, nor trained for the roles they will have to undertake.Yet East Timor will have to depend heavily on its civil service to manage the transition to anindependent, democratic, and economically viable society. To address this problem, the formerCabinet endorsed a comprehensive ten-year program for Governance and Public SectorManagement developed by the National Planning and Development Agency in 2001, withsupport from the UNDP. This program was well received by donor countries. The Plan buildson, and develops this program, by stressing the need to develop organizational and managerialvalues within a framework that respects East Timorese cultural values, whilst concomitantlypursuing open, cost effective and accountable systems of government.
5.6 The Plan sets out strategies for developing and strengthening institutions for the post-transition period. It outlines how capacity can be built to enable the Government to assist in thedevelopment of a market-based economy. For each sector, the Plan also provides strategies forstrengthening capacities in policy development, co-ordination, and the core skills required formanagement. It shows how the East Timorese Government can provide an enabling economicenvironment, deliver appropriate services, and establish relevant legal frameworks during thepost-independence period. It stresses the need for transparency, and outlines how capacity can bebuilt within the civil service for drafting legislation, developing policy and upgrading skills. Inthis, it cites as most crucial: the development of operational planning and budgeting; thedevelopment of organizational and supervisory skills at middle and supervisory levels; trainingin records management and document control, information technology, Portuguese language andtranslation; training programs for district and village staff; gender awareness and equity training,and human rights training. In meeting these aims, additional, basic skills need to be developed ata number of levels within public service. For example, at the senior and middle managementlevel, there is a need to develop the ability to put together operational plans and budgets, todevelop capacity in advising ministers on legislation and regulations, to create operationalprograms from policies, and to link government with the private sector, NGOs, and civil societyorganizations. Similarly, at the office management and administrative levels, skills need to bedeveloped in areas such as records management, drafting documents, and communication. Onlythrough developing skills such as those outlined above, will East Timorese be able to genuinelyown their administration, and begin to build capacity themselves.
5.7 The Capacity Development for Governance and Public Sector Management Programme,outlined above, suggested 75 areas of development, implementation of which was regarded asimportant for institutional and human resource development in East Timor. Some of the morecrucial of these have already been specified, notably for improving capacity for service deliveryin the Civil Service Academy, improving human resource skills and capacity for thedevelopment of policies, legal and regulatory frameworks for civil service personnelmanagement, and for servicing the government with cost-effective, efficient human resourcessystems. Donor support for these, and for other areas such as records management, policy,guideline and procedure development, legislative review, planning and budgeting, the operation,maintenance and management of Information Technology will be important in strengtheninggovernance and public sector management capacities. The aim of such support, and one of theessential goals for building capacity for plan implementation is to develop a professional,efficient and effective civil service, capable of monitoring and guiding long-term development.This is linked directly to poverty reduction, to optimising the delivery of services to the public,and to enabling the development of a vibrant private sector.

44
DECENTRALISATION
5.8 The need for political decentralisation is stressed in East Timor’s Constitution.Decentralisation aims to provide more efficient delivery of services and decision making, withpriority given to communities who understand their local needs and circumstances. The Planproposes that capacity be built for this, through the provision of training for the administration offive regional offices for several ministries, backed up by regional coordinating bodies withrepresentatives from government, community groups, NGOs and civil society organizations. Tofurther these proposals, training is required to improve the management skills of district anddeputy district administrators, local development officers, and sub-district coordinators. Suchtraining could be developed and provided through the Office of District Affairs. Sector managersworking at the district level also require relevant training, to implement, monitor and evaluateplan activities in their respective areas. Additionally, at the suco level, there is a need to developprograms to increase village capacity for plan implementation, and to provide support fordeveloping capacity in local training institutions to provide sustainable assistance to localadministrators. NGOs, church organizations and civil society groups can assist in this process, aswell as developing civic education programs to facilitate local communities to monitor planoutcomes, in relation to their original “vision” statements in the Countrywide Consultation.
EMPLOYMENT
5.9 Entrepreneurial, technical, and vocational skills are lacking in every sector of the EastTimorese economy. The Plan stresses that one of the most important challenges for East Timor,both currently and in the foreseeable future, is to create an adequate number of both formal andinformal employment opportunities to meet the needs of the country’s youth. Some 15-20,000young East Timorese enter the working age population each year, far more than the anticipatednumber of jobs in the public sector. To meet their needs, the Plan argues for an extension of thecurrent on-the-job training undertaken in informal economy workshops throughout the country,the design and implementation of basic training programs by employers in the formal sector, anda further development of existing donor and church programs in vocational training. To facilitatethe development of technical and vocational training, the Plan proposes that the Governmentestablish a unit responsible for Technical and Vocational Education and Training. The LabourCode passed by the Constituent assembly, due to be enacted on May 1st, 2002, requires that theDepartment of Labour and Solidarity establish a Division of Vocational Training andEmployment, comprising three units – for skills development and upgrading, employmentservices, and labour market assessment. Additionally, community-based training centres are tobe set up in the countryside, to train people in the skills needed in the local informal economy,and to provide advice on employment. These centres will also develop a basic skills-employmentmatching service.
EDUCATION AND LITERACY
5.10 Currently, standards of education in East Timor are among some of the lowest in theworld. Illiteracy prevents approximately 50% of the population from participating fully, sociallyand politically. It also restricts the attainment of improved health standards. Most importantly,however, it limits national development, since literacy and numeracy are crucial for productiveemployment and economic growth. Consequently, the Plan focuses on capacity building forreconstructing and developing the education system – through prioritizing strategies for teachertraining, increasing primary school enrolment, improving retention rates, modernizing thecurriculum, and enhancing community involvement in the management of schools. One of the

45
most difficult tasks for schools in the years ahead will be to extend both the use of Portugueselanguage and the standardization of Tetun for use in schools –as required in the country’sConstitution. Again, the plan offers programs and projects through which this can be achieved –through language training for teachers and administrators, and the production of texts in the twolanguages. Most importantly, the Plan also details programs and projects to design a literacymanual, to extend existing donor literacy campaigns, and to develop new campaigns forimplementation by the Ministry of Education.
HEALTH
5.11 Standards of health in East Timor are poor, and existing health provision is weak. Lifeexpectancy ranges from 50-58, and is combined with high infant mortality rates of 78-149 per1,000 live births, and under-5 years mortality rates of 124-201 per 1,000 live births. Women bearan unacceptable burden of maternal mortality and morbidity, with maternal mortality rates at350-800 per 100,000 live births. Only 30% of births have any skilled birth attendance.Approximately 3-4% of children aged 6 months to 5 years are acutely malnourished, whilst 1 in5 are chronically malnourished. About 45% of children under 5 are underweight. Almost allhealth facilities were destroyed in 1999, and there are acute shortages of doctors, nurses andmidwives. To build capacity in this area will be extremely difficult, and the focus necessarilywill be on the provision and delivery of services to meet basic needs. The Plan presents policies,and short and longer-term strategies for this. It prioritises ongoing, long-term programs in child,maternal and reproductive health. Crucially, it also focuses on current needs to build capacity forthe provision of support services and management systems for the delivery of these programs.
INFRASTRUCTURE
5.12 As detailed in the State of the Nation Report, infrastructure is in a poor state, and capacityin this sector is extremely weak. This is an issue of overarching importance for all sectors of theeconomy and society, since infrastructure is a key determinant of agricultural productivity,poverty reduction, investment, human development and government capacity to deliver services.The Plan specifies detailed programs for building capacity in the key areas of water supply andsanitation, road reconstruction, and the restoration of basic transport and communicationfacilities. For the longer term, it specifies programs for the development of a sustainable powerinfrastructure, with an accompanying institutional framework. The substantial expendituresrequired for these programs highlight the crucial issue of financial constraints on infrastructuredevelopment. Here - perhaps more than in other sectors - there is a pressing need forprioritization and sequencing. Many of the programs suggested to the Planning Commission forfunding may be necessary when viewed in the context of the developmental needs of the countryover the next twenty years, but the key questions for the sector are, which programs are neededcurrently, which in five, and which in ten or twenty years from now. On this basis, a series ofprograms have been selected and designed in the Plan, focusing specifically on infrastructureneeds in both the short and longer term.
THE JUDICIARY
5.13 A crucial area for East Timor’s development is an effective judicial system. Buildingcapacity for this currently is a major problem. As outlined in the State of the Nation Report, oneof the most pressing problems is a shortage of legal personnel. There are very few trained EastTimorese judges, prosecutors and public defenders, and the courts have few resources.Developing the judiciary will require rapid capacity building in three areas: i) simplification of

46
legal procedures in both civil and criminal law to replace the current overlapping system with itsheavy emphasis on procedure; ii) the creation of an independent, skilled judiciary, possiblythrough the formation of a judicial council to train and supervise judges; and iii) the developmentof a legal association to certify and train lawyers, establishing admissions criteria, and regulatinglegal conduct.
CONCLUSION
5.15 In most of the areas for capacity building outlined above, during the coming years, EastTimor will need continuing international support. At least in the short term, to further capacitybuilding and human resource development, there are positions which need to be filled byinternational advisers, working closely with local staff. Particularly crucial are positions with ahigh technical content, such as financial management, engineering, legal and judicial expertise. Itis vital that this mentoring continue, particularly for the next five years, whilst East Timorese arein tertiary education, on leave of absence to learn requisite skills. For implementation of thePlan, it is crucial that the knowledge and skills appropriate for the attainment of economicgrowth, poverty reduction and human development be transferred and developed in an EastTimorese context.

47
6. MONITORING, EVALUATION,AND REVIEW
“A comprehensive planning process with effective monitoring and evaluation will take into account what decision-makers need to know to make timely
corrections...... the process must be participative, not one of unilateral decision-making by a small cadre of Ministers.”
“This is East Timor’s first Plan,........., it is important that it is reviewed at certain times to see if the overall strategic direction remains valid or if changes
should be made.”
INTRODUCTION
6.1 Planning for the future is an ongoing concern, and the NationalDevelopment Plan is only the beginning of a structured planning process. Theheart of the Plan is the national vision that reflects the hopes and aspirations ofEast Timor’s people. It is a statement to indicate long-term commitment to humanprinciples and constitutional concepts that provide leaders with a philosophicalframework for development. However, the vision does not, in itself, provideinsights about how to plan, to grow, to address poverty, or to adapt to an ever-changing world. East Timor faces all these challenges and many more, not least ofall how to manage its financial resources during a very critical time of transition.
6.2 The Plan is, however, an initial framework that will grow, change, mature,and become systematically better with time and attention. This section of the Planincludes a description of a process that can ensure an effective monitoring andevaluation process, provide timely information to senior ministers who mustdecide the nation’s goals and strategies, and establish administrative control ofplanning activities. The process will reduce the risk of the nation becomingentrapped by unexpected circumstances or untimely events. It will allow thenation’s leaders to recognise unexpected opportunities or to act upon favourablecircumstances. The ultimate aim is to nurture the nation’s vision, bringing thenation and its people consistently closer to their aspirations for health, peace,equality, and prosperity.
6.3 Preparation of the Plan also involved policy development and theformulation of programs and projects. Experience from elsewhere shows,however, that the focus of planning has been largely on formulation, design andappraisal of programs and projects, without placing equal importance onmonitoring and evaluating development plans and the implementation of theirpolicies, legislative initiatives, programs and projects. That experience shows alsothat the lack of emphasis on monitoring and evaluation has led to major delays inimplementation, underperformance of programs and projects, and a failure tolearn from the lessons of past activities.
6.4 Monitoring and evaluation are critical components of successful nationaldevelopment planning exercises. Ensuring that policy objectives are met – throughprogram and project activities – requires adherence to a sound process ofmonitoring and evaluation. Additionally, such a process meets the requirements of

48
Government, donors and other stakeholders for transparency and accountability. The mainoutcomes of strengthened monitoring and evaluation capabilities are improvements in programand project implementation and management.
6.5 Consequently, an institutional planning process is essential, one that empowers thenation’s leaders with responsibility for strategic planning. The process itself must ensurecontinuity of monitoring and evaluation that will result in a living development plan, one thatgrows with the nation itself. First, it will provide timely feedback on actual performance byevery agency within the Government’s authority. Second, it will provide realistic projections andanalyses of what the nation faces in the coming year, the next few years, and perhaps the longterm. And third, the planning process will permit adaptation of the existing plan, its goals,objectives, and strategies. The key agency responsible for the various planning activities,including monitoring and evaluation, is characterised generically here as a ‘PlanningCommission’, although it might be a quite different body to the currently existing PlanningCommission.
6.6 The Plan, as noted above, is simply the beginning of the planning process. Planningresponsibilities will now fall to a senior person in each ‘sector’ (Ministry, agency, or office ofDirector-General). Actual planning will continue on the model developed through the firstnational planning process, but include specific one-year action plans devised at department anddivision levels to implement the comprehensive long-term plan. This might consist of workinggroups and key managers at division level, with at least quarterly planning duties, andcomprehensive long-range planning on an annual basis (these points are addressed below). Nonew staffing would be required. Indeed, the planning function is an appropriate responsibility formanagers in these positions, although the planning activities should be highly participative.
MONITORING PERFORMANCE AND OBJECTIVES
6.7 Monitoring and evaluation are complementary yet different activities. Monitoring is thetracking and information gathering process that provides the data, insights, or descriptions ofresults in a systematic manner throughout a plan’s life. This is a communication and reportingprocedure, which is proposed here on the basis of quarterly ‘feedback’ and annual‘consolidation.’ In contrast, evaluation is the process of analysing the information obtainedthrough monitoring to determine what progress is being made, what problems exist, whatsuccesses have been achieved, and how task-related activities compare against plannedoutcomes. In this section, ‘monitoring’ is addressed separately from ‘evaluation,’ which followsin the subsequent section.
6.8 Monitoring involves the continuous assessment of program and project activities in thecontext of implementation schedules, and the use of program/project inputs by targetedpopulations in the context of design expectations. It is an internal program/project activity, anessential part of good management practice, and an integral part of day-to-day management.
6.9 Monitoring, therefore, is an important management tool, one that provides the basis forcorrective actions to improve plan, policy, program and project design and implementation,along with the quality of results. It is a continuous assessment of the progress of policies,legislative initiatives, programs and projects with the aim of ensuring they achieve their policyobjectives. Monitoring assists organisations – the Government and its Ministries and otheragencies in this instance – to assess:

49
a) the relevance of policy, program and project goals and objectives, along withlegislative initiatives and reforms, on a continuing basis;
b) efficiency in the delivery of inputs;
c) effectiveness in the production of planned outputs and in fulfilling immediateobjectives of policies, programs and projects;
d) timeliness of policy, program and project activities and the adherence to theimplementation schedules that have been developed; and
e) problems encountered in the development process and possible remedial actions.
6.10 Consequently, a consistent and reliable monitoring process that addresses task-levelperformance indicators is essential. This will be achieved on several levels, including national,sector (Ministry or agency level), program, project and activity level. Monitoring (andevaluation) therefore requires a regular routine of preparing progress reports. The followingreports and activities will comprise the ‘backbone’ of monitoring and evaluation in East Timor:
a) quarterly policy, program and project performance reports;
b) six-monthly or semi-annual policy, program and project performance reports;
c) program/project site visits;
d) annual review reports for sector-level activities;
e) progress performance reports of large donor-funded programs and projects, as well aspolicies and legislative initiatives; and
f) progress performance reports on policies, legislative initiatives, programs andprojects.
6.11 Pro-formas need to be developed for each report to simplify the process of monitoring(and evaluation) and to ensure consistency in report preparation.
Monitoring at the National Level
6.12 The present Plan combines the outcomes of two separate but closely related visioningexercises – the Countrywide Consultation and the Ministry-level work of the Working Groups.Follow-up planning exercises could usefully follow the same format, with some activities beingconducted on a nationwide basis and others being performed at Ministry level.
6.13 Some activities at national level will have a monitoring function. The TLSS, for example,provided a very detailed snapshot of living and working conditions in all regions and for allsocial and economic segments of the population. The Countrywide Consultation providedqualitative insights on the concerns and aspirations of a broad cross-section of society. Follow-up exercises at regular intervals, perhaps every 3-5 years, would be useful in measuring theprogress being made in different areas and across a broad spectrum of indicators.
6.14 There is also a need for regular and close monitoring of macroeconomic indicators asthese provide guidance on the general health of and changes in the economy. Such monitoringmust be supported by monitoring policy development and implementation of policies. AMacroeconomic Policy Unit is proposed for the Ministry of Finance (MoF) for this purpose,
50
while such a Unit would also take responsibility for coordination with other key financialinstitutions such as the central bank (currently the Banking and Payments Authority – BPA).Macroeconomic skills are, however, in short supply, and capacity building and support in thisarea will be needed in support of national development.
Sector-level Monitoring
6.15 Each Ministry or agency, through the Working Group process, established developmentgoals and long-term policies within a framework of guiding principles that reflect priorities ofthe sector under the national vision. In many instances, they extended a sector-specific vision toreinforce their commitment to national development. Because development goals and policiesare long term and therefore do not change significantly over time, the reporting Ministry oragency should make a thorough review of its achievements with recommendations for changes atleast annually. Interim reviews on a quarterly basis would be ideal but require additionalresources.
Program-level Monitoring
6.16 Not all agencies or divisions within departments have formal programs to monitor. Theoffices of the Directors-General, for example, have activity responsibilities and priorities thatthey would pursue as part of their administrative roles. The Plan lists many of these as‘programs’ with descriptive titles. Monitoring at this level will entail descriptive progress reportswithout specific performance benchmarks. For activity-specific programs that exist in linedivisions, there are performance indicators or descriptive benchmarks associated with eachrelevant objective. Program managers should, therefore, be accountable for reporting quarterlyon performance results or describing progress with respect to each objective for which they areresponsible.
Project-level Monitoring
6.17 A ‘project’ is distinct from a ‘program’, comprising a well-defined set of tasks to beaccomplished within a specific time frame and with a specific budget. In contrast, programs arecommonly considered ongoing activities with a sense of permanence, such as a ‘trade promotionprogram.’ A project under trade promotion may be to establish trade legations with primarytrading partners within one year. Therefore, all projects should have clearly defined andmeasurable performance objectives. There should be no ambiguity about whether a project ismaking progress, falling short, or has succeeded.
6.18 There are three categories of projects for East Timor. The first concerns projects that arebudgeted and implemented entirely within the capabilities of the Government. The secondcomprises projects funded and implemented through the donor community. The third includes‘all others,’ which may be the result of one-off bilateral agreements with a specific country, acontract with an international company for a turnkey project, or projects with allocations undertrust funds or joint-development programs. In each instance, however, the projects will havewell-articulated objectives and performance indicators that should be tracked quarterly andreported. Donors and bilateral participants not subject to direct reporting to government shouldmake their progress reports available to the Planning Commission to ensure transparency andeffective planning.

51
EVALUATION OF PERFORMANCE RESULTS
6.19 Evaluation may be defined as an assessment, which is as systematic and objective aspossible, of an ongoing or completed program, project or policy, its design, implementation andresults. Normally, evaluation occurs at the completion of a program or project, or at thecompletion of a particular stage of such a program or project. Consequently, the purposes ofevaluation are
a) to provide an objective basis for assessing the performance of programs, projects,policies and activities;
b) to improve programs and projects through feedback on the lessons learned; and
c) to provide accountability, including provision of information to Government, donorsand other stakeholders, including the general public.
6.20 A formal evaluation process must be developed in East Timor to provide the Council ofMinisters with a consistent and accurate assessment of results throughout the governmentsectors. Donors invariably structure their projects with internal reporting and evaluation systemsand, while all donors have their own methods of evaluation, their evaluation framework issimilar. They will provide government planners with realistic summations of their activities andprojects on a timely basis that will be sufficient for the CoM to fully comprehend how allprograms and projects are progressing.
6.21 The challenge, therefore, is for East Timor to create a comparable system. This is notnecessary to simply placate donors (yet donors will want periodic verification of how therecipient ministries and agencies are performing), but to provide East Timor’s leaders with themost accurate diagnostics possible to help them steer their country toward its goals. Such asystem cannot be driven by financial priorities – a plan that is forced into a budget is not a planat all, but an ‘allocation process.’ The system must produce scenarios of both social andeconomic performance, and subsequently be judged in light of all development indicators.Budgets are vital, first of all, as ‘tools’ for tracking, keeping score, and quantifying results inuniversally understood terms. They are equally important for allocating resources, but onlywithin a fundamental framework of an effective national development plan. Financial budgetsbecome the standards for allocation and the mechanisms for assessing time-phased activities. Aneffective evaluation system must have the components of planned objectives articulated inmeasurable benchmarks, a method of analysis, and a correction process. These components areaddressed below.
Planned Objectives
6.22 Objectives, as defined in the Plan, are the operational results to be achieved. They aretypically described within programs or projects, or as role expectations for managers (such asdirectorates’ responsibilities to draft bodies of regulations). Objectives also are typically definedwithin a time frame and are measurable. For example, an educational development plan or aprogram for reducing poverty, have individual time-phased objectives, but must also beorchestrated with all other governmental activities and, therefore, considered within a budgetedresource and finance framework.

52
Measurable Benchmarks
6.23 Performance indicators are the predominant benchmarks used in program and projectmanagement. These are both quantitative and qualitative results that not only define whenobjectives are met, but provide timely points of assessment to ensure that planned activities arebeing effectively implemented. Similar patterns of performance benchmarks, dealing with suchmatters as timeliness of implementation, cost and project results, are required for every programand project and, indeed, for any initiative that occurs through government for which the politicalleadership is responsible.
6.24 Benchmarks should be appropriate to measure the intended performance, sufficient toinform decision-makers as to the results (or to corrections needed to remain on-course), andfeasible within the constraints and abilities of those accountable for results. Consider, forexample, the national goal of ‘reducing poverty’ and one task-related objective to be ‘to reducethe number of people living below the poverty line.’ This objective may be further refined to ameasurement such as ‘reducing the number of people living below the poverty line by fivepercent within one year.’ The appropriate benchmark would be to count the number of peoplecurrently living below the poverty line, and count that number again at the end of one year. Thismeasurement may also be sufficient to inform decision-makers as to the results, but perhaps itmay not. Decision-makers may also want to know where progress has been made (who wasaffected, who benefited from poverty reduction programs), how they achieved the added incometo rise above the poverty line (by earned income, a currency manipulation that distorted results,or a per-capita GDP measurement that averaged out national product when only a handful of theelite made windfall profits and most people remained poor). Consequently, an appropriatebenchmark is one (or a set) of performance indicators that provide sufficient information todecision-makers about the real results of planned activities. Finally, the measurement must befeasible. That is to say, the objective must be attainable (five percent reduction in the number ofpeople below the poverty line in one year may be unrealistic or perhaps even too modest), andthe programs implemented to achieve this must have the human, material, and financialresources to succeed.
6.25 The role of budgets, as indicated earlier, is critical to all plans. However, there aredifferent types of budgets used in planning, but budgets should not drive plans. A financialbudget is essential to allocate scarce monetary resources, and it subsequently becomes anumerical measurement on which to track and analyse performance. The role of a budget office,however, is to carefully accumulate data and to address all aspects of transactions and financialdata monitoring. Analysis may be delegated to a budget office or to another unit (as discussed inthe next section). The point here is that a financial budget is only part of the evaluation equation.Operational budgets are also required, and often they are equally important to financial budgets.They include staff mobilisation plans and targets for staff resources (measured in person days perproject, number of work hours, levels of effort, and many other criteria). They include materialbudgets and procurement levels, time budgets, and various measurements on social issues (suchas access to or distances from health clinics). The important point is that almost all activities andresources can be budgeted in measurable terms such as money, time, numbers, percentages, orquality standards, among others. They still must be appropriate, sufficient, and feasible to qualifyas useful performance indicators.
Methods of Analysis
6.26 Designing and implementing a monitoring and evaluation system is a significant projectrequiring experts in planning and monitoring systems, and specialists in developing analyticalprocedures. A budget office can be highly effective for tracking and evaluating financial budget

53
performance. The reason should be clear. Financial budgets comprise only a small part of thetotal planning and monitoring system. Human resource capabilities, asset management,regulatory performance, trade activities, foreign affairs, and many other issues make up amajority of the components within a national development plan. Each of these has its own set oftasks and objectives, and each must have performance indicators or means of describing whetherthey are being effectively implemented.
6.27 For most development programs and a majority of donor projects, the methods aresimilar. They will define the benchmarks and performance indicators, and establish a time-phased system of tasks required to accomplish their objectives. This system will be broken downinto stages, such as quarterly increments of task activities, and the indicators will be prorated toeach of these incremental stages. Therefore, reports will provide assessments of partial taskresults and compare these against ‘budgeted’ or expected results for each operational period. Thetechniques of evaluation will almost always take the form of variance analysis, and be reportedin easy-to-understand statistics. Variances can be calculated as absolute numbers (so manydollars under or over-budget, so many under or over-utilised staff compared to staff schedules,and so on), or by percentages (a certain percentage under or over budget for purchased assets,number of people trained, and so on). More sophisticated economic models are often necessaryfor variances in monetary or fiscal performance, trends in income, trade, or investments, assetdepreciation, technology development, industry capacity, and other macro factors.
6.28 A nation’s development, however, cannot be entirely reduced to numbers and analyses. Agreat many objectives are concerned with social, cultural, and behavioural dimensions. Poverty,for example, may be reduced to a definition of per capita income, yet the form of that incomemay be meaningless; a depreciating monthly cash income, even if the nominal amount is risingrapidly, may translate to even more wretched conditions for the individuals caught up in thesecircumstances. Cash money, even if sufficient to a rural family that cannot access health care orschooling for children seems hollow. A fully employed economy – if such a thing could exist –may still be abhorrent if the population is rutted in meaningless work and destitute conditions.Measurements of legislative endeavours, regulatory reforms, types of foreign investment, EastTimor’s presence in the region as a trading nation, political stability, cultural preservation,environmental protection, national security, and many other similar concerns require verycreative methods of evaluation. These cannot be addressed fully in this report, yet they will berequired for East Timor to have an effective and complete national planning, monitoring, andevaluation system.
Correction Process
6.29 The correction process completes the cycle, and it is where the CoM, with support andinformation from donors, from the budget office, and from the body set up to oversee planningimplementation, will steer the ship of state. In order to meet their responsibilities, they must haveready access to crucial information that is accurate and reliable, and they must have thatinformation when it is needed. The ‘instrumentation’ of monitoring and evaluation provides thatassortment of information. The ultimate objective is to have informed and enlightened decision-makers capable of correcting the direction of the plan.
6.30 Corrections are essential to remain realistically on course but, most importantly, to avoidmajor and unforeseen disasters. Without regular feedback and appropriate analysis, they cannotmake such decisions, and the timing of information can vary significantly. For example,feedback from a nationwide survey of the population’s perceptions about social and economicdevelopment may be important, but it may not be critical enough to cause planning to berepeated more than every few years. In contrast, a program aimed at repatriating indigent
54
refugees may require monthly or even weekly monitoring. Those situations of higher risk thanothers require more deliberate monitoring intervention, and those that could have greaterconsequences than others require greater attention.
6.31 A comprehensive planning process with effective monitoring and evaluation will takeinto account what decision-makers need to know to make timely corrections. In addition, theprocess must be participative, not one of unilateral decision-making by a small cadré ofMinisters. They will need to work with the planning specialists, donor representatives, andbudget analysts to fully address each issue, then to communicate decisions with a consensus ofagreement on changes or adaptations. Ministers will need to work closely with their departmentheads and directorates to share information and to involve them in the planning and evaluationsystem. This not only builds capacity systematically throughout government, but alsoprogressively advances the plans and all task activities toward achieving the nation’sdevelopment goals. In effect, each iteration of the monitoring and evaluation cycle improves theplan, improves operational performance, sharpens objectives and their related indicators,improves human resource capabilities, and moves the nation steadily toward fulfilling the visionfor national development.
PLANNING REVIEW
6.32 ‘Review’ and ‘evaluation’ are often used interchangeably. However, a distinction can bemade between them, with that distinction relating mainly to the purpose, timing and level atwhich the activity occurs. As noted above, evaluation tends to be focused on assessing how wellprograms, projects or policies are performing, and it may occur at various stages during thelifetime of an activity. Review tends to occur at a higher level and may influence the overallstrategic direction being taken by the organisation which, in this case, is the Government of EastTimor. This is East Timor’s first Plan and, consequently, it is important that it is reviewed atcertain times to see if the overall strategic direction remains valid or if changes should be made.Two matters are important here:
a) because the national budget is based on a three-year, medium-term fiscal framework,the national strategic plan needs to be reviewed each year so that it ‘rolls forward’and remains consistent with the Budget; and
b) because the Plan is East Timor’s first, it should be subject to a full review after itsfirst year of operation (meaning that the review would be due in July-August, 2003).The review should involve external support and personnel, along with domesticinputs and personnel in a team approach.
6.33 As the Plan’s policies, programs and projects are implemented, user surveys and othermeans should be used to monitor the outcomes of the programs against the intended results,according to the performance indicators or benchmarks established in the Plan. Such evaluationsshould focus on the cost-effectiveness of spending, analysing and explaining reasons for any costoverruns or shortfalls in outcomes that may have occurred.
INSTITUTIONAL SETTING: MODEL OF PLANNING, MONITORING AND
EVALUATION
6.34 On completion of the Plan, the Planning Commission will be disbanded. There is,however, a need for a Government body with responsibility for overseeing national developmentplanning functions, particularly monitoring and evaluation. In many countries such a body is

55
located either in the Prime Minister’s Office, in the Ministry of Planning, or - less frequently - inthe MoF24. In East Timor, there is a need to find a suitable institutional location for such a body.It should be located within an institution or office which can have an overview both of planningoperations, and of the role of government, civil society and community organizations in planimplementation. For it to be credible, this organization must have a significant degree ofautonomy, and be able to involve stakeholders in implementation, monitoring, and assessment.The location of the government body overseeing implementation of the Plan should be decidedafter independence, and should involve discussions with government ministers, civil societyorganizations and the main stakeholders already involved in the planning process. The body setup must ensure that adequate participatory processes are established to enable all stakeholders tobe involved in the monitoring of plan implementation. Since the vision statements of the EastTimorese population were crucial in designing and giving direction to the Plan, it is vital thatgroups representing their interests within the community and civil society are fully represented inmonitoring and evaluation of plan implementation. Those monitoring the plan should be trainedin participatory methods, and indicators devised for this monitoring should be based uponparticipatory approaches and techniques
6.35 Individual ministries will also require some planning capability, including the capacity toundertake monitoring. The use of pro-formas will allow individual officers to undertake regularmonitoring. However, at least in the larger ministries, the establishment of an internal policy andplanning unit could support project preparation, implementation, monitoring and evaluation, andreview. Such a unit could also provide the link to the national-level monitoring body, outlinedabove, as well as a contact point for donors and other stakeholders.
6.36 The routine involvement of stakeholders, outlined above, and other partners, notably thedonor community, will be instrumental in ensuring that planned future donor activities be basedon an accurate knowledge of experience with current programs, and a regularly updatedawareness of the Government’s priorities. Regular joint sector missions by donors could beplanned to take place shortly after quarterly updates become available. Such missions could beprovided with the latest information, to avoid placing a supplementary reporting burden on thegovernment.
CONCLUSIONS
6.37 Following independence, the Government should establish a new body withresponsibility specifically for overseeing national development planning functions, particularlymonitoring and evaluation. This should have a significant degree of autonomy, and should belocated within an institution or office which can have an overview of planning operations, therole of government, agencies, and civil society and community organizations in planimplementation. This new body will have to draft a policy statement that captures itsresponsibilities, relationships with the budget office, donor coordination, and respective lineministries. A general framework for planning and reporting should be instituted so that apervasive process can be implemented with consistent models of quarterly and annual reportsthat follow upward from project and program levels to ministries or agencies, and then to thenew overseeing body.
24 The monitoring and evaluation suggested here has a much broader focus, and is distinct from that which will be undertaken for the mediumterm fiscal framework (MTFF)

56
6.38 The reports submitted to the organisation overseeing plan implementation should beaggregated summaries, and they should include both the quantitative and qualitative analyses ofresults prepared through monitoring and evaluation. The overseeing body will have to havecapabilities for economic evaluation and forecasting, social and environmental evaluations, andvarious specialised analytical tasks. The budget office within the MoF will be responsible forfinancial monitoring and analyses, and a statistics division will be accountable for such issues aspopulation and demographics, healthcare, education, employment, and labour data.
6.39 Each division would be responsible for annual plans (action plans) that capture programand project activities, structured with quarterly performance indicators that meet the full criteriaof being appropriate, sufficient, and feasible. Line ministries would have aggregated plans thatreflect these annual action plans that, taken together over time, could provide the basis for longterm (five-year) national development plans. In effect, at the end of each year, the process ofrolling these annual plans forward can generate new ‘five-year’ plans (not merely second orsubsequent years to one five-year plan that eventually must be replaced with new and extensivelong-term criteria). This can be achieved by extending the fifth year every year as a new annualplan emerges. However, this is a policy decision. At minimum, the annual results should producea revised set of plans for the upcoming year whilst also providing the overseeing body withgreatly enhanced information on subsequent years.
6.40 Ultimately, the planning process should not be budget-driven, nor be subordinated tointernational financial mandates. It should address the social, economic, and human developmentpriorities of East Timor and, with appropriate diligence, consider what can be realisticallyaccomplished given budget constraints. All proposed programs and projects put forward by thedivisions in all sectors should remain within the development plans, even if they cannot befeasibly pursued in the near term. They should not be lost for current lack of resources orcapacity, but simply prioritised given the nation’s limitations. Finally, the planning processshould be fully participative, linking each level of government, and fully involving civil societyand community organisations in planning, monitoring, and evaluation activities.

57
PART 2
ECONOMIC OUTLOOK
Chapter 7. MACROECONOMIC POLICY FRAMEWORK
Chapter 8. MEDIUM TERM ECONOMIC AND FINANCINGOUTLOOK

58
7. MACROECONOMIC POLICYFRAMEWORK
VISION
7.1 To sustain our vibrant traditional culture and beautiful environment, whilemoving to faster growth in production and employment, so as to providesignificant improvements in opportunities, living standards and services for allEast Timorese. Central to achieving our vision will be the management of oureconomy and finances in efficient, transparent and corruption free ways.
INTRODUCTION
7.2 This chapter focuses on the policy framework for macroeconomics andpublic finance, mainly over the five-year planning period, but also in relation tothe longer term. The related State of the Nation Report addressed itself to recentmacroeconomic and public finance policies and conditions in East Timor andshould be read in conjunction with this chapter, which is essentially forwardpolicy oriented in nature. Chapter 8 (Medium Term Economic and FinancingOutlook) of this document also addresses related macroeconomic issues.
7.3 With the onset of political independence come additional and challengingresponsibilities for managing the national economy and public finances.Aspirations and expectations of the people are high. Sound but creativemacroeconomic and public finance policies will be needed over an extendedperiod if hopes and expectations are to be met.
7.4 East Timor is still recovering from the extreme difficulties of long periodsof external rule, which culminated in the 1999 emergency. Significant furthereconomic adjustment will be needed over the next two to three years as the UnitedNations fully withdraws and as current investment programs from bilateral donorsand the Trust Fund for East Timor (TFET) reduce in size, and in some casesterminate completely.
7.5 In these circumstances the immediate challenge is to consolidate on theeconomic institutions and framework that have been put in place and particularlyto ensure that public finances are placed on a sound and sustainable medium termpath. Provided the transition away from the United Nations period is successfullymanoeuvred over coming years, the outlook for East Timor is very bright, withthe prospect of steadily improving and broadly based growth for decades to come,particularly following the onset of oil production from the Timor Sea and aspolitical liberation leads to economic transformation and improved efficiencythroughout the country, especially in agriculture.
7.6 Successive periods of external rule have left East Timor with a fragileeconomic base and quite low levels of domestic revenues as it commencesIndependence. Prospects appear bright from around late in the decade that bothdomestic and foreign resource constraints will ease with the onset of petroleum

59
and gas production from the Bayu Undan project in the Timor Sea. However, continuingassistance from the international donor community will be critical, not only in the years leadingup to this project, but also well beyond it. This Plan asks donors to accept a heavy burden ofresponsibility for seeing through the generous initial assistance which has been provided. Anymove to premature withdrawal on the part of donors would be counter productive for all, andplace at risk the important advances made to date. In the short-term, over the next three years,donors are being asked to provide further financial resources to keep basic operations runningefficiently and to allow for development of the Government’s own modest investment program.In the longer term the need will change more to assistance with the development of capacity andthe building of physical and social infrastructure.
GOALS
7.7 The goals for the sector are as follows:
General Goals
a) Improved capacity and institutional performance of the key central economicMinistries/Agencies (including effective and transparent management approaches).
b) Reducing poverty.
Macroeconomic Goals
a) High and sustainable economic growth, particularly in the non-oil economy.
b) Low inflation.
c) Growth in employment/decline in unemployment
d) Stronger banking and finance sector.
e) Strengthening the external situation (competitive real exchange rate and open tradingsystem).
Public Finance/Fiscal Goals
a) To pursue growth of budget revenues to improve financial independence.
b) To effectively manage oil and gas revenues and savings.
c) To responsibly and productively manage budget expenditures.
d) To effectively manage the budget deficit and its financing (especially effective aidmanagement, including negotiation of a medium term aid agreement).
GUIDING PRINCIPLES
7.8 Broad principles that will guide economic policy development and the management ofthe economy and public finances are as follows:
60
a) Market economic system; but with strategic and regulatory roles for Government,including the provision of a social safety net during difficult times.
b) Strong role for the private sector in development.
c) Open trade and investment policies.
d) Government’s role will be limited to ensuring that physical and social infrastructureand services are provided and to establishing a growth enabling policy and legalenvironment; including provision of macroeconomic stability.
e) There are particular areas Government will not venture into, including operatingcommercial business ventures such as banks and airlines, regulating/controllingprices, or trying to pick winners and providing subsidies/exemptions to particularbusinesses or industries.
f) Effective, transparent and corruption free management of the economy and publicfinances.
g) Pursuing a fair and equitable economy and society with equal opportunities andimproving living standards for all.
h) Developing in ways that preserve the beautiful environment, traditions and customsof East Timor.
CONSTRAINTS
7.9 While the future is approached with confidence and optimism, there is need to recognise,and address over time, constraints to broadly based economic development, including thefollowing:
a) The aftermath of conflict has left some people weary – there is a need to consolidateand build confidence while commencing pursuit of economic growth.
b) The conflict destroyed a lot of property and assets; so property and assets need to berestored as part of the development effort.
c) Many in the rural areas are used to leading a dualistic subsistence/cash farminglifestyle where production of sufficient food crops to sustain life is of paramountimportance. Achieving major transformation and modernisation in the rural areas is amajor challenge. Rural/urban imbalances are significant.
d) The population is young and many young (and old) people cannot get jobs. Withoutthe creation of jobs youth problems and social unrest may develop.
e) Managing the economy and public finances is a new responsibility for many EastTimorese leaders and civil servants. There is need for rapid learning, institutionaldevelopment and capacity building in macroeconomics and public finance.
f) With low growth and low per capita incomes, domestic revenue collections are verylow. There are limits on the extent to which new public services can be provided,meaning in the short-term high dependence on aid inflows.

61
g) The banking system was destroyed in 1999 and needs to be further rebuilt to ensuresavings, credit and other financial instruments are available to all the people, and thatthe people gain confidence to use them. Further legislative reform is likely to benecessary to support financial sector development.
h) Since 1999 wages have grown very rapidly and the US Dollar has continued to bevery strong. Should these trends continue, or should further domestic inflationemerge, then it will be increasingly difficult to compete internationally, particularlyuntil the productivity of labour grows. Economic management will need to closelymonitor trends in currency and wage competitiveness. If the package of policies beingintroduced is not providing for production and employment growth, then boldermeasures will need to be considered with currency and wages policies.
i) Domestic savings and domestically financed investment are both low and need to beenhanced. Over the medium term generating savings and investment from oilearnings and direct foreign investment will be important.
j) The private sector needs to play a key role in development. Yet for the moment it isweak and will need time, support and an appropriate operating environment todevelop (particularly important will be the development of appropriate legislation:company law, foreign investment law, and secure land tenure for investors).
k) More education and training is needed at all levels, from primary through to tertiaryeducation and vocational training to equip the community with the skills to grow amodern economy.
l) The health of the population also needs to be improved, especially from energysapping diseases like malaria, if the productivity of workers in agriculture and thebroader economy is to be raised.
m) Without improved infrastructure (power, roads, transport, communications) it will bedifficult to develop either the agricultural sector or industry.
OVERVIEW OF POLICY CHALLENGES
7.10 The overriding goal is to achieve high growth in production and employment. This willbe no easy or short-term task. Most growth during the Indonesian and UNTAET periods wasgenerated by high levels of public expenditure. Yet it is clear that combined sources expenditurewill fall sharply in the immediate years ahead, thereby acting as a negative force on growth.Future growth must be largely generated by the private sector (including agriculture), but theprivate sector is currently small and weak. In the short term the UNTAET period has seen wagesrising to levels well above those of competitors in Indonesia and elsewhere in the region, withresultant losses in production and jobs. At the same time the extreme strength of the US Dollarsince 1999 has further worsened competitiveness. There is also a need to remove impediments toinvestment, and for the development of laws and institutional arrangements covering land andproperty rights, foreign investment, lenders collateral and a sound regulatory environment, aswell as policies to address inadequate infrastructure and low skill levels in the labour force.
7.11 Recent trends make for a very difficult starting position from which to generate futureprivate sector growth. Short-term economic management will need to closely monitor trends incurrency and wage competitiveness and growth. If the package of policies being introduced isnot providing growth then bolder measures will need to be considered with currency and wages

62
policies, particularly as the BPA develops over time the economic management and institutionalcapacity to run independent monetary and exchange policies.
GOALS, POLICY ACTIONS AND PERFORMANCE INDICATORS
GOAL NO. 1: INSTITUTIONAL STRENGTHENING
7.12 To further strengthen institutional and human capacities in the main central economicinstitutions (MoF, BPA and MEAD).
Policy Actions for Goal No. 1
a) Develop corporate plans for key institutions and manage to them.
b) Undertake a training and staff development needs assessment study and regularlyupdate.
c) Develop a Human Resources Development Plan for key institutions.
d) Establish Personal Development Plans for all officials, to include training needs, andto provide for annual assessments.
e) Develop succession plans for all line positions held by expatriates.
f) Develop small Economic Policy/Research Units in the MoF and the BPA.
g) Locate all planning, economic policy and aid coordination functions under one roof,possibly in the MoF - apart from monetary matters to be the responsibility of theBPA.
Performance Indicators for Goal No. 1
a) Effectively implement all seven policy actions above.
GOAL NO. 2: POVERTY REDUCTION
7.13 To eliminate poverty over time while maintaining an equitable distribution of income andwealth.
Policy Actions for Goal No. 2
a) Foster a social and political climate supportive of eliminating poverty andmaintaining equity.
b) Promote opportunities for participation and advancement of all members of thesociety.
c) Provide opportunities for empowerment of the people as key agents of governmentprocesses.
d) Provide security for all, including: human rights, freedom from hunger and relieffrom disasters.
e) Design and manage macroeconomic policies in pro poor ways.

63
f) Provide stable economic and political conditions as a prerequisite for assisting thepoor.
g) Implement equitable tax and revenue policies.
h) Spend government budget money in sectors and within sectors to benefit the poor.
i) Ensure expenditure allocations allow for an equitable balance between rural andurban areas.
j) Ensure foreign aid programming is appropriate to national needs, including povertyreduction.
k) Set monetary and exchange policies so as to support growth, stability and povertyreduction.
l) Ensure banking, credit and micro finance services are broadly available to the poor.
m) Implement open trade and investment policies to promote growth to benefit the poor.
Performance Indicators for Goal No. 2
a) Gini Ratio (currently 0.37) to remain relatively stable over the short and mediumterm.
b) Percentage below poverty line of US$0.55 (currently 41%) to reduce markedly withinfive years.
c) Adult illiteracy rate (currently about 50%) to reduce markedly within five years, andhalve within 20 years.
d) Primary school participation (net enrolment rate, currently about 70%) to increasesignificantly in five years.
e) Infant mortality rate (currently estimated between twelve and fifteen percent) todecline significantly below eight percent within five years.
f) Walking time to nearest health clinic (current average 70 minutes) to be reduced infive years.
g) Maternal mortality rate (currently between 0.4% and 0.6%) to decline within fiveyears.
GOAL NO. 3: PURSUIT OF ECONOMIC GROWTH
7.14 To achieve high, sustainable, and broadly based growth (with stability and povertyreduction).
Policy Actions for Goal No. 3
a) All macroeconomic policies to be framed as a consistent package to be conducive togrowth.
b) The package of macroeconomic policies to provide for international competitiveness.

64
c) All sector policies to be framed as a consistent package conducive to growth(especially policies for agriculture; infrastructure; education; health; regional/ruraldevelopment; and private sector development).
d) As 75% of people work in rural areas, but agriculture contributes only around 25% ofGDP, sector policies with regard to the transformation of agriculture will receive highpriority.
e) Both public and private sectors of the society will be provided with a policyenvironment conducive to saving. Foreign investment will be encouraged, as willsavings from Timor Sea revenues.
f) Market oriented mechanisms will allow for higher savings to be channelled intohigher capital formation (both private and public – including social capitalinvestment) to support growth.
g) The package of macroeconomic and sector policies aims to see development of astrong and energetic private sector with much of growth private sector led. This willinclude related legal reforms in areas such as foreign investment, land tenure,company law and lenders collateral.
h) Education sector policies (including well-targeted vocational and entrepreneurialeducation) will be given priority to improve the base knowledge and skills of theworkforce.
i) Health sector policies will receive priority to ensure the basic level of health of theworkforce.
j) Infrastructure policies and investments will be targeted to facilitate growth.
k) Initial growth is likely to be labour intensive with low to semi-skilled businesses.Policy will support this, but will be ready to move to more mature stages of growth asinvestment and skills emerge.
Performance Indicators for Goal No. 3
a) After a likely slump in growth, during the transition away from the UN period,underlying Non-Oil growth by the end of the planning period will reach sustainablelevels of five to six per cent per annum.
GOAL NO. 4: PURSUIT OF LOW INFLATION
7.15 To achieve a low level of inflation.
Policy Actions for Goal No. 4
a) Responsible monetary/currency policy (price stability is the prime objective of theBPA).
b) Restraint on wages growth (particularly public sector).
c) Responsible budget policies, with declining deficit levels and zero borrowing.

65
Performance Indicators for Goal No. 4
a) Consumer price index inflation in East Timor to be no higher than USA consumerprice index inflation over the five years of the Plan (around two to three percent perannum).
GOAL NO. 5: PURSUIT OF MORE EMPLOYMENT
7.16 To achieve growth in employment/decline in unemployment.
Policy Actions for Goal No. 5
a) Pursue a similar package of policies as those proposed to promote economic growth(see Goal No. 3).
b) Consistent and supportive package of macroeconomic policies.
c) Supporting sector policies: agriculture, education, training, youth, health andinfrastructure.
d) Internationally competitive wages, exchange rates, and trade policies.
e) Encouragement of higher domestic and foreign savings and investment levels.
f) Promoting conditions conducive to growth of the private sector (laws, landarrangements, labour market information; banking development, vocational trainingand education).
g) Gearing policies to support labour intensive growth initially (with high importancegiven to flexible and moderate wages policy linked to productivity movements).
Performance Indicators for Goal No. 5
a) Open unemployment rate to decline significantly from recent levels of around 17% ofthose actively seeking work.
b) A significant number of new jobs will be created each year.
GOAL NO. 6: PURSUIT OF STRONGER BANKING AND FINANCE SECTOR
7.17 To promote development of a stronger banking and financial sector.
Policy Actions for Goal No. 6
a) Review and upgrade Banking and Financial Legislation, including Governing Boardoversight of BPA, funding and accountability of BPA, and movement to full centralbanking functions (in line with April 2002 recommendations of the IMF – Preparingfor a Central Bank of East Timor).
b) Maintain appropriate international (mainly Basle) standards for licensing andregulation.
66
c) Promote more competition and increasing numbers and types of private banks andfinancial institutions (including widening rural presence by private banks and theBPA).
d) Develop regulations and capacities to promote growth of insurance (both general andlife).
e) Develop regulations and capacities to promote growth of private superannuation andother savings schemes (including increased saver education and enhanced security forsavings).
f) Support donors and NGOs to develop micro savings and credit schemes, especially inrural areas.
g) Develop related Laws important to the expansion of credit to the private sector(Company Law; Contract Law; Collateral Law; Bankruptcy Law; Foreign InvestmentCode; Land Laws).
h) Government (mainly through BPA) to increasingly undertake a near full range ofcentral banking type functions and to be a catalyst for significant growth of savingsand credit in the sector.
Performance Indicators for Goal No. 6
a) Effectively implement all eight policy actions above (particularly to increase therange of private sector institutions and products and to significantly expand savingsand credit) within the five-year period of the Plan.
GOAL NO. 7: PURSUIT OF A STRONGER EXTERNAL SECTOR
7.18 To achieve a stronger external situation, including a competitive real exchange rate,higher exports and an improving trade balance.
Policy Actions for Goal No. 7
a) Pursue responsible expenditure policies to constrain domestic demand to levels thatcan be sustained from domestic revenues and foreign grant aid (without publicborrowing).
b) Pursue a competitive real exchange rate (exchange rate adjusted for inflation),especially in relation to agricultural competitors.
c) Maintain competitive wage and trade policies to allow competition in export marketsand to enhance the ability of domestic producers to compete with imports.
d) Promote sector policies supportive of private sector growth in exports and improvedcompetitiveness in relation to imports (especially agriculture and agro processing).
e) Maintain open (low effective protection) trade and investment policies, includingmoving to observer or membership status of such bodies as ASEAN and WTO.
f) Pursue diplomatic efforts to increase access rights to key markets; Europe; Australia;and Asia.

67
Performance Indicators for Goal No. 7
a) No significant real effective appreciation of the currency over time.
b) Non-oil merchandise exports to recover significantly from recent negligible levels.
c) Non-oil and non-aid related merchandise imports to decline to more moderate levelsso narrowing the current imbalance on the non-oil/non-aid related trade balance.
d) Positive overall balance of payments to be achieved without recourse to publicforeign borrowing.
e) By the end of the Plan period net foreign reserves will be in the early stages of a largelong-term build-up (mainly from savings policies in relation to Timor Sea oil andgas).
GOAL NO. 8: PURSUIT OF IMPROVED REVENUE COLLECTIONS
7.19 To increase revenue collections to enhance fiscal autonomy, while retaining incentivesfor private sector development and ensuring equity for the poor.
Policy Actions for Goal No. 8
a) Maintain existing package of tax and non-tax revenues, while reviewing theirappropriateness regularly (including likely introduction of some recommendations ofthe IMF Mission on tax and revenue policy in the context of the FY 03 Budget).
b) Improve administrative resources, systems and skills to raise collection yields andlevels.
Performance Indicators for Goal No. 8
a) Domestic (non oil) revenue as a percent of GDP to grow from current levels of fivepercent of GDP to approach seven percent of GDP by the end of the Plan period.
b) Collection yields for existing taxes to show at least a 25% improvement over the Planperiod.
c) Any new taxes introduced to be consistent with equity and poverty alleviation goals.
GOAL NO. 9: MAXIMISE COLLECTIONS AND SAVINGS FROM TIMOR SEA REVENUES
7.20 To maximize collections of Timor Sea revenues and to save and sustainably managesignificant proportions of them.
Policy Actions for Goal No. 9
a) Install very strong, internationally competitive resource skills in the MoF/RevenueService, to ensure regular tax audits and collection of all petroleum taxes due.
b) Development of effective offshore savings and investment mechanisms, based in parton findings of the Norwegian Technical Assistance Mission undertaken in March2002.

68
Performance Indicators for Goal No. 9
a) Rigorous annual scrutiny of taxation returns and 3 yearly detailed tax audits.
b) Build up of a secure and growing stock of offshore investments, in line withrecommendations of the Norwegian Technical Mission and consistent with estimatespublished in the MTFF.
GOAL NO. 10: PURSUE CREATIVE AND EFFECTIVE EXPENDITURE PROGRAMS
7.21 To pursue creative and effective expenditure policies; including: (a) restraining totalexpenditure to levels that are sustainable; and (b) ensuring that expenditure allocations betweenAgencies/Functions are consistent with plan objectives and particularly that currently highcentral administration expenditures fall to the benefit of priority areas of health, education,agriculture and infrastructure.
Policy Actions for Goal No. 10
a) Improving the capacity of all public officials to prepare and manage effectivebudgets.
b) Use of MTFF to control aggregate expenditure.
c) Use of MTFF to determine the current/capital expenditure split.
d) Use of MTFF and work of Planning Groups to determine an appropriate allocation ofexpenditures.
Performance Indicators for Goal No. 10
a) Total expenditure to grow at an annual average rate, which is in line with the(sustainable) MTFF.
b) Average proportions of current/capital expenditure over the plan period to be in linewith responsible levels contained in the MTFF.
c) Expenditure allocations finally determined by CoM as being appropriate to beimplemented with close monitoring over the 5 years in line with MTFF allocations.
d) Currently high shares of central administration expenditures to fall to the benefit ofpriority areas of health, education, agriculture and infrastructure.
GOAL NO. 11: PURSUE APPROPRIATE DEFICIT AND FINANCING POLICIES
7.22 Budget deficit levels to reduce sharply over time with any deficits to be grant and notdebt financed; and donor grant deficit financing over time to be in line with a Public InvestmentProgram developed by the Government.
Policy Actions for Goal No. 11
a) MTFF in conjunction with donor negotiations to plan for gradual deficit reduction asdomestic and Timor Sea revenues grow.
69
b) A preferred forward Public Investment Program to be developed over time and thento be updated annually with significant improvements in project identification,preparation and appraisals over time.
Performance Indicators for Goal No. 11
a) Total deficit to fall sharply by the end of the Plan period, in line with MTFFestimates.
b) Government preferred forward Public Investment Program in place and improved onannually.

70
SUMMARY OF PROGRAMS / PROJECTS SPECIFIC TO MACROECONOMICS /PUBLIC FINANCE SECTOR
Table 7.1: Recent and Forward Estimates of Program / Project Expenditures (US$ 000)
Item FY 00Actual
FY 01Actual
FY 02RevisedBudget
FY 03Prelim.Budget
FY 04Estimate
FY 05Estimate
FY 06Estimate
FY 07Estimate
1. Banking and Payments Authority
CFET Operations 26.5 1,374.0 1,374.0 1,325.0 963.0 1,026.0 1,092.0 1,150.0
(Of Which OwnRevenues)
(0.0) (0.0) (0.0) (245.0) (350.0) (450.0) (550.0) (650.0)
U.N. AssessedContributions
0.0 1,060.0 933.0 900.0 800 0.0 0.0 0.0
Total 26.5 2,434.0 2,307.0 2,225.0 1,763.0 1,026.0 1,092.0 1,150.0
2. Ministry of Finance (Minister; Core CFA; Customs;
TFET Taxes;Payroll; ExternalAudit; Others – butexcludingContingencies /Reserves):
35.0 917.0 1,698.0 2,247.0 2,221.0 2,348.0 2,300.0 2,200.0
CFET Operations 0.0 0.0 305.0 445.0 0.0 0.0 0.0 0.0
TFETBilateral Projects
35.3 1,016.0 5,623.0 3,016.0 3,259.0 3,333.00 1,801.0 1,000.0
UN AssessedContributions
0.0 3,940.0 3,563.0 3,200.0 2,400.0 0.0 0.0 0.0
Total 70.3 5,873.0 11,189.0 8,908.0 7,880.0 5,681.0 4,101.0 3,200.0
3. Economic Affairs (Trade, Investment, Industry, Mineral Resources and Tourism):
CFET Operations 0.0 457.0 440.0 521.0 391.0 407.0 484.0 500.0
TFET 0.0 0.0 1,000.0 700.0 100.0 0.0 0.0 0.0
Bilateral Projects 0.0 0.0 280.0 220.0 50.0 0.0 0.0 0.0
UN AssessedContributions
0.0 2,170.0 1,110.0 900.0 700.0 0.0 0.0 0.0
Total 0.0 2,627.0 2,830.0 2,341.0 1,241.0 407.0 484.0 500.0
4. Planning Commission (Previously NPDA)
CFET Operations 0.0 225.1 113.0 0.0 0.0 0.0 0.0
Bilateral Projects 0.0 0.0 350.0 0.0 0.0 0.0 0.0
UN AssessedContributions
0.0 0.0 135.0 0.0 0.0 0.0 0.0
Total 0.0 225.1 598.0 0.0 0.0 0.0 0.0 0.0
Source: Ministry of Finance for FYs 00 to 02 and Preliminary Planning Commission estimates forFY 03 to FY 07

71
Table 7.2: Summary of Major Ongoing and New Projects
Organisation / Project Likely Funding Source
1. Banking and Payments Authority
1.1 Development of data processing systems ADB
1.2 Foreign training and attachments Various Central Banks and IMF
1.3 New Central Bank building Donor Sought
1.4 Capitalization for full Central Bank Donor Sought
2. Ministry of Finance
2.1 Phase 3, Freebalance Information Systems Donor Sought
2.2 Establish Office of Budget independently No additional cost
2.3 Capacity building (Budget Office/Statistics) TFET
2.4 Public sector management capacity building ADB
2.5 Ministry wide institutional strengthening AusAID
2.6 Technical Assistance Ministry wide Portugal
2.7 Continue 13 UNVs in District Offices UNTAET
2.8 Open 2 new Regional Revenue Offices Government Budget
2.9 External Legal Advice Donor Sought
2.10 Operationalise Board of Tax Appeals Government Budget
2.11 Senior Managers Development Program Donor Sought
2.12 Establish professional library Donor Sought
2.13 Additional common services by OGCS Budget + UNTAET
2.14 Training programs in Knowledge Centre Budget + World Bank
2.15 New Customs building Donor Sought
2.16 Refurbish Customs regional warehouses Donor Sought
2.17 Introduce ASYCUDA FMIS in Customs UNDP
2.18 Transfer Macro Policy, Planning; and Aid Coordination No additional cost
2.19 Transfer Statistics Office No additional cost
2.20 Develop statistics laws / regulations Donor Sought
2.21 Conduct national census UNFPA
2.22 Develop trade statistics Donor Sought
2.23 Compile National Accounts annually World Bank
2.24 Update CPI basket Donor Sought
2.25 Capacity building with poverty statistics World Bank
2.26 Establish Performance Monitoring Unit Government Budget
Notes: 1 Based on five year priorities developed by the Macroeconomics / Public Finance Working Group. Implementation willdepend on the availability of funding, either from the CFET Budget or Bilateral Donors.
Projects and Programs of the Department of Economic Affairs and Development have been included in the Chapter onIndustry, Trade and the Private Sector.

72
8. MEDIUM TERM ECONOMIC ANDFINANCING OUTLOOK
INTRODUCTION
8.1 This chapter provides a medium term economic and financing outlook forthe Plan period. Much of the information underlying the outlook presented issummarised in the statistical tables in the appendix and illustrated in the chartsbelow. Two important words of caution are made with regard to the outlookpresented:
a) Preparation of economic forecasts has not received significantattention so far in the building of East Timor’s central economicinstitutions. Accordingly, there does not exist a consolidated databaseof historical macroeconomic information, nor have macroeconomicforecasting models been developed.
b) Forecasting is notoriously difficult in small open economies, which areprone to shocks from a wide range of sources, with macroeconomictrends likely to be volatile rather than smooth.
8.2 The medium term outlook presented is a modest first attempt by thecentral economic institutions. One of the goals for institutional improvementwithin the Macroeconomics and Public Finance Sector is to significantlystrengthen capacities in macroeconomic policy formulation and management.Assuming progress is made in this regard, future medium term planning exerciseswill be able to build on the first efforts made here.
8.3 What follows is a base case outlook. It takes account of:
a) past underlying trends and relationships in the economy throughout the1990s;
b) estimates of the build-up of foreign assistance during the UNTAETperiod, and its forthcoming anticipated decline;
c) likely policy, program and project developments in different sectors ofthe economy, as set out in the sector chapters of this plan;
d) the views of the sector working groups on the base case outlook fordifferent sectors; and
e) prospects for Timor Sea Oil and Gas revenues based on the bestinformation available to the Government at this time.
8.4 Even more than most outlooks attempted, the base case scenario presentedis subject to significant risks and uncertainty. Providing the policies andapproaches set out in the Plan are closely adhered to and the human responses arepositive and reasonably rapid, there is an upside potential for more rapiddevelopment than in the case presented, especially in the later years of the Planperiod. Nevertheless, the risks of slow policy development and response remain;
73
and unexpected external shocks are always lurking for small and open economies. Accordingly,risks of lower potential also exist.
ECONOMIC GROWTH
8.5 Estimates of the economic growth outlook are presented in Appendix Table 1 and inFigures 8.1 to 8.3 in the text. It should be noted that for the time being for statistical purposes oilproducers in the Timor Sea Zone of Cooperation are being treated as non-residents pendingclarification of their status. Accordingly, GDP is effectively calculated on a Non Oil basis. Thegrowth outlook can be summarized as follows.
a) Total real growth is estimated to be negative in 2002 and 2003 (-0.5% and -2.2%respectively); before commencing recovery in 2004 and 2005 (1.2% and 3.3%); andthen going on to achieve its longer term underlying potential of 5.1%; and 5.9% in2006 and 2007, respectively. Significant progressive withdrawal of the internationalpresence from 2002 is the main negative influence on growth in the early years of thePlan period (with negative impacts on transport and communications, wholesaling,hotels and restaurants, utilities, construction, finance, rents, business services andgovernment services).
b) A number of sectors are expected to sustain positive growth throughout the Planperiod, notwithstanding the decline in foreign presence. The main sectors withexpected positive growth are: (a) agriculture, forestry and fisheries; (b) quarrying; and(c) manufacturing.
c) Most other sectors are expected to directly or indirectly experience negative effectsfrom the international drawback, before recovering and reaching their underlyingproduction and potential growth levels beginning from around 2004. Many of thetransitional negative effects will be felt in the urban areas; with large parts of thepopulation insulated from them, providing growth in productive sectors (especiallyagriculture) can be sustained.
d) The largest structural change expected to occur over the period relates to thedeclining importance of Government Services, which fall from 33.7% of GDP in2000 to 27.7% of GDP in 2007 (in constant prices). This mainly reflects the declineof UNTAET influence, which is currently large.
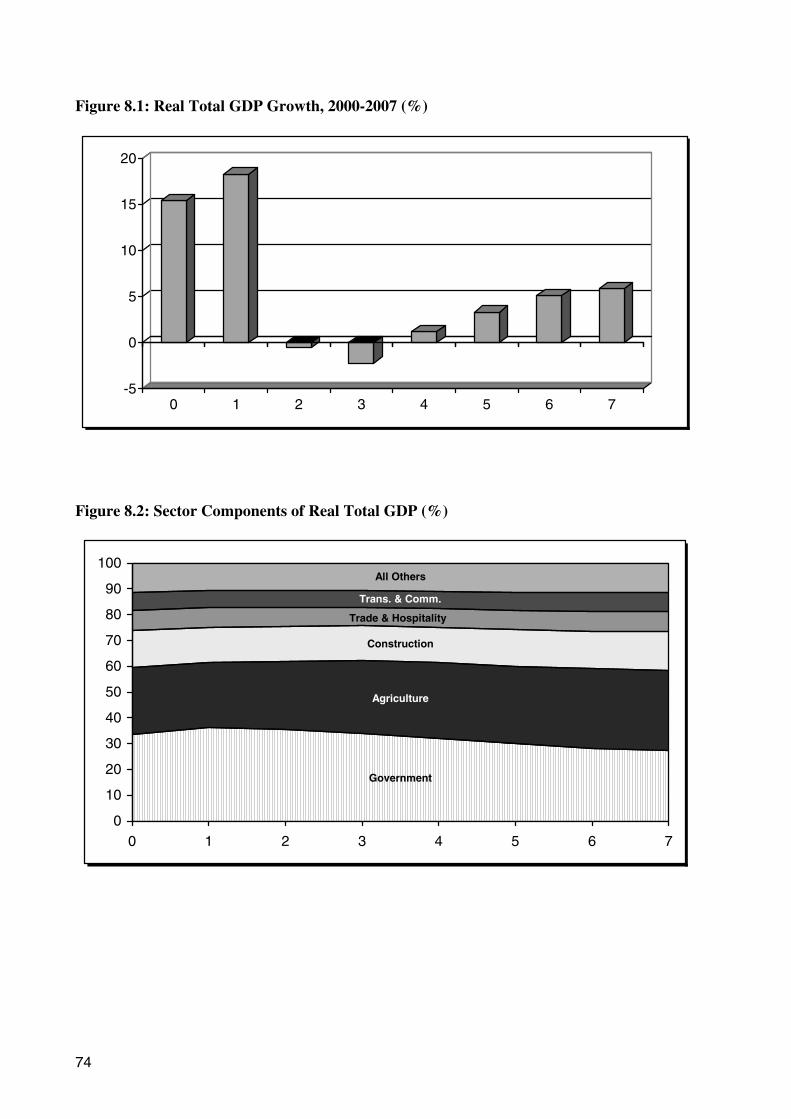
74
Figure 8.1: Real Total GDP Growth, 2000-2007 (%)
-5
0
5
10
15
20
0 1 2 3 4 5 6 7
Figure 8.2: Sector Components of Real Total GDP (%)
Government
Agriculture
Construction
Trade & Hospitality
Trans. & Comm.
All Others
0
10
20
30
40
50
60
70
80
90
100
0 1 2 3 4 5 6 7

75
Figure 8.3: GDP Sector Growth, 2001-2007 (%) Figure 8.3: Cont…
GDP Sector Growth, 2001 - 2007 (%)
02468
1012141618
1 2 3 4 5 6 7
Agriculture Manufacturing
GDP Sector Growth, 2001 - 2007 (%)
-10
-5
0
5
10
15
20
1 2 3 4 5 6 7
Construction Trade, Hotels, Restaurants
Figure 8.3: Cont… Figure 8.3: Cont…
GDP Sector Growth, 2001-2007 (%)
-10
-5
0
5
10
15
1 2 3 4 5 6 7
Electricity and Water
Transport and Communications
GDP Sector Growth, 2001 - 2007 (%)
-10
-5
0
5
10
15
20
25
30
1 2 3 4 5 6 7
Finance, Business Services
Government Services
EMPLOYMENT/UNEMPLOYMENT
8.6 The most recently available estimates on employment along with the outlook to 2007 arepresented in Table 8.1 and Figure 8.4. Because of data deficiencies these estimates should not beregarded as forecasts, but rather as broad indications of the types and levels of employmentgeneration that will be needed if the Government’s goal of significantly reducing theunemployment rate is to be achieved. The outlook presented suggests the following:
a) The goal is to increase employment and reduce the unemployment rate during thePlan period. The analysis below attempts to estimate the magnitude of employmentgeneration needed to achieve a major reduction in the open unemployment rate froman estimated 16.8% at present to 9.0% in 2007. The achievement of this target will beextremely challenging.

76
b) In the short term there is a severe squeeze on the growth of public sector employmentand this is expected to be more or less maintained over the course of the Plan period.The public sector does not present a direct solution to the unemployment problem.
c) Agricultural growth is projected to be reasonably strong over the Plan period and thiswill allow for significant numbers of workers to be absorbed there. However, over thelonger term (beyond the current plan period) agricultural growth is likely to beachieved increasingly by more rapid transformation towards modernisation andimproved efficiency, with a resultant freeing of labour for other private sectors of theeconomy. Agriculture alone is not the solution.
d) Given the above constraints around 40,000 new jobs in the private sector (excludingagriculture) would need to be created over the Plan period, if the target forunemployment reduction is to be met. This implies an annual growth of private sectoremployment of around 20% per annum, which is well above the projected privatesector GDP growth. It highlights the difficulties in reducing unemployment if theprivate sector of the economy cannot grow rapidly. In the absence of very rapidprivate sector growth, the target for reducing the unemployment rate will only bepartially achieved. Promoting agricultural and informal employment will remain ofhigh importance given the major challenges in the promotion of formal sectoremployment.
Table 8.1: Labour Force Outlook, 2001 and 2007
2001 2007ITEM
No. % No. %
Labour Force (Actively Seeking Work) 325,930 100.0 406,400 100.0
- Of Which Openly Unemployed 54,851 16.8 36,576 9.0
- Of Which in Agriculture 240,928 73.9 296,672 73.0
- Of Which in Military / Police 900 0.3 1,000 0.3
- Of Which in Public Administration 9,605 2.9 11,200 2.8
- Of Which Other Private / NGO 19,646 6.1 60,952 14.9
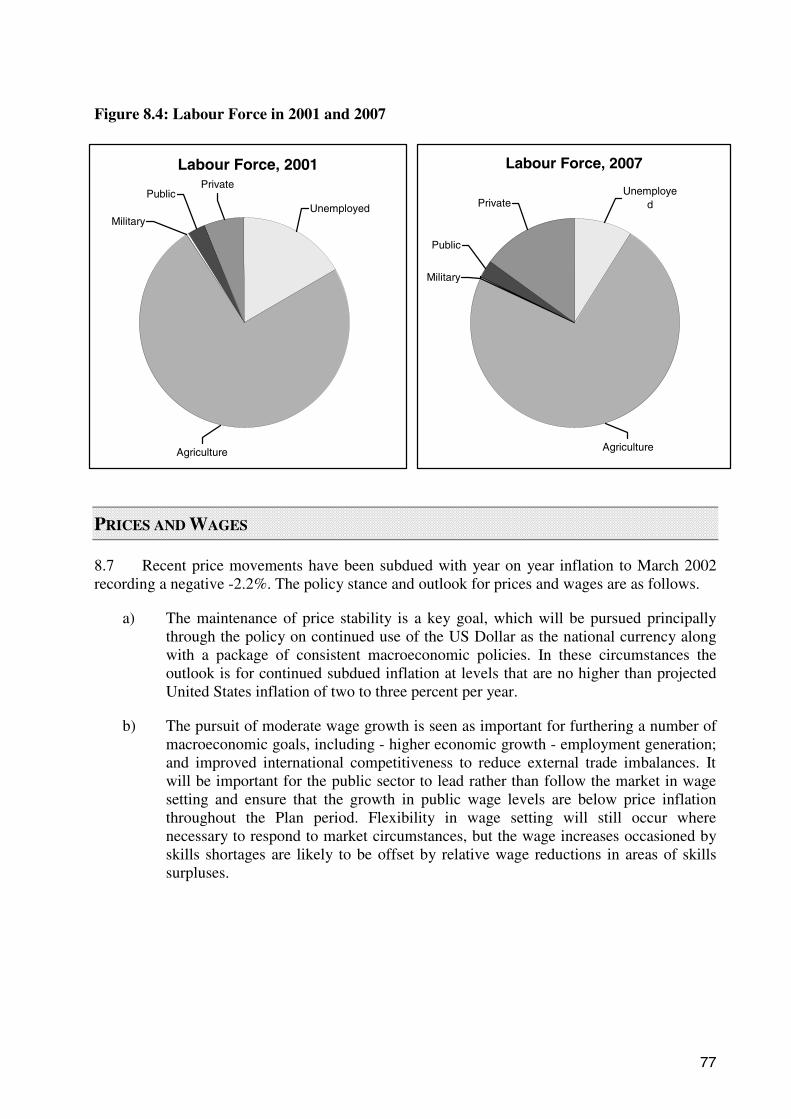
77
Figure 8.4: Labour Force in 2001 and 2007
Labour Force, 2001
UnemployedMilitary
PublicPrivate
Agriculture
Labour Force, 2007
UnemployedPrivate
Public
Military
Agriculture
PRICES AND WAGES
8.7 Recent price movements have been subdued with year on year inflation to March 2002recording a negative -2.2%. The policy stance and outlook for prices and wages are as follows.
a) The maintenance of price stability is a key goal, which will be pursued principallythrough the policy on continued use of the US Dollar as the national currency alongwith a package of consistent macroeconomic policies. In these circumstances theoutlook is for continued subdued inflation at levels that are no higher than projectedUnited States inflation of two to three percent per year.
b) The pursuit of moderate wage growth is seen as important for furthering a number ofmacroeconomic goals, including - higher economic growth - employment generation;and improved international competitiveness to reduce external trade imbalances. Itwill be important for the public sector to lead rather than follow the market in wagesetting and ensure that the growth in public wage levels are below price inflationthroughout the Plan period. Flexibility in wage setting will still occur wherenecessary to respond to market circumstances, but the wage increases occasioned byskills shortages are likely to be offset by relative wage reductions in areas of skillssurpluses.
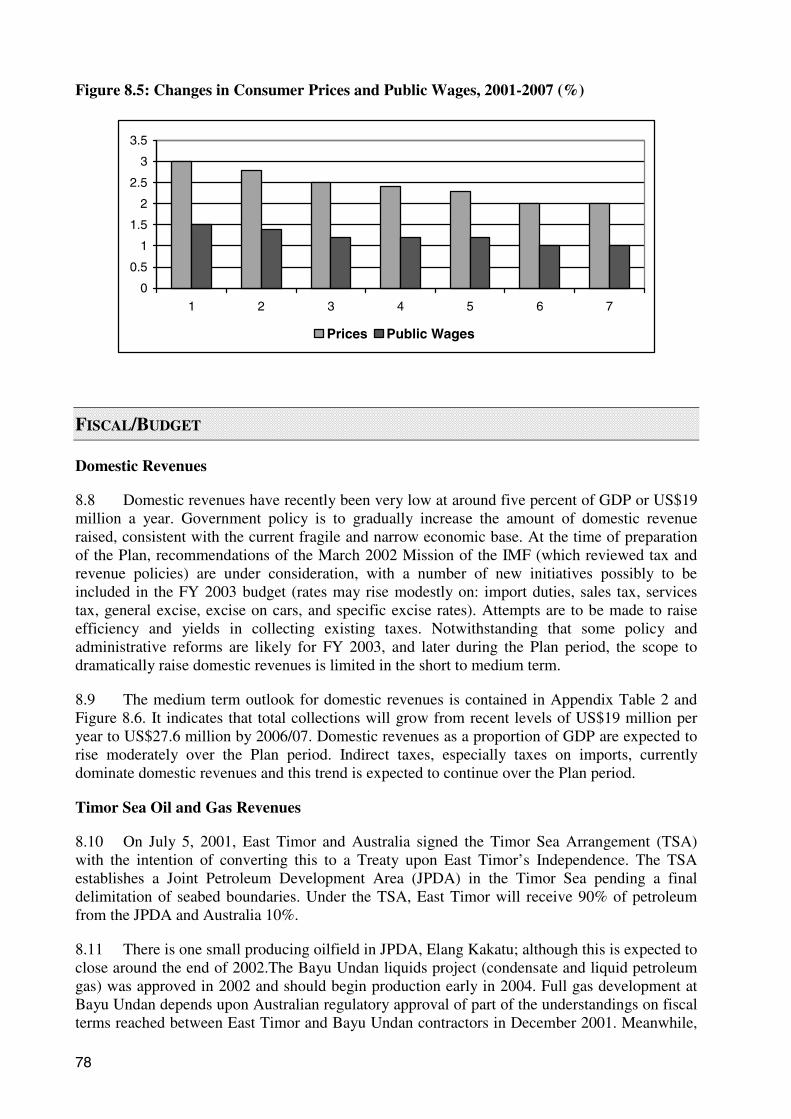
78
Figure 8.5: Changes in Consumer Prices and Public Wages, 2001-2007 (%)
0
0.5
1
1.5
2
2.5
3
3.5
1 2 3 4 5 6 7
Prices Public Wages
FISCAL/BUDGET
Domestic Revenues
8.8 Domestic revenues have recently been very low at around five percent of GDP or US$19million a year. Government policy is to gradually increase the amount of domestic revenueraised, consistent with the current fragile and narrow economic base. At the time of preparationof the Plan, recommendations of the March 2002 Mission of the IMF (which reviewed tax andrevenue policies) are under consideration, with a number of new initiatives possibly to beincluded in the FY 2003 budget (rates may rise modestly on: import duties, sales tax, servicestax, general excise, excise on cars, and specific excise rates). Attempts are to be made to raiseefficiency and yields in collecting existing taxes. Notwithstanding that some policy andadministrative reforms are likely for FY 2003, and later during the Plan period, the scope todramatically raise domestic revenues is limited in the short to medium term.
8.9 The medium term outlook for domestic revenues is contained in Appendix Table 2 andFigure 8.6. It indicates that total collections will grow from recent levels of US$19 million peryear to US$27.6 million by 2006/07. Domestic revenues as a proportion of GDP are expected torise moderately over the Plan period. Indirect taxes, especially taxes on imports, currentlydominate domestic revenues and this trend is expected to continue over the Plan period.
Timor Sea Oil and Gas Revenues
8.10 On July 5, 2001, East Timor and Australia signed the Timor Sea Arrangement (TSA)with the intention of converting this to a Treaty upon East Timor’s Independence. The TSAestablishes a Joint Petroleum Development Area (JPDA) in the Timor Sea pending a finaldelimitation of seabed boundaries. Under the TSA, East Timor will receive 90% of petroleumfrom the JPDA and Australia 10%.
8.11 There is one small producing oilfield in JPDA, Elang Kakatu; although this is expected toclose around the end of 2002.The Bayu Undan liquids project (condensate and liquid petroleumgas) was approved in 2002 and should begin production early in 2004. Full gas development atBayu Undan depends upon Australian regulatory approval of part of the understandings on fiscalterms reached between East Timor and Bayu Undan contractors in December 2001. Meanwhile,

79
in March 2002 the contractors announced a gas sales agreement with Japanese utilities for LPGfrom Bayu Undan Gas. The Greater Sunrise gas-condensate field lies partly within the JPDA asdefined in the TSA. A development arrangement for this field has yet to be agreed among thejoint venture partners.
8.12 There is still much uncertainty about revenue prospects from the Timor Sea. The mainuncertainty relates to whether particular projects will proceed at all. Further uncertainty remainsabout the gas pricing method. Even if these uncertainties abate, East Timor will still be exposedto the risk of lower than expected world prices for oil and gas. It is therefore appropriate for EastTimor to forecast Timor Sea revenues with caution.
8.13 If oil prices remain above US$18 per barrel (Brent Crude) then the Bayu Undan field isestimated to yield (in current prices) US$1.8 billion to US$ 3.2 billion to East Timor over theproject life up to 2021. The higher figure assumes that full gas development occurs, while thelower assumes it does not. This is a “base” forecast, with an equal chance of a better or worseoutcome. Accordingly, East Timor’s fiscal planning should use conservative estimates until thereis confirmation of higher prices or new development outcomes.
8.14 The Bayu Undan Phase-2 project, if developed would be a dry gas project based aroundeither a pipeline to Darwin or a floating manufacturing facility at the well site. Possibleadditional capital costs (extraction only) are around US$500 million. Gas reserves are estimatedat 3 trillion cubic feet. The potential revenue to East Timor over a 20-year site life has beententatively estimated at US$1.4 billion (current prices).
8.15 Annual revenues from Bayu Undan from FY 2006 to FY 2009 (oil and gas) are unlikelyto exceed US$100 million; perhaps just sufficient to support planned public (budget)expenditures during those years. Thereafter, revenues are estimated to be higher for a decade ormore. East Timor needs to finalise and implement a revenue smoothing and savings strategy wellbefore then.
8.16 While there may be substantial uncertainty about Timor Sea revenue flows, it is clear thatfor the next three years at least such revenues under any scenario will be insufficient to financegovernment expenditure needs. There are also prospects that there will be shortfalls in revenuebeyond FY 2005. The position may improve in the following years, but no substantial excess ofrevenue is likely until around FY 2010.
8.17 The long term implications of the oil and gas sector are covered in more detail later inthis chapter. The remainder of this section concentrates on anticipated revenues to FY 2007,which are detailed in Appendix Table 2, Table 8.2 and Figure 8.6.
Table 8.2: Distribution of Timor Sea Revenues, FY 01 to FY 07
ITEM FY 01 FY 02 FY 03 FY 04 FY 05 FY 06 FY 07 TOT.01/07
%
Total Oil Revenues 12.9 12.0 21.3 32.7 76.4 76.4 99.1 330.8 100
Oil Revenues to Budget 9.8 6.0 20.5 26.1 52.2 78.0 84.0 276.6 83.6
Oil Revenues Saved 3.1 6.0 0.8 6.6 24.2 (1.6) 15.1 54.2 16.4

80
Figure 8.6: Components of Total Government Revenue, FY 2001 – FY 2007 (US$m)
0
20
40
60
80
100
120
140
1 2 3 4 5 6 7
Total Non Oil Oil
Total Expenditures
8.18 Expenditure planning is occurring in the context of an MTFF covering the period FY 03to FY 05. The analysis in this plan uses this period and the MTFF as the fundamental buildingblock for expenditure planning, but also adds to it fiscal years 06 and 07. Detailed informationon the outlook for expenditure is contained in Appendix Tables 3, 5, 6, 8, 9 and10; Table 8.3 andFigures 8.7 to 8.9.
8.19 At the time of plan preparation the CFET budget for FY 03 was still in the verypreliminary approval stages having been tentatively endorsed by the COM, but yet to beconsidered by the National Parliament. Furthermore, due to uncertainties about the availability ofexternal donor financing, the Council approval covered a range of total expenditure possibilitiesfor FY 03, from a core of US$67.4 million to a peak and preferred level of US$77.2 million.
8.20 This Plan supports the provision of external donor financing to allow for totalexpenditures of US$77.2 million in FY 03. In the Appendix tables and in the analysis whichfollows, this amount is used for the FY 03 estimate and as the base for expenditure planning overthe full Plan period. Should financing levels to support this expenditure base not be forthcomingthen modest adjustments will be needed to total expenditure numbers for FY 03 and possibly forFYs 04 and 05. However, no such adjustments should be necessary to estimates for FYs 06 and07 which can be Government financed at proposed levels without recourse to donor CFETbudget support. The Planning Commission considers the base expenditure level of US$77.2million for FY 03 to be appropriate for the following reasons:
a) Total combined sources expenditure is projected to drop sharply in FY 03 (by 24%)as is Nominal GDP (by 8.5%). It is important for public expenditure to hold upeconomic activity in the coming difficult years, to the maximum extent possible. Hadvery significant expenditure outlays during the UNTAET period been conservedsomewhat better over time than occurred, a smoother contraction would have beenpossible, and smoothing the transition still warrants support.
b) Significant UNTAET common and other services are to be discontinued in FY 03 andwill need to be directly or indirectly picked up by CFET. The net effect of UNTAETwithdrawal from service delivery will be a significant real decline in resourcesavailable for public service delivery in FY 03 (and beyond) compared to FY 02.
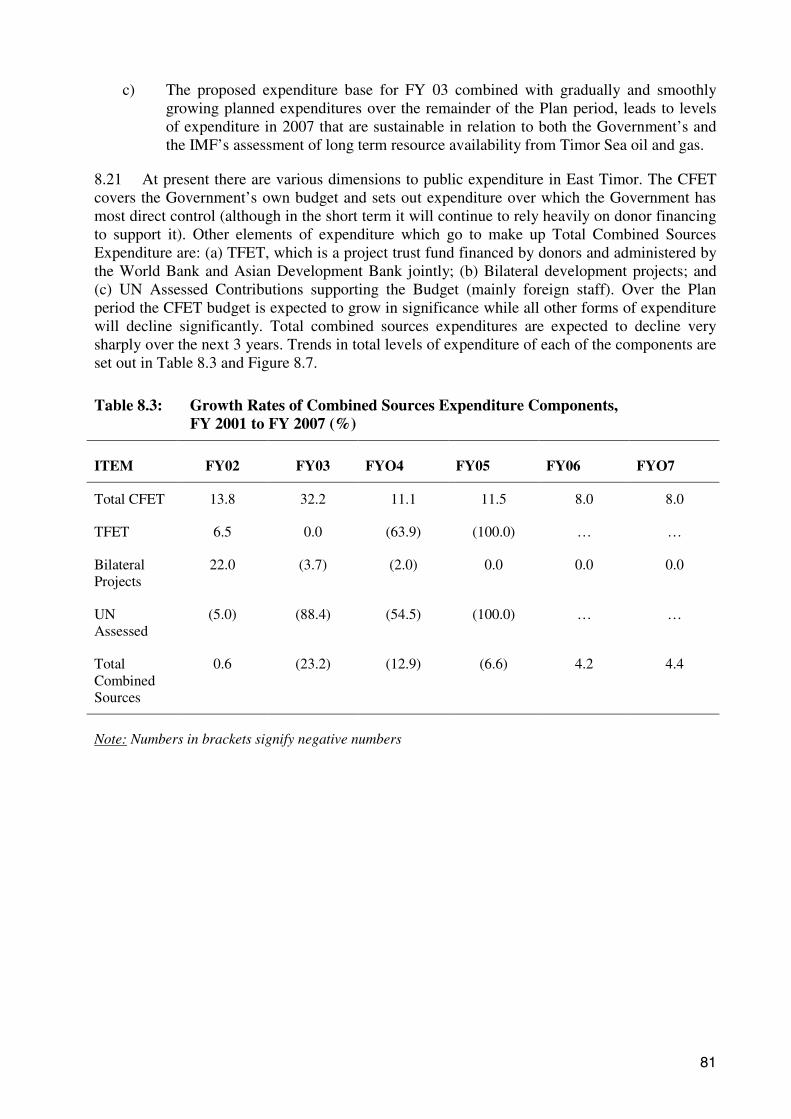
81
c) The proposed expenditure base for FY 03 combined with gradually and smoothlygrowing planned expenditures over the remainder of the Plan period, leads to levelsof expenditure in 2007 that are sustainable in relation to both the Government’s andthe IMF’s assessment of long term resource availability from Timor Sea oil and gas.
8.21 At present there are various dimensions to public expenditure in East Timor. The CFETcovers the Government’s own budget and sets out expenditure over which the Government hasmost direct control (although in the short term it will continue to rely heavily on donor financingto support it). Other elements of expenditure which go to make up Total Combined SourcesExpenditure are: (a) TFET, which is a project trust fund financed by donors and administered bythe World Bank and Asian Development Bank jointly; (b) Bilateral development projects; and(c) UN Assessed Contributions supporting the Budget (mainly foreign staff). Over the Planperiod the CFET budget is expected to grow in significance while all other forms of expenditurewill decline significantly. Total combined sources expenditures are expected to decline verysharply over the next 3 years. Trends in total levels of expenditure of each of the components areset out in Table 8.3 and Figure 8.7.
Table 8.3: Growth Rates of Combined Sources Expenditure Components,FY 2001 to FY 2007 (%)
ITEM FY02 FY03 FYO4 FY05 FY06 FYO7
Total CFET 13.8 32.2 11.1 11.5 8.0 8.0
TFET 6.5 0.0 (63.9) (100.0) … …
BilateralProjects
22.0 (3.7) (2.0) 0.0 0.0 0.0
UNAssessed
(5.0) (88.4) (54.5) (100.0) … …
TotalCombinedSources
0.6 (23.2) (12.9) (6.6) 4.2 4.4
Note: Numbers in brackets signify negative numbers
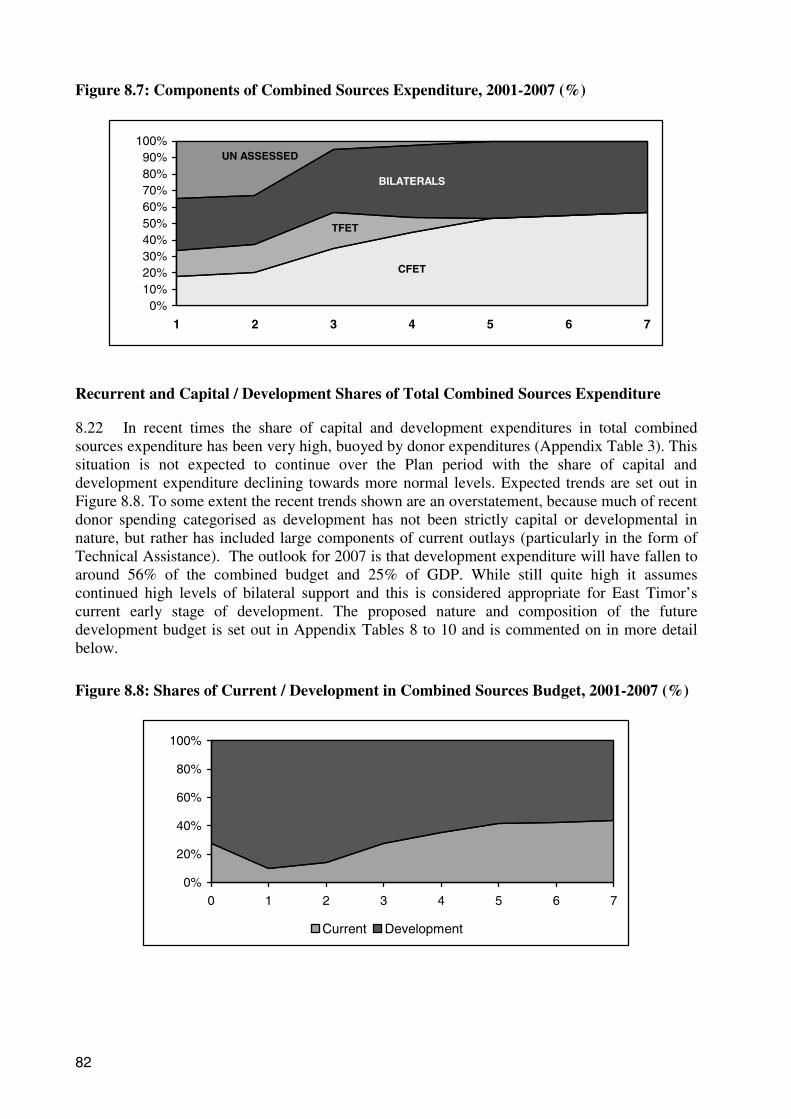
82
Figure 8.7: Components of Combined Sources Expenditure, 2001-2007 (%)
CFET
TFET
BILATERALS
UN ASSESSED
0%10%20%30%40%50%60%70%80%90%
100%
1 2 3 4 5 6 7
Recurrent and Capital / Development Shares of Total Combined Sources Expenditure
8.22 In recent times the share of capital and development expenditures in total combinedsources expenditure has been very high, buoyed by donor expenditures (Appendix Table 3). Thissituation is not expected to continue over the Plan period with the share of capital anddevelopment expenditure declining towards more normal levels. Expected trends are set out inFigure 8.8. To some extent the recent trends shown are an overstatement, because much of recentdonor spending categorised as development has not been strictly capital or developmental innature, but rather has included large components of current outlays (particularly in the form ofTechnical Assistance). The outlook for 2007 is that development expenditure will have fallen toaround 56% of the combined budget and 25% of GDP. While still quite high it assumescontinued high levels of bilateral support and this is considered appropriate for East Timor’scurrent early stage of development. The proposed nature and composition of the futuredevelopment budget is set out in Appendix Tables 8 to 10 and is commented on in more detailbelow.
Figure 8.8: Shares of Current / Development in Combined Sources Budget, 2001-2007 (%)
0%
20%
40%
60%
80%
100%
0 1 2 3 4 5 6 7
Current Development

83
Expenditure Allocations by Agency and Function
8.23 Anticipated trends in the Agency and functional composition of CFET total expendituresbetween FY 2002 and FY 2007 are set out in Appendix Tables 5 and 6 and Figure 8.9. Analysisof the recent situation (FY 2002 revised budget) in terms of expenditure allocation by Agencyand function reveals three important concerns for the development of future expenditure policy:
a) By international standards there is a quite high amount spent on bureaucracy andadministration at present The functional data indicates a significant 15% of the CFETbudget allocated to General Public / Administrative Services. Most countries aim tokeep this ratio below 10%. (However, comparison of East Timor’s budget situationwith other countries requires caution).
b) Subsidies to the energy sector are very high at US$ 6.8 million, representing 11.6% ofall budget expenditures. There is an obvious need to progressively reduce and removethis subsidy over a relatively short period of time.
c) As a result of the above expenditure patterns, resources available to priority areas ofGovernment are far less than they should be. This applies particularly to education,health, infrastructure maintenance and development; and agricultural extension andinvestment. These patterns in part reflect the post crisis nature of the economy andwith good management can be expected to even out over time.
8.24 Future planning policy needs to focus on progressively changing these inheriteddifficulties. At this point in time the Government is not sufficiently well advanced in it’splanning to have very hard sector and Agency ceilings in place for each of the 5 years of thePlan. Furthermore, all countries need to maintain reasonable flexibility with forward expenditureplans. Accordingly, neither the MTFF nor the Plan presents very hard numbers for outer years ofthe Plan. Notwithstanding this it will be critically important to actively manage and monitorexpenditure allocations over time to ensure that they are consistent with planning and policypriorities.
8.25 Rather than set out hard plans for expenditure allocations over the course of the Planperiod one illustrative example is now provided of a policy based approach to graduallychanging the composition of expenditures over time. In this regard an example of a relativelychallenging reform to the composition of expenditures over time is set out in Tables 5 and 6 andin Figure 8.9. This example of one possible reform to the composition of expenditure reflectsmoderately different outcomes than the forward estimates presented in the Budget documents.The forward estimates in the Budget documents set out the future ongoing costs of existingpolicies and programs. In contrast this Plan sets out an example of ongoing change to thecomposition of expenditures over time in the direction of higher funding for priority areasidentified in the planning process. If new spending policies and priorities were implemented overcoming years, the nature of the forward estimates would also change.
8.26 The main operational policies driving this illustrative example are:
a) Allocations for the FY 03 budget are taken as given in line with preliminary decisionsof the COM in April 2002.
b) Most administrative, defence, police and general public service expenditures over thePlan period FY 04 to FY 07 are constrained to annual expenditure growth of 2% perannum, thus approximately maintaining real expenditure levels.
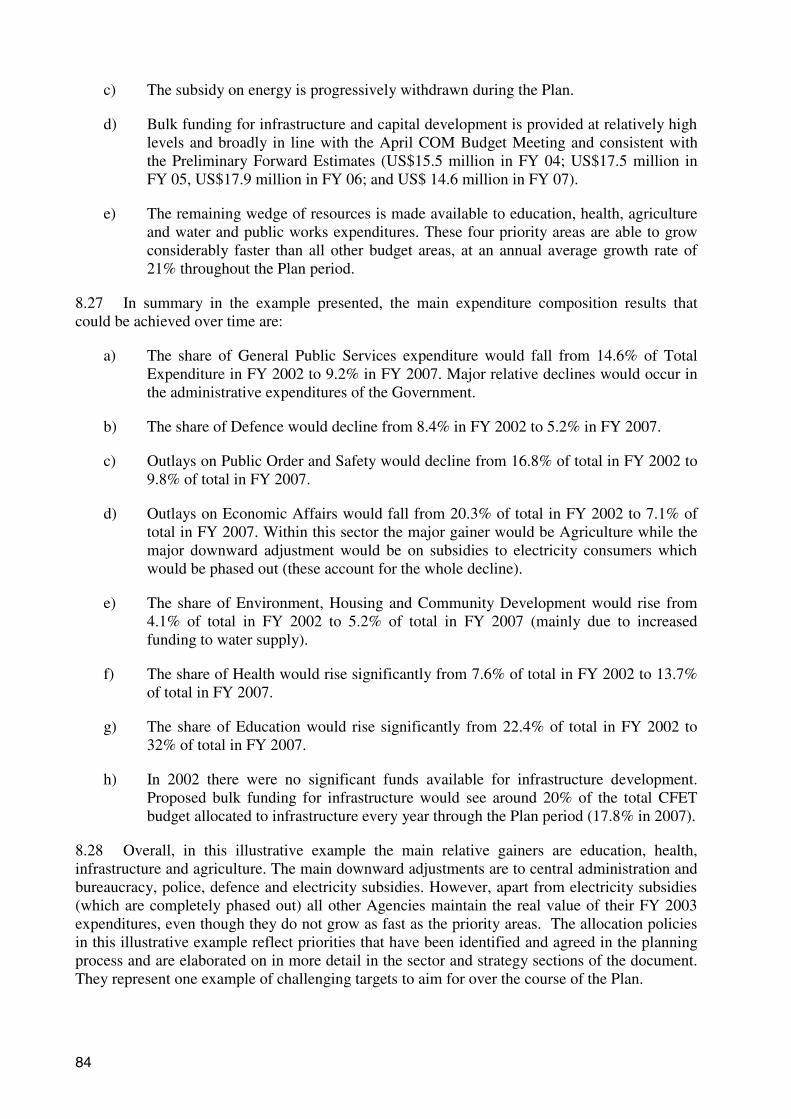
84
c) The subsidy on energy is progressively withdrawn during the Plan.
d) Bulk funding for infrastructure and capital development is provided at relatively highlevels and broadly in line with the April COM Budget Meeting and consistent withthe Preliminary Forward Estimates (US$15.5 million in FY 04; US$17.5 million inFY 05, US$17.9 million in FY 06; and US$ 14.6 million in FY 07).
e) The remaining wedge of resources is made available to education, health, agricultureand water and public works expenditures. These four priority areas are able to growconsiderably faster than all other budget areas, at an annual average growth rate of21% throughout the Plan period.
8.27 In summary in the example presented, the main expenditure composition results thatcould be achieved over time are:
a) The share of General Public Services expenditure would fall from 14.6% of TotalExpenditure in FY 2002 to 9.2% in FY 2007. Major relative declines would occur inthe administrative expenditures of the Government.
b) The share of Defence would decline from 8.4% in FY 2002 to 5.2% in FY 2007.
c) Outlays on Public Order and Safety would decline from 16.8% of total in FY 2002 to9.8% of total in FY 2007.
d) Outlays on Economic Affairs would fall from 20.3% of total in FY 2002 to 7.1% oftotal in FY 2007. Within this sector the major gainer would be Agriculture while themajor downward adjustment would be on subsidies to electricity consumers whichwould be phased out (these account for the whole decline).
e) The share of Environment, Housing and Community Development would rise from4.1% of total in FY 2002 to 5.2% of total in FY 2007 (mainly due to increasedfunding to water supply).
f) The share of Health would rise significantly from 7.6% of total in FY 2002 to 13.7%of total in FY 2007.
g) The share of Education would rise significantly from 22.4% of total in FY 2002 to32% of total in FY 2007.
h) In 2002 there were no significant funds available for infrastructure development.Proposed bulk funding for infrastructure would see around 20% of the total CFETbudget allocated to infrastructure every year through the Plan period (17.8% in 2007).
8.28 Overall, in this illustrative example the main relative gainers are education, health,infrastructure and agriculture. The main downward adjustments are to central administration andbureaucracy, police, defence and electricity subsidies. However, apart from electricity subsidies(which are completely phased out) all other Agencies maintain the real value of their FY 2003expenditures, even though they do not grow as fast as the priority areas. The allocation policiesin this illustrative example reflect priorities that have been identified and agreed in the planningprocess and are elaborated on in more detail in the sector and strategy sections of the document.They represent one example of challenging targets to aim for over the course of the Plan.

85
8.29 The main point in presenting this illustrative example is not to recommend it as the onlypossible approach to allocating budget resources over the medium term. Indeed current political(not Plan) perceptions are that higher levels of resources should go to defence, foreign affairsand police than are provided for in the example. Rather the purpose of the illustrative example isto draw out some more general pointers for expenditure planning approaches over time. Thebroader messages are:
a) The Government if it desires it strongly enough can change the compositional natureof the budget over time to better reflect Government priorities and developmentneeds.
b) Sectors and Agencies in most countries are able to manage their resources and affairsmore effectively where they have reasonable medium term clarity concerning likelylevels of available budget resources.
c) Further institutional, technical and coordination strengthening at both political andpublic service levels will be needed in East Timor to improve expenditure planningover time, particularly to more closely equate expenditure allocations with policy andplanning priorities.
Figure 8.9: CFET Expenditure by Agency and Function, FYs 2002 and 2007 (%)
Expenditure by Agency, FY 2002 (%)
CentralAdmin
Comm. /Trans.
Works
Int Admin
Justice
Econ Affairs
AgricultureEducation
Health
Foreign
Finance
Labour
Expenditure by Agency, FY 2007 (%)
Works
Finance
Foreign
Labour
HealthEducation
Agriculture
Econ Aff
Justice
Int Admin
CentralAdmin
Comm. &Tran.
Bulk Capital
Expenditure by Function, FY 2002 (%)
GeneralServices
Defence
Order &Safety
EconomicAffairs
Housing
Health
Education
BulkCapital
Expenditure by Function, FY 2007 (%)
GeneralServices
Defence
Order &Safety
EconomicAffairs
Housing
Health
Education
BulkCapital

86
Financing the Deficit and Aid
8.30 The outlook for combined sources financing over the Plan period is contained inAppendix Table 4. Large fiscal deficits are anticipated over all years of the Plan (-50.2% ofGDP in FY 2003; -39.9% of GDP in FY 2004; -22.1% of GDP in FY 2005; -21.7% of GDP inFY 2006; and -16.0% of GDP in FY 2007). All deficits are to be financed with donor grants withno public borrowing planned. Donor support to run the CFET budget is required for FYs 2003,2004 and 2005, but from then on oil revenues are estimated to be adequate to fund the CFETbudget.
8.31 All of the projected combined sources deficits in the years FY 2003 to FY 2007 areassumed to be financed by donor grants. It is anticipated that this will include contributionsfrom: (a) a donor facility to support on budget current and development expenditures underCFET, at least for FYs 03, 04 and 05 and if necessary beyond that; (b) TFET; (c) BilateralProjects; and (d) UN Assessed Contributions. By FY 2006 all of these financing sources apartfrom bilateral projects will have wound down to zero. Trends in projected deficit and financinglevels over the course of the Plan period are set out in Figures 8.10 and 8.11 below.
Figure 8.10: Combined Sources Deficit (-) as % of GDP, FY 2000 to FY 2007
-80
-70
-60
-50
-40
-30
-20
-10
0
0 1 2 3 4 5 6 7
Figure 8.11: Combined Sources Financing Components, FY 2000 to FY 2007 (as % ofTotal)
-20%
0%
20%
40%
60%
80%
100%
0 1 2 3 4 5 6 7
TFET Donor Budget Support Donor Projects U.N. Assessed Funds Saved (-) / Dissaved(+)
87
BANKING AND FINANCE
8.32 For the immediate future the Government intends to retain the United States Dollar asEast Timor’s currency. This along with responsible management of the package ofmacroeconomic policies should ensure price stability. Given dollarisation, there is essentially noscope at this stage for the application of flexible monetary and currency policies by theGovernment. In these circumstances – and in view of the paramount objective of ensuring acompetitive position for East Timor’s producers – it will be important to follow closelydevelopments in the real effective exchange rate (which is the exchange rate adjusted forinflation) for East Timor, and to assess its implications for economic growth and externalbalance.
8.33 In the meantime, there will continue to be a broadening and deepening of the capabilitiesof the BPA, with a view to preparing it to perform the fully-fledged functions of a central bank.Accordingly, the phased process of institution building that has been developed with supportfrom the IMF will be continued. In particular, further efforts will be made to train East Timoresestaff in performing central banking functions, including reserve management, provision ofbanking services to the government, development of the payments system and supervision ofbanking institutions in accordance with core Basle principles. Moreover, there will be growingemphasis on developing the economic analysis capability of the Authority, with the creation ofan incipient economic and financial research department. In this context, importance will beattached to the further development of banking, financial and balance of payments statistics.
8.34 Other major elements of the new institutional set up are expected to include:
a) Legislative review and upgrading of laws within the sector (to occur by early 2003).
b) A rise in the number of licensed commercial banks beyond the current number oftwo.
c) Increased diversity in the sector with a number of non-bank financial institutionshaving commenced operations by the end of the Plan period (leasing; financecompanies etc).
d) Access to branch or agency offices of financial institutions will have broadened toinclude at least minimum access in all main district centres.
e) Establishment by the end of the Plan period of at least some institutions relating to:
• General and life insurance.
• Micro savings and credit schemes.
• Private superannuation and related savings schemes.
f) A significant increase in Bank deposits (demand and time) and lending comparedwith recent levels.
EXTERNAL/BALANCE OF PAYMENTS
8.35 The external and balance of payments outlook is summarized in Appendix Table 7 and inFigure 8.12 below. Key elements of the external outlook are as follows:

88
a) Non oil exports will recover somewhat from recent levels, though at US US$40million per year by plan end will remain quite low, with potential for higher levels ifagricultural export growth can be stimulated.
b) New oil revenues from the Bayu Undan field from 2004 will assist the balance ofpayments through receipts of royalty and taxation payments. As the Timor Seaproducers are being treated as non-residents, Trade, Services, Income, Capital andFinancial transactions from the project are not recorded. In any event the project isexpected to be enclave in nature, with most foreign retention occurring in the form ofrevenue payments to East Timor.
c) Activities of UNTAET and the international donor community have had a majorinfluence on the external accounts in recent periods, fuelling a large growth inimports on the Trade Account to be offset by Donor grant financing, with no netimpact on the Overall Balance. The impact of these foreign flows is expected todiminish throughout the Plan period. General imports (which are not related to eitheraid or oil imports) are expected to be relatively modest throughout the period,although still significantly higher than merchandise exports.
d) As a result of the above trends the estimated current account deficits are moderatelyhigh in all years of the Plan period (averaging 12% of GDP), which are to be largelyfinanced by international grant and capital inflows.
e) In terms of overall balance, there are small negative balances projected for 2002,2003 and 2004 following which there is a gradual build-up of positive balances to2007. In the main these positive overall balances are represented by savings of TimorSea oil revenues, which will be built up in a special offshore savings facility to beintroduced.
Figure 8.12: Merchandise Imports and Exports, 2000-2007 (US$m)
0
50
100
150
200
250
0 1 2 3 4 5 6 7
Exports Imports
TWO CRITICAL FINANCING ISSUES
8.36 Arrangements for financing expenditure over the Plan period take on importance in EastTimor. There are two significant issues for medium term financing, which are:
a) Proposed management approaches and outlook for oil and gas revenues.
b) Aid management policy and the preferred forward aid program.

89
PROPOSED MANAGEMENT APPROACHES AND OUTLOOK FOR OIL AND GAS
REVENUES
Introduction
8.37 The short to medium term outlook for oil revenues has been set out at 8.10 above. Itdepends heavily on the outlook for Bayu Undan which is currently under construction. Apartfrom this approved petroleum liquids project (with approval on the gas phase still pending), thereis one other highly promising site under consideration, but not yet approved for development.This is the Sunrise Troubador project, which if developed would be mainly (about 90%) a drygas project, also based around either a pipeline to Darwin or a floating manufacturing facility atthe well site. Based on the feasibility work undertaken the possible capital costs (extraction only)are around US$700 million. Gas reserves are estimated at a significant 10 trillion cubic feet, withpotential production of 1,970 petajoules of gas and 70 million barrels of condensate. Potentialtotal revenue to East Timor over a 20-year site life has been tentatively estimated at US$1.0billion (current values).
8.38 Because no development contracts are yet in place for this potential project and becauseof engineering, commercial and international diplomacy uncertainties, no direct account has beentaken of it in the current national planning exercise. However, it is current Government policy topursue arrangements whereby these projects will come to full fruition in future years. This willdepend on reaching agreement with potential developers on terms and conditions that aresatisfactory for both the developers and the people and Government of East Timor.
8.39 The remainder of this section concentrates on the longer-term outlook and managementapproaches to the Bayu Undan Project. However, while the economic and commercial outlooksfor different projects will vary, similar management approaches (as those set out below) arelikely to be pursued for all future projects.
Proposed Management Approaches
8.40 Important elements and guiding principles of the management approaches that will bepursued are as follows.
a) The risks of Dutch Disease are now widely known and Government policy seeks toavoid such effects. Common elements of this disease include: (a) booming conditionsin the oil sector can cause real upward movements in currency, price and wage levels,leading to diminished competitiveness and prospects for other sectors of the domesticeconomy, such as agriculture, industry and tourism; and (b) frequently, Governmentexpenditure rises to levels above the effective absorptive capacity of the economy,leading to wastage in both recurrent and capital expenditures of the governmentbudget.
b) Once higher oil revenues start to flow (currently expected to reach peak levels aroundFY 2010), oil revenues will not be taken directly into the budget, but will go initiallyinto an offshore pool of foreign financial savings and investments. These investmentswill be of a secure nature (Investment Grade AAA only) and will aim to provide asecure stream of interest and dividends income, that can be brought into the budgetwithout diminishing the real capital value of the Fund over time (after it reaches itsprojected peak level, around twenty years into the Bayu Undan project).
90
c) The precise mechanisms to implement the above savings goals are still beingdeveloped, partly in consultation with officials from the Norwegian GovernmentAgencies responsible for similar mechanisms for supervising and managing oilrevenues in Norway. While it is likely that a Norwegian type model and legislationwill be introduced within the next 6 to 12 months it is still too early to be precise onall the fine details. However, important elements of the management approach arelikely to be as follows:
• The approach will be backed by strong legislation, which will provide quitelimited discretionary powers to Ministers to adjust legislated flows of financeseither into or out of the Fund. In the first instance all funds received are likely tobe deposited offshore.
• The legislation is likely to contain principles to apply to the collection and drawdown of funds, with close integration with the budget processes. Some flexibilitywill need to be built into the principles to allow for changing circumstances andparticularly during the early years, to allow for some draw down of capital untilsuch time that the fund reaches its peak capital and earnings level. However, allsignificant matters affecting the flows of funds are expected to require legislativebacking.
• After peak capital levels are achieved, a central principle is likely to be that thereal capital value (value adjusted for price and currency movements) of theoffshore fund will be at the very least maintained (hopefully it will grow) overtime.
• Thus amounts drawn into the budget will be at levels that are sustainable in termsof maintaining the real capital value of the Fund. At the same time the aim will beto draw down amounts in a consistent and regular fashion each year, to allowmedium term management of expenditures and the budget in smooth andpredictable ways, without abrupt changes from year to year. Appropriatemanagement of expenditures and the total budget from year to year will becritical for successful management of oil revenues.
• Offshore investments will be managed by a diversified range of AAA GradeInvestment Funds. Regular monitoring of investment performance of individualManagers and the Total Fund will occur by the MoF and the BPA.
• The Timor Gap Authority (which regulates licensing, production sharing andother matters in joint areas of the Timor Sea) will maintain high standards andwill be staffed only with people of high international standing, so as to fulfilproperly its licensing and regulatory functions and also to undertake theimportant role of monitoring collection of tranche 1 and tranche 2 oil payments toEast Timor.
• The Revenue Service will be strengthened to ensure proper administration of thecollection of oil revenues, using the highest international standards. Wherenecessary international technical assistance and the international contracting outof particular tasks will be undertaken. Regular and complete tax audits of oiloperators will be a common feature of future tax administration.

91
Financial Outlook
8.41 Important elements of the financial outlook for Bayu Undan Project (both liquids and gasphases) are as follows:
a) Total of 370 million barrels of condensate and LPG and 3 trillion cubic feet of gasover the 20-year life of the project.
b) Estimated total revenue (from all sources) to East Timor of approximately US$3.2billion over the course of the project (at current prices).
c) Recent modelling by both the Government and the IMF under quite conservativeassumptions of the build up of the offshore savings fund indicate:
• That the fund will achieve peak level in excess of US$1.3 billion (2000/2001constant prices) in the early 2020s.
• That beyond this peak the Fund should be able to support regular drawings ofaround US$60 to US$70 million per year (2000/2001 values, but to be adjustedannually to approximately maintain the real value of drawdowns).
• Provided there is solid growth over time in the Non Oil domestic revenues toaround 10 to 12% of GDP, the budget should be able to maintain annual totalexpenditures of around 25% of GDP (US$ 97 million in 2001 values), withoutrecourse to CFET debt financing (though capital and technical forms of donorassistance are still sought over the longer term). This total level of expenditure isbroadly equivalent to current plan estimates (where total CFET expenditure in2006 / 07 levels out at around 25% of GDP – Appendix Table 3).
• In the event that the Bayu Undan phase-2 gas component did not eventuate asomewhat lower level of expenditures would be needed to sustain the real valueof the offshore fund in perpetuity.
d) To the extent that oil prices are significantly above US$18 a barrel or that SunriseTroubador and other prospective sites are developed at a later stage, then the situationpresented would be even more promising. In these circumstances it is likely that thepeak capital size of the Fund would increase sharply beyond the currently projectedlevels and that there would be scope for either higher annual levels of capital anddevelopment expenditures through the budget than are currently planned or for higherlevels of savings for future generations, or a combination of both.
AID MANAGEMENT POLICY AND THE PREFERRED FORWARD ODA PROGRAM
CFET Budget Support
8.42 Foreign aid (or ODA) in its various forms has funded the bulk of public expendituressince 1999. This trend is expected to continue for the full period of the Plan, although the largestneed will be in the first three years of the Plan. Beyond that it is anticipated that there will be noneed for donor budget support, (although there are risks that this situation will change if oilrevenues do not reach expectations).

92
8.43 Other ODA is expected to continue for varying periods throughout the Plan (refer toFigure 8.7). TFET is expected to wind down sharply from FY 2003 and to cease completely inFY 2004. The UN Assessed Contributions are expected to be phased out in FY 2004. It isanticipated that bilateral capital projects and technical assistance will continue over the longerterm, and it is hoped that these can be maintained over the medium term to levels of at least US$85 million per year. This is the minimum level needed over a long period of time to sustain thegrowth and development projections.
8.44 Reaching agreement with donors on the amount of budget support to be provided in FYs2003 to 2005 (and if necessary beyond) is a matter of major importance for the Government. Theprocesses and terms and conditions of such assistance are also of great importance. At presentdiscussion is still proceeding as to amounts and processes to apply. It is hoped that broadagreement will be reached before the May 2002 Donor Conference, which will be asked toendorse the proposed arrangements.
Aid Policy
8.45 As at April 2002 discussion is occurring in terms of a possible single ODA facility tocover budget support funding in the coming financial years before significant oil revenues arrive.It seems likely this facility will include contributions from a number of participating donors, butwill probably be managed and coordinated through one or two donors. The more importantpolicy positions of the Government on the finalization of such a facility (and more generally inrelation to aid policy) are as follows:
a) There is a strong policy preference for grant forms of assistance with no borrowing inthe early years of independence.
b) Significant assistance is needed in the early years in the form of direct budget supportto assist the general current operations of government and to finance a small capitaldevelopment fund. While it is hoped that the need for assistance will not extendbeyond FY 05, the Government recognizes the need to be cautious as to the actuallevels of oil revenue collections and requests donors to remain flexible in theirprovision of budget support beyond FY 2005 should developments in the oil sectorrequire it.
c) Future aid planning makes some provision for longer-term technical assistance in thefive years after independence (around three hundred longer term positions). This TAsupport is specifically meant to cover long term line positions, initially to be filled byexpatriates. Beyond these identified positions (and any subsequently identified), theGovernment’s preference is for a much lower proportion of TA than occurred in theUNTAET period (In the period from 1999 to June 2002 it is estimated that TAspending will represent US$114.2 million out of the total ODA spending ofUS$323.1 million, or 35% of the total). It is preferred that the great bulk of futureODA support goes into capital and development projects that have been identified bythe Government and agreed with donors.
d) The Government lacks the capacity to manage a facility with a large and complexconditionality matrix. To the extent that any conditionality matrix at all is required,Government is of the view that it should be simple, containing only a small numberof conditions, most of which should relate to total levels of CFET expenditure andagreed targets for the composition and nature of both current and developmentexpenditures.

93
e) All future ODA should take close account of Government’s Vision, Goals, GuidingPrinciples, Policies and allocational priorities between sectors as contained in thisplan, to assist in the identification and formulation of future programs and projects ofassistance. In relation to formulating ODA programs and projects within sectors thisshould extend to understanding and supporting the various sector chapters of thisplan, which set out goals, priorities and policies for future assistance within each ofthe sectors (along with indicative programs and projects). Appendix Table 9 providesinformation on the composition of already approved and programmed bilateral ODAover the period, FY 00 to FY 07. In many respects existing and planned bilateralassistance has been favourably consistent with the priorities of the Plan. For example18% of the total has gone to Agriculture and Fisheries, 14% to Education, 11% toHealth and 22% to Infrastructure areas of Water, Public Works, Communications andTransport. On the other hand significant amounts have also been devoted to centraladministration (around 30% of total bilateral ODA). In some areas overlaps betweendonors’ contributions, particularly in competing forms of TA, have occurred and thisneeds to be addressed.
f) As part of institutional strengthening it is proposed during the course of the Plan tocentralize all aid coordination and management functions under one roof, possibly inthe Ministry of Finance. This should allow for easier integration of the current anddevelopment budgets and a closer linking of ODA with the MTFF, budgetpreparation and management.
g) The UNTAET Regulation 2001/13 makes provision for a Special Funds budget tocover aid in kind and external financing that does not pass through the ConsolidatedFund. All Government Ministries and Agencies are required to provide the necessaryproject and financial information through the budget formulation process. To increasethe comprehensiveness of coverage the MoF has introduced a database which aims toinclude all approved forms of ODA and to track disbursements against financingagreements, mainly using information collected from donors. It is proposed in futureyears to present more comprehensive information as an annex to the budgetdocuments with regard to all forms of ODA that are not directly on budget. The fullsupport and assistance of donors in building up this information base is sought.
Future ODA Programs and Projects
8.46 Apart from the above general policies, other key elements of the Government’s futureODA program and project needs are set out in the sector chapters of this Plan. The preferredprograms and projects have been developed through the eight sector working groups involved inthe preparation of the Plan. The Government seeks to gain as much future support as possible tofund these new initiatives. This includes support for projects that are to be directly on budget andalso projects the bilateral donors administer more directly themselves. The sector chaptersprovide the details.

Table 1
Constant (2000) Price GDP by Sector, 2000 - 2007, (US$ Millions; and %)
2000 2001 2002 2003 2004 2005 2006 2007Estimate Estimate Outlook Outlook Outlook Outlook Outlook Outlook
1. Agriculture, Forestry and Fisheries 83.3 96.0 100.1 103.8 109.4 116.5 124.5 133.0Annual Growth (%) -12.5 15.3 4.3 3.7 5.4 6.5 6.8 6.8As % of GDP 25.9 25.3 26.5 28.1 29.3 30.2 30.7 31.02. Mining and Quarrying 3.1 3.2 3.3 3.5 3.6 3.8 4.1 4.3Annual Growth (%) 0.0 5.5 3.3 3.5 5.1 5.4 6.0 6.0As % of GDP 1.0 0.9 0.9 0.9 1.0 1.0 1.0 1.03. Manufacturing Industry 8.7 9.3 9.5 9.9 10.4 11.0 11.8 12.6Annual Growth (%) 10.0 6.3 3.0 3.3 5.5 6.2 6.7 6.9As % of GDP 2.7 2.4 2.5 2.7 2.8 2.9 2.9 2.94. Electricity, Gas and Water 2.6 2.9 3.0 3.0 3.1 3.4 3.6 3.9Annual Growth (%) 13.3 10.1 1.6 0.9 5.3 6.7 7.6 7.3As % of GDP 0.8 0.8 0.8 0.8 0.8 0.9 0.9 0.95. Construction 45.9 50.6 50.4 49.7 51.7 54.9 59.3 63.8Annual Growth (%) 33.4 10.4 -0.5 -1.3 3.9 6.2 8.1 7.5As % of GDP 14.3 13.3 13.3 13.5 13.8 14.2 14.6 14.86. Trade, Hotels and Restaurants 25.1 29.1 28.0 26.5 27.3 29.0 31.5 33.5Annual Growth (%) 44.7 15.8 -3.6 -5.4 3.0 6.0 8.7 6.5As % of GDP 7.8 7.7 7.4 7.2 7.3 7.5 7.8 7.87. Transport and Communications 23.2 26.1 25.3 24.2 25.1 26.8 29.1 31.3Annual Growth (%) 45.8 12.6 -3.2 -4.4 4.0 6.6 8.6 7.5As % of GDP 7.2 6.9 6.7 6.5 6.7 6.9 7.2 7.38. Finance, Rents & Bus. Services 21.1 24.4 23.7 22.4 23.2 24.7 26.6 28.3Annual Growth (%) 24.5 15.9 -3.1 -5.3 3.5 6.3 8.0 6.3As % of GDP 6.6 6.4 6.3 6.1 6.2 6.4 6.6 6.69. Services 108.2 138.1 134.5 126.5 119.8 116.0 115.3 118.8Annual Growth (%) 27.0 27.6 -2.6 -6.0 -5.2 -3.2 -0.6 3.1As % of GDP 33.7 36.4 35.6 34.2 32.1 30.0 28.4 27.7
Total (Constant Price) GDP 321.1 379.8 377.8 369.4 373.7 386.0 405.7 429.4
Annual Real Total Growth (%) 15.4 18.3 -0.5 -2.2 1.2 3.3 5.1 5.9
Total Nominal GDP 321.2 389.3 370.6 345.2 357.4 382.5 417.3 454.9
Annual Nominal Total Growth (%) 18.9 21.2 -4.8 -6.9 3.5 7.0 9.1 9.0
94
Sources: (a) Ministry of Finance for 2000; (b) I.M.F. for 2001; and © I.M.F. and Planning Commission for 2002 - 2007
Note: Excludes oil and gas production with Oil Companies operating in the Zone of Cooperation treated as non residents pending clarification of their status
APPENDIX: MEDIUM TERM ECONOMIC AND FINANCING OUTLOOK TABLES

Table 2.
Combined Sources Revenues and Grants, FY 00 to FY 07 (US$ Millions and %)
FY00 FY01 FY02 FY03 FY04 FY05 FY06 FY07Actual Actual Budget Budget Estimate Estimate Estimate Estimate
Revised Prelim.
A. TOTAL REVENUE (B+C) 2.0 28.4 31.4 42.6 53.4 98.8 101.7 126.7Total Revenue as % of GDP 0.7 8.0 8.3 11.9 15.2 26.7 25.4 29.1
B. DOMESTIC REVENUE (B1+B2+B3) 2.0 15.5 19.4 21.3 20.7 22.4 25.3 27.6Total Domestic Revenue as % of GDP 0.7 4.4 5.1 6.0 5.9 6.1 6.3 6.3
B1. Direct Taxes (Taxes on Income) 0.0 0.8 4.6 4.3 4.3 4.6 5.0 5.4Direct Taxes as a % of GDP 0.0 0.2 1.2 1.2 1.2 1.2 1.3 1.2Individual Income Tax 0.0 0.6 2.3 2.2 2.2 2.4 2.6 2.9Income and Final Withholding Tax 0.0 0.2 2.3 2.1 2.1 2.2 2.4 2.5
B2. Indirect Taxes (Taxes on Commodities) 2.0 11.4 12.4 14.3 13.7 14.5 15.3 17.0Indirect Taxes as a % of GDP 0.7 3.2 3.3 4.0 3.9 3.9 3.8 3.9Sales Tax 0.0 3.0 3.2 4.0 4.0 4.2 4.4 4.9Excise 0.0 4.0 4.3 5.0 5.0 5.2 5.4 5.9Import Duties 2.0 2.6 2.9 3.4 2.8 3.1 3.3 3.7Export Duties 0.0 0.2 0.0 0.0 0.0 0.0 0.0 0.0Service Tax 0.0 1.7 2.0 1.9 1.9 2.0 2.2 2.5
B3. Non Tax Revenue 0.0 3.3 2.4 2.7 2.7 3.3 5.0 5.2Non Tax Revenues as % of GDP 0.0 0.9 0.6 0.8 0.8 0.9 1.3 1.2User Fees and Charges 0.0 2.6 1.3 1.4 1.5 1.5 1.6 1.7Other Non Tax Revenues (Including Interest) 0.0 0.6 1.1 1.3 1.2 1.8 3.4 3.5
C. Timor Sea Oil / Gas Revenue 0.0 12.9 12.0 21.3 32.7 76.4 76.4 99.1Oil / Gas Revenue as % of GDP 0.0 3.6 3.2 6.0 9.3 20.6 19.1 22.7First Tranche Petroleum 0.0 3.0 6.0 0.8 6.6 24.2 22.3 29.5Taxes 0.0 9.9 6.0 20.5 26.1 52.2 54.1 69.6
D. FOREIGN GRANTS 154.2 258.2 260.9 180.7 146.7 106.1 85.0 85.0Foreign Grants as a % of GDP 52.1 72.7 68.7 50.5 41.8 28.7 21.3 19.5Trust Fund for East Timor 69.1 46.2 49.2 49.0 17.7 0.0 0.0 0.0Direct Donor Budget Support 41.6 22.0 30.0 35.7 39.0 21.1 0.0 0.0Projects Administered by Bilateral Donors 27.9 90.0 86.7 85.0 85.0 85.0 85.0 85.0U.N. Assessed Contribution 15.6 100.0 95.0 11.0 5.0 0.0 0.0 0.0
F. TOTAL REVENUE AND GRANTS (A+D) 156.2 286.6 292.3 223.3 200.1 204.9 186.7 211.7Total Revenue and Grants as % of GDP 52.8 80.7 76.9 62.4 57.0 55.4 46.7 48.6
Sources: (a) Ministry of Finance for FY 00 to FY 03; and (b) Planning Commission for FY 04 to FY 07
95
Notes: 1. First tranche petroleum revenue is currently accumulated in a Special Timor Sea Account. In future all oil revenues may go firstly to an offshore account.
2. General U.N. assessed contributions only include estimates of U.N. funded activities that are likely to directly affect the operations of Government through the CFET budget (This reflects mainly TA and staffing. Non recurring items such as peacekeeping; New York activities etc. are not included here).
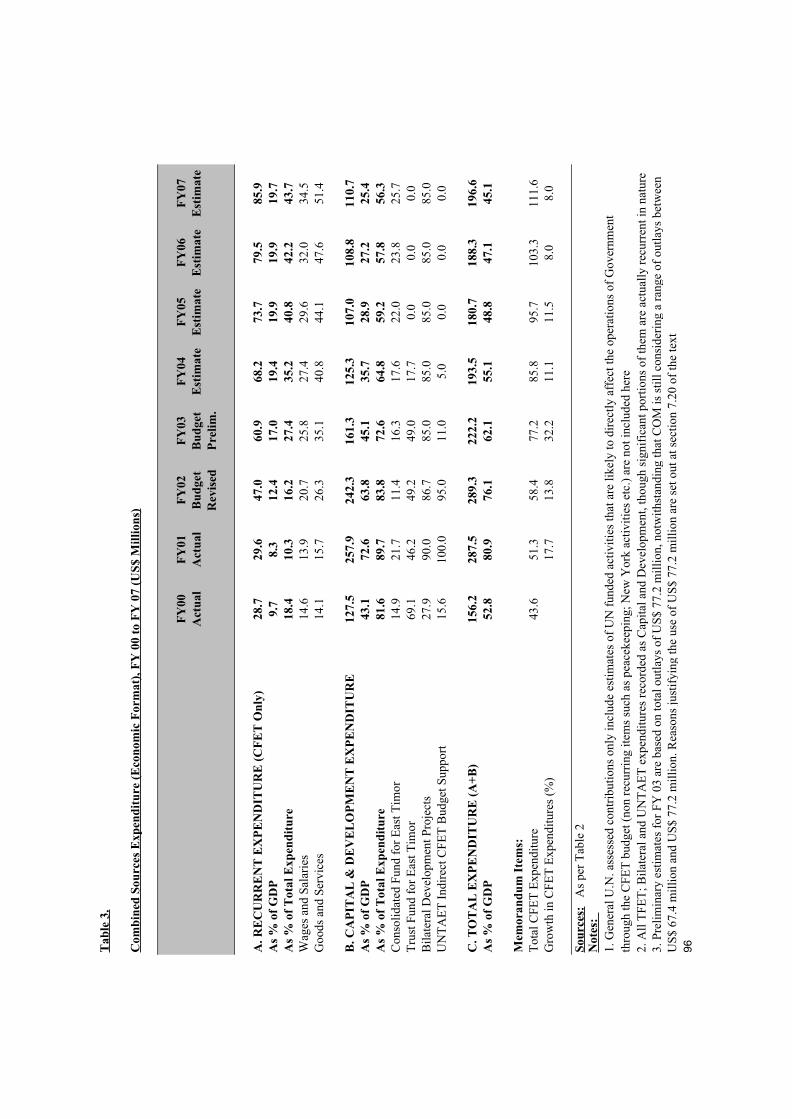
Tab
le 3
.
Com
bine
d So
urce
s E
xpen
ditu
re (
Eco
nom
ic F
orm
at),
FY
00
to F
Y 0
7 (U
S$ M
illio
ns)
FY
00F
Y01
FY
02F
Y03
FY
04F
Y05
FY
06F
Y07
Act
ual
Act
ual
Bud
get
Bud
get
Est
imat
eE
stim
ate
Est
imat
eE
stim
ate
Rev
ised
Pre
lim.
A. R
EC
UR
RE
NT
EX
PE
ND
ITU
RE
(C
FE
T O
nly)
28.7
29.6
47.0
60.9
68.2
73.7
79.5
85.9
As
% o
f G
DP
9.7
8.3
12.4
17.0
19.4
19.9
19.9
19.7
As
% o
f T
otal
Exp
endi
ture
18.4
10.3
16.2
27.4
35.2
40.8
42.2
43.7
Wag
es a
nd S
alar
ies
14.6
13.9
20.7
25.8
27.4
29.6
32.0
34.5
Goo
ds a
nd S
ervi
ces
14.1
15.7
26.3
35.1
40.8
44.1
47.6
51.4
B. C
AP
ITA
L &
DE
VE
LO
PM
EN
T E
XP
EN
DIT
UR
E12
7.5
257.
924
2.3
161.
312
5.3
107.
010
8.8
110.
7A
s %
of
GD
P43
.172
.663
.845
.135
.728
.927
.225
.4A
s %
of
Tot
al E
xpen
ditu
re81
.689
.783
.872
.664
.859
.257
.856
.3C
onso
lidat
ed F
und
for
Eas
t Tim
or14
.921
.711
.416
.317
.622
.023
.825
.7T
rust
Fun
d fo
r E
ast T
imor
69.1
46.2
49.2
49.0
17.7
0.0
0.0
0.0
Bila
tera
l Dev
elop
men
t Pro
ject
s27
.990
.086
.785
.085
.085
.085
.085
.0U
NT
AE
T I
ndir
ect C
FET
Bud
get S
uppo
rt
15.6
100.
095
.011
.05.
00.
00.
00.
0
C. T
OT
AL
EX
PE
ND
ITU
RE
(A
+B
)15
6.2
287.
528
9.3
222.
219
3.5
180.
718
8.3
196.
6A
s %
of
GD
P52
.880
.976
.162
.155
.148
.847
.145
.1
Mem
oran
dum
Ite
ms:
Tot
al C
FET
Exp
endi
ture
43.6
51.3
58.4
77.2
85.8
95.7
103.
311
1.6
Gro
wth
in C
FET
Exp
endi
ture
s (%
)17
.713
.832
.211
.111
.58.
08.
0
Sour
ces:
A
s pe
r T
able
2
96US$
67.
4 m
illio
n an
d U
S$ 7
7.2
mill
ion.
Rea
sons
just
ifyi
ng th
e us
e of
US$
77.
2 m
illio
n ar
e se
t out
at s
ectio
n 7.
20 o
f th
e te
xt
1. G
ener
al U
.N. a
sses
sed
cont
ribu
tions
onl
y in
clud
e es
timat
es o
f U
N f
unde
d ac
tiviti
es th
at a
re li
kely
to d
irec
tly a
ffec
t the
ope
ratio
ns o
f G
over
nmen
tN
otes
:
thro
ugh
the
CFE
T b
udge
t (no
n re
curr
ing
item
s su
ch a
s pe
acek
eepi
ng; N
ew Y
ork
activ
ities
etc
.) a
re n
ot in
clud
ed h
ere
2. A
ll T
FET
; Bila
tera
l and
UN
TA
ET
exp
endi
ture
s re
cord
ed a
s C
apita
l and
Dev
elop
men
t, th
ough
sig
nifi
cant
por
tions
of
them
are
act
ually
rec
urre
nt in
nat
ure
3. P
relim
inar
y es
timat
es f
or F
Y 0
3 ar
e ba
sed
on to
tal o
utla
ys o
f U
S$ 7
7.2
mill
ion,
not
with
stan
ding
that
CO
M is
stil
l con
side
ring
a r
ange
of
outla
ys b
etw
een

Tab
le 4
.
Com
bine
d So
urce
s F
inan
cing
(E
cono
mic
For
mat
), F
Y 0
0 to
FY
07
(US$
Mill
ions
)
FY
00F
Y01
FY
02F
Y03
FY
04F
Y05
FY
06F
Y07
Act
ual
Act
ual
Bud
get
Bud
get
Est
imat
eE
stim
ate
Est
imat
eE
stim
ate
Rev
ised
Pre
lim.
A. T
OT
AL
RE
VE
NU
E (
Exc
ludi
ng G
rant
s)2.
028
.431
.442
.653
.498
.810
1.7
126.
7T
otal
Rev
enue
as
% o
f G
DP
0.7
8.0
8.3
11.9
15.2
26.7
25.4
29.1
B. M
INU
S T
OT
AL
EX
PE
ND
ITU
RE
156.
228
7.5
289.
322
2.2
193.
518
0.7
188.
319
6.6
Tot
al E
xpen
ditu
re a
s %
of
GD
P52
.880
.976
.162
.155
.148
.847
.145
.1
C. E
QU
AL
S D
EF
ICIT
(-)
/ Su
rplu
s (+
)-1
54.2
-259
.1-2
57.9
-179
.6-1
40.1
-81.
9-8
6.6
-69.
9T
otal
Def
icit
as
% o
f G
DP
-52.
1-7
2.9
-67.
9-5
0.2
-39.
9-2
2.1
-21.
7-1
6.0
D. F
INA
NC
ING
OF
DE
FIC
ITT
rust
Fun
d fo
r E
ast T
imor
69.1
46.2
49.2
49.0
17.7
0.0
0.0
0.0
Dir
ect D
onor
Bud
get S
uppo
rt41
.622
.030
.035
.439
.021
.10.
00.
0Pr
ojec
ts A
dmin
iste
red
by B
ilate
ral D
onor
s27
.990
.086
.785
.085
.085
.085
.085
.0U
.N. A
sses
sed
Con
trib
utio
n15
.610
0.0
95.0
11.0
5.0
0.0
0.0
0.0
Incr
ease
(-)
/ D
ecre
ase
(+)
in C
ash
Bal
ance
s0.
00.
9-3
.0-0
.8-6
.6-2
4.2
1.6
-15.
1
TO
TA
L F
INA
NC
ING
154.
225
9.1
257.
917
9.6
140.
181
.986
.669
.9
Mem
oran
dum
Ite
m:
Cum
ulat
ive
Cas
h B
alan
ce L
evel
s0.
0-0
.92.
13.
09.
935
.134
.551
.1So
urce
s: A
s pe
r T
able
s 2
and
397

Table 5.
Consolidated Fund for East Timor, Total Expenditure by Agency, FY 02 to FY 07(US$ 000)
FY02 FY03 FY04 FY05 FY06 FY07Revised Preliminary Estimate Estimate Estimate Estimate
Budget Budget
1. Government and Administration 7,767 7,903 8,061 8,222 8,387 8,554 1.1 Chief Ministers Office 783 461 470 480 489 499 1.2 Legislative Assembly 851 883 901 919 937 956 1.3 Independent Electoral Commissioner 11 59 60 61 63 64 1.4 Banking and Payments Authority 1,374 1,080 1,102 1,124 1,146 1,169 1.5 ETDF Command 4,214 4,429 4,518 4,608 4,700 4,794 1.6 Office of President 90 404 412 420 429 437 1.7 Other Ministers - Bulk 382 539 550 561 572 583 1.8 Ombudsman 62 48 49 50 51 52
2. Ministry of Internal Administration 9,272 11,769 12,004 12,244 12,489 12,739 2.1 East Timor Police Service 6,707 7,806 7,962 8,121 8,284 8,449 2.2 Internal Administration / Local Administration / Other 2,565 3,963 4,042 4,123 4,206 4,290
3. Ministry of Justice 2,390 2,078 2,120 2,162 2,205 2,249
4. Ministry for Economic Affairs and Planning 7,256 4,565 3,478 3,142 553 564 4.1 Department of Natural and Mineral Resources 115 168 171 175 178 182 4.2 Department of Economic Affairs and Development 325 353 360 367 375 382 4.3 Energy Subsidy 6,816 4,044 2,947 2,600 - -
5. Ministry for Agriculture and Fisheries 881 1,373 1,716 2,060 2,471 2,966
6. Ministry of Education, Culture and Youth 13,061 16,653 20,816 24,980 29,975 35,970
7. Ministry of Health 5,313 7,079 8,849 10,619 12,742 15,291
8. Labour and Solidarity 234 480 490 499 509 520
9. Ministry of Foreign Affairs and Cooperation 272 671 684 698 712 726
10. Ministry of Finance 5,727 3,782 3,858 3,935 4,013 4,094 10.1 Ministry Operations 3,742 2,247 2,292 2,338 2,385 2,432 10.2 Whole of Government Payments / Contingencies 1,985 1,535 1,566 1,597 1,629 1,662
11. Ministry of Water and Public Works 5,601 5,467 6,834 8,201 9,841 11,809
12. Ministry of Communications and Transport 460 1,388 1,416 1,444 1,473 1,502
13. Bulk Unallocated Funding / Other 146 14,004 15,474 17,495 17,928 14,616 13.1 Recurrent 146 2,112 1,300 1,350 1,400 1,500 13.2 Capital - 11,892 14,174 16,145 16,528 13,116
14. Total Expenditure (Current + Capital) 58,380 77,212 85,800 95,700 103,300 111,600 Sources: (a) Ministry of Finance for FYs 02 and 03 and; (b) Planning Commission estimates for FYs 04 to 07
Notes: 1. Data for FY 03 based on very preliminary budget data
98 2. Estimates for FY 04 to FY 07 based on a policy based scenario of the Planning Commission's as set out in Chapter 7 of the Development Plan
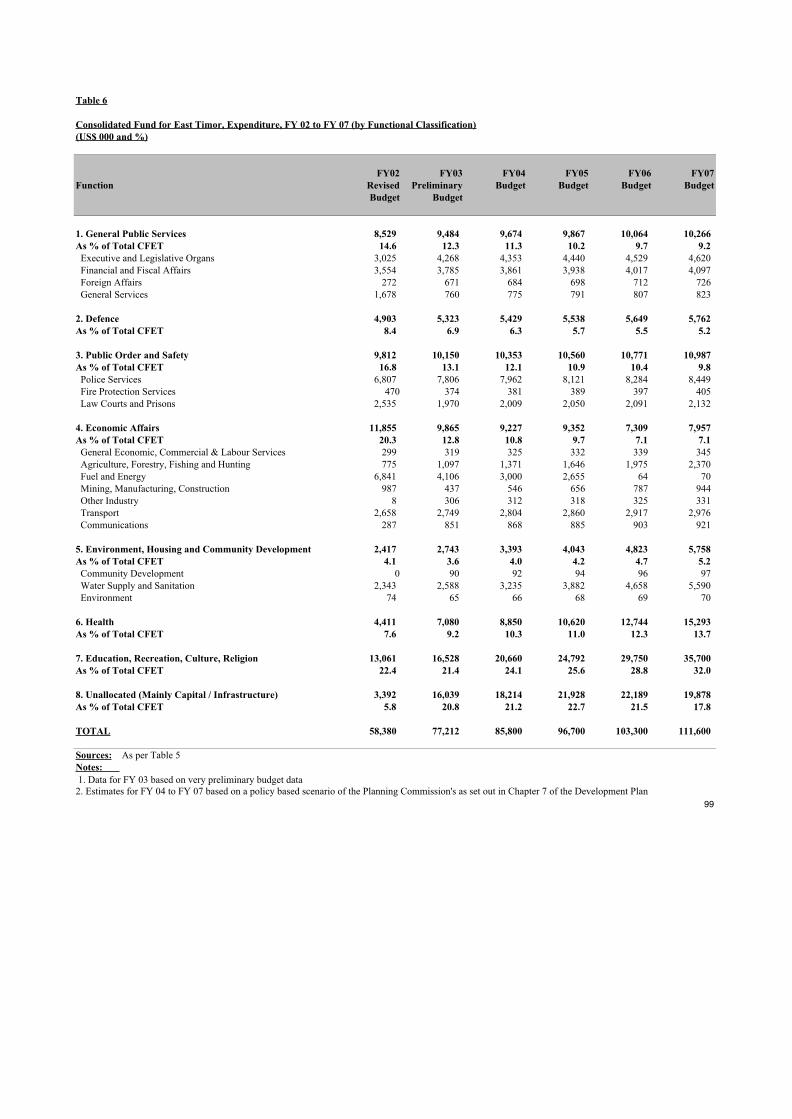
Table 6
Consolidated Fund for East Timor, Expenditure, FY 02 to FY 07 (by Functional Classification)(US$ 000 and %)
FY02 FY03 FY04 FY05 FY06 FY07Function Revised Preliminary Budget Budget Budget Budget
Budget Budget
1. General Public Services 8,529 9,484 9,674 9,867 10,064 10,266 As % of Total CFET 14.6 12.3 11.3 10.2 9.7 9.2 Executive and Legislative Organs 3,025 4,268 4,353 4,440 4,529 4,620 Financial and Fiscal Affairs 3,554 3,785 3,861 3,938 4,017 4,097 Foreign Affairs 272 671 684 698 712 726 General Services 1,678 760 775 791 807 823
2. Defence 4,903 5,323 5,429 5,538 5,649 5,762 As % of Total CFET 8.4 6.9 6.3 5.7 5.5 5.2
3. Public Order and Safety 9,812 10,150 10,353 10,560 10,771 10,987 As % of Total CFET 16.8 13.1 12.1 10.9 10.4 9.8 Police Services 6,807 7,806 7,962 8,121 8,284 8,449 Fire Protection Services 470 374 381 389 397 405 Law Courts and Prisons 2,535 1,970 2,009 2,050 2,091 2,132
4. Economic Affairs 11,855 9,865 9,227 9,352 7,309 7,957 As % of Total CFET 20.3 12.8 10.8 9.7 7.1 7.1 General Economic, Commercial & Labour Services 299 319 325 332 339 345 Agriculture, Forestry, Fishing and Hunting 775 1,097 1,371 1,646 1,975 2,370 Fuel and Energy 6,841 4,106 3,000 2,655 64 70 Mining, Manufacturing, Construction 987 437 546 656 787 944 Other Industry 8 306 312 318 325 331 Transport 2,658 2,749 2,804 2,860 2,917 2,976 Communications 287 851 868 885 903 921
5. Environment, Housing and Community Development 2,417 2,743 3,393 4,043 4,823 5,758 As % of Total CFET 4.1 3.6 4.0 4.2 4.7 5.2 Community Development 0 90 92 94 96 97 Water Supply and Sanitation 2,343 2,588 3,235 3,882 4,658 5,590 Environment 74 65 66 68 69 70
6. Health 4,411 7,080 8,850 10,620 12,744 15,293 As % of Total CFET 7.6 9.2 10.3 11.0 12.3 13.7
7. Education, Recreation, Culture, Religion 13,061 16,528 20,660 24,792 29,750 35,700 As % of Total CFET 22.4 21.4 24.1 25.6 28.8 32.0
8. Unallocated (Mainly Capital / Infrastructure) 3,392 16,039 18,214 21,928 22,189 19,878 As % of Total CFET 5.8 20.8 21.2 22.7 21.5 17.8
TOTAL 58,380 77,212 85,800 96,700 103,300 111,600
Sources: As per Table 5Notes: 1. Data for FY 03 based on very preliminary budget data
992. Estimates for FY 04 to FY 07 based on a policy based scenario of the Planning Commission's as set out in Chapter 7 of the Development Plan
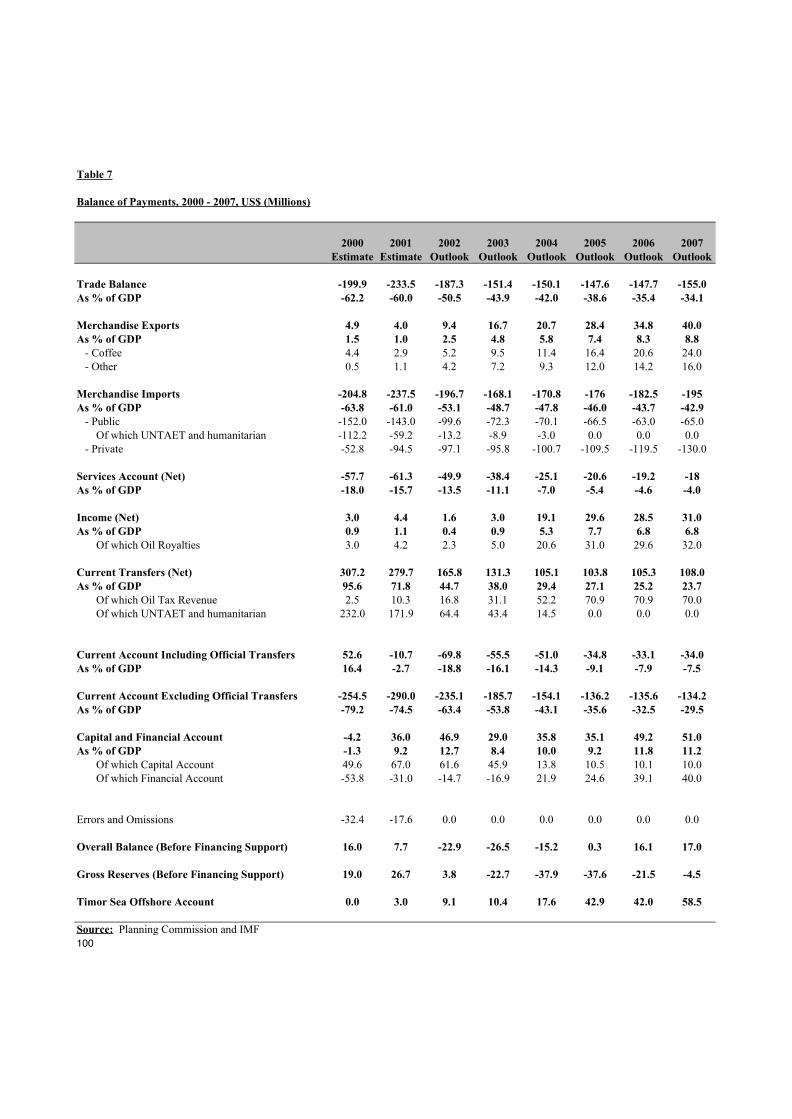
Table 7
Balance of Payments, 2000 - 2007, US$ (Millions)
2000 2001 2002 2003 2004 2005 2006 2007Estimate Estimate Outlook Outlook Outlook Outlook Outlook Outlook
Trade Balance -199.9 -233.5 -187.3 -151.4 -150.1 -147.6 -147.7 -155.0As % of GDP -62.2 -60.0 -50.5 -43.9 -42.0 -38.6 -35.4 -34.1
Merchandise Exports 4.9 4.0 9.4 16.7 20.7 28.4 34.8 40.0As % of GDP 1.5 1.0 2.5 4.8 5.8 7.4 8.3 8.8 - Coffee 4.4 2.9 5.2 9.5 11.4 16.4 20.6 24.0 - Other 0.5 1.1 4.2 7.2 9.3 12.0 14.2 16.0
Merchandise Imports -204.8 -237.5 -196.7 -168.1 -170.8 -176 -182.5 -195As % of GDP -63.8 -61.0 -53.1 -48.7 -47.8 -46.0 -43.7 -42.9 - Public -152.0 -143.0 -99.6 -72.3 -70.1 -66.5 -63.0 -65.0 Of which UNTAET and humanitarian -112.2 -59.2 -13.2 -8.9 -3.0 0.0 0.0 0.0 - Private -52.8 -94.5 -97.1 -95.8 -100.7 -109.5 -119.5 -130.0
Services Account (Net) -57.7 -61.3 -49.9 -38.4 -25.1 -20.6 -19.2 -18As % of GDP -18.0 -15.7 -13.5 -11.1 -7.0 -5.4 -4.6 -4.0
Income (Net) 3.0 4.4 1.6 3.0 19.1 29.6 28.5 31.0As % of GDP 0.9 1.1 0.4 0.9 5.3 7.7 6.8 6.8 Of which Oil Royalties 3.0 4.2 2.3 5.0 20.6 31.0 29.6 32.0
Current Transfers (Net) 307.2 279.7 165.8 131.3 105.1 103.8 105.3 108.0As % of GDP 95.6 71.8 44.7 38.0 29.4 27.1 25.2 23.7 Of which Oil Tax Revenue 2.5 10.3 16.8 31.1 52.2 70.9 70.9 70.0 Of which UNTAET and humanitarian 232.0 171.9 64.4 43.4 14.5 0.0 0.0 0.0
Current Account Including Official Transfers 52.6 -10.7 -69.8 -55.5 -51.0 -34.8 -33.1 -34.0As % of GDP 16.4 -2.7 -18.8 -16.1 -14.3 -9.1 -7.9 -7.5
Current Account Excluding Official Transfers -254.5 -290.0 -235.1 -185.7 -154.1 -136.2 -135.6 -134.2As % of GDP -79.2 -74.5 -63.4 -53.8 -43.1 -35.6 -32.5 -29.5
Capital and Financial Account -4.2 36.0 46.9 29.0 35.8 35.1 49.2 51.0As % of GDP -1.3 9.2 12.7 8.4 10.0 9.2 11.8 11.2 Of which Capital Account 49.6 67.0 61.6 45.9 13.8 10.5 10.1 10.0 Of which Financial Account -53.8 -31.0 -14.7 -16.9 21.9 24.6 39.1 40.0
Errors and Omissions -32.4 -17.6 0.0 0.0 0.0 0.0 0.0 0.0
Overall Balance (Before Financing Support) 16.0 7.7 -22.9 -26.5 -15.2 0.3 16.1 17.0
Gross Reserves (Before Financing Support) 19.0 26.7 3.8 -22.7 -37.9 -37.6 -21.5 -4.5
Timor Sea Offshore Account 0.0 3.0 9.1 10.4 17.6 42.9 42.0 58.5
Source: Planning Commission and IMF100

Table 8.
Approved and Programmed Foreign ODA by Country and Type, FY 00 TO FY 07, (US$ 000)
FY00 FY01 FY02 FY03 FY04 FY05 FY06 FY07 Total PeriodActual Actual Estimate Estimate Estimate Estimate Estimate Estimate Estimate
A. TRUST FUND FOR EAST TIMOR (TFET)
ADB - Capital - 10,342 13,104 9,824 8,000 - - - 41,270 ADB - TA - 5,257 4,195 1,641 - - - - 11,093 ADB - Total - 15,599 17,299 11,465 8,000 - - - 52,363 WB - Capital - 27,167 25,974 33,106 8,487 - - - 94,733 WB - TA - 3,390 5,927 4,430 1,213 - - - 14,960 WB - Total - 30,557 31,901 37,535 9,700 - - - 109,693 Total - Capital - 37,509 39,078 42,929 16,487 - - - 136,003 Total - TA - 8,647 10,122 6,071 1,213 - - - 26,053 Total TFET - 46,156 49,200 49,000 17,700 - - - 162,056
B. MULTILATERALS AND BILATERALS (NON TFET)ADB - Capital - - - - - - - - - ADB - TA - 150 5,023 350 - - - - 5,523 ADB - Total - 150 5,023 350 - - - - 5,523 Australia - Capital 375 2,835 14,862 9,400 8,040 2,200 - - 37,712 Australia - TA 2,105 8,587 19,849 15,805 12,226 3,090 - - 61,662 Australia - Total 2,480 11,422 34,711 25,205 20,266 5,290 - - 99,374 Canada - Capital - 260 1,115 835 690 105 - - 3,005 Canada - TA 680 2,385 2,542 580 250 100 - - 6,537 Canada - Total 680 2,645 3,657 1,415 940 205 - - 9,542 ECHO - Capital 5,425 5,980 7,730 - - - - - 19,135 ECHO - TA 400 315 210 - - - - - 925 ECHO - Total 5,825 6,295 7,940 - - - - - 20,060 Japan - Capital 750 18,832 7,311 10,270 5,920 4,810 - - 47,893 Japan - TA 857 9,995 4,747 3,317 1,140 29 - - 20,085 Japan - Total 1,607 28,827 12,058 13,587 7,060 4,839 - - 67,978 Portugal - Capital 6,752 8,731 7,928 5,229 2,090 100 100 700 31,630 Portugal -TA 630 6,923 7,747 6,570 1,480 - - - 23,350 Portugal - Total 7,382 15,654 15,675 11,799 3,570 100 100 700 54,980 USAID - Capital 7,850 9,657 5,600 2,300 1,550 - - - 26,957 USAID - TA 270 3,207 5,048 698 - - - - 9,223 USAID - Total 8,120 12,864 10,648 2,998 1,550 - - - 36,180 Other Bilaterals - Capital 643 8,439 7,658 - - - - - 16,740 Other Bilaterals - TA 1,134 2,706 3,217 - - - - - 7,057 Other Bilaterals - Total 1,777 11,145 10,875 - - - - - 23,797 UNDP Capital 32 1,042 900 - - - - - 1,974 UNDP TA - - 3,762 1,481 886 1,450 1,450 - 9,029 UNDP Total 32 1,042 4,662 1,481 886 1,450 1,450 - 11,003 Other Multilaterals - Capital - - 1,584 - - - - - 1,584 Other Multilaterals - TA - - 2,955 100 - - - - 3,055 Other Multilaterals - Total - - 4,539 100 - - - - 4,639 GRAND TOTAL - Capital 21,827 55,776 54,688 28,034 18,290 7,215 100 700 186,630 GRAND TOTAL - TA 6,076 34,268 55,100 28,901 15,982 4,669 1,450 - 146,446 GRANDTOTAL - Capital + TA 27,903 90,044 109,788 56,935 34,272 11,884 1,550 700 333,076
C. (TFET + NON TFET)GRAND TOTAL - Capital 21,827 93,285 93,766 70,963 34,777 7,215 100 700 322,633 GRAND TOTAL - TA 6,076 42,915 65,222 34,972 17,195 4,669 1,450 - 172,499 GRANDTOTAL - Total 27,903 136,200 158,988 105,935 51,972 11,884 1,550 700 495,132
Source: Ministry of Finance, ODA Database and Planning Commission
101
Note: Only includes approved and fully programmed projects. Does not include bulk amounts notionally targeted by Donors for future plan years
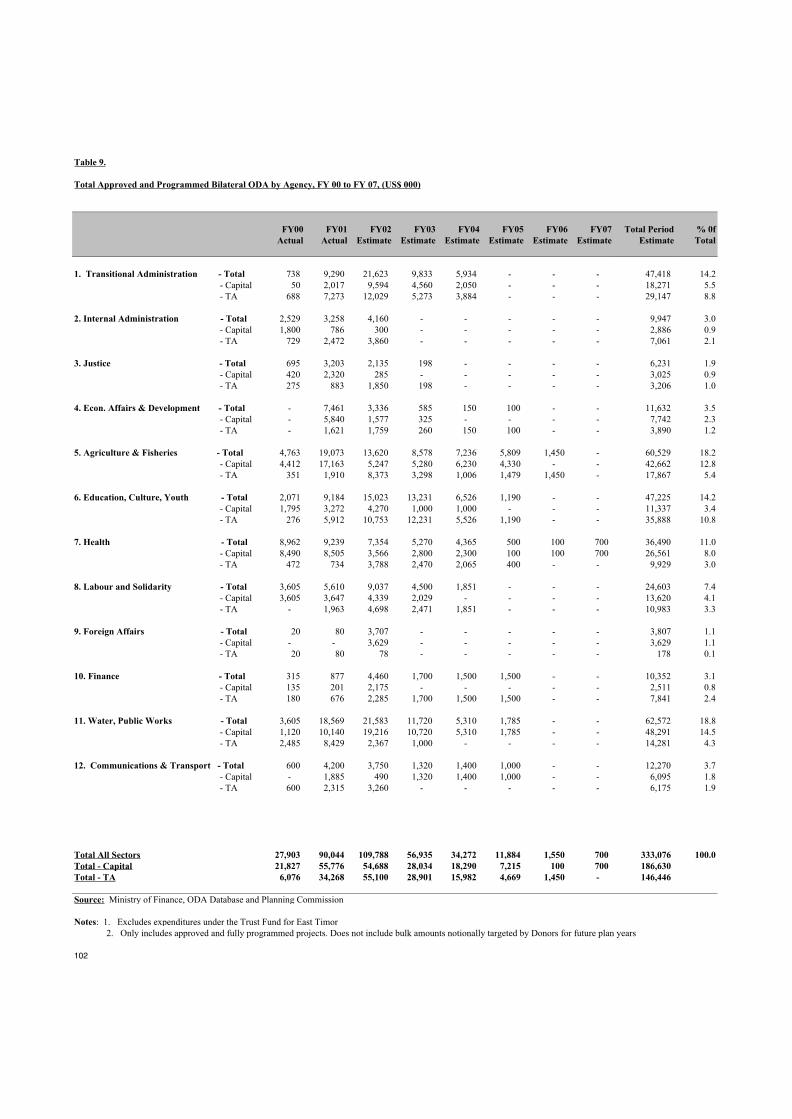
Table 9.
Total Approved and Programmed Bilateral ODA by Agency, FY 00 to FY 07, (US$ 000)
FY00 FY01 FY02 FY03 FY04 FY05 FY06 FY07 Total Period % 0fActual Actual Estimate Estimate Estimate Estimate Estimate Estimate Estimate Total
1. Transitional Administration - Total 738 9,290 21,623 9,833 5,934 - - - 47,418 14.2 - Capital 50 2,017 9,594 4,560 2,050 - - - 18,271 5.5 - TA 688 7,273 12,029 5,273 3,884 - - - 29,147 8.8
2. Internal Administration - Total 2,529 3,258 4,160 - - - - - 9,947 3.0 - Capital 1,800 786 300 - - - - - 2,886 0.9 - TA 729 2,472 3,860 - - - - - 7,061 2.1
3. Justice - Total 695 3,203 2,135 198 - - - - 6,231 1.9 - Capital 420 2,320 285 - - - - - 3,025 0.9 - TA 275 883 1,850 198 - - - - 3,206 1.0
4. Econ. Affairs & Development - Total - 7,461 3,336 585 150 100 - - 11,632 3.5 - Capital - 5,840 1,577 325 - - - - 7,742 2.3 - TA - 1,621 1,759 260 150 100 - - 3,890 1.2
5. Agriculture & Fisheries - Total 4,763 19,073 13,620 8,578 7,236 5,809 1,450 - 60,529 18.2 - Capital 4,412 17,163 5,247 5,280 6,230 4,330 - - 42,662 12.8 - TA 351 1,910 8,373 3,298 1,006 1,479 1,450 - 17,867 5.4
6. Education, Culture, Youth - Total 2,071 9,184 15,023 13,231 6,526 1,190 - - 47,225 14.2 - Capital 1,795 3,272 4,270 1,000 1,000 - - - 11,337 3.4 - TA 276 5,912 10,753 12,231 5,526 1,190 - - 35,888 10.8
7. Health - Total 8,962 9,239 7,354 5,270 4,365 500 100 700 36,490 11.0 - Capital 8,490 8,505 3,566 2,800 2,300 100 100 700 26,561 8.0 - TA 472 734 3,788 2,470 2,065 400 - - 9,929 3.0
8. Labour and Solidarity - Total 3,605 5,610 9,037 4,500 1,851 - - - 24,603 7.4 - Capital 3,605 3,647 4,339 2,029 - - - - 13,620 4.1 - TA - 1,963 4,698 2,471 1,851 - - - 10,983 3.3
9. Foreign Affairs - Total 20 80 3,707 - - - - - 3,807 1.1 - Capital - - 3,629 - - - - - 3,629 1.1 - TA 20 80 78 - - - - - 178 0.1
10. Finance - Total 315 877 4,460 1,700 1,500 1,500 - - 10,352 3.1 - Capital 135 201 2,175 - - - - - 2,511 0.8 - TA 180 676 2,285 1,700 1,500 1,500 - - 7,841 2.4
11. Water, Public Works - Total 3,605 18,569 21,583 11,720 5,310 1,785 - - 62,572 18.8 - Capital 1,120 10,140 19,216 10,720 5,310 1,785 - - 48,291 14.5 - TA 2,485 8,429 2,367 1,000 - - - - 14,281 4.3
12. Communications & Transport - Total 600 4,200 3,750 1,320 1,400 1,000 - - 12,270 3.7 - Capital - 1,885 490 1,320 1,400 1,000 - - 6,095 1.8 - TA 600 2,315 3,260 - - - - - 6,175 1.9
Total All Sectors 27,903 90,044 109,788 56,935 34,272 11,884 1,550 700 333,076 100.0Total - Capital 21,827 55,776 54,688 28,034 18,290 7,215 100 700 186,630 Total - TA 6,076 34,268 55,100 28,901 15,982 4,669 1,450 - 146,446
Source: Ministry of Finance, ODA Database and Planning Commission
Notes: 1. Excludes expenditures under the Trust Fund for East Timor 2. Only includes approved and fully programmed projects. Does not include bulk amounts notionally targeted by Donors for future plan years
102

Tab
le 1
0.
Pro
file
of
the
For
war
d O
DA
Pro
gram
Nee
ded
to F
inan
ce t
he P
lan,
FY
03
TO
FY
07
(US$
Mill
ions
)
FY
03F
Y04
FY
05F
Y06
FY
07E
stim
ate
Est
imat
eE
stim
ate
Est
imat
eE
stim
ate
A. F
OR
WA
RD
OD
A P
RO
GR
AM
SO
UG
HT
BY
TH
E G
OV
ER
NM
EN
T
Tru
st F
und
for
Eas
t Tim
or49
.017
.70.
00.
00.
0D
irec
t Don
or B
udge
t Sup
port
35.4
39.0
21.1
0.0
0.0
Proj
ects
Adm
inis
tere
d by
Bila
tera
l Don
ors
85.0
85.0
85.0
85.0
85.0
U.N
. Ass
esse
d C
ontr
ibut
ion
- R
ecur
rent
; Cap
ital;
and
Dev
elop
men
t11
.05.
00.
00.
00.
0T
OT
AL
SO
UG
HT
180.
414
6.7
106.
185
.085
.0
B. A
MO
UN
TS
AP
PR
OV
ED
/ F
IRM
LY
CO
MM
ITT
ED
Tru
st F
und
for
Eas
t Tim
or49
.017
.70.
00.
00.
0D
irec
t Don
or B
udge
t Sup
port
0.0
0.0
0.0
0.0
0.0
Proj
ects
Adm
inis
tere
d by
Bila
tera
l Don
ors
56.9
34.3
11.9
1.6
0.7
U.N
. Ass
esse
d C
ontr
ibut
ion
- R
ecur
rent
; Cap
ital;
and
Dev
elop
men
t11
.05.
00.
00.
00.
0SU
B T
OT
AL
116.
957
.011
.91.
60.
7
C. A
MO
UN
TS
NO
T Y
ET
AP
PR
OV
ED
/ F
IRM
LY
CO
MM
ITT
ED
Tru
st F
und
for
Eas
t Tim
or0.
00.
00.
00.
00.
0D
irec
t Don
or B
udge
t Sup
port
35.4
39.0
21.1
0.0
0.0
Proj
ects
Adm
inis
tere
d by
Bila
tera
l Don
ors
28.1
50.7
73.1
83.4
84.3
U.N
. Ass
esse
d C
ontr
ibut
ion
- R
ecur
rent
; Cap
ital;
and
Dev
elop
men
t0.
00.
00.
00.
00.
0SU
B T
OT
AL
63.5
89.7
94.2
83.4
84.3
Sour
ce:
As
per
Tab
les
4,8
and
9
103

104
105
PART 3
STRATEGIES FOR NATIONAL
DEVELOPMENT:
SECTORAL PLANS
Chapter 9. POLITICAL DEVELOPMENT, FOREIGN
RELATIONS, DEFENCE AND SECURITY
Chapter 10. POVERTY REDUCTION, RURAL AND
REGIONAL DEVELOPMENT
Chapter 11. SOCIAL AND HUMAN DEVELOPMENT:
EDUCATION AND HEALTH
Chapter 12. AGRICULTURE, FISHERIES AND FORESTRY
Chapter 13. NATURAL RESOURCES AND ENVIRONMENT
Chapter 14. INDUSTRY, TRADE AND THE PRIVATE
SECTOR
Chapter 15. INFRASTRUCTURE
106
9. POLITICAL DEVELOPMENT, FOREIGNRELATIONS, DEFENCE AND SECURITY
“The development of an effective administrative and governance structure and capacity to serve the needs and interests of the people and sovereign State of East Timor is one of the most critical national priorities for the next five years
and beyond.”
VISION
9.1 East Timor will be a country with:
a) a solid democratic culture, based on a pluralist, law-based State, whereseparation and balance of powers is real and naturally developed;
b) well structured institutions, open, professional and accountable media,and an organized civil society active in the defence of global interests;and
c) a population aware of and participatory in the process of social,political and economic development.
INTRODUCTION
9.2 The sector incorporating Political Development, Foreign Relations,Defence and Security is presented in this Plan as the collective efforts of a numberof Ministries and Departments, and encompasses broad areas of governance,protection of liberty and safeguarding of human rights.
9.3 Two essential institutions ensuring the healthy functioning of the nation’snewly won democracy are the National Parliament and the Public Service. TheParliament must ensure that its legislative functions are accomplished in a timelymanner, as it has an important role in the country’s democratisation andstabilisation. It also has the responsibility in overseeing and controlling of otherpowers, always in terms of its legal mandate. State administration is to beundertaken in a professional manner, with effective and efficient performance ofits personnel. The administrative apparatus (i.e. number of staff) shall be reducedto the lowest number possible in order to guarantee its sustainability, and so thatsalaries and other forms of compensation can attract the best national staff toserve the State, without incentives for corruption and/or nepotism.
9.4 East Timor’s freedom has been founded upon the willingness of itspopulation to participate in the protection of their liberty and human rights. Thecountry’s defence and security will be understood in the widest context of social,political and economic development, in the context of poverty reduction and aparticipatory and responsible citizenship. They will be
107
provided by professional military and police forces, which will be non-political and subordinatedto the power of the democratically constituted civil institutions. In its foreign affairs East Timorwill reinforce its position as a country supporting peace and the values of respect, mutualassistance and cooperation. The administration of justice, accessible to all, will combineprofessionalism and juridical expertise with sensitivity to the culture and values of East Timor.The protection of rights, freedoms, guarantees and legitimate interests of citizens will be ensuredby the establishment of an independent institution, also mandated to monitor transparency inboth the public administration and the administration of justice in East Timor. This institutionwill guarantee, through accessible and informal means, that citizens will be able to findexpeditious redress to accusations of illegality and/or injustice in the conduct of publicauthorities.
9.5 Civil society will take part in the political process through political parties that respectthe rules of democracy and implement them at the parties’ organizational level and through otherlegal private associations (i.e. professional associations, unions, NGOs, etc.) established todefend the legitimate interests of their members and to take part in the social, political andeconomic development of the country. The media will be responsible and able to inform, educateand direct national energy towards development and social harmony, guaranteeing thedissemination of educational information on health, human rights, social harmony and nationaldevelopment.
GOALS
9.6 The overarching goals for the sector include:
a) Fostering a robust multiparty democratic system;
b) Creating a lean, effective and efficient public service;
c) Securing the unity, territorial integrity and sovereignty of the nation;
d) Creating and maintaining durable internal peace, security and stability;
e) Developing effective professional, non-partisan (non-political) defence and policeforces;
f) Strengthening regional and international political, economic, cultural and scientificcooperation and relations;
g) Developing and administering an effective, accessible, justice system that is inconformity with positive values and East Timor’s national cultural heritage;
h) Building and maintaining an effective and independent oversight system;
i) Nurturing a responsible, independent and effective media;
j) Strengthening an already robust civil society and creating opportunities for itsconstructive engagement and participation in national life; and
k) Enhancing the participation of citizens in public and national life.

108
OBJECTIVES
9.7 Specific objectives of the National Parliament’s are to:
a) Pass relevant, well drafted legislation in a timely manner;
b) Establish a multiparty system and democratic rules through a productive dialogue;
c) Provide a counterbalance to the powers of the Presidency and of the government;
d) Establish and maintain proper, efficient and effective communication between thevarious branches of the Government in order to ensure respect for the Constitutionand constitutionally enacted laws, transparency within the public administration, andthe independence and impartiality of the judiciary.
9.8 The Public Administration will:
a) Create a culture of public service, establishing professionalism in service provision;
b) Establish a well equipped and decentralized administration with simple andtransparent norms in order to move public administration closer to the people;
c) Create internal mechanisms to control and avoid corruption and nepotism.
9.9 The objectives for the Defence Force and Police of East Timor are:
a) Guaranteeing national independence, territorial integrity, constitutional order, and thesafety of people and their property.
b) Preventing crime and involving the community in the reduction of crime.
c) Providing help to the population in case of natural disasters or emergency.
9.10 Foreign Affairs has the following objectives:
a) Maintaining friendship and cooperation links within the region, in particular with theneighbouring countries, and with the rest of the world;
b) Maintaining special links of friendship and cooperation with the Community ofPortuguese Speaking Nations (CPLP);
c) Establishing diplomatic and consular representation overseas in order to developforeign policy and ensure protection of national citizens abroad;
d) Maintaining good relations with other countries, maximizing support for the socialand economic development of East Timor.
9.11 The Courts (in the widest sense of the judicial system, including all three essentialelements of judge, prosecutor and defender) shall:
a) Guarantee access to prompt, transparent and equitable justice for all;
b) Administer justice of technical quality independently, with respect for citizenshiprights, sensitivity to cultural values and popular participation and involvement.

109
9.12 The Ombudsman’s Office (in support of Human Rights and Justice) aims to:
a) Create and establish a culture of respect for human rights and legality;
b) Prevent and fight against corruption and nepotism in the administration of the State inorder to develop public trust in a fair and just public administration; and
c) Establish control mechanisms to ensure the accountability of public servants andpublic authorities.
9.13 The objectives of Civil Society, where organized in political parties, are as follows:
a) Make people aware of the political ideals and programs to be undertaken;
b) Monitor public administration activities in order to identify any errors in policies andprograms as well as cases of lack of transparency, nepotism and corruption;
c) Monitor parliamentary activities and propose solutions to national problems inaccordance with the established political rules.
9.14 The objectives of Civil Society, where organized in legal associations, unions and NGOsare as follows:
a) Defend the legitimate interests of their associates and of the community;
b) Promote the participation of the citizens in public life.
9.15 The activities of the media should have the following central objectives:
a) Report with accuracy, impartiality and professionalism the news and issues ofnational interest, including what happens abroad, and in particular in the countries ofthe region;
b) Report in a manner that promotes social peace, development and the promotion ofhuman rights, particularly concerning women, children and the elderly;
c) Follow closely the activities of the State administration and denounce cases ofcorruption and nepotism.
GUIDING PRINCIPLES
9.16 The general guiding principles for the sector are:
a) Democracy, sovereignty, respect for human rights, equity and social justice;
b) Rule of law and equality before the law;
c) Transparency and accountability, integrity and public morality;
d) Predictability and consistency;
e) Efficiency;
f) Professionalism;

110
g) Sustainability;
h) Decentralization;
i) Participation;
j) Gender and cultural sensitivity; and
k) Social justice.
9.17 The organs of sovereignty and public administration will respect the following principles:
a) National sovereignty and State unity;
b) Respect for the Constitution and for the law, guaranteeing the regular operation of thedemocratic institutions;
c) A spirit of public service, professionalism, non-partisanship with respect to politicalparties, equity and legality;
d) Moral integrity and professional ethics;
e) Democratic decentralization of administrative structures ensuring accessibility toservices for all citizens;
f) Transparency and accountability of public agents; and
g) Government responsibility for ensuring equality for all when facing the law,promoting and guaranteeing protection of human rights and caring for victims.
9.18 In foreign affairs, East Timor is to be guided by principles of:
a) National independence;
b) The right of the people to independence, self determination and respect for humanrights;
c) Mutual respect for the sovereignty, territorial integrity, equality and non-interferencein the internal affairs of States;
d) Creation of an international economic order capable of ensuring peace and justice inthe relations between different peoples/nations.
9.19 The media will undertake its activities adhering to the following principles:
a) Freedom to inform and be informed;
b) Impartiality and quality;
c) No censorship;
d) Safeguarding the sources of information.

111
KEY DEVELOPMENT INDICATORS
9.20 The key development indicators for the sector are as follows:
Parliament
a) Level of participation of its members in discussions;
b) Level of the population’s awareness of approved legislation.
Public Administration
a) Level of progress in the design of the organic structures of government and of each ofits ministries;
b) Level of establishment of departments, with the necessary legal and regulatoryframeworks;
c) Enactment of the regulation of the public service, including the formulation ofstandardised professional career terms of reference, duties and rights, together with acode of conduct and a disciplinary process;
d) Progress in the areas of recruitment and training in order to meet the public sector’sneeds for professionalism and for financial sustainability;
e) Progress in the conducting of studies concerning the reorganisation of sub-nationalgovernment, with a decentralization of services, promoting effective and competentservice provision and an increase of local participation in decision-making.
Security and Defence Forces
a) Level of progress in recruitment and training of the police forces, armed forces andinformation services.
Foreign Affairs
a) Level of progress in recruitment and training of skilled staff;
b) Progress in the constitution of the first six diplomatic representations and obtainingother forms of representation for the country through the good offices of friendlyEmbassies.
Public Prosecution and Defence
a) Progress in recruitment of prosecutors and public defenders and respective supportingskilled staff.
Ombudsman’s Office
a) Progress in the definition of the legal framework for the Office and in the creation ofaccessible procedures that facilitate the reporting of injustices and human rightsviolations;
b) Progress in the recruitment and training of skilled staff;

112
c) Progress in the level of awareness, by the East Timorese citizens, of their humanrights and their right to good public administration;
d) Progress in the level of awareness of the existence of services of the Ombudsman asan effective avenue of appeal from the actions or omissions of public administration;
e) Level of acceptance of the recommendations of the Ombudsman by the respectivebranches of the public service.
Promotion of Gender Equality
a) Existence of legislation to protect women from violence;
b) Accomplishment of targets for the participation of women in the public service,parliament, rural councils, defence and security forces and diplomatic service;
c) Creation of mechanisms to help decrease school dropout rates for girls.
Media
a) Progress in the creation of public media;
b) Approval of press legislation enabling the creation of private means ofcommunication and regulating professional media activities;
c) Creation of an independent organ that guarantees disciplinary management andobservance of ethical behaviour by the media and its professional.
Civil Society
a) Progress in the constitution of unions and private associations under the law.
PROBLEMS AND CONSTRAINTS
9.21 The principal constraints confronted are as follows:
General constraints:
a) Human resources;
b) Financial resources (budget);
c) Infrastructure (buildings, vehicles, office furniture and supplies, communications andInformation Technology (IT);
d) Problems with multiplicity of languages;
e) Time pressures;
f) Limitations in institutional capacity;
g) Gaps in the body of laws, regulations, procedures and codes.

113
More specific constraints:
a) Absence of adequate representation on COM (i.e. Armed Forces);
b) Unrealistic expectations (e.g. subsidies for producers and consumers, universitydegrees and Public Sector employment for all students);
c) Lack of basic social infrastructure (to accommodate spontaneous relocation ofpopulation);
d) Bad habits from previous period (e.g. corruption, nepotism);
e) Reconciliation problems;
f) Difficulties with reintegration of ex-FALINTIL and former members of theclandestine resistance network and with assistance to widows and orphans ofresistance fighters.
STRATEGIES
9.22 A number of strategies will be adopted to overcome the constraints outlined above:
a) To clearly define and broadcast the rights and obligations of citizens in general and ofpublic servants, in particular;
b) To continue the search for more efficient forms of organization of the publicadministration to improve quality and cost-effectiveness of service provision;
c) To redistribute available resources, in accordance with new priorities;
d) To recruit to fill vacancies already provided for in budget;
e) To train in-house, at the Civil Service Academy, and abroad;
f) To utilize the temporary solution of foreign staff more effectively, during the periodwhen domestic staff is being trained;
g) To promote diversification of sources of assistance and develop stronger partnershipswith civil society;
h) To develop appropriate mechanisms to facilitate reintegration of refugees;
i) To redefine priorities for university education, with a view to preparing graduates indisciplines most useful for the nation’s development and improving the quality ofuniversity education;
j) To promote transparency in public life, accountability in public servants and leaders,and equal opportunities for all;
k) To reconfigure regional administrative divisions and the intermediate levels ofgovernment (between the national central administration and the community) to makethem more conducive to development and sustainability;

114
l) To transform the present international support and sympathy for East Timor into astrong and permanent base to secure the country’s political, economic (trade andinvestment), cultural and national security interests;
m) To develop an independent oversight capacity, capable of encouraging transparency,and which will allow civil society and citizens to monitor the public service in orderto minimise corruption.
POLICIES
9.23 The following policy initiatives of importance will be undertaken by the sector:
General Policies
a) Creation of incentives to reward effort and excellence in education and in the civilservice (i.e. create a merit based public service).
b) Seek external assistance for buildings and infrastructure.
c) Selection of bursaries to study abroad in countries where the risk of “brain drain” isminimized.
d) Development of practical skills training courses (e.g. secretarial, filing, protocol,mechanics, electricians, hospitality services).
e) Reduction of places in general university courses with limited career prospects.
f) Provision of translation and interpretation services.
g) Accelerated training of translators and interpreters.
h) Provision of language courses in Portuguese and English.
i) Utilisation of existing facilities and partnerships with non-government entities toprovide practical courses in languages, accounting, secretarial, etc. for adults.
j) Selective utilisation of assistance from donor countries and NGOs.
k) Development of a policy for payment of university fees and other forms of usercharges.
Public Administration and Democratisation Policies
a) Clear definition and proclamation (broadcasting) of rights and obligations of citizensand of public servants.
b) Continued search for more efficient ways of organizing the public administration.
c) Improve quality and cost effectiveness of service provision (i.e. a lean and efficientpublic administration).
d) Decentralization and empowerment of communities to manage their local affairs(grass roots democracy).

115
e) Gender equality in all aspects of public administration.
f) Reintroduce Portuguese and introduce Tetun as effective working languages ofParliament and public administration.
g) Enhance the knowledge of members of Parliament.
Security and Defence Forces
a) Prioritise needs and requirements of the Armed Forces.
b) Establish technical and military cooperation agreements with defence branches ofCPLP member countries.
c) Extend support to the veterans of the Resistance.
d) Establish a Defence Ministry or other liaison office at the COM level.
e) Elaborate mandate of the Naval Force, including inter-sectoral coordination, anddefine its development program.
f) Develop specialized police forces (criminal investigation, immigration/frontierservice, rapid response).
g) Establish selection criteria for the security forces, including factors of reliability andsocial suitability.
h) Outsource provision of goods and services to the security services and prisons.
External Relations
a) Initiate and gradually expand the nation’s diplomatic representation in a systematicand planned way.
b) Transform previous networks of solidarity and support for Timorese resistance in thediaspora into a permanent network of allies for the defence of national interests.
c) Pursue and strengthen south–south cooperation.
d) Pursue regional cooperation.
e) Foster special relationship and cooperation with Portuguese speaking countries.
Justice, Human Rights and Gender Equality
a) Create an Ombudsman’s office to raise the level of awareness of citizens’ rights andrespect for the law, to defend citizens from any abuse of power by publicadministration entities and to safeguard against practices of corruption, nepotism andother abuses of power.
b) Draft the legal framework for the nation.
c) Reintroduce Portuguese and introduce Tetun as effective working languages for theadministration of justice.

116
d) Develop the necessary legal capacity to serve the Government by establishing theinstitutions that are essential for the proper functioning of the legal and judicialsystem.
e) Promote reconciliation.
f) Facilitate access to justice for women and develop the legal means to fight violenceand other crimes perpetrated against women.
g) Ensure equal opportunities for women in recruitment and promotion and providetraining in technical and leadership skills.
h) Promote a free press.
PROGRAMS
9.24 The development of an effective administrative and governance structure and capacity toserve the needs and interests of East Timor and its people is one of the most critical nationalpriorities for the next five years and beyond. After centuries of foreign domination, the countryhas been left with out the institutional architecture, the human resources capacity or the requisitephysical infrastructure and equipment, not only to effectively discharge the challenges ofnational development, but also to meet the demands of routine governance. After two years ofcomprehensive effort, political institutions are only nascent; central and regional administrativestructures and institutions fledgling; and the operational systems, procedures, and relationshipsare yet to be developed or clearly defined.
9.25 Given the existing environment, the priority medium term programs will have to be theestablishment and strengthening of the organs of state and of public administration, laying thefoundations of good governance, creating the avenues for popular and community participation,developing the legal and regulatory framework, building the human resources capacity for policyformulation and execution as well as service delivery, strengthening oversight institutions andfostering the press and civil society. After the previous administration there is also a glaring needto develop a new culture of public service, good governance in public administration and astrong work ethic. The formulation of the above programs is, however, only the initial orpreliminary stage. Although there are some mature programs ready for implementation, mostwill require extensive effort and time for their design and implementation.
Public Administration and Governance
9.26 The core programs in this sector will focus on developing transparent governance,institutional and human resources development, decentralization, and development of a leanefficient and merit based civil service.
Transparent governance
a) Development of information programs for the general population and for civilservants regarding the activities of Parliament, the functions of each Ministry, theservices that citizens have a right to expect from public institutions and the courses ofredress available in case of non-compliance.
b) Introduction of an action program to enhance the skills of Members of Parliament, viatechnical assistance, specialized courses of study and experience-sharing visitsabroad.

117
c) Development of a medium and long-term program for the reintroduction ofPortuguese and introduction of Tetun as effective working languages of Parliamentand government.
Institutional Development
a) Design and introduce effective administrative regulations, systems, and proceduresfor all public service institutions.
b) Develop civil service regulations governing recruitment, working conditions, careerpaths and a code of conduct.
c) Develop a training program for the civil service to enhance capacity.
Decentralisation and Participation
a) Study and introduce an optimal sub-national configuration conducive fordevelopment as well as service provision in conjunction with stakeholders.
b) Study and delineate the levels of administrative hierarchy down to the communitythat will facilitate cost effective and efficient service delivery and enhancecommunity initiative and participation.
c) Study options for effective decentralization that clearly defines the roles of central,regional, local and community, and civil society organizations and entities; empowerscommunities and strengthens transparency and grass roots democracy.
Media Development
9.27 Create public enterprises in radio and TV broadcasting, in accordance with theConstitution, and train media professionals.
Security and Defence Forces
9.28 In the area of defence and security the formation and consolidation of a modelprofessional army to defend the sovereignty and territorial integrity of the nation and, similarly, apolice force to maintain internal law and order are the major programs.
Defence program
a) Development of a model professional army through the continuation of the process ofrecruitment, training and equipping.
b) Supporting the process through cooperation agreements with other countries.
c) Establishment of a Defence Ministry or other liaison office at the level of the COM.
d) Program to identify the veterans of the Resistance, study their needs, and formulatetraining and other forms of assistance.
Police and Security Service Programs
a) Strengthening of the police service by training an additional 520 new recruits at thePolice College and by improving the material support to those already deployed.

118
b) Establishing new specialized units (criminal investigation, border patrols, rapidresponse).
c) Formulating outsourcing modalities and incentives for provisioning the prisons andsecurity services that facilitate participation by local firms.
External Relations
9.29 Diplomacy and external solidarity was one of the most effective pillars of the Resistance.At this new chapter in East Timor’s history, the medium term diplomatic programs and externalwork will be directed at building on this experience, and our extensive solidarity network, tomaintain the strong international support and empathy to address our long term national needsand interests. Programs will, therefore, focus on developing the necessary institutional andhuman resource capacity to chart and implement the policies and programs that will enable us tomarshal their extensive external assets and to deal with the ever-evolving global and regionaldevelopments.
Capacity Building Program
9.30 The main components of this program are as follows.
a) Recruitment and training, in country and abroad, to staff Headquarters and Missions.
b) Construction of a Headquarters building.
c) Development and implementation of a plan to utilize previous networks of support toTimorese resistance and diaspora organizations, transforming them into a permanentnetwork of allies abroad in defence of Timorese interests.
d) Elaboration and implementation of a plan to gradually and systematically expanddiplomatic representation abroad. Utilisation of various options and modalities toachieve wider representation.
Policy Development Program
a) Articulate global and regional policies to safeguard and serve the national interest onthe bases of the guiding principles and in light of external developments and trends.
Action Program
a) Develop, in collaboration with other relevant ministries and institutions, actionprograms relating to the attraction of foreign investment, promotion of exports andforeign trade, and external aid to guide the activities of the ministry. Develop similaraction programs regarding political, cultural and defence and security relations.
b) Develop a program to reinforce south-south cooperation.
Justice, Human Rights and Gender Equality
9.31 The justice system, both in its legal framework and its administration, is of criticalimportance to society at large and the development process in particular. In this unique situation,where the legal framework is defined by its practical non-existence and where the capacity forthe formulation and administration of the body of laws is in its embryonic stage, the issue ofprioritization and sequencing becomes of extreme importance. It thus becomes necessary to, on
119
the one hand, seek a longer time frame to develop the body of laws and the capacity, and, on theother, to put interim arrangements or solutions in place. The elaboration of the followingprograms of the Ministry of Justice will require extensive time and effort.
Institutional Development Program
a) Creation of an Ombudsman’s office to raise the level of awareness of citizens’ rightsand respect for the law, to defend citizens from any abuse of power by publicadministration entities, and to safeguard against practices of corruption, nepotism andother abuses of power.
b) Creation of a Judicial Training Centre and a Public Defender’s office, as independentagencies.
c) Establishment and implementation of a timetable for setting up functioning registrarand notary services, including modalities to ensure that such services are madeavailable to the population in the interior of the country.
Legislative Program
a) Formulation of a legislative agenda for the Government indicating the sequence of thedesired legislation and the internal and external resources, as well as time required todraft such legislation. This agenda will include, among other laws, National DefenceLaw, Company Law, Land Law, Investment Law, and Media Law.
b) Development of the capacity to prepare proposals for legislation, draft legislation andto prepare legal opinions and advices, as required by effective government.
Reconciliation Program
a) Promotion of reconciliation activities, with the support of the Reception, Truth, andReconciliation Commission, the Church and civil society.
Rights and Equality Program
a) Capacity building for women’s participation in leadership and decision makingthrough training in order to stimulate skills for decision making, negotiation, politicsand other leadership areas.
b) Ensuring gender balance through recruitment, elimination of constraints anddiscrimination against women and integration of gender issues in all laws, programsand policies.
c) Promotion of family-friendly policies that promote appropriate measures to facilitatethe family and professional lives of women and support their participation in publiclife.
d) Promote legal protection from violence against women through adoption oflegislation, access to the judicial system and creation of institutional mechanisms inorder that women and girls are able to denounce acts of violence. Promotecooperation between authorities and social support programs and involvement ofwomen in protection services.

120
e) Encourage social change regarding violence against women through analysis ofcauses and consequences, and the development and promotion of educationcampaigns.
f) Develop protection services through the creation of refuge centres and supportsystems for victims of violence and by creating programs for protection, assistanceand training for refugee or displaced women to facilitate their reintegration into theircommunities.
121
10. POVERTY REDUCTION, RURAL ANDREGIONAL DEVELOPMENT
VISION
10.1 That the people of East Timor live in a prosperous society, comfortable interms of food, shelter and clothing, in safety, and free from illness and ignorance(illiteracy); with an income that is fair and equally distributed; with nodiscrimination; and with a balanced development of towns and villages anddifferent areas.
INTRODUCTION
10.2 The Poverty Reduction and Rural and Regional Development WorkingGroup was co-chaired by the Minister for Internal Administration and theSecretary of State for Labour and Solidarity. Representatives of all thedepartments/sections in the Ministry of Internal Administration and the Secretaryof State for Labour and Solidarity took part in the Working Group. Also, officialsfrom a number of other Ministries including Agriculture, Education, Health andFinance participated in the Working Group. The output of the Working Group ispresented in the following paragraphs.
Poverty Reduction
10.3 Poverty is multidimensional and is experienced in different ways bydifferent people. The usual measure of poverty is the headcount ratio, which is theproportion of people living below the national poverty line. Adapting themethodology used in other countries, the poverty line for East Timor is estimatedto be US$0.55 per person per day in September 2001. It incorporates a foodcomponent (2,100 kilocalories) and a non-food component covering, amongothers, expenditures on education, health, clothing and housing. The data showthat more than two-in-five (41 %) East Timorese are below the poverty line.
10.4 Other dimensions of poverty include education, health, water supply,sanitation, infrastructure including roads and electricity, communications, securityand empowerment. On education, for example, the adult illiteracy rate in EastTimor is high with more than half the East Timorese population unable to readand write. Health indicators show a high mortality for infants and children belowfive years of age. Death of mothers in childbirth (maternal mortality) is also high.Further dimensions relate to security and empowerment. Security includessecurity of person, property, food and livelihood (including jobs andvulnerability). Empowerment involves a lack of “voice” and a limitedparticipation of the poor in decision-making on their future and the affairs of theircommunities on economic, social, cultural and political issues, or a lack ofinvolvement in institutions of society and state. It also involves a lack of freedomto exercise and enjoy basic human rights, essential economic and social rights – tobe productive and creative, enjoying self-respect, and contributing to the wellbeing of the community and the nation.
122
10.5 The incidence of poverty is higher among households headed by those with no schooling(around one-in-two or 49 %), fishers (47 %) and farmers (46 %). Poor households in East Timorare more likely to be large with a low proportion of earners (or a large proportion of children andold people leading to a higher dependency ratio), and have very little land. A large majority (85%) of the 341,000 poor people live in the rural areas of country.
Rural Development
10.6 More than three-quarters (76 %) of East Timor’s population lives in the rural areas.Poverty incidence in the rural areas (46 %) is significantly higher than that in the urban centres(26 %), with Dili and Baucau having the lowest (14 %). The bulk of the country’s poor arelocated in rural areas. Land holdings are small for the majority of the population, with about 24%of households owning less than 0.5 ha each, and a further 60 % between 0.5 and 1.5 ha each. Theproductivity of land is relatively limited, due to low-input, low-output technologies thatemphasise risk minimisation, since crop failure may jeopardise survival of the family. Access tomarkets is difficult. Buyers may be scarce, and unwilling to pay prices that include profits due tohigh costs for transport, storage, and processing.
10.7 Access to basic social services in rural areas is significantly lower than that in urbancentres. For example, access to both primary and secondary schools in rural areas is far lessfavourable than in urban centres. A number of the rural sucos do not have a health post and someare not even served by mobile clinics.1 Most of the qualified medical personnel are concentratedin urban centres, and access to qualified doctors and nurses is virtually non-existent in most ruralareas. Access to safe water, sanitation and electricity, while limited overall, is very low in therural areas. Access to roads and communications is also a major constraint facing rural residents.As a result, many of the income, education and health indicators show a considerable gapbetween rural and the urban areas.
Regional Development
10.8 The nation is divided into three regions, Eastern, Central and Western,2 and 13 districts.Prior to 1999, a Governor headed the East Timor Province, with each of the three regionsadministered by an Assistant Governor. Bupati administered districts, with Sub-districts led byCamats. After 1999, the Government provided for District Administrators and sub-districtCoordinators. However, the roles and responsibilities of these functionaries, as well as the Sucoand Aldeia chiefs, are still evolving. The necessary legislation and regulations are expected to bein place in the next two to three years.
10.9 There are significant disparities between the regions and districts in economic and socialindicators. For example, poverty incidence is high in the rural areas of the Central and Westernregions as compared to the rural Eastern region. Access to public facilities (e.g. schools andhealth centres) is more difficult in the upland areas/districts, as is access to roads and markets.Although the topography is difficult, the agro-climatic conditions in some areas (e.g. in the
1 Mobile clinics and health posts are the frontline health delivery facilities that reach down to the villages, while communityhealth centres (CHCs) are often located at sub-district (posto) headquarters and in the small number of hospitals in the urbancentres of Dili and Baucau. A few CHCs are equipped with a limited number of beds.
2 The Eastern region comprises Baucau, Lautem, Manatuto and Viqueque districts; the Central region comprises Aileu, Ainaro,Liquica and Manufahi as well as Dili districts; and the Western region covers Ambeno (Oecussi), Bobonaro, and Covalimadistricts. A redefinition of the regions is expected after independence.

123
Central region) may be favourable for higher value crops (e.g. coffee, fruits and vegetables) andhave good proximity to markets.
10.10 The Ambeno (Oecussi), Bobonaro and Suai districts face unique problems. Ambeno issurrounded by Indonesia, and access to the rest of East Timor is either by sea or throughIndonesian territory. Given the current state of infrastructure, the costs of linking Ambeno withthe rest of East Timor may be prohibitive in the short and medium term. It will require specificeconomic, trade and social (including language) policies for the district. Similarly, the borderdistricts of Bobonaro and Suai face distinct opportunities and constraints in their relations withthe other districts in East Timor and across the border in West Timor.
10.11 Poverty reduction is a crosscutting issue, addressed in the overall development strategyand in each of the sector strategies, programs and projects. As a result, responsibility for povertyreduction is distributed among a wide range of institutions. Similarly, rural and regionaldevelopment is addressed mainly through macro and sector programs, and several Ministries andDepartments are involved in these efforts. For example, the local government functions are underthe purview of the Ministry of Internal Administration, while the Secretary of State for Labourand Solidarity is expected to facilitate the delivery of assistance to vulnerable groups, dependingon resource availability.
GOALS
10.12 The overall goals of poverty reduction, rural and regional development, as formulated byEast Timorese are as follows.
a) Transform the subsistence economy and achieve a rapid economic growth that isstable and sustainable, utilising to the full the country’s resources; create equitablebusiness opportunities and increase rural incomes.
b) Deliver training and health services, create equal opportunities to obtain work, andestablish a social safety net to help victims of disasters.
c) Create skilled and professional human resources in accordance with the interests andtalents of the people in each sector, and ensure an effective utilisation of labour.
d) Create a society, which is free from internal and external threats, and make thecountry attractive and safe to citizens and visitors.
e) Reduce poverty in all its aspects, particularly among women and vulnerable groups.
f) Promote integrated rural development to reduce poverty, accelerate economic growth,and reduce the gap between rural and urban areas.
g) Achieve balanced regional development to reduce poverty, improve the lives of EastTimorese in all regions, enhance and exploit complementarities between regions andagro-ecological areas, accelerate economic growth, and reduce regional disparities.
h) Access, maintain, and make available cultural, popular (folkloric) and historicartefacts and government records/materials, for present and future generations of EastTimorese.
i) Promote good governance through: popular participation; responsible and responsivegovernment; a competent, efficient, accountable and transparent civil service;

124
decentralisation and devolution; a socially responsible private sector; and transparentand accountable civil society organizations.
GUIDING PRINCIPLES
10.13 Promoting rural and regional development within a framework for poverty reduction andeconomic growth in East Timor will be based on the concept of sustainability, and on thefollowing principles.
a) Participatory Development
• Empowerment of rural people, enabling them to participate, contribute ideas, andmake and implement decisions regarding their needs in terms of the policies andprograms they have chosen.
• Ensuring the involvement of individuals and communities in all villagedevelopment activities in rural areas.
b) Integrated and Equitable Development
• Development to be undertaken in an integrated manner between the varioussectors, so that it spreads evenly from the centre to the districts and to lowerlevels.
c) Equality and Non-Discrimination
• Development to respect equality and human rights without racial, religious,gender or ethnic discrimination, in accordance with the Constitution of EastTimor.
d) Social Solidarity
• Development to be based on principles of social solidarity among the people,including assistance to vulnerable groups.
• Development to take place within a framework that can create democratic andsocial conditions conducive to raising the living standard of the poor, and ofvulnerable groups.
e) Professionalism
• Poverty reduction to be based on principles of professionalism, such asdedication, honesty, commitment, transparency, creativity, innovation,effectiveness and efficiency.
f) Environmental Protection
• Development to be based on a respect for, and a desire to protect theenvironment, and the use of natural resources in a sustainable way.
g) Preservation of Culture
• Development to uplift, rather than erode, the nation’s cultural heritage and values.

125
h) National unity, peace and hard work
• Development to promote national unity, peace and reconciliation and theinstilling of a strong work ethic
KEY DEVELOPMENT INDICATORS
10.14 The key development indicators identified by the Working Group on Poverty Reductionand Rural and Regional Development overlap to a large extent with those presented in Chapter 2on Vision, Goals, Principles and Indicators (Annex 1), with a detailed breakdown by gender,rural and urban areas, regions and districts, and income groups (poor and non-poor) whereverappropriate and feasible. They cover the standard indicators including GDP per capita, ratio ofincome of the richest 20 % to the poorest 20 %, Gini coefficient of inequality in incomedistribution, labour force and employment, poverty incidence, access to and use of education andhealth services and safe water and sanitation, housing, electricity and communications. They alsoinclude security and empowerment.
PROBLEMS AND CONSTRAINTS
10.15 The problems and constraints for poverty reduction and rural and regional developmentare grouped under the broad headings of resource constraints, labour, social and gender areas,capacity, infrastructure, rural-urban and regional disparities, civil service, private sector, legalframework and governance.
Resource Constraints
a) Shortage of animals.
b) No means to lift and/or pump water for irrigation.
c) Inadequate agro-processing facilities.
d) Lack of capital.
e) Lack of, or limited markets.
f) Lack of economic opportunities.
g) Limited economic support services.
h) Lack of growth centres.
i) Lack of opportunities for remunerative work.
j) Shortage of labour during critical periods.
k) Discrimination in access to work opportunities.
l) Lack of information on employment and unemployment, and on labour issues such asworkplace safety.
126
Social Aspects
a) Lack of social accountability.
b) Informal institutions weakened during the occupation and violence, with no formalsocial institutions set up during the transition period.
c) Lack of awareness of rights and responsibilities (civic education).
d) Lack of willingness to take initiatives and break the cycle of dependence.
e) Political and social divisions.
f) Political disturbances.
g) Social turmoil.
h) Lack of, or weak social cohesion and solidarity.
Gender aspects
a) Discrimination against girls and women.
b) High unemployment rate, especially among women.
c) Low wages especially for women.
d) Lack of professional skills among women, especially young women.
e) Lack of training facilities for women.
Capacity
a) Lack of teachers and trainers.
b) Limited capacity within Government, private sector and civil society organisationsincluding NGOs.
c) Limited capabilities or skills among people in general, and poor people in particular(e.g. literacy) in the villages.
d) Lack of knowledge of industry.
e) Lack of skills to start and operate businesses.
f) Illiteracy, including inability to manage money.
g) Inadequate number of personnel.
h) Limited capacity of existing personnel.
i) Traditional low-input, low-output technologies.
127
Infrastructure
a) Lack of appropriate and essential facilities, equipment and supplies, includingmedicines.
b) Inadequate number of public facilities, such as schools and health centres.
c) Inadequate, and limited access to infrastructure.
d) Poor maintenance of existing infrastructure.
e) Access to other parts of the country difficult and/or costly.
Rural-urban and regional disparities
a) Limited access to relatively lower quality social services (including education, health,water supply, sanitation, and housing in rural areas, as compared with urban centres.
b) Regional disparities in educational achievement and opportunities (e.g. Baucau hasthe largest number of schools in the country whilst some of the other districts havevery few schools).
c) Civil service with very limited presence in regional areas.
d) Lack of articulation of values and principles on the “service” role of civil service.
e) Limited capacity within civil service.
f) Limited number of civil servants.
Private sector
a) Lack of policies and programs to develop entrepreneurship and support for privateenterprise development.
b) Lack of competition in the private sector.
c) Legal framework
d) Lack of legislation and regulations in areas such as immigration and labour.
e) Lack of national support and advocacy on behalf of susceptible groups in legaldifficulties. Outmoded laws.
f) Inadequate capacity (number of personnel, skills, institutions, facilities andequipment) in the judiciary, legal professions and the police force.
g) High cost (financially and in time) of justice.
h) Lack of well-defined property rights, especially for land.
Governance
a) Lack of coordination and cooperation between government and non-governmentinstitutions.
128
b) Vested interests aiming to grab much of the public resources.
c) Uncertainty regarding security and the nature of government and/or governanceamong the population.
d) Crime.
e) Lack of institutional mechanisms for coordination in different districts and/or regions.
f) Lack of targeted support to meet the needs of children and the disabled.
g) Lack of plans for district development, based on comparative advantages.
h) Lack of criteria for allocation of resources to districts.
i) Lack of capacity at district level to account for funds allocated.
j) Lack of transparency.
k) Inadequate accountability mechanisms.
l) Long colonial past with highly centralised decision-making in government.
m) Lack of understanding of the Portuguese language among many administrators.
n) Legacy of bribery and corruption
o) Political favouritism in civil service recruitment.
p) Political influence in allocation of funds.
q) Corruption.
STRATEGIES AND POLICIES INCLUDING PROGRAMS AND PROJECTS
10.16 The proposed strategies are outlined below, together with suggested programs, projects,policies and legislation for the achievement of each strategy necessary for the attainment of thestated goals. Several proposed programs overlap with those proposed by other Working Groups,particularly in areas such as agriculture. The annual action plans of Ministries must take accountof the activities of other Ministries and agencies of Government.
POVERTY REDUCTION
10.17 The overall strategy for poverty reduction is presented in Chapter 4. As poverty reductionis an overarching goal, it is mainstreamed into the sector chapters. A sample of these areenumerated in the following.
CREATING ECONOMIC OPPORTUNITIES
10.18 The strategies for creating economic opportunities are included mostly in the sectorchapters, especially on Agriculture, Fisheries and Forestry and Industry, Trade and the PrivateSector. The specific strategies formulated by the Poverty Reduction and Rural and RegionalDevelopment Working Group include the following:

129
a) Transformation of the non-farm subsistence economy through small-scale, home andcottage industries and other business activities that generate income for the poor.
b) Provision of skills training and guidance to increase the ability of the poor inmanaging small businesses so that they become self-reliant.
c) Increased production in the rural areas through the application of appropriate farmingtechniques and promotion of agro-industries.
d) Identification and development of potential markets for products inside and outsidethe country
10.19 The policies that are conducive to promoting the above include those on micro finance,and policy or guidelines on small-scale, cottage and village industries. For example, the lattermay include exemption from licensing, taxes and other restrictions; while enforcing theobservation of hygiene, health and environmental regulations. The types of programs andprojects visualised are listed in the following:
a) small-scale industries promotion program
b) household and cottage industries promotion program
c) hawkers and vendors (petty trade) program
d) micro credit or micro finance programs and projects
e) training programs for small-scale, home and cottage industries
f) project to strengthen technical and vocational education.
g) bee keeping and honey production (apiculture) project
h) production of tais, bags and baskets project
i) production of small tools including agricultural implements project
j) production of packaged food such as peanuts and shrimp/fish crackers project
10.20 The performance indicators are:
a) number of new small and micro enterprises established and operating by gender ofowner/operator
b) increase in non-farm income of poor and low-income households
c) number of borrowers under micro credit schemes by gender
d) average amount of loan per borrower in micro credit schemes total and by gender
e) number of training programs conducted
f) number of trainees by gender
g) number of trainees graduating from technical and vocational education trainingprograms and number employed by gender

130
10.21 In addition, the Working Group proposed other training for farmers and fishers in suchareas as improved crop husbandry, irrigation management, livestock raising and veterinary careand fishing and aquaculture. The policies, programs and projects overlap with those in othersectors. In operational terms, most of the activities are covered in other sectors includingIndustry, Trade and the Private Sector and Agriculture, Fisheries and Forestry.
PROVIDING SOCIAL SERVICES
10.22 The strategies, programs and projects on provision of education and health servicesproposed by the Poverty Reduction and Rural and Regional Development mirror those presentedin Chapter 10 on Social and Human Development: Education and Health, while those on watersupply and sanitation and housing are covered in the relevant sections of Chapter 15 onInfrastructure.3 The specific additions proposed include programs to increase the skills of thepeople in general and the poor in particular; and to create networks between the Government andnon-government institutions that are active in the delivery of education and training services tosociety.
ENHANCING SECURITY INCLUDING DISASTER PREPAREDNESS AND SAFETY NETS
Security
10.23 The country has been emerging from the 1999 violence and turmoil. There is stilllingering insecurity, mistrust and friction from the occupation and resistance movement. Also,political social divisions and some uncertainty about the scope of government security afterindependence prevail. The Plan proposes the creation and strengthening of family andcommunity consciousness to increase the sense of solidarity, and create safe and peacefulconditions. The specific interventions under the strategy include programs and projects for:
a) intelligence gathering and pre-emptive actions to prevent and combat crime.
b) involving communities in monitoring potential risks.
c) investigating and solving crimes as soon as possible.
d) strengthening community solidarity through the creation of a system of protectingpeople, which is participatory and responsible.
e) supporting people to be active in guarding the security and public order in residentialareas in all areas (rural and urban) of the country.
f) strengthening the capacity of the community to withstand and overcome disturbancesand challenges (e.g. through provision of financial resources, equipment and trainingto communities/areas prone to such disturbances).
g) establishing an early warning system with the involvement of the people to identifypotential security and social disturbances and evolve measures to prevent them.
h) organising campaigns on civic education and social solidarity
3 For example, the Poverty Reduction and Rural and Regional Development Working Group identified health programs such as rehabilitation andexpansion of health facilities, health personnel training, supply of health equipment and essential medicines, immunization, and amelioration ofvitamin and micronutrient deficiencies among children and pregnant and lactating women. However, these programs are an integral part of thePlan interventions proposed under the Health Sector in Chapter 11.
131
i) mobilising traditional institutions and leaders to promote social cohesion
j) instilling family values through schools and other means.
10.24 Many of these activities fall under the purview of the Ministry of Internal Administration,especially the Department of Local Administration and Police and Security Forces. Theperformance indicators include: (i) reduction in number of crimes reported, (ii) number of crimessolved and average time taken to solve the crimes, (iii) number of neighbourhood watchcommittees established, (iv) number of communities trained and supported including averageamount of support provided, (v) number of early warning groups established, (vi) number ofpeople reached by civic education campaigns by gender, (vii) number of leaders contacted andtrained in promoting social cohesion, (viii) number of courses conducted in schools on familyvalues and civic education and number of students covered, and (ix) number of people andcommunities organised to participate in community safety and peacekeeping by the police.
Disaster preparedness
10.25 It is recognised that in the medium term the resources and capacity at the Government’sdisposal are extremely limited to provide direct assistance to vulnerable groups. Therefore, muchof the focus in the Plan is on preventative measures and strengthening the self-reliance of societyto care and share and cope with disasters and other contingencies. The programs and projectsinclude the following:
a) setting up early warning systems to gather and disseminate information on floods,droughts, landslides, etc. These could be simple systems at the village, posto anddistrict levels under a national centre.
b) compiling information on how communities have coped with disasters in the past(e.g. through the National Archives) and examine whether similar practices could beadopted.
c) creating a network to strengthen the preparedness of society in facing and coping withdisasters.
d) organizing communities prone to disasters to help themselves through setting upcommunity food banks, stocks of other materials, etc.
e) encouraging religious organizations and other voluntary groups including NGOs toset up mechanisms to monitor and assist.
f) establishing a national disaster prevention and preparedness group (includingrepresentatives from local and international organizations) to plan and coordinate theactivities.
g) making provision in the government budget for assistance to victims of disasters.
h) providing support to victims of disasters including emergency aid and support forrehabilitation/reconstruction of houses.
i) recruiting and training SATGAS who will deal with disasters.
10.26 The disaster preparedness functions mentioned above are the responsibility of theMinistry of Internal Administration. The performance indicators include: (i) early warningsystem established, (ii) number of food banks and other community storage established to cope

132
with disasters, (iii) number of religious groups and NGOs mobilised to participate, (iv) nationaldisaster prevention and preparedness group established, (v) amount of money allocated inGovernment budget for disaster preparedness, (vi) number of disaster victims helped and averageamount per victim, and (viii) number of SATGAS recruited and trained.
Vulnerable groups
10.27 The strategies comprise the (i) provision of assistance to vulnerable groups such aswomen in difficult circumstances (e.g. widows and victims of violence), the elderly (old people),veterans of the resistance movement, refugees, destitute (very poor) families and prisoners torecover and lead satisfying lives as full members of society, (ii) establishment of a specialfacility for the service of children and the disabled, (iii) organisation of coordination,consultation and joint work between NGOs and the church in the framework of providingservices to vulnerable groups, and (iv) formation of a working group to advocate on behalf ofvulnerable groups who are facing legal problems.
10.28 The proposed programs and projects include the following:
a) a campaign to stop violence against women and children.
b) counselling and assisting female victims of violence who are socially andeconomically vulnerable.
c) supporting the elderly with essentials such as food and clothing and organizingrecreation groups.
d) providing assistance to veterans in the form of training, credit and other supportservices.
e) supporting refugees and displaced people by returning them to their original places ofresidence, providing food, clothing, shelter in the transition, facilitatingreconciliation, and providing the means to re-establish their lives and livelihoods.
f) social service programs for children.
g) helping the disabled (physically challenged).
h) assisting the school system to provide school supplies and equipment for neglectedchildren.
i) scholarship/bursary programs for orphans and children from poor families thatdemonstrate good academic potential.
j) training programs in computers and sewing for the disabled.
k) providing economic support to the disabled.
l) improving the situation of destitute people through provision of food and other basicnecessities and housing materials.
m) supporting prisoners and former prisoners including training and skills development,counselling and resocialization.

133
n) establishing a mechanism (working group) to provide legal advice and support to thevulnerable groups in need of such advice.
o) setting up a consultation and coordination mechanism and organize joint programsbetween government, church, NGOs and other groups on provision of services tovulnerable groups.
10.29 Many of the activities proposed above are expected to be undertaken by the SocialAffairs Department in the Secretary of State for Labour and Solidarity, while the rest will beimplemented by other Ministries/Departments (e.g. Education and Justice). However, theGovernment budget situation is not adequate to provide any significant resources to fund theactivities in the next two to three years. Accordingly, it is proposed to include the activities in theannual action plans as budget resources become available.
Empowering the people
10.30 The country had experienced for almost a quarter century, the lack of awareness andinterest on the part of civil servants in involving people in the development of the country. It alsocreated an attitude among the people not to take initiative and to depend on the government. It isimportant to break this cycle of dependence. The development strategies include: (i)strengthening and sustaining the political will in the government to support policies andendeavors for poverty reduction, (ii) liberating society from all social and cultural impedimentsthat constrain development, (iii) strengthen formal and non-formal local social institutions, and(iv) promoting popular participation, especially of the poor and other vulnerable groups ineconomic, social and political processes.
10.31 The programs and projects proposed to translate the above strategies into action includethe following:
a) organise advocacy groups (e.g. NGOs) to promote and sustain governmentcommitment to poverty reduction.
b) organise citizens groups to watch and monitor how public resources are beingallocated and spent, with particular attention to poverty reduction.
c) inform people of the successes and failures of government interventions, especiallyon poverty reduction programs.
d) promote the strengthening of informal social institutions such as community mutual-help groups, farmers groups, irrigation/water user groups, fishers groups andwomen’s groups, through facilitation and organization.
e) establish and strengthen formal social institutions such as cooperatives, savings andloan associations and marketing groups (e.g. coffee marketing), and religious andinterest groups (e.g. labour unions).
f) introduce programs to facilitate the formation of the poor into groups, providetraining and help undertake economic, social and advocacy activities to advance thewelfare of the groups.
g) formulate and implement legislation to allow the formation, registration andfunctioning of various groups within the law and without violating the rights of othergroups or citizens.

134
h) discourage social and cultural practices such as spending beyond one’s means, orbride price, through civic education with the involvement of community leaders andprominent persons. Consider introduction of legal measures to curb harmful practices.
i) undertake community animation and confidence building programs usingparticipatory approaches such as that adopted in the Participatory PotentialAssessment.
10.32 The responsibility for implementation of the above activities will be spread acrossvarious Ministries/Departments. Some of the programs and projects are already included in theSector Plans, while others would need to be incorporated in the annual plans.
Gender dimensions
10.33 The strategies include:
a) the creation of equal opportunities to obtain work including the conditions that have apositive effect on the working conditions and income of women workers in the formaland non-formal sectors, through a:
• program to create an enabling environment for employment of women inremunerative jobs (including incentives to employers).
• program of child care (day care) centres for working women with children.
• policy favouring employment of women.
• policy and guidelines on workplace facilities for women (e.g. child care centres,separate washrooms and recreation areas).
• law against discrimination against women in employment and wages.
• law against harassment of women in the workplace.
b) provision of training to women in general and young women in particular in a numberof skills/fields (e.g. management, enterprise development and informationtechnology) at the national, regional and local levels to facilitate their participation ineconomic activities, including
• professional training programs for women in such areas as management,enterprise development and information technology at the national and regionallevels.
• establishing and strengthening professional training facilities for women atdifferent levels.
• training programs for women at the suco and aldeia levels suited to the localcircumstances (e.g. availability of raw materials and supplies and support servicessuch as electricity and credit) and markets for the products and services theyproduce.

135
c) establishment and strengthening of a network of businesswomen through policies tosupport private enterprise, women’s organizations, cooperatives and groups, to enablewomen to help themselves and other groups. These include a:
• project to establish network(s) of businesswomen.
• project to establish and/or strengthen women’s groups.
• program to establish and/or strengthen women’s cooperatives.
• project to support East Timorese women’s groups to establish contacts andnetworks with similar groups in other countries in the Asia-Pacific region, and inother parts of the world.
10.34 The above activities will be mainstreamed into the programs and projects of relevantMinistries. The performance indicators, which may be monitored by the relevant Ministries aswell as the Office of Promotion and Equality, include the following:
a) increase in number of women employed in formal private sector.
b) institution of policy favouring employment of women.
c) new workplace facilities for women (e.g. child care centres, separate washrooms andrecreation areas).
d) enactment of law against discrimination against women in employment and wages.
e) enactment of law against harassment of women in the workplace.
f) number of professional training programs for women and number of women trainedin each discipline.
g) number of training programs for women at the suco and aldeia levels and number ofwomen trained.
h) number of networks of businesswomen established and number of members.
i) number of women’s groups established and/or strengthened and number of members.
j) number of women’s cooperatives established strengthened and number of memberscovered.
RURAL DEVELOPMENT
10.35 Goal: Promote integrated rural development to reduce poverty, accelerate economicgrowth and reduce the gap between the rural and urban areas.
10.36 The strategies include the following:
a) Empower the rural people through education and organizational skills training.
b) Strengthen the economic base of the communities and enhance productivity.
136
c) Improve access to infrastructure and markets.
d) Improve the protection and sustainable use of natural resources (e.g. land, water,forests, fisheries and minerals, but excluding oil and gas) and the environment in thecommunities.
e) Reduce the gap between urban centres and rural areas in economic opportunities,provision of social services and infrastructure (including communications).
f) Promote development of urban areas and other growth centres.
10.37 The policies, programs and projects proposed for rural development are:
a) Integrated community education, training, information and communications program.
b) Program to strengthen the autonomy and self-reliance of village communities.
c) Policy on local government/governance at the suco and aldeia levels.
d) Integrated community economic development program.
e) Integrated community services development program covering such areas as health,education, water supply, sanitation, agricultural extension and veterinary services.
f) Integrated community infrastructure development program.
g) Programs for community management of infrastructure maintenance.
h) Programs for community protection and the use of public resources, such as forestsand fisheries.
i) Policy/legislation on community management and the use (sharing of benefits) ofpublic resources, such as forestry and fisheries.
j) Law prohibiting the delineation and privatisation of community and commonproperty resources.
k) Laws regulating the management and use of natural resources and protection of theenvironment.
l) Programs to encourage dispersal of investments to areas close to urban centres, and toareas appropriate for resource endowments and products (e.g. coffee processing).
m) Programs to improve the quality and quantity of social services in rural areas, with aparticular focus on the poor, women and other vulnerable groups.
n) Programs to improve the rural infrastructure (including farm to market roads, andrural electrification) and communications.
o) Dili development program.
p) Urban centres development programs.
q) Programs to develop markets and growth centres in highlands.
r) Programs to develop markets and growth centres in lowlands.

137
s) Policy on urban development and city/municipal governance (government).
t) Policy on rural-urban migration.
u) Policies on markets and growth centres.
10.38 The above policies, laws, programs and projects are either implicitly or explicitlyincorporated in the relevant sectors including Agriculture and Infrastructure. The importance ofintegration of the various development interventions to ensure complementarities (avoidduplication) and enhance the impacts is emphasised. Relevant performance indicators for theactivities have been formulated and presented in the sector chapters.
REGIONAL DEVELOPMENT
10.39 Goal: Achieve balanced regional development to reduce poverty, improve the lives ofEast Timorese in all regions, enhance and exploit complementarities between regions and agro-ecological areas, accelerate economic growth, and reduce regional disparities.
10.40 The strategies formulated by the Working Group to achieve the above goal include thefollowing:
a) reduce imbalances in education, organisational skills and institutional mechanisms fordevelopment between the regions/districts.
b) strengthen the economic base of the districts, taking into account their resourceendowments (land, agro-climatic conditions, people and their skills, etc.), enhanceproductivity, and enhance complementarities between districts/regions.
c) improve access to infrastructure and markets in regions/districts that are relativelydisadvantaged.
d) allocate central (national) government resources to district(s) based on population,land area, present level of development and other specific problems which the districtfaces to ensure equitable sharing and promote balanced development of all districts.
e) develop districts and areas with specific problems – i.e., Ambeno (Oecussi),Bobonaro and Covalima districts, and Atauro and Jaco Islands.
10.41 The policies, programs and project proposed are:
a) programs to strengthen and expand education and skills training opportunities inrelatively disadvantaged regions and districts.
b) program to strengthen the organisational skills of government, private sector and civilsociety organisations in regions/districts that are relatively disadvantaged.
c) program to create and/or strengthen institutional mechanisms for coordination ofdevelopment activities in regions and districts that are relatively disadvantaged.
d) formulation and implementation of district and/or regional economic developmentprograms, with particular attention to agro-ecological and human resource areas.
e) program to adapt appropriate technologies for improving productivity.

138
f) tailor-made training and extension programs to enhance the skills of people (e.g.farmers and small entrepreneurs in agro-industries, marble/mineral extraction).
g) programs of economic support services including rural electrification, input supply,marketing, etc.
h) integrated infrastructure development program in relatively disadvantaged districts.
i) strengthen the capacity of district administrations in finance and management.
j) devise policies to raise additional resources from both internal and external sources.
k) devise criteria for allocation of resources among districts, taking into account theircurrent state of development.
l) law on local government, specifying the roles and responsibilities of district andlower level government administrations.
m) program to develop Ambeno district, including land and sea transport linking it withthe rest of the country.
n) program to develop Bobonaro district.
o) program to develop Covalima district.
p) program to develop Atauro Island.
q) program to protect and develop Jaco Island for eco-tourism and bio-diversityresearch.
r) policy on border trade and the flow of people between Ambeno district and WestTimor.
s) policy on border trade and the flow of people between Bobonaro and Covalimadistricts and West Timor.
t) policy on development of Atauro Island.
u) policy on conservation, protection and use of bio-diversity in Jaco Island.
10.42 Many of the activities proposed above require clarifications on the coverage/boundariesof the regions and the roles and responsibilities of local government entities and personnel at thedistrict, sub-district and lower levels. The Ministry of Internal Administration will be animportant actor in helping to clarify these and formulating the local government code or law.Also, the Ministry would have to coordinate many of the activities. The promotion of regionaldevelopment may be spearheaded by different line Ministries such as Agriculture depending onthe resource base and comparative advantage of the districts/regions.
CIVIL SERVICE
10.43 Goal: Strengthen the capacity of civil service at the national and local levels and enhanceits efficiency, transparency and accountability.

139
10.44 The civil service is staffed mostly with people with minimal experience in governmentand governance. It is much smaller than that prior to 1999. Strengthening the capacity of the civilservice is a priority. The policies, laws, programs and projects include the following:
a) program to strengthen the capacity of civil service including inadministration/management, finance and budgeting
b) training of trainers program
c) training programs with adequate representation of different groups such as womenand language groups)
d) curriculum and training materials development projects
e) external training program(s)
f) monitoring and follow-up of trainees project
g) supply of equipment and facilities programs
h) civil service recruitment policy (e.g. to ensure adequate representation of women,social and language groups and regions/districts transparent, fair and merit-basedmanner)
i) civil service reward, promotion and career development policy
j) civil service separation and disciplinary action policies
k) civil service code of conduct, rules and regulations
l) civil service law
m) orientation and training programs to instil the values and principles of serving thepeople within the civil service
n) program to evaluate civil service performance
o) program for the formulation and promulgation of civil service rules and regulationspromoting transparency and accountability
p) program to establish and operate accountability systems and mechanisms within thecivil service
q) program to establish and operate citizen watchdog mechanisms
r) policy on public access to, and disclosure of government information
s) policy on role and accountability of civil service
t) policy on citizen/community mechanisms to monitor the civil service
10.45 The policies, laws, programs and projects will be implemented by the relevant entitiesunder the Ministry of Internal Administration in cooperation with other Ministries andDepartments. Also, citizen participation in monitoring the performance of civil servants inservice delivery and in seeking accountability is important.

140
Immigration Service
10.46 Create an Immigration Service, which is professional and efficient, providing a qualityservice for citizens and visitors.
a) program for recruitment of additional staff
b) training programs, including (English) language training
c) program to provide office facilities (including buildings), and equipment
d) program of technical advice and services
e) program to monitor visitors and immigrants
f) program to establish a database on visitors and immigrants
g) policy on immigration, including visa and other entry requirements
h) policy on immigrants’ rights to work, start businesses, and engage in other activities
National Archives
10.47 The objective is to access, preserve and make available cultural, popular (folkloric) andhistoric artefacts and government records/materials for present and future generations of EastTimorese. The National Archive will acquire, preserve and make available to the public oral,written, film, tape, photographic and other materials through the its facilities.
10.48 Many of the artefacts have been lost or destroyed during the 1975-1999 occupation andduring the 1999 paramilitary violence. There are no records or knowledge of East Timoresematerials taken to other countries including Portugal, other Portuguese-speaking countries andIndonesia. Further, the information on what is available in East Timor is limited. The programsand projects include the following:
a) cultural and historical materials collection program
b) cultural and historical materials and heritage buildings/architecture preservationprogram
c) cultural and historical display and dissemination programs
d) research programs (library and field projects, including archaeological projects)
e) training programs
f) buildings/facilities and equipment supply projects
g) program for accession and preservation of government records
h) policy on culture and heritage
i) policy on the retrieval and repatriation of East Timorese cultural, historic and heritagematerials from other countries
j) policy on accession and preservation of government records
141
10.49 The National Archive under the Ministry of Internal Administration will implement theactivities, subject to availability of adequate resources.
Labour
10.50 The objectives include the improvement in the utilization of labour with equitable reward(wage) system and workplace safety; establishing and maintaining a labour market database,introduction of manpower planning, and dissemination of the information to all interestedparties. The strategies include improving the functioning of the labour market throughemployment exchanges, business (employer) consultation forums, and the media, establishingand maintaining a labour market database, introducing manpower planning, and disseminatingthe information to all interested parties;
a) program for promotion of formation of labour groups/unions to protect workers’rights
b) program for promotion of occupational safety and environmental health
c) project for promotion of job security
d) program for promotion of retirement pension schemes
e) program for promotion of disability insurance
f) program for promotion of mediation/arbitration in labour disputes.
g) minimum wage policy
h) working hours policy
i) policies on leave and other workers’ rights
j) labour law that incorporates internationally accepted (ILO) labour standards andpractices.
k) program to establish labour market database
l) manpower planning program
m) program to strengthen staff capacities
n) program to set up labour market monitoring and information collection offices indistricts
o) program of dissemination of labour market information and manpower plan
p) policy requiring employers to provide information on employment, wages, workinghours, etc., by occupation (skill level)
q) program to establish and operate employment exchanges to match jobseekers withpotential employers
r) program to establish business (employer) consultation forums
s) policy on advertisement of vacancies in the media

142
t) regulation on supply of information on job vacancies to employment exchanges
10.51 The above activities will be implemented by the Secretary of State for Labour andSolidarity in cooperation with other Ministries. The activities will be prioritised andimplemented in phases to respond to emerging needs and demands, subject to availability ofresources.
143
11. SOCIAL AND HUMAN DEVELOPMENT:EDUCATION AND HEALTH
“Meeting East Timor’s basic needs in health and education is vital for the nation’s development, in reducing poverty, promoting economic growth, and
in improving the livelihoods of its population.”
VISION
11.1 Our vision is that by 2020, the East Timorese people will be welleducated, healthy, highly productive, democratic, self-reliant, espousing thevalues of nationalism, non-discrimination and equity within a global context.
BACKGROUND AND STATUS
11.2 Meeting East Timor’s basic needs in health and education is vital for thenation’s development, in reducing poverty, promoting economic growth, and inimproving the livelihoods of its population. Education and Health are the largestsectors, in terms of expenditure, both in 2001-2 and for the foreseeable future.This expenditure reflects the wishes of the population, as expressed in the recentCountrywide Consultation, in which 70% of the population prioritised educationas one of the three most important sectors to be developed for the country’sfuture, followed by health, prioritised by 49%. The PPA completed in January,2002, produced similar results. These views are captured in the vision presentedin this document. In meeting its people’s needs in health and education, however,both government and civil society organisations face formidable challenges.
Education
11.3 East Timor has an illiteracy rate of 50-60%. 46% of the current populationhave never attended school. Almost two-thirds of the female population isilliterate. The primary enrolment rate is low, as are school retention rates.Approximately 20% of children enrolled in primary schools rarely attend classes.There is a substantial shortage of trained teachers, and teaching quality is low. Inthe 2000-01 school year, for example, of the 2,091 secondary school teachers,only 106 had formal secondary school training. The curriculum introduced duringthe Indonesian occupation is viewed by East Timorese students and teachers asoutmoded and irrelevant.
11.4 During the UNTAET period, some increases have occurred in primaryschool enrolment, particularly for girls, but there have been declines in secondaryschool attendance. Tertiary provision and skills training remain grosslyinadequate. The current teacher-student ration in the primary sector is 1:62.
11.5 During the period before oil revenues begin to have an impact, keychallenges to be addressed are:
a) A rapid expansion in primary school enrolment, particularly forchildren from poor households.

144
b) A reduction in the high drop-out rate at primary level.
c) An improvement in teaching quality through the provision of appropriate training.
d) The design and introduction of literacy manuals, and the implementation ofcampaigns to address the low literacy level within the population.
e) A specification of the respective roles to be played by the government, church, NGOsand local communities in the management of education.
f) The development of strategies for the furtherance of the Portuguese language at alleducation levels, and amongst the adult population.
Health
11.6 The heavy burden of disease in East Timor is due largely to the prevalence ofcommunicable diseases such as malaria, tuberculosis, respiratory tract and childhood infections.The current TB rate is 900 per 100,000. Life expectancy ranges from 50-58, and is combinedwith high infant mortality rates of 78-149 per 1,000 live births, and under 5 mortality rates of124-201 per 1,000 live births. Women bear an unacceptable burden of maternal mortality andmorbidity, with maternal mortality rates at 350-800 per 100,000 live births. Only 30% of birthshave any skilled birth attendance. Approximately 3-4% of children aged 6 months to 5 years areacutely malnourished, whilst one in five is chronically malnourished. 45% of children under 5are underweight.
11.7 During the Indonesian occupation, the health system delivered poor quality services, andwas widely mistrusted by the population. During the paramilitary rampage, most health facilitieswere destroyed, and there was a total collapse of the health system.
11.8 During the UNTAET period, access to basic services has been restored, a TB programhas been implemented, immunisation services have been developed for women and children, andbasic health packages have been designed. Health centres have been rehabilitated and re-equipped. A plan has been devised for human resource development, capacity-building, andhealth training.
11.9 The main challenges to be addressed by the health sector are to design and implementpolicies, programs and projects addressing:
g) high rates of maternal and infant mortality
h) a high proportion of illness and death due to preventable communicable diseases
i) the prevalence of malnutrition, iodine and vitamin A deficiency
j) the lack of access to safe drinking water and sanitary facilities for a majority of thepopulation
k) poor reproductive health
l) the prevalence throughout the country of post-conflict mental health problems andtrauma
m) poor and inequitable access to health services

145
n) inadequate management support systems
o) an inadequate referral system
p) poor knowledge of HIV/AIDS among the population.
11.10 In both the health and education sectors, a major challenge is to set clearly-defined,specific priorities in line with available expenditure. A medium term framework has beendeveloped, selecting priority areas that can ensure most successfully the delivery of services to apopulation with continuing high levels of poverty.
Gender
11.11 Women play a vital role in East Timorese society. They manage community resources,households, and constitute a crucial part of the labour force, particularly in agriculture. Yet theyare not adequately represented in positions of power throughout the country. Gender inequalitiesare addressed in many of the objectives, strategies and policies in the national plan. There areparticular gender concerns in human development – notably in relation to women’s levels ofliteracy, training, and health needs. These issues are covered in the particular projects andprograms outlined for the health and education sectors.
GOALS
11.12 The goals for the education and health sectors are to:
a) improve the education and health status of the people of East Timor;
b) contribute to the improvement of the economic, social and cultural well being ofindividuals, families and communities in East Timor; and
c) promote gender equality and empower women in East Timor.
GUIDING PRINCIPLES
11.13 Several principles serve to guide development in education and health, with the followingof particular importance.
a) Human Rights: Human development programs will respect all internationallyrecognized human rights and fundamental freedoms consistent with the East TimorConstitution, including the right to development.
b) Cultural, Religious and Gender Sensitivity: Human development in East Timorwill respect its people’s cultural and religious diversity and enhance equality amongmen and women, by promoting the values of tolerance, dialogue and peacefulresolution of differences.
c) Quality and Relevance: The implementation of human development programs inEast Timor shall promote high standards and ensure that the choices are oriented tothe country’s needs.

146
d) Sustainability: To achieve long-lasting human development, human and naturalresources shall be managed taking into account financial capacity, appropriate andexisting technology.
e) Equity and Accessibility: The provision of education, health and other basic needsshall be fair, affordable and within everyone’s reach.
f) Social Solidarity: Human development programs will promote the values ofcommunity participation, self-help and shared responsibility between government andall actors in civil society.
g) Ethics and Efficiency in Public Service: Public service will be guided by the valuesof courtesy, efficiency, productivity, honesty and high ethical standards in order toachieve full transparency, accountability and public satisfaction.
h) Legality: Given the special circumstances of East Timor as a new nation, humandevelopment will take place within a responsive legal framework and with respect forthe rule of law.
i) Creativity and Innovation: Human development will aim to harness people’snatural creativity and reward innovation.
j) Protection of the Environment: Human development programs will take intoaccount the impact on the environment and promote environmental protection forfuture generations.
KEY DEVELOPMENT INDICATORS
11.14 The key development indicators for the sectors and for particular components of eacharea are as follows.
Education
a) Literacy rate
b) Net enrolment ratio in primary and secondary schools
c) Primary education completion rate
d) School attendance
e) School participation by age
f) School participation rates of richest and poorest quintiles of the population
g) Household expenditure on education at primary and secondary levels
h) Levels of educational attainment
Health
a) Life expectancy at birth
b) Infant mortality rate

147
c) Under 5 mortality rate
d) Maternal mortality rate
Labour
a) Labour force participation rate
b) Unemployment rate
Economic, Social and Culture
a) GDPper capita
b) % of households below the poverty line
c) Income distribution index
d) % of displaced families with access to education and health services
e) % of orphans and widows with access to education and health services
f) % of disabled with access to education and health services
g) % of families with access to radio/television/telephone
h) Number of cultural and civic society associations
i) Voter participation rate
j) Number of street children
k) Number of orphanages
l) Crime rate
m) Suicide rate
n) Number of libraries/Number of people visiting libraries
o) Number of people in receipt of social security
p) Rate of youth participation in social/cultural organizations
Gender Equality
a) Ratio of boys/girls at all education levels
b) Ratio of literate females, urban/rural
c) Percentage of women employed on completion of studies
d) Incidence of domestic violence
e) Female access to health services
148
f) Proportion of females holding decision-making positions, in both public and privatesectors.
PROBLEMS AND CONSTRAINTS
PROBLEMS AND CONSTRAINTS COMMON TO BOTH SECTORS
11.15 Both the education and health sectors face a number of difficulties, some of which arecommon to both sectors, and some of which apply to each sector separately. The commonproblems and constraints are as follows:
Literacy
a) High levels of illiteracy, particularly amongst women
b) Female education plays an important role in health since women make many of thedecisions about the health of the family. Better-educated people know more abouthealthy behaviour and make better choices about childbearing, food distribution andnutrition, personal hygiene and seeking health care. The literacy rate among the adultpopulation is generally low with women lagging behind (54% for men and 40% forwomen).
Culture
a) Lack of awareness of education and health problems, particularly for women. Thereis also a general lack of understanding of education and health benefits.
b) Cultural inhibitions - many people do not seek appropriate health care until it is verylate (due to a preference for traditional practitioners).
c) Girls experience discrimination in access to education due to traditional practices,such as early pregnancy and marriage, demanding household work and the failure ofeducational materials to address gender issues.
Poverty
a) Income levels are related to people’s standard of living, access to food, education andhealth care – the essential elements of health. About 41% of the East Timoresepopulation lives below the poverty line. Poor people are more likely to become ill,remain ill, and discontinue their education.
Poor nutrition
There is a high prevalence of malnutrition, iodine and vitamin A deficiency. Malnutrition isprevalent among infants and pre-school children, as well as pregnant and lactatingwomen. Available information indicates that 3-4% of children aged six months to fiveyears are acutely malnourished, while one in five is chronically malnourished. VitaminA deficiency, iodine deficiency disorder and anaemia are significant problems in childrenand mothers.
Unequal distribution of food and health care in the family favours boys. This is similarly thecase in the areas of education opportunity and health care.

149
Lack of adequate food, directly affecting health, and indirectly, the ability to learn.
Limited knowledge of nutritional practices.
Infrastructure
a) Inadequate infrastructure, lack of available transport, and poor physical facilitiesresult in geographical and social isolation of villages and households.
Quality of services
a) General lack of availability of inputs and materials
b) Low public confidence in both the health and education systems
Resource constraints
a) Inadequate financial resources
b) Inadequate human resources in number and skills
Legal Framework
a) Lack of comprehensive legal framework
b) Inadequate management and support systems
Gender related issues
a) Low level of awareness of gender issues at all levels and sectors
SECTOR SPECIFIC PROBLEMS AND CONSTRAINTS
11.16 A number of problems and constraints are experienced in both the education and healthsectors separately, including the following.
Education
a) Community
• Lack of involvement in school management
• Household and farming needs limiting school attendance – particularly for girls.
• High number of illiterate people
b) Pre-School
• Insufficient number of pre-schools (currently, there are 43 pre-schools)
• Lack of budgetary support from the Government
• Lack of support from both the community and NGOs
c) All School Levels (Primary School to University)
150
• Most six year old children do not enter the 1st grade of primary school
• Students do not complete the six grades in six years
• Lack of support for special school provision
d) Insufficient Number of Schools
e) Low Quality
• Lack of specialized teachers
• Lack of appropriate study material
• Lack of qualified labour force
• Lack of adequate study material
• Very limited access by students to libraries
f) Low Effectiveness and Efficiency of Educational Management
• Lack of strategic planning for documenting and replicating existing good practice(as, for example, in existing pre-school provision and women’s literacy circlesorganised outside the formal sector by NGOs)
g) Sport
• Lack of sports activities in schools and within society in general
• Government has not yet defined its policy regarding Youth and Sports
• No sports managers or relevant technical and human resource capacity
• Insufficient and inadequate sports equipment
h) Curriculum
• The current curriculum is too abstract and arduous
• The curriculum context does not reflect the values and reality of East Timor
i) Youth
• The qualifications held by unemployed youth are not relevant to the currentlabour market
• There are insufficient youth activities
j) Culture
• Lack of experience in articulating cultural values, and in assessing how thesevalues can be expressed most effectively and appropriately

151
• Very few readily accessible museums, libraries and organized historicaldocumentation centres
k) Language Provision
• Difficulties in standardising Tetun and reintroducing Portuguese as a languageofinstruction in a relatively short period of time
Health
a) Major Public Health Problems
• High maternal and infant mortality.
o East Timor has one of the highest rates of maternal mortality in the regionwith estimates ranging to over 800 deaths per 100,000 live births. This isunacceptably high. The infant mortality rate is estimated by the Ministry ofHealth to be 70 - 95 per 1,000 live births, the most common causes beinginfections, prematurity and birth trauma.
• A high proportion of illness and death due to preventable communicable diseasessuch as malaria, tuberculosis, childhood respiratory infections, measles, typhoid,and diarrhoeal diseases.
• A high prevalence of malnutrition, iodine deficiency and vitamin A deficiency.
o As noted above, this is a problem for both education and health sectors.Specifically, for the health sector, malnourished people are more likely to getsick and to die from their illnesses.
• Low access to safe water and sanitation.
o Unhygienic conditions increase people's chances of getting sick and makingtheir illnesses worse. A majority of the population do not have access to safewater and sanitary facilities. They depend on contaminated or unprotectedsources of water. Existing systems for solid and liquid waste disposal areinadequate.
• Poor reproductive health is a major cause of maternal mortality.
o A complex interplay of social, economic, environmental and cultural factors,and limited availability of health care services contribute to poorreproductive health within the population. There is an increasing incidenceof teenage pregnancies with short periods of time between each pregnancy.
• High prevalence of communicable diseases and a rising incidence of non-communicable diseases.
• Poor knowledge of HIV/AIDS among the population.
o HIV/AIDS is a global problem that has potential to have devastating effectson the people of East Timor as they become exposed to the rest of the world.Current knowledge and awareness about HIV/AIDS is low.

152
• Lack of education on oral health.
• Prevalence of post-conflict mental health problems and trauma.
o Currently, mental health services are inadequate. Major mental problemsobserved in post-conflict East Timor include psychosis, acute schizophrenia,suicidal depression and severe trauma-related reactions.
• An increase in environmental degradation, occupational and environmental healthproblems in recent years.
b) Problems Related to the Performance of the Health System
• Poor and inequitable access to health services.
o Much of the population living in the rural areas, does not have easy access tothe health system – due both to geographical inaccessibility and toinadequate provision of infrastructure and transport facilities. Averagewalking time to the nearest health facility is 70 minutes.
• Inadequate management support systems.
o The absence of a regulatory framework – health regulations do not deal withpublic health issues, such as environmental and occupational hazards.
• Inadequate referral system.
o This results in delayed treatment and inappropriate utilisation of healthservices.
OBJECTIVES
11.17 The following objectives address the various problems identified in health and education.
Education
a) Increase the population’s awareness and understanding of basic educational needs,and particularly:
• Reduce the number of illiterate people within the adult population, with anemphasis particularly on women;
• Encourage community and NGO participation, particularly in relation to theimplementation of pre-school education;
• Strengthen the community ownership of education through inclusion of parent,community, student and teacher groups, involving them in the development ofappropriate quality educational provision in local areas.
b) Increase access to education and develop means for ensuring the retention of childrenwithin the school system, at all levels; improve the drop-out rate.
c) Rationalize educational provision in relation to the varying needs of different areas.

153
d) Improve educational provision, particularly through the provision of professionaltraining, notably for girls and women, adults, and groups with special needs.
e) Increase the efficiency of school organization and management.
f) Encourage sports education in schools.
g) Develop a curriculum appropriate to East Timor’s contemporary needs, encouragingthe development of cultural identity, and stressing the importance of the values ofdemocracy, self-sufficiency, national unity and non-discrimination. Developprograms for unemployed youth, and for school drop-outs, providing qualificationsenabling them to re-enter the labour market.
h) Develop extra-curricular occupational programs.
i) Develop forms of culture and art, emphasizing the national identity of East Timor.
j) Re-introduce and develop Portuguese and Tetun as the official languages of EastTimor.
Health
a) Reduce levels of maternal and infant mortality.
b) Reduce the incidence of illness and death due to preventable communicable and non-communicable diseases, including HIV/AIDS.
c) Improve the nutritional status of mothers and children.
d) Improve reproductive health in East Timor.
e) Ensure that all people have access to health services.
f) Ensure the delivery of a minimum health care package at all levels of service.
g) Collaborate with all stakeholders in the health sector to achieve national goals forhealth.
h) Ensure that sufficient and adequate health professional training is undertaken to meetnational requirements.
i) Regulate the employment of all health professionals to ensure minimum standards ofprofessional practice.
j) Provide sufficient referral and tertiary health care services, including laboratorysupport services, to ensure that referral cases are treated effectively.
k) Improve the organization and management systems in the health sector.
l) Increase women’s access both to health information, and to quality health services.
m) Increase the availability of mental and dental health services.
n) Contribute to the improvement of occupational and environmental health in EastTimor.

154
POLICIES
11.18 Based on these objectives the following basic policies will be formulated.
Education
a) Promote mandatory education for all children of school age.
b) Develop primary education for all as the main goal and priority in allocation ofgovernment resources.
c) Create incentive partnerships with the private sector, NGOs, parents’ associations andthe community, to support education at all levels, in pre-school, secondary school,vocational training and non formal education, as well as in university education.
d) Establish a minimum qualification for teachers, such as a university degree. Developadditional relevant specialisations for secondary school, vocational training, as wellas for university teachers and assistants;
e) Mainstream gender concerns in all educational programs and monitor the impact ofthese programs on women’s education, through the development and use of gender-sensitive indicators.
f) Work with relevant sectors/organisations to advocate an improved status for women,promoting equal rights for men and women in access to education.
g) Have as a key policy objective to increase women’s access to information oneducational provision.
Health
a) Emphasise preventive and promotive health care, provided closest to the community,with the additional aim of limiting expenditure on hospital care.
b) Adopt primary health care policies enabling increased accessibility and coverage ofhealth care.
c) Adopt a policy of integrating the health care system with other sectors.
d) Target groups to achieve the greatest health impact (e.g. emphasizing mother andchild health care).
e) Develop health staffing policies appropriate to the needs of the country.
f) Promote access and utilization of basic health services by vulnerable groups.
g) Adopt Integrated Management of Childhood Illness (IMCI).
h) Mainstream gender health concerns in all programs and monitor their impact onwomen’s health, through gender-sensitive indicators.
i) Work with relevant sectors/organisations to advocate an improved status for women,promoting equal rights for men and women in access to health.

155
j) Have as a key objective to increase women’s access to health information and qualityhealth services.
STRATEGIES
11.19 These policies will be realised through the following strategies.
OVERALL STRATEGIES
Education
11.20 In the short term – over a 2-3 year period – strategies will aim to consolidate the effortsand achievements of reconstruction. This will be done through rationalising educationalprovision in relation to the needs of different areas of the country, and by developing humanresources within the educational sector as a whole. Institutional capacity will be strengthenedwithin the ministry, to promote reforms and to plan and develop educational programs.
11.21 In the longer term – over a 5-10 year period – strategies will aim to promote reforms inkey areas of the sector, as well as developing measures for institutional strengthening to achievethe provision of universal primary school education. Curricula will be designed andimplemented, promoting high quality teaching relevant to the needs of East Timor. Institutionalcapacity will be strengthened, with the aim of an efficient management of the overall educationalsystem.
Health
11.22 To meet our goal, strategies will emphasise the importance of primary health care,focusing on prevention and the targeting of underserved areas. Primary health care is a systemof essential health care, based on practical, scientifically sound and socially acceptable methodsand technology made universally accessible to individuals and families in the communitythrough their full participation and at a cost that the community and country can afford tomaintain at each stage of its development, in a spirit of self-reliance and self-determination. Itforms an integral part both of the country's health system, of which it is the central function andmain focus, and of the overall social and economic development of the community. It is the firstcontact point with the national health system for individuals, the family and community, bringinghealth care as close as possible to where people live and work. It forms the first step in acontinuing health care process.
Gender
11.23 Women in East Timor have been suffering from both a national culture of violence, andfrom the results of mass displacement. Both of these increase the feminization of poverty.There are no laws either ensuring the protection of women’s fundamental rights or addressingthe social and cultural obstacles favouring men’s access to opportunities. The goal of promotinggender equality and empowering women must entail changes in attitudes, government socialinstitutions and private sector practices. Our overall strategy is focused on mainstreaminggender and gender equality in all areas, and at all levels of education and health, assessing theimplications for women and men of any planned action in order to ensure that institutions,policies and programs respond to the needs and interests of women as well as men and distributebenefits equitably between women and men.

156
The root cause of gender inequality in human development lies in the social structures,institutions, values and beliefs which create and perpetuate women's subordination. Solutionsshould not aim merely to integrate women in the development process but must also reshape thehuman development agenda, reflecting gender concerns. Consequently, gender objectives ineducation and health must emphasize the need for gender awareness campaigns at all levels, inorder to deal with the stereotypes that are obstacles to a full participation of girls in theeducational process, particularly after secondary school, as well as for the need for formal andvocational training as an instrument of empowerment. In relation to health status, the objectivesof our strategy centre on information and educational campaigns on women’s right to health,involving all key stakeholders, to ensure that women, due to their specific vulnerability –particularly in reproductive health - are not exposed to continued health hazards and risks.
SPECIFIC STRATEGIES
Education
11.25 The strategies that are specific to education are the following.
a) Educational campaigns, focusing on three areas:
• Promotion of the importance of basic education (defined not simply in relation toreading, writing and numeracy, but encompassing a broad range of thinking,conceptualizing, analyzing, participating and learning skills);
• Literacy programs: addressing the range of relevant skills required to enable poorand vulnerable groups to develop basic learning skills and knowledge of issuesrelevant to their daily lives and to their plans for the future.
• Nation-wide campaigns on pre-schooling and primary education, raising theimportance of girls’ access to education.
b) Improving enrolment and attendance
• Educating teachers, community leaders and parents on the importance of theirresponsibilities in securing enrolment and attendance in school of children ofschool age.
• Improving health at schools by providing school snacks as a way of reducingabsenteeism and drop out rates.
c) Rationalising educational provision, by building new schools, increasing school size,and closing redundant schools.
d) Improving teaching capacity, through:
• The training of teachers, in Portuguese/Tetun language.
• Increasing the availability of textbooks and other teaching materials; schoolfacilities must be adequate and sufficient for all levels, including special schools.
• Establishing performance management programs and national examinations.
e) Setting up career plans for teachers and school deans.
157
• Developing programs for institutional strengthening.
• Setting up scholarship programs for school managers and administrators.
• Developing training programs in basic education planning and management forthe different levels of school managers at central, districts and schools offices.
f) Providing equipment for sporting facilities and organizing sport competitions.
g) Developing relevant curriculum and education programs.
• Developing an appropriate curriculum at all levels, which promotes practicalactivities, interaction between teachers and students, relevancy of content tocontemporary East Timorese reality, and takes into account questions of humanrights and gender.
• Developing contemporary programs for education, introducing new learningtechniques.
• Developing and/or improving the quality of text books, other materials, andlearning processes, stressing the importance of eliminating stereotypes associatedwith gender, and adopting a relevant curriculum.
h) Developing appropriate vocational training and distance learning programs.
i) Developing East Timorese concepts of literacy and basic education throughconferences, training programs, and professional development.
j) Developing extra-curricular activities, social and cultural events for East Timoreseyouth.
k) Designing workshops, conferences, and seminars promoting East Timorese culturalvalues.
l) Developing Tetun and reintroducing Portuguese as the official languages ofinstruction.
m) Assisting policy development through inputs into government by internationalexperts, and via conferences, materials, and other documented internationalexperience.
Health
a) Targeting mother and child health by:
• Increasing immunization coverage of all children under five
• Growth monitoring
• Adopting Integrated Management of Childhood Illness (IMCI) and providingtraining at Community Health Center level
• Providing antenatal services close to the community

158
• Upgrading midwifery skills
• Training Traditional Birth Attendants (TBAs)
b) Emphasising health promotion through health education focusing on major healthproblems and targeting community schools, youth groups, and risk groups throughhealth promotion campaigns, training, curriculum integration, media, environmentalhealth education
c) Prevention and control of communicable diseases through:
• Disease surveillance
• Capacity building, including training
• Developing a system of timely detection and control of epidemics/diseaseoutbreaks
d) Improving nutritional status of mothers and children through:
• Micronutrient supplementation
• Promotion of exclusive breast feeding
• Growth monitoring
• Health education on good nutrition
e) Improving management of human resources by:
• Developing a comprehensive human resources development plan
• Training an adequate number of health personnel based on national needs
• Establishing regulatory mechanisms for medical practice and professional ethics
• Developing incentive systems for motivating health personnel
• Optimizing the use of available human resources through appropriate skill mixand productivity improvement
f) HIV/AIDS prevention through:
• Providing Information, Education and Communication (IEC) targeting vulnerablegroups and individuals
• Establishing voluntary counseling and testing
• Encouraging community participation and working with social, religious andwomen’s organizations
• Developing the capacity of health workers and community groups
• Developing the legal and policy framework

159
• Developing support services
• Advocacy work with key stakeholders, such as churches and women’sorganisations
g) Promoting reproductive health through:
• The creation of awareness on STI and other reproductive health problems
• Sex education in schools, media and health facilities, and youth centres
• Promoting the benefits of family planning
• Early detection, diagnosis and treatment of breast cancer, cervical cancer,STI/HIV
h) Improving access to, and utilization of health services particularly by vulnerablegroups through:
• The construction of new facilities
• Rehabilitation of existing facilities
• Provision of additional services in facilities to ensure all priority interventions areavailable
• Involvement of NGO health providers in the overall plan to increase coverage ofprimary health care
• Fostering active participation of the community
• Reducing the cost of seeking health care by the poor, children under 5, pregnantwomen, the elderly and the disabled.
• Health promotion and education to influence health-seeking behaviour,alleviating social-cultural barriers
i) Developing and implementing a rational secondary and tertiary hospital developmentplan
j) Improving management systems of health services by:
• Strengthening the planning and policy development capacity of the Ministry ofHealth
• Improving financial resource allocation to increase efficiency
k) Adopting a multi-sector approach in dealing with health problems, in order to ensurecontributions by other sectors concerned with health status improvement
l) Improving access to information and provision of health services through:
• Expanding coverage of women’s health care services

160
• Working with other partners to promote women’s health and education
• Monitoring the impact of health programs on women’s health
m) Developing national mental and oral health programs that address prevention,promotion and appropriate treatment at district level
n) Improving occupational and environmental health through:
• Collaboration with the Departments of Labor, Environment and Infrastructure todevelop regulations, strategies and plans to combat occupational andenvironmental health hazards
• Environmental and occupational health education programs, designed by theMinistry of Health
PROGRAMS AND PROJECTS
Education
11.26 Based on the objectives, policies and strategies, and addressing the problems andconstraints outlined above, the following programs and projects will be implemented by theMinistry of Education over the five-year NDP period.
Program 1: Expand Access and Improve Internal Efficiency
11.27 While one of the major accomplishments of the Transitional Administration has been thetremendous increase in enrolment at all educational levels, it is estimated that almost 25% of allchildren of school age are still out of school. Moreover, there is a significant misalignment ofage by grade due to the late start for most first graders, and a high drop-out and repetition ratewhich renders the system very inefficient. The key program thrust for the next five years istherefore to expand access particularly in basic education, and to improve the internal efficiencyof schools. Some of the projects to be implemented are as follows.
a) Information Campaign on the Importance of Schooling
b) School Drop-out Prevention
c) School Location Planning
d) Multi-grade Schools
e) School Health and Nutrition
f) Community-Based Pre-School Development
Program 2: Improve the Quality of Education
11.28 One of the main issues in East Timor is the poor quality of education, largely broughtabout by the low qualifications of teachers and headmasters. A key program thrust in the nextfive years is therefore an improvement in quality, particularly in primary and secondaryeducation. This thrust will also respond to the requirements for effectively bridging the transitionin the language of instruction (from Indonesian to Portuguese/Tetun), as well as developing thecurriculum and teaching materials, responding to the goal of creating an East Timorese national

161
identity, in addition to the emphasis on mathematics and the sciences. The key projects forimplementation under this program are the following.
a) Curriculum Review and Development
b) Textbooks and Teaching Materials Development
c) Language of Instruction Development (Tetun and Portuguese)
d) Teacher and Headmaster Training
e) Rehabilitation and Capacity Building of the Institute for Continuing Education
f) School Supervision and Improvement
g) Fundamental School Quality (TFET2)
h) Project to Redefine Technical-Vocational Education.
i) National Examinations and Supervision Improvement
j) Teachers’ Career Development and Welfare
k) International Cooperation and Linkages
l) 100 Schools Project (UNICEF-assisted)
Program 3: Build Internal Management Capacity and Improve Services Delivery
11.29 The educational system faces tremendous challenges and opportunities which require acapable and effective service delivery system. Due to a general lack of experienced educationalmanagers, sector management capacity can pose a major constraint. There is also a need todevelop physical facilities (such as for logistics) in order to ensure that critical inputs for theschools system are adequate. Building the internal capacity to formulate policies and plans, andto identify, prepare and implement responsive projects, as well as facilities development, willtherefore be an important program thrust. Some of the projects identified to respond to this needare as follows.
a) Training for Educational Managers
b) Project to Build Capacity for Policy Formulation, Planning and Project Development
c) Warehousing Expansion and Logistics Development.
Program 4: Non-Formal Education and Adult Literacy
11.30 A number of surveys have confirmed that adult illiteracy is a major problem that willpose severe constraints to productivity, growth and family health and welfare. The non-formaleducation and adult literacy program is designed to directly address this problem. Some of thespecific interventions are as follows.
a) Literacy Campaign
b) Literacy Project for Young Illiterate Women
c) Community Reading Centers Project

162
d) Distance Learning Project.
Program 5: Develop Tertiary Education
11.31 The University’s five-year plan envisages the improvement of tertiary education as anindispensable and solid nation-building effort in East Timor. It sets out to pursue key parametersof small size, high quality and gradual financial and government autonomy and has the followingprojects.
a) Institutional Strengthening
b) Staff Development
c) Curriculum Development
Program 6: Promote East Timorese Culture and the Arts
11.32 To meet the needs of a newly emerging nation, the promotion of East Timor’s culturewill be a priority program in the next five years. The thrust of this program will be initially tostructure the state’s response to this need by identifying and establishing cultural institutions anddeveloping their institutional capacity to perform their mandate. The initial projects identifiedfor this purpose are as follows.
a) Institutional Capacity Building for Culture Project
b) Cultural Renewal and Promotion Project
c) Survey and Documentation of Traditional Culture/Arts Project
Program 7: Promote Youth Welfare
11.33 As a consequence of the demographic structure of the population, East Timor’spopulation has a large proportion of young people (45% under 15 years old). When combinedwith the reality of early drop-out from school of young people, the country has a large proportionof youth who are relatively under-employed, unskilled and often barely literate. An importantprogram thrust of the education plan is therefore to provide youth welfare services and programsto respond to their needs. Some of the initial projects identified for implementation in the nextfive years are as follows.
a) Structuring and Institutional Support to Youth Sector Development
b) Project to Train Unskilled Youth
Program 8: Promote Physical Education and School Sports
11.34 Physical education and sports is an important ingredient for the development of the wholeindividual, and therefore a necessary component of the education plan. In view of the relativelyunderdeveloped state of this component of the curriculum, the program thrust in the next fiveyears is to create awareness of its importance, structure the ministry to provide an adequateresponse to its requirements, and undertake basic refurbishment of sports facilities and trainteachers and coaches. Some of the projects identified to implement the program are as follows.
a) Structuring and Capacity-Building of Sports Institutions Project
b) Information Campaign Project on the Importance of Physical Education and Sports
163
c) Teachers/Coaches Training Project
d) Rehabilitation of Sports Facilities Project.
Program Priorities
11.35 In its expenditure for the financial year, 2002/03, the Ministry of Education hasprioritised funding on programs 1 and 2, on improving the quality of education, expandingaccess, and improving internal efficiency. The focus within these funding areas will be onprimary education, followed by junior and senior secondary education, respectively. Followingthese, the next priority areas for funding are from program area 4, for continuing and non-formaleducation, with the emphasis on improving levels of adult literacy. Details are provided in theSummary of Expenditures for the Education Ministry, contained in the 2002/03 BudgetSubmission, accompanying the Plan.
Health
11.36 The Ministry of Health will implement the following programs and projects.
Program 1: Child Health
a) Child Health
b) Expanded Program of Immunisation
c) Nutrition
d) Growth Monitoring
e) Micronutrients distribution
f) Food Supplementation
g) Breast Feeding
h) Health Education on Good Nutrition
Program 2: Maternal Health
a) Ante-Natal Care
b) Safe Motherhood
Program 3: Reproductive Health
Program 4: Health Promotion
a) School Health Program
b) Media and Public Health Campaigns
Program 5: Communicable Diseases Control, including:
a) TB
b) STD/HIV/AIDS
c) Malaria Control

164
d) Disease Surveillance and Response
e) Diarrhoeal diseases
f) Leprosy
Program 6: Environmental and Occupational Health
a) Environmental Health Promotion
b) Occupational Health and Safety
Program 7: Specialised Services Programs
a) Integrated Mental Health
b) National Oral Health
c) Hospital Services
d) Ambulance Service
e) Disaster Preparedness
Program 8: Medical Supplies Program
a) Essential Drugs Program
Program 9: Laboratory Services
a) Central Laboratory Services
b) National Blood Transfusion Service
Program 10: Health Facilities Rehabilitation and Development
Program 11: District Health Services
Program 12: Health Sector and Management Programs
Program 13: Health Policy and Planning Development
a) Health Policy and Regulation
• Establishment of Regulatory Mechanisms
• Health Policy Framework
• Strategic Planning
• Inter-Sectoral Co-ordination.
b) Human Resources Development
• Training and Scholarship Program
• Strengthening of Training Institutions

165
• Establishment of National Institute of Health Sciences
c) Health Information System
• Establishment of National Health Information System
Program 14: Support to Administration and Finance functions
a) Administration
b) Finance
c) Logistics
The Second Health Sector Rehabilitation and Development Project
11.37 Within the program areas listed above, the Ministry of Health currently is focusing on theSecond Health Sector Rehabilitation and Development Project, that is, on the project as set up inthe second phase of TFET. The objectives of this project are to assist the Ministry of Health inrehabilitating and developing a cost-effective and financially sustainable health system in EastTimor, responsive to the immediate basic health needs of the population and, within a wellintegrated and sustainable health policy framework, to prepare the health system to meet futureneeds.
11.38 The project has three main components and sixteen sub-projects, for which the Ministryis requesting funding. These components are as follows.
Component 1: Support to ongoing Health Service Delivery
11.39 This component will support the delivery of health services, including selected highpriority activities (immunization, tuberculosis treatment, nutrition, and health promotion) andbasic services (including maternal and child health), in accordance with district health plans,medical supply systems, logistical systems, and essential hospital care, through the provision oftechnical assistance to the Ministry of Health. The project will also support the provision ofpharmaceuticals to health facilities, including hospitals.
Component 2: Improvement of the Range and Quality of Health Services, and theDevelopment and implementation of Health Support Systems
11.40 This component will support the improvement of the quality of basic health servicesprovided at the district level, including the enhancement of health promotion activities,environmental health, communicable diseases surveillance and reproductive health, through theprovision of technical assistance to the Ministry of Health and the provision of training to healthservices staff. It will also include the rehabilitation, construction and equipping of hospitals, andthe improvement of communication systems and transport between health facilities andhospitals. The project will further support the establishment of an autonomous medical supplyentity, and the provision of technical assistance for management.
Component 3: Development and implementation of Health Sector Policy and ManagementSystems
11.41 This component will support the development of health sector policy, health managementsystems and capacity building through technical assistance for health studies, the development ofa strategic plan for human resources, the provision of fellowships, and the development ofadministrative and financial systems.

166
11.42 Details of the funding required for financing the development of these projects in 2002-3are provided in the summary of expenditures for the Ministry of Health, contained in the BudgetSubmission accompanying the Plan.
PERFORMANCE INDICATORS
11.43 The performance indicators for the education and health sectors are summarised in thefollowing tables.

167
Table 11.1: Performance Indicators for Education
Objectives Performance indicator
1. To raise the population’s interest andknowledge of basic educational needs
Number of population participating ineducational campaigns.
a) Reduce the number of illiterate peoplewithin the adult population, with anemphasis on women;
Number of illiterate people (including women)reduced
b) Enforce community and NGOparticipation, particularly regardingimplementation of pre-school education;
Number of children enrolling in pre-schoolsincreasedNumber of pre-school facilities increased
2. a) Increase the access to education as wellas school retention of children of bothsexes within school ages;
b) Improve drop-out rates at all educationallevels and in all social and sex groups
Number of student drop-outs, including girls,reduced
Number of children repeating school yearsreduced
3. Rationalize the school network Teacher/students ratio
4. Improve the educational process at all levels,from pre-school to university, focusing alsoon professional training for all, includinggirls and women, adults, and groups withspecial needs.
Number of teachers using Portuguese languageincreasedCourse results improvedRatio of success
5. Increase the efficiency of schools and theeducational system.
Punctuality of teachers increasedEducational managers in districts and centraloffices trainedReduction in the number of internationalassistants.Relationship between school and firstemployment
6. Compulsory sports education in schools. Intensive sports programs established in schools
7. Develop a curriculum appropriate tocontemporary needs, reflecting indigenousculture and the values of democracy, self-sufficiency, nationalism and non-discrimination.
Quality assurance for delivery of curriculum
8. Improve youth qualifications, particularly forthose who have left school early, and for theunemployed, through professional training
Number of unemployed youth findingemploymentDuration in occupation
9. Develop extra-curricular occupationalprograms;
Level of youth participation in social andcultural activities increased
10. Develop culture and the arts, based on thenational identity of East Timor
Number of documents and cultural dataavailable increased
11. Developing Tetun and Portuguese as thenational & official languages
Number of students speaking Tetun andPortuguese increased.

168
Table 11.2: Performance Indicators for Health
Objectives Performance indicator
1. To reduce maternal and infant mortality MMR (reduced Maternal Mortality Rate)IMR (reduced Infant Mortality Rate)% of births attended by trained health worker% of children under 12 months with DPT3
vaccination% of pregnant women receiving tetanus
vaccination
2. To reduce the incidence of illness and deathdue to preventable communicable diseases
% population with preventable communicablediseases
Number of people infected with HIV% of TB cases treated successfully
3. To improve the nutritional status of mothersand children
% of children with low birth weight% of pregnant women with anemia% of children below weight for age
measurement% of target population receiving
micronutrients supplements
4. To improve reproductive health in East Timor Total fertility rateContraceptive prevalenceIncidence of STIsIncidence of teenage pregnancies% of women receiving screening tests
5. To ensure that all people have access tohealth services
% of population in patient admissionNumber of outpatient visits per capita% of population within a 2 hours walk to
health facility% of population utilizing outpatient and in-
patient services
6. To ensure the delivery of a minimum healthcare package at all levels of service
% of health facilities that adequately deliver aminimum package of health services
7. To collaborate with all stakeholders in thehealth sector to achieve the national goalsfor health.
Number of inter-sectoral activities/programsMechanisms and forums establishedNumber of joint plans with other stakeholders
8. To ensure that sufficient health professionaltraining is undertaken to meet nationalrequirements and regulate the employmentof all health professionals to ensureminimum standards of professional practice.
Number of health workers trained in specificareas
Regulatory bodies established% of health facilities with adequate staff
9. To provide sufficient referral and tertiaryhealth care services, including laboratorysupport services, to ensure that referral casesare treated effectively
Referral system developedNumber of referral facilities with adequately
providing referral services
10. To improve the organization and % of policies, regulations, guidelines and
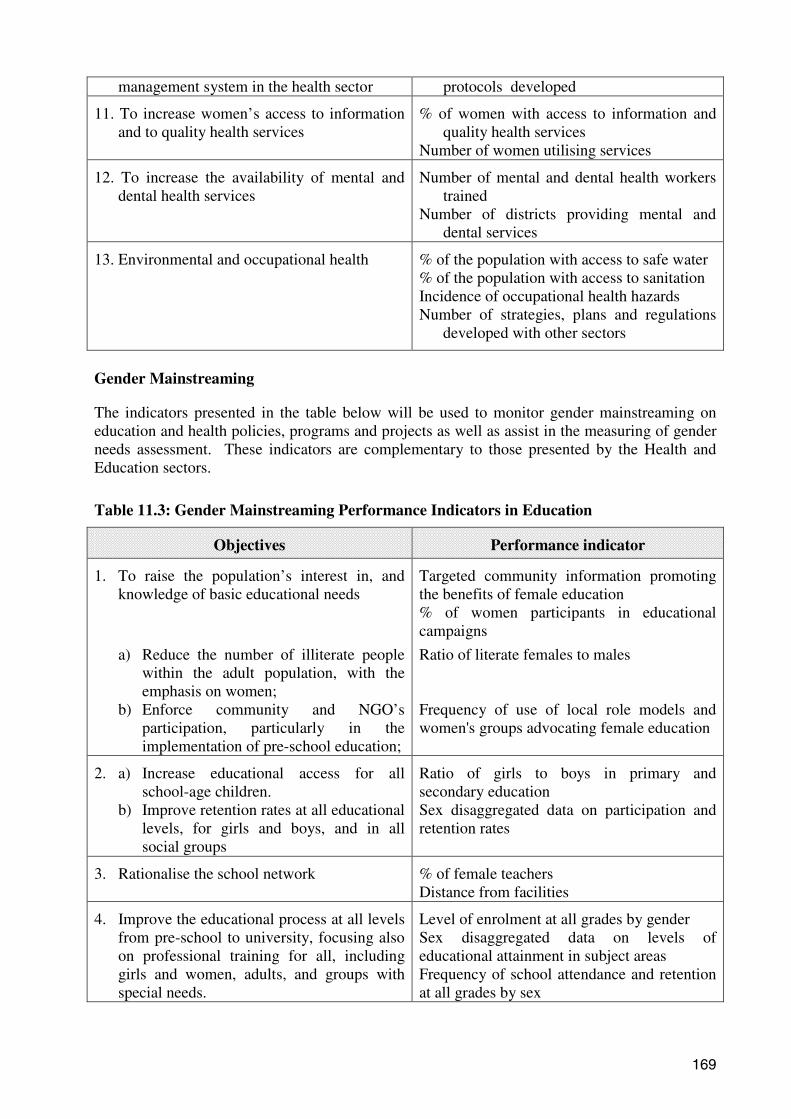
169
management system in the health sector protocols developed
11. To increase women’s access to informationand to quality health services
% of women with access to information andquality health services
Number of women utilising services
12. To increase the availability of mental anddental health services
Number of mental and dental health workerstrained
Number of districts providing mental anddental services
13. Environmental and occupational health % of the population with access to safe water% of the population with access to sanitationIncidence of occupational health hazardsNumber of strategies, plans and regulations
developed with other sectors
Gender Mainstreaming
The indicators presented in the table below will be used to monitor gender mainstreaming oneducation and health policies, programs and projects as well as assist in the measuring of genderneeds assessment. These indicators are complementary to those presented by the Health andEducation sectors.
Table 11.3: Gender Mainstreaming Performance Indicators in Education
Objectives Performance indicator
1. To raise the population’s interest in, andknowledge of basic educational needs
Targeted community information promotingthe benefits of female education% of women participants in educationalcampaigns
a) Reduce the number of illiterate peoplewithin the adult population, with theemphasis on women;
Ratio of literate females to males
b) Enforce community and NGO’sparticipation, particularly in theimplementation of pre-school education;
Frequency of use of local role models andwomen's groups advocating female education
2. a) Increase educational access for allschool-age children.
b) Improve retention rates at all educationallevels, for girls and boys, and in allsocial groups
Ratio of girls to boys in primary andsecondary educationSex disaggregated data on participation andretention rates
3. Rationalise the school network % of female teachersDistance from facilities
4. Improve the educational process at all levelsfrom pre-school to university, focusing alsoon professional training for all, includinggirls and women, adults, and groups withspecial needs.
Level of enrolment at all grades by genderSex disaggregated data on levels ofeducational attainment in subject areasFrequency of school attendance and retentionat all grades by sex
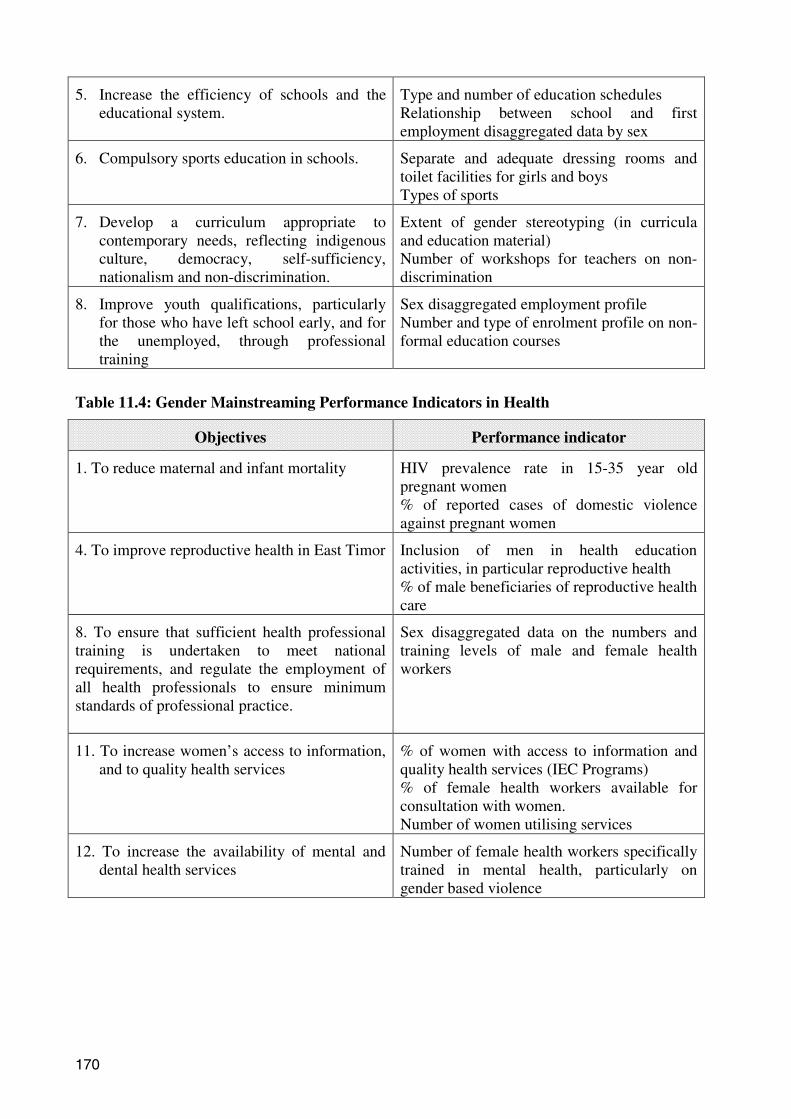
170
5. Increase the efficiency of schools and theeducational system.
Type and number of education schedulesRelationship between school and firstemployment disaggregated data by sex
6. Compulsory sports education in schools. Separate and adequate dressing rooms andtoilet facilities for girls and boysTypes of sports
7. Develop a curriculum appropriate tocontemporary needs, reflecting indigenousculture, democracy, self-sufficiency,nationalism and non-discrimination.
Extent of gender stereotyping (in curriculaand education material)Number of workshops for teachers on non-discrimination
8. Improve youth qualifications, particularlyfor those who have left school early, and forthe unemployed, through professionaltraining
Sex disaggregated employment profileNumber and type of enrolment profile on non-formal education courses
Table 11.4: Gender Mainstreaming Performance Indicators in Health
Objectives Performance indicator
1. To reduce maternal and infant mortality HIV prevalence rate in 15-35 year oldpregnant women% of reported cases of domestic violenceagainst pregnant women
4. To improve reproductive health in East Timor Inclusion of men in health educationactivities, in particular reproductive health% of male beneficiaries of reproductive healthcare
8. To ensure that sufficient health professionaltraining is undertaken to meet nationalrequirements, and regulate the employment ofall health professionals to ensure minimumstandards of professional practice.
Sex disaggregated data on the numbers andtraining levels of male and female healthworkers
11. To increase women’s access to information,and to quality health services
% of women with access to information andquality health services (IEC Programs)% of female health workers available forconsultation with women.Number of women utilising services
12. To increase the availability of mental anddental health services
Number of female health workers specificallytrained in mental health, particularly ongender based violence

171
12. AGRICULTURE, FISHERIES ANDFORESTRY
“In the medium-term the agricultural sector, more than most, provides opportunities for economic growth, exports, employment and improvements in
social welfare throughout East Timor.”
VISION
12.1 By 2020 East Timor will have sustainable, competitive and prosperousagricultural, fisheries and forestry industries that support improved livingstandards for the nation’s people.
INTRODUCTION
12.2 The agriculture sector comprises crop and livestock activities, fisheriesand forestry. The sector is pre-eminent in East Timor, with the majority of thepopulation deriving their livelihood from agricultural activities.
12.3 Prior to the violence that followed the September 1999 IndependenceReferendum, agriculture and its support industries employed more than 85% ofthe workforce, contributed 40% of GDP, and earned 90% of foreign exchange,mostly from coffee exports. Exports included coffee and live cattle, along withillegal exports of sandalwood. The key position of agriculture in the economymeans that there remains a strong imperative to rebuild the sector for reasons offood security, employment and income generating opportunities. In the medium-term the agricultural sector, more than most, provides opportunities for economicgrowth, exports, employment and improvements in social welfare throughout EastTimor.
12.4 The Ministry of Agriculture and Fisheries (MAF) is the Governmentagency with prime responsibility for the sector and its development. The privatesector and NGOs are also very important to the future development of the sectorand will provide many of the support services plus the commercial servicesrequired by agriculture, fisheries and forestry. Donor support for the sector wasstrong in the post-1999 period and the continuation of such support is critical inthe medium-term.
12.5 The structure of MAF is as shown in Figure 12.1, with the developmentprograms and other activities implemented and administered predominantly on aDepartmental basis. The activities and responsibilities of each Department orother functional area are as follows.
a) Administration: includes Finance and Budget Support Services,Agricultural Planning, Bilateral and Multilateral Coordination, andAdministration and Operational Support Services.
b) Policy and Planning Unit: the agricultural sector’s role as a keyeconomic and social sector in the nation demands that the Ministryis able to formulate appropriate policies for the sector. MAF needs
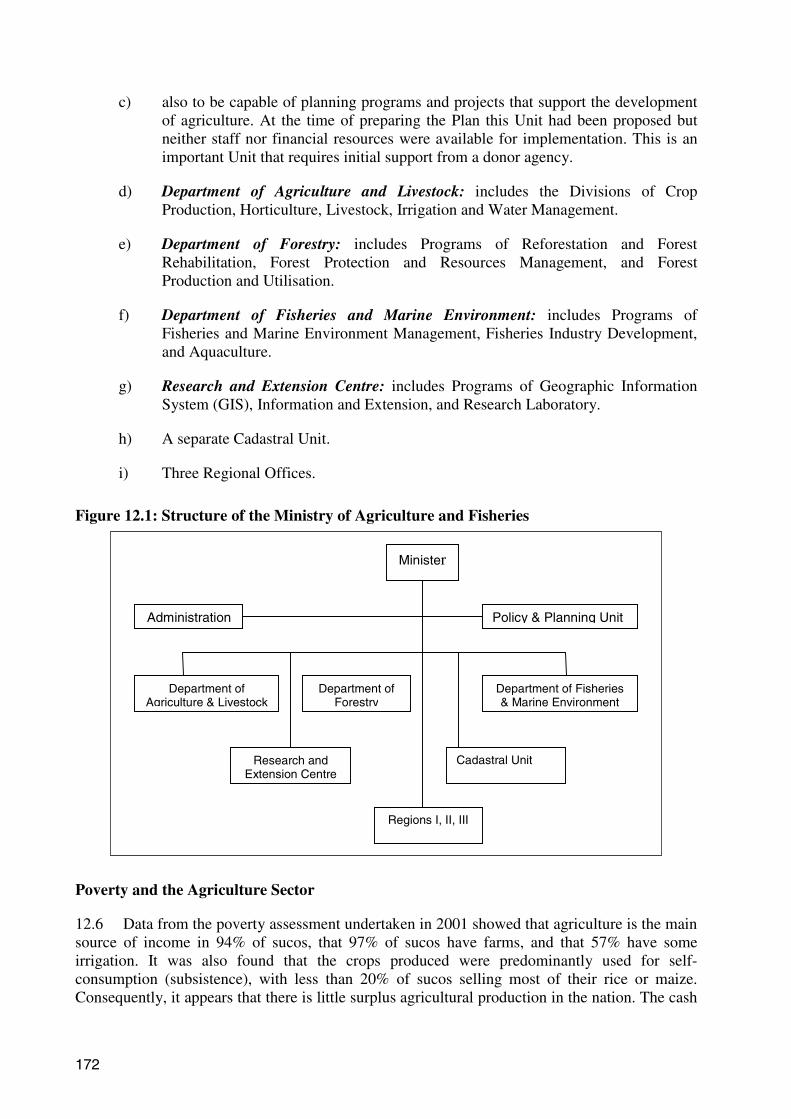
172
c) also to be capable of planning programs and projects that support the developmentof agriculture. At the time of preparing the Plan this Unit had been proposed butneither staff nor financial resources were available for implementation. This is animportant Unit that requires initial support from a donor agency.
d) Department of Agriculture and Livestock: includes the Divisions of CropProduction, Horticulture, Livestock, Irrigation and Water Management.
e) Department of Forestry: includes Programs of Reforestation and ForestRehabilitation, Forest Protection and Resources Management, and ForestProduction and Utilisation.
f) Department of Fisheries and Marine Environment: includes Programs ofFisheries and Marine Environment Management, Fisheries Industry Development,and Aquaculture.
g) Research and Extension Centre: includes Programs of Geographic InformationSystem (GIS), Information and Extension, and Research Laboratory.
h) A separate Cadastral Unit.
i) Three Regional Offices.
Figure 12.1: Structure of the Ministry of Agriculture and Fisheries
Poverty and the Agriculture Sector
12.6 Data from the poverty assessment undertaken in 2001 showed that agriculture is the mainsource of income in 94% of sucos, that 97% of sucos have farms, and that 57% have someirrigation. It was also found that the crops produced were predominantly used for self-consumption (subsistence), with less than 20% of sucos selling most of their rice or maize.Consequently, it appears that there is little surplus agricultural production in the nation. The cash
Minister
Administration
Department ofAgriculture & Livestock
Department ofForestry
Department of Fisheries& Marine Environment
Research andExtension Centre
Cadastral Unit
Regions I, II, III
Policy & Planning Unit
173
income of farm families in 2002 is generated mainly by the sale of chickens, pigs, eggs and somevegetables.
12.7 Analyses of poverty data indicate that food insecurity is faced by 18.6% of thepopulation, or more than 154,000 people in East Timor. Furthermore, preliminary results fromthe Countrywide Consultation point to concern about food shortages and the need to increaseboth the quantity and quality of food crops.
12.8 The PA also serves to indicate that 41% of the population suffers from poverty, withthose in rural areas more likely to be experiencing poverty. Agricultural policy and strategies,therefore, need to recognise the likelihood of seasonal food shortages and accord suitable priorityto programs to overcome those shortages. Based on concern about food shortages, the medium-term development policy could focus on a goal of reducing poverty and food insecurity. Thepolicy instruments to do so, however, require careful consideration. Strategies such as educationand training, complemented with applied research and field demonstrations will improve farmerknowledge of adaptive technology. These are key platforms in the MAF’s developmentprograms. In addition, better access to inputs, along with improved access to markets viaimproved infrastructure will increase productivity in the medium to long term. Ultimately,economic growth provides the best solution to poverty, so that sustainable productivityimprovements in agriculture, supporting increased employment and incomes, provides the bestway forward.
12.9 Agriculture, particularly coffee, was responsible for more than 90% of export incomeduring the Indonesian administration. Since 1999, however, the world price of coffee hasslumped to historic lows, while inadequate quality control and poor crop husbandry typify thelocal industry. This serves also to highlight the narrow base of agricultural production forexports, although domestic production of food crops is well diversified. At present, East Timorhas little or no comparative advantage in relation to the export of agricultural commodities.Current wage levels and the use of the US dollar as the medium of exchange render East Timorinternationally uncompetitive on price alone. While MAF has an important role in this respect,so too do other arms of Government, such as the MoF.
12.10 The private sector has a vital role to play in the development of agriculture – includingfisheries and forestry – in areas such as infrastructure development, transport, storage,manufacturing and processing, marketing, contract services, and the supply of inputs.
12.11 The production of agricultural produce in East Timor is indicated by reference to Table12.1. As shown in the table, there appear to be inconsistencies in the data reported. The PovertyAssessment was, however, based on an extremely robust sample that provided data considered tobe very reliable. It is these data that are considered to be most credible.
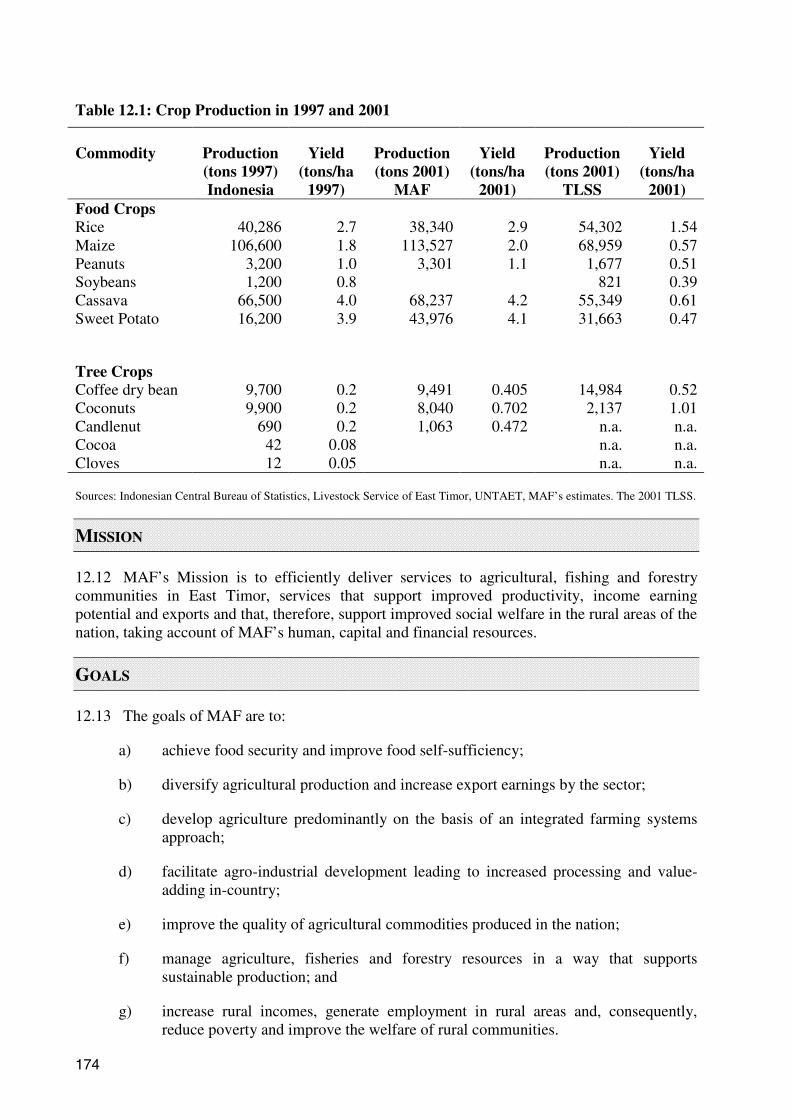
174
Table 12.1: Crop Production in 1997 and 2001
Commodity Production(tons 1997)Indonesia
Yield(tons/ha
1997)
Production(tons 2001)
MAF
Yield(tons/ha
2001)
Production(tons 2001)
TLSS
Yield(tons/ha
2001)Food CropsRice 40,286 2.7 38,340 2.9 54,302 1.54Maize 106,600 1.8 113,527 2.0 68,959 0.57Peanuts 3,200 1.0 3,301 1.1 1,677 0.51Soybeans 1,200 0.8 821 0.39Cassava 66,500 4.0 68,237 4.2 55,349 0.61Sweet Potato 16,200 3.9 43,976 4.1 31,663 0.47
Tree CropsCoffee dry bean 9,700 0.2 9,491 0.405 14,984 0.52Coconuts 9,900 0.2 8,040 0.702 2,137 1.01Candlenut 690 0.2 1,063 0.472 n.a. n.a.Cocoa 42 0.08 n.a. n.a.Cloves 12 0.05 n.a. n.a.
Sources: Indonesian Central Bureau of Statistics, Livestock Service of East Timor, UNTAET, MAF’s estimates. The 2001 TLSS.
MISSION
12.12 MAF’s Mission is to efficiently deliver services to agricultural, fishing and forestrycommunities in East Timor, services that support improved productivity, income earningpotential and exports and that, therefore, support improved social welfare in the rural areas of thenation, taking account of MAF’s human, capital and financial resources.
GOALS
12.13 The goals of MAF are to:
a) achieve food security and improve food self-sufficiency;
b) diversify agricultural production and increase export earnings by the sector;
c) develop agriculture predominantly on the basis of an integrated farming systemsapproach;
d) facilitate agro-industrial development leading to increased processing and value-adding in-country;
e) improve the quality of agricultural commodities produced in the nation;
f) manage agriculture, fisheries and forestry resources in a way that supportssustainable production; and
g) increase rural incomes, generate employment in rural areas and, consequently,reduce poverty and improve the welfare of rural communities.
175
GUIDING PRINCIPLES
12.14 The key guiding principles for development of the agriculture, fisheries and forestrysectors are as follows.
Sustainability
Agricultural, fisheries and forestry production activities will use natural, social and financial resources ina sustainable manner. This will be based on the well-known definition of sustainability from the 1983World Conservation and Environmental Development Conference, which states:
“sustainable development is development that meets the needs of the present withoutcompromising the ability of future generations to meet their own needs.”
Efficiency
Agricultural, fisheries and forestry resources will be used in a manner that prevents waste,ensures they are employed in a cost-effective way, and maximises community benefits from theiruse4.
Equity
All farmers and fishers will have the same access to the services provided by MAF and otherGovernment agencies, while the benefits of development will be distributed fairly across thenation and between generations.
Self-reliance
Government will encourage private sector initiatives and provide a conducive policyenvironment and support services to make agriculture and fisheries profitable and globallycompetitive.
Values
The values of East Timorese will be considered in development programs, which will takeaccount of, and respect, cultural values and traditional practices such as farmers workingtogether in crop production (serbisu hamutuk).
Participatory Development
Decision-making by MAF will be undertaken in consultation with major stakeholders in thesector.
KEY DEVELOPMENT INDICATORS
12.15 The key development indicators for the agricultural sector are as follows.
a) Increased food production, rural incomes and per capita nutritional intakes. Theincrease in food production is possibly the most critical indicator. It will be
4 Efficiency has two aspects: allocative efficiency, requiring that the net benefits to the community from the use of resources are maximised; andproductive efficiency, requiring that the technically most efficient (and least wasteful) mix of resources is used in production.

176
measured by both the overall amount of food production and food production perhousehold.5
b) Increased total area (hectares) planted to new crop varieties.
c) Higher incomes and employment among farmers adopting a farming systemsapproach.
d) Increased foreign exchange earnings from exports of quality agricultural andfisheries products.
e) Higher proportion of irrigated land relative to total arable land
f) Higher crop yields and productivity due to intensification, adoption of newvarieties, farmer training, and improved genetic stock in livestock, aquaculture andfisheries.
g) Increased number of Agricultural Service Centres, along with production and post-production infrastructure.
h) Quality standard improvements in agriculture and fisheries products.
i) Increased number of livestock volunteer workers, water user associations and otherfarmers’ associations.
j) New protected areas through improved resources management and development,terrestrial and marine parks, law enforcement and information dissemination.
k) Enhanced forestry and fisheries products’ utilisation.
l) Increased production and quality of fishery products due to training, improvedharvest and post-harvest fish handling and infrastructure development.
PROBLEMS AND CONSTRAINTS
12.16 The critical problems and constraints faced by MAF and the nation in relation todevelopment of the agriculture sector include the following.
Capacity
MAF currently faces a lack of institutional and personnel capacity to undertake the wide range oftasks with which they are confronted, including the implementation, management andmonitoring of donor-funded activities. The planned increase in staff numbers in 2002/03, alongwith capacity building for staff will address these issues to a partial extent.
Management and Entrepreneurial Skills
Farmers and fishers in East Timor are typified by low levels of management skills andentrepreneurial ability. This is a capacity constraint in the private sector component of the sector.
5 These two indicators relate food security at national level to food security at household level. The former measures the gross increase in foodproduction while the latter measures the equitable distribution of increases in food production.
177
Data and Information
As stated in the Introduction, doubts remain about the veracity of the data which MAF has at itsdisposal. This imposes a constraint on planning and development in the sector. Results of the2001 Poverty Assessment will be helpful in this context, but further, regular data collection willbe important to policy and program development.
Financial Resources
MAF, like other Ministries, faces severe budgetary constraints for staffing, other recurrent costsand capital equipment. Therefore, it will continue to rely on donor support in the medium termto establish both a stock of needed capital equipment and a cadré of suitably trained staff.
Poor Transport, Communication, Marketing and Processing Infrastructure
Many sucos and aldeias cannot be reached by vehicles, and the majority have little or nocommunication facilities other than transistor radio. This imposes constraints both ondevelopment programs and extension activities, while also hindering the marketing of produceby isolated communities. Furthermore, value-adding is constrained by a lack of processingfacilities.
Low Productivity
Agriculture in East Timor is typified by low productivity with, for example, average rice yieldsaround 1.5 tons per hectare (compared, say, to the Philippines where average yields are around 4tons per hectare). Low productivity results from farmers’ shortage of cash, low input systems,inadequate knowledge of alternative production systems the continued use of traditionalcultivation techniques, zero or minimal fertiliser use, and high seeding rates to guard againstlosses. Farm practices are also typified by risk-averse behaviour as farmers attempt to guaranteefood for their families, which is rational under existing farming circumstances. Increasingproductivity through introducing appropriate changes to production systems comprises one of thebiggest challenges for MAF and its Department of Agriculture and Livestock.
Poor Quality Produce
The quality of agricultural commodities produced in East Timor is generally quite poor. Thisreduces farm incomes and competitiveness in both domestic and international markets.
State of Irrigation Schemes
Irrigation schemes were extensively damaged in 1999, although many were already in a poorstate, due to lack of maintenance and weak structure. Water shortages and poor management aretypical and, amongst other things, result in irrigated rice normally grown only as one crop peryear.
Land Tenure
Lack of clarity about land tenure presents a constraint on commercial agricultural development,as well as on various support services that require access to land to become established. Thecurrent situation relating to land tenure remains to be ascertained in accordance with theConstitution of the country, but is currently typified by great uncertainty. There is no proper landregistry, no recording or verification of land transactions, no transparent system for allocating orgoverning foreign interests in land use, and no framework in which to determine competingclaims to land.

178
Comparative Advantage and Diversity
The principal export in past years from East Timor has been coffee. The current state of theinternational coffee market means, however, that the industry is currently non-viable. EastTimor coffee formerly had a reputation as a quality product, but this reputation has beendamaged in recent years by poor post-harvest handling and processing and the subsequentplacement of an inferior product onto the international market. Furthermore, husbandry of thecrop, in general, is poor to non-existent, leading to reduced productivity and quality. The presentuse of the US$ means also that East Timorese exports are expensive on world markets – thenation has virtually no comparative advantages in international trade at the present time. Finally,the parlous state of the coffee industry shows the need to diversify the export base; reliance ononly one or a small number of exports brings with it both price and production risks.
Fisheries Legislation and Management
East Timor is yet to develop and implement a Fisheries Act and to formulate the approaches tothe management of various fisheries through fisheries management plans. A precautionaryapproach has been taken to the allocation of fishing rights because fish stocks are poorlyunderstood. There is an urgent need to address these matters so that the nation can develop itsfisheries in a manner that is economically, biologically and socially sustainable.
Forest Degradation
The forests of East Timor are in a very poor state, with previous logging activity, firewoodcollection, shifting agriculture and defoliation by the Indonesian military each contributing to thecurrent status of forests. There is much to be done in terms of reforestation, the declaration andmanagement of protected areas, and watershed protection. Reforestation is both long-term andexpensive with domestic funding unlikely to be able to make a significant contribution to neededefforts.
Forestry Legislation
There is currently no forestry legislation, although UNTAET Regulation #2000/19 is designed toprotect various natural areas, while UNTAET Regulation #2000/17 deals with the prohibition oflogging and timber exports. There is, however, a need to develop appropriate legislation andfurther regulations as soon as practicable.
Quarantine
There is currently a lack of regulation and services for quarantine in East Timor. This isimportant to the whole nation, but of particular importance as it develops new agriculturalindustries, particularly those with an export focus.
STRATEGIC POLICY DIRECTIONS
12.17 The overall strategic policy directions for MAF in the next five years are designed to overcomethese problems and constraints. They include the following.
a) Establish effective and efficient technical support services to assist farmcommunities to increase food (particularly rice and maize), livestock and vegetableproduction.
b) Introduce and develop new and adaptable technologies such as new cultivars andother inputs to enhance farm productivity. Such technologies will be complemented
179
with adaptive field experiments, field demonstrations and extensive training forfarmers.
c) Promote and develop diversification of agriculture through identification ofpotential niche markets for East Timor farm commodities in the region and inEurope and North America. This might include creating incentives to producecrops such as tropical fruits for both the domestic and export markets.
d) Maintain and improve the existing irrigation systems for rice, along with othercrops including horticulture and legumes.
e) Promote the development of a sustainable fishing industry targeting both domesticand export markets. Such development will be supported by an appropriateregulatory framework, encouragement for local and foreign investment throughappropriate fiscal arrangements, and protection of the nation’s marine resources.
f) Create services to assist farmers to develop and improve animal production (cattle,buffalo, goats and poultry). A regulatory framework that enforces appropriatesanitation standards in abattoirs and processing plants will be formulated.
g) Develop and implement an extensive vaccination and sanitation campaign toprevent disease and improve animal production.
h) Rehabilitate and improve infrastructure, including irrigation systems, silos, roadsand markets. Such activities will be undertaken in conjunction with theDepartments of Public Works and Transport.
i) Promote crop rotation as critical in crop production systems to maximise profitableuse of agricultural land, thereby increasing farm incomes and also improving soilstructure.
j) Increase coffee production through the systematic renovation of coffee plantationsby pruning, or replacement of old trees with new Arabica plants and, whereappropriate, by expanding the area of plantings. Simultaneously, niche markets willbe sought in Asia, Europe and North America.
k) Promote, develop and improve production from tree crops such as candlenut andcoconut for both domestic and export markets.
l) Develop and expand the reforestation program to increase forest cover and theproduction of commercially valuable trees for the timber industry.
PROGRAMS AND PROJECTS
12.18 The development programs and projects of the Ministry are presented under the threecore departments of Crops and Livestock, Forestry and Fisheries and Marine Environment.Programs for the GIS and Cadastre Units of the Ministry are shown separately.

180
DEPARTMENT OF AGRICULTURE AND LIVESTOCK
Mission Statement
The mission of the Department of Agriculture and Livestock (DAL) is to improve the well-beingof farm families through encouraging them to adopt profitable, productive and sustainablefarming practices in relation to both crops and livestock.
12.19 The overarching goal of the DAL is a highly developed crops and livestock industrywithin farming communities typified by progressive and self-reliant farmers who are adoptingprofitable, productive, and sustainable farming systems practices. DAL will undertake a farmingsystems development approach that strongly recognises existing resource limitations, knowledge,skill and indigenous technologies. It will undertake its development activities in a manner that isspecific to each agricultural ecosystem (upland, irrigated lowland, rain fed lowland, slopinglands, and cool-elevated lands). The focus will be on integrating crops and livestock production,along with adaptation and promotion of proven, profitable and sustainable farming systemstechnologies featuring efficient use of soil and irrigation water.
12.20 DAL consists of four divisions: Crop Production Division, Division of Horticulture,Livestock Division; and Division of Irrigation and Water Management.
Problems, Goals and Policies
12.21 The key problems confronted by the DAL are the following.
a) Low productivity, production and value of food crops, cash crops and livestock.
b) Poor animal husbandry and animal health.
c) Irrigation schemes are, overall, in a state of disrepair and road access in rural areasis deficient.
d) Transport and marketing infrastructure to serve post-harvest distribution is limitedor non-existent.
e) The coffee industry is in urgent need of revitalisation.
f) Lack of know-how about improved agricultural techniques and best practices.
12.22 Consideration of these problems means that three goals are of particular importance tothe DAL. These are to:
a) increase the productivity of the crop and livestock sectors, focusing initially onrice, maize, fruit and vegetables, coffee and chickens;
b) make more intensive use of agricultural land; and
c) improve the quality of agricultural produce.
12.23 The three principal policy options for achieving these goals are to:
a) increase information provision and training for farmers;
b) ensure the availability of better inputs such as seed and livestock medicines; and
c) rehabilitate irrigation schemes and coffee plantings.

181
12.24 To put these policies into practice the Department, through its Divisions, will implementthe various programs described below. The projects to be implemented under each program, withthe actual or proposed sources of funding and the current status of individual projects are asshown in Tables 12.24 – 12.28.
Crop Production Division
Program 1: Enhancement of Food Crops Production
Program 2: Enhancement of Horticultural Crop Production
Program 3: Enhancement of Industrial Crops Production
Program 4: Support to Farmers’ Associations
Program 5: Crop Protection
Program 1: Enhancement of Food Crops Production
12.25 The goal of this program is to increase the productivity, overall production and quality ofimportant food crops grown in East Timor. The program will be focused on food crops, mainlyrice and maize, which are grown by 23% and 81%, respectively, of East Timorese households.The current low yields and productivity of these two crops results from the use of poor seeds andvarieties that grow poorly under the existing soil and climatic conditions; and inadequateapplication of improved practices that are already tested and continue to be used by other farmersin Asia. Program activities will include on-farm demonstrations of certified seed use; improvedproduction practices, cropping systems and crop diversification; and variety testing and seedmultiplication of newly selected varieties of rice and maize, as well as Phaseolus, mungbean,soybean, cowpea, sweet potato, peanut, and cassava. The performance targets, after five years ofthe program, are as shown in Table 12.2.
Table 12.2: Performance Targets, Enhancement of Food Crops Production: 2002-2007
Performance Targets (at the end of 5 years) Measurement
50% reduction in number of months with insufficientfood supply among rural households
National poverty/nutrition surveys
Stabilisation of deficit in rice supply National poverty/nutrition surveys andMAF data
Development of 3 model rice villages MAF monitoring records
Release of new food crop varieties:- 2 varieties of new irrigated lowland rice- 3 new varieties of maize- 1 new variety of mungbean, soybean & cowpea- 3 new varieties of peanut- 3 new varieties of sweet potato and seed
pieces distributed to 5,000 households
MAF monitoring records

182
Program 2: Enhancement of Horticultural Crop Production
12.26 The goal of this program is to increase the production and quality of fruit crops grown byEast Timorese for both food and cash. This program does not include the ‘industrial’ crops suchas coffee. A large number of households in East Timor are dependent on the production ofhorticultural crops, from the relatively dry lowland areas in the north, to the humid and coolelevated lands in the mountainous region, through to the relatively humid lowlands in the south.The recent household poverty assessment showed that richer farmers tend to grow proportionallymore fruit trees than poorer farmers, indicating that development of horticultural productionmight have an impact on poverty alleviation. Initial activities include improvement of thegermplasm of suitable fruit crops, training selected farmers in commercial nursery operation,conducting on-farm demonstrations about improved cultural practices, and seed or seedlingmultiplication of the best performing newly recommended varieties. Performance targets areshown in Table 12.3.
Table 12.3: Performance Targets, Enhancement of Horticultural Crops Production
Performance Targets (for FY02/03) Measurement
Two plant nurseries (1 in the highlands and 1 in thelowlands) for selected varieties of fruit crops to use assources of seeds or planting materials for propagationand training of plant nursery operators. Identificationof plants.
Crop Production Division records
Program 3: Enhancement of Industrial Crops Production
12.27 The goal of this program is to enhance and develop industrial crops that will contribute toincome earning opportunities and employment in rural areas, and to export earnings for thenation. The program will focus on crops that involve value-adding activities and support: (a) thedevelopment of industrial crops such as coffee, candlenut, coconut, sugarcane, Manila hemp, andvanilla; (b) germplasm collection, identification, and evaluation; (c) seed or seedlingmultiplication; (d) on-farm demonstration of best practices in orchard management; (e)processing of value-added products; and (f) training of farmers in nursery and plantingoperations.
12.28 An estimated 25,000 farm families derive a substantial portion of their income fromcoffee, while another 15,000 obtain a small portion of their income from the crop. Consequently,about 40,000 families earn at least some cash income from coffee, meaning that around 200,000people (given that the average family size is five persons) or a quarter of the population rely onthe crop for at least a portion of their livelihood. Seasonal off-farm labour is also employed inthe transport and processing of coffee. While not the only activity, coffee production will be animportant component of the program because the crop is already grown and well understood.Furthermore, coffee is – at least for the present – heavily supported by aid donors and the MAFprogram will complement donor activities. Donor support includes:
a) USAID: NCBA Timor Economic Rehabilitation and Development Project(TERADP);
b) Portugal: Replanting of Coffee Fields and Research on Coffee Production;

183
c) Portugal: Integrated Rehabilitation and Construction of Coffee ProcessingFacilities;
d) USAID: Abaca Pilot in Liquica (under Economic Recovery Program: Agriculture).
Table 12.4: Performance Targets, Enhancement of Industrial Crops Production:
Performance Targets (for FY02/03) Measurement
3 batches of farmers trained in the production of highquality processed coffee
Crop Production Division records
5 demonstration sites on proper rehabilitation ofcoffee orchards
Crop Production Division records
2 nurseries of selected varieties established Crop Production Division records
Program 4: Support to Farmers’ Associations
12.29 The goal of this program is to facilitate the marketing of agricultural inputs and products,through private commercial agricultural associations owned by farmers. This program is beingsupported by the TFET-funded Agricultural Rehabilitation Program I (ARPI) and ARP IIprojects, and is helping establish three Agriculture Service Centres (ASCs) in Bobonaro,Viqueque, and Aileu, each serving 3,500-4,000 farmers. The total beneficiary population is closeto 10,000 farmers. The ASCs will facilitate: (a) marketing and trading of agricultural products(including rice in Bobonaro, candlenuts and copra in Viqueque, and coffee in Aileu); (b) sales ofagricultural inputs (such as seeds, fertilisers, pesticides, and farm tools): and (c) transport ofagricultural products from farm sites to markets. Apart from staff time, all project costs are metunder TFET funding; MAF staff will play a counterpart role and support the in-field activities ofthe program. Performance targets are shown in Table 12.5.
Table 12.5: Performance Targets, Support to Farmers’ Associations
Performance Targets Measurement
Three Agriculture Service Centres established andoperational
ARP II monitoring records
Agriculture inputs and transportation available, andmarketing network re-established for nearly 10,000 farmers
ARP II monitoring records
Program 5: Crop Protection
12.30 The goal of the Crop Protection Program is to support the improvement of food supply atthe household level by controlling common pests and diseases (including weeds) that lead to lossof yields in the field and during storage of crops. Essential functions include monitoring commonpests and diseases, and informing farmers about how to act in a timely fashion to controlcommon pests, particularly rats, and reduce their impact. The program will also administer andoperate the plant quarantine program that will prevent entry of new pests and diseases into EastTimor, and regulate the importation and use of pesticides by farmers. Given that this is anintegrated program, no projects are specified.
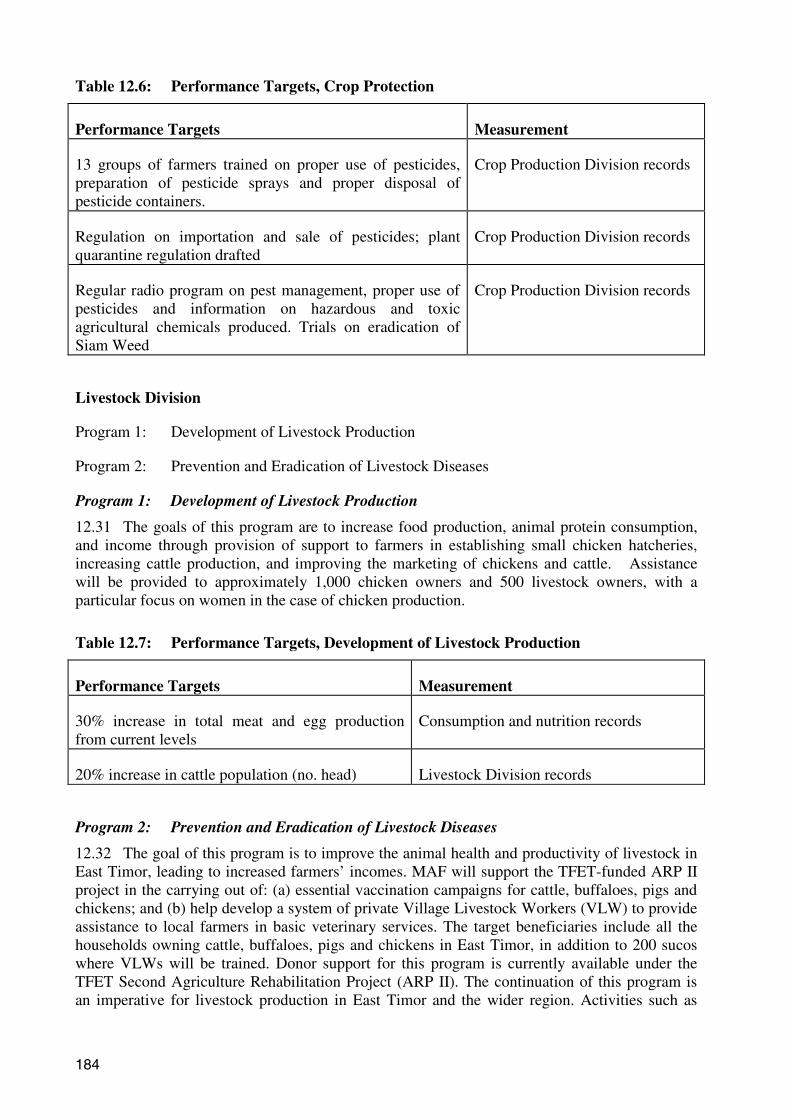
184
Table 12.6: Performance Targets, Crop Protection
Performance Targets Measurement
13 groups of farmers trained on proper use of pesticides,preparation of pesticide sprays and proper disposal ofpesticide containers.
Crop Production Division records
Regulation on importation and sale of pesticides; plantquarantine regulation drafted
Crop Production Division records
Regular radio program on pest management, proper use ofpesticides and information on hazardous and toxicagricultural chemicals produced. Trials on eradication ofSiam Weed
Crop Production Division records
Livestock Division
Program 1: Development of Livestock Production
Program 2: Prevention and Eradication of Livestock Diseases
Program 1: Development of Livestock Production
12.31 The goals of this program are to increase food production, animal protein consumption,and income through provision of support to farmers in establishing small chicken hatcheries,increasing cattle production, and improving the marketing of chickens and cattle. Assistancewill be provided to approximately 1,000 chicken owners and 500 livestock owners, with aparticular focus on women in the case of chicken production.
Table 12.7: Performance Targets, Development of Livestock Production
Performance Targets Measurement
30% increase in total meat and egg productionfrom current levels
Consumption and nutrition records
20% increase in cattle population (no. head) Livestock Division records
Program 2: Prevention and Eradication of Livestock Diseases
12.32 The goal of this program is to improve the animal health and productivity of livestock inEast Timor, leading to increased farmers’ incomes. MAF will support the TFET-funded ARP IIproject in the carrying out of: (a) essential vaccination campaigns for cattle, buffaloes, pigs andchickens; and (b) help develop a system of private Village Livestock Workers (VLW) to provideassistance to local farmers in basic veterinary services. The target beneficiaries include all thehouseholds owning cattle, buffaloes, pigs and chickens in East Timor, in addition to 200 sucoswhere VLWs will be trained. Donor support for this program is currently available under theTFET Second Agriculture Rehabilitation Project (ARP II). The continuation of this program isan imperative for livestock production in East Timor and the wider region. Activities such as
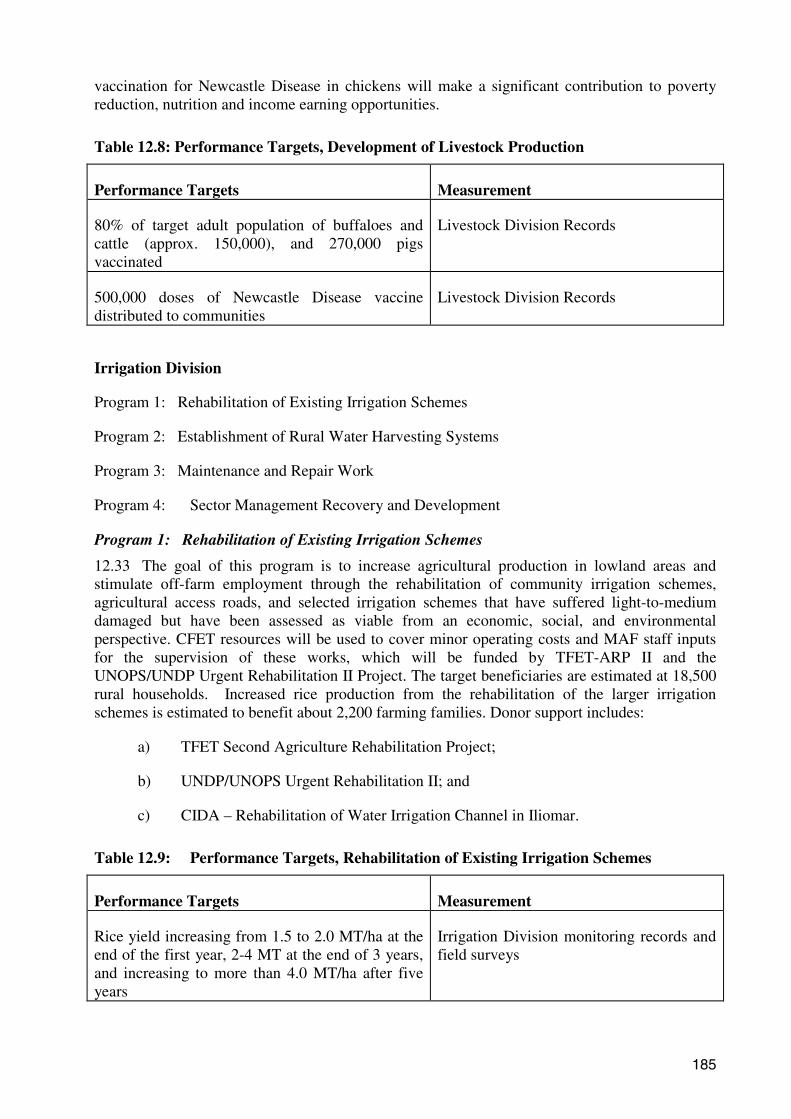
185
vaccination for Newcastle Disease in chickens will make a significant contribution to povertyreduction, nutrition and income earning opportunities.
Table 12.8: Performance Targets, Development of Livestock Production
Performance Targets Measurement
80% of target adult population of buffaloes andcattle (approx. 150,000), and 270,000 pigsvaccinated
Livestock Division Records
500,000 doses of Newcastle Disease vaccinedistributed to communities
Livestock Division Records
Irrigation Division
Program 1: Rehabilitation of Existing Irrigation Schemes
Program 2: Establishment of Rural Water Harvesting Systems
Program 3: Maintenance and Repair Work
Program 4: Sector Management Recovery and Development
Program 1: Rehabilitation of Existing Irrigation Schemes
12.33 The goal of this program is to increase agricultural production in lowland areas andstimulate off-farm employment through the rehabilitation of community irrigation schemes,agricultural access roads, and selected irrigation schemes that have suffered light-to-mediumdamaged but have been assessed as viable from an economic, social, and environmentalperspective. CFET resources will be used to cover minor operating costs and MAF staff inputsfor the supervision of these works, which will be funded by TFET-ARP II and theUNOPS/UNDP Urgent Rehabilitation II Project. The target beneficiaries are estimated at 18,500rural households. Increased rice production from the rehabilitation of the larger irrigationschemes is estimated to benefit about 2,200 farming families. Donor support includes:
a) TFET Second Agriculture Rehabilitation Project;
b) UNDP/UNOPS Urgent Rehabilitation II; and
c) CIDA – Rehabilitation of Water Irrigation Channel in Iliomar.
Table 12.9: Performance Targets, Rehabilitation of Existing Irrigation Schemes
Performance Targets Measurement
Rice yield increasing from 1.5 to 2.0 MT/ha at theend of the first year, 2-4 MT at the end of 3 years,and increasing to more than 4.0 MT/ha after fiveyears
Irrigation Division monitoring records andfield surveys

186
Program 2: Establishment of Rural Water Harvesting Systems
12.34 The goal of this proposed new program is to improve the reliability of irrigation watersupplies for upland communities, which are particularly vulnerable to water shortages during thedry season. The program will be piloted in two communities during FY02/03, using a limitedCFET budget of $5,000 for the construction of vaults and tanks in vegetable areas in thehighlands of East Timor. Based on lessons learned from this pilot, the program will be expandedinto a specific project in FY03/04.
Table 12.10: Performance Targets, Establishment of Rural Water Harvesting Systems
Performance Targets Measurement
Construction of small irrigation water tanksand vaults in 2 pilot communities
Irrigation Division monitoringrecords
Program 3: Maintenance and Repair Work
12.35 The goal of this program is to provide essential maintenance and repair for irrigationschemes rehabilitated in previous years under donor-funded projects. The costs of annualoperation and maintenance of irrigation schemes are estimated at about 10% of the capitalinvestment. While most of the schemes rehabilitated in the past have been community tertiarycanals, meaning that operation and maintenance costs are borne by the community, there is aneed to allocate modest CFET funding (US$45,000) to essential maintenance and repair. Thetargeted beneficiaries would be communities in a 7,700 ha area previously rehabilitated underARP I.
Table 11.11: Performance Targets, Maintenance and Repair Work
Performance Targets Measurement
Maintenance and repair work covering 2,100hectares
Irrigation Division monitoring records
Program 4: Sector Management Recovery and Development
12.36 Under this program, the MAF Irrigation Division will complete two essential policystudies, one on Water Users Associations, and a second on broader Water Management Policy.These studies will develop the Government’s policy towards operation and maintenance ofirrigation schemes, such as the share of communities’ responsibilities for the schemes, and theincentives and policies influencing the use of water, one of East Timor’s most critical naturalresources. MAF staff will contribute to the formulation of these essential policies. Donor supportfor technical aspects is provided under:
a) TFET: Second Agriculture Rehabilitation Project

187
Table 12.12: Performance Targets, Sector Management Recovery and Development
Performance Targets Measurement
Two draft policy documents on WaterUsers Associations and broader WaterManagement Policy
Irrigation Division monitoringrecords
DEPARTMENT OF FISHERIES AND MARINE ENVIRONMENT
Mission Statement
The mission of the Department of Fisheries and Marine Environment (FME) is to leadsustainable development of the fishing and aquaculture industries in East Timor and ensure theyplay a significant role in national food security and income generation.
12.37 The overarching goal of the FME is to lead the development of the nation’s aquaticresources in a sustainable fashion, while providing opportunities for coastal communities tobenefit from such development. Current and planned development is based on the Strategic Planfor the Fisheries of East Timor. The Strategic Plan addresses major issues facing the fishingindustry, including: (1) the declaration of fishing boundaries between East Timor, Australia andIndonesia; (2) the licensing of offshore commercial operations; and (3) the definition of EastTimor’s various fisheries. The FME will focus on: (a) training for capacity building; (b)development of appropriate administrative protocols to ensure coordination of all fisheriesprograms and activities; (c) maximising the value of the catch by improving fish handling,transport, storage, processing and marketing; and (d) upgrading the database of fishing capacityheld at FME. The FME will also work with Legal Affairs and other Government departments toensure that a fishing zone for East Timor is defined, declared and ratified as soon as practicable.
Problems, Goals and Policies
12.38 The key problems confronted by the Department are the following.
a) No Fisheries Act and legislation
b) No fisheries management plans
c) No international maritime boundaries
d) Lack of staff skills
e) Lack of fisheries data
f) Underdeveloped fresh water and marine and brackishwater aquaculture sector
g) No fisheries monitoring capability or activities at present
h) Facilities destroyed in September, 1999
i) Lack of shore-based industry
j) Under-developed harvest sector

188
12.39 Based on these problems, the goals of the FME are to:
a) establish and implement a Fisheries Act and accompanying legislation;
b) establish a profitable private sector-based fishing industry that maximisessustainable economic returns to East Timor;
c) establish a viable aquaculture industry;
d) provide sustainable marine recreational activities for the recreational fishing,charter fishing and dive tour sectors;
e) assert jurisdiction and control over the living marine resources in the seas of EastTimor;
f) develop the capacity of the staff of the FME;
g) sustain and enhance the aquatic resources of East Timor and their supportingecosystems; and
h) operate an efficient and accountable FME.
12.40 The policy options for achieving these goals include the following:
a) develop appropriate legislation, regulations and management instruments forsustainable development of fisheries in East Timor;
b) develop each fishery via a step-wise, precautionary approach;
c) develop fisheries-specific management and development plans consistent with theprinciples of ecologically sustainable development (ESD);
d) establish a responsive extension system that works closely with commercial,private and subsistence fishers;
e) provide a regulatory system that promotes community-based management for reefand coastal fisheries, including the development of local by-laws that protect theinterests and user-rights of the community;
f) rehabilitate the former government run Ikan Mas hatcheries, and supply assistance,technical advice, and fish fry to local fish farmers on a cost-recovery basis; and
g) provide staff training across the full spectrum of fisheries-related disciplines,including socio-economics and sustainable fishing practices, thereby upgradingstaff skills to meet the needs of a modern fisheries sector.
12.41 To put these policies into practice the FME will implement the programs describedbelow. The projects to be implemented under each program, with the actual or proposed sourcesof funding and the current status of individual projects are as shown in Table 12.26.
Program 1: Fisheries and Marine Environment Management
Program 2: Fisheries Industry Development
Program 3: Aquaculture

189
Program 1: Fisheries and Marine Environment Management
12.42 The goals of this program are: (a) the creation of a policy and legislative environment,backed up by appropriate stock assessments, monitoring and data that supports sustainabledevelopment of East Timor’s fisheries; and (b) co-management of fisheries resources, involvingcoastal communities, the Department and other stakeholders. CFET funds will be usedpredominantly for staff inputs, with staff working mostly on programs that are supported bydonors. The support from donors is received under:
a) AusAID: Fisheries Management Planning
b) AusAID: Survey of Nearshore Fish Stocks – Dili Harbor
c) TFET: Second Agriculture Rehabilitation Project
Table 12.13: Performance Targets, Fisheries and Marine Environment Management
Performance Targets (at the end of 5 years) Measurement
50% overall increase in production Records of catches at landing sites
25% increase in industry employment National employment surveys
Program 2: Fisheries Industry Development
12.43 The goal of this program is to facilitate the development of the fisheries sector in EastTimor so that it contributes to economic growth, incomes, employment and export earnings. Theprogram builds on the initiatives in Program 1 by supporting the growth of a commercial fishingindustry based on the legislation, regulations, management protocols and marine boundariespromulgated under that Program.
Table 12.14: Performance Targets, Fisheries Industry Development
Performance Targets (at the end of 5 years) Measurement
Quantum of facilities re-established Monitoring of rehabilitation
Increase in annual revenues from leasing of servicesat the fishery port
Income realised by the Government fromthe port & its operations
Program 3: Aquaculture
12.44 The overarching goal of this program is to develop and expand a local aquacultureindustry, both freshwater and marine, to enhance food security and add to local and exportincomes. The program is comprised of one project at the current time, with a principal goal tomake fish fry available so that the aquaculture industry can redevelop in East Timor and becomean important provider of food, incomes and employment. Prior to the 1999 violence five fishhatcheries were owned and managed by the East Timor Fisheries Authority. These hatcheriessupplied fish fry to both small and large fish farmers. Without at least one freshwater fishhatchery and one marine/brackishwater hatchery, East Timor runs the risk of losing potentialinvestment and employment opportunities. Revenue from fish farming would not be realised and

190
food security issues heightened. Ultimately, the aim is that the management and operation ofsuch facilities will be taken over by the private sector with FME providing research and otherprofessional inputs, but not taking any commercial risks.
Table 12.15: Performance Targets, Aquaculture
Performance Targets Measurement
Expansion in the aquaculture industry Annual aquaculture production
Number of privatised hatcheries Number of hatcheries in the nation
DEPARTMENT OF FORESTRY
Mission Statement
The mission of the Department of Forestry (DoF) is to ensure the sustainable management of EastTimor’s forest resources through effective planning, capacity building, community participation and theformulation of appropriate policies and legislation.
11.45 The overarching goal of the DoF is to develop appropriate policies, legislation andmanagement strategies as the basis for the formulation and implementation of forestrymanagement plans to facilitate the sustainable management of forest resources in East Timor.DoF will work with other stakeholders, including rural communities who are reliant on forestresources, in its management and development programs. The Department will, therefore,encourage the participation of rural communities and other stakeholders in all aspects ofsustainable forest resources management in the nation.
Problems, Goals and Policies
12.46 The key problems confronted by DoF are the following.
a) No forestry legislation and minimal regulation
b) Inability to police those regulations that do exist
c) No forestry management strategies yet in place
d) Lack of staff capacity and skills
e) Lack of forestry data
f) Collection of firewood and lack of action on watershed protection
12.47 Consequently, the goals of the DoF are to:
a) collect and analyse information on forestry resources in East Timor, to be used asthe basis of planning and decision making;
b) develop essential forestry policies, legislation and management strategies;
c) prepare a Forestry Master Management Plan and develop and implement ActionPlans based on that Plan;

191
d) build the capacity of the national staff to implement forestry programs;
e) promote reforestation and sustainable land management practices in East Timor forerosion control, soil rehabilitation, watershed protection and subsistence use;
f) provide effective and efficient management programs for sustainable forestry, withemphasis on forest lands, their resources, and protected natural areas; and
g) develop strategies that could encourage the participation of rural communities andother stakeholders in planning and decision making related to forest resourcesmanagement.
12.48 The policy options for achieving these goals include the following:
a) develop appropriate legislation, regulations and management instruments forsustainable development of forestry in East Timor;
b) develop forestry management and development plans consistent with the principlesof ecologically sustainable development (ESD);
c) promote and support community-based management of forest resources and watersource areas;
d) support staff training across the full spectrum of forestry-related activities;
e) establish the protocols and facilities for the collection, collation and analysis offorestry data; and
f) support the development of a number of protected natural areas throughout EastTimor.
12.49 The Department will implement the various programs described below in response to theneeds summarised above. The projects to be implemented under each program, with the actual orproposed sources of funding and the current status of individual projects are as shown in Table12.24.
Program 1. Reforestation and Forest Rehabilitation
Program 2. Forest Protection and Forest Resources Management
Program 3. Forest Production and Utilisation
Program 1: Reforestation and Forest Rehabilitation
12.50 The aims in this program are to: (a) reforest degraded areas in East Timor with valuablelocal timber species, in particular sandalwood; (b) restore the ecological balance of degradedareas and arrest the environmental problems resulting from their degraded condition (whilepromoting the development of forest resources in those areas); and (c) encourage communityparticipation in the rehabilitation of East Timor’s degraded forest areas. Reforestation is animmediate response to widespread upland degradation. An estimated 85% of upland areas aredenuded and devastated due to forest fires and non-environmental friendly upland management(including widespread collection of firewood). In line with this, Agro-forestry techniques areconsidered an alternative to slash and burn cultivation, as farmers are able to produce foresttrees, fruit trees, and cash crops, including livestock. Aside from the uplands, mangrove areas

192
have been exploited for fuel wood and other products. Mangroves play a major role as coastalhabitats and hence are a priority for rehabilitation. Donor support for this program comprises:
a) TFET: Second Agriculture Rehabilitation Project (Pilot Participatory Developmentand Natural Resources Management
b) Portugal: Reforestation and Alternative Cash Crops
c) CIDA: Tree Nursery, Reforestation and Agroforestry in Seloi
d) CIDA/CARE: Community-based Natural Resources Management in Covalima andDili
Table 12.16: Performance Targets, Reforestation and Forest Rehabilitation
Performance Targets Measurement
No. of hectares of reforested upland andrehabilitated mangrove areas
Forestry Division monitoring records
No. of partnerships between NGOs and MAF staff Forestry Division monitoring records
No. of Participatory Action Plans for NaturalResource Management
Forestry Division monitoring records
12.51 This program is focused on the protection and conservation of the forest resources of EastTimor, through: (a) increased public awareness; (b) development of a framework formanagement of watershed areas; and (c) protection and conservation of the biodiversity andsocio-cultural significance of important natural sites. The program will cover projects in theareas of watershed management, protected natural areas (PNA), and public information, buildingupon the existing watershed management activities started by MAF in FY01/02. Targetbeneficiaries include the communities within the targeted watershed and protected areas, farmerswishing to use resources of the protected area and East Timor in general through the protectionof its biodiversity and cultural heritage. The expected outcomes of the program include a greaterunderstanding amongst communities of regulations on protected areas, involvement incommunity-based Integrated Management Planning, and raised public awareness. Donor supportwill be provided under:
a) AusAID: Agriculture and Fisheries Community Watershed Project
b) TFET: Second Agriculture Rehabilitation Project (Pilot Participatory Developmentand NRM component)

193
Table 12.17: Performance Information, Forest Protection and Forest ResourcesManagement
Performance Targets Measurement
No. of Watershed Management Plan Developmentproposals prepared
Forestry Division monitoring records
No. of PNA boundary maps prepared Forestry Division monitoring records
Program 3: Forest Production and Utilisation
12.52 The goal of this program is to develop and promote the sustainable use of timber andnon-timber forest products in East Timor. It includes the undertaking of a forestry inventory onkey production areas, dissemination and discussion of a revised Forestry Policy and Strategy,public hearings in support of draft directives on tree crops and non-timber forest products, andenforcement of forest laws. The effective conservation of natural resources relies largely oncommunities’ wise use of those resources and their awareness and participation in resourcemanagement. This program will rely heavily on public information and consultation.
Table 12.18: Performance Information, Forest Production and Utilisation
Performance Targets Measurement
No. of directives and workshop proceedingsreflecting issues and solutions proposed by thecommunities
Forestry Division monitoring records
RESEARCH AND EXTENSION CENTRE
12.53 The Research and Extension Centre is a “service centre” to the technical Departments ofthe Ministry of Agriculture and Fisheries and, consequently, no particular mission or problems,goals and policies are laid out for the Centre as it is structured to respond to the needs of theother areas of MAF.
12.54 The goal of the Research and Extension Centre is to provide support in the derivation anddissemination of important technical, management and other information to clients of MAFthrough its Departments. The Centre will combine the crucial functions of information and GISsystems with a small laboratory for soil, plant and pest analyses. CFET funding will be allocatedto MAF staff inputs to the programs supported by the centre, operating costs for the equipmentheld by the Geographic Information System (GIS) program, and a small amount of capitalexpenditures for the purchase of essential laboratory equipment and communications equipmentfor the GIS program.
12.55 The Research and Extension Centre will have three essential programs:
Program 1. Research and Laboratory
Program 2. Information and Extension
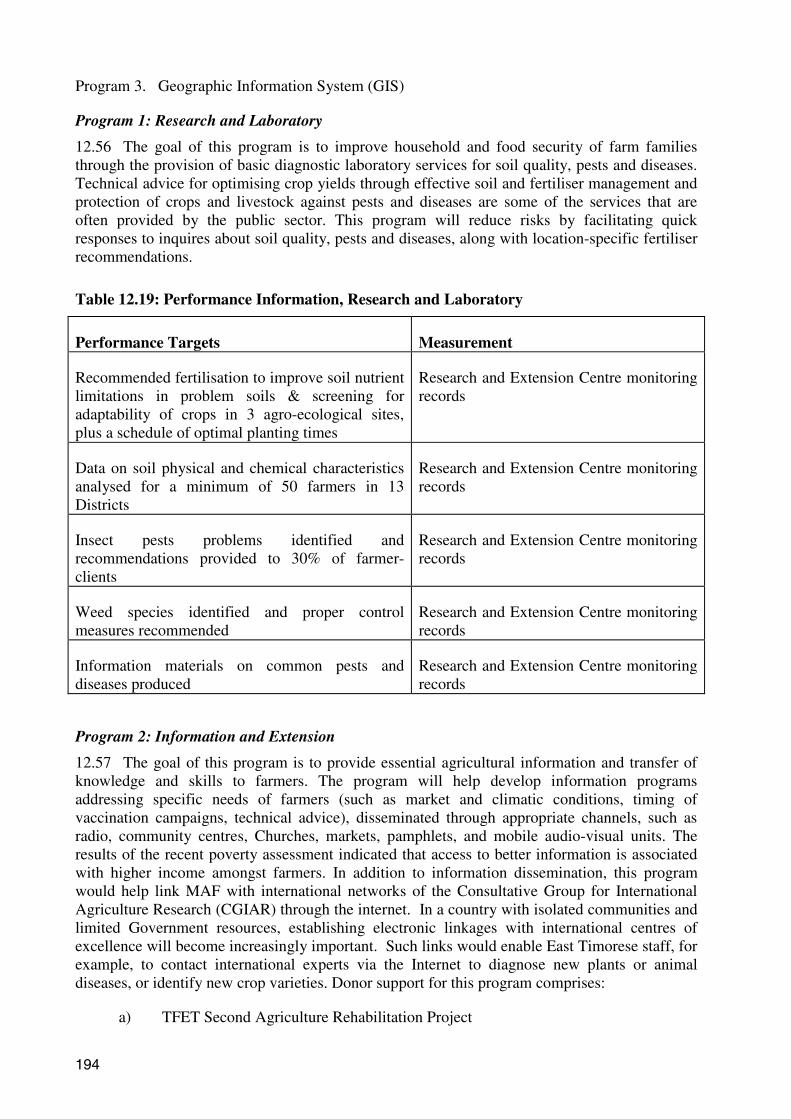
194
Program 3. Geographic Information System (GIS)
Program 1: Research and Laboratory
12.56 The goal of this program is to improve household and food security of farm familiesthrough the provision of basic diagnostic laboratory services for soil quality, pests and diseases.Technical advice for optimising crop yields through effective soil and fertiliser management andprotection of crops and livestock against pests and diseases are some of the services that areoften provided by the public sector. This program will reduce risks by facilitating quickresponses to inquires about soil quality, pests and diseases, along with location-specific fertiliserrecommendations.
Table 12.19: Performance Information, Research and Laboratory
Performance Targets Measurement
Recommended fertilisation to improve soil nutrientlimitations in problem soils & screening foradaptability of crops in 3 agro-ecological sites,plus a schedule of optimal planting times
Research and Extension Centre monitoringrecords
Data on soil physical and chemical characteristicsanalysed for a minimum of 50 farmers in 13Districts
Research and Extension Centre monitoringrecords
Insect pests problems identified andrecommendations provided to 30% of farmer-clients
Research and Extension Centre monitoringrecords
Weed species identified and proper controlmeasures recommended
Research and Extension Centre monitoringrecords
Information materials on common pests anddiseases produced
Research and Extension Centre monitoringrecords
Program 2: Information and Extension
12.57 The goal of this program is to provide essential agricultural information and transfer ofknowledge and skills to farmers. The program will help develop information programsaddressing specific needs of farmers (such as market and climatic conditions, timing ofvaccination campaigns, technical advice), disseminated through appropriate channels, such asradio, community centres, Churches, markets, pamphlets, and mobile audio-visual units. Theresults of the recent poverty assessment indicated that access to better information is associatedwith higher income amongst farmers. In addition to information dissemination, this programwould help link MAF with international networks of the Consultative Group for InternationalAgriculture Research (CGIAR) through the internet. In a country with isolated communities andlimited Government resources, establishing electronic linkages with international centres ofexcellence will become increasingly important. Such links would enable East Timorese staff, forexample, to contact international experts via the Internet to diagnose new plants or animaldiseases, or identify new crop varieties. Donor support for this program comprises:
a) TFET Second Agriculture Rehabilitation Project

195
Table 12.20: Performance Information, Information and Extension
Performance Targets (for 5 years) Measurement
4 printed information documents on rice, 2 on maize,2 on root crops, 2 on beans; weekly 5-minute radioreports on improved farming practices.
Research and Extension Centremonitoring records
Weekly agriculture radio program on agriculturalprojects and technology
Research and Extension Centremonitoring records
CGIAR links established and operational Research and Extension Centremonitoring records
Program 3: Geographic Information System
12.58 The goal of this program is to support MAF in the planning and delivery of geographicinformation and high quality maps on current land use, land use potential, agricultural productionand production trends, and socio-economic information, as a basis for natural resourcemanagement and decision making. The GIS program aims to: (a) develop a cost recovery GISinterpretation and mapping service for non-MAF users; (b) expand and provide assistance withdatabase development and mapping for land suitability based on available soils information; (c)produce thematic maps of land capability for agricultural expansion; (d) expand the GIS networkto other Ministry departments and integrate the individual units’ databases; and (e) train staff indatabase access, data entry, accessibility, desktop mapping, and evaluation of data reliability.Donor support for this program comprises:
a) AusAID Agriculture/Forestry Landuse Mapping and GIS project
Table 12.21: Performance Information, Geographic Information System
Performance Targets Measurement
Train 3 MAF staff in database structure, data entry,accessibility, and evaluation of data reliability
GIS program monitoring records
Develop and institute a cost recovery system GIS program monitoring records
Expand and provide assistance with database andmapping for land suitability
GIS program monitoring records
Produce thematic maps of land capability GIS program monitoring records
Integrate individual Departmental databases GIS program monitoring records
CADASTRAL UNIT
12.59 The Cadastral Unit is responsible for: (a) maintaining the National Geodesian System,cartographic projections, elevation data, support to hydrographic work and delineation of theterritory; (b) acquisition and processing of aerial photographs, analysis of quality of nationalcartography, certification of professionals in the areas of topography and cartography, andstandardisation of maps; (c) maintaining the National Building Register, including production ofidentification cards for building registration, establishment of norms and technical specifications,

196
issuance of licenses, inspection of licensed buildings, and enforcement of regulations related tobuilding codes; (d) processing of geographic information, including satellite imagery, andsupport to planning; and (e) maintenance of the national Global Position System stations,including provision of topographic and geographic information to the general public.
12.60 The Cadastral Unit has one essential program: Geography and Cadastre
Program 1: Geography and Cadastre
12.61 The objectives of the Geography and Cadastre program are to maintain the NationalGeodesic System, maintain cartographic coverage, implement the National Building, Rural andUrban Cadastres, issue licenses, maintain geo-reference information, and generally cooperatewith other institutions to assist them in the areas of geodesic, cartography and cadastre services.The Geography and Cadastre program proposes the following activities: (1) capacity buildingand training; (2) developing an inventory of the previous geodetic points provided by Portugaland Indonesia; (3) data collection; and (4) Sub-village administration survey.
Table 12.22: Performance Information, Geography and Cadastre
Performance Targets Measurement
Geography: maintenance, provide geodetic pointsthroughout the country & finalise borderdemarcation between Indonesia & East Timor;Sub-village administration survey
a. Orde 0:6 geodetic pointsb. Orde 1:25 geodetic pointsc. Orde 2:50 geodetic pointsd. Orde 3:100 geodetic points
Approx. 250 km for 6 districts: Lautem,Baucau, Viqueque, Manatuto, Dili &Liquica
Cadastre: survey the land parcels in Dili for taxand/or certification
2,500 land parcels in first step
Mapping & GIS: produce basic topographic maps 250-500 maps at different scales (1:5000,1:100000, 1:25000, etc.)
POLICY AND PLANNING UNIT
12.62 The Policy and Planning Unit is a planned new initiative of MAF. Because agriculturaldevelopment is so critical to the development of East Timor and the well-being of the nation’speople, and because human and financial resources are scarce, MAF needs to be able to carefullyplan, implement and monitor those programs and projects for which it is responsible. Skills inareas such as benefit-cost analysis, used to prioritise projects, and in monitoring and evaluationof budgets and projects will be amongst the required planning expertise.
Furthermore, policy development is extremely important in the sector. Agriculture, fisheries andforestry development all rely heavily on the development of appropriate policies in a wide rangeof areas such as fisheries management and licensing and user-pays requirements in the sub-sector. The allocation of the economic rents appropriated by commercial fishers is also animportant policy question to be addressed. In agriculture, policies in areas such as import duties,

197
irrigation water allocation, support for certain production activities, input subsidies andmarketing arrangements might be amongst key matters to be analysed.
12.64 It is proposed that donor funding is sought in 2002/03 for support of the Policy andPlanning Unit. The Unit would be staffed by an international advisor with appropriate expertise,along with a small number of local staff from MAF who, after a period of 6-12 months, would beexpected to take over the running of the Unit. The establishment of systems for tasks such asmonitoring and evaluation would be important activities in the start-up phase, as would thetraining of local staff in areas such as benefit-cost analysis.
Table 12.23: Performance Information, Policy and Planning Unit
Performance Targets Measurement
Establishment of appropriate systems formonitoring & evaluation and project appraisal
Systems established and running within thefirst 6 months of the project
Training of local staff in monitoring & evaluation,benefit-cost analysis and project planning,including use of appropriate software
Number of staff trained in each 12 monthperiod.
Mapping & GIS: produce basic topographic maps 250-500 maps at different scales (1:5000,1:100000, 1:25000, etc.)

198
Tab
le12
.24:
Pro
ject
sof
the
Cro
pP
rodu
ctio
nD
ivis
ion,
Dep
artm
ent
ofA
gric
ultu
rean
dL
ives
tock
,Min
istr
yof
Agr
icul
ture
and
Fis
heri
es,
2002
/03-
2006
/07
Pro
gram
/Pro
ject
sC
ost
US$
’000
2002
–20
06F
undi
ngSo
urce
s(a
ctua
l&po
tent
ial)
Fun
ding
Ava
ilabl
e?Im
plem
enta
tion
Per
iod
Cro
pP
rodu
ctio
nD
ivis
ion
Pro
gram
1:E
nhan
cem
ent
ofF
ood
Cro
psP
rodu
ctio
n
Pro
ject
1.1
Enh
ance
men
tof
Food
Cro
psPr
oduc
tion
180
CFE
TY
ES
2001
-200
6
Pro
ject
1.2
See
dsof
Lif
e–
Eas
tTim
or59
CFE
T/A
CIA
RY
ES
2001
-200
3
Pro
ject
1.3
Red
uctio
nof
Pos
t-H
arve
stL
osse
sof
Ric
e&
Mai
zein
Eas
tTim
or17
8C
FET
YE
S20
01-2
006
Pro
ject
1.4
Enh
ance
men
tofB
eans
Pro
duct
ion
n.a.
n.a.
NO
2003
-200
6
Pro
ject
1.5
Enh
ance
men
tofR
ootC
rops
Pro
duct
ion
n.a.
n.a.
NO
2003
-200
6
Pro
gram
2:E
nhan
cem
ent
ofH
orti
cult
ural
Cro
pP
rodu
ctio
n
Pro
ject
2.1
Enh
ance
men
tof
Frui
tCro
psPr
oduc
tion
176
CFE
TY
ES
2002
-200
6
Pro
ject
2.2
Enh
ance
men
tofV
eget
able
Cro
psP
rodu
ctio
nn.
a.n.
a.N
O20
03-2
006
Pro
ject
2.3
Enh
ance
men
tofR
ootC
rops
Pro
duct
ion
n.a.
n.a.
NO
2003
-200
6
Pro
ject
2.4
Dev
elop
men
tofN
ativ
eH
erba
lPla
nts
n.a.
n.a.
NO
2003
-200
6
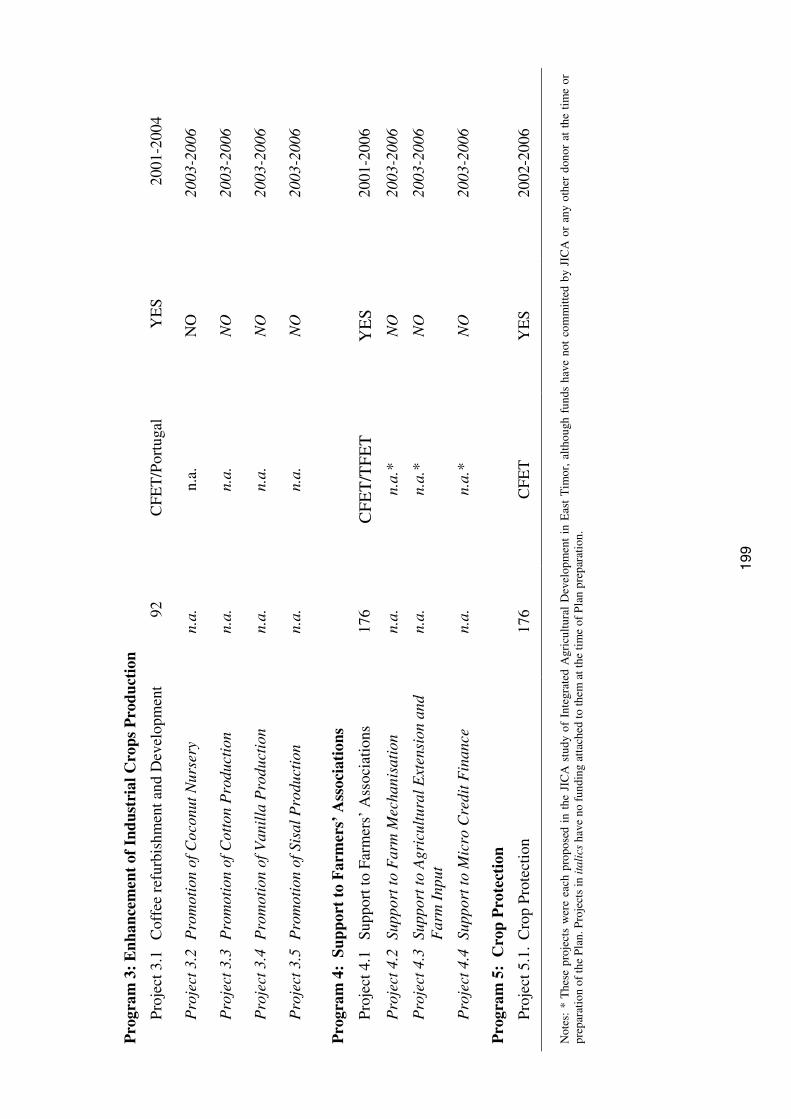
199
Pro
gram
3:E
nhan
cem
ent
ofIn
dust
rial
Cro
psP
rodu
ctio
n
Pro
ject
3.1
Cof
fee
refu
rbis
hmen
tand
Dev
elop
men
t92
CFE
T/P
ortu
gal
YE
S20
01-2
004
Pro
ject
3.2
Pro
mot
ion
ofC
ocon
utN
urse
ryn.
a.n.
a.N
O20
03-2
006
Pro
ject
3.3
Pro
mot
ion
ofC
otto
nP
rodu
ctio
nn.
a.n.
a.N
O20
03-2
006
Pro
ject
3.4
Pro
mot
ion
ofV
anil
laP
rodu
ctio
nn.
a.n.
a.N
O20
03-2
006
Pro
ject
3.5
Pro
mot
ion
ofSi
salP
rodu
ctio
nn.
a.n.
a.N
O20
03-2
006
Pro
gram
4:Su
ppor
tto
Far
mer
s’A
ssoc
iati
ons
Pro
ject
4.1
Supp
ortt
oFa
rmer
s’A
ssoc
iatio
ns17
6C
FET
/TF
ET
YE
S20
01-2
006
Pro
ject
4.2
Supp
ortt
oF
arm
Mec
hani
sati
onn.
a.n.
a.*
NO
2003
-200
6
Pro
ject
4.3
Supp
ortt
oA
gric
ultu
ralE
xten
sion
and
Far
mIn
put
n.a.
n.a.
*N
O20
03-2
006
Pro
ject
4.4
Supp
ortt
oM
icro
Cre
ditF
inan
cen.
a.n.
a.*
NO
2003
-200
6
Pro
gram
5:C
rop
Pro
tect
ion
Pro
ject
5.1.
Cro
pPr
otec
tion
176
CFE
TY
ES
2002
-200
6
Not
es:
*T
hese
proj
ects
wer
eea
chpr
opos
edin
the
JIC
Ast
udy
ofIn
tegr
ated
Agr
icul
tura
lD
evel
opm
ent
inE
ast
Tim
or,
alth
ough
fund
sha
veno
tco
mm
itte
dby
JIC
Aor
any
othe
rdo
nor
atth
eti
me
orpr
epar
atio
nof
the
Pla
n.P
roje
cts
inita
lics
have
nofu
ndin
gat
tach
edto
them
atth
eti
me
ofP
lan
prep
arat
ion.
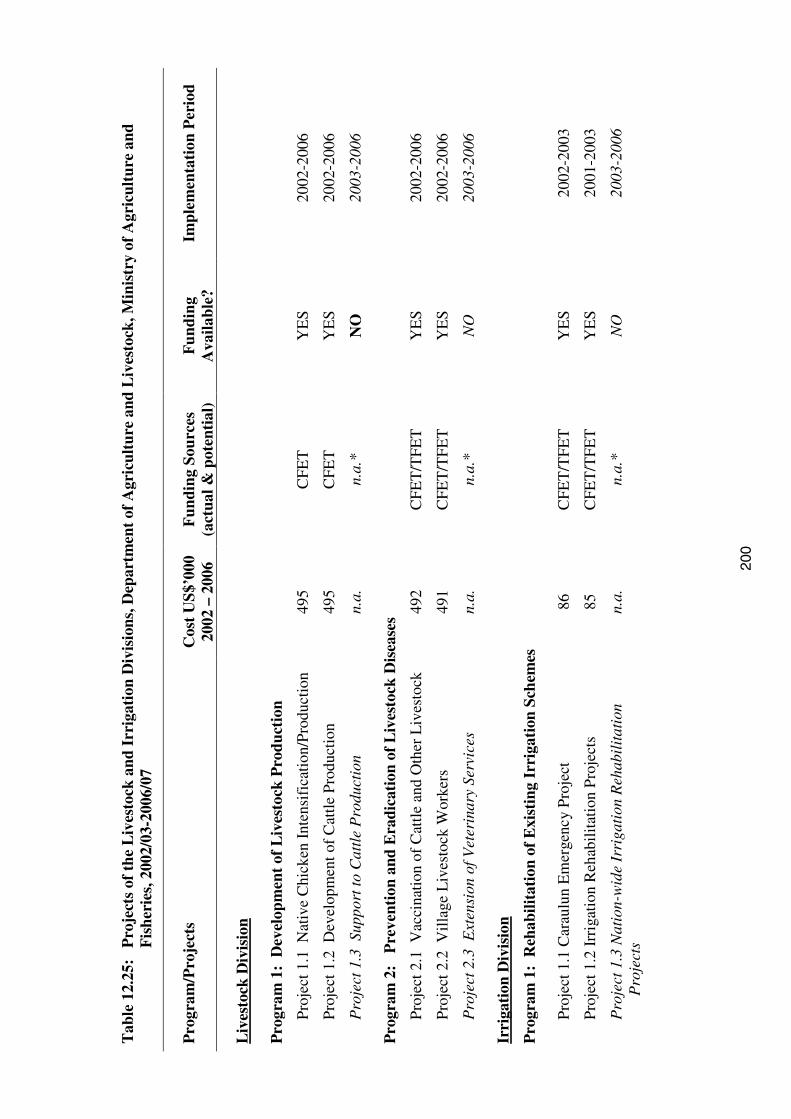
200
Tab
le12
.25:
Pro
ject
sof
the
Liv
esto
ckan
dIr
riga
tion
Div
isio
ns,D
epar
tmen
tof
Agr
icul
ture
and
Liv
esto
ck,M
inis
try
ofA
gric
ultu
rean
dF
ishe
ries
,200
2/03
-200
6/07
Pro
gram
/Pro
ject
sC
ost
US$
’000
2002
–20
06F
undi
ngSo
urce
s(a
ctua
l&po
tent
ial)
Fun
ding
Ava
ilabl
e?Im
plem
enta
tion
Per
iod
Liv
esto
ckD
ivis
ion
Pro
gram
1:D
evel
opm
ent
ofL
ives
tock
Pro
duct
ion
Pro
ject
1.1
Nat
ive
Chi
cken
Inte
nsif
icat
ion/
Prod
uctio
n49
5C
FET
YE
S20
02-2
006
Pro
ject
1.2
Dev
elop
men
tof
Cat
tlePr
oduc
tion
495
CFE
TY
ES
2002
-200
6
Pro
ject
1.3
Supp
ortt
oC
attl
eP
rodu
ctio
nn.
a.n.
a.*
NO
2003
-200
6
Pro
gram
2:P
reve
ntio
nan
dE
radi
cati
onof
Liv
esto
ckD
isea
ses
Pro
ject
2.1
Vac
cina
tion
ofC
attl
ean
dO
ther
Liv
esto
ck49
2C
FET
/TFE
TY
ES
2002
-200
6
Pro
ject
2.2
Vill
age
Liv
esto
ckW
orke
rs49
1C
FET
/TFE
TY
ES
2002
-200
6
Pro
ject
2.3
Ext
ensi
onof
Vet
erin
ary
Serv
ices
n.a.
n.a.
*N
O20
03-2
006
Irri
gati
onD
ivis
ion
Pro
gram
1:R
ehab
ilita
tion
ofE
xist
ing
Irri
gati
onSc
hem
es
Pro
ject
1.1
Car
aulu
nE
mer
genc
yP
roje
ct86
CFE
T/T
FET
YE
S20
02-2
003
Pro
ject
1.2
Irri
gatio
nR
ehab
ilita
tion
Pro
ject
s85
CFE
T/T
FET
YE
S20
01-2
003
Pro
ject
1.3
Nat
ion-
wid
eIr
riga
tion
Reh
abil
itat
ion
Pro
ject
sn.
a.n.
a.*
NO
2003
-200
6
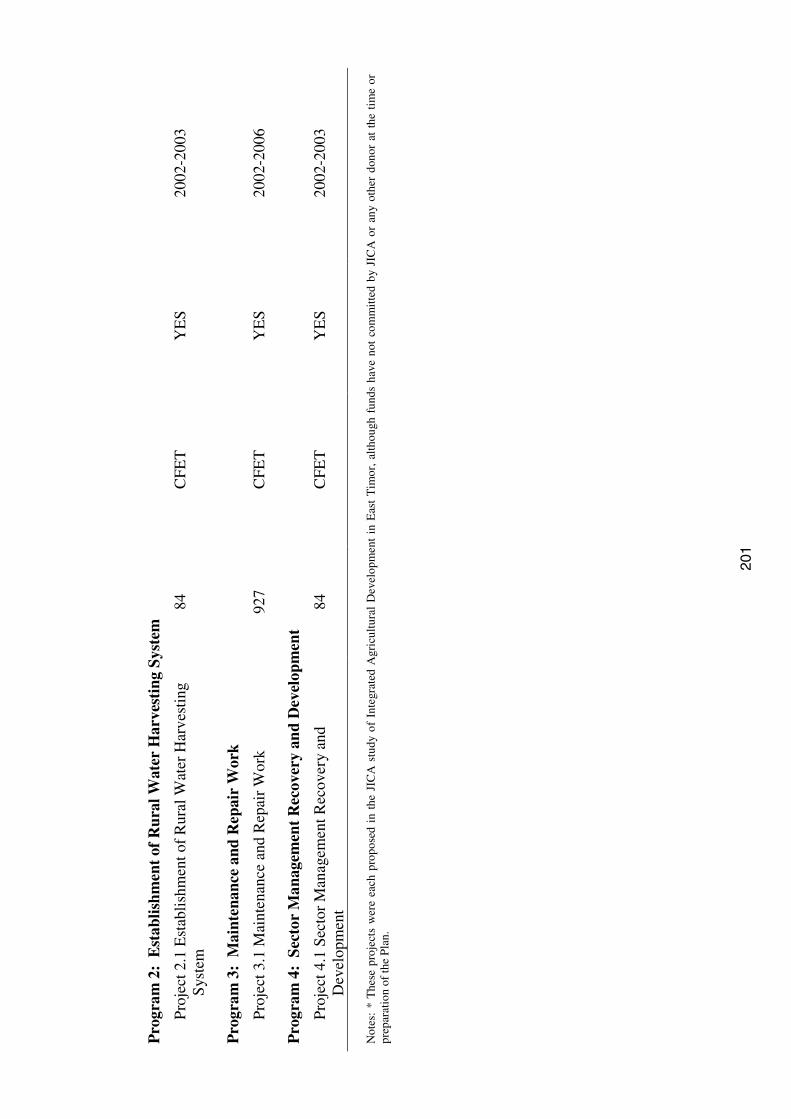
201
Pro
gram
2:E
stab
lishm
ent
ofR
ural
Wat
erH
arve
stin
gSy
stem
Pro
ject
2.1
Est
ablis
hmen
tof
Rur
alW
ater
Har
vest
ing
Sys
tem
84C
FET
YE
S20
02-2
003
Pro
gram
3:M
aint
enan
cean
dR
epai
rW
ork
Pro
ject
3.1
Mai
nten
ance
and
Rep
air
Wor
k92
7C
FET
YE
S20
02-2
006
Pro
gram
4:Se
ctor
Man
agem
ent
Rec
over
yan
dD
evel
opm
ent
Pro
ject
4.1
Sect
orM
anag
emen
tRec
over
yan
dD
evel
opm
ent
84C
FET
YE
S20
02-2
003
Not
es:
*T
hese
proj
ects
wer
eea
chpr
opos
edin
the
JIC
Ast
udy
ofIn
tegr
ated
Agr
icul
tura
lD
evel
opm
ent
inE
ast
Tim
or,
alth
ough
fund
sha
veno
tco
mm
itte
dby
JIC
Aor
any
othe
rdo
nor
atth
eti
me
orpr
epar
atio
nof
the
Pla
n.

202
Tab
le12
.26:
Pro
ject
sof
the
Dep
artm
ent
ofF
ishe
ries
and
Mar
ine
Env
iron
men
t,M
inis
try
ofA
gric
ultu
rean
dF
ishe
ries
,200
2/03
-200
6/07
Pro
gram
/Pro
ject
sC
ost
US$
’000
2002
–20
06F
undi
ngSo
urce
s(a
ctua
l&po
tent
ial)
Fun
ding
Ava
ilabl
e?Im
plem
enta
tion
Per
iod
Pro
gram
1:F
ishe
ries
and
Mar
ine
Env
iron
men
tM
anag
emen
t
Pro
ject
1.1
Fish
erie
sP
olic
y,A
ctan
dL
egis
latio
n58
CFE
T/A
usA
id
Pro
ject
1.2
Mar
itim
eB
ound
arie
san
dO
ffsh
ore
Mon
itori
ng14
2C
FET
Pro
ject
1.3
Fish
erie
sM
anag
emen
tPla
ns14
2C
FET
/Aus
Aid
/WB
Pro
ject
1.4
Staf
fT
rain
ing
141
CFE
T
Pro
ject
1.5
Res
earc
han
dD
ata
Col
lect
ion
141
CFE
T/A
usA
id
Pro
gram
2:F
ishe
ries
Indu
stry
Dev
elop
men
t
Pro
ject
2.1
Reh
abili
tatio
nof
Her
aP
ort
82C
FET
/TFE
TY
ES
2001
-200
4
Pro
ject
2.2
Impr
oved
Har
vest
and
Pos
t-H
arve
stM
etho
d14
0C
FET
/Ice
land
YE
S20
02-2
006
Pro
ject
2.3
Dev
elop
men
tof
aPr
ofes
sion
alC
hart
erB
oata
ndD
ivin
gIn
dust
ry13
8C
FET
YE
S20
02-2
006
Pro
gram
3:A
quac
ultu
re
Pro
ject
3.1.
Nat
iona
lDev
elop
men
tof
anA
quac
ultu
reIn
dust
ry13
8C
FET
/Por
tuga
lY
ES
2001
-200
4

203
Tab
le12
.27:
Pro
ject
sof
the
Dep
artm
ent
ofF
ores
try,
Min
istr
yof
Agr
icul
ture
and
Fis
heri
es,2
002/
03–
2006
/07
Pro
gram
/Pro
ject
sC
ost
US$
’000
2002
-20
06F
undi
ngSo
urce
sF
undi
ngA
vaila
ble?
Impl
emen
tati
onP
erio
d
Pro
gram
1:R
efor
esta
tion
and
For
est
Reh
abili
tati
on
Proj
ect1
.1A
grof
ores
try
145
CFE
T/C
IDA
YE
S20
02-2
006
Proj
ect1
.2R
efor
esta
tion
and
Soil
Con
serv
atio
n14
5C
FET
/TFE
T/P
ortu
gal
YE
S20
02-2
006
Proj
ect1
.3M
angr
ove
Reh
abili
tati
onan
dC
onse
rvat
ion
145
CFE
TY
ES
2002
-200
6
Proj
ect1
.4C
omm
unity
Fore
stry
144
CFE
T/C
IDA
YE
S20
02-2
006
Pro
ject
1.5
Nat
ion-
wid
eR
efor
esta
tion
n.a.
n.a.
NO
2003
-200
6
Pro
ject
1.6
Nat
ion-
wid
eC
omm
unit
yF
ores
try
n.a.
n.a.
NO
2003
-200
6
Pro
gram
2:F
ores
tP
rote
ctio
nan
dF
ores
tR
esou
rces
Man
agem
ent
Proj
ect2
.1.
Wat
ersh
edM
anag
emen
t14
1C
FET
YE
S20
02-2
006
Proj
ect2
.2.
Nat
iona
lPar
kan
dW
ildl
ife
Man
agem
ent
141
CFE
TY
ES
2002
-200
6
Proj
ect3
.3.
Publ
icIn
form
atio
nan
dE
duca
tion
141
CFE
TY
ES
2002
-200
6
Pro
gram
3:F
ores
tPro
duct
ion
and
Uti
lisat
ion
Proj
ect3
.1Fo
rest
Inve
ntor
y14
1C
FET
YE
S20
02-2
006
Proj
ect3
.2Fo
rest
Plan
ning
,Pol
icy
and
Leg
isla
tion
53C
FET
YE
S20
02-2
006
Proj
ect3
.3.
Fore
stU
tilis
atio
nan
dL
awE
nfor
cem
ent
194
CFE
TY
ES
2002
-200
6
Not
es:
*T
hese
proj
ects
wer
eea
chpr
opos
edin
the
JIC
Ast
udy
ofIn
tegr
ated
Agr
icul
tura
lD
evel
opm
ent
inE
ast
Tim
or,
alth
ough
fund
sha
veno
tco
mm
itte
dby
JIC
Aor
any
othe
rdo
nor
atth
eti
me
orpr
epar
atio
nof
the
Pla
n.
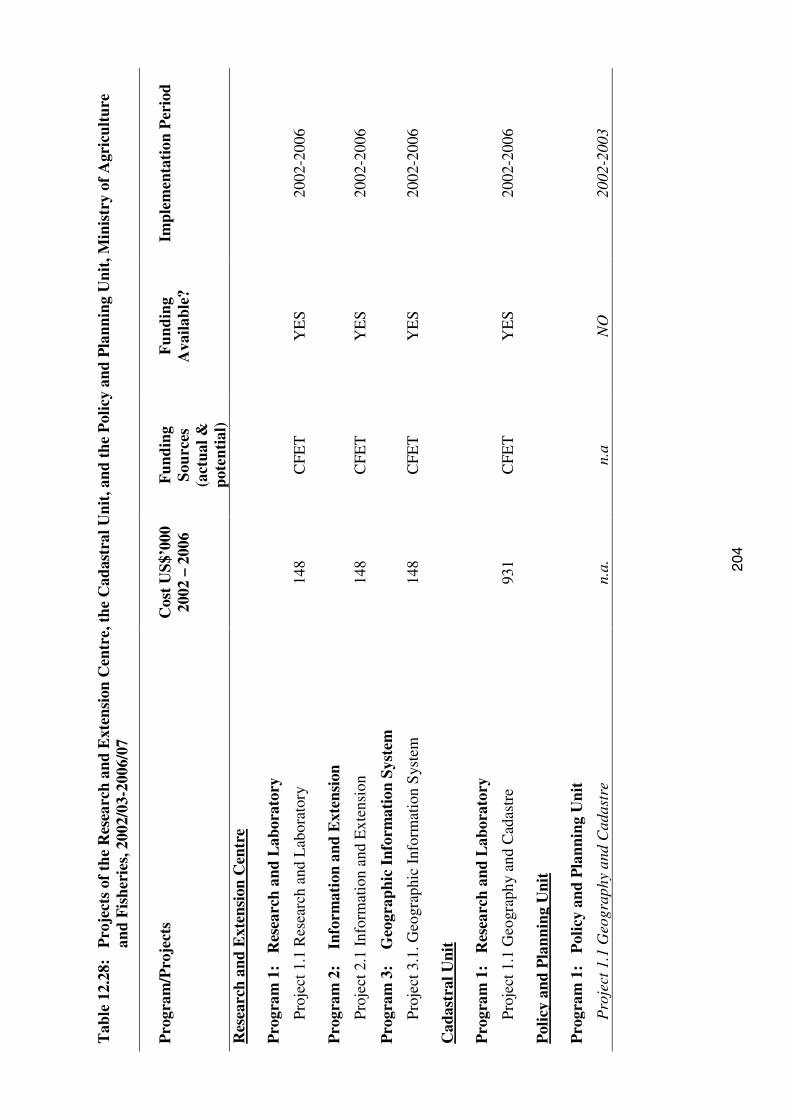
204
Tab
le12
.28:
Pro
ject
sof
the
Res
earc
han
dE
xten
sion
Cen
tre,
the
Cad
astr
alU
nit,
and
the
Pol
icy
and
Pla
nnin
gU
nit,
Min
istr
yof
Agr
icul
ture
and
Fis
heri
es,2
002/
03-2
006/
07
Pro
gram
/Pro
ject
sC
ost
US$
’000
2002
–20
06F
undi
ngSo
urce
s(a
ctua
l&po
tent
ial)
Fun
ding
Ava
ilabl
e?Im
plem
enta
tion
Per
iod
Res
earc
han
dE
xten
sion
Cen
tre
Pro
gram
1:R
esea
rch
and
Lab
orat
ory
Pro
ject
1.1
Res
earc
han
dL
abor
ator
y14
8C
FET
YE
S20
02-2
006
Pro
gram
2:In
form
atio
nan
dE
xten
sion
Pro
ject
2.1
Info
rmat
ion
and
Ext
ensi
on14
8C
FET
YE
S20
02-2
006
Pro
gram
3:G
eogr
aphi
cIn
form
atio
nSy
stem
Pro
ject
3.1.
Geo
grap
hic
Info
rmat
ion
Sys
tem
Cad
astr
alU
nit
148
CFE
TY
ES
2002
-200
6
Pro
gram
1:R
esea
rch
and
Lab
orat
ory
Pro
ject
1.1
Geo
grap
hyan
dC
adas
tre
931
CFE
T
Pol
icy
and
Pla
nnin
gU
nit
YE
S20
02-2
006
Pro
gram
1:P
olic
yan
dP
lann
ing
Uni
t
Pro
ject
1.1
Geo
grap
hyan
dC
adas
tre
n.a.
n.a
NO
2002
-200
3

205
APPENDIX 12.1: OVERVIEW OF DONOR FUNDED PROJECTS IN THEAGRICULTURE SECTOR
TFET PROJECT 1 OVERVIEW
1. Second Agriculture Rehabilitation Project (ARP II)
The aims of ARP II, with funding of $8.0 million from TFET and $0.9 million from CFET, areto improve food security of rural families and increase agricultural production in selected areasof East Timor. The implementation period is December 2001 to December 2003. Estimatedexpenditures in FY02/03 amount to $5.1 million. The project includes the following activities.
• Pilot Participatory Development and Natural Resources Management in up to 30 pilotcommunities in seven districts (Baucau, Covalima, Dili, Lautem, Liquica, Manufahi, andOecussi). This component will provide small grants to communities to strengthen their self-reliance and the management of their natural resources. The sub-sector focuses are forestryand fisheries, with other inter-sectoral inputs (crops and livestock).
• Rapid Infrastructure Rehabilitation, including 2,100 ha of community irrigation schemes,100 km of farm-to-market access roads, 1,430 ha of larger irrigation schemes, establishmentof 11 Water User Associations, and a feasibility study for schemes that suffered majordamage. The sub-sectoral focus is irrigation.
• Services to Farmers, including the provision of information, programming and establishmentof a small CGIAR Liaison Secretariat at MAF, vaccination services for livestock, andpiloting of a system of private Village Livestock Workers (VLWs). This component alsoincludes the establishment and initial operation of up to six Agriculture Service Centres(ASC), each of which would be privately run and owned by farmer associations, to facilitatethe marketing of agricultural commodities and provision of inputs. The sub-sector focusesare research and extension, livestock and crop production.
• Program Management, including policy advice in the areas of general agricultural policy,forestry strategy, fisheries baseline data, capacity building, minor equipment and vehicles fordistrict staff, and incremental operating costs and advisory services for a ProjectManagement Unit (PMU). The sub-sectoral focuses are crop production, fisheries, forestryand general administration.
2. Hera Port Rehabilitation Project (implemented through ADB)
This project, with funding of $1 million from TFET and $0.1 million from CFET, will assist theGovernment of East Timor to rehabilitate the Hera Fishing Port and put in place the necessaryinfrastructure to attract private investment for its operations. The project will be implementedthrough FY02/03, and is focused in Dili. Estimated expenditures in FY02/03 are $800,000 andthe sub-sectoral focus is fisheries.

206
BILATERAL PROJECTS OVERVIEW
1. Australian Centre for International Agricultural Research (ACIAR): Seeds for LifeProject
This project, valued at $266,000, is focused on: (a) evaluating the suitability of plant geneticmaterials provided by the Consultative Group of International Agricultural Research Centres(CGIAR) to East Timor conditions; (b) introducing modern cultivars to improve diseasetolerance, nutrient imbalance and climatic conditions; (c) improve farmers’ access to high qualityseeds of modern cultivars; and (d) gather baseline data for future development programs onincreasing farm productivity. The project runs from November 2000 to October 2003 in Ainaro,Bobonaro, Baucau, Aileu, Lautem, and Viqueque. The sub-sectoral focus is crop production.
2. AusAID: East Timor Rural Development Program
This project, with a total cost of $9.5 million, has an aim of assisting East Timor’s ruraldevelopment efforts in the districts of Bobonaro, Viqueque and Aileu. It consists of two majorphases. Phase I (January 2001 – December 2002) includes (a) project establishment; (b) rapidimpact projects in upland and lowland activities, supporting community-based activities (whichmight include, for example, lowland rice production, upland subsistence farming, small livestockprograms, chicken vaccination, and support to coffee production); and (c) three TechnicalResource Centres. During the second phase (January 2003-December 2005) the project willsupport detailed design and implementation of longer-term Rural Development Projects. This isa multi-sector project.
3. AusAID: Fisheries Management Planning
This project, at a cost of $907,500, aims to build the capacity of Fisheries staff to developpolicies and regulations associated with the management of East Timor’s marine fisheries, andassist MAF to design and implement a series of fisheries management plans in cooperation withcoastal communities. The project runs from February 2002 to January 2005, and is national inscope. The sub-sectoral focus is fisheries.
4. AusAID: Survey of Nearshore Fish Stocks – Dili Harbor
The principal aims of this small project ($7,700) are to assess the impact of current fishing levelson the fish stocks of Dili Harbor and provide scientific skills transfer to the fisheries staff atMAF. The project runs from April 2001 to August 2002, with a sub-sectoral focus of fisheries.
5. AusAID: Agriculture and Forestry Landuse Mapping and GIS Development andTraining.
This $760,000 project has aims to: (a) strengthen landuse mapping and GIS information on soilresources and classify agro-ecological zones; (b) develop zoning for organic coffee; (c) identifyof erosion-prone areas; (d) identify the layout of major irrigation schemes and the condition ofaccess roads; and (e) provide landuse baseline data. The project runs from November 2000 toNovember 2002, and is national in scope. The sub-sectoral focus is MAF’s Research andExtension Centre.

207
6. JICA: Study of Integrated Agriculture Development in East Timor
The aim of this project, at a cost of $3.7 million, is to formulate a mid-term comprehensivedevelopment plan for agriculture, forestry and fisheries in East Timor. It includes an assessmentof the present situation and problems, an inventory survey, and implementation of pilotagricultural projects for human resources development (including integrated upland agriculturalmanagement, and fisheries). The project runs from March 2001 to December 2002, and isnational in focus. The sub-sectoral focuses are multi-sectoral and general administration in MAF.
7. JICA: Capacity Building in East Timor, Japan and ASEAN Countries
This project (on a request basis) will provide technical assistance to MAF by providing Japaneseexperts and training in East Timor, Japan and ASEAN countries. The timing and funding aredependent on requests from MAF.
8. JICA: Rehabilitation and Strengthening of Rice Farming in Lautem and Manatutu
This project is focused on the distribution of seeds and tools to farmers, rehabilitation ofagricultural infrastructure, and capacity building for farmers’ groups, at a cost of $863,000. Theproject runs from February 2000 to January 2003, and is implemented in partnership withCARE. The sub-sectoral focus is crop production.
9. JICA: Recovery Program for Village Based Economic Activities in LosPalos/Manufahi
This project, at a cost of $241,000, is focused on farmers’ group organisation, comparativestudies, needs assessment, distribution of agricultural tools to, and assistance in commodityproduction and marketing. The project runs from March 2001 to March 2004, and isimplemented in partnership with Yayasan HAK. This is a multi-sector project.
10. JICA: Agriculture Development Project in Baucau
This project, at an initial cost of $330,000, is focused on technical assistance to farmers in riceproduction, vegetable production and livestock breeding in Baucau. It also involves a surveyabout further rural development assistance needs. This project is nearing completion and has asub-sectoral focus of crop production and livestock.
11. Portugal: Replanting of Coffee and Coffee Research
This project is focused on coffee research and coffee processing, at a cost of $265,000. Itinvolves seed selection, experiments on coffee shading, trials on composting, experiments withnursery construction techniques, integrated pest management, trials on planting techniques, andnursery construction and plant distribution to communities. The project runs from November2000 to 2003, and is operational in Ermera, Aileu, Ainaro and Same. The sub-sectoral focus iscrop production (industrial crops).
12. Portugal – Integrated Rehabilitation and Construction of Coffee ProcessingFacilities
This project (approximately $220,000) focuses on rehabilitation of coffee processing. It involvesrehabilitation of water capture, storage and allocation facilities; construction or rehabilitation ofcoffee processing facilities; coffee processing machinery supply; and demonstration andmaintenance of equipment. The project runs from April 2000 to 2003, and is operational in

208
Ermera, Aileu, Same, and Liquica. Estimated expenditures in FY02/03 amount to $70,000.Sub-sectoral focus: Crop Production (Industrial Crops).
17. Portugal: Reforestation and Alternative Cash Crops
This project, at a value of $310,000, has aims to set up nurseries for coffee shade trees, firewood,timber (sandalwood, teak and others) and tree species for erosion control, and provide strategicdistribution of seedlings to communities. The project runs from January 2002 to 2004, and isactive in Ermera, Aileu and Liquica. The sub-sectoral focus is forestry.
18. Portugal: Aquaculture
This $62,000 project has aims to do experiments on breeding different aquaculture species, andto undertake comparative studies in traditional and modern facilities. It also aims to supply fishfry to communities and, subsequently, evaluate the acceptance and possible further developmentof the project. The project runs from April 2001 to 2004/05, and is active in Ermera and Aileu,with a sub-sectoral focus of Fisheries.
19. Portugal: Capacity Building
This project, valued at $130,000, has aims to provide training on different techniques of nurseryconstruction for coffee, fruit trees, and forestry species, as well as aquaculture techniques. It alsoincludes capacity building for MAF, district staff, and associations and cooperatives offarmers/experts. The project runs from April 2001 to 2004/05, and is active in Ermera, Aileu,Same, and Ainaro. The sub-sectoral focuses are administration and multi-sectoral.
20. Portugal: Interaction with Other Institutions
This project, valued at $60,000, provides for interactions between East Timorese staff andvarious institutions, such as CIFC (Centro de Investigação das Ferrugens do Cafeeiro.), ISA(Instituto Superior de Agronomia), UTAD (Universidade de Tras dos Montes), INMG/UTAD(Instituto Nacional de Meteorologia e Geofisica), UA (Universidade de Aveiro), UE(Universidade de Evora), IHERA (Instituto de Hidraulica Engenharia Rural e Ambiente), Porbatt(Portuguese Battalion), and ACIAR. The project runs from January 2002 to 2003/04 and isnational in scope. The sub-sectoral focus is administration.
21. USAID: NCBA Timor Economic Rehabilitation and Development Project
This $12 million project has provided support to coffee cooperatives in East Timor since 1994. Itinvolves: (a) coordination of crop extension activities; (b) assessment of community welfareneeds; (c) finance; (d) processing facilities; (e) seedling nurseries; (f) demonstration plots; (g) avanilla seedling nursery; (h) community primary health care; (i) a Cooperative and SmallEnterprise Training Centre; and (j) a Consumer Goods Wholesale Cooperative run through smallenterprise village shops and kiosks. The project runs from 1994 to December 2002 and isoperational in the districts of Ermera, Ainaro, Aileu, Manufahi and Liquica. The sub-sectoralfocus is crop production (industrial crops).
22. USAID: Economic Recovery Program (Agriculture)
This program, valued at $900,000, is focused on the provision of materials and equipment tofarmers for various activities such as agro-processing inputs, rehabilitation of small-scaleirrigation schemes, industrial crops (e.g. Abaca), and fishpond rehabilitation. The project runsfrom 2001 to 2003 with a multi-sectoral focus.

209
MULTILATERAL PROJECTS OVERVIEW
1. UNDP/UNOPS: Ainaro and Manatutu Community Activation Project
This $5.1 million project is focused on food security improvement, strengthening linkages toagricultural services, and integrated watershed management. The project runs from December2001 to 2005, and will be active in Ainaro and Manatutu. It is a multi-sectoral project.
2. UNDP/UNOPS: Urgent Irrigation Rehabilitation Project II (funded by theGovernment of Japan)
This proposed project, at a value of $5.8 million, will focus on the rehabilitation of irrigationstructures in Laclo and Manautu, along with training of members of Water Users’ Associations.The sub-sectoral focus is irrigation.

210
13. NATURAL RESOURCES ANDENVIRONMENT
“Real, lasting poverty reduction is only possible if the environment is able to provide the services people depend on, and if natural resources are used in a
manner that does not undermine long-term development”
VISION
13.1 East Timor will manage and utilise its natural resources in a sustainablemanner that takes account of environmental needs in order to support economicgrowth and improved community welfare.
INTRODUCTION
13.2 The development and management of natural resources, including mineralresources, and the environment is the responsibility of the Department of Naturaland Mineral Resources (DNMR) and the Division of Environment (DoE), both ofwhich are agencies of the Ministry for Economic Affairs and Development. TheMinistry is also responsible for Trade and Industry, Energy, Investment andTourism.
13.3 East Timor is relatively poorly endowed with natural resources, apart fromthe oil and gas reserves of the Timor Sea. Anderson and Deutsch (eds., 2001) notethat oil and gas are amongst the few high value natural resources that can beexploited for economic purposes, with the Timor Sea thought to be one of theworld’s 20 richest oil deposits. Fisheries stocks are poorly understood, but mightalso comprise an important economic resource.
13.4 Natural resources are limited in East Timor, and given that the nationneeds to make best use of its various resources, the sound management of thoseresources is a critical matter. Best use in this instance means that resources mustbe used efficiently, thereby maximising the net benefits realised by thecommunity from such resource use. Sound management is normally taken tomean that resources are managed in a sustainable manner. The Conference onSustainable Development in East Timor (Anderson and Deutsch, eds., 2001, p. 8)adopted the World Conservation and Environmental Development Conference’sdefinition of sustainability; viz:
“sustainable development is development that meets the needs of the presentwithout compromising the ability of future generations to meet their ownneeds.”
13.5 East Timor is a mountainous country that is less than ideal for agriculturalproduction. Its soils are derived from limestone and metamorphosed marine claysand are, consequently, generally of low fertility. The generally steep terrain,
211
shallow soils and heavy rainfall events during the wet season, render many parts of East Timorvery prone to erosion. Deforestation and grazing often adds to the problems of loss of topsoil.Ongoing erosion causes sedimentation of rivers, reservoirs and near-shore marine areas.
13.6 Forest resources are widely used by households for both timber and non-timber purposes,and previously were also important in East Timor as export commodities. During the Portugueseand Indonesian administrations export income was earned from the sale of species such as teak,redwood, mahogany and sandalwood, all of which are native to East Timor. Apart fromsandalwood, timber products were mostly exported as unprocessed logs. Very little forest nowremains, and the vegetation consists largely of secondary forest, savanna and grassland. Theecology of the flora and fauna of East Timor is poorly understood.
13.7 Forests contribute to family livelihoods by providing firewood, non-timber products,poles and timber. Firewood collection is, however, a major cause of deforestation. Effectiveforest management has been achieved only in those few cases where the forest area has beenclearly defined and is recognised by the community.
13.8 There was substantial damage to the forestry sector during the violence of 1999. MostGovernment and private facilities were destroyed or stolen, while stockpiles of teak logs andabout 1,300 m3 of sandalwood for export were not allowed to leave. Large areas of mountainforests where resistance groups sheltered were defoliated and now comprise degraded scrubland.
13.9 UNDP (2000) concluded that East Timor’s marine ecosystem, if used in a sustainablefashion, has considerable potential to support economic development and sustain the population,thereby contributing to poverty reduction. Fisheries development is currently guided by aStrategic Plan formulated by the Department of Fisheries and Marine Environment (FME).
13.10 Many species of animal in East Timor are threatened with extinction, particularly thosethat rely on forests. A number of marine species are also thought to be under threat. The coastalzone is, however, considered to be in very good condition. Mangrove ecosystems aresubstantially intact and many beaches are fringed by coral reef. Reefs are a source of biodiversityand are important for the ecological functions they provide. Plans exist to create both terrestrialand marine protected areas in order to conserve biodiversity.
13.11 Pollution and the lack of waste management pose significant problems in the urban areasof East Timor. Consequently, they also pose human health risks as well as a threat to marineecosystems and species in nearby marine areas. Dili has a very limited sewerage system and aninadequate system for the collection and disposal of solid waste. Poor waste management hasresulted in the pollution of groundwater, which is the source of drinking water for many of thepeople living in Dili. Litter is a substantial problem, particularly in the urban areas, with plasticand other materials usually being washed into the ocean during storms, where they represent ahazard to marine species.
Poverty, Natural Resources and Environment
13.12 Consistent with the efforts to integrate environmental considerations into developmentpolicies and programs, it is now recognised that there is an “urgent need to integrateenvironmental concerns into poverty alleviation…” (World Bank Group, undated, p. v).Furthermore:
212
“Real, lasting poverty reduction is only possible if the environment is able toprovide the services people depend on, and if natural resources are used in amanner that does not undermine long-term development” (World Bank Group,undated, p. v).
13.13 Consideration of the links between environmental interventions and poverty reduction inEast Timor should allow: (1) an improvement in people’s health due to access to resources suchas potable water; (2) enhancement of the livelihoods of poor people, particularly those in ruralareas where people depend on land, water, forests and biodiversity; and (3) reduction of people’svulnerability to natural disasters such as violent storms, floods and fires.
MISSION
13.14 Two mission statements are reported here because the mission of the Department ofMinerals and Natural Resources (DNMR) is somewhat different to that of the Division ofEnvironment (DoE).
13.15 The mission of the DNMR is to:
Efficiently administer legislation relating to minerals, energy and extractive industries in aconsistent, fair, transparent, timely and accurate fashion; and partner industry and provideleadership in achieving regulatory reform.
13.16 The mission of the DoE is to:
Conserve and protect natural resources and environment in East Timor through sustainabledevelopment planning.
GOALS
13.17 The goals for the mineral and natural resources and environment sectors are to:
a) efficiently manage minerals, energy and extractive activities in a consistent, fair,environmentally appropriate, transparent and timely fashion;
b) protect and enhance the natural environment of East Timor;
c) raise community awareness about the importance of protecting the environmentand behaving in ways that support such protection;
d) work with other Government departments and agencies in integratingenvironmental considerations into their policies, programs and projects; and
e) ensure accountability to the Government and community for financial,environmental and safety aspects of the extractive and energy industries.
213
GUIDING PRINCIPLES
13.18 The guiding principles for development in the minerals, natural resources andenvironment sectors are as follows.
Sustainability
East Timor’s resources will be used in such a way that they will still be available to futuregenerations, or at least provide benefits to those future generations of East Timorese (e.g. bycareful investment of mining royalties).
Efficiency
The nation will make the best possible use of agricultural, water and other resources. They willbe used in such a way as to maximise the benefits from their use to all citizens (“allocativeefficiency”). It also means that the nation will not be wasteful with its resources – they will bemanaged and used carefully (“productive efficiency”) (Box 13.1).
Box 13.1: The Notion of Efficiency in Resource Use
Equity
Everyone will be treated equally or fairly. For example, people in rural areas should have thesame access to health, education and other services as people in urban areas, along with the sameopportunities to advance their living standards.
KEY DEVELOPMENT INDICATORS
13.19 The key development indicators for each sub-sector are the following.
Department of Natural and Mineral Resources
a) Establishment of a database on mining, minerals, oil and gas resources.
b) Trained cadré of East Timorese to deliver all services to the sector.
c) Development, promulgation and implementation of legislation and regulations formining, oil and gas.
d) Survey and mapping of the minerals, oil and gas resource base in East Timor.
Division of Environment
a) More effective appraisal of development proposals and consequent reducedenvironmental impacts from development activities.
The notion of economic efficiency is that a nation will manage and use its various resources insuch a way as to maximize the net social benefits to the whole of the nation from that use. Thisimplies that the ‘best’ or optimal combination of outputs is produced by means of the mostefficient combination of inputs. Efficiency can be at odds with equity, because an improvementin efficiency might make some people better off and some worse off. Policy-makers must dealwith such trade-offs.
214
b) Development, promulgation and implementation of legislation and regulations onenvironmental impact assessment and pollution control.
c) Increased capacity of DoE staff to implement environmental regulations.
d) Completion of policies on important environmental matters, including watercatchment management, coastal zone management and biodiversity conservation.
PROBLEMS AND CONSTRAINTS
13.20 The problems and constraints faced by both DNMR and DoE are, in general, the same.Where either the Department or the Division face unique difficulties those are noted below.
Capacity
Both agencies face a lack of institutional and personnel capacity to undertake the wide range oftasks with which they are confronted. DoE has neither the number of staff, nor suitably skilledstaff, to meet its myriad of important challenges. Similarly, DNMR has a very small staffcomplement, although it is planned to increase staff numbers considerably through the Planperiod. The DNMR also confronts the problem of a lack of appropriate staff skills.
Legal and Regulatory Frameworks
The enabling legal and regulatory frameworks currently do not exist to support theresponsibilities of both DNMR and DoE. The legal and regulatory legacy from the Indonesianadministration is both irrelevant and ineffective. This also results in weak control of theenvironmental impacts of various development activities and, in the case of DoE, reduces itseffectiveness in establishing cooperative mechanisms with other agencies in relation toenvironmental management.
Data and Information
Neither DNMR nor DoE has access to relevant and accurate data on the inventory and state ofnatural resources and the environment of East Timor. The lack of such information constrainstheir ability to ensure sustainable development and management of these resources.
Financial Resources
Both agencies face severe budgetary constraints for staffing, other recurrent costs and capitalequipment. Both require certain capital equipment to meet their responsibilities and, therefore,they will rely on donor support in the medium term to establish both a stock of needed capitalequipment and a cadré of suitably trained staff.
Acknowledgment and Independence
These constraints apply particularly to DoE. The existing institutional structure means that DoEis not a fully independent body, constraining its ability to make and implement decisions on theappropriateness of particular development proposals. Concomitantly, there is little or noacknowledgment that DoE and its attendant environmental legislation (once developed andimplemented) should play a role as an independent umbrella agency that can regulate alldevelopment activities, particularly those that carry environmental risks.
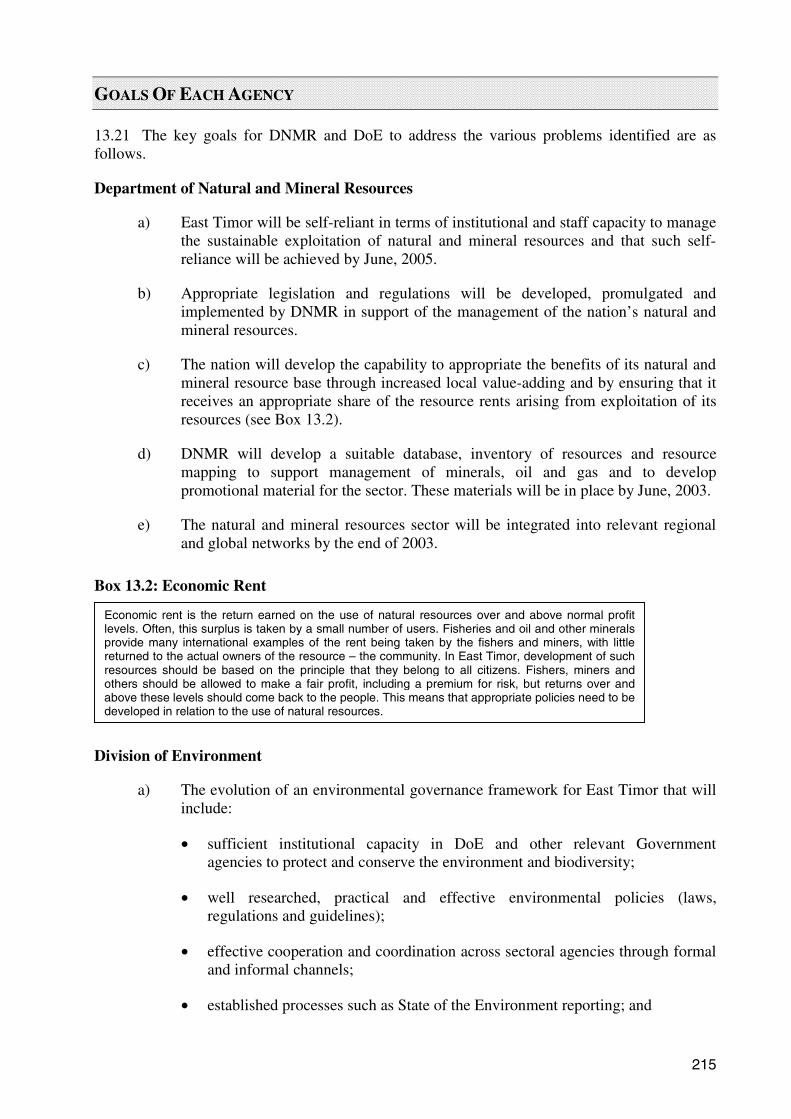
215
GOALS OF EACH AGENCY
13.21 The key goals for DNMR and DoE to address the various problems identified are asfollows.
Department of Natural and Mineral Resources
a) East Timor will be self-reliant in terms of institutional and staff capacity to managethe sustainable exploitation of natural and mineral resources and that such self-reliance will be achieved by June, 2005.
b) Appropriate legislation and regulations will be developed, promulgated andimplemented by DNMR in support of the management of the nation’s natural andmineral resources.
c) The nation will develop the capability to appropriate the benefits of its natural andmineral resource base through increased local value-adding and by ensuring that itreceives an appropriate share of the resource rents arising from exploitation of itsresources (see Box 13.2).
d) DNMR will develop a suitable database, inventory of resources and resourcemapping to support management of minerals, oil and gas and to developpromotional material for the sector. These materials will be in place by June, 2003.
e) The natural and mineral resources sector will be integrated into relevant regionaland global networks by the end of 2003.
Box 13.2: Economic Rent
Division of Environment
a) The evolution of an environmental governance framework for East Timor that willinclude:
• sufficient institutional capacity in DoE and other relevant Governmentagencies to protect and conserve the environment and biodiversity;
• well researched, practical and effective environmental policies (laws,regulations and guidelines);
• effective cooperation and coordination across sectoral agencies through formaland informal channels;
• established processes such as State of the Environment reporting; and
Economic rent is the return earned on the use of natural resources over and above normal profitlevels. Often, this surplus is taken by a small number of users. Fisheries and oil and other mineralsprovide many international examples of the rent being taken by the fishers and miners, with littlereturned to the actual owners of the resource – the community. In East Timor, development of suchresources should be based on the principle that they belong to all citizens. Fishers, miners andothers should be allowed to make a fair profit, including a premium for risk, but returns over andabove these levels should come back to the people. This means that appropriate policies need to bedeveloped in relation to the use of natural resources.

216
• ratification, where appropriate, of relevant international treaties andconventions.
b) DoE will facilitate increased awareness of environmental issues amongst the publicand Government agencies through publications, campaigns and environmentalcurricula.
c) Air, water and soil pollution will be managed, particularly in urban areas.
d) The environmental impacts of existing developments will be better managed, whilean effective system for the environmental appraisal and review of investmentproposals will be implemented.
e) DoE will establish a well-researched approach to biodiversity protection andconservation, including the establishment of a system of protected areas for EastTimor.
POLICIES
13.22 Based on the problems and constraints and, subsequently, the goals of DNMR and DoE,the following basic policies will be formulated.
Department of Natural and Mineral Resources
a) Extensive institutional and capacity building programs in the period 2002-2006 toyield an appropriate institutional structure, including the establishment of aseparate Ministry of Minerals, Natural Resources and Energy, along with thedevelopment of a critical mass of local East Timorese staff with the requisite skillsto manage all activities in these sectors.
b) The Department will establish an enabling legal and regulatory framework basedon the national resource base.
c) DNMR will identify and join regional and global natural and mineral resourcesnetworks, develop strategic alliances that facilitate the appropriate exploitation ofEast Timor’s mineral and natural resources, and promote the minerals, mining, oiland gas resources of the nation to the world.
Division of Environment
a) DoE will emphasise capacity development initiatives to build specialistenvironmental and other required skills amongst its staff, and support such capacitydevelopment in other Government agencies.
b) Institutional strengthening of DoE will be a focus of policy, with assistance frombilateral and multilateral donors.
c) Appropriate regulatory and legal frameworks that support environmentalmanagement will be developed, beginning with regulations on pollution controland environmental assessment.
d) Considerable focus will be placed on strengthening cross-sectoral linkages toimprove the coordination of environmental management and raise the profile of
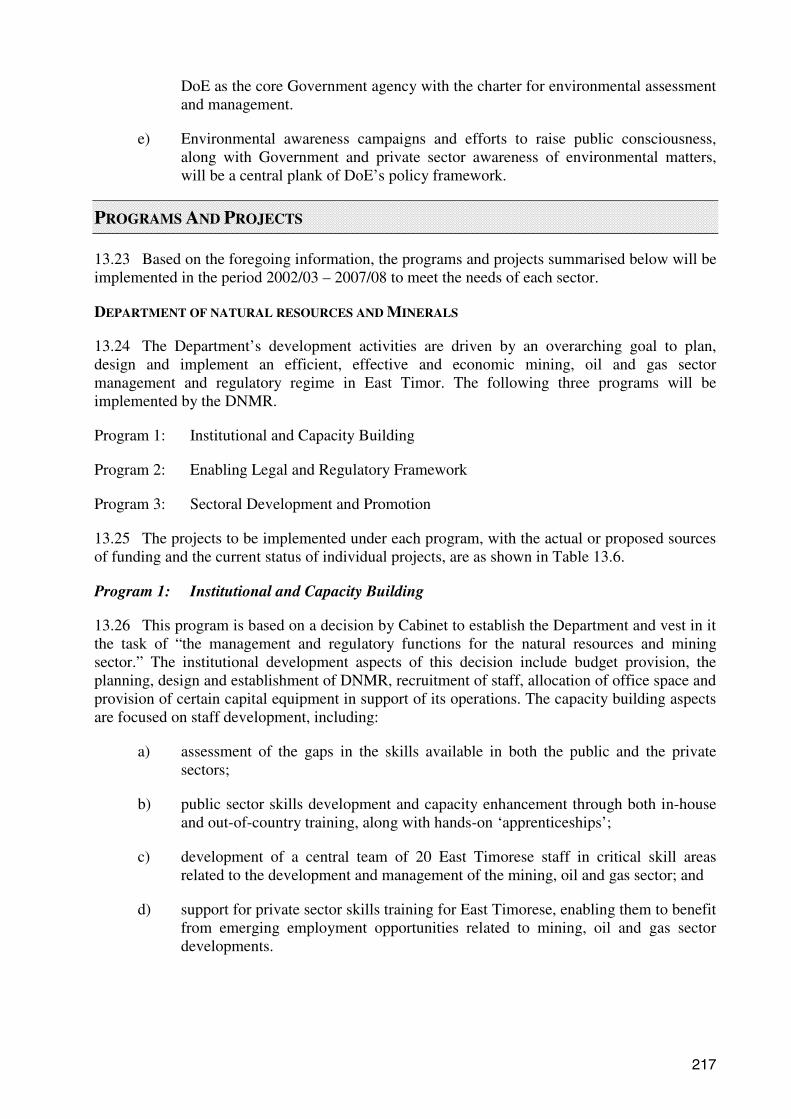
217
DoE as the core Government agency with the charter for environmental assessmentand management.
e) Environmental awareness campaigns and efforts to raise public consciousness,along with Government and private sector awareness of environmental matters,will be a central plank of DoE’s policy framework.
PROGRAMS AND PROJECTS
13.23 Based on the foregoing information, the programs and projects summarised below will beimplemented in the period 2002/03 – 2007/08 to meet the needs of each sector.
DEPARTMENT OF NATURAL RESOURCES AND MINERALS
13.24 The Department’s development activities are driven by an overarching goal to plan,design and implement an efficient, effective and economic mining, oil and gas sectormanagement and regulatory regime in East Timor. The following three programs will beimplemented by the DNMR.
Program 1: Institutional and Capacity Building
Program 2: Enabling Legal and Regulatory Framework
Program 3: Sectoral Development and Promotion
13.25 The projects to be implemented under each program, with the actual or proposed sourcesof funding and the current status of individual projects, are as shown in Table 13.6.
Program 1: Institutional and Capacity Building
13.26 This program is based on a decision by Cabinet to establish the Department and vest in itthe task of “the management and regulatory functions for the natural resources and miningsector.” The institutional development aspects of this decision include budget provision, theplanning, design and establishment of DNMR, recruitment of staff, allocation of office space andprovision of certain capital equipment in support of its operations. The capacity building aspectsare focused on staff development, including:
a) assessment of the gaps in the skills available in both the public and the privatesectors;
b) public sector skills development and capacity enhancement through both in-houseand out-of-country training, along with hands-on ‘apprenticeships’;
c) development of a central team of 20 East Timorese staff in critical skill areasrelated to the development and management of the mining, oil and gas sector; and
d) support for private sector skills training for East Timorese, enabling them to benefitfrom emerging employment opportunities related to mining, oil and gas sectordevelopments.
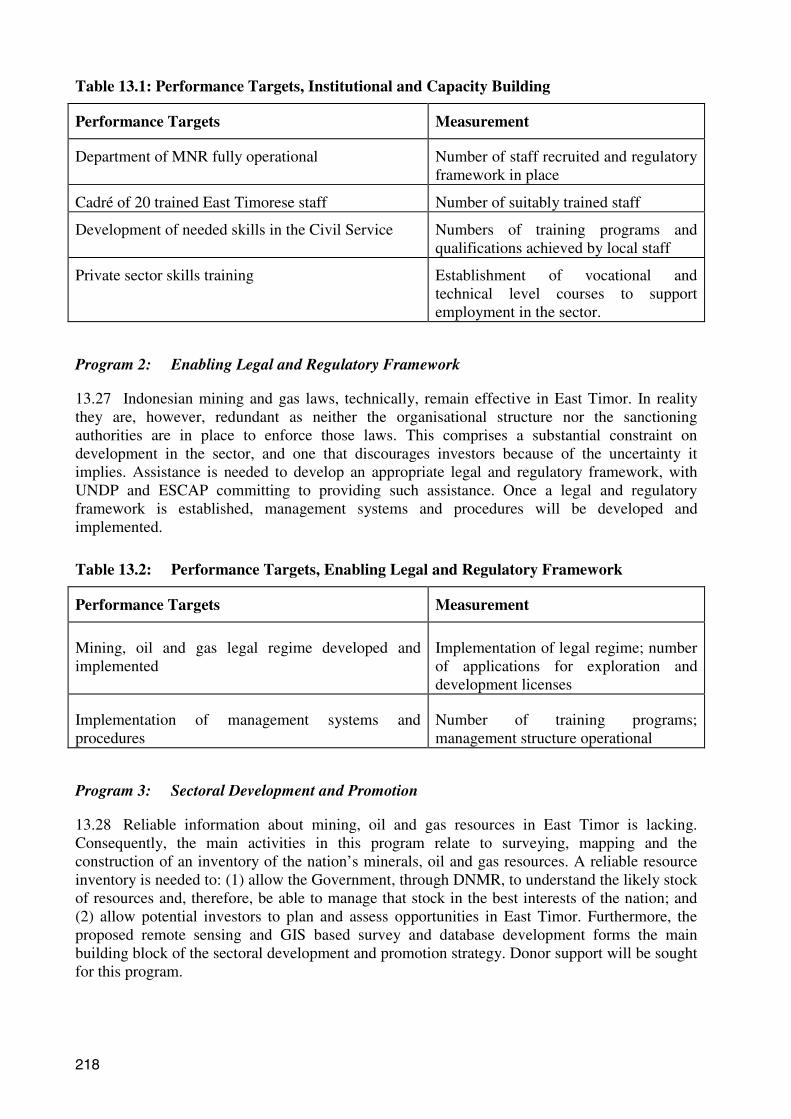
218
Table 13.1: Performance Targets, Institutional and Capacity Building
Performance Targets Measurement
Department of MNR fully operational Number of staff recruited and regulatoryframework in place
Cadré of 20 trained East Timorese staff Number of suitably trained staff
Development of needed skills in the Civil Service Numbers of training programs andqualifications achieved by local staff
Private sector skills training Establishment of vocational andtechnical level courses to supportemployment in the sector.
Program 2: Enabling Legal and Regulatory Framework
13.27 Indonesian mining and gas laws, technically, remain effective in East Timor. In realitythey are, however, redundant as neither the organisational structure nor the sanctioningauthorities are in place to enforce those laws. This comprises a substantial constraint ondevelopment in the sector, and one that discourages investors because of the uncertainty itimplies. Assistance is needed to develop an appropriate legal and regulatory framework, withUNDP and ESCAP committing to providing such assistance. Once a legal and regulatoryframework is established, management systems and procedures will be developed andimplemented.
Table 13.2: Performance Targets, Enabling Legal and Regulatory Framework
Performance Targets Measurement
Mining, oil and gas legal regime developed andimplemented
Implementation of legal regime; numberof applications for exploration anddevelopment licenses
Implementation of management systems andprocedures
Number of training programs;management structure operational
Program 3: Sectoral Development and Promotion
13.28 Reliable information about mining, oil and gas resources in East Timor is lacking.Consequently, the main activities in this program relate to surveying, mapping and theconstruction of an inventory of the nation’s minerals, oil and gas resources. A reliable resourceinventory is needed to: (1) allow the Government, through DNMR, to understand the likely stockof resources and, therefore, be able to manage that stock in the best interests of the nation; and(2) allow potential investors to plan and assess opportunities in East Timor. Furthermore, theproposed remote sensing and GIS based survey and database development forms the mainbuilding block of the sectoral development and promotion strategy. Donor support will be soughtfor this program.

219
Table 13.3: Performance Targets, Sectoral Development and Promotion
Performance Targets Measurement
Complete survey and mapping of mineral, oiland gas resources in East Timor
Data available and accessible andusable in support of promotionand sectoral development
DIVISION OF ENVIRONMENT
13.29 The overarching goal of DoE is to implement a National Environmental ManagementPlan (NEMP) for East Timor, which is a necessary part of the Government’s approach tosustainable development. The implementation of the NEMP will play an important role inpoverty reduction through improved access to clean water and other resources, and alsocontribute to economic growth in the long term because of improved management of the nation’sscarce natural resources. Under the NEMP development proposals will be screened for potentialimpacts and advice given on the need for environmental management plans or environmentalimpact assessment (EIA). Effective laws and capable staff will ensure that such processes areefficient and provide investors with high quality advice. While improving the investmentenvironment, it will also reduce the economic and social costs of environmental damage.Environmental awareness and education for the community will support a cleaner environmentand have positive heath outcomes.
13.30 DoE will focus on one overall program, viz:
Program 1: Environmental Governance Framework for East Timor
The projects to be implemented under this program, with the actual or proposed sources offunding and the current status of individual projects, are as shown in Table 13.5. The projectsand the principal elements in each project are as summarised in Table 13.4.
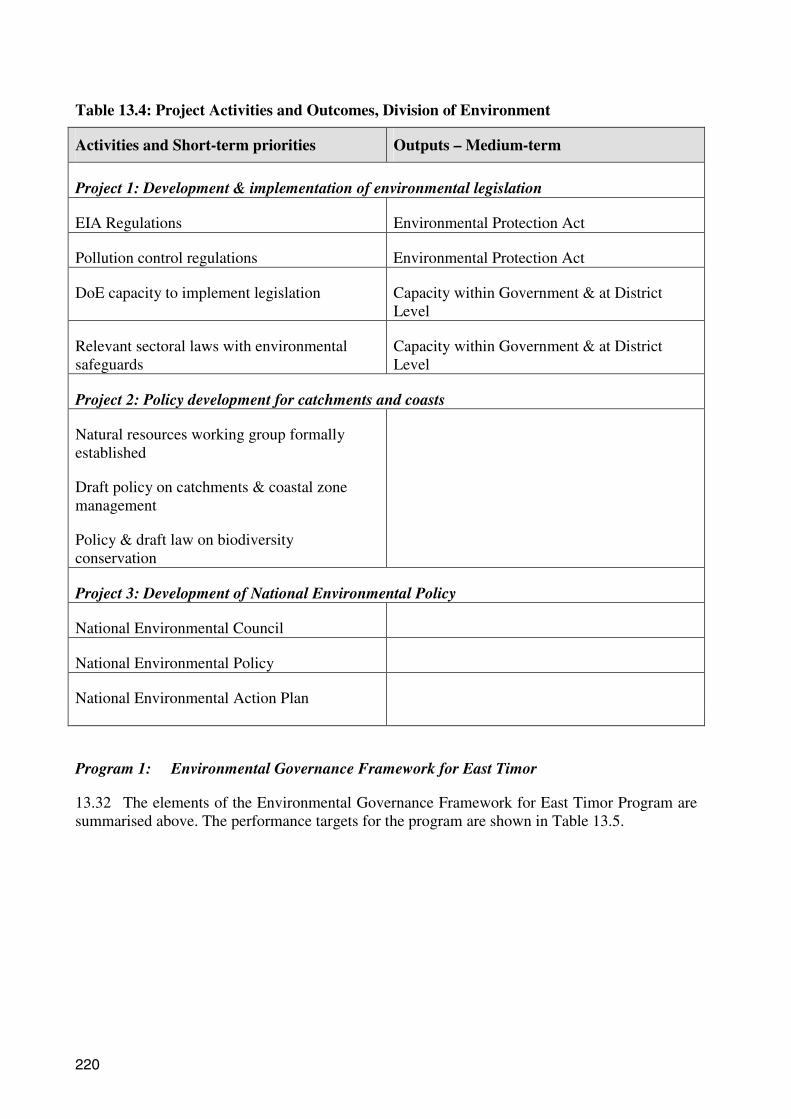
220
Table 13.4: Project Activities and Outcomes, Division of Environment
Activities and Short-term priorities Outputs – Medium-term
Project 1: Development & implementation of environmental legislation
EIA Regulations Environmental Protection Act
Pollution control regulations Environmental Protection Act
DoE capacity to implement legislation Capacity within Government & at DistrictLevel
Relevant sectoral laws with environmentalsafeguards
Capacity within Government & at DistrictLevel
Project 2: Policy development for catchments and coasts
Natural resources working group formallyestablished
Draft policy on catchments & coastal zonemanagement
Policy & draft law on biodiversityconservation
Project 3: Development of National Environmental Policy
National Environmental Council
National Environmental Policy
National Environmental Action Plan
Program 1: Environmental Governance Framework for East Timor
13.32 The elements of the Environmental Governance Framework for East Timor Program aresummarised above. The performance targets for the program are shown in Table 13.5.

221
Table 13.5: Performance Targets, Environmental Governance Framework for EastTimor
Performance Targets Measurement
EIA regulations prepared and implemented by June2003
Passing of regulations by Parliament;application to development activities
Reduced pollution in Dili and other urban areas Fewer cases of gross pollution. Pollutionlicenses issued for major hotels &polluting industries in Dili
Three DoE Bulletins produced each year.
Celebration of World Environment Day in 2003
Increased awareness of environmental issues
Number of Bulletins, number of peopleattending Environment Day celebrations
Natural Resources Working Group meets at least 4times per year
Number of meetings, issues raised andacted upon
Initial draft policies produced and released fordiscussion by June 2003
Development of draft environmentalpolicies on pollution control and EIA.Number of people consulted about policies
Capacity building of DoE staff through trainingprograms in East Timor & overseas; at least oneeach of language training, technical skills training,management training
Number of training programs andpersonnel receiving training; increase intechnical skills
Environmental capacity development at Districtlevel
Employment of consultant by November,2002; recruitment of 4 District staffmembers, number of workshops andtraining programs
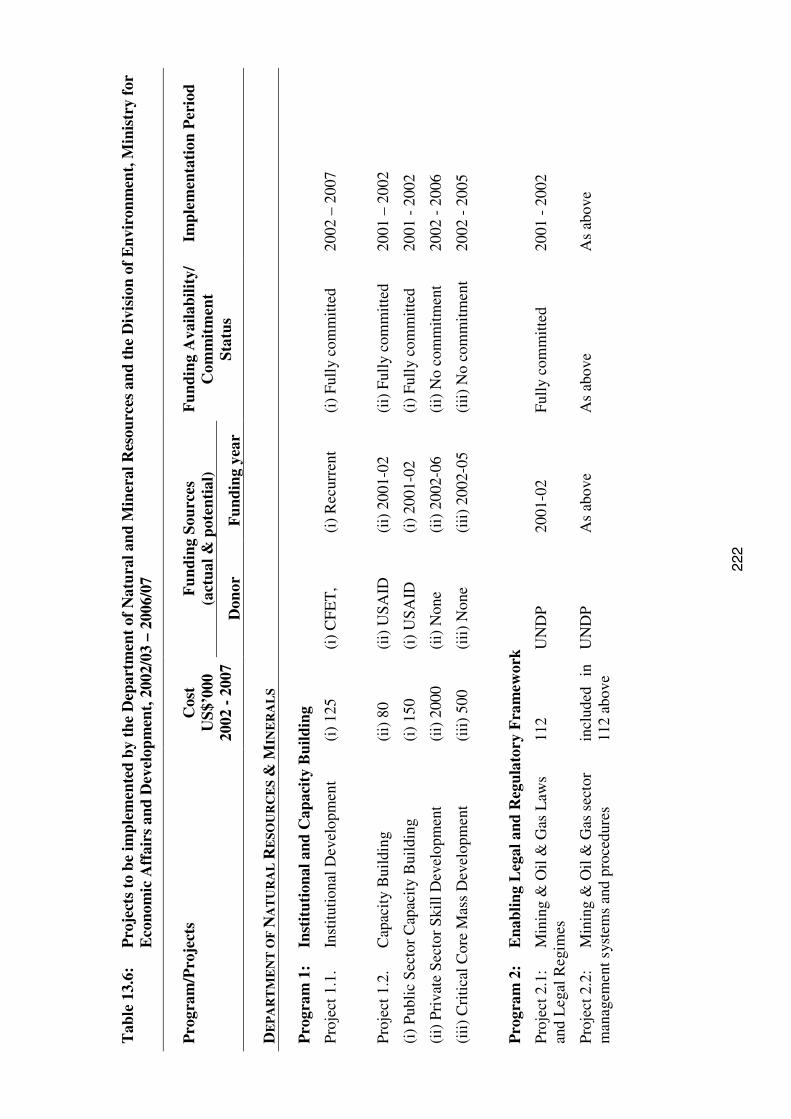
222
Tab
le13
.6:
Pro
ject
sto
beim
plem
ente
dby
the
Dep
artm
ent
ofN
atur
alan
dM
iner
alR
esou
rces
and
the
Div
isio
nof
Env
iron
men
t,M
inis
try
for
Eco
nom
icA
ffai
rsan
dD
evel
opm
ent,
2002
/03
–20
06/0
7
Fun
ding
Sour
ces
(act
ual&
pote
ntia
l)P
rogr
am/P
roje
cts
Cos
tU
S$’0
0020
02-
2007
Don
orF
undi
ngye
ar
Fun
ding
Ava
ilabi
lity/
Com
mit
men
tSt
atus
Impl
emen
tati
onP
erio
d
DE
PA
RT
ME
NT
OF
NA
TU
RA
LR
ESO
UR
CE
S&
MIN
ER
AL
S
Pro
gram
1:In
stit
utio
nala
ndC
apac
ity
Bui
ldin
g
Pro
ject
1.1.
Inst
itutio
nalD
evel
opm
ent
(i)
125
(i)
CFE
T,
(i)
Rec
urre
nt(i
)Fu
lly
com
mitt
ed20
02–
2007
Pro
ject
1.2.
Cap
acit
yB
uild
ing
(ii)
80(i
i)U
SAID
(ii)
2001
-02
(ii)
Full
yco
mm
itte
d20
01–
2002
(i)
Pub
lic
Sec
tor
Cap
acit
yB
uild
ing
(i)
150
(i)
USA
ID(i
)20
01-0
2(i
)Fu
lly
com
mitt
ed20
01-
2002
(ii)
Priv
ate
Sec
tor
Ski
llD
evel
opm
ent
(ii)
2000
(ii)
Non
e(i
i)20
02-0
6(i
i)N
oco
mm
itmen
t20
02-
2006
(iii)
Cri
tical
Cor
eM
ass
Dev
elop
men
t(i
ii)
500
(iii)
Non
e(i
ii)20
02-0
5(i
ii)N
oco
mm
itmen
t20
02-
2005
Pro
gram
2:E
nabl
ing
Leg
alan
dR
egul
ator
yF
ram
ewor
k
Pro
ject
2.1:
Min
ing
&O
il&
Gas
Law
san
dL
egal
Reg
imes
112
UN
DP
2001
-02
Full
yco
mm
itted
2001
-20
02
Pro
ject
2.2:
Min
ing
&O
il&
Gas
sect
orm
anag
emen
tsys
tem
san
dpr
oced
ures
incl
uded
in11
2ab
ove
UN
DP
As
abov
eA
sab
ove
As
abov
e

223
Pro
gram
3:Se
ctor
alD
evel
opm
ent
and
Pro
mot
ion
Pro
ject
3.1:
Nat
ural
and
Min
eral
Res
ourc
esSu
rvey
and
Map
ping
toD
evel
opa
Rel
iabl
eD
atab
ase
for
Res
ourc
es
1,50
0U
ND
P(1
12),
othe
rdo
nors
tobe
iden
tifie
d
2001
-03
Initi
alw
ork
unde
rU
ND
Ppr
ojec
t2.1
,ot
her
dono
rsto
beid
enti
fied
2001
-20
03
Pro
ject
3.2:
Sect
oral
Prom
otio
nan
dM
arke
ting
Str
ateg
y25
0C
FET
(85)
othe
rdo
nors
tobe
iden
tifie
d
2002
-06
Init
ialw
ork
unde
rC
FET
allo
catio
n,ot
her
dono
rsto
beid
entif
ied
2002
-20
06
DIV
ISIO
NO
FE
NV
IRO
NM
EN
T
Pro
gram
1:E
nvir
onm
enta
lGov
erna
nce
Fra
mew
ork
for
Eas
tT
imor
Pro
ject
1.1:
Dev
elop
men
t&im
plem
enta
tion
ofen
viro
nmen
tall
egis
lati
on25
0C
FET
,Asi
anD
evel
opm
entB
ank
Yes
2002
–20
04
Pro
ject
1.2:
Polic
yD
evel
opm
entf
orC
atch
men
ts&
Coa
sts
363
Don
or(s
)to
beid
entif
ied
No
2003
–20
05
Pro
ject
1.3:
Dev
elop
men
tof
Nat
iona
lE
nvir
onm
enta
lPol
icy
411
Don
or(s
)to
beid
entif
ied
No
2005
–20
07
224
14. INDUSTRY, TRADE AND THE PRIVATESECTOR
“Private sector investment and entrepreneurial activity, stimulated by continued reconstruction activity and donor inputs in the near-term, will be
the key driver of poverty reduction and economic growth in East Timor in the medium- to long-term.”
VISION
14.1 To establish an East Timorese economy that is stable and that enables asociety to be just and prosperous.
INTRODUCTION
14.2 As part of the national planning process, the Working Group for Industry,Trade and the Private Sector reached a consensus on a sector Vision, as well as onsector Goals, Guiding Principles and Key Development Indicators. These arepresented in Box 14.1. The agreed Vision, Goals and Guiding Principles thenformed the basis for preparation of the future work programs of the five Divisionswithin the MEAD. Details of the programs are set out below. Each division hasperformance indicators related to programmatic activities and objectives. Theseprograms were agreed within the proposed Medium-Term Fiscal Framework thatcovers the financial year 2002-2003 and the three subsequent financial years.
14.3 The foundations of a market-based economy were implicitly set during theUNTAET period and have since been confirmed in the articles of the recentlyadopted Constitution. The Government has embarked on a model of economicgrowth led by private business, supported by an open approach to trade andinvestment, and coupled with significant emphasis on human development andgood governance. Private sector investment and entrepreneurial activity,stimulated by continued reconstruction activity and donor inputs in the near-term,will be the key driver of poverty reduction and economic growth in East Timor inthe medium- to long-term.
14.4 The transition period has witnessed a return to economic growth and arapid restoration of much of the regular supply of goods and services. Theeconomy will undergo further transformation during the life of the Plan. First, thelevel of international financial support and the size of the international presencewill begin to reduce over the next few years, and the magnitude of reconstructionprograms will also decline, possibly causing negative rates of economic growth in2002-2003 and 2003-2004. Second, toward the end of the life of the Plan,relatively large revenues from the oil and gas sector are expected to commence.Both changes pose risks and opportunities to the economy and both have beenfactored into the national planning process as fully as possible.
14.5 The successful transition to “economic independence” will continue torequire substantial support from international donors for private sectordevelopment in the medium-term. In an economic sense, East Timor must buildfrom a very low base and the constraints on growth are many. But there are

225
certain opportunities that East Timor can pursue. Offshore oil and gas resources present the mostsignificant opportunity and, if well managed, will be the principal source of East Timor’sintergenerational wealth. Perhaps more important though will be the need to develop further thenon-oil and gas sectors of the economy, in particular agriculture and fisheries. This will beimportant in terms of reducing the level of poverty among the poorest, especially in rural areas,and helping to avoid over-investment in industries producing non-tradable goods following thestart of inward flows of oil and gas revenues. East Timor also has potential for sustained growthin tourism and among select forestry products.
14.6 More efficient and effective processing of raw materials, natural resources, and inparticular agricultural produce, will subsequently enhance domestic development as well ascontribute to export revenues. With better transport, communications infrastructure and better-educated workers, East Timor over time will become more attractive to investors.
14.7 The principal task of East Timor’s economic policy-makers, however, is to develop thebest possible enabling environment in which private sector business activity can succeed.Accordingly, this is the central thrust of the programmatic initiatives set out in the Plan.Continued development of the business regulatory environment, reinforced through effectivepromotional activities, is the cornerstone of the sector’s plan. This will place a demand upon theresources of those parts of Government responsible for preparing and passing legislation andsubordinate legal instruments. Several parts of the regulatory framework have been readied tovarying stages, for example the foreign investment law. However, other areas such as legislationaddressing land reform and uncertain property title have not yet been effectively addressed.Overall, there are three broad areas of intended program activity within the sector:
a) Policy and regulatory development related to the private sector-enablingenvironment.
b) Government and joint public-private promotion of industry, investment, tourismand trade.
c) Capacity building of civil servants and private sector operators.
14.8 The largest portion of East Timor’s private sector is its micro-enterprises and SMEs, andthe needs of these businesses dominate the policy-making horizon. As the formal enablingframework takes greater form, and as private sector activity deepens and the average size andcapacity of businesses grows, a key challenge will be to take advantage of downstreamopportunities that may follow from the offshore oil and gas operations. This includes seeking tobuild the capacity of smaller businesses, developing better domestic and foreign supply chains,and broadening the economic base, thus generating more employment, utilizing more advancedtechnology, and increasing non-oil and gas exports. This will be the principal task of greatestrelevance to economic policy-makers in the years to come and will continue well beyond the lifeof the Plan.
14.9 Trade, both foreign and domestic, will play a crucial role in achieving this growth anddevelopment. East Timor should actively develop its trading industries, especially those with anexport focus, and seek to increase trade with its neighboring countries, mainly Indonesia andAustralia, where proximity to markets and logistics provide realistic opportunities. East Timorshould seek membership of appropriate trade groupings and seek preferential treatment from keyexport markets. East Timor’s foreign trade regime needs to be carefully set. It needs to be open,and it needs to reflect the fact that East Timor shares land and sea borders with Indonesia andthese borders will become increasingly porous. Import tariffs set too highly in such an

226
environment will tend to encourage inward smuggling and loss of customs revenue. Whileimports can bring technologies and products essential to growth and development, imports canalso destabilize the economy, fuel higher prices, and polarize employment opportunities in thenear term. Therefore, it is imperative that growth in trade and foreign investment does notdisenfranchise the population and cause incidental costs to the environment and society.Similarly, domestic trade will play an important part in continuing to restore the supply of goodsand services, especially to outlying rural areas. This has already occurred to some extent, mainlyenabled by a relatively rapid replacement of the national truck and bus fleet since 1999.
14.10 Development of East Timor’s agricultural base and its rural areas will be an importantpart of economic growth and poverty reduction strategies. New manufacturing capacity will betargeted in rural areas where rural non-farm employment opportunities can be generated.Processing of raw materials and agricultural products to add value to outputs will enhancedomestic development as well as contribute to export revenues and reduce poverty.
14.11 In building the enabling environment, the following are the main issues that East Timorwill need to address:
a) minimize barriers to domestic and foreign investments
b) provide more certain land and property rights, especially for enterprisedevelopment
c) improve availability of, and access to, credit for micro-enterprises and SMEs
d) expedite enactment of key laws
e) ensure that enhancement of the policy and regulatory framework is matched bycorresponding capacity of the legal system to adjudicate
f) increase level and diversity of exports, and improve domestic productive capacity
g) maintain sufficient flexibility and competitiveness in the national wage structure
h) soundly invest proceeds from offshore oil and gas extraction
14.12 The Working Group and the MEAD undertook an extensive amount of analysis of policyand strategy options which formed the basis of decisions on the programs and projects presentedhere. This process of analysis was, in itself, an important outcome of the national planningprocess. The Working Group and the MEAD also recognize that the formulation of the Plan isthe beginning rather than the end of the planning process. Beyond the scope of this document,the MEAD will establish action plans that will be used to guide the ongoing activities requiredwithin the programs and projects. The MEAD is also aware of the importance of monitoring andevaluating progress against performance indicators as they are set out in the Plan and willinstitute appropriate monitoring and evaluation systems.
14.13 The national planning process has shown a large number of outstanding requirements thatwould benefit from additional external assistance. Within this sector, there are high-priorityprograms and projects that will be essential to achieve economic growth and to reduce povertythat may funded by donors. These include, for example, projects to develop the regulatoryframework, micro-enterprise and SME development, trade and foreign investment policy andlaw development, and capacity building.

227
14.14 In conclusion, it is certain that a vibrant private sector will be the key determinant ofwhether East Timor can achieve sustainable growth leading to improved livelihoods. However,in the near term and during the critical transition period, little can be achieved in developmentwithout the continued assistance of international donors and it is intended that this document willhelp guide donor deliberations on future interventions in this sector.
WORKING GROUP RESULTS
Box 14.1 Vision, Goals, Guiding Principles and Key Development Indicators, Issuesand Constraints
Vision:
An East Timorese economy that is stable, and that enables a society to be just andprosperous.
Goals:
1. To increase the level of per capita income
2. To improve the ability to compete with the rest of the world
3. To create new employment
4. To eradicate poverty
5. To create a healthy capital investment environment
6. To develop export-oriented industries
7. To raise the inflow of international tourists
8. To promote the sale of local products overseas
9. To strengthen the banking system to enable a strong economy
10. To provide infrastructure to help, in particular, agri-business develop
11. To broaden community access to commercial credit
Guiding Principles for Program Development:
1. That national welfare is equitable
2. That provides full employment opportunities
3. That reduces income inequalities
4. That optimizes benefit from natural resources

228
Key Development Indicators for the Five-year Plan:
1. Income per capita to reach $600 per annum (in 2002 dollars)
2. Percentage of non-coffee exports to reach 60% of total non-oil and gas exports
3. Value of non-oil and gas exports to grow ten-fold from 2001 export levels
4. Ratio of Imports/GDP to fall from 170% to < 70%
5. Number of foreign investment operations to reach 2,000
6. Total foreign tourists to reach 5,000 per annum
7. Industrial production/GDP to reach 15%
Issues and Constraints
The Working Group identified the following as some of the issues, risks and constraints facingthe sector and to which the Plan seeks to respond:
1. Lack of literacy in the country.
2. High population growth rate that will place pressure on labor market.
3. Low levels of technology and productivity in all sectors.
4. Unclear incentives for business people.
5. Limited government budget to fund programmed activities.
6. Low levels of production efficiency, notably in agricultural.
7. Coming reduction in international presence and resulting demand distortions.
8. Minimal experience in and understanding of sovereignty.
9. Lack of civil servant policy-making experience.
10. Uncertain property and land rights.
11. Incomplete legislative framework in virtually every essential commercial area.
12. Continuing lack of physical capital, plant and equipment.
13. Relatively high wage rates relative to probable international competitors.
14. Uncertainty about areas of national comparative advantage.
15. Small domestic market for absorption of domestic goods and services.
16. Insufficient access to, and levels of, credit for small business
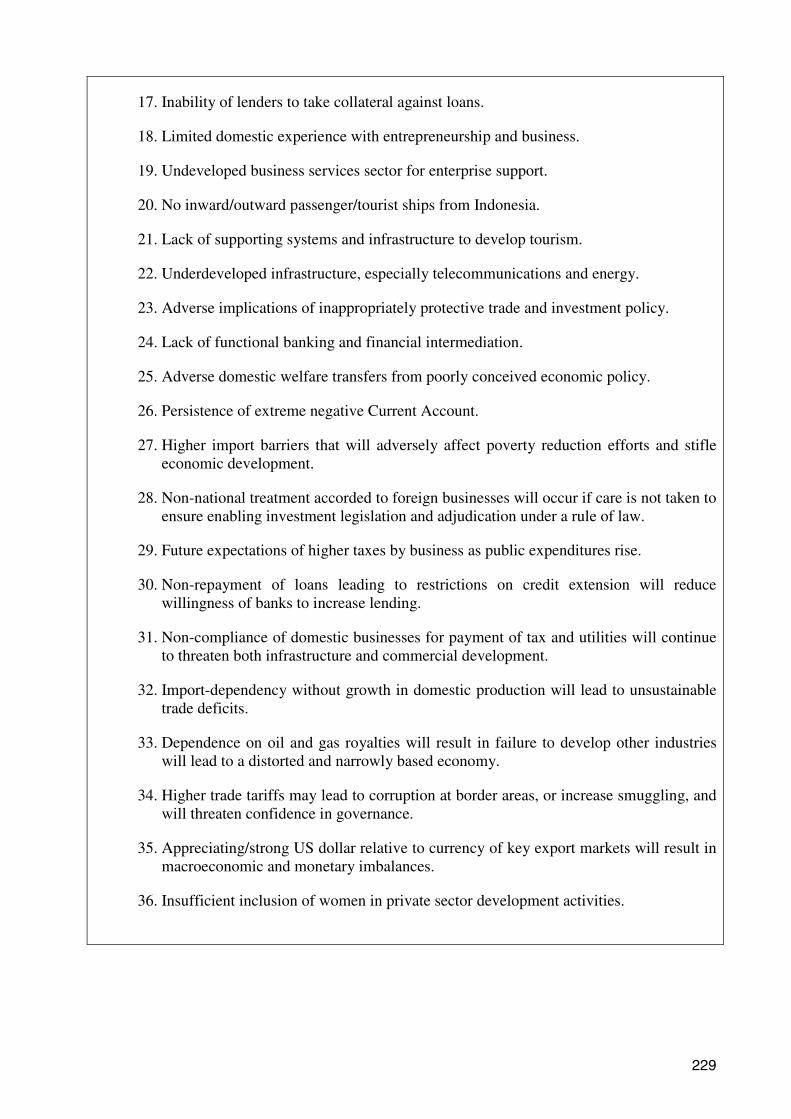
229
17. Inability of lenders to take collateral against loans.
18. Limited domestic experience with entrepreneurship and business.
19. Undeveloped business services sector for enterprise support.
20. No inward/outward passenger/tourist ships from Indonesia.
21. Lack of supporting systems and infrastructure to develop tourism.
22. Underdeveloped infrastructure, especially telecommunications and energy.
23. Adverse implications of inappropriately protective trade and investment policy.
24. Lack of functional banking and financial intermediation.
25. Adverse domestic welfare transfers from poorly conceived economic policy.
26. Persistence of extreme negative Current Account.
27. Higher import barriers that will adversely affect poverty reduction efforts and stifleeconomic development.
28. Non-national treatment accorded to foreign businesses will occur if care is not taken toensure enabling investment legislation and adjudication under a rule of law.
29. Future expectations of higher taxes by business as public expenditures rise.
30. Non-repayment of loans leading to restrictions on credit extension will reducewillingness of banks to increase lending.
31. Non-compliance of domestic businesses for payment of tax and utilities will continueto threaten both infrastructure and commercial development.
32. Import-dependency without growth in domestic production will lead to unsustainabletrade deficits.
33. Dependence on oil and gas royalties will result in failure to develop other industrieswill lead to a distorted and narrowly based economy.
34. Higher trade tariffs may lead to corruption at border areas, or increase smuggling, andwill threaten confidence in governance.
35. Appreciating/strong US dollar relative to currency of key export markets will result inmacroeconomic and monetary imbalances.
36. Insufficient inclusion of women in private sector development activities.

230
OFFICE OF THE DIRECTOR-GENERAL (ODG) – OVERVIEW
14.15 The ODG provides the overall departmental leadership and administrative coordinationof activities of the four Divisions. The Director-General will have primary responsibility fordepartmental capacity building, staff training, budget management, and coordination ofcomplementary Division activities. The ODG will also support promotional activities, coordinatemulti-media requirements, and implement a realistic monitoring and evaluation system toimplement and guide the sector’s efforts against the programs and projects set out in the Plan.
14.16 The ODG will become the primary repository for materials and skills that are necessaryfor economic development, capacity building, and support for departmental projects. The ODGwill also be responsible for training, inter-departmental communications, and joint projects withother agencies of Government. Donor-related activities specific to programs or projects under theMEAD will be coordinated through the ODG, including activities for micro-enterprise and SMEdevelopment, tourism, domestic and foreign investment, industry development, foreign anddomestic trade, and business registration.
14.17 It is important to distinguish between activities within the budgeted framework of theMEAD (and the programmatic divisions) and those projects that will require external budgetsupport or direct donor assistance. The ODG is responsible for managing all of the programs andprojects of the sector. This includes government-funded activities that can normally be classifiedas capacity building, promotional, and policy and regulatory development. Such responsibilitieswill also require coordination with other departments, in particular, in relation to draftinglegislation and regulations, and with external donors and NGOs.
14.18 The ODG will also be responsible for managing and leading externally funded programsand projects which are identified within the Plan but will be beyond the scope of the nationalbudget to implement. The ODG will support various donor and NGO initiatives by helping todesign and implement projects, and providing access to Government support as necessary.Similarly, the ODG will work with donors, civil society and NGOs, to ensure that the benefits ofexternal inputs are maximized and well distributed, and that duplication is avoided.
14.19 The ODG will also be responsible for leading efforts to engage with foreign partners,both investors and governments, in an effort to grow the economy. This will include fosteringstronger foreign trade links, explaining the potential of East Timor to foreign investors, andensuring that benefits from such efforts are demonstrably connected to economic growth andpoverty reduction throughout the country. In order to achieve this, the Government intends towork closely with the private sector and civil society to explain the expected benefits ofeconomic development efforts and how those benefits should be available to all, but in particularto the poorest.
OFFICE OF THE DIRECTOR-GENERAL– PROGRAM SUMMARY
PROGRAMS OF THE ODG
Key Objectives:
a) To generate new employment and create economic opportunities
b) To ensure coordination with other Government departments on private sectordevelopment

231
c) To assist and stimulate effective relationships with foreign countries and foreigninvestors
d) To pursue legal and regulatory initiatives that enable a competitive private sector
e) To encourage private sector development that can drive future economic growth inEast Timor
f) To coordinate policy and regulatory development for all parts of the private sector
g) To provide the departmental support for division promotions and effective publicrelations
h) To achieve sustained improvements in departmental capabilities for economicdevelopment
Key Strategies:
a) Understanding the specific requirements of private sector businesses
b) Coordinating the wide range of necessary policy and regulatory development work
c) Maximizing the value of, and coordinating, donor contributions to the sector
d) Coordinating the promotional work of Divisions and achieving efficiencies
e) Leading efforts to find solutions to business problems such as uncertain land titlerights
f) Strengthening institutional economic policy-making, administrative and promotionalcapacity
g) Sequencing implementation of sector programs and projects according to set priorities
Program 1: Coordination of Divisional Promotions
a) Divisional promotions
b) External assistance for promotions
Program 2: Coordination of Policy and Regulatory Development
a) Policy bank
b) External technical assistance coordination
c) Regulatory Development Coordination
d) Enterprise land reform
e) International arrangements

232
Program 3: Institutional Capacity Building
a) Institutional strengthening with donor assistance
b) Seminars and workshops
OFFICE OF THE DIRECTOR-GENERAL – OBJECTIVES
14.20 The ODG represents the departmental leadership and focus for administrativecoordination and has the following primary objectives:
a) To pursue, in coordination with other relevant departments, the development of a fullcommercial code including, primarily, laws on insurance, incorporation,unincorporated business entities, contract, trademarks and bankruptcy.
b) To develop with the MoJ a company registration and licensing system.
c) To institute a Land Code including a land registry which will facilitate more certainland and property rights and enable more protection for capital improvements to landfor both foreign and domestic investors.
d) To support the passage of laws that will better enable the operations of banks andmicro-finance providers to increase their levels of lending, and their ability tomobilize savings.
e) To establish an overarching micro-enterprise and SME development program, andcoordinate donor intervention for training, business services, access to credit, andbuild stronger domestic trade linkages that better support flow of goods and servicesbetween Dili and the districts.
f) To promote the importance of the private sector through public media, and todemonstrate the benefits of a market-based economy, and to coordinate divisionalprinting of publications.
g) To build institutional capacity within the department for and establish a sustainableprofessional development program.
h) To promote the principle of National Treatment for all investors and enterprises, thusequal treatment under the law.
i) To support the development of capable business associations and chambers ofcommerce to address private sector issues.
OFFICE OF THE DIRECTOR-GENERAL – STRATEGIES
14.21 In order to achieve its objectives, the ODG will support the strategic initiatives of otherdepartments and government agencies. It will provide departmental leadership in implementingthe programs and projects of the Plan. It will take the lead in establishing and following anagreed format for monitoring and evaluating its own efforts and that of other departments inimplementing the programs and projects of this sector. The ODG will seek to regularly explainthe nature of the sector plans to other departments and the private sector so that all stakeholdersare informed about the efforts of Government to grow the economy and reduce poverty. The

233
ODG will also necessarily respond to changing circumstances, as well as ensuring that the Planis regularly updated in accordance with broader Government planning processes. This integratedsector strategy will be realized through coordinated division strategies that achieve economicgrowth through effective legal and regulatory initiatives, enhanced training, pursuit of a strongdomestic economy that concurrently supports export development, and a diversified economicbase that supports new employment while reducing poverty.
OFFICE OF THE DIRECTOR-GENERAL – PROGRAMS AND PROJECTS
Program 1: Coordination of Divisional Promotions
14.22 The ODG has the capacity to pursue objectives related to general public relations, butmore importantly, to support promotional activities for each of the programmatic divisions.These may include inter-divisional projects for private enterprise development, joint industrialand investment initiatives, SME development, and interdependent trade development projects.Essentially, the ODG will provide a focal point for information, publication, and materialdatabase development relevant to industry, investment, trade, and tourism.
14.23 The projects to be implemented under this program are the following.
a) Public Relations on Private Enterprise Development
b) Association and Chamber Development and Support
c) Divisional promotions
d) Internet and Web-based systems development
e) Departmental Printing and Publications
Program 2: Coordination of Policy and Regulatory Development
14.24 Many objectives of economic development of high priority to the Department and theprivate sector rely on inter-ministerial cooperation for legislation. Consequently, the ODG willdevelop a liaison procedure with each relevant ministry or agency, outlining the type oflegislation required for economic development and the rationale to underpin a policy forlegislative initiatives. The ODG will then identify projects or activities under the program thatcan be managed through appropriate divisions within the department or through cooperativegovernmental efforts. In many instances, these will require donor assistance that the ODG willeither directly pursue or identify as projects to be presented to the CoM and donor organizations.
14.25 The projects to be implemented under this program are the following.
a) Regulatory Development Coordination
b) Policy Bank
c) External Technical Assistance Coordination
d) Enactment of a Foreign Investment Law
e) Intellectual Property Rights, Patents, Trademarks, Copyrights
f) Consumer Protection Laws and Related Safety, Truth in Advertising

234
g) Enterprise Land Reform and Titling
h) Public Land Reform and Titling
i) Rural and Agricultural Law Reform and Titling
j) Land Title and Registration System
k) International arrangements
l) Land Lease and Use Rights Project
Program 3: Institutional Capacity Building.
14.26 There are several priority objectives requiring capacity for training and requisite expertisefor human resource development. The training will require external expertise and donor-supported technical assistance for general training processes and for specific educationalactivities. The ODG will identify component activities under this program, the targetparticipants, and the expected results within the five-year planning horizon. Eventually, theobjective will be to have internal training and development capacity with effective educationalmaterials and resources to sustain staff initiatives in economic and private sector development.As an additional benefit, these capabilities will allow the department to be a provider formaterials and access to training in economic and private sector affairs for other offices andagencies.
14.27 The projects to be implemented under this program are the following.
a) Departmental Staff Capacity Training
b) Development of Human Resource Training for Business & Economics
c) Skills Training and Entrepreneurship (relates to Informal Sector Initiatives)
d) SME Training Support and Modeling
e) Institutional Strengthening with Donor Assistance
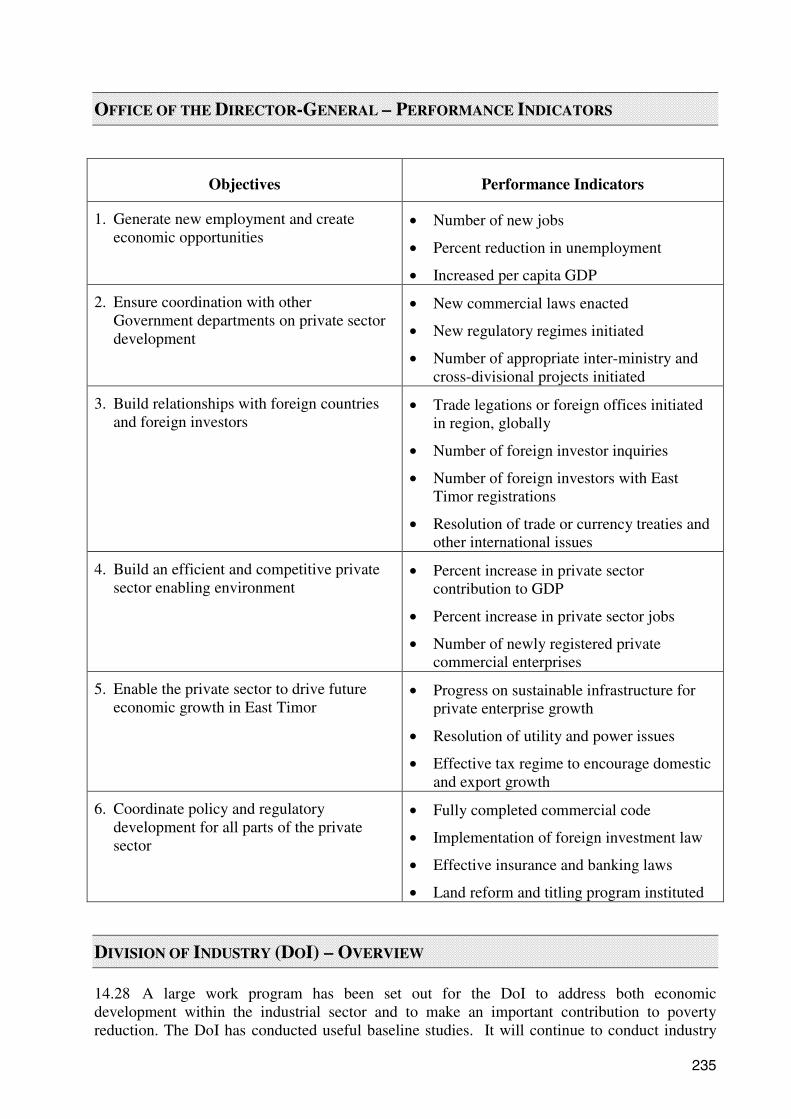
235
OFFICE OF THE DIRECTOR-GENERAL – PERFORMANCE INDICATORS
Objectives Performance Indicators
1. Generate new employment and createeconomic opportunities
• Number of new jobs
• Percent reduction in unemployment
• Increased per capita GDP
2. Ensure coordination with otherGovernment departments on private sectordevelopment
• New commercial laws enacted
• New regulatory regimes initiated
• Number of appropriate inter-ministry andcross-divisional projects initiated
3. Build relationships with foreign countriesand foreign investors
• Trade legations or foreign offices initiatedin region, globally
• Number of foreign investor inquiries
• Number of foreign investors with EastTimor registrations
• Resolution of trade or currency treaties andother international issues
4. Build an efficient and competitive privatesector enabling environment
• Percent increase in private sectorcontribution to GDP
• Percent increase in private sector jobs
• Number of newly registered privatecommercial enterprises
5. Enable the private sector to drive futureeconomic growth in East Timor
• Progress on sustainable infrastructure forprivate enterprise growth
• Resolution of utility and power issues
• Effective tax regime to encourage domesticand export growth
6. Coordinate policy and regulatorydevelopment for all parts of the privatesector
• Fully completed commercial code
• Implementation of foreign investment law
• Effective insurance and banking laws
• Land reform and titling program instituted
DIVISION OF INDUSTRY (DOI) – OVERVIEW
14.28 A large work program has been set out for the DoI to address both economicdevelopment within the industrial sector and to make an important contribution to povertyreduction. The DoI has conducted useful baseline studies. It will continue to conduct industry
236
assessments while exploring new opportunities that may be attractive to investors. The resultswill allow the DoI to orchestrate a meaningful industry promotion program and directly pursueinnovative ways in which the country can encourage a stronger platform of private sectorinitiatives that can be sustained.
14.29 The challenges for industry, which are essentially concerned with manufacturing andprocessing systems, are enormous after nearly 70 percent of the industrial base was destroyed.Despite this, it is encouraging that so much potential remains if manufacturing can bereconstructed as a foundation for future growth.
14.30 In 1997, there were approximately 46 different types of manufacturing in five industrialsectors (rice and coffee processing, wood furniture and crafts, textiles and weaving, construction,and baking). Manufacturing also existed in iron works, dyeing, salt production, and a number ofvery small micro-enterprise cottage activities. At that time, 4,494 enterprises were formallyregistered, employing about 13,355 workers, and generating an official output of more than $20million in income on $65 million invested. Today, some manufacturing remains in most sectors,but at such low levels and with such marginal resources that it is difficult to classify any activityas self-sustaining.
14.31 A DoI study completed in 2001 indicated that there are around 1,300 enterprises engagedin some means of manufacturing or processing. This could be an optimistic estimate as manysampled enterprises were informal cottage activities in rural areas. Estimated total employmentamong these may not be more than 8,700 workers, and little is known about the investment baseor income generation. Consequently, plans for the DoI rest strongly on the ability to establish areliable picture of manufacturing, of employment, investment, and industries with growthpotential.
14.32 The DoI cannot, on its own accord, implement a feasible strategy for growth inmanufacturing or national industry development. Success will depend greatly on integratedactivities within the MEAD, and the interdependent activities of this and other governmentministries. In most instances, division objectives, strategies, and project activities representoperational planning, project oversight, and coordination, not direct use of departmental budgetand staff.
14.33 The DoI will focus primarily on small-scale enterprises, and further emphasizeopportunities in agri-business, but also be part of the integrated departmental activities conduciveto trade and tourism. The division has formulated objectives as benchmarks for the five-yearplanning period, and it has devised strategies based on the themes of integrated activities and theinterdependencies among government constituents. A composite overview of division plans ispresented in Box 12.3 and these components are further described in subsequent sections.
DIVISION OF INDUSTRY - PROGRAM SUMMARY
PROGRAMS OF THE DOI
Objectives:
a) To create greater employment opportunities in the industrial sector
b) To provide a better enabling environment for private sector investment
c) To produce more added-value products in East Timor, especially in agriculture

237
d) To increase export earnings through using more technology in production
e) To ensure increases in export of non-oil and gas related products relative to GDP
f) To increase Government tax receipts via a profitable formal private sector
g) To ensure that Government policy does not hinder micro-enterprises and SMEs
Strategies:
a) Developing a stronger business culture and support to SMEs
b) Promoting private participation in infrastructure development
c) Devoting resources to export promotion and diversification of the export base
d) Increasing commitment of resources to development of basic business skills
e) Strengthening the policy and regulatory environment
f) Facilitating creation of industrial infrastructure such as the Industrial Zone
g) Working toward greater access to bank credit for small businesses
h) Encouraging improved competitiveness, efficiency and productivity
i) Improving the economic policy-making capacity of Division staff
Program 1: Industrial Development
Key Projects:
a) Industrial Zone assessment and development
b) Business Development Centres and subordinate Business Offices
c) Formation of Chamber of Commerce and development of business associations
d) Industry database enhancement
Program 2: Policy and Regulatory Development
Key Projects:
Small Enterprises Project II business regulatory environment development
Support for inter-agency development of Policy Framework for Micro-financing and Credit
Development and maintenance of relevant industrial and commercial policies
Program 3: Divisional Training and Development
Key Projects:
a) SEP II civil servant economic policy-making skills training

238
b) Training in industrial development experiences
c) Training in service delivery to the private sector
Program 4: Micro-enterprise and SME Development
Key Projects:
a) Small Enterprises Project (SEP I)
b) Small Enterprises Project (SEP II)
c) Micro-finance Development Project
d) Formation of Inter-industry Commission on the Micro-enterprise and SME sector
e) Establishment of industrial skills and crafts centre and exhibition centre
DIVISION OF INDUSTRY - OBJECTIVES
14.34 The following are some of the objectives of the DoI:
a) To create greater employment opportunities in the industrial sector and supportgrowth initiatives in other sectors.
b) To ensure that Government policy does not hinder growth of microenterprises andSMEs and supports efforts to build domestic trade.
c) To work with other departmental activities to promote a favourable investmentclimate and to mobilize investment capital in the private sector.
d) To promote development in the manufacturing, processing, and industrial enterprises,specifically in relation to agro-businesses.
e) To assist the private sector in creating greater value-added production that canstimulate strong domestic growth and accelerate employment.
f) To increase the number of established registered manufacturing enterprises.
g) To increase industrial output relative to overall GDP.
h) To increase the tax revenue base, over time, through the formalization of newenterprise and employment activities, and by demonstrating the benefits ofparticipation in the formal economy
i) To increase export earnings through using more technology in production
DIVISION OF INDUSTRY - STRATEGIES
14.35 In order to achieve its objectives, the DoI will follow an integrated, multi-sectoralapproach with strategic programs and focused projects during the next five years. The corestrategies require working jointly with other ministries to improve the physical and institutional
239
structures conductive to the promotion and development of industry, trade, investment andtourism with responsible utilization of natural resources.
14.36 The divisions programs will be implemented through a strategy of targeted developmentof industrial infrastructure, such as industrial estates, that can provide as a priority, strongdomestic manufacturing and process capabilities. This will require a parallel strategy aimed atfinancial needs of the industrial community encouraging new credit and investment, greateraccess to bank credits, and donor-assisted activities that can improve credit access and financialintermediation to industrial enterprises.
14.37 A crucial strategic role of the DoI will be to identify opportunities and assist SMEdevelopment that reaches small, cottage, and entrepreneurial activities. The most forward-looking strategy will be concerned with competitiveness, which reaches well beyond industrialreconstruction or early transitional activities to include East Timor’s position within the regionand among more global interests for participating in bilateral trade agreements, establishingindustry delegations, and pursuing projects that can achieve realistic competitive advantages.
DIVISION OF INDUSTRY – PROGRAMS AND PROJECTS
14.38 The division will pursue several programs to implement its strategies with each definedaccording to logical categories of activities. Each program will initiate projects and identifyactivities that can be initiated under the division or through joint-divisional efforts, and in eachprogrammatic area the division will identify potential donor-assisted projects and activities.Many of these have overlapping responsibilities within the department, but also with othergovernmental ministries.
Program 1: Industry Promotion
14.39 Internal to this program will be a concerted effort to support and promote exportdevelopment, bilateral trade with primary trading partners, broad-based investment, and tourism.The DoI will have responsibilities in all areas, but more specifically in coordinated projectsinclusive of manufacturing, agro-business, and vendor-related activities that support initiativessuch as hospitality development. Industry promotion will occur, in part, through the BDCs andregional offices, and through support for CoC and private sector business associations. It is alsoessential to build into the departmental system an integrated industry database that can beutilized in trade, investment, and domestic industrial development promotions.
14.40 The projects to be implemented under this program are the following.
a) Development of National Industrial Association and Chamber of Commerce
b) Formation of Inter-industry Commission on Cottage and Micro-enterprises
c) Assessments on Industry and Database Development
d) Establishment of Industrial Skills and Crafts Training Centre
e) East Timor Handicrafts and Industrial Products Showroom
f) Industrial Zone assessment and development
g) BDCs

240
Program 2: Policy and Regulatory Development.
14.41 This program area captures the leading role of the division of industry for legal andregulatory initiatives specific to manufacturing and industry sector growth. A critical part of thisprogram is coordination of the Small Enterprises Project II with respect to the componentactivities designed for regulatory development that will be orchestrated with a specific (andseparate) program of SME development described momentarily. Much of the division’s workwill be jointly pursued under the ODG and with cross-divisional support.
14.42 The projects to be implemented under this program are the following.
a) Regulatory Requirements for Industrial And Economic Zones
b) Inter-Agency Development of Policy Framework For Micro-Finance And Credit
c) SEP II Business Regulatory Environment Development
d) Establishment of a Government Credit Guarantee Agency for Industry
e) Capital Markets and Industrial Investment Initiative
Program 3: Divisional Training and Development
14.43 The DoI has a commensurate responsibility to develop staff capabilities to plan andmanage industrial projects, or to coordinate inter-divisional activities. Not least of all, staff mustbe able to work closely with many different ministries and a variety of donors who will beessential to success in East Timor’s drive toward a market-based economy. Consequently, thedivision will provide industrial databases, materials, information resources, and programmaticmodels for training and management development. It will work together with other divisions todesign intervention proposals to support department-wide efforts at comprehensive staff andmanagement development. Several project activities are listed below:
14.44 The projects to be implemented under this program are the following.
a) Division Capacity Building and Training in Industrial Development
b) SEP II as Related to Civil Service Economic Policy Making and Skills Training
c) Joint Training for Services and Industrial Vendor Support Systems in the PrivateSector
Program 4: Micro-enterprise and SME Development.
14.45 A majority of projects and activities under a micro-enterprise and SME mandate willaddress issues within the informal economy. This will occur consciously as part of the divisionstrategy to assist entrepreneurs, cottage enterprises, and established SMEs who can becometaxpayers while benefiting from official support and public services. Projects under this programwill provide assistance to micro-enterprises, but also support new ventures, independententrepreneurs, and SMEs with growth potential through training and business services. Inaddition, the division will work closely with trade and tourism, and with other sectors such asagriculture, forestry, and fishing, to target interdependent problems of access to bank credit, andmicro-finance. Many of these initiatives will necessarily require donor support and technicalassistance, particularly for enhanced skills and technology development.
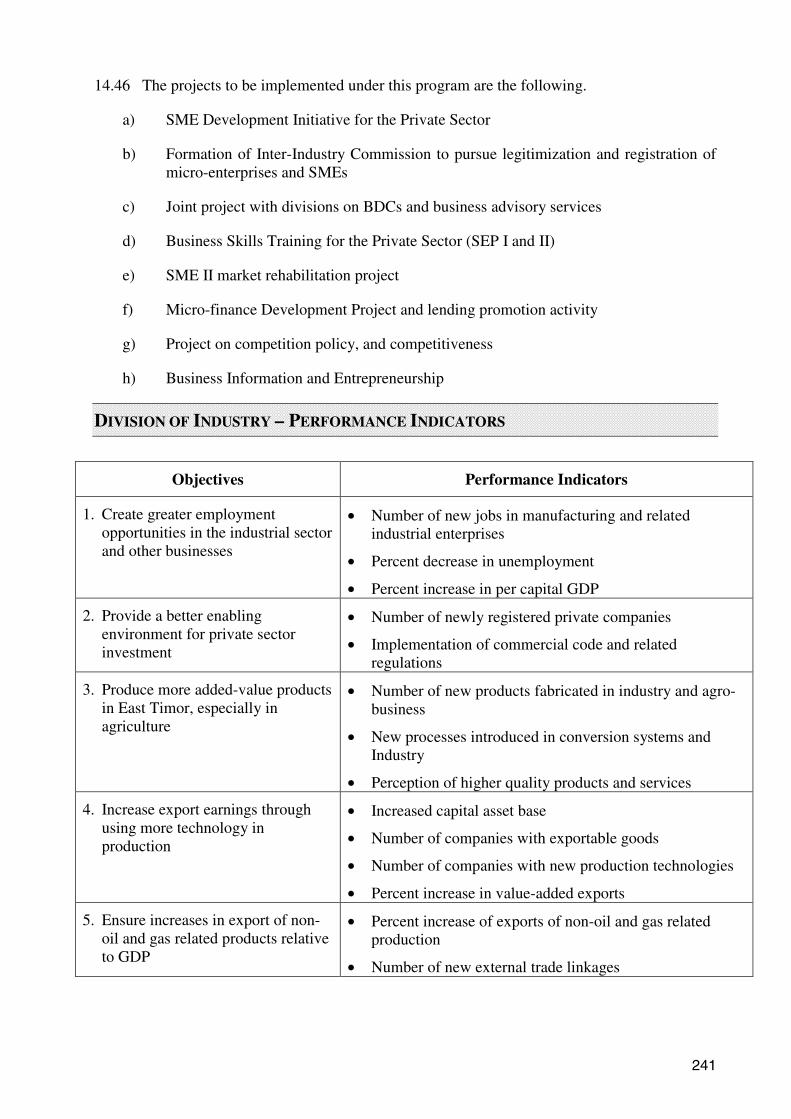
241
14.46 The projects to be implemented under this program are the following.
a) SME Development Initiative for the Private Sector
b) Formation of Inter-Industry Commission to pursue legitimization and registration ofmicro-enterprises and SMEs
c) Joint project with divisions on BDCs and business advisory services
d) Business Skills Training for the Private Sector (SEP I and II)
e) SME II market rehabilitation project
f) Micro-finance Development Project and lending promotion activity
g) Project on competition policy, and competitiveness
h) Business Information and Entrepreneurship
DIVISION OF INDUSTRY – PERFORMANCE INDICATORS
Objectives Performance Indicators
1. Create greater employmentopportunities in the industrial sectorand other businesses
• Number of new jobs in manufacturing and relatedindustrial enterprises
• Percent decrease in unemployment
• Percent increase in per capital GDP
2. Provide a better enablingenvironment for private sectorinvestment
• Number of newly registered private companies
• Implementation of commercial code and relatedregulations
3. Produce more added-value productsin East Timor, especially inagriculture
• Number of new products fabricated in industry and agro-business
• New processes introduced in conversion systems andIndustry
• Perception of higher quality products and services
4. Increase export earnings throughusing more technology inproduction
• Increased capital asset base
• Number of companies with exportable goods
• Number of companies with new production technologies
• Percent increase in value-added exports
5. Ensure increases in export of non-oil and gas related products relativeto GDP
• Percent increase of exports of non-oil and gas relatedproduction
• Number of new external trade linkages

242
6. Increase Government tax receiptsvia profitable formal private sectorbusinesses
• Increased taxes from registered business enterprises
• Number of new registered private sector enterprises
• Percentage increase of taxes from exports anddomestically marketed products
7. Ensure that Government policydoes not hinder growth of SMEsand the informal sector
• SME rate of growth matches or exceeds industry andsector performance
• Percentage of SME capital assets matches or exceedsindustry averages
• Percent of commercial credit available
DIVISION OF INVESTMENT – OVERVIEW
14.47 The mandate of the DI is to encourage and facilitate new investment, in particular foreigninvestment. This will require establishment of an enabling environment for foreign and domesticinvestments and pursuit of capital projects that can improve the nation’s technological profileand provide greater employment opportunities. Inward flows of foreign capital, especially as thesize of the international presence continues to decline, will be critical to economic growth andpoverty reduction. The DI will take the lead on seeking to improve the regulatory and policyframework for foreign investors, promoting foreign and domestic investment, and building thecapacity of its staff to carry out their tasks effectively. The DI will work closely with otherdivisions such that new investment can be attracted to areas that best support the targetedobjectives of the overall sector, including industry, trade and tourism.
14.48 The DI cannot achieve these overarching objectives independent of efforts from otherparts of Government. The only feasible way to succeed on these issues as a nation is throughintegrated activities and a cooperative, interdependent commitment among the ministries and keyagencies as well as with the private sector and civil society. With that in mind, the DI hasformulated objectives for the five-year planning period, and it has devised strategies toimplement programs of investment and development within an interdependent system ofactivities.
14.49 The DI has, during the UNTAET period, already developed a reasonable approach tomanaging and attracting foreign investment, based on informal, but broadly understood,Government policies. These policies, given that the country was in a transition period, servedthe country well and have enabled a surprisingly high level of foreign investment. The comingperiod will require these quasi-regulatory arrangements to be formalized.
14.50 Further, the policies and practices emerging from the DI will have a strong signalingeffect to the private sector. The Government recognizes this and is committed to maintaining anopen and transparent role in approving, registering and licensing foreign investment in anefficient and even-handed way. To give this approach a legal footing, the DI has formulated adraft policy and regulation governing FDI. These underscore the Government’s commitment toseeking additional FDI and to providing a high level of service to investors. The DI has a largework program set out within the Plan but it attaches especially high priority to putting in place aformal policy and regulation governing FDI.

243
14.51 The focus on coordination with other divisions and departments is intended to ensure thatthe benefits of FDI are maximized. This relates to, for example, the desire to increaseappropriate investment in the tourism sector, as well as coordinating with the DoE to ensure thatthe Government’s commitment to environmental protection is upheld. Additionally, theGovernment is keen to attract long-term, high quality FDI, especially where it brings newtechnology, is labor-intensive, promotes exports or increases domestic productive capacity, andcreates new demand for inputs from local suppliers.
DIVISION OF INVESTMENT – PROGRAMMATIC SUMMARY
PROGRAMS OF THE DI
Objectives:
a) To maintain an open and responsible foreign investment framework
b) To attract foreign investment that creates employment and brings new technology
c) To help link foreign investment with domestic businesses, especially for supply
d) To create a “One-Stop Shop” for foreign investors to help streamline the investmentprocess
e) To attract foreign investment that generates new, sustainable export industries
f) To encourage foreign investment that adds value to agricultural products
g) To demonstrate to all stakeholders the merit of foreign investment to the country
Strategies:
a) Working with other Divisions to build a strong policy and regulatory environment
b) Initiating and overseeing the passing of a foreign investment law
c) Supporting broader Government efforts to redress land and property title uncertainty
d) Maintaining oversight of the activities and initiatives of foreign investors
e) Improving the technical capacity of Division staff over time
f) Promoting East Timor as an attractive investment destination
g) Using forms of promotional advertising such as brochures and exhibitions
h) Advising potential investors of the risks and opportunities available in various sectors
i) Consulting regularly with domestic businesses about the impact of FDI
j) Preventing crowding out of domestic businesses
244
Program 1: Investment Promotion
Key Projects:
a) Investment Service Centre (One-Stop Shop)
b) Production of Promotional Literature
c) Overseas and domestic foreign investment promotion events
d) Website project
Program 2: Policy and Regulatory Development
Key Projects:
a) Development, maintenance and enforcement of policy and legislation
b) Support to development and oversight of licensing requirements
Program 3: Divisional Training and Development
Key Projects:
a) Overseas training in language and service delivery
b) Technical training in foreign investment management
Program 4: Foreign Investment Management
Key Projects:
a) Foreign investment database
b) Foreign investment reporting and review mechanism
c) Certification of foreign investment
DIVISION OF INVESTMENT - OBJECTIVES
14.52 Below are some of the key objectives of the DI:
a) To draft and implement a Foreign Investment Law capable of sustaining long-terminterest in foreign investment while enfranchising and complementing domesticinvestments and satisfying social and environmental parameters.
b) To work with the MoJ to facilitate a foreign company registration and licensingsystem.
c) To cooperate with appropriate ministries to develop a Land Code with a land registrywhich sets out ownership rights and provides certainty for investors to add capitalimprovements to land.
245
d) Create feasible scenarios for FDI and domestic development for cultural centres, eco-tourism, and recreational facilities.
e) Establish feasibility studies for capital-intensive enterprises (resorts, fisheries, LPGgas depots, and others) that can be marketed to foreign investors.
f) Within the DI, create an Investment Service Centre (one-stop shop) that can processinvestment inquiries and applications for foreign investment certificates andcomplement Division of Trade activities.
g) To establish programs and services that promote investment opportunities in regionaltourism, thus reinforcing a positive global image for East Timor as an attractiveforeign investment opportunity.
h) To ingrain the principle of National Treatment for all foreign investors andenterprises, thus ensuring equal treatment under the law.
i) To work jointly with the Divisions of Industry and Trade to establish specialeconomic zones for controlled export and transshipment of value-added, processedgoods.
j) Establish a sustainable professional development program on foreign investment andits related activities for internal departmental staff, and that can be used for externalstaff and private sector development through seminars and workshops.
DIVISION OF INVESTMENT - STRATEGIES
14.53 The DI endorses the concept of an open approach to foreign investment, and the divisionwill follow an integrated process for strategic implementation of all objectives. Even those withprimary responsibilities resting within the division, extensive cooperation with other divisionswill be required to achieve the desired outcomes. The division will pursue a comprehensivestrategy of generating greater legal capacity for investment with effective processing andmanagement of registered foreign investments. This will include monitoring and evaluation toprotect the environment, and joint strategies for planning with trade and tourism to promoteecologically sound investments. Investment strategies include a systematic effort to designproject proposals that can be considered by government or by donor organizations. These will betargeted investment initiatives that will result in sustainable expansion of infrastructure or apolicy framework that can encourage accelerated foreign investments. Understandably, astrategy of encouraging labor-intensive industries will have more direct effect on employmentand poverty reduction than large capital-intensive projects, yet the division will evaluate thestrategic impact of any initiative that foster growth while not threatening to crowd out localbusiness.
DIVISION OF INVESTMENT – PROGRAMS AND PROJECTS
14.54 The primary strategies described above imply orchestrated programs to serve as vehiclesfor achieving divisional objectives. These are described individually with projects proposed thatcan be reasonably addressed within the five-year plan, even though many will rely on interactivedevelopment with other divisions. Significant donor assistance will be crucial as resources andtechnical expertise in many project areas is beyond local capabilities in the near term.

246
Program 1: Investment Promotion.
14.55 The division will specifically address innovative approaches to domestic and foreigninvestments, incentive systems, feasibility plans for unusual projects, joint investment-tradeactivities, public information and foreign investor information systems, and various types ofassistance that can be offered through governmental hospitality and investment centres. Thesemay include domestic and foreign media activity, VIP centres and support at airports andseaports, advisory services for foreign investors, conferences on trade and investment, andseminars and workshops on investment
14.56 The projects to be implemented under this program are the following.
a) East Timor Industrial Products and Trade Exposition Centre (joint with others)
b) Create investment liaison activities with Tourism to support promotions of a NTB
c) Investment Service Centre (One-Stop Shop)
d) Investment promotion project for regional trading partners (mainly through Tradeliaisons in Australia and Indonesia)
e) Investment promotion project to include East Timor in trade and investmentdatabases among major foreign trade regimes (e.g., Japan, Hong Kong, others)
f) Production of Promotional Literature
g) Website for international investment and trade activities
h) Promotional development of materials and marketing of East Timor’s investmentopportunities
i) Information and promotion project with activities for investor packages, and project
j) activities for interfacing with public media, providing seminars, and promotinginvestment-oriented conferences
Program 2: Policy and Regulatory Development
14.57 In concert with the ODG, the DI will support legislative and regulatory initiatives relatedto economic growth, and it will take a leading role in laws and regulations concerning foreignand domestic investments. Closely related to legislative issues are those activities of processingand registering foreign investments, and subsequently monitoring investor activities forcompliance.
14.58 The projects to be implemented under this program are the following.
a) Draft and pursue enactment of a Foreign Investment Law
b) Joint development of a Foreign Investor Registry System with the MoJ
c) Implementation of an internal processing system for Applications and Certificationsof Foreign Investors
d) Interdependent coordination of a Customs and Trade Regime

247
e) Support to development and oversight of licensing requirements
Program 3: Training and Development
14.59 The division will pursue specific staff training and investment development activities thatsystematically improve departmental capabilities for promotion, coordination, and managementof foreign investments. These activities will also be structured to strongly support all domesticdevelopment and complement programs and projects under the divisions of industry, trade, andtourism.
14.60 The projects to be implemented under this program are the following.
a) Establish capacity building activities for foreign language materials and overseasinvestment communications.
b) Technical training and assistance for promotion of foreign investments
c) Technical training and intervention support for foreign investment processing andmanagement systems
Program 4: Foreign Investment Management
14.61 The key to managing foreign investment activities will be to provide a “one-stop-shop”focus within the division. This will not be a specific centre in itself, but a comprehensiveapproach to foreign investments whereby an investor can obtain information on opportunities,make applications, process requests for registering companies, and process requirements forlicenses or permits. At the same time, the division can expedite applications and rapidly routeinformation for reviews and approvals, and subsequently position the investor for efficientregistration. Management also includes projects that expand investment capacity, and that ensuremonitoring and responsible compliance procedures. Planning will be required with inter-ministerial cooperation on many projects under the program.
14.62 The projects to be implemented under this program are the following.
a) Foreign Investment Database
b) Foreign Investment Certification
c) Feasibility studies for investor scenarios in resorts, hospitality, culture, and recreationopportunities
d) Feasibility studies for major foreign investments (e.g., LPG terminal, porttransshipment system, air cargo, and fisheries.)
e) Investment coordination with Divisions of Trade and Industry for capitalization ofindustrial zones
f) Joint projects with government agencies for seaport and airport development

248
DIVISION OF INVESTMENT – PERFORMANCE INDICATORS
Objectives Performance Indicators
1. Maintain an open and responsibleforeign investment framework
• Absence of protective regulations and equitabletreatment under the law for all enterprises
• Number of investment inquiries by foreigninvestors
• Favorable trade and customs regimescomparable to regional trade partners
2. Attract foreign investment thatgenerates employment and introducesnew technology
• Number of new investors
• Increased value of FDI relative to GDP
3. Help link foreign investment with EastTimorese businesses, especially forsupply
• Number of joint ventures or investedcooperatives with foreign and domesticenterprises
• Number of foreign investment applications andnumber of joint venture or subcontractedbusiness registrations
• Percent participation by East Timorese
4. Create a “One-Stop Shop” for foreigninvestors to help streamline theinvestment process
• Effective application and registration system inplace
• Progressive number of registrations processed ina timely manner
5. Attract foreign investment thatgenerates new and sustainable exportindustries
• Number of foreign investors engaged in exportof commodities
• Survival rate of foreign invested companies
6. Encourage foreign investment thatadds value to agricultural products
• Rate of increase in agricultural production
• Number of agribusiness enterprises with foreigninvested new processes/technology
• Value of agricultural products
• Improved logistics or markets
7. Demonstrate to all stakeholders themerit of foreign investment to thecountry
• Number of public information releases or mediaevents on foreign investment
• Number of participants in sponsored events,seminars, and conferences
• Proportional participation in events by privateenterprises

249
DIVISION OF TOURISM – OVERVIEW
14.63 The tourism sector has been identified as having great potential in East Timor, althoughcare must be exercised in its development in order to protect the natural environment, and toavoid the mistakes made in tourism development in other countries. Prior to 1975, East Timorwas attracting around 3000 tourists per year. There is scope within the life of this Plan to attractnumbers well beyond that. Indeed, and in the absence of reliable statistics, there is someindication that quite a large number of tourists (perhaps 1,000 per annum) have already arrivedin East Timor during the UNTAET period. Evidence suggests that the majority of these touristshave been friends and family of international personnel working in East Timor.
14.64 The DT has already undertaken a large amount of preparatory policy development andbaseline studies. There is scope, however, for further policy development work and for theGovernment to better inform the private sector about prospects for tourism in East Timor andspecific investment opportunities. The Plan calls for the DT to carry out additional promotionalwork and better advertise the many attractive features available to tourists.
14.65 Investment by private businesses will be the key driver of growth in this sector, althoughthe role of Government in promoting tourism and assisting private sector operators is crucial.The relevant Key Development Indicator refers to a consistent growth in the number of touristsattracted to East Timor, yet a critical result will also be sustained growth in foreign investmentwithin the sector. Tourism is a relatively labor-intensive sector, and so tourism is to be promotedwith a view to generating new direct and indirect jobs. Investment in tourism, and touristspending, will drive demand for a range of goods and services including in construction,transportation, and supplies such as linens, foodstuffs, clothing and handicrafts.
14.66 A key objective of the DT is to raise the national image of East Timor to being anattractive destination for both investors and tourists. The broader private sector-enablingframework will be instrumental in achieving this. In line with other divisions, the DT recognizesthe need to develop a commercial code as well as improved infrastructure. Although the DT isnot directly responsible for infrastructure, it will help coordinate regarding the necessaryinfrastructure improvements, for example, water and sanitation, telephone connections, andenvironmental protection requirements. The DT will have an active role in coordinating with theDivisions of Trade and Investment on overseas and domestic promotional activities.
14.67 The DT also proposes to ensure that civil society understands the Governments tourismpolicy and how tourism is expected to help drive economic growth and reduce poverty. The DT,as part of its sector development, also intends to demonstrate the potential benefits for protectingcultural and historical heritage that can occur as a result of properly regulated tourismdevelopment.
DIVISION OF TOURISM – PROGRAM SUMMARY
PROGRAMS OF THE DT
Objectives:
a) To build a tourism industry in East Timor that generates employment and maintainsculture
b) To attract and maintain foreign investment in the tourism sector and capture foreignskills

250
c) To identify and promote strategic tourism sites and experiences in East Timor
d) To create a profile of East Timor abroad as an attractive tourism destination
e) To support the development of necessary supporting tourism infrastructure
f) To establish a specialized centre of training in tourism and hospitality
g) To develop cross-sectoral appreciation of the benefits of tourism
Strategies:
a) Developing a repository of professional personnel with specialized tourism skills
b) Improving welcome and farewell facilities at the airport
c) Capturing a greater amount of data on what tourists are seeking in East Timor
d) Establishing a separate governmental body to oversee tourism development
e) Adopting an agreed tourism policy that sets out a tourism development framework
f) Using international forums to promote tourism investment opportunities
g) Maintaining an ongoing promotional agenda via print media and the Internet
h) Conserving natural and cultural capital that will underpin East Timor’s tourismappeal
i) Ensuring that tourism is developed at a rate acceptable to the community
j) Requiring skill transfers from foreign operators to domestic operators
Program 1: Tourism Promotion
Key Projects:
a) Multimedia materials production and distribution
b) Website project
c) Tourism database
d) Visitor and tourist reception and information centres
Program 2: Policy and Regulatory Development
Key Projects:
a) Tourism policy framework
b) Strategic planning for industry development

251
Program 3: Divisional Training and Development
Key Projects:
a) Tourism and hospitality training centre
b) Overseas capacity building training for divisional staff
c) Seminars and workshops
DIVISION OF TOURISM - OBJECTIVES
14.68 Following are some of the objectives of the DT:
a) To create a NTB to promote East Timor within the Southeast Asia region, and toestablish a positive global image for East Timor through foreign travel and tourismchannels, government agencies, and commercial investment interests.
b) To establish an advocacy and advisory role to assist government with constructivereforms and progressive, sustainable development.
c) To establish airport and seaport arrival facilities for business travelers and tourists inconcert with related infrastructure improvements.
d) To sustain a professional development program for hospitality and services.
e) To identify and insulate strategic locations for resort or coastal development, therebyprotecting the environment from haphazard development, but also providing a long-term planning scenario for hospitality and tourism investment.
f) To establish sanitation standards and waste management regulations for all licensedpublic facilities, thus supporting a proactive image for business travel and tourism.
g) To establish a performing arts centre with student enticements for cultural events,thus anchoring East Timor’s cultural history while providing tourist-related interestsin the nation and the region.
h) To foster documentation of traditional recipes and encourage culinary art throughformal schools and materials, and enhance the quality of all food and beverageservices through skills training, workshops, and a repository of multi-ethnic andregional information.
i) To create an Internet Website promoting tourism in East Timor
j) Establish a Hospitality Training Institute for hotel, restaurant, and tourism services tosolidify skill levels and a labor market within the sector.
DIVISION OF TOURISM - STRATEGIES
14.69 The DT will pursue a primary strategy of creating a diversified tourist industry,effectively using natural coastlines, interior elevations, and recreational benefits of sea-and-island environment. Development will be planned within a framework of ecological preservation

252
and cultural enhancement, promoting growth through a skilled workforce with quality facilitiesand services.
14.70 A promotional strategy will be implemented through a focal program to establish animage for East Timor that attracts tourists and business investors. Promotional activities will betargeted to trading partners in close proximity to the country, and subsequently to selectedcountries where East Timor can be strongly marketed.
14.71 The division also has a commitment to train and develop staff within the division and toprovide broader training services to other government agencies or to private sector constituentswith an interest in tourism, travel, and hospitality services.
DIVISION OF TOURISM – PROGRAMS AND PROJECTS
Program 1: Tourism Promotion.
14.72 The DT will pursue all cost-effective and realistic opportunities to promote travel andrecreation activities in East Timor through print and electronic media, Web services, projects ofcultural and eco-tourism, and recreational advantages of the natural coastline, interior, and sea.Promotions will also extend to materials and projects designed for marketing through trademissions, commercial foreign travel agencies, and foreign travel network associations. A numberof projects and activities under the program will be concerned with value-enhancing and image-building priorities, such as welcome centres at airports and seaports for business and casualtravelers, hosting seminars and meetings on tourism, and creating investor packages for externalpromotions.
14.73 The projects to be implemented under this program are the following.
a) Develop a Web Site for broad-based Internet promotions
b) Establish multi-media materials, pamphlets, and public relations activities
c) Create packaged investor feasibility studies for foreign investment in tourism andrecreational activities
d) Create a database on tourism sites, investments and attractions
e) Visitor and tourist reception centres
f) Publication and dissemination of travel and tourism information through trade andforeign country liaisons
Program 2: Policy and Regulatory Development
14.74 Responsibility for this program will include initiatives by the division for planningcoastline and inland sites that can be ecologically safe and attractive to foreign investors. Otherobjectives will involve establishing a NTB, coordinating regulations that relate to hospitality andtravel services, working with airport and seaport authorities, and coordinating (or structuringproposals for) projects such as the creation of a cultural centre or a hospitality training program.Many other projects may be pursued with donor assistance, and the division itself will haveoperational responsibilities, such as working with the Investment Centre to approval foreigninvestments in tourism.

253
14.75 The projects to be implemented under this program are the following.
a) Creation of the NTB and operational constituency
b) Legal and Regulatory reforms affecting hospitality, travel, and tourism
c) Tourism Policy Framework
d) Joint project with airports on planning, tourism support, travel facilities
e) Joint project with seaports on planning, tourism support, travel facilities
f) Strategic planning for resort development and coastline or interior site development
g) Cooperative projects with public works on sanitation and waste managementstandards for public licensed establishments
Program 3: Divisional Training and Development
14.76 The DT will develop internal staff training materials, hold workshops, and support shortcourses on travel, tourism, and hospitality management to hone divisional capabilities. Inaddition, the division will develop training modules that can be used in other government offices,or used in conjunction with promotional activities for private sector development. There areseveral projects under this program while most responsibilities are within operational activities.
14.77 The projects to be implemented under this program are the following.
a) Develop training materials, seminars and workshops on tourism, hospitalitymanagement, and travel
b) Overseas capacity building training for divisional staff
c) Establish regular staff training and periodic reviews, seminars, and workshops withtechnical assistance (donor related) on Tourism, planning, and sector regulatorypriorities
d) Establish a culture and performing arts centre
e) Establish a hospitality training institute centre
f) Contribute materials workshops, and information to the departmental database andutilize the database for outreach seminars and intergovernmental staff development
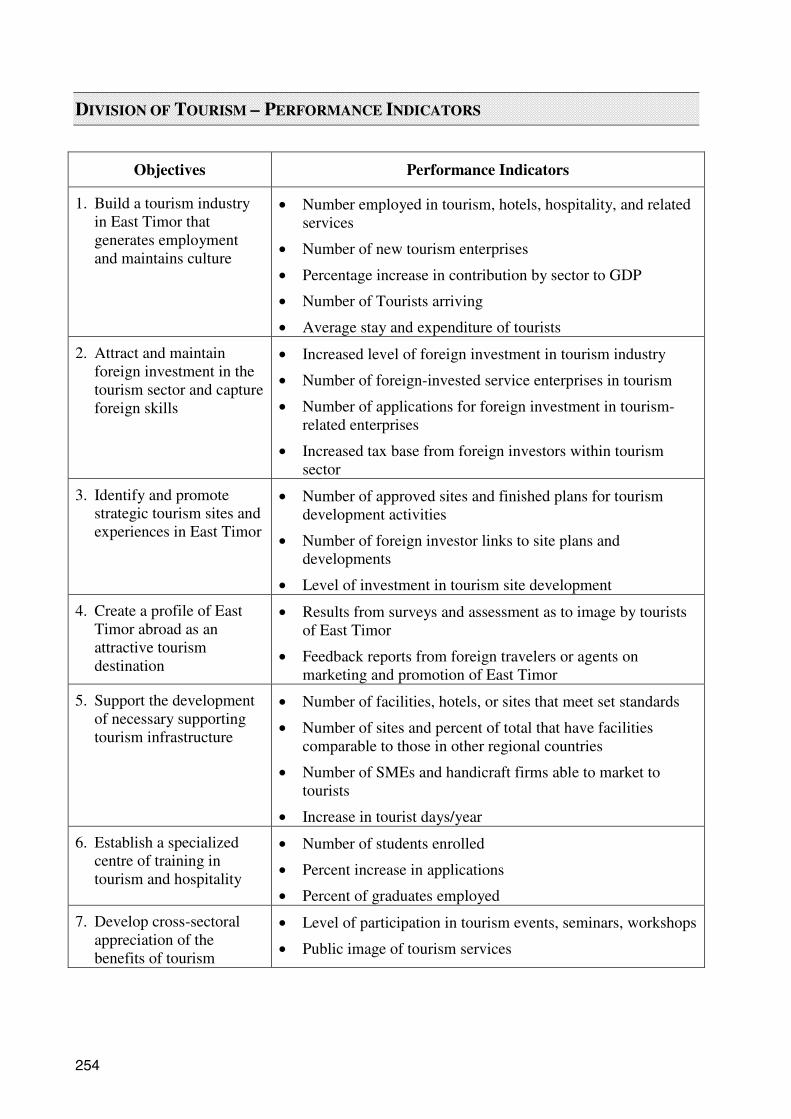
254
DIVISION OF TOURISM – PERFORMANCE INDICATORS
Objectives Performance Indicators
1. Build a tourism industryin East Timor thatgenerates employmentand maintains culture
• Number employed in tourism, hotels, hospitality, and relatedservices
• Number of new tourism enterprises
• Percentage increase in contribution by sector to GDP
• Number of Tourists arriving
• Average stay and expenditure of tourists
2. Attract and maintainforeign investment in thetourism sector and captureforeign skills
• Increased level of foreign investment in tourism industry
• Number of foreign-invested service enterprises in tourism
• Number of applications for foreign investment in tourism-related enterprises
• Increased tax base from foreign investors within tourismsector
3. Identify and promotestrategic tourism sites andexperiences in East Timor
• Number of approved sites and finished plans for tourismdevelopment activities
• Number of foreign investor links to site plans anddevelopments
• Level of investment in tourism site development
4. Create a profile of EastTimor abroad as anattractive tourismdestination
• Results from surveys and assessment as to image by touristsof East Timor
• Feedback reports from foreign travelers or agents onmarketing and promotion of East Timor
5. Support the developmentof necessary supportingtourism infrastructure
• Number of facilities, hotels, or sites that meet set standards
• Number of sites and percent of total that have facilitiescomparable to those in other regional countries
• Number of SMEs and handicraft firms able to market totourists
• Increase in tourist days/year
6. Establish a specializedcentre of training intourism and hospitality
• Number of students enrolled
• Percent increase in applications
• Percent of graduates employed
7. Develop cross-sectoralappreciation of thebenefits of tourism
• Level of participation in tourism events, seminars, workshops
• Public image of tourism services
255
DIVISION OF TRADE - OVERVIEW
14.78 Trade, both foreign and domestic, will play an important role in growing the economyand reducing poverty. Maintaining an open foreign trade policy, and resisting protectionisttendencies to increase import tariffs, will be critically important in ongoing efforts to increasenational competitiveness, grow consumer spending surplus, and respond accurately to productionconstraints, especially in agriculture. A stronger external sector has been repeatedly identified asan essential precursor to a stronger economy. The Government’s currency policy will also havea strong effect on the economy in general and trade in particular. The US dollar, should it retainits current relative value, or appreciate relative to key trading partners, will make East Timor’sexports less competitive and make imports more affordable.
14.79 The Government intends, upon independence, to seek membership of appropriate tradeorganizations. In relation to this, the Division of Trade will work closely with the Ministry ofForeign Affairs and Cooperation. Preferential treatment from key export markets, should it beobtainable, will immensely help East Timor’s export competitiveness as it continues its transitionto a viable, independent economy. The Government’s key trading partners will be Australia andIndonesia. Accordingly, additional effort to maximize benefit from bilateral relations with thesecountries should help East Timor to increase market access and levels of exports. As East Timorfurther formalizes its foreign trade policy over the next few years after independence, it will beimportant to recognize the shared and porous land and sea borders with Indonesia and theprospect of inward smuggling and loss of customs revenues should import tariffs be set too high.
14.80 The Government is also determined to reduce the size of the trade deficit and so has builtinto the Plan specific programs and projects designed to enhance domestic production capacity.This is aimed at increasing the level and diversity of exports and enabling local businesses tocompete with foreign businesses in the production of regularly imported gods, for example,foodstuffs.
14.81 Improving domestic trade linkages will arguably be the key factor in reducing poverty inrural areas, and in reducing income disparities between rural and urban areas. Improvements todomestic trade linkages will require a cross-sectoral approach, and will focus heavily onimproving information flows and services, and building business support services. Programs andprojects have been adopted in other sectors to improve rural access to telecommunications, andto continue to maintain the state of the roads. Additional training to rural businesses is alsoplanned.
14.82 The Division of Trade, working with the DoI, will play a role in monitoring levels andtypes of businesses, both big and small, domestic and foreign. The Business Registration Unit(BRU) will carry out much of this work. The Plan calls for enhanced efforts in businessregistration, both so that the process provides more utility to business users and serves as a morehelpful database for Government. It is possible that the BRU may move to the MoJ as part of thefuture Office of Companies Registrar, to be established pursuant to the law on corporations. TheBRU, nevertheless, is included here as a separate program.

256
DIVISION OF TRADE – PROGRAM SUMMARY
PROGRAMS OF THE DIVISION OF TRADE
Objectives:
a) To increase the level and diversity of exports
b) To maintain an open and competitive foreign trade regime
c) To explain the benefits of resisting protective tariffs
d) To seek membership of appropriate regional and international trade groups
e) To reduce the trade deficit
f) To improve the information systems of the Business Registration Unit
g) To add value to export products using new technology spillovers from FDI
Strategies:
a) Promoting East Timor’s products overseas at trade fairs and via other means
b) Encouraging foreign and domestic businesses to develop an export orientation
c) Supporting business associations develop overseas links that will enhance trade
d) Pursuing an amendment to exempt income tax on exports (excluding gas and oil)
e) Enabling domestic trade to link into foreign trade, especially for exports
f) Developing domestic production of imported goods, especially foodstuffs
g) Improving information monitoring systems for the Business Registration Unit
h) Seeking preferential trade arrangements from key exports markets as appropriate
Program 1: Trade Promotion
Key Projects:
a) Trade Exposition Centre
b) Trade fair Participation
c) Multimedia materials production and distribution
d) Domestic trade promotion and domestic market linkages
e) Overseas foreign trade promotion

257
Program 2: Policy and Regulatory Development
Key Projects:
a) International trade agreement accession
b) Trade and customs law
c) Foreign trade policy
d) Domestic trade policy
Program 3: Divisional Training Development
Key Projects:
a) Overseas capacity building training for divisional staff
b) Seminars and workshops
c) Language and trade management training
d) Program 4: Business Registration Unit
Key Projects:
a) Business registration and updating
b) Information systems
c) Monitoring and evaluation
DIVISION OF TRADE - OBJECTIVES
14.83 Some of the objectives specified for the Division is as follows.
a) To establish a Trade Exposition Centre for trade and investment development.
b) To create regional trade promotion activities that reach throughout the country withrelevant initiatives and support.
c) To encourage innovative development processes and technologies that add value toproducts or that introduce new products capable of reaching export markets.
d) To establish trade legations with close trading partner nations.
e) To establish trade-oriented relationships with regional multi-lateral associations,including ASEAN, the Pacific Forum, and others according to East Timor’s capacity.
f) To build domestic trade linkages by promoting better information services that aremore accessible to small business people
g) To establish, in conjunction with the Divisions of Industry and Investment, anindustrial zone for controlled export and transshipment of value-added products.

258
h) To establish a Web Site for trade information and market opportunities that capturesboth export profiles and import requirements essential for domestic development.
i) To establish staff training and management development activities to enhance traderegulatory and management capabilities within the division and among other relevantgovernment agencies.
DIVISION OF TRADE - STRATEGIES
14.84 The Division of Trade will pursue an aggressive strategy of integrated domesticdevelopment on which to foster exports and concurrently attract investments that can sustainfuture trade growth. The key to effective trade is having the domestic strength in exportableproducts that, in East Timor’s situation, will require a broad-based development program ofindustry, tourism, agriculture, and infrastructure. The Division of Trade cannot directly pursueinitiatives in any of these circumstances, but it can provide the support of government tradeprograms and a policy environment conducive to trade and investment.
14.85 The division will directly assert its capabilities in trade promotion to reach foreign tradeconduits for investment and market opportunities. This will be an information-based strategy ofutilizing the departmental database on all industrial and economic activity to formulate market-penetrating marketing materials and web-based access to East Timor’s trade opportunities.
14.86 The division will pursue a human resource development strategy aimed at elevating thedivision’s capabilities for working in, regulating, and managing a trade regime. In addition, thiseffort will establish materials and skill-based resources for wider utilization within government,for joint private-sector training and promotion activities, and for future development planningsystems.
DIVISION OF TRADE – PROGRAMS AND PROJECTS
Program 1: Trade Promotion
14.87 The Division of Trade will pursue joint projects within a broad program of developmentwith airport and seaport authorities to expand foreign trade, export processing, warehousing, andlogistics. In addition, the division will be working closely with divisions of Industry andInvestment on initiatives concerning special economic zones and industrial parks. The ultimateobjective of this program is to rapidly enhance the capability of East Timor to developmentexportable products and to pursue export markets.
14.88 The projects to be implemented under this program are the following.
a) Establish the Trade Exposition Centre in conjunction with divisions of industry andinvestment
b) Coordinated activities with divisions of Industry and Investment for capitalization ofindustrial zones
c) Joint projects with government agencies for seaport and airport development tofacilitate trade logistical capabilities
d) Support and promotion of export-related industry for inclusion in industrial parks

259
e) Domestic trade promotion and domestic market linkages
f) Technical assistance for SME training and enterprise development of trade-relatedmarketing, promotion, and financing,
g) Export finance and development for expediting international transactions
h) Export and Trade participation, such as regional presence in trade shows, hostingtrade and export/investment opportunities
i) Infrastructure joint projects for enhancing export capacity, such as bondedwarehousing, auction systems, and commodity logistics systems
j) Establishing foreign trade relations, particularly to Australia and Indonesia, withlinkage to broader regional trade conduits and international trade commissions
k) Web-based linkage to international trade and investment networks and multi-mediaproducts
l) Promotional packaging of investment and trade opportunities, informationalbrochures, and multi-lingual materials for domestic and foreign dissemination
m) Database management of exports and imports, companies, industry growth, andtourism, as part of a comprehensive departmental data management system
Program 2: Policy and Regulatory Development.
14.89 The principal objective of this program is to develop an integrated trade policy thataddresses foreign trade, company licensing, regulatory authority to protect the environment, andto give incentive to businesses. The Division of Trade will not be in a position to pursueunilateral legal or policy initiatives, yet it will be important to policy development and theregulatory operations required under a trade regime.
14.90 The projects to be implemented under this program are the following.
a) Domestic trade policy
b) Foreign trade policy
c) Support for cooperative development of trade and customs law
d) Develop a regulatory system for foreign trade licensing and monitoring withaccountability for customs or tax reporting
e) International trade agreement accession
f) Creation of policy instruments for export incentive programs or domesticdevelopment that reduces dependencies on imports
g) Establish trade-related government support activities for SME development andenhancement of informal sector participation through such activities as culturalproducts and services and handicrafts
260
h) Create a liaison function within trade to coordinate trade and investment activitieswith departments of environmental protection and relevant divisions concerned withmineral and natural resources
Program 3: Divisional Training and Development
14.91 Because trade represents a complication field with many different constituent interests, itis essential to have on-going staff training and capacity building within the MEAD, andexternally with agencies accountable for supporting trade endeavors. Therefore, the Division ofTrade will create a body of training materials and information under a model that can bereplicated and updated as trade and private sector activities accelerates.
14.92 The projects to be implemented under this program are:
a) Develop training materials and workshops on trade, regulation of trade, managementof trade transactions and financing, and use of network systems for regional andinternational trade legations
b) Develop multi-lingual training and trade management materials to enhancedepartmental, governmental, and foreign legation trade management and promotioncapabilities
c) Establish regular staff training and periodic seminars and workshops with technicalassistance (donor related) on trade, customs, trade expediting, and related topics ofinvestment, import controls, and joint development projects
d) Contribute materials on workshops and trade information to the departmentaldatabase, and ensure access to web-based and archive information resources
e) Establish a media liaison domestically and through trade legations for public relationsand trade-related development news
Program 4: Business Registration.
14.93 The existing Business Registration Unit is the only effective national point for companyregistration, and it is a fee-based service. However, there will be a far more important role for theregistration process as a commercial code and a company law are enacted (in whatever formthose take), and a complementary activity under a registrar for foreign investments. Theinstitutional structure of these licensing (or registration) processes has yet to be solidified, andindeed, the position of the current registry may be within another ministry. As a planningscenario, the BRU staff anticipates an enlarged role with far greater responsibilities and morepressing demands. These are listed here under “projects” but are more accurately “functionalactivities.”
14.94 The projects to be implemented under this program are the following.
a) Establish an effective and comprehensive registration process for domestic andforeign companies with appropriate regulations on licensing and permits
b) Create a fee-based registration process that is equitable among differentclassifications of enterprises and commercial activities

261
c) Technical assistance to develop effective use of registration income, if not accruing tothe general budget, for relative private sector development or enhanced managementof the registration process
d) Information database
e) Establish a compliance methodology for equitably monitoring registrations, ensuringlegal procedures, and accounting for new, terminated, and inactive enterprises
f) Technical assistance for institutional restructuring that solidifies activities ofregistration with commercial codes, company laws, the foreign investment law, andother regulations under appropriate ministries

262
DIVISION OF TRADE – PERFORMANCE INDICATORS
Objectives Performance Indicators
1. Increase the level and diversity ofexports and earn additional foreignrevenues
• Percent increase of exports
• Number of new products or repackaged productsexported
• Percent contribution to GDP
• Rate of growth of exports by sector
2. Maintain an open and competitiveforeign trade regime
• Comparative trade regime to trade partners withoutdisparities
• Trade balances
3. Explain the benefits of maintaininggood trading relations and resistingprotective tariffs
• Number of media events, seminars, and tradeprograms
• Proportional participation by all sectors andclassification of individuals in trade events
• Absence of protective regulations or implementationof incentives
4. Seek membership of certainregional and international tradegroups as appropriate
• Progressive participation by East Timor in ASEANand other Pacific Rim associations
• Recognition of East Timor for observer status and formembership in key regional associations
5. Reduce the trade deficit • Percentage growth of exports in excess of percentageincrease in imports
• Reduction of trade gap by each major sector with oiland gas interest tracked independently
• Reduction due to oil and gas exports
6. Improve the information systems ofthe Business Registration Unit
• Accomplish institutional restructuring
• Implement enforceable registration system fordomestic and foreign enterprises
• Increase revenues from registrations
• Reduced time for registration
7. Add value to export products usingnew technology spillovers fromforeign investment
• Value chain analysis of technology implementationfrom foreign investments
• Analysis of secondary market for replacementtechnology
• Improved productivity

263
15. INFRASTRUCTURE
“Having an effective system of physical infrastructure and services is crucial for agricultural productivity and poverty reduction, a determinant of business
investment, instrumental to human development, and the foundation for private sector development.”
VISION
15.1 To plan for, provide and manage physical infrastructure that is efficient,cost-effective and financially sustainable, and which supports the social andeconomic development priorities of the people of East Timor.
INTRODUCTION
15.2 Infrastructure is an issue of overarching importance to all sectors of theeconomy and society. This includes the physical capabilities and service systemsthat provide to all people the essentials of electric power, water, sanitation, postalservices, telecommunications, roads, air and sea transport facilities, and varioussupport services. Infrastructure has perhaps the strongest cross-sectoralimplications for national development. Having an effective system of physicalinfrastructure and services is crucial for agricultural productivity and povertyreduction, a determinant of business investment, instrumental to humandevelopment, and the foundation for private sector development. Infrastructurerepresents many diversified responsibilities, and through the Working Groupsestablished the vision statement above on which to pursue priority developmentactivities.
15.3 As background to this plan, it must be emphasised that infrastructure is ina poor state, substantially damaged and in some instances obliterated by years ofconflict and lack of meaningful maintenance. Reconstruction efforts have beenprogressive with airports and seaports operational, major road repairs andmaintenance programs underway, and to a significant degree, water supply andsanitation services restored. Substantial progress has been made to reconstruct amajority of the damaged buildings and houses through humanitarian relief workand donor reconstruction programs. Telecommunications services have beenrestored using largely temporary measures supported by UNTAET and through acommunications system contracted with an Australian company. Postal servicesremain very weak. Electricity generation is now near to its pre-1999 levels ofsupply and reliability, but there has been insufficient progress in putting the powersector on a sustainable footing.
15.4 The Infrastructure Sector as presented in this Plan is treated as thecollective efforts of many directorates. (The term “Division” is used fordirectorate to distinguish it from the administrative department.) Officially, thereis no infrastructure agency. Instead, it consists of Divisions under three separateMinistries. The Ministry of Water and Public Works (MWPW), recentlyreorganised, has four functional Divisions under the Director-General of onedepartment. The Ministry of Economic Affairs and Development (MEAD) has

264
one infrastructure-related activity, the Division of Energy, which reports directly to the Minister.And the Ministry of Communications and Transport (MCT) has five Divisions administeredunder the Director-General of one department. These Divisions have unique responsibilities, andbudgetary accountability is within their respective ministries. However, activities among thevarious Divisions are captured in this planning document, often resulting in a consensus voice,yet because the individual Divisions have differentiated priorities, this plan addresses eachseparately. Table 15.1 summarises the structure used within the report while the term“Infrastructure” is used as the collective initiatives of all concerned.
Table 15.1 Planning Structure of Infrastructure Sector
Ministry Division (Directorate)
Water and Public Works • Public Works
• Roads, Bridges and Flood Control
• WSS
• Research and Development
Economic Affairs and Planning • Division (directorate) of Energy: EDTL,operates as a Government-owned company.
Communications and Transport • Land Transportation
• Civil Aviation
• Sea Transportation
• Telecommunications and Post
• Meteorology
MAJOR GOALS OF INFRASTRUCTURE
15.5 The Infrastructure Sector will emphasise national priorities of economic development anda strong commitment to poverty reduction throughout its department activities. In essence, therole of government will be strongly focused on establishing physical capabilities and publicservices required for sustained development. Consequently, there are two overarchinginfrastructure goals that amplify the sector vision. They are:
a) to minimise adverse impacts on the natural and human environment, and to takeaccount of the needs and aspirations of those disadvantaged by poverty, remotenessand difficulty of access to infrastructure services; and
b) to regulate the sector so that infrastructure and services are safe, are provided at a fairprice, and give maximum opportunity for Timorese people and enterprises toparticipate in their construction, management, operation and use.

265
GUIDING PRINCIPLES FOR DEVELOPMENT
15.6 A composite approach to development permeates the Infrastructure sector even thougheach of the departments operates within differentiated and independent parameters. There areseveral guiding principles that underscore the major development goals and provide a foundationfor accountability. These are as follows.
a) To pursue infrastructure development that is safe and that can provide accessibility toneeded services and utilities by everyone.
b) To pursue activities that bring infrastructure and services to the disadvantaged, thusencouraging economic growth while reducing poverty.
c) To create an enabling environment required for sustained development while ensuringa regulatory process that guarantees fair prices without corruption, effective revenuemanagement, and transparent public administration.
d) To work in cooperation with other Government ministries, agencies, districtadministrations and communities in ensuring the efficient delivery of services.
e) To utilise the private sector to the maximum extent possible in the cost effectivedelivery of projects, programs and services, and to support and promote thedevelopment of the private sector in this role.
f) To promote whenever possible equity between regions and between urban and ruralcommunities.
g) To ensure the protection of the natural and man-made environment, safety fromnatural disasters, and the protection of human life.
DIRECTOR-GENERAL, DEPARTMENT OF WATER & PUBLIC WORKS (MINISTRY
FOR WATER AND PUBLIC WORKS)
15.7 Following recent restructuring, the Office of Director-General (ODG) under the MWPWnow has management responsibilities for public works administration of four Divisions. Theseconcern public works, roads, bridges, and flood controls, water and sanitation, and research anddevelopment. These are more fully explained under Division plans. The Director-General’sOffice has overall department responsibility, represented by the following operations anddepartment services.
a) Financial planning, management, budgeting and control.
b) Human resource management and departmental coordination.
c) Procurement services including civil works equipment and services (in accordancewith technical requirements of directorates).
d) Management of departmental assets.
e) Provision and operation of facilities to enable directorates to pursue their programsand project activities.

266
15.8 The ODG as the operational arm under the Ministry has several important inter-ministrytasks. These are not presented here as distinct programs or projects, yet they are focal activitiesthat must be accomplished. These are to achieve interdepartmental integrated ministerialagreements, largely directed toward capital assets and development responsibilities. The fivemain concerns are as follows.
a) An agreement on responsibilities with all ministries on capital allocations for new orrenovated offices, and future roles for maintenance.
b) An agreement with constituent ministers on use of natural, mineral, and waterresources for public works and construction.
c) An agreement with appropriate departments in agriculture, fishing, and forestry, andthose concerned with the environment for use of surface water, responsibilities forrivers, various maintenance requirements.
d) An agreement with Communications and Transport that covers all public worksactivities requiring equipment, transport, and national communications assets.
e) An agreement with Industry, Trade, and Tourism regarding development andmaintenance of industry parks, business centres, or tourist structures.
PUBLIC WORKS DIVISION
15.9 The Public Works Division under the ODG and the MWPW is concerned withreconstruction of public buildings in Dili and the nation’s districts, oversight of tenders for newpublic construction, coordinating public housing (government facilities) in Dili and the districts,and instituting urban planning. Division responsibilities focus on reconstruction and new publicdevelopment of facilities, but activities each beyond the Division to include cross-cuttinginterests of other ministries and Divisions. The Division’s objectives, strategies for pursing thoseobjectives, programs and projects are described in the following passages.
Public Works Objectives
15.10 The Division’s objectives reflect its primary responsibilities yet also accommodateinterdependent activities of other agencies, such as coordinating urban development plans thatmust coincide with road, traffic, and public utility services, and regulatory issues that involveother departments and ministries. These are the following.
a) To reduce housing shortages in urban centres through improved planning andregulation in support of national policies.
b) To improve housing facilities in urban slum areas through planning, contracting,engineering services, and cooperative support for poverty reduction initiatives.
c) To provide structural development and essential public services while minimisingadverse ecological and environmental effects.
d) To provide engineering services for the design and implementation of publicbuildings, government staff housing, and associated facilities as required to supportgovernment development programs.

267
e) To facilitate the improvement of spontaneous housing settlements through planning,design, and implementation of micro infrastructure utilising community participationand management approaches.
f) To implement urban development planning and control systems in Dili and districtcapitals including urban land use planning, development control systems, andbuilding regulations.
g) To pursue human resource development with a sustainable staff with technicalcapabilities for management of a diverse program of public works development.
Constraints, Problems, and Issues
15.11 The Division faces constraints similar to all other Divisions and directorates, primarilythus concerned with severely limited budgets and the lack of well-qualified human resources in anumber of areas that require very specific technical education and experience. The Division alsolacks a legal foundation for pursuing many necessary projects, and it faces logistical challengesof serving rural areas or administering district programs. With that said, many of the objectivesand program activities are aimed at resolving these problems, not treating them as uncontrollablebarriers to development. Several points are illustrative:
a) Legislation and a regulatory framework. Lack of an enabling environmentconstrains the Division from pursuing medium-term and long-term objectives, andtherefore it is essential that the ministries (with departmental and Divisioncooperation) initially pursue laws that will provide building and land codes, housingpolicies and construction standards, and empower Public Works and other constituentDivisions to pursue urban, rural, and regional planning.
b) Human resources. A majority of proposed programs and projects under this plancannot be realised without technical expertise. In the near-term, donor assistance mayfulfil these needs, but the Division will require staff with a broad range of technicalskills that include: urban planning and design; community development; townscape &landscape architecture; all relevant engineering; land surveying; and cost estimating.
c) Support facilities and funding. Oversight and management of public works,tendering and follow-on quality control, and actual the environmental necessities ofurban and rural district projects will require laboratory testing and inspectionprocesses which do not exist nor are they funded. Public works activities require ruralpresence, travel, and a project management/monitoring process that will requirecapital and staff beyond the scope of this plan.
Public Works Strategies
15.12 Public Works will develop a legislative framework to address relevant infrastructurepolicy issues, and generate the regulations required to appropriately implement and manageoperations. Much of the legislative and regulatory framework will be derived from experiencesof other countries, adapted to the particular socio-economic and cultural conditions in EastTimor.
15.13 With departmental support, local human resource capabilities will be enhanced through anumber of skills training programs developed over the five-year planning period. Immediatehuman resource needs, particularly those for higher-skilled and experienced experts, will requirenear-term recruitment and external assistance.

268
15.14 The Public Works Division, other government agencies and ministries recognise theimportance of a GIS. Public Works is willing to be responsible for establishing an GIS that couldbecome a national asset for broader utilisation, but wherever the GIS is positioned, it will be anessential tool for the Division in terms of urban planning, construction, and development.
15.15 Public Works will implement the engineering design and supervision processes for publicbuildings and housing construction. The Division will establish outsource and tender procedures,then ensure oversight of projects in cooperation with the respective constituent funding Divisionsor ministries. Current projects, and those in the near-term, are funded under TFET; larger futureprojects will require donor assistance.
Public Works Programs & Projects
15.16 The Division of Public Works has structured individual project activities under fiveprograms. It is understood that the ODG will also be addressing integrated activities foradministrative training, planning, and capacity building that concerns all Divisions within thedepartment while specific technical training will be addressed by the separate Divisions. Fullydescriptions of programs and projects are contained in detailed planned documents by eachDivision.
Program 1: Institution Building
15.17 The focus of this program is to draft and Implement planning guidelines, draft regulationsfor public works, implement housing standards, create building and construction codes, addressboth public and private land utilisation.
Projects
a) Draft Planning Act and with Timor Planning Institute.
b) Capacity building for staff planning, urban planning, rural development at national,district, and village levels.
c) Draft a Housing Policy and establish regulations on public and private housing.
d) Draft a National Building Code.
e) As an activity in support of the Building Code, formulate Industry ConstructionStandards.
f) Establish a Works Specification and Cost Analysis procedure for all tendering andprocurement.
Program 2: Urban Planning
a) Dili Zoning Plan under the Dili District Administration.
b) Central-South Dili, Central-North Dili, East Dili, and West Dili Land Use Plans
c) Baucau, Suai, and Maliana Strategic Zoning Plans and Land Use Plans
d) Liquiça, Manatuto, and Ermera Strategic Zoning Plans and Land Use Plans

269
e) Lospalos, Viqueque, Aileu, Ainaro, Same, and Oecussi Strategic Zoning Plans andLand Use Plans
Program 3: Slums Improvement
a) Central-South Dili Slums and Central-North Dili Slums Improvement Program
b) East Dili Slums Improvement Program and Study of West Dili Slums
Program 4: Provision of Government Buildings
a) Renovation of MWPW Offices
b) Renovation of District Offices for Water and Public Works
c) Renovation of Ministry of Internal Administration Offices
d) Renovation of Ministry of Agriculture Offices
e) Renovation of Customs Offices under the Ministry of Finance
f) Establish and Renovate a National Registry Building
g) Renovation of Judges and Prosecutors Housing (Central and Districts)
h) Renovation of District Offices (Covalima, Lautem, Liquiça, and Viqueque)
i) Renovation of Warehouses/Workshops (Viqueque, Lospalos, Suai, Oecussi)
j) Renovation of 65 Sub-district Administration Buildings
k) Renovation of the Presidential Office
l) Renovation to Establish a National Archives Building
m) Renovation of MFAC Offices
n) Renovation of MCT Offices
o) Renovation of MoH Offices
p) Renovation of MAF Offices
q) Renovation of Ministry of Labor and Solidarity Offices
r) Construct a New Central Bank Building
Program 5: Public Education and Training
a) Planning Principles Training at National and District Levels
b) Planning principles Training at Sub-District and Village Levels
c) NGO and Government Workshops on Urban and Rural Planning

270
Table 15.2: Public Works Performance Indicators
Objectives Performance Indicators
1. Reduce housing shortages inurban centers through improvedplanning and regulation insupport of national policies.
• Urban Land Use Plan Completed
• Urban Development Controls Implemented
• GIS Utilised for Integrated Planning
• Assessment to Reduce of Housing Shortage
2. Improve housing facilities inurban slum areas throughplanning, public contracting,engineering services, andcooperative support for povertyreduction.
• Urban Land Use Plan Completed
• Urban Slum Areas Reduced
• Assessed Access to Public Facilities
• GIS Utilised for Integrated Planning
• Assessment of Reduced Slum Population
3. Structural development ofessential public services whileminimising adverse ecologicaland environmental effects.
• Percent Increase in Household Access to PublicUtilities
• Assessment of Improved Urban Health Environment
• Reduction in Environmental Hazards
4. Engineering services for thedesign and implementation ofpublic buildings, governmentstaff housing.
• Percent of Public Buildings Engineered andReconstructed
• Percent of Government Staff Adequately Housed
5. Improvement of spontaneoushousing settlements throughplanning, design, andimplementation of microinfrastructure utilisingcommunity participation
• Improved Living Conditions Assessed
• Settlement Areas Planned
• Extent of Community Participation
• Micro Infrastructure Designed/Implemented
6. Urban development planningand control systems in Dili anddistrict capitals.
• Urban Development Plan Assessment Implemented
• Dili and District Capital Plans Completed
• Development Controls in Place
7. Human resource developmentwith a sustainable staff oftechnical experts and capabilitiesfor management.
• 100% Staffing for Management
• 100% Engineering and Technician Targets
• Achieve 100% District Supervision Levels
271
ROADS, BRIDGES AND FLOOD CONTROL DIVISION
15.18 The Division of Roads, Bridges, and Flood Control (DRBFC) is primarily concernedwith regulation of roads and roadway reserves, management of tenders and maintenancecontracts on roads and easements (including environmental concerns of related development),planning and legal classification of roads, coordination of traffic regulations with the MCT, andthe hydrology and soil mechanics of bridge and adjacent roadway development.
DRBFC Objectives
15.19 Guiding principles under the department mandate coupled with similar principlesestablished within this Division largely determine DRBFC objectives. Specifically, the Divisionhas responsibilities to assure all citizens of parity in road and transport access withindevelopment constraints, and also to ensure the needs of national security and defence areaccommodated in roads, bridges, and flood control activities. The Division will face constraintsbut will seek to fulfil the following objectives.
To identify the national district and rural road network essential for the support of economicand social development.
To initiate policies within a legal and regulatory framework for order of the territory thatimprove quality of life, encourage private enterprise, and assist those with access and safety,particularly in impoverished areas.
To develop roads, bridges, and topologies of flood controls that provide environmentalprotection and further reverses existing ecological damage.
To ensure development and regulation for the safe circulation of transport.
To ensure transport infrastructure that meets national defence imperatives
To establish technical standards for a national road network.
To preserve the existing road assets as the first priority through sustainable maintenance andlong-term management plans for support systems.
To establish an institutional structure and develop technical and administrative capacity ofTimorese staff to manage, maintain and improve the road network.
To implement sustainable strategies for the maintenance of rural access roads.
To establish and implement sustainable erosion control measures to prevent damage tophysical Infrastructure and economically valuable property.
Constraints, Problems and Issues
15.20 The most significant immediate constraints should be viewed as opportunities for theDivision and other government agencies to strengthen the existing poor structure of the legal andregulatory environment of East Timor. In addition, the constraints faced in human resources andlack of local technical skills can be viewed as an opportunity to create new jobs and greaterprofessional capacity in the nation. Some constraints, however, are not immediately controllable
272
and represent barriers to effective program implementation. Several key points are emphasisedbelow.
a) Legislation. Agreement on roles and responsibilities between the MWPW and MAFare needed to protect and improve the environment around roadways, bridge sites,and riverbanks. Concurrent environmental protection regulations are essential.Legislation that defines road reserves, drainage easements, and access to land forconstruction and maintenance will also be required. And regulatory guidelines areneeded on utilisation of natural and mineral resources.
b) Human resources. The flood control activity cannot be pursued without recruitmentof experts or external (donor or contractual) assistance. The nation does not havethese core capabilities to recruit in the near term. Requirements in particular includehydrologists, geologists and soil mechanic experts, and environment specialists.Equally important, there is no local indigenous capability to train specialists or toprovide the mentoring required.
c) Support systems. Procurement systems and logistic are inefficient, and the ability toprovide private sector support is nascent. In effect, there is not sufficient equipmentor private contractors to pursue many of the priority projects, and little capability tomaintain road, bridges, or conservation facilities. Regional offices andcommunications are problematic, and there is little capability to provision or equipthe districts for rural road and bridge development. The types of equipmentemployed in East Timor, and their respective technologies, are far less than optimal.
DRBFC Strategies
15.21 Policy and legislative initiatives will be pursued through the Land and Property Unit, andin conjunction with the MCT and the MAF (particularly the Director of Forestry). These liaisonsare essential for an integrated strategy of development to address a broad range of cross-cuttingissues relating to land use, roadways, water rights, forestry and mineral appropriations, andregulations for roadway utilisation, vehicles, and coordinated water and sanitation development.Creation of a road classification system will also be a strategic coordination process with otherministries.
15.22 An Inter-departmental commission will be established for land transport regulations,oversight responsibilities for traffic, and vehicular safety. In addition, there is a role for NGOsand external expertise, including socio-cultural interests and those most able to address ruralpopulation problems and poverty reduction, to address infrastructure priorities within the contextof community development and environmental protection.
15.23 The Division will develop human resource capabilities within its limitations and seekrecruitment for higher skills when possible, but in the near term, the Division will continue torely on existing (in progress) projects under international donors and activities being pursuedunder TFET funds that bring to East Timor the necessary technical experts. Over the five-yearplanning period, the Division will seek to create the local capabilities for sustained training andmentoring.
15.24 A strong priority will be placed on private sector contracting and outsourcing,maintaining internal oversight for tenders and continued monitoring. The Division will seekcooperative assistance to develop the technical standards required for road building,maintenance, inspection, materials management, bridge engineering, flood controls and district

273
water resource utilisation, and conservation as it applies to national roadway plans and respectiveurban road and street development.
15.25 A priority will be placed on reconstructing and expanding the main national roadnetwork, thus reaching well into the districts and rural areas, but also supporting industrialdevelopment initiatives and the priorities of airport and seaport facilities. Only emergency workwill be carried out on sub-district and feeder roads in the budget period, and any periodicmaintenance or capital works on urban roads must be addressed outside CFET or existing TFETproject allocations.
15.26 Multilateral and bilateral donors require, as a priority, to ensure funding for periodicmaintenance programs, and realistic plans funding upgrading programs and new capital projectsfor bridges or flood control projects. Consequently, the Division must be part of a broaderministry effort to secure infrastructure development assistance, and to those ends, the Divisionwill develop appropriate scenario plans for systematic capital development with long-termfunded maintenance programs.
DRBFC Programs & Projects
15.27 The Division does not have specific responsibilities for “institution building,” yet it willplay a vital role in achieving the agreements under the ODG for natural resource utilisation,responsibilities for roadway and river areas, and cooperative work with Divisions concerned withwater, sanitation, and environmental protection. The Division as it is now structured also is partof on-going projects previously funded (TFET I and II), yet these will not be oversightresponsibilities of other directorates. With that said, the DRBFC will focus technical projectsunder two mainstream programs, and one program of public safety designed to become astanding process. These are summarised below:
Program 1: Road & Bridge Rehabilitation and Maintenance
15.28 First priorities during the early stages of this planning period are for road and bridgemaintenance. There are several projects well underway, each with TFET funding, and severalwith preliminary interest for donor support. Secondary priorities concern road and bridgeupgrading with long-term plans capable of networking the country with effective and safeground infrastructure to serve the entire population.
Projects
a) Road Maintenance for Current Requirements (TFET)
b) Small Bridge Maintenance and Replacement (TFET)
c) Road Maintenance in Core Network and Districts (2002-2007)
d) Major Maintenance, Re-alignment, Resolving Slips & Washouts (2002-2003)
e) Casa and Natarbora Bridges (2202-2004)
f) Bridge Causeway Construction (2004-2007)
g) Periodic Maintenance of Core Network and Districts
h) Cooperative Planning for Urban and Rural Development for Road & Street Access
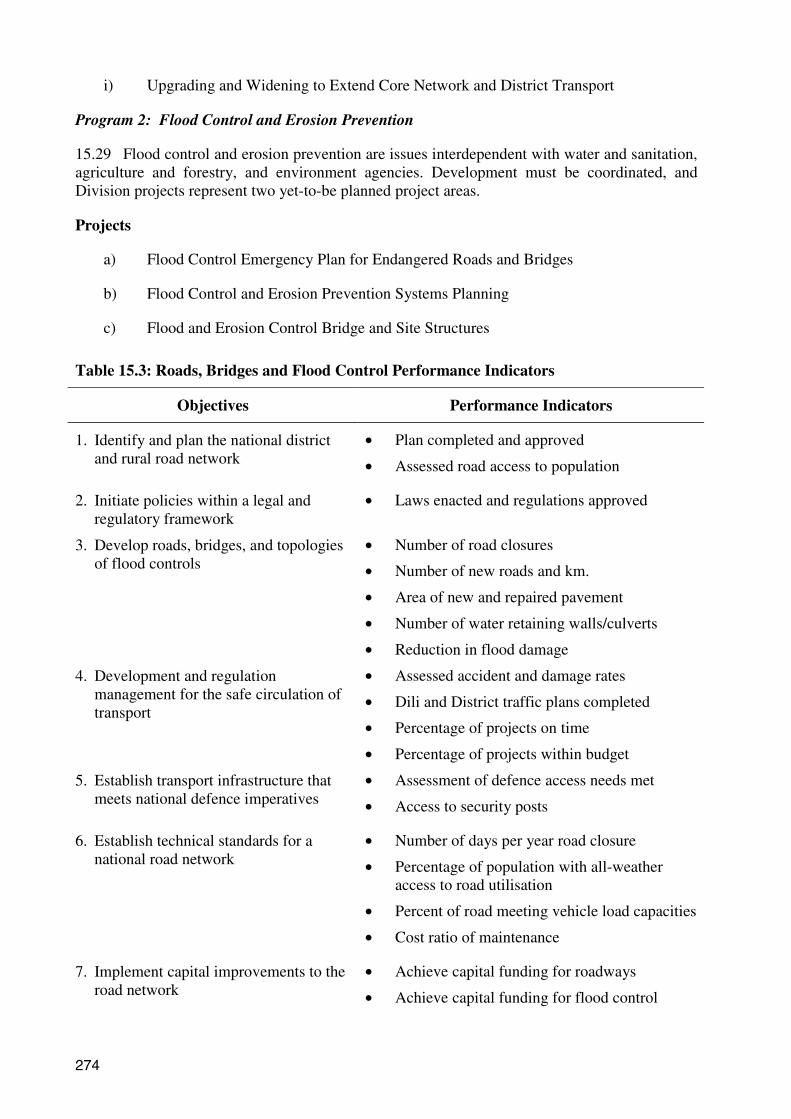
274
i) Upgrading and Widening to Extend Core Network and District Transport
Program 2: Flood Control and Erosion Prevention
15.29 Flood control and erosion prevention are issues interdependent with water and sanitation,agriculture and forestry, and environment agencies. Development must be coordinated, andDivision projects represent two yet-to-be planned project areas.
Projects
a) Flood Control Emergency Plan for Endangered Roads and Bridges
b) Flood Control and Erosion Prevention Systems Planning
c) Flood and Erosion Control Bridge and Site Structures
Table 15.3: Roads, Bridges and Flood Control Performance Indicators
Objectives Performance Indicators
1. Identify and plan the national districtand rural road network
• Plan completed and approved
• Assessed road access to population
2. Initiate policies within a legal andregulatory framework
• Laws enacted and regulations approved
3. Develop roads, bridges, and topologiesof flood controls
• Number of road closures
• Number of new roads and km.
• Area of new and repaired pavement
• Number of water retaining walls/culverts
• Reduction in flood damage
4. Development and regulationmanagement for the safe circulation oftransport
• Assessed accident and damage rates
• Dili and District traffic plans completed
• Percentage of projects on time
• Percentage of projects within budget
5. Establish transport infrastructure thatmeets national defence imperatives
• Assessment of defence access needs met
• Access to security posts
6. Establish technical standards for anational road network
• Number of days per year road closure
• Percentage of population with all-weatheraccess to road utilisation
• Percent of road meeting vehicle load capacities
• Cost ratio of maintenance
7. Implement capital improvements to theroad network
• Achieve capital funding for roadways
• Achieve capital funding for flood control

275
8. Preserve the existing road assetsthrough appropriate allocation of roadfunds and a system of sustainablemaintenance
• Number of road with maintenance achieved
• Km of roads and percent maintained
• Percentage of maintenance on time
9. Establish an institutional structure anddevelop technical and administrativecapacity
• Division staff and management approved
• Qualified technical staffing levels met
• Certified staff levels attained
10. Implement sustainable strategies forthe maintenance of rural access roads
• Rural road maintenance plan approved
• Number of roads maintained under plan
• Km of rural roads maintained
11. Establish and implement sustainableerosion control measures
• Number of reduced flood-related incidents
• Percent reduction for road maintenance
• Assessment of environmental impact
12. Enhance human resource capabilitiesfor sustained indigenous development
• Number of local qualified staff
• Number participating in training workshops
• Percentage retained and qualified
WATER AND SANITATION DIVISION
15.30 The Water and Sanitation (WSS) Division is responsible for establishing the legal andinstitutional framework for water utilisation and sanitation controls, managing the integratedactivities of water and sanitation engineering, water quality control, relevant development andmaintenance contracts, and establishing support activities (e.g., customer services, materialswarehousing, waste collection vehicles, and waste tanks or sites). The WSS Division also willinitiate a program of public information and education workshops to promote safe water andsanitation practices.
WSS Division Objectives
15.31 The Division has aggressive objectives to pursue safe water and sanitation throughoutEast Timor, but realistic expectations must be appreciated for each of the long-term objectives.The Division will prioritise its efforts with respect to each objective and in general pursueincremental cost-effective programs that can progressively improve human welfare. Primaryobjectives for administrative responsibility include the following.
a) To provide adequate, safe and sustainable water supplies for the communities of Diliand major urban centres in districts, with the aim of full cost recovery from users ofthe water supply.
b) To facilitate adequate, safe and sustainable water supply and sanitation for village andrural communities through community-managed water and sanitation facilities.
c) To facilitate at a National level the safe disposal of sewage and wastewater in urbanareas.

276
d) To facilitate at a National level the collection and safe disposal of nuisance surfacewaters from major urban areas.
e) To facilitate at a National level the collection and safe disposal of solid and hazardouswaste from major urban areas.
f) To ensure the appropriate management of water resources for the purposes of watersupply and sanitation in cooperation with other relevant ministries.
g) To inform the public of safe water and sanitation practices that systematicallyimprove the environment and enhance human health and welfare.
Constraints, Problems and Issues
15.32 The WSS Division faces an uphill struggle with long-term expectations to achieve manyof its objectives. Many of the constraints can be overcome through legislative enactments andinter-ministerial cooperation, but funding is a limitation that will persist. Social and culturalconstraints are viewed as challenging opportunities to enhance living standards and supportpoverty reduction initiatives. These include the following.
a) Legislative. Agreements are needed on roles and responsibilities between theMWPW and the Secretary of State for Natural & Mineral Resources regarding controland management of water resources. The Division must also have enabling legislationto pursue water and sanitation services, assess tariffs, and expedite procurements.
b) Human resources. Like most Divisions, WSS is facing shortages of human resourcesin the fields of resource management, sanitation engineering, quality control,plumbing technicians, cost estimating, and public information specialists. Timoresestaff are not sufficiently skilled in current methods of water and sanitation systems toadminister, cost, plan, or manage.
c) Support facilities. There is a pressing need for customer service centres andwarehouse, technical workshop areas, drilling and well equipment, heavy equipment,waste tanks, and procurement of sanitation materials and supplies, including vehiclesfor waste collection and recycling. There is no effective capital budget for theseactivities, and limited funding for maintenance.
d) Social and cultural issues. A majority of the population has had little or noexperience with modern water or sanitation processes, and do not understand thehazards of unsafe conditions nor how to resolve them. What they cannot understandor see for themselves cannot motivate them to change behaviour. The health problemsof East Timor, sanitation safety, social improvement of fundamental livingconditions, improved agricultural health systems, and the simple act of clean living indecent surroundings will require a pervasive change in human behaviour. Thisbecomes an enormous challenge for government and social leaders, but in particular achallenge for the Division.
WSS Division Strategies
15.33 The Division will be part of an integrated team comprised of staff from the threeministries to develop an effective body of infrastructure-related legislation. This is essential toaddress during the first two years of the plan, resulting in a legal basis for design and planning ofwater and sanitation systems in concert with road building, bridge work, flood control, and

277
priorities of environmental protection. Such an integrated approach will include representativesof health and community development agencies, and the real property and land managementstaff from several ministries.
15.34 A similar integrated process must be established for long-term operational planning anddevelopment of water and sanitation resources. This will involve a commission that can plan andimplement programs for district and rural (village) public works, specifically those for safewater, options for disposing of non-solid waste and collection or recycling of solid waste,coordinating priorities of health authorities, and supporting programs of agricultural andcommunity development. A parallel commission will address public works and public healthissues for urban public works where special attention must be given to slum rehabilitation, streetconstruction and repair, water and sanitation related to public and commercial users, and thewider ranging development interests for airports, seaports, industrial parks, and public recreationfacilities.
15.35 The Division recognises the importance of addressing high-priority objectives related topoverty reduction, improved conditions for human health, and such problems as urban slums andextreme rural isolation. Consequently, during the first two years of the planning period, theDivision will concentrate on service delivery requirements for safe water and adequate sanitationfor these and other high priorities.
15.36 The Division will seek to ensure that adequately trained or skilled personnel will bemaintained for addressing water and sanitation service programs in Dili and primary urbancentres during the first three years. This will involve budgeted capacity building training with acontinuation of existing transitional donor support programs. During the latter half of the five-year planning period, water and sanitation will require support for rural and district staff trainingand development, and more extensive technical expertise, which can be partially addressedinternally and partially with donor support.
15.37 The Division will seek the most cost-effective way of implementing programs,conducting assessments, and fulfilling projects. Competitive bids and tenders will be stressed foroptimal participation by private consultants and contractors, not only for designing andimplementing projects, but for potential investments in water and sanitation facilities, supplyingmaterials and fixtures, and maintaining these systems.
15.38 It will be essential for the Division to address the social and cultural patterns of water andsanitation utilisation. Therefore, the Division will establish a program of public information andeducation on water and sanitation issues, and in the long term, one that can lead to an informedpublic capable of self-managed hygiene.
WSS Division Programs and Projects
15.39 After recent reorganisation within the department, the WSS Division has identified fourcore programs. The first, concerned with capacity building, include the Joint departmentaltraining and staff recruitment responsibilities. These are interdependent activities whileremaining programs address technical project activities.
Program 1: Institution and Capacity Building
15.40 Training and capacity building will occur through inter-Divisional workshops andprograms designed to reach a wide constituency that includes NGOs and government staff. TheDivision will focus on specific projects are noted below.
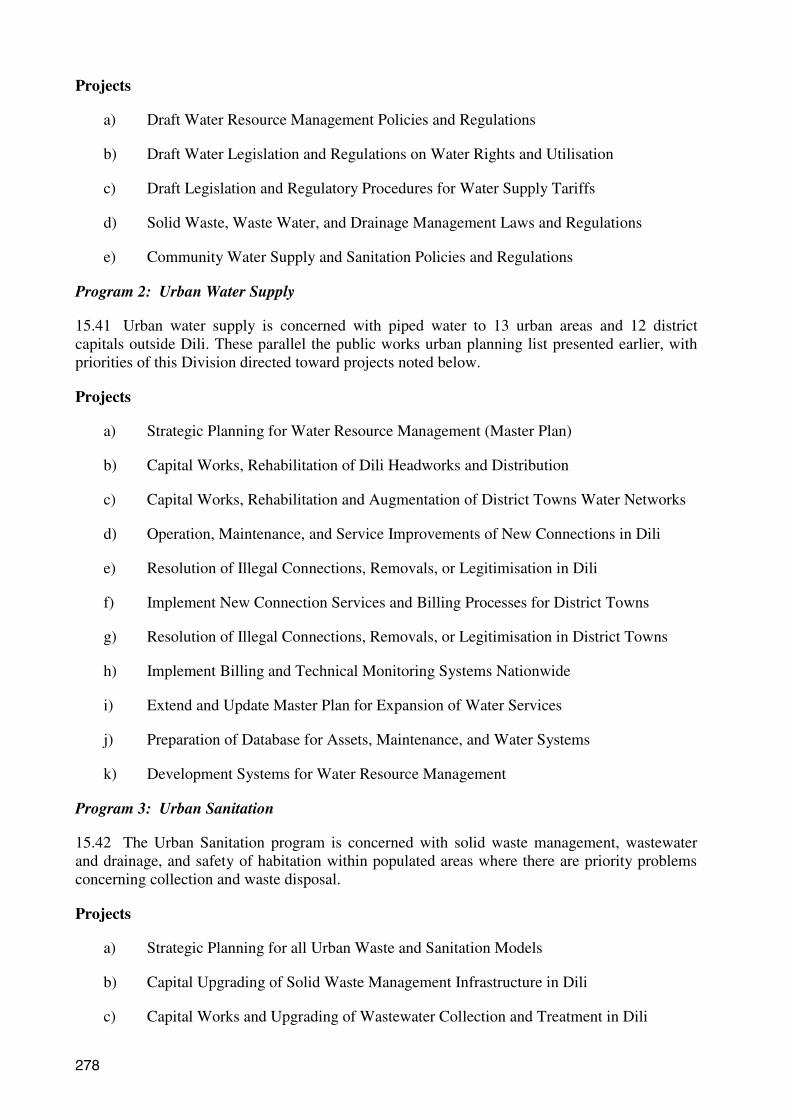
278
Projects
a) Draft Water Resource Management Policies and Regulations
b) Draft Water Legislation and Regulations on Water Rights and Utilisation
c) Draft Legislation and Regulatory Procedures for Water Supply Tariffs
d) Solid Waste, Waste Water, and Drainage Management Laws and Regulations
e) Community Water Supply and Sanitation Policies and Regulations
Program 2: Urban Water Supply
15.41 Urban water supply is concerned with piped water to 13 urban areas and 12 districtcapitals outside Dili. These parallel the public works urban planning list presented earlier, withpriorities of this Division directed toward projects noted below.
Projects
a) Strategic Planning for Water Resource Management (Master Plan)
b) Capital Works, Rehabilitation of Dili Headworks and Distribution
c) Capital Works, Rehabilitation and Augmentation of District Towns Water Networks
d) Operation, Maintenance, and Service Improvements of New Connections in Dili
e) Resolution of Illegal Connections, Removals, or Legitimisation in Dili
f) Implement New Connection Services and Billing Processes for District Towns
g) Resolution of Illegal Connections, Removals, or Legitimisation in District Towns
h) Implement Billing and Technical Monitoring Systems Nationwide
i) Extend and Update Master Plan for Expansion of Water Services
j) Preparation of Database for Assets, Maintenance, and Water Systems
k) Development Systems for Water Resource Management
Program 3: Urban Sanitation
15.42 The Urban Sanitation program is concerned with solid waste management, wastewaterand drainage, and safety of habitation within populated areas where there are priority problemsconcerning collection and waste disposal.
Projects
a) Strategic Planning for all Urban Waste and Sanitation Models
b) Capital Upgrading of Solid Waste Management Infrastructure in Dili
c) Capital Works and Upgrading of Wastewater Collection and Treatment in Dili

279
d) Augmentation of Drainage System for Dili
e) Capital Works Implementation for District Towns of Solid Waste, WastewaterCollection and Treatment, and Drainage Infrastructure
f) Update to Efficient Sanitation Operations and Maintenance for Dili
g) Implement or Update Sanitation Operations and Maintenance in District Towns
Program 4: Community Water and Sanitation
15.43 This program is designed to implement new systems for both water and sanitationrequired in areas outside Dili and in the 12 district capitals. Projects reflect combined area ordistrict township activities.
Projects
a) Strategic Planning to Develop Best Practice Models for Rural and Small Towns
b) Capital Investment and Systems Development for WSS in Isolated Communities ofAtauro, Oecussi, and Others as Designated.
c) Develop and Implement Emergency Response Systems for Communities withRespect to Water, Sanitation, Health Issues, and Disaster Relief
d) Revise Guidelines on Operations and Maintenance for Community SystemsCongruent with the Strategic Master Plan
Program 5: Water & Sanitation Support and Public Safety
15.44 This program is concerned with human resource development beyond internal Divisionstaff to include district water authorities, community or private interests, and the public ingeneral as to water utilisation, sanitation systems, and human safety. There is a strong emphasison HRD training that will require donor assistance with technical advisers, communitydevelopment experts, and NGOS capable of supporting a public awareness program on suchissues as water safety, disease prevention related to water and sanitation, and attention to waterand sanitation standards.
Projects
a) Capacity Building for WSS Standards and Safety
b) Community Development for Safe Water and Town Sanitation Utilisation
c) Enforcement processes for Illegal WSS Usage, and to Prevent Vandalism andDestruction of Systems
d) Public Awareness of Safe Water Practices, Safe Habitation, and Good Hygiene
e) Public Media and School Programs for Habitation and Agricultural Practices
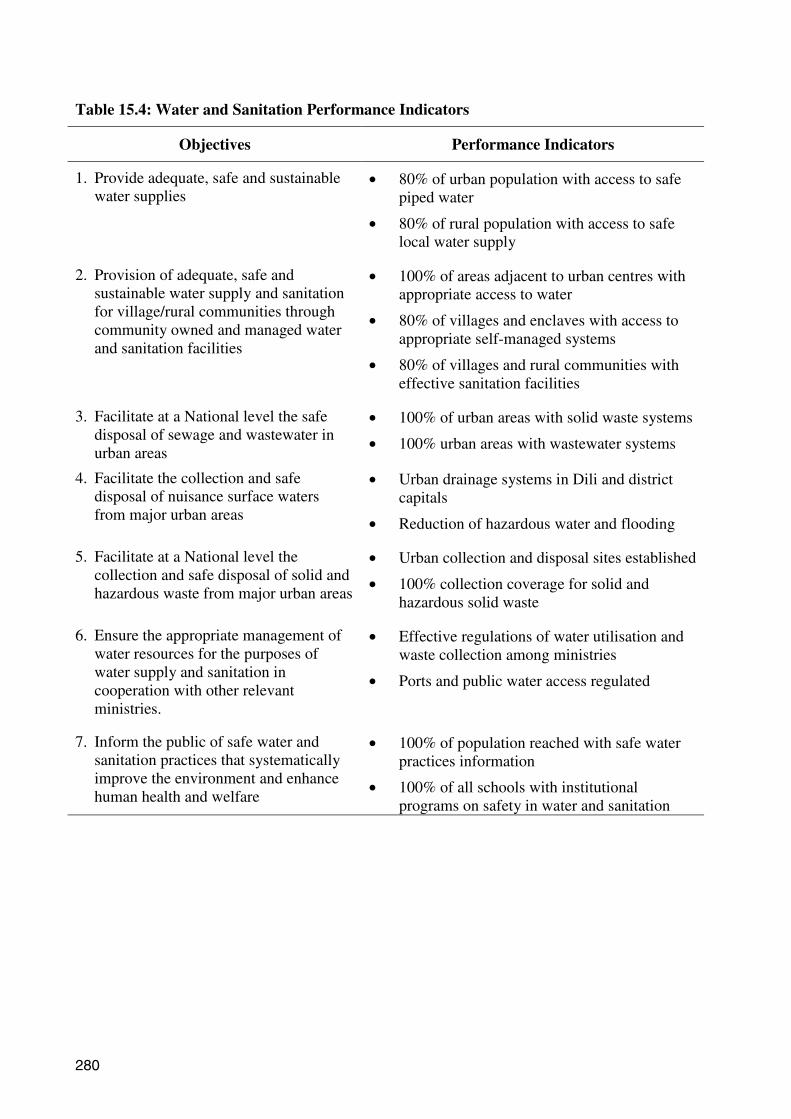
280
Table 15.4: Water and Sanitation Performance Indicators
Objectives Performance Indicators
1. Provide adequate, safe and sustainablewater supplies
• 80% of urban population with access to safepiped water
• 80% of rural population with access to safelocal water supply
2. Provision of adequate, safe andsustainable water supply and sanitationfor village/rural communities throughcommunity owned and managed waterand sanitation facilities
• 100% of areas adjacent to urban centres withappropriate access to water
• 80% of villages and enclaves with access toappropriate self-managed systems
• 80% of villages and rural communities witheffective sanitation facilities
3. Facilitate at a National level the safedisposal of sewage and wastewater inurban areas
• 100% of urban areas with solid waste systems
• 100% urban areas with wastewater systems
4. Facilitate the collection and safedisposal of nuisance surface watersfrom major urban areas
• Urban drainage systems in Dili and districtcapitals
• Reduction of hazardous water and flooding
5. Facilitate at a National level thecollection and safe disposal of solid andhazardous waste from major urban areas
• Urban collection and disposal sites established
• 100% collection coverage for solid andhazardous solid waste
6. Ensure the appropriate management ofwater resources for the purposes ofwater supply and sanitation incooperation with other relevantministries.
• Effective regulations of water utilisation andwaste collection among ministries
• Ports and public water access regulated
7. Inform the public of safe water andsanitation practices that systematicallyimprove the environment and enhancehuman health and welfare
• 100% of population reached with safe waterpractices information
• 100% of all schools with institutionalprograms on safety in water and sanitation

281
RESEARCH AND DEVELOPMENT DIVISION
15.45 The newly created Division of Research and Development under the MWPW willaddress a broad range of studies and pursue regulations on standards and norms for constructionand materials, building codes, fire retardant treatments, and quality controls in support ofdepartmental activities.
Research and Development Division Objectives
15.46 As a new Division, Research and Development will support the efficient operation of allDivisions under the MWPW. It will play an important role for operational planning,procurement, assessments, support for the Director General to manage assets, and working withinter-ministry commissions for both rural and urban development. The Division’s primaryobjectives are as follows.
a) To ensure effective financial planning and budgeting through database managementand control systems.
b) To provide effective support for human resource assessments, capacity-buildingsupport materials, technical research, and project costing and management.
c) To develop effective procurement processes including those for civil worksequipment and services, to support initiatives under each of the technical Divisions.
d) To provide the system processing methods and controls required for management ofpublic works assets.
e) To provide research support for, and liaison with, contractors and donors fordevelopment of technical standards of all public works activities.
Constraints, Problems and Issues
15.47 Legislation will remain a constraint until the integrated activities of the ministries andvarious commissions empower public works administration to regulation utilities and the variousrequirements for infrastructure development. As a new Division, R&D also has no explicitbudget allocation and lacks facilities, laboratory equipment, and technical staff. It currentlyexists in name only and will evolve with the public works and infrastructure plans. Twoadditional points should be emphasised as follows.
a) In order to launch the Division, staff members are needed but not yet authorised, toinclude a Civil Engineer and experienced Laboratory Technician.
b) The Division also will require a research workshop to design and create pilotconstruction projects for the technical Divisions, and a laboratory for material andconstruction testing. These are special-use facilities that may only be possible throughdonor support or outsourcing in the short term.
Research and Development Division Strategies
15.48 The Division will form a commission with representatives from academia, the ArchitectAssociation, Civil Engineering Association, Builders Association, Tradesmen Association, andselected NGO’s to review legislation and various models of technical standards required in

282
public works. These will include, for example, a draft Building Code prepared by the StateGovernment of Victoria for East Timor, feasibility for a variety of international standards foradaptation in East Timor, and roadway and flood district construction standards modelled onother Southeast Asian nations.
15.49 The Division will work closely with meteorology and utilise data from the GIS to supportinfrastructure research and planning, and pursue private consultants and contractors to design,test, and facilitate appropriate project proposals for materials, construction, and maintenanceoperations. The Division will essentially be a planning, research, and oversight function for thenext several years, and in the long term, perform similar roles with greater technical participationas laboratories, staff capacity, and facilities evolve.
15.50 With limited funding and high demand for services, the Division will rely on externalprivate consultants and experts, seeking external funding for assessment and research projectsapart from the recurrent budget or support through the ODG. Specific requests for research anddevelopment intervention from technical Divisions will be supported through the requestingdirectorate.
Research and Development Division Programs and Projects
15.51 As a new Division without specific authorisation for portfolio development, the plannershave put forward two programs with only illustrative projects that should be expandedsignificantly once empowered to pursue activities. All program and project initiatives aresupporting endeavours for the entire public works department.
Program 1: Development of Appropriate Technology
15.52 Concurrent with legislation and regulations on housing and construction standards, urbanand rural planning, town and community development, and the various projects under roads andmaintenance programs, Research & Development programs are essential to identify the best andmost appropriate technologies for East Timor. This is a challenge in terms of the topography andclimatic conditions.
Projects
a) Research on Bamboo Materials for Housing and Construction
b) Research on Concrete, Blocks, and Natural Materials
c) Assessments on Composites
d) Research on Alternative Building Materials and Designs
e) Technical Assistance for Adaptation of International Recognised Building andConstruction Methods, and for Known Road and Bridge Designs
Program 2: Material and Construction Testing
15.53 This program has essentially one focus, which is to support technology research and therequests from any other Division for controlled laboratory testing. This would extend to naturaland manmade materials, and to prototype fabrications. Testing would represent quality control,stress factors, endurance characteristics, water retention factors, fire retardants, and many otherphysical considerations for public works activities. As the new Division begins, operations areexpected to be basic and restricted to priority public works efforts. These activities will also be

283
constrained until the scientific and technology knowledge is available to conduct moresophisticated procedures. Initial projects are proposed below:
Projects
a) Construction material stress and utilisation testing
b) Alternative materials testing for strength, durability, and fire safety
c) Environmental Assessments for Potential Toxicity and Threats to Public Health
Table 15.5: Research and Development Performance Indicators
Objectives Performance Indicators
1. Ensure effective financial planningand budgeting with databasemanagement
• Administrative systems and databasestested and effective
2. Support for human resourceassessments, capacity-buildingsupport materials, research fortechnical criteria, and projectcosting and management models
• Assessment models in use and effective
• 100% on time provision of solicitedresearch
• Project costing model completed
3. Develop effective procurementprocesses for civil worksequipment and services, to supportinitiatives under each of thetechnical Divisions
• Database procurement system effective
• 100% of on-time procurement requests
• Reduction in backlog for logistics
• 100% sourcing for technical Divisions
4. Provide the systems processingmethods and controls required formanagement of public works assets
• Building codes and standardsimplemented
• 100% compliance of codes andstandards
• Construction standards implemented
• 100% compliance for public works
5. Research support and liaison withcontractors and donors fordevelopment of technical standardsof all public works activities
• Material testing laboratory established
• Alternative technologies modelsresearched
• Donor liaison office established
• Reliable contractor process established

284
DIVISION OF ENERGY (MINISTRY OF ECONOMIC AFFAIRS & PLANNING)
15.54 The Division of Energy is maintained as a separate functional directorate under theMEAD, and it essentially consists of the electric power generating authority for East Timor. Thepower authority was created under the UN and transition government, and the Division ofEnergy represents the administrative linkage for official development of public power capacity.The power authority itself, EDTL has been established as a state-owned enterprise, required tobe financially autonomous, recovering its costs of operation and investment from electricitycharges. Currently EDTL is jointly operated as a semi-autonomous authority with UN supportand joint management.
15.55 EDTL is receiving a high level of subsidy and having difficulty in progressing towards itstarget of financial self-sufficiency. Authorities have been unable to establish an effective ratestructure, many users are not metered, and the metering system is not reliable. Those problemsare complicated further by difficulty in collecting tariffs, illegal bypassing or system tampering,and the reluctance to cut off power to users or block power utilisation. Demand for electricityexceeds supply and will continue to rise more rapidly than new supply can be provided undercurrent operating capabilities. Also, the installation of effective metering systems and acomparable system of effective maintenance and expansion must be addressed. Finally, essentialimprovements are needed to manage the power sector, enforce an effective collection regime,provide accountability for procurement of source fuels and supplies.
DIVISION OF ENERGY OBJECTIVES
15.56 The Division of Energy has expanded the vision statement to include a mandate to createand maintain reliable and affordable power supplies. Ultimately, the power authority will meetthe needs for electricity throughout East Timor, thus supporting economic productivity andquality of life for all citizens, and pursue indigenous resources to displace imported fuels. This isa long-term objective. In the near term, the Division will focus on development in Dili and keypopulation or industry development areas at the lowest possible cost to consumers. Objectivesinclude the following
a) To ensure an enabling legal and regulatory environment for an autonomous powerauthority accountable for resource management and national power provisions.
b) To sharply reduce subsidies to the power sector to a sustainable level throughintroduction of equitable but universal user charges for electricity.
c) To establish a transparent and auditable system of procurement and supply utilisationwith effective cost-recovery planning and development oversight.
d) To develop a self-sufficient management capacity for the power sector.
e) To complete installation of effective metering systems and provide for security ofthose systems in Dili, and as power systems expand, to district users.
f) To develop national self-reliance in power generation by exploiting indigenousenergy resources such as natural gas, solar, and hydro as economically feasible.
g) To ensure coordination among government, donor, and private sector interests forexpenditures on power development over long-term planning horizons.

285
DIVISION OF ENERGY CONSTRAINTS, PROBLEMS AND ISSUES
15.57 Many of the current constraints facing the sector are reflected in the objectives theDivision hopes to achieve over the planning period, but most notable are funding requirementsfor all capital improvements and the high cost of recurrent maintenance and human resources.Without legal empowerment, no agency of government can pursue meaningful initiatives.Particular points to consider are as follows.
a) Operational limitations. High and unsustainable subsidies to the sector will continueto retard capital development and threaten future programs of maintenance andcapital expansion that rely on predictable levels of income generated equitably fromend-user tariffs. These problems will continue to hamper service capabilities and theprovision of reliable electricity services.
b) Management. The Division is capable of its existing oversight responsibilities, butdoes not have the technical depth for strategic power planning or for pursuingalternative forms of power generation. Capacity development is essential, and withinthe near term, indigenous staff must be able to supplant the technical expertise ofexisting donor and UN supported positions.
c) Power generation technology. There is no medium- or long-term power systemdevelopment planning framework that captures the technical or capital assetrequirements for a viable electric power generating capability. Further, there is anassumption of public sector (state-owned) power resources without consideration ofbenefits that could be achieved by private sector investment or BOT developmentunder long-term contracts.
DIVISION OF ENERGY STRATEGIES
15.58 The Division of Energy will pursue a strategy of providing power capacity throughquality systems of physical distribution and reliable delivery services. This will require a stagedprocess of development, initiated through empowering legislation that enables an autonomousEDTL to fully function, and consequently, to be fully accountable. A comprehensive legislativeframework is needed that will be pursued under a high-level steering committee, assuring publicand private participation, to include appropriate donors and transitional interests, and to protectthe national interests of homeland security which vitally depends on reliable power capabilities.
15.59 Recognising that in the near term neither the Division nor the government can meet thedemand of power development, the Division will prepare feasible outlines for medium and longterm plans for current and future government, and for existing and potential donors who supportEast Timor’s efforts. In every instance, consideration will be given to the potential to involveprivate sector interests in power sector development, investments, and new initiatives for electricgeneration and distribution.
15.60 During the planning period, and perhaps well into the future, the Division will pursueinitiatives that explore alternative forms of electric power generation, such as using gasresources, hydropower, solar energy, or perhaps another form or combination of fuels. Progressrests heavily on the ability of the power authority to reach the poorer regions and more distantdistricts to support agricultural and industrial development.
15.61 The Division will seek the means to legally enforce revenue collection from consumers,and the systems to support a fair and impartial process. In addition, the Division will study thepotential for models of differentiated rates that would assist the most needy households,
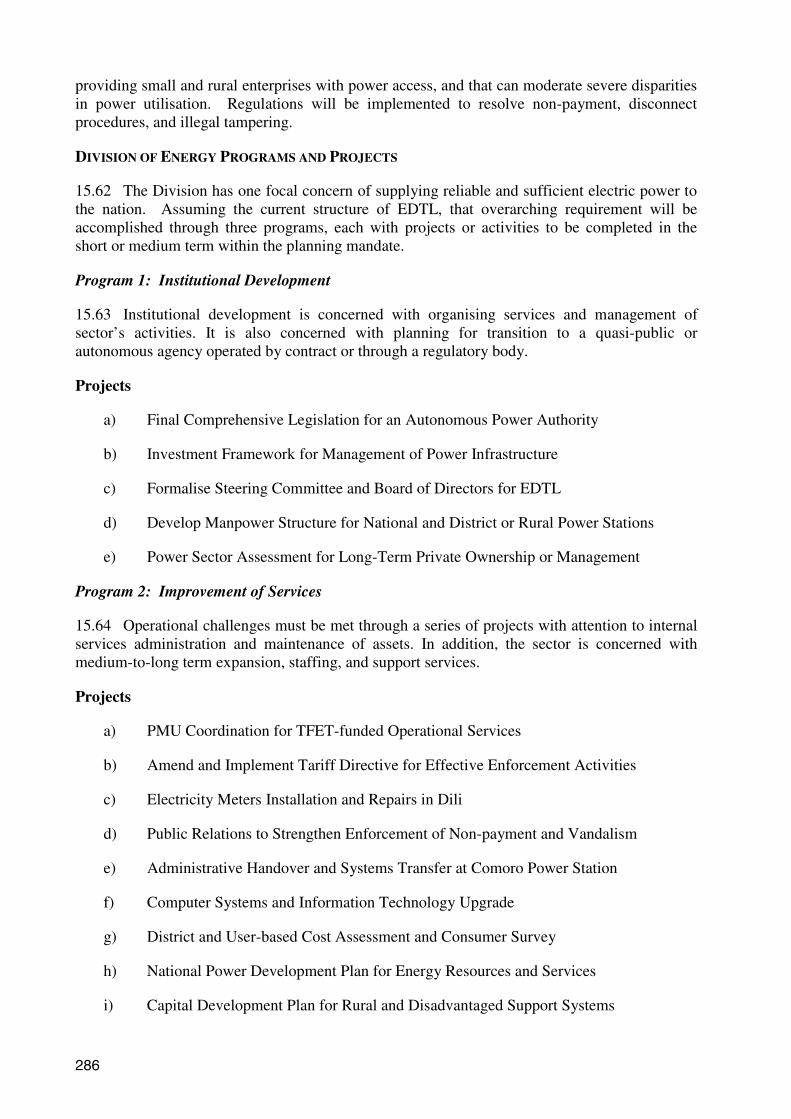
286
providing small and rural enterprises with power access, and that can moderate severe disparitiesin power utilisation. Regulations will be implemented to resolve non-payment, disconnectprocedures, and illegal tampering.
DIVISION OF ENERGY PROGRAMS AND PROJECTS
15.62 The Division has one focal concern of supplying reliable and sufficient electric power tothe nation. Assuming the current structure of EDTL, that overarching requirement will beaccomplished through three programs, each with projects or activities to be completed in theshort or medium term within the planning mandate.
Program 1: Institutional Development
15.63 Institutional development is concerned with organising services and management ofsector’s activities. It is also concerned with planning for transition to a quasi-public orautonomous agency operated by contract or through a regulatory body.
Projects
a) Final Comprehensive Legislation for an Autonomous Power Authority
b) Investment Framework for Management of Power Infrastructure
c) Formalise Steering Committee and Board of Directors for EDTL
d) Develop Manpower Structure for National and District or Rural Power Stations
e) Power Sector Assessment for Long-Term Private Ownership or Management
Program 2: Improvement of Services
15.64 Operational challenges must be met through a series of projects with attention to internalservices administration and maintenance of assets. In addition, the sector is concerned withmedium-to-long term expansion, staffing, and support services.
Projects
a) PMU Coordination for TFET-funded Operational Services
b) Amend and Implement Tariff Directive for Effective Enforcement Activities
c) Electricity Meters Installation and Repairs in Dili
d) Public Relations to Strengthen Enforcement of Non-payment and Vandalism
e) Administrative Handover and Systems Transfer at Comoro Power Station
f) Computer Systems and Information Technology Upgrade
g) District and User-based Cost Assessment and Consumer Survey
h) National Power Development Plan for Energy Resources and Services
i) Capital Development Plan for Rural and Disadvantaged Support Systems

287
j) Investment or Donor-supported Plans and Proposals for Rural Development, SocialPriority Programs, and Intervention for Poverty Reduction Programs
Program 3: Capacity Building
15.65 Capacity building will occurs on two levels. First, projects will be directed towardenhancing existing service capabilities and training local staff. Second, the EDTL will pursuerecruitment and appropriate donor-supported technical assistance.
Projects
a) Establish a Long-term Manpower Plan for District and Rural Development
b) Revise Existing Salary and Wage Structures within the Existing System
c) Recruit Locally and Train for Positions, including District Expansion
d) International Mentoring for Management & Technical Staff Development
e) Technical Team Job Development and Power Management Specialists
Table 15.6 Division of Energy Performance Indicators
Objectives Performance Indicators
1. Sharply reduce subsidies to thepower sector to a sustainablelevel
• Reduced percentage of subsidies to budget• Increased collection rates and enforcement• Percent of budget self-generated
2. Establish a transparent andauditable system of procurementand supply utilisation with cost-recovery planning
• 100% audit and procurement tracking• Increased rate of cost-recovery from users
3. Develop a self-sufficientmanagement capacity for thepower sector with demonstratedpower capacity and services
• 100% staffed with qualified technicians• Percent of distribution system as planned• Hours per day of public power supply in each
power centre served
4. Complete installation of meteringsystems and provide for securityof those systems in Dili, and aspower systems expand, to districtusers
• 100% of business, public buildings, and registeredhousehold with meters
• 100% of users officially subscribed in Dili anddistrict capitals
5. Develop national self-reliance inpower generation by exploitingindigenous energy resources suchas natural gas, solar, and hydro
• Percent economically-viable indigenous energysources in total generation mix
• Assessed appropriate alternative power generationin all districts
6. Ensure coordination amonggovernment, donor, and privatesector interests for expenditureson power sector development
• Percent invested by private sector and percent bypublic sector on capital assets
• 100% target achieved for capital assetdevelopment
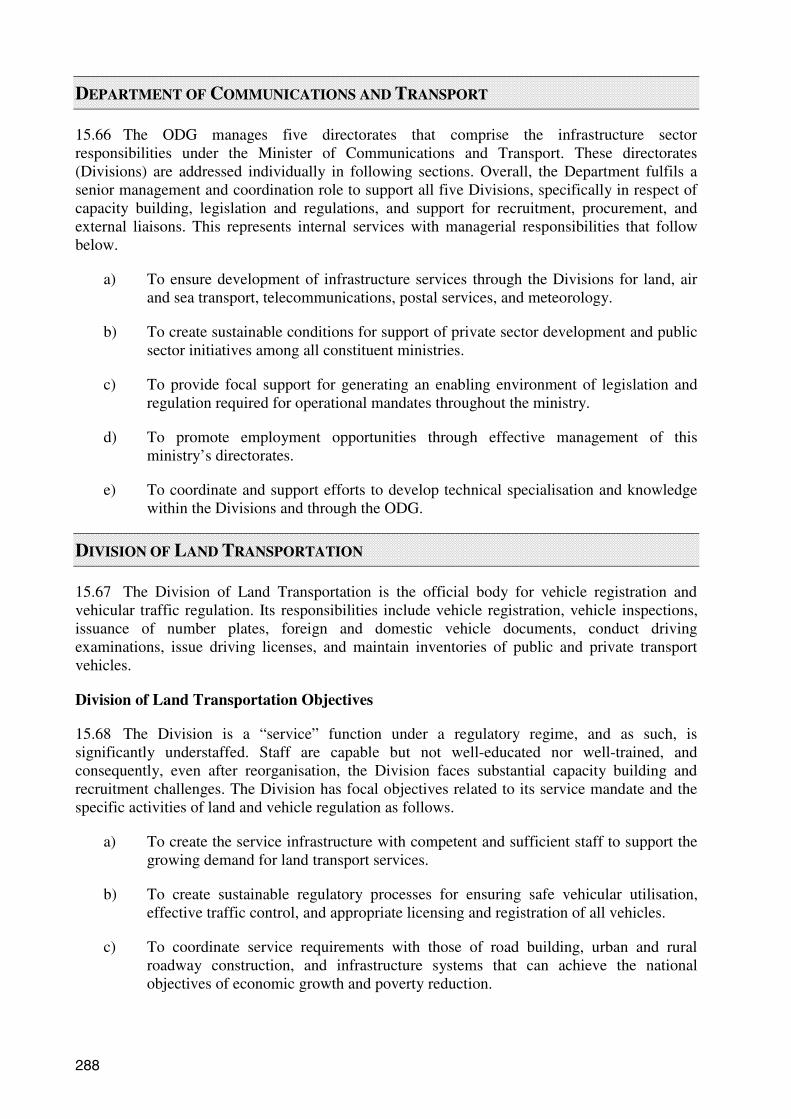
288
DEPARTMENT OF COMMUNICATIONS AND TRANSPORT
15.66 The ODG manages five directorates that comprise the infrastructure sectorresponsibilities under the Minister of Communications and Transport. These directorates(Divisions) are addressed individually in following sections. Overall, the Department fulfils asenior management and coordination role to support all five Divisions, specifically in respect ofcapacity building, legislation and regulations, and support for recruitment, procurement, andexternal liaisons. This represents internal services with managerial responsibilities that followbelow.
a) To ensure development of infrastructure services through the Divisions for land, airand sea transport, telecommunications, postal services, and meteorology.
b) To create sustainable conditions for support of private sector development and publicsector initiatives among all constituent ministries.
c) To provide focal support for generating an enabling environment of legislation andregulation required for operational mandates throughout the ministry.
d) To promote employment opportunities through effective management of thisministry’s directorates.
e) To coordinate and support efforts to develop technical specialisation and knowledgewithin the Divisions and through the ODG.
DIVISION OF LAND TRANSPORTATION
15.67 The Division of Land Transportation is the official body for vehicle registration andvehicular traffic regulation. Its responsibilities include vehicle registration, vehicle inspections,issuance of number plates, foreign and domestic vehicle documents, conduct drivingexaminations, issue driving licenses, and maintain inventories of public and private transportvehicles.
Division of Land Transportation Objectives
15.68 The Division is a “service” function under a regulatory regime, and as such, issignificantly understaffed. Staff are capable but not well-educated nor well-trained, andconsequently, even after reorganisation, the Division faces substantial capacity building andrecruitment challenges. The Division has focal objectives related to its service mandate and thespecific activities of land and vehicle regulation as follows.
a) To create the service infrastructure with competent and sufficient staff to support thegrowing demand for land transport services.
b) To create sustainable regulatory processes for ensuring safe vehicular utilisation,effective traffic control, and appropriate licensing and registration of all vehicles.
c) To coordinate service requirements with those of road building, urban and ruralroadway construction, and infrastructure systems that can achieve the nationalobjectives of economic growth and poverty reduction.

289
d) To resolve the problem of saturation of major road arteries through improvedaccessibility for outlying and remote population areas.
e) To reduce import dependence on oil by using alternative public transport andimproving energy efficiencies of vehicles permitted to register in East Timor.
f) To provide employment opportunities within the Division through effective jobdevelopment and capacity building programs.
g) To pursue optimal models of regulation and technical knowledge from establishedand comparable land transportation systems, incorporating these into East Timor.
h) To implement a national public safety program for driving and maintaining all roadvehicles through driver awareness campaigns and public information services.
i) To formulate regulations with traffic and vehicular rules governing safe and legalvehicle operation, and enforcement capabilities with appropriate penalties.
j) To establish an effective policy for public transportation fees and charges, and aretention fund for these revenues for enhanced public transportation.
Constraints, Problems and Issues
15.69 The Division faces several constraints that cannot be easily resolved, and severalchallenging problems to address. These are not within the unilateral control of the Division orthe ministry, but require joint efforts by several government agencies, with technical support andassistance. The following points should be considered.
a) Physical infrastructure. Physical disparities of road development exist, and there areremote pockets of population without vehicles, trucks, or farm equipment. With theDivision centralised in Dili, there is little capability of reaching isolated districts (e.g.,Viqueque and Oecussi). The physical infrastructure of roads and bridges will notreach into remote areas soon.
b) Traffic systems. Physical infrastructure will restrain service such as effective streetmarkings, intersection traffic control systems, signage, and resolution of commercialtraffic in congested areas. This is particularly acute in Dili where port traffic issituated in the centre of the capital, and there is no organised public bus transportationterminal or organisation of routes.
c) Control and regulation issues. Not all vehicles are registered and there is no vehicleinspection or safety control facility. These are minor requirements, yet crucial tomeeting objectives such as controlling emission standards, improving safe urban andrural road utilisation, and regulating safe driving practices. These constraints alsoprevent the Division from controlling contraband vehicles, ensuring public safety, andproviding reliable public transportation.
d) Funding and revenue diseconomies. Individual modes of transport do not alwayspay for their costs, and cost-effective modes of public transport are available only inselective high-density areas. This leads to dysfunction of the internal market anddistorts competition within the transport system.
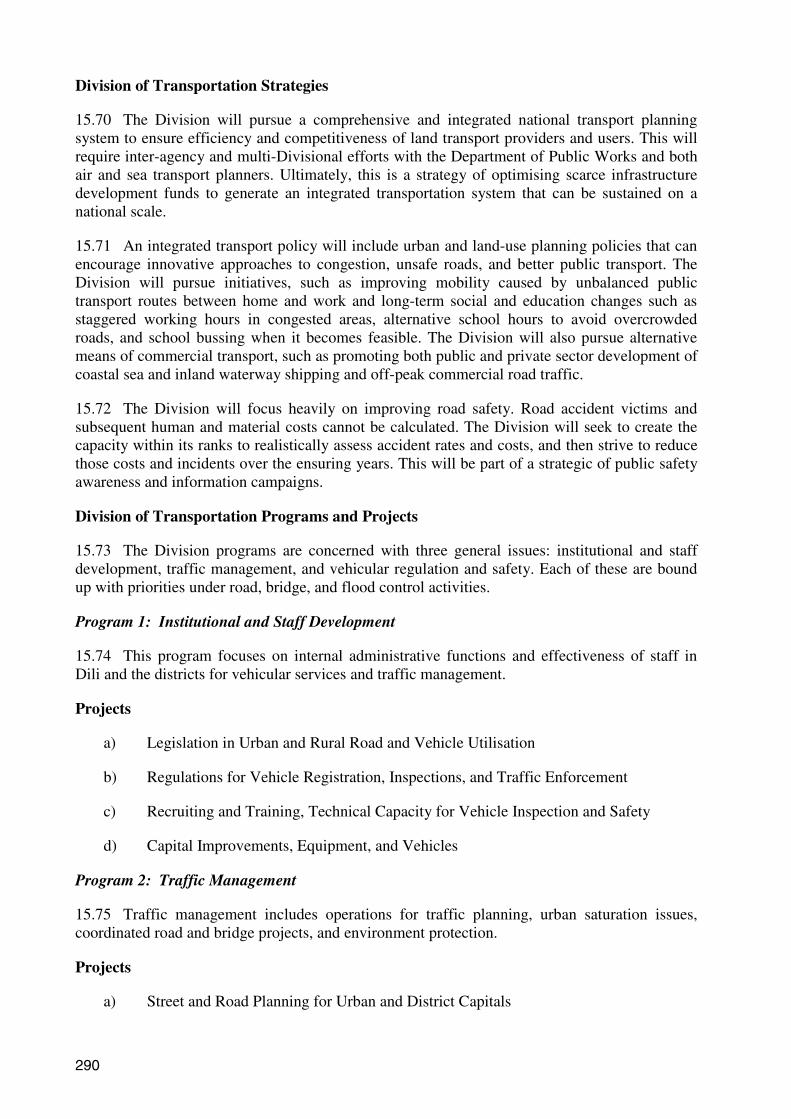
290
Division of Transportation Strategies
15.70 The Division will pursue a comprehensive and integrated national transport planningsystem to ensure efficiency and competitiveness of land transport providers and users. This willrequire inter-agency and multi-Divisional efforts with the Department of Public Works and bothair and sea transport planners. Ultimately, this is a strategy of optimising scarce infrastructuredevelopment funds to generate an integrated transportation system that can be sustained on anational scale.
15.71 An integrated transport policy will include urban and land-use planning policies that canencourage innovative approaches to congestion, unsafe roads, and better public transport. TheDivision will pursue initiatives, such as improving mobility caused by unbalanced publictransport routes between home and work and long-term social and education changes such asstaggered working hours in congested areas, alternative school hours to avoid overcrowdedroads, and school bussing when it becomes feasible. The Division will also pursue alternativemeans of commercial transport, such as promoting both public and private sector development ofcoastal sea and inland waterway shipping and off-peak commercial road traffic.
15.72 The Division will focus heavily on improving road safety. Road accident victims andsubsequent human and material costs cannot be calculated. The Division will seek to create thecapacity within its ranks to realistically assess accident rates and costs, and then strive to reducethose costs and incidents over the ensuring years. This will be part of a strategic of public safetyawareness and information campaigns.
Division of Transportation Programs and Projects
15.73 The Division programs are concerned with three general issues: institutional and staffdevelopment, traffic management, and vehicular regulation and safety. Each of these are boundup with priorities under road, bridge, and flood control activities.
Program 1: Institutional and Staff Development
15.74 This program focuses on internal administrative functions and effectiveness of staff inDili and the districts for vehicular services and traffic management.
Projects
a) Legislation in Urban and Rural Road and Vehicle Utilisation
b) Regulations for Vehicle Registration, Inspections, and Traffic Enforcement
c) Recruiting and Training, Technical Capacity for Vehicle Inspection and Safety
d) Capital Improvements, Equipment, and Vehicles
Program 2: Traffic Management
15.75 Traffic management includes operations for traffic planning, urban saturation issues,coordinated road and bridge projects, and environment protection.
Projects
a) Street and Road Planning for Urban and District Capitals

291
b) Urban Signage and Road Network Traffic Mapping
c) Procedures for Emergency or Disaster Traffic Routing
d) Saturation Assessments and Coordination for Port Services
e) Environmental Standards for Vehicle Fuel, with Regulations on Emissions
Program 3: Vehicular Regulation and Safety
15.76 This program represents on-going activities more than projects that will ensure publicsafety, reduce accidents, and generally enhance all vehicle operations.
Projects
a) Accident and Traffic Incident Studies
b) Accident Prevention and Auto Safety Inspection Initiatives
c) Public Awareness Campaign on Safe Driving
d) School Programs on Vehicle and Pedestrian Traffic Safety
Table 15.7: Division of Land Transport Performance Indicators
Objectives Performance Indicators
1. Create the service infrastructurewith competent and sufficientstaff to support the growingdemand for land transportservices
• 100% of basic law completed by 2003
• 100% staffing levels achieved and sustained
• Regulations and enforcement implemented
2. Create sustainable regulatoryprocesses for ensuring safevehicular utilisation, trafficcontrol, and licensing andregistration of all vehicles
• 60% of sector policies defined in 2002
• 100% of policies implemented by 2003
• Traffic control supervision 100% by 2004
• National licensing 100% by 2003
• Traffic plans completed with Roads Division
3. Coordinate service requirementswith those of road building, urbanand rural roadway construction,and infrastructure systems
• Signage and traffic control in Dili completed
• Roadway hazard rural signage completed
4. Resolve the problem of saturationof major road arteries throughimproved accessibility foroutlying and remote populationareas
• Integrated road/port access plan by 2003
• Vehicle load/road-use requirements by 2003
• Percent of nation with access to safe roads
• Reduced travel time to clinics and schools

292
5. Reduce import dependence on oilby using alternative publictransport and improving vehicleenergy efficiencies
• Improved bus and public conveyances
• Reduced emissions with new standards for vehicleinspection and licensing
6. Provide employmentopportunities through effectivejob development and capacitybuilding programs
• Increased local district & rural staff
• 100% training coverage for all staff in relevanttechnical areas
7. Establish optimal models ofregulation and technicalknowledge from established andcomparable land transportationsystems
• Plans and models from regional nations acquiredand compatibility approved
• Compliance with international standards for roadand traffic safety
8. Implement a national publicsafety program for driving andmaintaining all transport vehiclesby creating driver awarenesscampaigns
• 100% of population with access to public safetyregulations
• 100% of schools with road safety and driving safetyprograms for relevant youth
• Public media safety campaign instituted
9. Formulate regulations for trafficand vehicular rules governingsafe legal vehicle operation, andenforcement
• Assessment process for accidents and trafficincidents implemented
• Reduced accident and traffic incident rates
10. Establish an effective policy forpublic transportation fees andcharges, and a retention fund forthese revenues
• Affordable public transport fees established
• Rural system for public transport and fees
• Fund established for retention and road use fees,public transport revenues
DIVISION OF SEA TRANSPORTATION
15.77 The Division of Sea Transportation is the administrative authority for port, dockside, andwaterway development. With UN support, the war-related damage has been the highest priority,yet the port authority is entering this first national planning period with only rudimentaryfacilities, a weak legal mandate for regulation of port and shipping activities, and a slim profileof experienced technical staff. Port progress has occurred primarily through the EmergencyInfrastructure Rehabilitation Project implemented under TFET funding, and bilateral fundingfrom Japan.
15.78 Significant rehabilitation work is ongoing to repair existing wharf facilities, extend thecontainer terminal, pave loading and storage areas, provide security walls, improve expeditingsystems, and train select staff members. However, port and sea shipping regulations have notbeen prepared, tariffs remain in question, and there are concerns regarding coastal environmentaland port protection, safety, access and traffic patterns of port container services, andadministration of the Division.

293
Division of Sea Transportation Objectives
15.79 The Division has enthusiastic objectives. Some reflect projects and existing activities thatare donor-funded or under bilateral assistance. Others focus on institutional development andcapacity building in maritime law and procedure. These objectives are as follows.
a) To develop a code of commercial maritime law.
b) To conclude ratification procedures on behalf of East Timor for principal maritimeconventions on maritime safety and maritime transport.
c) To achieve ratification on behalf of East Timor of the United Nations Convention onthe Law of the Sea.
d) To establish a registry of shipping for East Timor.
e) To establish a modern system of port taxes and tariffs with effective enforcementcapabilities that preclude contraband and corruption.
f) To pursue enactment of the law on public maritime domain in conjunction with theMEAD, and with the MoJ.
g) To establish a public passenger sea transport service between Dili and Atauro, andbetween Dili and Oecussi.
h) To create a plan and institute a policy for regulation of national coastal traffic.
i) To achieve a national capacity for essential survey & inspection procedures, andthereon, for certifications regarding ship conditions, materials safety, and hazards.
j) To train and develop East Timorese in special maritime studies abroad.
k) To improve port container and bulk handling while reducing congestion at Dili.
l) To provide the facilities and services required to situate the Naval Defence Force atthe Port of Hera in concert with the government’s priorities.
m) To complete current projects and rehabilitation activities on schedule with Japanesebilateral and multilateral assistance.
n) To assess and subsequently implement an effective system of fire prevention and bothport and maritime fire and damage control.
Constraints, Problems and Issues
15.80 The Division of Sea Transportation faces similar constraints to all other Divisionsconcerning inadequate funding and insufficient human resources. There is an urgent need forstaff recruitment and training to provide the Division with highly skilled technical and maritimespecialists, which are now temporary provided by UNTAET. In addition, the port is entirelyreliant on private and foreign-owned companies for cargo portage and handling. What accessthere is to domestic equipment is largely supported through UNTAET assistance. In effect, EastTimor has little cargo support capability. This is further complicated by limited telephone andinformation systems.

294
15.81 The Port of Dili has basic ship-to-shore communications, but with limited range andinadequate security. This reflects a general lack of service infrastructure, which includes the lackof effective port security, fire-fighting capabilities, handing of hazardous materials, and maritimeand port safety procedures.
Division of Sea Transportation Strategies
15.82 The Division will initially concentrate on institutional development creating thelegislative framework for an effective maritime authority. Development of principal portlegislation includes creation of a public institute “Administration of the Ports of East Timor, IP”with respective statutes. This must reflect an appropriate administrative structure for the PortsAuthority of East Timor and Maritime Administration.
15.83 The Division will manage planning, project design, and tendering for competitive privatesector development of port facilities, coordinate port services, and implement development plansfor expanded port operations, including viable fire fighting and marine rescue operations at Dili,and expand services to secondary ports. Establishing a Shipping Registry will be critical to portcontrol.
15.84 Strategic development will occur in phases, first with completion of rehabilitationprojects and bilateral assistance projects. During this early development phase basic port servicesat the ports of Suai and Oecussi will be initiated, followed by those at Caravel and Com.Development of regional ports will be linked to the maritime coastal transport system to beimplemented over a period of four years. Recruitment and capacity building for human resourcemaritime skills will be essential for providing new public services, designing developmentprojects, and administering shipping and commercial sea transport systems, and to replaceUNTAET staff.
Division of Sea Transportation Programs and Projects
15.85 The Division is concerned with port development and sea transport as projects rather thanprograms. Projects are described under program headings for clarity.
Program 1: Institutional Development
15.86 East Timor must develop the legal framework for a port authority with the regulatorycapability of shipping, registry, and inspections. There also is a requirement for effectiveadministration and ship-to-shore communications with qualified staff.
Projects
a) Develop a Code of Commercial Maritime Law
b) Ratification of Maritime Conventions on Safety and Transport
c) Ratification of United Nations Convention on the Law of the Sea.
d) Establishment of a Registry of Shipping
e) Enactment of Law on Public Maritime Domain
f) Policy for Regulation of Coastal Traffic
g) Survey & Inspection Procedures, Certifications on Material Safety and Hazards
295
Program 2: Port Rehabilitation and Development
15.87 Existing projects focus on rehabilitation under recurrent and bilateral funding. These andproposed projects are concerned with rebuilding, security, and facilities.
Projects
a) Dili Port Operations
b) Container Handling and Storage Enhancement
c) Dili Port Emergency Infrastructure Rehabilitation Project
d) Japanese Assistance Project for Facilities and Port Improvements Dili
e) Oecussi Passenger Ferry Operation
f) Rehabilitation of Secondary Ports
Program 3: Port Services
15.88 Many new services are needed for docking, loading, and expediting, but most are inplanning stages. Several projects for required services are proposed here.
Projects
a) Port Taxes and Tariffs Project
b) Security Enforcement to Preclude Contraband and Corruption
c) Port Planning for Strategic Passenger and Cargo Services
d) Distribution and Land Route Congestion at the Port of Dili
e) Public passenger sea transport, Dili and Atauro, and Dili and Oecussi
f) Naval Defence Force at the Port of Hera
Program 4: Capacity Building
14.88 Staff management and technical capabilities are necessary to attain the service levelsrequired. Several projects are in progress and several are proposed.
Projects
a) Technical Port Management and Maritime Administrative Studies Abroad
b) Staff Training and Development in Safety and Fire Fighting
c) Assistance Programs for Training and Standards on Hazardous Materials, ShipboardSafety, Inspections, and Disaster Procedures

296
Table 15.8: Division of Sea Transport Performance Indicators
Objectives Performance Indicators
1. Develop commercial maritimelaw
• Code completed by 2003
2. Ratification procedures forprincipal maritime conventions onmaritime safety and maritimetransport
• Ratification achieved by 2003
• Conventions on safety implemented by2003
3. Ratification of the United NationsConvention on the Law of theSea.
• Ratification achieved by end of 2002
• Conventions promulgated by end of2002
4. Establish a registry of shipping • Registry completed by end of 2002
5. Establish a modern system of porttaxes and tariffs with effectiveenforcement capabilities thatpreclude contraband andcorruption
• System approved and implemented byend of 2002
• Enforcement staff and control systems inplace by 2003
6. Enactment of the law on publicmaritime domain in conjunctionwith the MOE&P and MOJ
• Joint regulations by end of 2002
• Enforcement procedures enacted andPublished by 2003
7. Establish passenger sea transportservice between Dili and Atauro,and between Dili and Oecussi
• Dili to Atauro service established by2003
• Dili to Oecussi service established by2003
8. Plan and institute a policy forregulation of national coastaltraffic
• Plan drafted by end of 2002
• Plan for total coastal traffic instituted in2003
9. Achieve a national capacity forsurvey & inspection procedures,and certifications for shipconditions, materials safety, andhazards
• Ship survey & inspection regulationspassed
• Inspection staff recruited or contracted2003
• Materials safety inspection system 2003
• Hazardous handling systems in place2003
10. Achieve access to proper trainingand development for Timorese inspecial maritime studies abroad
• 100% of human resources required fortechnical port operations educated andcertified by 2004
11. Improve port container and bulkhandling while reducing
• 100% of regional ports operational by2005

297
congestion problems at the Port ofDili
• Dili port congestion resolved by 2003
• Container port handling improved by50%
12. Situate Naval Defence Force atHera
• Comply with defence requirements by2003
13. Complete current projects andrehabilitation activities onschedule with Japanese bilateraland multilateral assistance
• Projects completed on time and in budget
• 90% rehabilitation by 2004, 100% by2005
• Land infrastructure at Dili completed2003
• Tibar, Hera, Sufi repairs completed 2003
• Ports of Com and Oecussi remodelled2004
14. Assess and implement aneffective system of fire preventionand both port and maritime fireand damage control
• Assessment completed by end of 2002
• Port of Dili fire and emergency systemsto international standards by 2003
• Secondary fire and emergency systems2004
DIVISION OF CIVIL AVIATION
15.90 Nine airfields in East Timor were constructed during the Portuguese era, but with nohistory of a national air carrier or infrastructure for air hub cargo or maintenance capabilities.Reconstruction has focused on the Comoro Airport and development of safety operations forpassengers and cargo. Baucau and Suai airports are also under rehabilitation. The Division’smain development objectives in the near-term are to complete rehabilitation and to implementstaff training programs.
15.91 Pacific Architecture Engineering operates two airports outside Dili under the UN inBaucau and Suai. Airports in Oecussi, Los Palos, Viqueque and Maliana are operated byUNTAET. An Airport Master Plan is being developed for each airport, and together with thetransition, this will provide a compliance structure for an international standard accountingsystem within an East Timor Civil Aviation Authority.
15.92 Legislation is in draft form on basic Aviation Law and expected to be finalised andenacted by the end of the year 2002. This will be the foundation for the organisation andstructure of ETCA, which will then be able to maintain an official relationship with InternationalCivil Aviation Organisation based on compliance with the Civil Aviation InternationalConvention (Chicago Convention). However, the Division will be dependent on donor assistancewith contracted services until 2004.
15.93 The transition to a competent and fully operational East Timor authority will requirethree general phases. The first is the current emphasis on rehabilitation and training. The secondis concerned with expansion of facilities and transition toward a certified civil aviation authority.

298
And the third is the integrated development of air transport and cargo capabilities to sustain long-term growth.
Division of Civil Aviation Objectives
15.94 The Division’s objectives extend the vision of the Civil Aviation authority, which is toattain excellence in aeronautical services, establish membership in the ICAO, and providequality airports and air services. The Division’s strategic objectives are:
a) To attain a high standard of safe and efficient passenger service.
b) To establish effective air cargo systems for international and national transport.
c) To generate a reliable staff with qualifications required to ensure safe and effectiveairport operations comparable to the best airport facilities in the region.
d) To establish the reliable and secure systems needed for an efficient mail and postalexpediting hub and internal national postal support services.
e) To establish an appropriate financial system that allows the civil aviationadministration to recover its full costs of operation.
f) To promote and maintain a favourable environment for development with confidenceamong the Division staff and throughout the integrated civil aviation structure.
g) To provide the ground facilities required to support military air and land priorities.
h) To support national development priorities and poverty reduction initiatives throughindigenous staff recruitment, training, employment, and district services.
Constraints, Problems and Issues
15.95 The most serious constraint will continue to be the imbalance of supply and demand ofairport operations. In order to achieve the level of quality and safety envisioned for airports, andsubsequently to achieve the revenue levels required to sustain airport facilities and services, a“critical mass” is required for qualified staff and the operational infrastructure. Specifically,quality and safe service levels cannot be achieved incrementally but must be attained throughsubstantial capital development.
15.96 There is a substantial market for air cargo if it can be cost-effective and efficient. Thereare no credible facilities for air cargo with scale economies to justify a profitable air cargosystem at present, and the capital development of such a facility is well beyond funding capacityover the term of this planning period.
15.97 East Timor must become a cost-effective destination for tourist travel and internationalbusiness development. Consequently, the main airport and key regional airports must achieve thequality and service efficiencies to support tourism and trade activities. At the same time, airportdevelopment will be significantly dependent on tourism and trade development. Neither canprogress very quickly in isolation.
Division of Civil Aviation Strategies
15.98 The Division will pursue a three-stage strategy that begins with implementation ofexisting rehabilitation and training projects to achieve the basic operational structure required for
299
a civil aviation system. This will include passage of enabling legislation and drafting theregulations needed for quality, safety, and financial operations. A system of airport fees andappropriate service taxes will be introduced during this stage as the revenue base for operationalcost recovery. The Division will seek bilateral agreements in the area of air transport withcountries in the sub-region with the objective of establishing reciprocal legal arrangements fornational operators.
15.99 The second phrase will be strategic development of district airports, generating thecritical mass for quality and safety needed for passenger and cargo services that can supportinternal trade, transport, and postal services. During this stage, it is anticipated that the CivilAviation authority will attain membership in the ICAO and ratify necessary agreements forregional cooperation in air services.
15.100 The third stage will be an integrated strategy of commercial air services developmentwith cooperative endeavours that include tourism, trade, business, cargo, and ground supportdevelopment. Many of these linkages will be pursued at the outset of this planning period but canonly be realistically initiated when the airport facilities and qualified staff operations haveattained the “critical mass” required to participate.
Division of Civil Aviation Programs and Projects
15.101 Programs are focused on priority issues of Comoro Airport operations, rehabilitation, andsupport facilities. The East Timor Civil Aviation Authority is also concerned with institutionaldevelopment as a sustained authority for passenger and cargo services.
Program 1: Institutional Development
15.102 Institutional development is concerned with legislative framework for an Aviation Lawand transition from UN operational management to East Timor authorities. In addition, astructure of fees and assessment must be developed, and East Timor must establish regional andinternational relationships for air services.
Projects
a) Enactment of Aviation Law
b) Organisation and Structural Development for East Timor Civil Aviation Authority
c) Regional Affairs for Air Service and Cargo
d) Membership in the ICAO
e) ICAO Compliance Regulations and Practices
Program 2: Comoro Airport Operations
15.103 This program provides for the safe and efficient operation of Comoro Airport inaccordance with ICAO standards. With the approaching end to the Memorandum ofUnderstanding, responsibility will shift from UNTAET and the Government of Portugal to anEast Timor Civil Aviation Authority requiring changes in services, fees, facilities,administration, and safety.
300
Projects
a) Comoro Runway Overlay Rehabilitation
b) TFET Project 1 Comoro Runway Structural Evaluation
c) Bilateral Project 1 Training/Supervising Staff for Comoro
d) Multilateral Civil Aviation Authority assistance for Operations
e) Air Traffic Control, Navigational Lighting, and Communications
f) Airport Emergency Procedures, Fire Fighting Facilities
g) Airport and Customs Security
h) Infrastructure and Ground Maintenance
i) Finance and Administrative Systems Development
Program 3: Improvement of National Services
15.104 A second phase of airport development late in the current planning period will build oncore of services and capabilities at Comoro. District air services and cargo will continue to beprivately contracted but expanded, including capacity development.
Projects
a) Runway Development and Rehabilitation
b) Directional Guidance and Navigation Support Systems
c) Aircraft Maintenance and Support Facilities at Comoro and Regional Airports
d) Fees and Tariffs on Cargo and Passenger Services
e) Air Cargo and Postal Facilities
f) National Plan for Air Routes and Private Support Facilities
g) Communications, Air Controller Systems, and Emergency Procedures Systems
h) Fire Prevention and Fire Fighting Systems
Program 4: Capacity Building
15.105 Substantial training and staff development has been taking place through bilateralprojects and UNTAET/ETTA activities. Programs for continued training, specifically in highlytechnical areas and critical emergency situations, are only now in planning stages. The EastTimor authority has been heavily reliant on donor and international assistance, which willcontinue to be necessary.

301
Projects
a) Bilateral Project 1 Training & Supervising Staff
b) Air Controller Training and Certification
c) Emergency Services and Fire Fighting
d) Administration and Airport Management
e) Ground Maintenance
Table 15.9: Division of Civil Aviation Performance Indicators
Objectives Performance Indicators
1. Attain a high standard of safeand efficient passenger service
• Maintain 100% incident and accidentfree air and ground operations
• Join ICAO by year end 2002
• Compliance with ICAO Guidelines by2003
• Civil aviation laws and regulations 100%enacted and approved by end of 2003
2. Establish effective air cargosystems for international andnational transport
• 100% rehabilitation of Dili facilities by2005
• 90% of cargo facilities renovation by2002
• Create mobile off-loading and conveyercargo and passenger systems by 2003
3. Generate a reliable staff withqualifications required to ensuresafe and effective operations
• 80% of ground and CA staff recruitedand trained by end of 2002
• 100% of staff hired and trained by end2003
4. Establish the reliable and securesystems needed for efficientmail & postal expediting
• With Post Office, establish fully secureand efficient air mail and post by end of2002
• Establish with Post Office and postalministry fees for all postal handling andshipping by 2003
5. Establish an appropriatefinancial system that allows fullcost recovery of operations
• System implemented database withdonor support by 2003
• Fee structure and budgeted system by2003
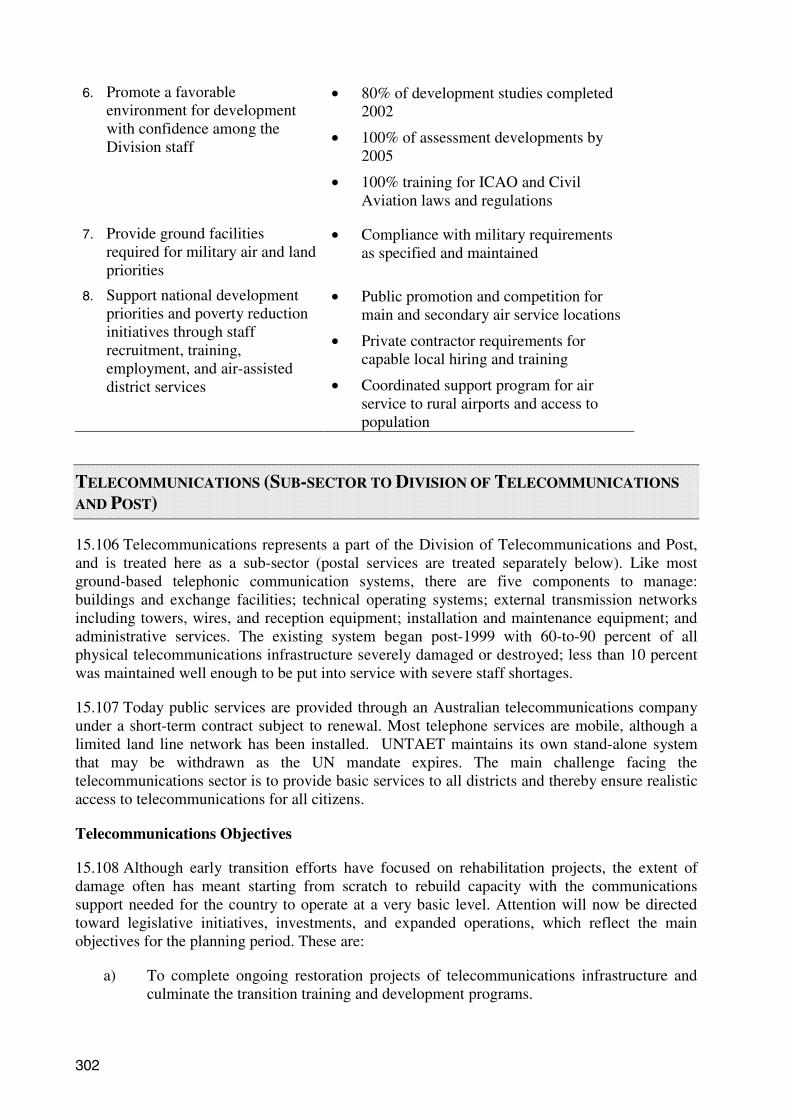
302
6. Promote a favorableenvironment for developmentwith confidence among theDivision staff
• 80% of development studies completed2002
• 100% of assessment developments by2005
• 100% training for ICAO and CivilAviation laws and regulations
7. Provide ground facilitiesrequired for military air and landpriorities
• Compliance with military requirementsas specified and maintained
8. Support national developmentpriorities and poverty reductioninitiatives through staffrecruitment, training,employment, and air-assisteddistrict services
• Public promotion and competition formain and secondary air service locations
• Private contractor requirements forcapable local hiring and training
• Coordinated support program for airservice to rural airports and access topopulation
TELECOMMUNICATIONS (SUB-SECTOR TO DIVISION OF TELECOMMUNICATIONS
AND POST)
15.106 Telecommunications represents a part of the Division of Telecommunications and Post,and is treated here as a sub-sector (postal services are treated separately below). Like mostground-based telephonic communication systems, there are five components to manage:buildings and exchange facilities; technical operating systems; external transmission networksincluding towers, wires, and reception equipment; installation and maintenance equipment; andadministrative services. The existing system began post-1999 with 60-to-90 percent of allphysical telecommunications infrastructure severely damaged or destroyed; less than 10 percentwas maintained well enough to be put into service with severe staff shortages.
15.107 Today public services are provided through an Australian telecommunications companyunder a short-term contract subject to renewal. Most telephone services are mobile, although alimited land line network has been installed. UNTAET maintains its own stand-alone systemthat may be withdrawn as the UN mandate expires. The main challenge facing thetelecommunications sector is to provide basic services to all districts and thereby ensure realisticaccess to telecommunications for all citizens.
Telecommunications Objectives
15.108 Although early transition efforts have focused on rehabilitation projects, the extent ofdamage often has meant starting from scratch to rebuild capacity with the communicationssupport needed for the country to operate at a very basic level. Attention will now be directedtoward legislative initiatives, investments, and expanded operations, which reflect the mainobjectives for the planning period. These are:
a) To complete ongoing restoration projects of telecommunications infrastructure andculminate the transition training and development programs.
303
b) To initiate currently planned projects for controlling radio frequency electro-magneticemissions in the country and other functions of the Communications RegulatoryAuthority.
c) To attain by mid-2003 the implementation of a telecommunications network with thecapacity to satisfy the minimum telecommunication needs of the nation.
d) To extend basic telecommunication services to all districts by the end of 2004.
e) To promote the formation a sufficient number of Internet Service Providers torealistically serve all of East Timor by the end of 2002.
f) To create a regulatory and fiscal authority, the Communications Regulatory Authorityfor control of radio frequency electro-magnetic emissions and standards.
g) To build capacity to the level of self-sufficient management and technical operationalcontrol by the end of 2003.
h) To complete legislative guidelines and operating standards for telecommunications bythe end of 2002, and to obtain approval for national implementation thereon.
i) To pursue capacity building and recruitment programs that ensure the sector has well-qualified staff in telecommunications and information technology.
j) To institute a supervisory and coordination process for district operators and servicetechnicians.
Constraints, Problems and Issues
15.109 Telecommunications is a capital-intensive industry and will require high levels ofinvestment to finance the development of infrastructure. As with other sectors, the sector faceshuman resource shortages and attention to capacity development. Perhaps the most importantconsideration is the topology of East Timor that poses major constraints on land-based tower-and-wire development.
15.110 Under current operating constraints and the realities of funding, staff capabilities, andpotential support from international donors, incremental development of land-based wiretelephone systems and current-generation PABX systems may be the only option. This shouldnot prevent the sector (and the donor community) from considering the cost-benefit trade-off ofpursuing the latest technological systems.
Telecommunications Strategies
15.111 The highest priority after current rehabilitation projects are completed is to establish thelegislative framework for regulating telecommunications. The Division will pursue laws andoperating regulations to become an autonomous agency in terms of self-financing, and in thelong-term, create an impact fund capital development.
15.112 The sector can achieve its objectives best through a BOT contract with an experiencedmajor private international company. This would entail contracting with government backingwith a 20-25 year amortisation and BOT completion horizon. This would permit state-of-the-arttelecommunications development from the start of the contract, consistent and thorough trainingof local technicians and administrative staff, and a full transparent telecommunication systemwith rapid capital development. Under the BOT contractor, optimal use of local human and

304
material resources would be realised with a final “handing over of keys” to an already-competentstaff. This strategic approach would fully meet the component parts of a domestic strategy thatwould address all five aspects of telecommunications.
15.113 If a BOT strategy cannot be implemented, the Division must plan independent programsfor each of the five components – buildings and exchange facilities, operational systems, externalnetwork infrastructure, equipment and maintenance, and staff capabilities. The Division willaddress these components within its programs.
Telecommunications Programs and Projects
15.114 The directorate has several program areas but few individually identified projects apartfrom overall operations. Two priorities stand out. The first is concerned with establishing theregulatory authority. The second is concerned with maintaining appropriate operational contractsuntil government can negotiate a major investment for private telecommunications developmentthrough a build-operate-transfer process.
Program 1: Regulation
15.115 The Communications Regulatory Authority will be fully established and empowered asthe government regulator of all communications services in East Timor.
Projects
a) Public and Private Policy Development
b) Radio Frequency Electro-Magnetic Emissions and Standards
c) Regulations Pertaining to Post and Internet
Program 2: Telecommunications Operations
15.116 The rehabilitation of national services will continue with systematic transition of assetsand infrastructure services from UNTAET as East Timor progresses.
Projects
a) Rehabilitation of Towers, Lines and Exchanges
b) Capital Upgrade of Equipment and PABX
c) Provision of Customer Service Centre
d) Maintenance of Facilities and Transmission Distribution Systems
Program 3: Capacity Building
Projects
a) Recruitment and Staff Training in Administrative Services
b) District Operations Training and Staffing of Exchanges
c) Maintenance Workshops and Skills Development

305
Table 15.10: Telecommunications Performance Indicators
Objectives Performance Indicators
1. Complete ongoing restorationprojects and culminate transitiontraining and developmentprograms
• 100% restoration of Dili infrastructure by 2003
• 50% of service to rural areas complete in 2003
• 100% of training initiatives completed by 2003
2. Initiate controls for radiofrequency electro-magneticemissions
• 100% completed projects by 2003
3. Implement a telecommunicationsnetwork with the capacity tosatisfy the minimumtelecommunication needs of thenation
• Network implemented by July 2003
• Network districts and populated areas by 2004
• Install 75% of planned public telephone booths incapital by 2002, 100% by end of 2003
• 100% of rural telephone booths end of 2004
4. Extend basic telecommunicationservices to all districts by 2004
• Expansion of basic telecommunications services to alldistricts by end of 2004
5. Promote sufficient InternetService Providers to serve all ofEast Timor
• Target coverage of all subscribers by 2004
6. Create a regulatory and fiscalauthority, the CommunicationsRegulatory Authority (CRA)
• Enabled and operational by end of 2002
7. Build capacity to the level of self-management, operational control
• Complete all Dili/district staff training by 2004
• Qualified maintenance staff recruited by 2004
8. Complete legislative guidelinesand operating standards
• Complete slate of regulations by end of 2002
• Draft regulations for operation standards 2002
9. Pursue capacity building andrecruitment programs
• Sector staff can meet self-sufficiency in informationtechnology and telecom technical advancements
10. Institute a supervisory andcoordination process for districts
• Implemented in district capitals by end of 2002
• 100% of urban/rural areas participate by 2003
POSTAL SERVICES (SUB-SECTOR TO DIVISION OF TELECOMMUNICATIONS AND
POST)
15.117 Postal services are currently operating in eight districts following early transitionsupport for reconstruction and bilateral assistant from Portugal. The remaining districts areserviced by road through infrequent routes by existing staff. A large part of the population has no

306
easy access to postal services, nor can they afford to use mail services. In Oecussi, an agencyoperates mail service in a UNTAET building, and the UN has supported airmail andgovernment-related postal services.
15.118 Although governmental approval has been given for expanded district services, theregulations needed for postal services administration have not yet been developed. This plan isan early step to generate comprehensive postal services with enabling postal policies that provideefficient and affordable services to everyone.
Postal Services Objectives
a) Repair the postal infrastructure to provide basic postal services within the currentprogram framework for rehabilitation.
b) Recruit, train and enable postal staff to be able to offer high quality services currentlybeing developed and planned for long-term expansion.
c) Increase the quality of postal service coverage, extending the range of service tocommunities that have not yet been incorporated to the postal map.
d) Create community agencies with the objective of delivering to all a range of generalservices. These will be public-funded activities under the postal authority.
e) Establish “peoples stores” as private, fee-based services in rural areas to providepostal contract systems coordinated with public works and other agencies for mailtransactions, banking networks, and various forms of transfer payments.
f) In the long term, pursue a postal financial intermediation process, and if approved andconsistent with banking laws yet to be developed, provide various cash and demandaccounts, payment capability, and certain approved lending.
g) Initiate professional training and development to enhance human resource capacityamong postal officers.
h) Pursue alternatives for postal administration, including scenario plans for a fullyprivate, quasi-governmental, and fully public postal service.
Constraints, Problems and Issues
15.119 The major constraints are those that face all other sectors, namely lack of funding togenerate the capital improvements required for a national postal service, and insufficient humanresources capable of administering the postal service or operating the district services. Virtuallyall other limitations stem from these two situations, including lack of equipment, unreliableservice, poor (or no) access for much of the rural population, and the inability to support othergovernment functions.
15.120 In the near term, and perhaps well into the future, development costs and the operatingcosts of maintaining district offices with decent access to postal services will far exceedrevenues. A regime of rates must be competitive on an international scale, yet also bedomestically modest so that a vast majority of citizens can afford to use the mail as its means ofcommunication and various transactions.

307
Postal Services Strategies
15.121 Because postal services were nearly totally destroyed, it is necessary to graduallydevelop new services throughout the country. The strategy will be incremental development asthe Division continues as a public postal authority. However, the Division will study alternativesfor private postal services or a quasi-governmental agency through joint-contractual agreements.
15.122 The first phase of development will be carried out with the support and financing ofCTT-Correios of Portugal, allowing the re-establishment of postal flows and the creation ofpostal centres in Dili, Baucau, and Oecussi. During this stage (through 2003), a central nationalpostal sorting and forwarding office will be established. During phase two (through 2007), thechallenge will be to widen postal services, branching out from the district capitals to realisticallyprovide access to all areas of the population. Access will still be limited for many ruralhouseholds, but the aim is to at least provide access through small agencies or private servicepoints.
15.123 Clearly, a priority will be to develop proposals for bilateral or multilateral assistancewith essential capital improvements and with capacity development and human resources. Inaddition, the Division will seek technical assistance to develop planning scenarios forprivatisation of postal services or a quasi-government agency.
Postal Services Programs and Projects
15.124 The Postal sector has three program areas, each with several projects that requireresources and support activities throughout the five-year planning cycle. The ultimate aim of theprograms is to restore 90 percent of the infrastructure and be able to provide the full range ofpostal communications services required, with realistic access to all populated areas, by the endof the planning period.
Program 1: Restoration and Development
Projects
a) Renovation of District Capital Offices
b) Restoration of Central General Post Office in Dili
c) Installation of Street Post Boxes in Urban Centres
d) Initiation of Mail Pick Up and Delivery
e) Mobile Post Office Program
Program 2: Human Resource Capacity
Projects
a) Recruitment for Public Service Staffing
b) Training of District Staff and Delivery Personnel
c) Contracting Private Rural Carriers and Access Services

308
Program 3: Innovations and Expansion
Projects
a) Postage Stamp Printing and Distribution
b) Vehicle Acquisitions for Rural Services
c) Electronic Service Centres
d) Establish Postal Banking Services
Table 15.11: Postal Service Performance Indicators
Objectives Performance Indicators
1. Repair the postal infrastructure toprovide basic postal services
• 30% completed by end of 2002
• 70% completed by end of 2003
• 100% completed by end of 2005
2. Recruit, train and enable postal staffto be able to offer high qualityservices
• 30% staffing level achieved end of 2002
• 70% recruited and trained by end of 2003
• 100% human resource competency and staffinglevel by end of 2005
3. Increase the quality of postal servicecoverage, extending services tocommunities that have not yet beenincorporated to the postal map
• General Post Office and district offices withelectronic counter services by end of 2003
• Rural postage and counter service coverage90% by end of 2003
• Street post boxes installed in Dili, 2003
• District capital street post boxes by 2003
• Mobile Post Van services by end of 2002
• Rural home or core point delivery and pick-upinitiated in 2003
• Urban route pick up and delivery 100% by endof 2003
4. Create community agencies with arange of general services for suburbsand districts
• 50% of all regional offices or kiosks operatedunder public service staff by end of 2003
• 50% of mobile services by adjunct staffcontracts
5. Establish “peoples stores” as privatesector, fee-based services for ruralareas
• 50% of rural postal services in privateenterprise stores with extended fax, phone,copy, and other services plus postal
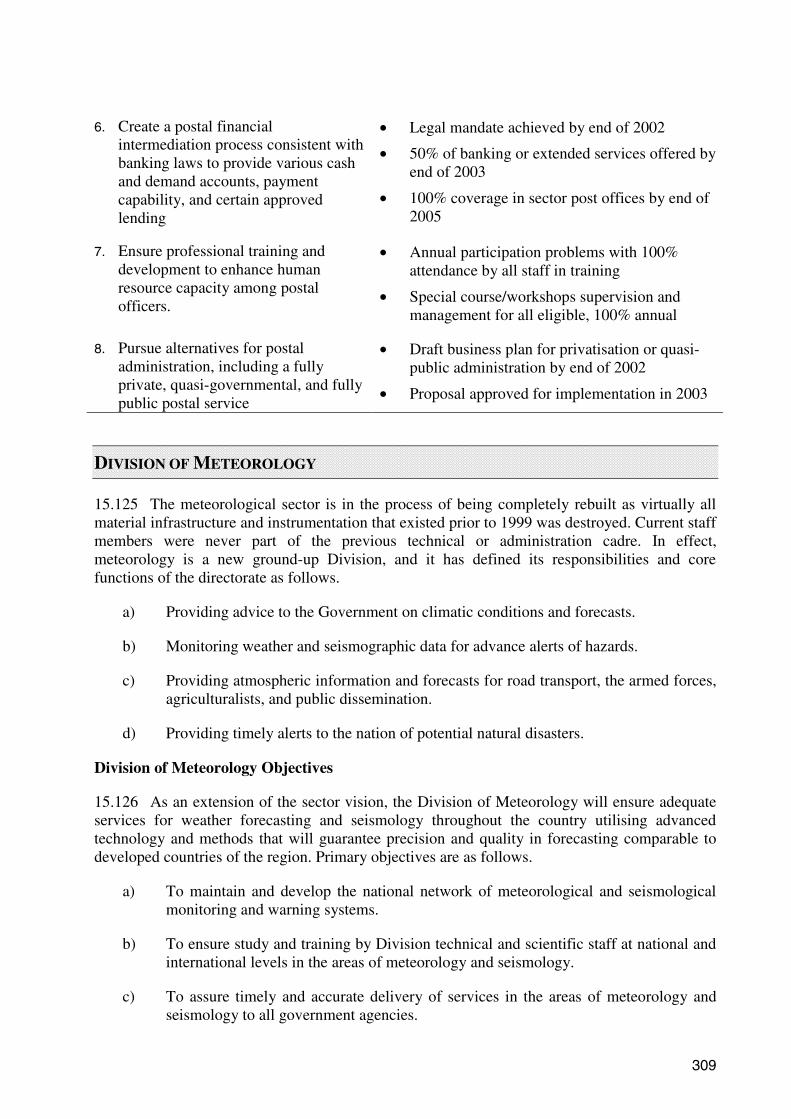
309
6. Create a postal financialintermediation process consistent withbanking laws to provide various cashand demand accounts, paymentcapability, and certain approvedlending
• Legal mandate achieved by end of 2002
• 50% of banking or extended services offered byend of 2003
• 100% coverage in sector post offices by end of2005
7. Ensure professional training anddevelopment to enhance humanresource capacity among postalofficers.
• Annual participation problems with 100%attendance by all staff in training
• Special course/workshops supervision andmanagement for all eligible, 100% annual
8. Pursue alternatives for postaladministration, including a fullyprivate, quasi-governmental, and fullypublic postal service
• Draft business plan for privatisation or quasi-public administration by end of 2002
• Proposal approved for implementation in 2003
DIVISION OF METEOROLOGY
15.125 The meteorological sector is in the process of being completely rebuilt as virtually allmaterial infrastructure and instrumentation that existed prior to 1999 was destroyed. Current staffmembers were never part of the previous technical or administration cadre. In effect,meteorology is a new ground-up Division, and it has defined its responsibilities and corefunctions of the directorate as follows.
a) Providing advice to the Government on climatic conditions and forecasts.
b) Monitoring weather and seismographic data for advance alerts of hazards.
c) Providing atmospheric information and forecasts for road transport, the armed forces,agriculturalists, and public dissemination.
d) Providing timely alerts to the nation of potential natural disasters.
Division of Meteorology Objectives
15.126 As an extension of the sector vision, the Division of Meteorology will ensure adequateservices for weather forecasting and seismology throughout the country utilising advancedtechnology and methods that will guarantee precision and quality in forecasting comparable todeveloped countries of the region. Primary objectives are as follows.
a) To maintain and develop the national network of meteorological and seismologicalmonitoring and warning systems.
b) To ensure study and training by Division technical and scientific staff at national andinternational levels in the areas of meteorology and seismology.
c) To assure timely and accurate delivery of services in the areas of meteorology andseismology to all government agencies.

310
d) To implement a system of information for relevant conditions in East Timor that canbe transmitted to international counterparts.
e) To develop international relations and cooperation in the areas of meteorology andseismology to better inform East Timor of relevant conditions within the region.
f) To develop the appropriate physical means of monitoring and communicatinginformation on meteorological conditions (targeted for end of plan-year 2003).
g) To establish the human resource capabilities for using instruments and monitoringsystems for meteorology and seismology (targeted for end of plan-year 2003).
h) To attain the necessary level of management and administration for the Divisionthrough recruitment and training (by year-end 2002).
i) To define programs and procedures for technical assessments and monitoring, thusestablishing the systems for forecasting and analyses (by year-end 2002).
j) To complete a network of observation and warning stations with operational servicesrequired for national meteorology service (by year-end 2004).
k) To establish the means of collaboration with environmental constituents to monitorclimatic changes vital to the protection of the natural environment.
Constraints, Problems and Issues
15.127 With total destruction of the infrastructure and destruction of all meteorologicalinstruments, the capital funding requirements are exceptional. Lack of skilled staff and bothscientific and technical expertise will impede progress toward achieving the Division’sobjectives. Without adequate systems or procedural policies, East Timor is fully dependent onother countries for weather forecasts, which provide no emergency alert capabilities.Communication systems in East Timor cannot be adequately employed for alerts or weathertransmission to government agencies, military, district or rural areas, or the public at large.Without having a credible level of monitoring and forecasting, East Timor cannot be part of alarger reciprocal regional network of such services, thus remaining hostage to whatever climaticconditions occur.
Division of Meteorology Strategies
15.128 The strategy of the Division has two main thrusts. The first is to simply build (fromscratch or by rehabilitating what can be redeemed) the meteorological infrastructure of basicobservation, monitoring, and information forecasting networks. This will have an early stage(completed by 2004), and a latter stage of national expansion of observation points and services(extending through the planning period and beyond). This is largely a “capital development”component but will be mirrored by a capability building effort to recruit and train Division staffand local technicians.
15.129 The second component concerns pervasive activities that begin now and will extendthroughout the planning period. This includes regulatory planning and Division structuring ofcommunications, emergency procedures, and rapid-response alert systems. These systems andnetworks will define the scientific and technical staffing patterns that evolve over the next fewyears.

311
15.130 Neither component to the strategy is feasible without first having approval throughenacted laws and regulations for a national meteorological service, and the support for recurrentoperating budgets. The Division’s director general will subsequently be responsible for securingthese enabling approvals and budgets while providing administrative oversight to the proposedstrategic initiatives.
15.131 It is safe to assume that capital assets and technical expertise required are not in EastTimor, not can they be attained without international assistance. Therefore, the Division willorganise a round table meeting with a view to obtaining international support for thedevelopment of the sector following approval of this development plan. The Division will seekdirect technical assistance for both development and operations over the course of the planningperiod, sufficient to ensure membership in the World Meteorological Organisation, and tosustain a high level of quality services.
Division of Meteorology Programs and Projects
15.132 Building the service from the ground up requires attention to three program areas, butno specific projects beyond implementing the programs summarised below.
Program 1: Operational Infrastructure
15.133 The combined efforts of construction and equipment installation will proceed to achievea basic capacity for all services by the end of 2002, and be fully functional by the end of 2004.Expansion will then target district stations and equipment. Part of this program will be to identifypolicies required for emergency procedures, alerts, and communications concerning allmeteorology and seismology circumstances. Instrumentation must be obtained throughinternational assistance and installed and maintained under international certification standards.
Program 2: Capacity Building
15.134 Concurrent with infrastructure development and equipment installation, local staff willbe recruited and trained to achieve 50 percent of targeted capabilities by the end of 2002 andfully competent skilled staff by the end of 2004. External technical assistance through donorprograms is assumed to be needed for higher level technical and scientific positions, thuscomplementing local staff with the service levels required for forecasting, internationalcooperation, and developing emergency alert systems.
Table 15.12: Division of Meteorology Performance Indicators
Objectives Performance Indicators
1. Develop a national network ofmeteorological and seismologicalmonitoring and warning systems
• 50% rehabilitated stations by 2002
• 100% of new construction by end of 2004
2. Ensure study and training by Divisiontechnical and scientific staff at nationaland international levels
• 25% of selected technical and scientific staffrecruited or trained by end of 2002
• 100% staff credentialed by year end 2004
3. Assure timely and accurate delivery ofservices in the areas of meteorologyand seismology to all governmentagencies
• 100% forecasts and communication of weatheror other information delivered within time ofInternational Meteorology Standards
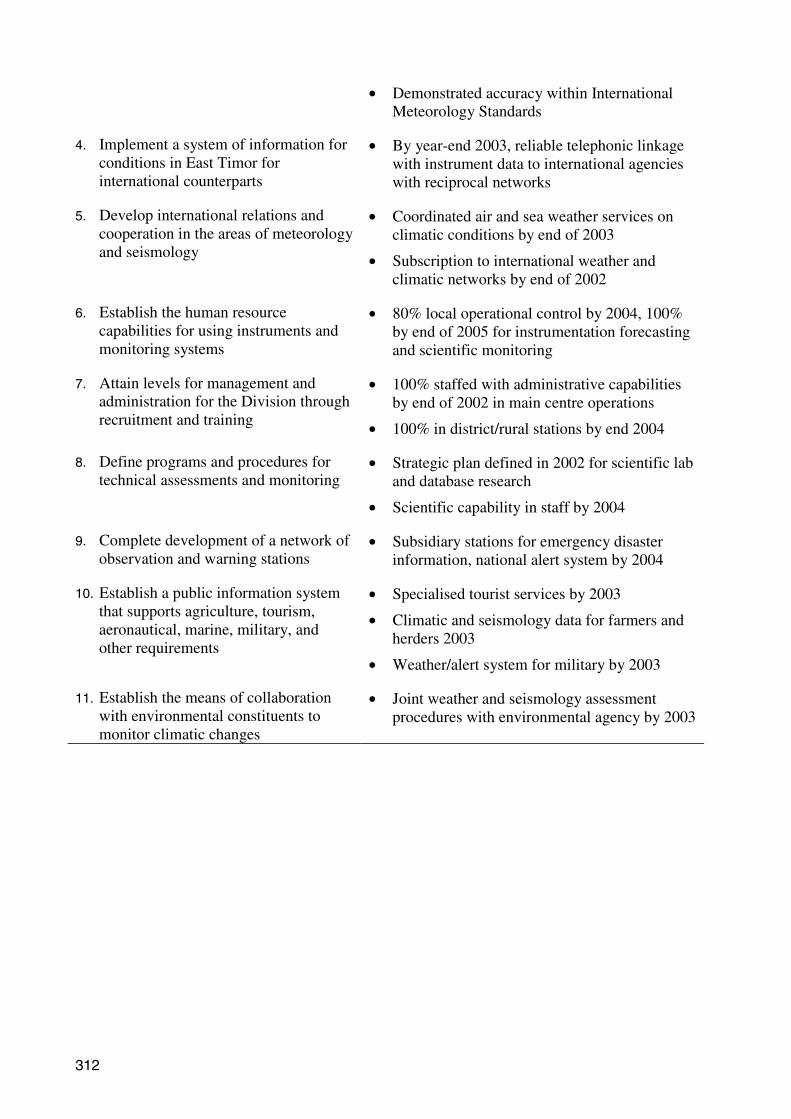
312
• Demonstrated accuracy within InternationalMeteorology Standards
4. Implement a system of information forconditions in East Timor forinternational counterparts
• By year-end 2003, reliable telephonic linkagewith instrument data to international agencieswith reciprocal networks
5. Develop international relations andcooperation in the areas of meteorologyand seismology
• Coordinated air and sea weather services onclimatic conditions by end of 2003
• Subscription to international weather andclimatic networks by end of 2002
6. Establish the human resourcecapabilities for using instruments andmonitoring systems
• 80% local operational control by 2004, 100%by end of 2005 for instrumentation forecastingand scientific monitoring
7. Attain levels for management andadministration for the Division throughrecruitment and training
• 100% staffed with administrative capabilitiesby end of 2002 in main centre operations
• 100% in district/rural stations by end 2004
8. Define programs and procedures fortechnical assessments and monitoring
• Strategic plan defined in 2002 for scientific laband database research
• Scientific capability in staff by 2004
9. Complete development of a network ofobservation and warning stations
• Subsidiary stations for emergency disasterinformation, national alert system by 2004
10. Establish a public information systemthat supports agriculture, tourism,aeronautical, marine, military, andother requirements
• Specialised tourist services by 2003
• Climatic and seismology data for farmers andherders 2003
• Weather/alert system for military by 2003
11. Establish the means of collaborationwith environmental constituents tomonitor climatic changes
• Joint weather and seismology assessmentprocedures with environmental agency by 2003

THE ROAD MAP (for the Implementation of NDP Programs)
Final Draft
República Democrática de Timor-Leste Dili, 15 April 2003

Timor-Leste Road Map Final Draft, 15 April 2003
Page 2 of 33

Timor-Leste Road Map Final Draft, 15 April 2003
Page 3 of 33
THE ROAD MAP........................................................................................................1
INTRODUCTION..........................................................................................................................................5
PART ONE.................................................................................................................5
A. The Planning Process: Progress Thus Far............................................................................................5
B. Preliminary Results of Plan Monitoring...............................................................................................7
C. Lessons from Plan Implementation: Planning Gaps and the Need to Prioritise..................................8
D. Immediate Priorities and Stability program.........................................................................................9
E. Prioritization and Sequencing.............................................................................................................10
F. Process Dimensions of Prioritisation and Sequencing........................................................................11
G. Structural Constraints ........................................................................................................................11
H. Financial Constraints: Budget Parameters.........................................................................................12
I. The Millennium Development Goals ..................................................................................................13
J. The Road Map.....................................................................................................................................13
K. NDP, Stability Program and Road Map.............................................................................................14
PART TWO ..............................................................................................................16
A. Ministry of Agriculture, Forestry and Fisheries.................................................................................16
B. Ministry of Development and Environment .......................................................................................17
C. Ministry of Education, Youth, Culture and Sport..............................................................................18
D. Ministry of Foreign Affairs and Cooperation.....................................................................................20
E. Ministry of Health...............................................................................................................................21
F. Ministry of Interior and State Administration ...................................................................................22
G. Ministry of Justice...............................................................................................................................24
H. Ministry of Planning and Finance ......................................................................................................25
I. Ministry of Transportation, Communications, and Public Works ....................................................27
J. Secretary of State for Defence.............................................................................................................28
K. Secretary of State for Labour and Solidarity .....................................................................................28
L. Secretary of State for Commerce and Industry..................................................................................29
M. The Office of the President .................................................................................................................30

Timor-Leste Road Map Final Draft, 15 April 2003
Page 4 of 33
N. The National Parliament.....................................................................................................................30
O. State National Security Service...........................................................................................................31
P. Government Structures.......................................................................................................................31
Q. The Oecussi Enclave............................................................................................................................32
CONCLUSION .........................................................................................................33
Timor-Leste Road Map Final Draft, 15 April 2003
Page 5 of 33
INTRODUCTION Timor-Leste has prepared its first five-year National Development Plan (NDP) in record time. Implementation of the Plan began on 01 July 2002 with the FY03 budget.1 Early on, the Government recognised the need to prioritise and sequence the NDP activities and prepare a “Road Map” to guide their implementation. Also, the requirement to fill some of the gaps in the Plan and address the urgent needs of the people through expansion and improvements in services delivery became evident. This paper on the “Road Map” summarises the results of the Prioritisation and Sequencing exercise and the conclusions. It explains why and how the prioritisation and sequencing has been undertaken and what the main issues influencing the process were. The paper is divided into two parts. The first part (Part One) covers the planning background and performance, rationale for prioritisation and sequencing and the process dimensions, while Part Two summarises the results of the submissions by ministries and agencies.
PART ONE
A. The Planning Process: Progress Thus Far Prior to independence on 20 May 2002, Timor-Leste's Second Transitional Government began to formulate the country’s first National Development Plan (NDP). Eight Ministerial Working Groups in areas such as poverty reduction and rural and regional development, human development, agriculture and infrastructure prepared the Plan. They drew upon the results of the Countrywide Consultation, in which more than 38,000 citizens from all walks of life spread in all parts of the country were asked to express their vision for the country to the year 2020 and identify their priorities and development needs. The Working Groups recognized that the people of Timor-Leste needed virtually everything and incorporated a wide range of strategies, policies, programs and actions to address their needs during the five-year Plan period (2002/03 to 2006/07) within a twenty-year perspective. The Plan incorporates the vision (see Box 1) and set of inter-related development goals and priorities of the people of Timor-Leste, and specified a number of strategies, policies, laws, regulations, programs, projects and activities. It also highlights the key constraints on the attainment of these goals and vision, and provides performance indicators through which progress can be assessed. The Plan was finalized in early May 2002 and adopted by the Parliament after independence. Since its formulation, the NDP has become the basis for the country’s national development and budgeting process. At the recent semi-annual Meetings with Development Partners, in May and December 2002, representatives of all external Partners (bilateral and multilateral donors, UN agencies and others) commented favourably on the NDP as the basis for Timor-Leste’s development. 1 FY03 refers to the fiscal year beginning on 01 July 2002 and ending on 30 June 2003.

Timor-Leste Road Map Final Draft, 15 April 2003
Page 6 of 33
Box 1. TIMOR-LESTE: VISION 2020* For the next generation, in the year 2020:
? Timor-Leste will be a democratic country, with a vibrant traditional culture and a sustainable environment; ? It will be a prosperous society with adequate food, shelter and clothing for all people; ? Communities will live in safety, with no discrimination; ? People will be literate, knowledgeable and skilled. They will be healthy, and live long, productive lives.
They will participate actively in economic, social and political development, promoting social equality and national unity;
? People will no longer be isolated, because there will be good roads, transport, electricity, and communications in the towns and villages, in all regions of the country;
? Production and employment will increase in all sectors –agriculture, fisheries and forestry; ? Living standards and services will improve for all East Timorese, and income will be fairly distributed; ? Prices will be stable, and food supplies secure, based on sound management and sustainable utilisation of
natural resources; ? The economy and finances of the state will be managed efficiently, transparently, and will be free from
corruption; and The state will be based on the rule of law. Government, private sector, civil society and community leaders will be fully responsible for those by whom they were chosen or elected. * Timor-Leste’s Vision is taken from the introduction to the National Development Plan, adopted officially by the National Parliament as the basis for the nation’s development.
The Plan gave hope to the people about their future as well as that of their children and raised expectations. It recognized the likely direct and indirect adverse impacts of the reduction of the international presence due to the scale-down of the UN operations in mid-2002 on the demand for goods and services and employment. The unemployment rate was estimated to be of the order of about 17%. The economy was estimated to contract by about 4.8% in 2002 and 6.8% in 2003 and recover somewhat (by 3.5%) in 2004.2 As the next step in the planning process, the Council of Ministers requested that all ministries prepare and submit Annual Action Plans (AAPs) and Quarterly Reporting Matrices (QRMs) for their Programs and Projects, for the first year of Plan implementation. The aim of this exercise was to link the programs in the Annual Budget for FY033 with the goals and objectives of the NDP. To prepare the ministries for drafting their AAPs and QRMs, staff from the Planning and External Assistance Management Division (PEAMD) and the Budget Division (BD) of MPF, together with external facilitators and trainers provided workshop sessions in July and August 2002.4 These workshops introduced the formats for AAPs and QRMs, and advised lead officials and focal persons in the ministries on the provision of the necessary material and data required for their completion. During August and September 2002, PEAMD consultants and staff worked intensively with Ministry focal persons on their AAPs and QRMs, providing written recommendations for improvements. Individual assistance was given to ministries, with consultants spending time
2 All rates in nominal terms. The Budget Paper for FY03 (April 2002) indicates the GDP in real terms to decline by 0.5% in calendar 2002 and 2% in calendar 2003, but recover (increase) by 1.2% in 2004, and continue to grow at 3.3% and 5.1% respectively during calendar 2005 and 2006. 3 FY03 refers to the fiscal year beginning on 01 July 2002 and ending on 30 June 2003. 4 UNDP, UNICEF and the World Bank funded the facilitators and trainers.

Timor-Leste Road Map Final Draft, 15 April 2003
Page 7 of 33
on areas such as performance targets. Additional workshops were held in September, focusing in particular on outputs, benchmarks and indicators. Reports from these sessions indicated a high degree of involvement by Ministry officials, and progress in building capacity within ministries for the drafting of future programs. Following this training, ministries submitted completed AAPs and QRMs to PEAMD. Staff in PEAMD, working with international consultants, then assessed these documents. Comments and recommendations were provided to Ministry focal persons, who then undertook revisions, which were finalized and submitted to the Council of Ministers. B. Preliminary Results of Plan Monitoring Based on the reporting system developed through the use of AAPs and QRMs, the Government, through PEAMD, MPF and individual ministries, has been able to monitor plan implementation during the first six months of the first year of NDP. Some 742 activities were monitored of which 44 actions were included in the Transition Support Program5. The results of the first five months of this monitoring were presented to the December 2002 Meeting with Development Partners. In summary, monitoring indicated that there had been some early successes in a number of sectors. In education, for example, primary school enrolments increased, particularly for girls, and for the poorest groups in the villages. In health, targets for restoring the public health network and drafting a national health policy framework were met. In agriculture, programs were set in place to increase crop cultivation, and to meet the particular needs of the poorer upland areas, especially in the center of the country. In infrastructure, a comprehensive set of programs was initiated, in areas such as water supply and sanitation, roads, bridges, and flood control. Additionally, the Government developed a range of new programs, notably for improved governance. Given Timor-Leste’s conditions, however, it rapidly became apparent that there were crucial constraints on development. For example, the Government inherited a power sector that was technologically inadequate, with no serious means for cost recovery. A judicial system had to be built, virtually from nothing. Capacity building through the funding of advisers to provide expertise to crucial posts in government and public service developed very slowly6. In several areas, budgets were under-spent due to limited capacity and the somewhat complex procurement and other regulations. These developments should be seen in the context of the transfer of governance from the United Nations Transitional Administration in East Timor (UNTAET) to the National Government in May 2002, and the withdrawal of the substantial administrative, technical and other support provided by UNTAET to the Government. Recruitment of international advisers for the 100 stability positions and the 200 development positions to augment the capacity of the Timorese staff was slow at best. Thus, by 01 July 2002, only about a third of the 100 stability positions were filled largely through continuation of some international advisers that served under UNTAET. The progress was less encouraging on securing the resources and filling the 200 development positions. 5 The Transition Support Program (TSP) is a three-year budgetary support program, in which the Government undertakes to monitor a set of activities, particularly in relation to areas of poverty reduction and governance. 6 For a detailed assessment of the first five months of NDP implementation, see the Background Paper prepared for the December 2002 Timor Leste and Development Partners Meeting, available from PEAMD, MPF.

Timor-Leste Road Map Final Draft, 15 April 2003
Page 8 of 33
Assisted by the Brettonwoods institutions (IMF and World Bank), Timor-Leste adopted a Twenty-first Century fiscal system with checks and controls that would ensure transparency and accountability, especially in such areas as procurement. While this is commendable, the system has been beyond the capacity of the Timorese officials and required the retention of international advisers in some line management positions in MPF. Support to line ministries and agencies in such areas as procurement (e.g. explaining the procurement guidelines, assistance including providing necessary information on ‘specifications” for such items as equipment and supplies and in tendering and tender evaluation) proved inadequate, although some international advisers were provided in these areas. Notwithstanding, the Timorese officials, most of whom lacked any experience in governance, did manage to get the government machinery moving and began to implement the Plan. The performance during the first eight months of FY03, measured in terms of budget execution, albeit lower than the pro-rata target, is encouraging. In fact, budget execution during FY01 and FY02 under UNTAET was also lower than expected. Overall budget execution by the National Government in the first eight months was about 56% as compared to a pro-rata target of 67%. This is commendable for a nascent Government facing significant capacity problems and other constraints. C. Lessons from Plan Implementation: Planning Gaps and the Need to Prioritise Government ministries and agencies drew up their Annual Action Plans (AAPs) for the first year of implementation of the Plan. During the preparation of the AAPs, it became clear that some activities specified in the NDP either did not indicate or there was some ambiguity about which division or agency was to be responsible for implementing the activities (e.g. regional development, rural development, job creation, developing Tetun and introducing Portuguese language), while in other cases, some divisions and agencies established did not have activities specified for them in the NDP (e.g. for some Divisions in the Ministry of Justice and the Timor Sea Office). In mid-January 2003, the Council of Ministers reviewed the sector chapters of the NDP in general and the chapters on “Political Development, Foreign Relations, Defence and Security” and “Poverty Reduction and Rural and Regional Development” in particular, and assigned responsibility for implementation of the activities to specific ministries and agencies. Implementing the NDP during the first six months also made it clear that there were important gaps in programs and activities, notably in areas such as water resources, infrastructure development, literacy, and technical and vocational education. While capacity building including the establishment and/or strengthening of government institutions and civil servants received considerable attention, delivery of services to the people was lagging. Also, employment, especially in the urban areas and among youth, declined precipitously in the latter half of 2002 after withdrawal of a significant proportion of the UN personnel. The country is facing difficulties in attracting foreign direct investment, and in rapidly creating an enabling environment for private sector development. Also, the Government has not yet been able to address adequately the provision of social services for vulnerable groups. In general, delivery of services has not expanded to meet the high expectations of the people due to various factors that included (i) capacity limitations and technical difficulties in putting in place the necessary legislation and regulations supporting good governance, (ii) time
Timor-Leste Road Map Final Draft, 15 April 2003
Page 9 of 33
absorbed in setting up the administrative and service delivery systems, and (iii) lack of prioritization and sequencing of the activities in the NDP. Early on, the Government realized some of the constraints and began in October 2002 to see the need to refocus the development efforts on a limited number of priority activities. The events of 4 December 2002 added urgency to address the immediate needs of the people through tangible delivery of goods and services that are visible to the people. D. Immediate Priorities and Stability program In the semi-annual meeting with Development Partners in December 2002, the Prime Minister alluded to the need to address the urgent needs of the people and indicated the types of priorities around which the Government intended to focus its efforts in the short-term. In January 2003, the Council of Ministers refined the immediate priorities taking into account the feedback from the people in both the urban and rural areas. A tentative list of immediate priorities was shared with Development Partners in a meeting on 21 January 2002. The suggestions emerging from the Partners were taken into account in finalizing the immediate priorities, which were approved by the Council of Ministers on 22 January 2003. Elaborating on the immediate priorities, and in consultation with key Ministers and other stakeholders, the Stability Program was developed and presented in a document accompanying the Road Map, focusing on specific areas to be taken into account in program prioritisation. This was intended to ensure focus by the ministries on immediate improvements in service delivery to the people for poverty reduction and rejuvenation of the economy. The specific immediate priority areas include: a. The Governance area where the Government aims to:
? Strengthen the administrative structures of the State and legitimise the local authorities beginning with the election of Chefes de Suco so as to enable them to address local priorities;
? Strengthen the justice system including both formal and customary systems aiming at improving the provision of judicial services, through increasing the number of jurists, and enhancing the quality and delivery of services including provision of adequate legal assistance;
? Strengthen the capacities of security involving support to the Timor-Leste Police Force (PNTL) and Defence Force (FDTL) as well as mobilising and organising the local communities for self-defence;
b. In the Stability area, the Government aims to:
? Encourage job creation - especially for youth and veterans. This would include expansion of vocational training in general and in particular to promote integration of the disabled people in the development process. Further, it would involve formulating a national policy on employment linking relevant ministries and public and private investments;
c. In the Development area, the Government aims to:
? Support the development of the agriculture sector, ensuring food security and enhancing access to markets through the
o Family (farming) sector o Cooperative sector

Timor-Leste Road Map Final Draft, 15 April 2003
Page 10 of 33
o Private sector, and in particular small and medium enterprises o Private sector with the state’s participation such as through joint ventures;
? Develop trade through cooperatives and private sector via o Promotion of domestic trade o Import of basic products, and o Export of local products such as cumin and copra;
? Improve educational access, particularly to primary education, in both public and other schools as well as requiring higher quality in all levels of education; and
? Promote health through extension of the mobile clinics and delivery of services to the remote areas through the implementation of the public health system.
In prioritization and sequencing, ministries had been asked to take into account the immediate priorities approved by the Council of Ministers on 22 January 2003. Further, in assessing their programs, ministries were requested to ensure that criteria for incorporation of the programs included:
? Addressing at least one of the immediate priority areas in governance, stability and/or development; and
? Generating tangible benefits through improved delivery of services. Additionally, ministries were reminded of their continuing overall objectives to:
? Justify their programs in relation to medium and long-term NDP priorities; ? Promote sustainability - both fiscally and in development terms; and ? Pursue strategies for poverty reduction and economic growth.
E. Prioritization and Sequencing During the first quarter of calendar 2003, the Government has embarked on a process of readjustment in NDP implementation. The process drew upon the experiences in implementing programs in the first half of the first year of the NDP. Also, it took into account the imperatives to deliver urgently needed services to the people as indicated by the immediate priorities. The process entailed prioritization and sequencing of the development programs for the remaining four years of the Plan period (FY04 to FY07). This has involved both the Council of Ministers and individual ministries. It included ranking of the programs in order of priority, and planning the sequenced introduction and implementation of these programs. Ministries have examined their programs and identified actions that could contribute tangible results, in terms of meeting requirements of the immediate priorities, and filling gaps in existing service provision. In the prioritisation of their programs for the remaining four years of the Plan, ministries were made aware of the financial resources likely to be made available from the CFET budget, TFET,7 and Bilateral and Multilateral sources, for the remaining years of the Plan period (i.e. FY04 to FY07). The latter were outlined in assessments of forward estimates of allocations for the ministries provided by the Budget Division in MPF.
7 The Trust Fund for East Timor (TFET) receives contributions from Australia, Finland, Ireland, Italy, Japan, New Zealand, Norway, Portugal and the United Kingdom. TFET provides grants for economic reconstruction and development activities in Timor-Leste that are prepared and supervised by the World Bank and the Asian Development Bank. The World Bank is the trustee of the fund. Ministries are designated to implement TFET projects.
Timor-Leste Road Map Final Draft, 15 April 2003
Page 11 of 33
Prioritisation was influenced by the experiences during the first half of the first year of NDP implementation and the need to address the immediate priorities approved by the Council of Ministers on 22 January 2003. Programs to meet the immediate priorities are articulated in detail in the Stability Program, which will be implemented within the next eighteen months. The Stability Program is presented in Annex 2. F. Process Dimensions of Prioritisation and Sequencing In prioritisation and sequencing, ministries were assisted by some Development Partners (UNDP, UNICEF, World Bank, AusAid and USAID) mobilising technical specialists and facilitators to support key ministries in the prioritization and sequencing process. An international consultant (or in the case of larger ministries, two consultants) was assigned to work with senior staff and focal persons in each ministry to advise and oversee the process. This was accompanied by a series of workshops, held during February 2003. The workshop presentations outlined the proposals for prioritisation and sequencing of programs. The trainers familiarised the participants with the criteria and formats for prioritisation, and helped the latter to relate these to budget submissions for FY04. The prioritization and sequencing of activities was guided by several criteria. They included such aspects as (i) importance of the activity for improved service delivery and the demand for the service by the people (clients), (ii) when the service is needed (e.g. now, next year or four years from now), (iii) capacity of the ministry or agency to deliver the service and need for technical assistance, if any, (iv) sustainability of the activity or facility, (v) linkages with and involvement of other ministries, civil society organizations, communities and the private sector, (vi) whether Government involvement would encourage or discourage similar activities by other actors, and (vii) whether deferring the implementation of the activity to future years would improve the benefit streams. The ministries and agencies took these criteria seriously and applied them as much as possible in the prioritisation and sequencing of their programs. Some ministries achieved outstanding results; some others produced average outcomes, while a few encountered difficulties in applying the criteria. Overall, the criteria helped the Government officials to begin to think in strategic terms in assessing their programs. Additional workshops were held on Annual Action Plans and Quarterly Reporting Matrices, followed by sessions on devising appropriate indicators for monitoring program implementation. The prioritisation and sequencing exercise, lasting from mid-January to late-March 2003, resulted in the ministries developing a definite set of priority programs for the remaining four years of the NDP. These program priorities were then used as the basis for formulation of AAPs for FY04, feeding into the budget preparation. The final step in the process was the refining of the indicators developed for assessing progress on implementation of the AAPs, and the devising of a set of key development indicators to measure overall Plan implementation in the remaining years of the NDP. G. Structural Constraints Prioritisation and Sequencing was carried out with an awareness of the key structural economic problems currently facing Timor-Leste that include (i) widespread poverty,

Timor-Leste Road Map Final Draft, 15 April 2003
Page 12 of 33
unemployment and underemployment, (ii) dependence on external grant finance, due to substantial trade and budget deficits, (iii) relatively high price levels that are incommensurate with the nation's level of development, (iv) low levels of skills and productivity, and (v) high levels of illiteracy. H. Financial Constraints: Budget Parameters Prioritisation and sequencing was undertaken with also an awareness of the financial constraints imposed by budget parameters. The Council of Ministers has stressed the need to formulate the prioritisation and sequencing based upon a sustainable medium-term fiscal framework that is intended to ameliorate future funding shortages. Table 1 (see Annex at end of Part One) provides mid-year budget update (MYBU) estimates of CFET8 revenue for the six-year period FY02 to FY07, and compares it to MYBU forward estimates of CFET expenditures. Revenues excluding those from First Tranche Petroleum (FTP) but including external budgetary support under the three-year TSP (covering FY03, FY04 and FY05), are indicated to range between $70.6 million and $75.0 million during the first three years, decline there after to $57.5 million in FY06, and recover moderately to $60.3 million in FY07. Revenues with FTP are projected to increase from $71.6 million in FY03 to 96.6 million in FY05, decline to 83.0 million in FY06 and increase slightly to $86.5 million in FY07. CFET expenditures are projected to increase from $74.2 million in FY03 to $80.0 million in FY04, $92.9 million in FY05, $102.4 million in FY06 and reach $105.0 million in FY07. The data indicate an anticipated funding gap between revenues (excluding those from FTP) and expenditures ranging from $5.0 million in FY04, $20.2 million in FY05, $45.1 million in FY06 and $44.7 million in FY07. However, including the FTP revenues, funding gaps of $19.4 million and $18.5 million emerge only in FY06 and FY07 respectively. It will be necessary to develop a credible strategy for addressing the funding gaps. In pursuit of this aim, ministries were asked by the Council of Ministers to keep their CFET budgets within the limits of two scenarios presented by the Council of Ministers. The Budget Division in MPF developed these scenarios, on the basis both of forward revenue estimates and on the results of discussions with some Development Partners. Ministries were asked, if possible, to keep within the lower scenario (Scenario 2). The two scenarios are summarized in Table 2 (see Annex 1). Scenario 1 in Table 2 follows existing CFET forward estimates, and includes an increased subsidy for the Power Authority, allowing for the limited progress made so far in revenue collection in FY03. This scenario is not affordable within CFET, given the latest revenue estimates. Scenario 2 is based on a significantly reduced growth in expenditures as compared to Scenario 1, with the expenditure indicated to decline from $74.2 million in FY03 to 72.0 million in FY04 and $73.9 million in FY05, but increase to $80.4 million and $85.0 million respectively in FY06 and FY07. For the prioritisation and sequencing of their programs, ministries were also requested to consider the CFET allocations given to them, based upon the two scenarios, in providing their cost estimates for the programs. CFET allocations for the ministries, based on the two scenarios, are presented in Tables 3 and 4 (see Annex 1). 8 The Consolidated Fund for East Timor (CFET) is the Government’s central account, structured to reflect revenue, operating and capital income budget. Revenues are derived from Government taxes, Timor Sea revenues, and direct budget support from Development Partners.

Timor-Leste Road Map Final Draft, 15 April 2003
Page 13 of 33
Taking these two CFET allocations into the Combined Sources9 Budget for the remaining years of the Plan period, ministries were then provided with overall indicative Combined Sources funding envelopes for each of the remaining years of the NDP, highlighting the two scenarios, as outlined in Table 5 (see Annex 1). They were requested to prioritize and sequence their programs with reference to these overall Combined Sources funding envelopes, and to the two alternative CFET scenarios (tables 3 and 4) within these envelopes. The Combined Sources Budget Funding Envelopes are outlined in Table 5 (see Annex 1), together with the high and low case CFET expenditures scenario limits italicized. Bilateral and Multilateral Funding: Ministries were also asked to refer to current forward estimates for bilateral and multilateral expenditure, since some of these allocations may not match either the immediate priorities of the Stability Program or the medium and long-term development priorities. Current Bilateral and Multilateral allocations are outlined in Table 6 (see Annex 1). I. The Millennium Development Goals Recently, the Government has also commenced a process of internalising the Millennium Development Goals (MDGs), to provide a means to assess the nation’s development against that of other countries in the region and elsewhere, and disseminate information on this. This exercise was facilitated by the fact that the goals and objectives of the National Development Plan already overlap to a large extent with those covered by the MDGs. As is well known, the MDGs comprise eight goals, most of them to be achieved by 2015. Each of the MDGs addresses some key dimensions of poverty and/or sustainable development and the enabling environments at the national and global levels for helping the countries to achieve the goals. The targets and indicators under many of the goals are quantifiable, and provide a global blueprint that can be tailored to specific national conditions. Commensurate with their circumstances, countries and their development partners can develop strategies for both achieving goals and measuring progress in reaching them. Ministries currently are engaged in the process of assessing their sectoral objectives and aims, in relation to the long-term achievement of the MDGs. This also influenced their process of program prioritisation, by providing comparative human development criteria - particularly in relation to the East Asia and Pacific region - through which the relevance of programs could be assessed further. J. The Road Map The Road Map summarises the results of the Prioritisation and sequencing exercise undertaken by the ministries during the first quarter of calendar 2003. It presents the programs that the Government of Timor-Leste has prioritised as most crucial for the development of the country. The Road Map describes the main development issues faced by each ministry, and outlines the programs they have prioritised to address these issues. It shows the way forward for implementation of the NDP over the next four years (FY04 to FY07). 9 The Combined Sources are CFET, TFET, bilateral and other multilateral sources, and UN Assessed Contributions.

Timor-Leste Road Map Final Draft, 15 April 2003
Page 14 of 33
Within the Road Map document, each ministry has prioritised a set of programs, and has sequenced their implementation for the remaining years of the NDP. It provides estimates of total funding required to implement the programs annually over the four-year period. Expenditure estimates are provided by Ministry for each individual program, and for each year of its implementation in Annex 3. The Government will utilise the Road Map as a basis for its Policy Dialogue with the Development Partners and expects the latter to use the Road Map in their funding decisions and the devising of their country assistance strategies for Timor-Leste. In particular, the programs and their estimated costs specified in the Road Map will be extremely useful in the discussions between the Government and Development Partners and in the decisions on which programs the Development Partners wish to support during the next four years (FY04 to FY07). K. NDP, Stability Program and Road Map The links and overlaps between the National Development Plan, the Stability Program and the Road Map are illustrated in Figures 1 to 3.
Figure 1. Illustration of NDP and Gaps
FY03 FY04 FY05 FY06 FY07 NDP – Year1 Part of AAPs Strategies Policies Laws Regulations Programs Projects Activities
NDP – Year 2 Part of AAPs Strategies Policies Laws Regulations Programs Projects Activities
NDP – Year 3 Part of AAPs Strategies Policies Laws Regulations Programs Projects Activities
NDP – Year 4 Part of AAPs Strategies Policies Laws Regulations Programs Projects Activities
NDP – Year 5 Part of AAPs Strategies Policies Laws Regulations Programs Projects Activities
NDP Gaps Part of AAPs Activities
NDP Gaps Part of AAPs Activities
NDP Gaps Part of AAPs Activities
NDP Gaps Part of AAPs Activities
NDP Gaps Part of AAPs Activities
Figure 2. Illustration of Overlaps between NDP, Gaps and Road Map
FY03 FY04 FY05 FY06 FY07
NDP – Year1 Part of AAPs Strategies Policies Laws Regulations Programs Projects Activities
NDP – Year 2 Part of AAPs Strategies Policies Laws Regulations Programs Projects Activities
NDP – Year 3 Part of AAPs Strategies Policies Laws Regulations Programs Projects Activities
NDP – Year 4 Part of AAPs Strategies Policies Laws Regulations Programs Projects Activities
NDP – Year 5 Part of AAPs Strategies Policies Laws Regulations Programs Projects Activities
NDP Gaps Part of AAPs Activities
NDP Gaps Part of AAPs Activities
NDP Gaps Part of AAPs Activities
NDP Gaps Part of AAPs Activities
NDP Gaps Part of AAPs Activities
NDP
Road Map

Timor-Leste Road Map Final Draft, 15 April 2003
Page 15 of 33
Figure 3. Illustration of Overlaps between NDP, Gaps, Road Map and Stability Program
FY03 FY04 FY05 FY06 FY07
NDP – Year1 Part of AAPs Strategies Policies Laws Regulations Programs Projects Activities
NDP – Year 2 Part of AAPs Strategies Policies Laws Regulations Programs Projects Activities
NDP – Year 3 Part of AAPs Strategies Policies Laws Regulations Programs Projects Activities
NDP – Year 4 Part of AAPs Strategies Policies Laws Regulations Programs Projects Activities
NDP – Year 5 Part of AAPs Strategies Policies Laws Regulations Programs Projects Activities
NDP Gaps Part of AAPs Activities
NDP Gaps Part of AAPs Activities
NDP Gaps Part of AAPs Activities
NDP Gaps Part of AAPs Activities
NDP Gaps Part of AAPs Activities
Stability Program
Timor-Leste Road Map Final Draft, 15 April 2003
Page 16 of 33
PART TWO The main results from the Prioritisation and Sequencing exercise are presented in the following sections. For each ministry, they include the broad areas of the programs prioritised, the timeframe for their implementation, and the justification of their importance. They address the immediate (short-term) priorities as well as the medium and long-term development requirements. For Government Structures,10 a brief summary is provided. The Road Map provides estimated costs for each year for all the programs prioritised by each Ministry in the prioritisation and sequencing exercise and the total funding requested for the remaining four-year Plan period (FY04 to FY07). Detailed annual and total cost estimates by program, including the costs of the programs intended to address the immediate priorities, are provided for each of the ministry’s programs in the Programme Matrix (see Annex 3). The cost projections presented in the Programme Matrix are estimates. Some of them have funding commitments, while others have been identified as program of interest to be funded by Development Partners. For most of the sequenced programmes however, the Government is currently negotiating with the Development Partners. Given this situation, the Government recognizes that it will not be in the position to finalize this part of the document until after all negotiations with the Development Partners have been completed this year. A. Ministry of Agriculture, Forestry and Fisheries The agricultural sector dominates Timor-Leste's economy. It contributes 21% of GDP, and is the main source of income in 94% of villages. It provides 80% of the food and subsistence requirements of rural households. The goals of the Ministry of Agriculture, Forestry and Fisheries (MAFF) are intrinsically linked with NDP priorities, to achieve food security, poverty reduction, rural employment and agricultural diversification. These are also essential elements of the Stability Program. Additionally, the Ministry's programs have significant linkages with programs in other sectors including infrastructure, education, natural resources management, and commerce and industry. It is important to recall that the CFET allocations to the agricultural sector (i.e. MAFF) are modest as compared to those provided through TFET and bilateral and multilateral sources. For example, for FY03, MAFF’s Combined Resources Budget was $25.3 million, of which CFET allocation comprised only $1.4 million. MAFF prioritised its programs in relation to the requirements of the prioritisation and sequencing exercise, but also added to this
10 The Government Structures include the Office of the Prime Minister and Council of Ministers, Capacity Development Co-ordination Unit (CDCU), Provedor de Direitos Humanos e Justica (Ombudsman and Human Rights), Office of the Inspector General, Office for the Promotion of (gender) Equality, Independent Electoral Commission, Banking and Payments Authority, and Timor Sea Office.
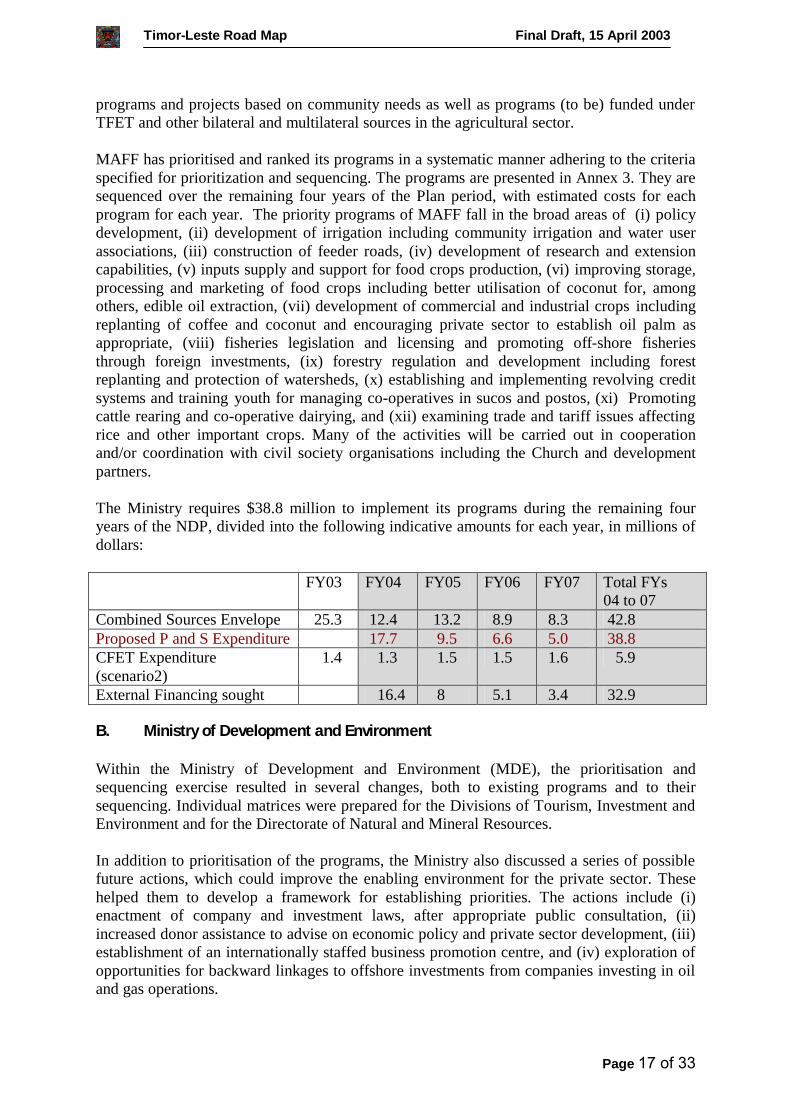
Timor-Leste Road Map Final Draft, 15 April 2003
Page 17 of 33
programs and projects based on community needs as well as programs (to be) funded under TFET and other bilateral and multilateral sources in the agricultural sector. MAFF has prioritised and ranked its programs in a systematic manner adhering to the criteria specified for prioritization and sequencing. The programs are presented in Annex 3. They are sequenced over the remaining four years of the Plan period, with estimated costs for each program for each year. The priority programs of MAFF fall in the broad areas of (i) policy development, (ii) development of irrigation including community irrigation and water user associations, (iii) construction of feeder roads, (iv) development of research and extension capabilities, (v) inputs supply and support for food crops production, (vi) improving storage, processing and marketing of food crops including better utilisation of coconut for, among others, edible oil extraction, (vii) development of commercial and industrial crops including replanting of coffee and coconut and encouraging private sector to establish oil palm as appropriate, (viii) fisheries legislation and licensing and promoting off-shore fisheries through foreign investments, (ix) forestry regulation and development including forest replanting and protection of watersheds, (x) establishing and implementing revolving credit systems and training youth for managing co-operatives in sucos and postos, (xi) Promoting cattle rearing and co-operative dairying, and (xii) examining trade and tariff issues affecting rice and other important crops. Many of the activities will be carried out in cooperation and/or coordination with civil society organisations including the Church and development partners. The Ministry requires $38.8 million to implement its programs during the remaining four years of the NDP, divided into the following indicative amounts for each year, in millions of dollars:
FY03 FY04 FY05 FY06 FY07 Total FYs
04 to 07 Combined Sources Envelope 25.3 12.4 13.2 8.9 8.3 42.8 Proposed P and S Expenditure 17.7 9.5 6.6 5.0 38.8 CFET Expenditure (scenario2)
1.4 1.3 1.5 1.5 1.6 5.9
External Financing sought 16.4 8 5.1 3.4 32.9 B. Ministry of Development and Environment Within the Ministry of Development and Environment (MDE), the prioritisation and sequencing exercise resulted in several changes, both to existing programs and to their sequencing. Individual matrices were prepared for the Divisions of Tourism, Investment and Environment and for the Directorate of Natural and Mineral Resources. In addition to prioritisation of the programs, the Ministry also discussed a series of possible future actions, which could improve the enabling environment for the private sector. These helped them to develop a framework for establishing priorities. The actions include (i) enactment of company and investment laws, after appropriate public consultation, (ii) increased donor assistance to advise on economic policy and private sector development, (iii) establishment of an internationally staffed business promotion centre, and (iv) exploration of opportunities for backward linkages to offshore investments from companies investing in oil and gas operations.

Timor-Leste Road Map Final Draft, 15 April 2003
Page 18 of 33
The Ministry's main priority programs/projects by Divisions are as follows: In the Division of Tourism:
? Website development for Tourism Promotion; and ? Legal and Regulatory Framework for Tourism.
In the Division of Investment:
? Production of Investment Literature including an Investor Information Kit; ? Organisation of Investment Forums; and ? Feasibility Studies for Investment Sectors.
In the Environment Division:
? Establishment of Environmental Impact Assessment (EIA) Regulations and Pollution monitoring and control regulations; and
? Formulation of a National Environment Policy. In the Directorate of Natural and Mineral Resources:
? Develop a core of 20 Highly-Skilled Oil and Gas Professionals; and ? Formulation of Mining and Petroleum Laws.
Details of the Ministry’s programs and their sequencing are outlined in Annex 3, together with estimated costs for each program, for each of the remaining four years of NDP implementation. The Ministry requires $ 3,210,682 million to implement its programs for the remaining years of the NDP, divided into the following indicative amounts for each year, in millions of dollars: FY03 FY04 FY05 FY06 FY07 Total FYs
04 to 07 Combined Sources Envelope 7.9 2.4 1.5 1.5 1.5 6.9 Proposed P and S Expenditure 1.5 0.5 0.5 0.4 3.2 CFET Expenditure(scenario2) 0.5 0.4 0.4 0.4 0.5 1.7 External Financing sought 1.1 0.1 0.1 -0.1 1.5 C. Ministry of Education, Youth, Culture and Sport The programs implemented by the Ministry of Education, Youth, Culture and Sport (MECYS) are crucial in meeting the aims of the NDP, particularly in the promotion of poverty reduction. In the Countrywide Consultation, a majority Timor-Leste’s population consulted ranked education as its number one priority among the top three priorities for the country. The Combined Sources budget allocations for the Ministry are the highest of any of the ministries, for each of the remaining years of NDP implementation. About a quarter of the CFET budget is allocated to MECYS for education. Similarly, more than a fifth of the projected bilateral aid from FY02 to FY06 is for education, as are one-fifth of the TFET resources.

Timor-Leste Road Map Final Draft, 15 April 2003
Page 19 of 33
The Ministry's current general priority requirements are to (i) build more primary and secondary schools to achieve universal basic education, (ii) improve the quality of education through teacher development and curriculum and textbook development, and (iii) strengthen the Ministry's capacity to plan and manage the provision of education. Thorough rigorous prioritisation and sequencing, the Ministry identified the most important gaps in the strategies and programs presented in the NDP. Building on this, they decided on program activities to be commenced during FY04 and subsequent years of the Plan period. The Ministry was concerned particularly with the mechanisms of service delivery for the main levels of education – at pe-primary, primary, junior and senior secondary levels, and technical and vocational education. It has also become concerned in recent months, at the low levels of execution of the Ministry’s FY03 budget, particularly in the goods & services and capital development areas. In discussions with staff through workshops and meetings, Department Directors in MECYS produced a sequencing of their priority programs with estimated costs. They indicated the level of priority for each of the activities in their area, the year they should commence, and an indicative cost for the activity in the medium-term. The Ministry’s proposed expenditures of $53.5 million for FY04 are somewhat above the Combined Sources Indicative Envelope of $45.8 million, but are below the latter for subsequent years, notably in FY07. This reflects the aim of the Ministry to focus expenditures on improving service delivery in the next two years. The Ministry’s priority programs for the remaining Plan period cover the broad areas of (i) managing and delivering education including at early childhood, primary, junior secondary and secondary levels as well as technical and vocational education, (ii) managing and delivering teacher training, (iii) managing and administering the Ministry’s functions at the central and district levels, (iv) developing an Education Management Information System (EMIS), (v) implementing the literacy program, (vi) development of textbooks and teaching materials, and (vii) implementation of cultural, youth and sports programs. The Ministry has selected a number of programs within the above areas on which it intends to focus in FY04. This emphasis in sequencing reflects the Ministry's concern to improve educational delivery in the short-term. The programs include (i) design and introduction of an information campaign on the importance of schooling, (ii) implementation of measures to reduce school drop-out and repetition rates, (iii) introduction of a Teaching Diploma and teacher, headmaster and educational manager training, (iv) language of instruction development (Tetun and Portuguese), (v) curriculum review and development including rehabilitation of the Institute of Continuing Education and strengthening its capacity, (vi) building the capacity of the Ministry for policy formulation, planning and project development, (vii) improving school quality through the Fundamental School Quality program, (viii) literacy campaign, (ix) training and structural support for youth employment, and (x) structuring and capacity building for sports institutions. Church, other private and community schools, which account for more than a fifth of all schools in the country, play an important role in the provision of primary and secondary education. In spite of the significant expansion of public schools visualised, it would be difficult for MECYS to meet the exponentially increasing demand for schooling brought

Timor-Leste Road Map Final Draft, 15 April 2003
Page 20 of 33
about by the population dynamics.11 Church, other private and community schools will continue to be important in delivery of education for the foreseeable future. Accordingly, the Ministry’s programs incorporate continued support to Church, other private and community schools. Details of the Ministry’s programs and their sequencing are outlined in Annex 3, together with estimated costs for each program, for each of the remaining years of NDP implementation. The Ministry requires $194.9 million to implement its programs for the remaining years of the NDP, divided into the following indicative amounts for each year, in millions of dollars: FY03 FY04 FY05 FY06 FY07 Total FYs
04 to 07 Combined Sources Envelope 45.8 39.4 33.9 33.7 33.2 186 Proposed P and S Expenditure 53.5 49.3 46.7 45.4 194.9 CFET Expenditure (scenario2) 18.3 16.2 17.9 18.8 19.5 96.4 External Financing sought 37.3 31.4 27.9 25.9 98.5 D. Ministry of Foreign Affairs and Cooperation The Ministry of Foreign Affairs and Cooperation (MFAC) has identified nine sub-programs, corresponding to its nine organisational divisions. Within these, areas are prioritised and sequenced for implementation in the remaining years of the NDP. The main areas/activities are (i) establishing the Office of the Director General, (ii) provision of policy advice to the Minster’s Office, (iii) management of the Ministry, (iv) establishing three Embassies with appropriate support facilities, (v) support for participation in international events, (vi) regional capacity building, (vii) development of Protocol Guidelines, (viii) completion of international treaties and national legislation ratifying these treaties, (ix) finalising country agreements with Development Partners, (x) strengthening the capacity of the Ministry, and (xi) finance, administration and human resources management. Details of these areas are presented in Annex 3, where the Ministry’s programs are sequenced over the remaining Plan years, together with sources of funding. Much of the Ministry’s work will be funded from grants from external Partners including international organisations, for particular activities fundamental to the Ministry’s work, such as attendance at international events and Embassy support. The Ministry requires $US 11.6 million to implement its programs for the remaining years of the NDP, divided into the following indicative amounts for each year, in millions of dollars: FY03 FY04 FY05 FY06 FY07 Total FYs
04 to 07 Combined Sources Envelope 1.2 1.1 1.1 1.1 1.1 4.4 Proposed P and S Expenditure 4.1 3.8 1.8 1.9 11.6 CFET Expenditure(scenario2) 1.2 1.1. 1.0 1.0 1.1 4.2 External Financing sought 3 2.8 0.8 0.8 7.4 11 About half the population of Timor-Leste is estimated to be below 16 years.

Timor-Leste Road Map Final Draft, 15 April 2003
Page 21 of 33
E. Ministry of Health Health provision is crucial for poverty reduction. Health was ranked second only to education in importance by the people of Timor-Leste in the Countrywide Consultation. In its implementation of NDP, the Ministry of Health has pursued several key strategies. Most notable among these are (i) emphasis on preventive and promotive health care, provided close to the community, with an additional aim of limiting expenditure on health care, (ii) adoption of primary health care policies that enable increased accessibility and coverage, and (iii) adoption of policies for integrating the health care system with other sectors. The strategies have been defined and further elaborated in East Timor’s Health Policy Framework, published by the Ministry in June 2002. In particular, the Framework defines a basic package of services for delivery within the districts. It outlines policies to decentralise the health service through more effective participation by local health workers and communities in the development and implementation of health programs. These two policy aims have been important for the Ministry in assessing its programs for prioritisation and sequencing. Monitoring of the activities in the FY03 AAPs including those covered under the Transition Support Program has also highlighted the importance of extending health care including through mobile clinics, particularly in poorer and more remote areas. In prioritisation of its programs, the Ministry has paid attention particularly to the objective of bringing health services closer to the population. It has also included proposals for improving both basic training for community health workers and the mobility of health personnel to facilitate service delivery to remote areas, which is one of the immediate priorities. Additionally, the Ministry has focused on identifying gaps in its programs within the framework of the NDP. In its prioritisation for the next four years, the Ministry will be implementing programs on (i) child health including immunisation, nutrition, growth monitoring, micronutrient distribution, breast-feeding and nutritional education, (ii) maternal health including antenatal care and safe motherhood, (iii) reproductive health, (iv) health promotion, with particular attention to schools, (v) control of communicable diseases including malaria and treatment of tuberculosis and diarrhoea, (vi) environmental health promotion, (vii) drugs and medical supplies, (vi) laboratory services, (vii) rehabilitative services, (viii) establishment of a Health Information System, and (ix) support for logistics and finance administration. Given their importance, these programs will continue throughout the remaining four years of the Plan period. Details of these programs and their sequencing are outlined in Annex 3, together with estimated costs for each program, for each of the remaining years of NDP implementation. The Health Sector requires $83.8 million to implement its programs for the remaining four years of the NDP, divided into the following indicative amounts, in millions of dollars:

Timor-Leste Road Map Final Draft, 15 April 2003
Page 22 of 33
FY03 FY04 FY05 FY06 FY07 Total FYs
04 to 07 Combined Sources Envelope 30.2 16.1 10.7 15.4 15.9 58.1 Proposed P and S Expenditure 24.6 28.6 15.3 15.2 83.8 CFET Expenditure(scenario2) 7.1 8.7 9.5 15.2 15.7 49.9 External Financing sought 15.9 19.1 0.1 -0.5 33.9 F. Ministry of Interior and State Administration Following a recent decision by the Council of Ministers, two new ministries have been created - the Ministry of the Interior and the Ministry of State Administration. The responsibilities and programs of the former Ministry of Internal Administration have been divided between these two new ministries. Consequently, the priorities decided upon by the former Ministry of Internal Affairs have now become priorities in the two new ministries, depending upon which areas of the former Ministerial portfolio have become their respective responsibilities. Prior to the Ministerial reorganisation, the former Ministry of Internal Administration (MIA) carried out a thorough assessment of its programs in relation to the requirements of the NDP. It identified gaps and focussed on the key issue of service delivery. Further, the Ministry paid attention to the immediate priorities including the need to legitimise the role of the Chefes de Suco and empower functionaries at the sub-national levels.
1. Ministry of Interior The new Ministry of Interior will be implementing former MIA programs in the areas of (i) Civil Security, (ii) Fire Rescue and Emergency Services, and (iii) National Disaster Management.
Details of these programs and their sequencing are outlined in Annex 3, together with estimated costs for each program, for each of the remaining years of NDP implementation. The new Ministry of Interior requires US$ 62.1 million to implement its programs for the remaining years of the NDP, divided into the following indicative amounts for each year, in millions of dollars. FY03 FY04 FY05 FY06 FY07 Total FYs
04 to 07 Proposed P and S Expenditure 18.7 13.2 14.8 15.2 62.1
2. Ministry for State Administration In the key area of local government administration, the ministry is concerned with improving the quality of its staff through detailed programs of training and capacity -building, and to improve the delivery of services to local communities. In this regard, the enactment of the law on local government and its implementation are considered crucial. This is rated to be a major priority for the Ministry.

Timor-Leste Road Map Final Draft, 15 April 2003
Page 23 of 33
Similarly, there is a strong focus on supporting and building the capacity of District Community Development Committees, and enabling local institutions and community-based groups to participate. In the local government area, the priority programs include (i) enactment of the Law on Local Government, specifying the roles and responsibilities of sub-national government administrations, (ii) strengthening the capacity of the Administration of Local Government staff in administration, management, finance and budgeting, (iii) creation and strengthening of institutional mechanisms for coordination of development activities in relatively disadvantaged regions/districts, and (iv) promotion of popular participation in economic, social and political processes, particularly by the poor and vulnerable groups. These areas will become the main priorities in the portfolio of the new Ministry for State Administration, which will also be implementing the former MIA programs for the Civil Service Academy, Public Service, Government publications including the Gazette, and maintenance and development of the National Archives. Details of these programs for the new ministry, and their sequencing are outlined in Annex 3, together with estimated costs for each program, for each of the remaining years of NDP implementation. The Ministry of State Administration requires US$ 30.1 million to implement its programs for the remaining years of the NDP, divided into the following indicative amounts for each year, in millions of dollars: FY03 FY04 FY05 FY06 FY07 Total FYs
04 to 07 Proposed P and S Expenditure 11.7 4.1 6.1 8.1 30.1
3. The Two Ministries Combined Since neither CFET expenditures nor Combined Sources Indicative Envelopes are available as yet for the two new ministries, their combined P and S Submission, together with their original CFET and Combined Sources envelopes, are presented below. FY03 FY04 FY05 FY06 FY07 Total FYs
04 to 07 Combined Sources Envelope 11.9 5.0 4.6 5.0 5.1 19.7 Proposed P and S Expenditure 30.4 17.3 20.9 23.3 92.2 CFET Expenditure(scenario2) 4.3 3.7 4.0 4.4 4.6 16.7 External Financing sought 26.7 13.3 16.5 18.7 75.5 The former Ministry of Internal Administration was and the present Ministry of Interior is also responsible for the Timor Leste Police Service (PNTL).
4. Timor Leste Police Service Considerable time has been spent by Timor Leste Police Service (PNTL) Section Heads in discussing the NDP planning process, with attention particularly to gaps in the programs specified originally in the NDP.
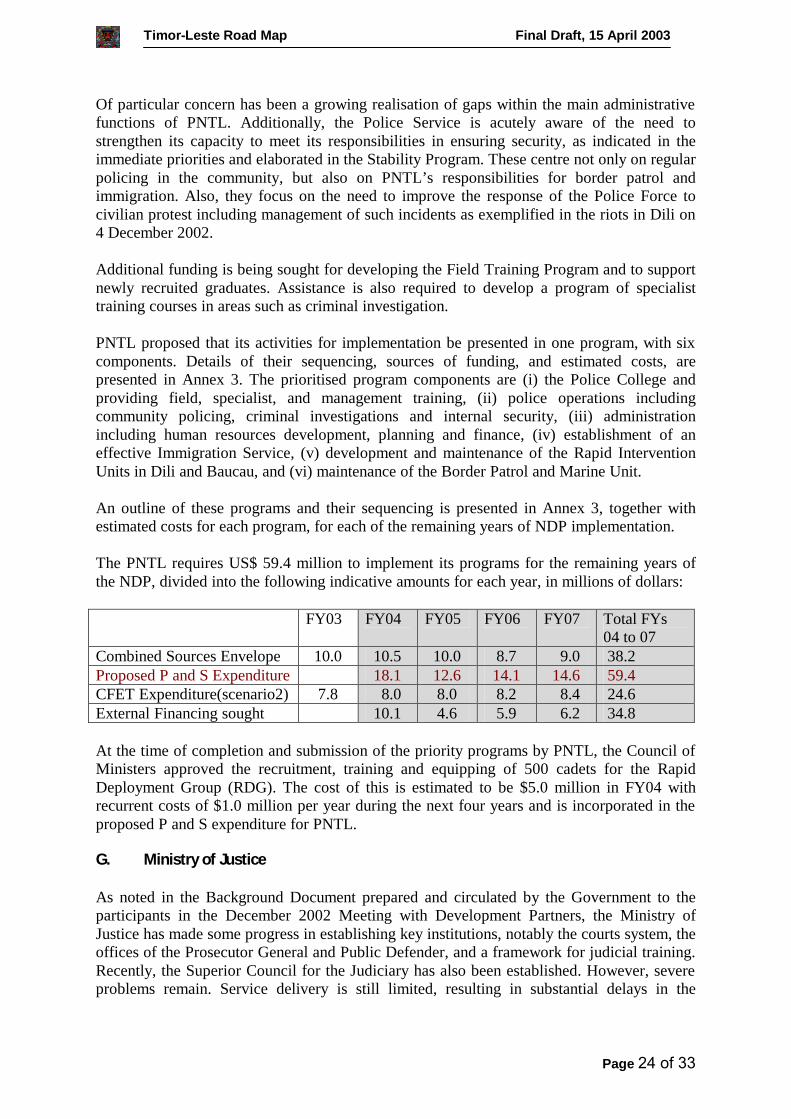
Timor-Leste Road Map Final Draft, 15 April 2003
Page 24 of 33
Of particular concern has been a growing realisation of gaps within the main administrative functions of PNTL. Additionally, the Police Service is acutely aware of the need to strengthen its capacity to meet its responsibilities in ensuring security, as indicated in the immediate priorities and elaborated in the Stability Program. These centre not only on regular policing in the community, but also on PNTL’s responsibilities for border patrol and immigration. Also, they focus on the need to improve the response of the Police Force to civilian protest including management of such incidents as exemplified in the riots in Dili on 4 December 2002. Additional funding is being sought for developing the Field Training Program and to support newly recruited graduates. Assistance is also required to develop a program of specialist training courses in areas such as criminal investigation. PNTL proposed that its activities for implementation be presented in one program, with six components. Details of their sequencing, sources of funding, and estimated costs, are presented in Annex 3. The prioritised program components are (i) the Police College and providing field, specialist, and management training, (ii) police operations including community policing, criminal investigations and internal security, (iii) administration including human resources development, planning and finance, (iv) establishment of an effective Immigration Service, (v) development and maintenance of the Rapid Intervention Units in Dili and Baucau, and (vi) maintenance of the Border Patrol and Marine Unit. An outline of these programs and their sequencing is presented in Annex 3, together with estimated costs for each program, for each of the remaining years of NDP implementation. The PNTL requires US$ 59.4 million to implement its programs for the remaining years of the NDP, divided into the following indicative amounts for each year, in millions of dollars: FY03 FY04 FY05 FY06 FY07 Total FYs
04 to 07 Combined Sources Envelope 10.0 10.5 10.0 8.7 9.0 38.2 Proposed P and S Expenditure 18.1 12.6 14.1 14.6 59.4 CFET Expenditure(scenario2) 7.8 8.0 8.0 8.2 8.4 24.6 External Financing sought 10.1 4.6 5.9 6.2 34.8 At the time of completion and submission of the priority programs by PNTL, the Council of Ministers approved the recruitment, training and equipping of 500 cadets for the Rapid Deployment Group (RDG). The cost of this is estimated to be $5.0 million in FY04 with recurrent costs of $1.0 million per year during the next four years and is incorporated in the proposed P and S expenditure for PNTL. G. Ministry of Justice As noted in the Background Document prepared and circulated by the Government to the participants in the December 2002 Meeting with Development Partners, the Ministry of Justice has made some progress in establishing key institutions, notably the courts system, the offices of the Prosecutor General and Public Defender, and a framework for judicial training. Recently, the Superior Council for the Judiciary has also been established. However, severe problems remain. Service delivery is still limited, resulting in substantial delays in the

Timor-Leste Road Map Final Draft, 15 April 2003
Page 25 of 33
presentation of cases, a large backlog of unresolved cases, inconsistent decision-making, and a limited legitimacy of legal authority. In its assessment of its programs, the Ministry has paid attention particularly to gaps in NDP implementation, notably in capacity building via recruitment and training. Addressing these needs is also intended to meet the requirements of the immediate priority to strengthen the justice system including both formal and customary systems in order to improve the provision of judicial services, through increasing the number of jurists, and enhancing the quality and delivery of services including provision of adequate legal assistance. Further, it is to cater to improved institutional co-ordination and increased community awareness of laws and legal procedures. The Ministry has prioritised a set of programs for implementation in the remaining four years of the Plan period. These are presented in Annex 3, with sequencing and indicative funding requirements. The priority programs are in the following areas:
a. Service Delivery through District Courts, Public Defender's Office, Office of the Prosecutor-General, Appeals Court, and the Superior Council for the Judiciary. This will include the recruitment of international judges, prosecutors, defence lawyers, court clerks and interpreters, promoting the use of functional registries, and improving internal reporting systems;
b. Improving the Prison system including recruitment of international trainers to train Timorese trainers of Prison Guards, and organising vocational training, work programs and literacy classes for detainees;
c. Capacity building through the Judiciary Training Centre; d. Framework for legal Consistency through assessment and legislation; e. Land and Property, Civil Registry, Notary, and Administration; and f. Strengthening and providing assistance for mediation and resolution mechanisms at
national, district, sub-district and community levels. The Ministry requires $21.5 million to implement its programs for the remaining years of the NDP, divided into the following indicative amounts for each year, in millions of dollars: FY03 FY04 FY05 FY06 FY07 Total FYs
04 to 07 Combined Sources Envelope 9.2 4.4 3.9 3.8 3.7 15.8 Proposed P and S Expenditure 8.7 4.8 4.4 3.6 21.5 CFET Expenditure(scenario2) 2.2 2.2 2.2 2.2 2.3 8.9 External Financing sought 6.5 2.6 2.2 1.3 12.6 H. Ministry of Planning and Finance For implementation of NDP, the Ministry of Planning and Finance (MPF) has established a framework for sustainable public sector financial management, administration and accountability. The Ministry has eight Divisions: Treasury, Budget, East Timor Revenue Service, Customs, Government Procurement Supply and Inventory, Statistics, Macroeconomic and Taxation Policies, Administration and Information Technology, and Planning and External Assistance Management. Several of these Divisions are proposing new initiatives for funding during the remaining years of the NDP, based upon their
Timor-Leste Road Map Final Draft, 15 April 2003
Page 26 of 33
implementation experiences during FY03, and taking into consideration the immediate priorities. In addition to its ongoing functions of budget formulation and management, the Budget Division aims to focus on substantial capacity building activities for national staff, through the provision of on-the-job training, mentoring, short courses, and targeted training in financial management and budget execution. Similarly, in tandem with its work to oversee and report on the execution of the budget, payroll and maintenance of public accounts, the Treasury is developing systems for mentoring and on-the-job training for local staff. In addition to its functions of overseeing tax collection and developing the Government's taxation administration system, the East Timor Revenue Service intends to spend 25% of its budget on developing capacity for Timor Sea taxation officers through attendance at courses, workshops and in-house training. Similarly, a substantial proportion of the expenditure of the Division of Administration and Information Technology will be devoted to designing and carrying out a needs assessment study and a human resources development plan for strengthening IT provision within the Ministry. To improve its work in revenue policy and forecasting, the Macroeconomic and Tax Policy Program intends to devote approximately a quarter of its budget to improving local staff knowledge of international best practices. The Procurement Unit is devoting over half of its planned expenditures for FY04 to revising procurement regulations, in an attempt to improve levels of transparency and competitiveness and increased conformity with international guidelines. In developing a strategy for wider information gathering by agencies, and for improved co-ordination and dissemination, the Statistics Department is focusing on the need to develop the National Accounts required by the NDP, both sectorally and in relation to the overall measurement of economic growth and poverty reduction. The Planning and External Assistance Management Division (PEAMD) performs a crucial role within the Ministry, overseeing and monitoring NDP implementation, mobilising support for the Plan, engaging donors, detailing donor funding, and disseminating information to stakeholders. Its priority programs/program components are particularly important for planning and mobilising resources for Plan implementation. The latter includes notably the establishment and maintenance of an effective data management system to register and facilitate monitoring of all external assistance. The programs prioritised by the Ministry of Planning and Finance are presented in Annex 3, with sequencing, estimated costs, and indicative sources of funding, for each of the remaining years of NDP implementation. The Ministry is requesting $ 22.4 million to implement its programs for the remaining years of the NDP, divided into the following indicative amounts for each year, in millions of dollars:
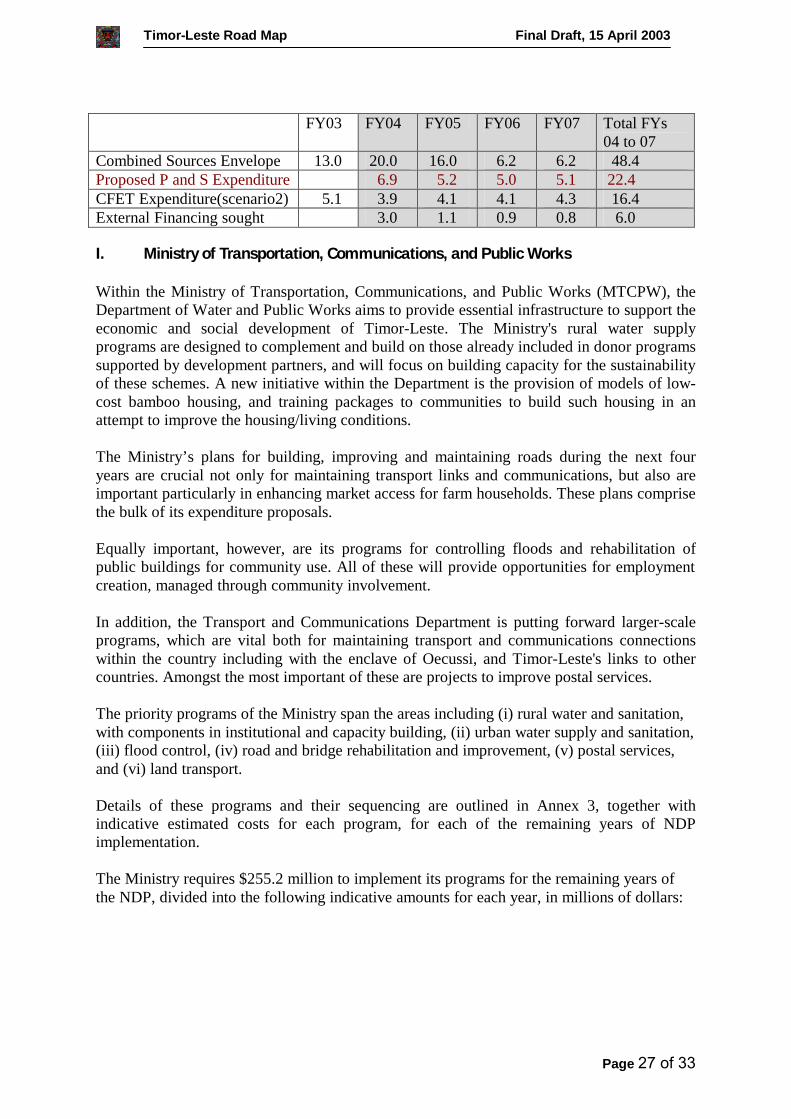
Timor-Leste Road Map Final Draft, 15 April 2003
Page 27 of 33
FY03 FY04 FY05 FY06 FY07 Total FYs
04 to 07 Combined Sources Envelope 13.0 20.0 16.0 6.2 6.2 48.4 Proposed P and S Expenditure 6.9 5.2 5.0 5.1 22.4 CFET Expenditure(scenario2) 5.1 3.9 4.1 4.1 4.3 16.4 External Financing sought 3.0 1.1 0.9 0.8 6.0 I. Ministry of Transportation, Communications, and Public Works Within the Ministry of Transportation, Communications, and Public Works (MTCPW), the Department of Water and Public Works aims to provide essential infrastructure to support the economic and social development of Timor-Leste. The Ministry's rural water supply programs are designed to complement and build on those already included in donor programs supported by development partners, and will focus on building capacity for the sustainability of these schemes. A new initiative within the Department is the provision of models of low-cost bamboo housing, and training packages to communities to build such housing in an attempt to improve the housing/living conditions. The Ministry’s plans for building, improving and maintaining roads during the next four years are crucial not only for maintaining transport links and communications, but also are important particularly in enhancing market access for farm households. These plans comprise the bulk of its expenditure proposals. Equally important, however, are its programs for controlling floods and rehabilitation of public buildings for community use. All of these will provide opportunities for employment creation, managed through community involvement. In addition, the Transport and Communications Department is putting forward larger-scale programs, which are vital both for maintaining transport and communications connections within the country including with the enclave of Oecussi, and Timor-Leste's links to other countries. Amongst the most important of these are projects to improve postal services. The priority programs of the Ministry span the areas including (i) rural water and sanitation, with components in institutional and capacity building, (ii) urban water supply and sanitation, (iii) flood control, (iv) road and bridge rehabilitation and improvement, (v) postal services, and (vi) land transport. Details of these programs and their sequencing are outlined in Annex 3, together with indicative estimated costs for each program, for each of the remaining years of NDP implementation. The Ministry requires $255.2 million to implement its programs for the remaining years of the NDP, divided into the following indicative amounts for each year, in millions of dollars:

Timor-Leste Road Map Final Draft, 15 April 2003
Page 28 of 33
FY03 FY04 FY05 FY06 FY07 Total FYs
04 to 07 Combined Sources Envelope 40.5 31.9 30.1 27.3 25.7 115.0 Proposed P and S Expenditure 68.9 61.7 60.6 63.9 255.2 CFET Expenditure(scenario2) 4.7 6.9 7.1 6.9 7.1 28 External Financing sought 62.0 54.6 53.7 56.8 227.2 J. Secretary of State for Defence The Secretary of State for Defence (SSD) has undertaken a thorough review of its programs, particularly in relation to the requirements of the NDP and the immediate priorities. It has put forward three programs, all of which it considers to be of equal priority. These are (i) Defence Organisation, with components covering recruitment and training, (ii) procurement of equipment and supplies, and (iii) facilities development and maintenance. Details of these programs and their estimated sequenced costings are outlined in Annex 3. The first program, Defence Organisation, is the overarching program in the effort to improve Timor-Leste’s defence. The other two programs underpin this effort. Sequencing is particularly important in the implementation of SSD’s programs. For example, current facilities for the Defence Force of Timor-Leste (FDTL) are inadequate, and the strategic location and training of battalions is dependent on the construction and refurbishment of buildings, planned during FY04. Total expenditure proposed by SSD for FY04 is $10.6 million as compared to the current indicative Combined Sources Funding Envelope of $8.4 million. However, for subsequent years, proposed expenditures are within indicative envelopes. The Secretary of State for Defence requires $29.1 million to implement its programs for the remaining years of the NDP, divided into the following indicative amounts for each year, in millions of dollars: FY03 FY04 FY05 FY06 FY07 Total FYs
04 to 07 Combined Sources Envelope 6.6 8.4 7.8 7.9 8.0 32.1 Proposed P and S Expenditure 8.7 6.8 6.8 6.8 29.1 CFET Expenditure(scenario2) 4.4 6.0 6.1 6.1 6.3 24.5 External Financing sought 2.7 0.7 0.7 0.5 4.6 K. Secretary of State for Labour and Solidarity The Secretary of State for Labour and Solidarity (SSLS) has undertaken a detailed review of its programs implemented within the NDP, noting in particular gaps in its provision, and the requirements of the immediate priorities. The latter is particularly important, in that Labour and Solidarity has been developing programs in important areas such as vocational training including the setting up and strengthening of training centers, the development of a labour market database, and the dissemination of information on employment opportunities.

Timor-Leste Road Map Final Draft, 15 April 2003
Page 29 of 33
In other crucial areas such as the provision of social services for children and the disabled, programs have been redefined to improve service delivery. The women's unit is placing greater emphasis in its programs on the provision of skills training to women for setting up small businesses. The Secretary of State’s prioritised and sequenced programs reflect the results of its program review, with a strong emphasis on the funding requirements for assisting the veterans. In each of the remaining years of NDP implementation, almost one-half of the expenditures will be devoted to veterans’ programs. The priority programs fall in the areas of (i) Veterans’ Affairs, (ii) employment and skills development, (iii) worker protection and industrial relations, (iv) staff training and skills development, (v) provision of social services for children, (vi) development of the Women's Unit, (vii) provision of social services for the disabled, and (viii) development of the Emergency and Humanitarian Assistance Unit. An outline of the programs put forward by the Secretary of State for Labour and Solidarity, together with sources of funding and the expenditure required in each year of NDP implementation are provided in Annex 3. The Secretariat requires $25.9 million to implement its programs for the remaining years of the NDP, divided into the following indicative amounts for each year, in millions of dollars: FY03 FY04 FY05 FY06 FY07 Total FYs
04 to 07 Combined Sources Envelope* 10.9 10.3 10.0 10.0 9.2 39.5 Proposed P and S Expenditure 17.2 2.8 2.8 3.0 25.9 CFET Expenditure(scenario2) 0.5 0.4 0.4 0.5 0.5 1.8 External Financing sought 16.8 2.4 2.3 2.5 24.1 * The Combined Sources indicative envelope figures presented in this table contain significant bilateral funds, of approximately US$ 9.5 million annually, provided to the Secretary of State for emergency food distribution.
CFET allocations for the Secretary of State are limited, at a projected average of less than $0.5 million for the remaining years of the NDP. Hence, substantial bilateral funding will be required for the implementation of its prioritised programs. L. Secretary of State for Commerce and Industry The Secretary of State for Commerce and Industry comprises two Divisions – Industry and Trade. The priorities for each of the Divisions are: In the Division of Industry:
? Regulatory Requirements for Industrial and Economic Zones; ? Development Policy Framework for Micro-Finance/Credit for small and medium size
enterprises. In the Division of Trade:
? Support for Export-related Industry Inclusion in an Industrial Zone; ? Domestic Trade Promotion and Domestic Market Linkages.
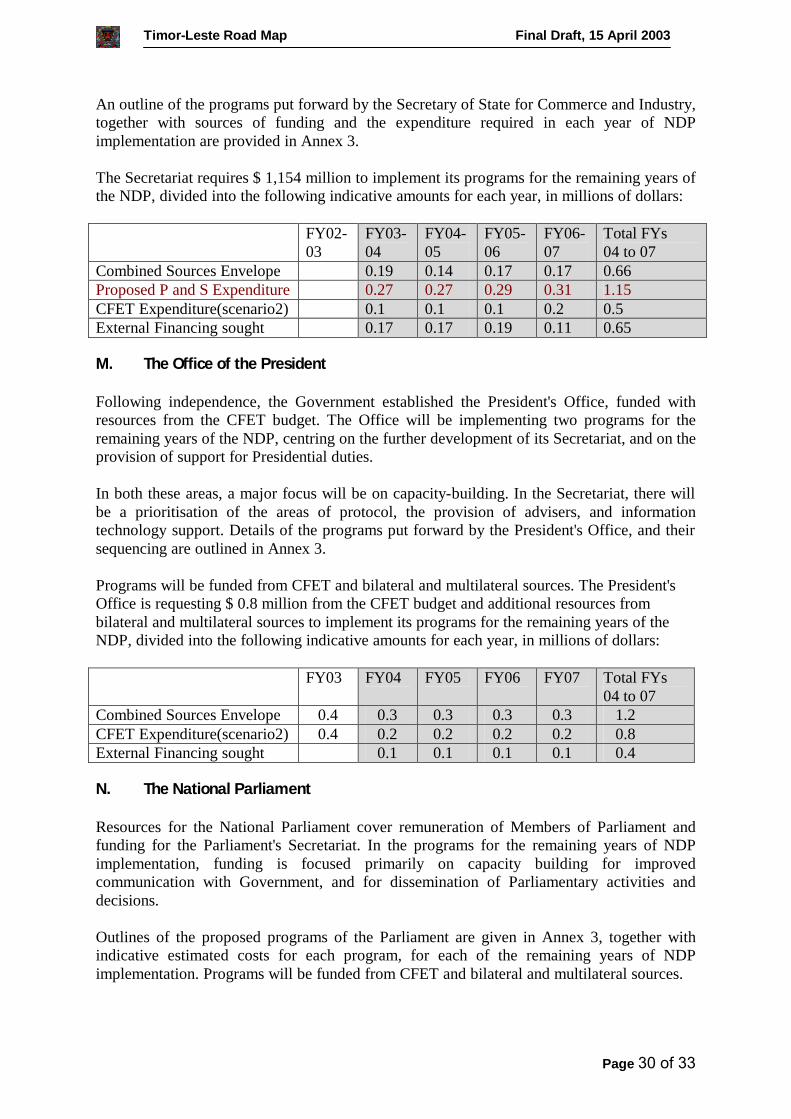
Timor-Leste Road Map Final Draft, 15 April 2003
Page 30 of 33
An outline of the programs put forward by the Secretary of State for Commerce and Industry, together with sources of funding and the expenditure required in each year of NDP implementation are provided in Annex 3. The Secretariat requires $ 1,154 million to implement its programs for the remaining years of the NDP, divided into the following indicative amounts for each year, in millions of dollars: FY02-
03 FY03-04
FY04-05
FY05-06
FY06-07
Total FYs 04 to 07
Combined Sources Envelope 0.19 0.14 0.17 0.17 0.66 Proposed P and S Expenditure 0.27 0.27 0.29 0.31 1.15 CFET Expenditure(scenario2) 0.1 0.1 0.1 0.2 0.5 External Financing sought 0.17 0.17 0.19 0.11 0.65 M. The Office of the President Following independence, the Government established the President's Office, funded with resources from the CFET budget. The Office will be implementing two programs for the remaining years of the NDP, centring on the further development of its Secretariat, and on the provision of support for Presidential duties. In both these areas, a major focus will be on capacity-building. In the Secretariat, there will be a prioritisation of the areas of protocol, the provision of advisers, and information technology support. Details of the programs put forward by the President's Office, and their sequencing are outlined in Annex 3. Programs will be funded from CFET and bilateral and multilateral sources. The President's Office is requesting $ 0.8 million from the CFET budget and additional resources from bilateral and multilateral sources to implement its programs for the remaining years of the NDP, divided into the following indicative amounts for each year, in millions of dollars: FY03 FY04 FY05 FY06 FY07 Total FYs
04 to 07 Combined Sources Envelope 0.4 0.3 0.3 0.3 0.3 1.2 CFET Expenditure(scenario2) 0.4 0.2 0.2 0.2 0.2 0.8 External Financing sought 0.1 0.1 0.1 0.1 0.4 N. The National Parliament Resources for the National Parliament cover remuneration of Members of Parliament and funding for the Parliament's Secretariat. In the programs for the remaining years of NDP implementation, funding is focused primarily on capacity building for improved communication with Government, and for dissemination of Parliamentary activities and decisions. Outlines of the proposed programs of the Parliament are given in Annex 3, together with indicative estimated costs for each program, for each of the remaining years of NDP implementation. Programs will be funded from CFET and bilateral and multilateral sources.

Timor-Leste Road Map Final Draft, 15 April 2003
Page 31 of 33
The Parliament is requesting $9.4 million to implement its programs for the remaining years of the NDP, divided into the following indicative amounts for each year, in millions of dollars: FY03 FY04 FY05 FY06 FY07 Total FYs
04 to 07 Combined Sources Envelope 3.4 1.0 1.0 1.0 1.0 4.0 Proposed P and S Expenditure 1.2 6.2 1.0 1.0 9.4 CFET Expenditure(scenario2) 0.9 0.8 0.8 0.8 0.8 3.2 External Financing sought 0.4 5.4 0.2 0.2 6.2 O. State National Security Service The formation of the Servico Nacional de Seguranca do Estado (SNSE) was approved in September 2002 (under Organic Law 3/2002). As stated in its prioritisation and sequencing documentation, the objective of the SNSE is to provide early warning of politically motivated violence and other actions detrimental to national security. Initial funding for the SNSE was provided from the Prime Minister's Contingency Fund. SNSE is requesting funding for the collection and analysis of information, and for the dissemination of intelligence. Details of SNSE's programs and their sequencing are outlined in Annex 3, together with indicative estimated costs for each of the remaining years of NDP implementation. The SNSE requires $ 0.4 million to implement its programs for the remaining years of the NDP, divided into the following indicative amounts for each year, in millions of dollars: FY03 FY04 FY05 FY06 FY07 Total FYs
04 to 07 Proposed P and S Expenditure 0.1 0.1 0.1 0.1 0.4 Combined Sources Envelope CFET Expenditure(scenario2) Figures for the SNSE's CFET budget and indicative Combined Sources Funding Envelopes are not yet available. P. Government Structures The Government Structures Portfolio represents those organisations that are not overseen directly by a Minister or Secretary of State. Their functions are described in detail in the Combined Sources Budget Document (2002-03). For the prioritisation and sequencing exercise, a number of changes have been made in constituent programs, in relation particularly to observed gaps in NDP implementation, and the immediate priorities. New initiatives are the creation of the Timor Sea Office to provide legal and negotiating advice to the Prime Minister and the Council of Ministers, and the moving of the Capacity Development and Co-ordination Unit into the Prime Minister's Office. This move reflects the priority given to CDCU's work in co-ordinating capacity building in the ministries through the appointment of focal persons to deal specifically with capacity building in each ministry and agency (Secretary of State).

Timor-Leste Road Map Final Draft, 15 April 2003
Page 32 of 33
The Office for the Promotion of Equality has reorganised its programs to create a more effective approach to gender mainstreaming in policy development through ongoing training in both government institutions and civil society organisations. Details of the constituent organisations of the government structures, and their sequencing, together with sources of funding, are outlined in Annex 3, together with indicative estimated costs for each of the remaining years of NDP implementation. These are summarised in the following: Structure FY03 FY04 FY05 FY06 FY07 Total FYs 04 to 07 Office of the Prime Minister and Council of Ministers
CS PS CFT
22.3 19.0
7.0
14.8
8.7
14.8
8.7
14.8
8.7
63.4
33.1 Capacity Development Co-ordination Unit (CDCU) *
CS PS CFT
30.12
20.05
10.05
0.052
60.27
Provedor de Direitos Humanos e Justica
PS CS CFT
0.06
0.05
0.05
0.07
0.07
0.24 Office of the Inspector General
CS PS CFT
0.05
0.63
0.37 0.13 0.05
0.09 0.07 0.05
0.09 0.07 0.05
0.09 0.07 0.05
0.64 0.34 0.20
Office for the Promotion of Equality
CS PS CFT
0.29
0.04
0.12 0.07 0.04
0.04 0.03 0.04
0.04 0.03 0.04
0.04 0.03 0.04
0.24 0.16 0.16
Independent Electoral Commission
CS PS CFT
2.09
0.06
0.54
0.06
0.64
0.06
0.63
0.06
0.63
0.06
2.44
0.24 Banking and Payments Authority
CS PS CFT
2.22
1.08
1.18
0.61
0.58
0.58
0.54
0.54
0.54
0.54
2.84
2.81 Timor Sea Office
CS PS CFT
0. 22 0.13
0.22
0.22 0.24
0.22 0.22
0.66 0.68
CS – Combined Sources Envelope; PS - Proposed P and S Expenditure; and CFT - CFET Expenditure (scenario2) * No figures are yet available for CDCU indicative envelopes or CFET expenditure. Q. The Oecussi Enclave In addition to the programs prioritised above, the Government is also requesting funding for programs to be implemented in Oecussi, due to the difficulties of its current situation. These are to be implemented during the next eighteen months. The programs are:
? Ferry Service; ? Communications; ? Cattle Raising; ? Improving Rice Yields; ? Small-Scale Agro-Processing, including improved rice-milling; ? Tourism Development; ? Bricks and other construction materials to supply to the local market; ? Furniture production for the local market; ? Development of small-scale industries and services; ? Strengthening of new Vocational Training Centre; ? Aquaculture; ? Production of Eucalyptus oil; and,

Timor-Leste Road Map Final Draft, 15 April 2003
Page 33 of 33
? Replanting of sandalwood Total funding required for these activities is estimated at $2.4 million. The rationale for some of programs and the cost estimates for each of these programs are provided in the Stability Program in Annex 2. These programs have not yet been allocated to the respective ministries.
CONCLUSION In presenting the Government’s priorities in each sector, the Road Map has attempted to provide a basis for the Policy Dialogue between the Government and its Development Partners. The document has outlined both the main development priorities for each ministry, and the reasons for their prioritisation, under conditions of resource constraints. The information in the Road Map provides the detailed knowledge and understanding required for Government ministries and Development Partners to work together to finalise the funding arrangements for Timor-Leste’s programs for the remaining years of the NDP.

Annex to Part One
Table 1: CFET Revenue and MYBU Forward Estimates of Expenditure
FY02 FY03 FY04 FY05 FY06 FY07* Revenue (not FTP) 52.0 70.6 75.0 72.7 57.5 60.3 Timor Sea (not FTP) 6.5 23.8 36.2 35.6 37.8 39.6 Domestic Revenue 20.5 17.5 17.5 18.5 19.7 20.7 TSP Grants 26.0 29.3 21.3 18.6 0.0 0.0 Expenditure (MYBU) 53.1 74.2 80.0 92.9 102.4 105.0 Capital & Development 0.0 7.0 10.0 20.0 25.0 25.0 Recurrent 53.1 67.2 70.0 72.9 77.4 80.0 Funding Shortage 5.0 20.2 45.1 44.7 Revenue (with FTP) 56.3 71.6 86.8 96.6 83.0 86.5 Funding Shortage 19.4 18.5
FTP – First Tranche of Petroleum (revenues). * The MYBU had no estimates for FY07. Recurrent expenditure is estimated to grow by 2.5 per cent. The MYBU forward estimates do not include revisions due to any changes in wages, or in subsidies to the Power Authority.
Table 2: MYBU and Reduced Expenditure Scenarios
FY03 FY04 FY05 FY06 FY07 Scenario 1 (MYBU) Expenditure Total 74.2 82.0 92.9 102.5 105.0 Recurrent 60.7 67.1 70.3 77.4 80.0 Power Subsidy 6.5 4.9 2.6 0.0 0.0 Capital & Development 7.0 10.0 20.0 25.0 25.0 Funding Shortage 5.0 20.2 45.1 44.7 Scenario 2 Expenditure Total 74.2 72.0 73.9 80.4 85.0 Recurrent 60.7 62.1 65.3 72.4 75.0 Power Subsidy 6.5 4.9 2.6 0.0 0.0 Capital & Development 7.0 5.0 6.0 8.0 10.0 Funding Shortage 1.2 18.0 24.7
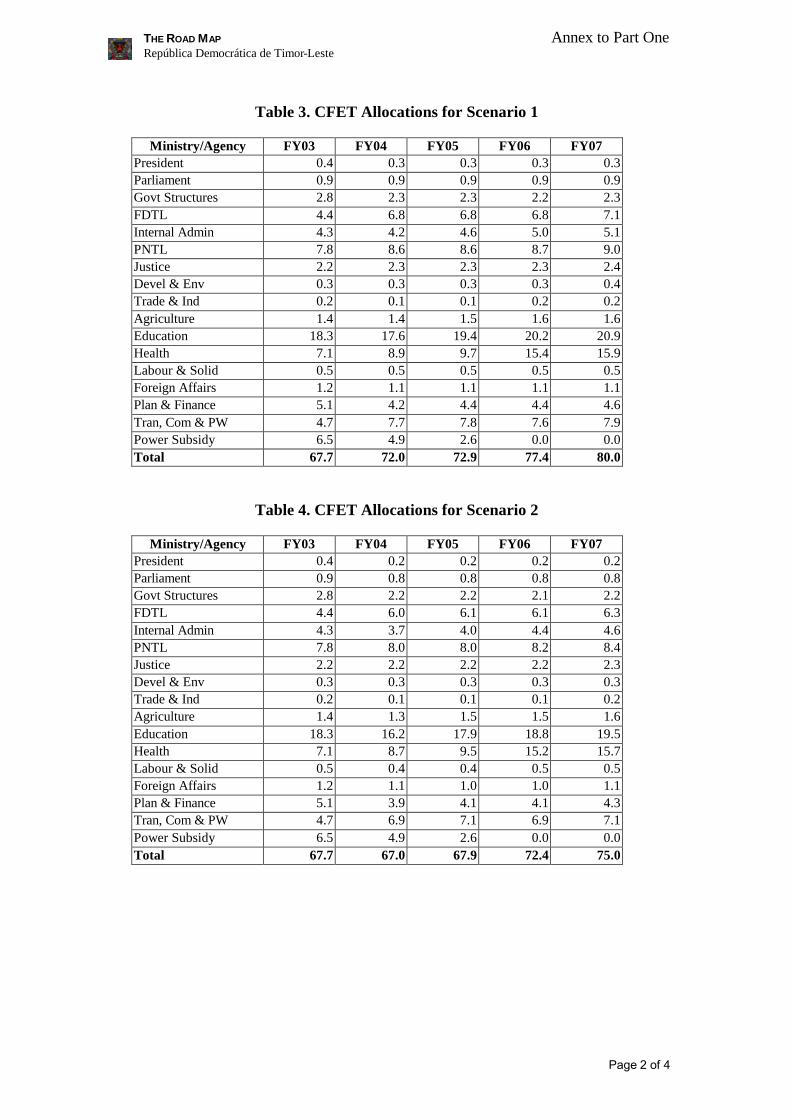
THE ROAD MAP Annex to Part One República Democrática de Timor-Leste
Page 2 of 4
Table 3. CFET Allocations for Scenario 1
Ministry/Agency FY03 FY04 FY05 FY06 FY07
President 0.4 0.3 0.3 0.3 0.3 Parliament 0.9 0.9 0.9 0.9 0.9 Govt Structures 2.8 2.3 2.3 2.2 2.3 FDTL 4.4 6.8 6.8 6.8 7.1 Internal Admin 4.3 4.2 4.6 5.0 5.1 PNTL 7.8 8.6 8.6 8.7 9.0 Justice 2.2 2.3 2.3 2.3 2.4 Devel & Env 0.3 0.3 0.3 0.3 0.4 Trade & Ind 0.2 0.1 0.1 0.2 0.2 Agriculture 1.4 1.4 1.5 1.6 1.6 Education 18.3 17.6 19.4 20.2 20.9 Health 7.1 8.9 9.7 15.4 15.9 Labour & Solid 0.5 0.5 0.5 0.5 0.5 Foreign Affairs 1.2 1.1 1.1 1.1 1.1 Plan & Finance 5.1 4.2 4.4 4.4 4.6 Tran, Com & PW 4.7 7.7 7.8 7.6 7.9 Power Subsidy 6.5 4.9 2.6 0.0 0.0 Total 67.7 72.0 72.9 77.4 80.0
Table 4. CFET Allocations for Scenario 2
Ministry/Agency FY03 FY04 FY05 FY06 FY07 President 0.4 0.2 0.2 0.2 0.2 Parliament 0.9 0.8 0.8 0.8 0.8 Govt Structures 2.8 2.2 2.2 2.1 2.2 FDTL 4.4 6.0 6.1 6.1 6.3 Internal Admin 4.3 3.7 4.0 4.4 4.6 PNTL 7.8 8.0 8.0 8.2 8.4 Justice 2.2 2.2 2.2 2.2 2.3 Devel & Env 0.3 0.3 0.3 0.3 0.3 Trade & Ind 0.2 0.1 0.1 0.1 0.2 Agriculture 1.4 1.3 1.5 1.5 1.6 Education 18.3 16.2 17.9 18.8 19.5 Health 7.1 8.7 9.5 15.2 15.7 Labour & Solid 0.5 0.4 0.4 0.5 0.5 Foreign Affairs 1.2 1.1 1.0 1.0 1.1 Plan & Finance 5.1 3.9 4.1 4.1 4.3 Tran, Com & PW 4.7 6.9 7.1 6.9 7.1 Power Subsidy 6.5 4.9 2.6 0.0 0.0 Total 67.7 67.0 67.9 72.4 75.0
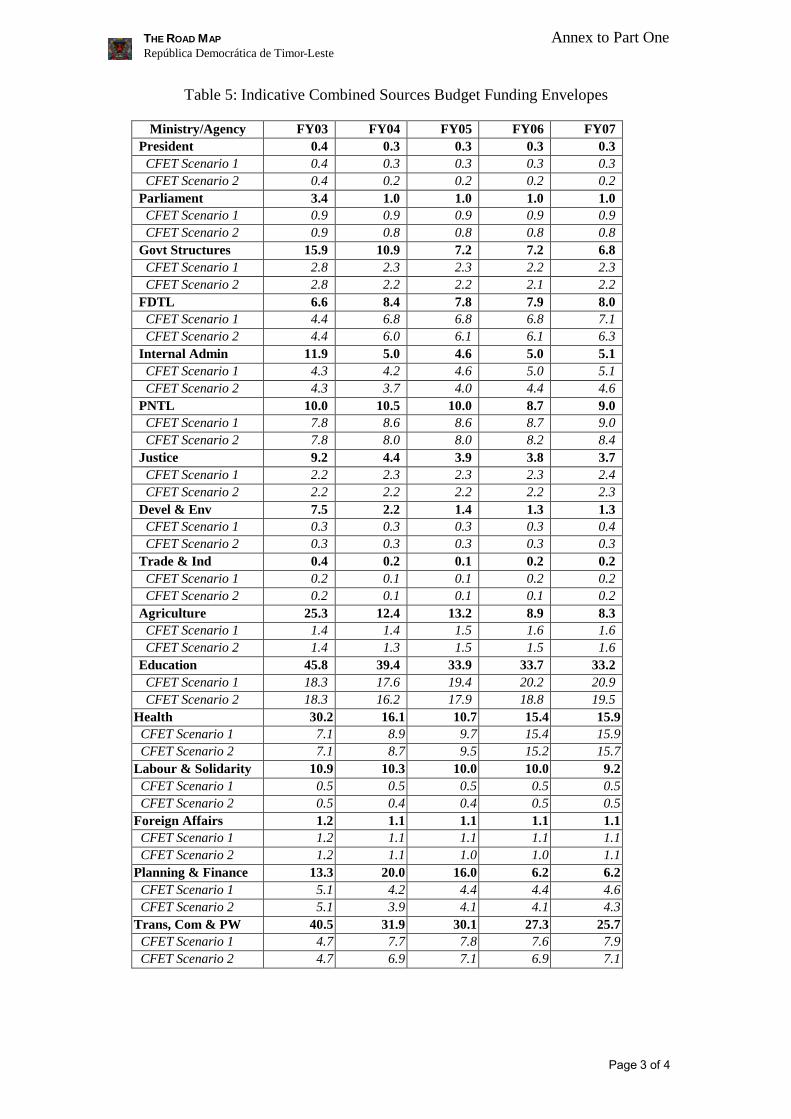
THE ROAD MAP Annex to Part One República Democrática de Timor-Leste
Page 3 of 4
Table 5: Indicative Combined Sources Budget Funding Envelopes
Ministry/Agency FY03 FY04 FY05 FY06 FY07 President 0.4 0.3 0.3 0.3 0.3 CFET Scenario 1 0.4 0.3 0.3 0.3 0.3 CFET Scenario 2 0.4 0.2 0.2 0.2 0.2 Parliament 3.4 1.0 1.0 1.0 1.0 CFET Scenario 1 0.9 0.9 0.9 0.9 0.9 CFET Scenario 2 0.9 0.8 0.8 0.8 0.8 Govt Structures 15.9 10.9 7.2 7.2 6.8 CFET Scenario 1 2.8 2.3 2.3 2.2 2.3 CFET Scenario 2 2.8 2.2 2.2 2.1 2.2 FDTL 6.6 8.4 7.8 7.9 8.0 CFET Scenario 1 4.4 6.8 6.8 6.8 7.1 CFET Scenario 2 4.4 6.0 6.1 6.1 6.3 Internal Admin 11.9 5.0 4.6 5.0 5.1 CFET Scenario 1 4.3 4.2 4.6 5.0 5.1 CFET Scenario 2 4.3 3.7 4.0 4.4 4.6 PNTL 10.0 10.5 10.0 8.7 9.0 CFET Scenario 1 7.8 8.6 8.6 8.7 9.0 CFET Scenario 2 7.8 8.0 8.0 8.2 8.4 Justice 9.2 4.4 3.9 3.8 3.7 CFET Scenario 1 2.2 2.3 2.3 2.3 2.4 CFET Scenario 2 2.2 2.2 2.2 2.2 2.3 Devel & Env 7.5 2.2 1.4 1.3 1.3 CFET Scenario 1 0.3 0.3 0.3 0.3 0.4 CFET Scenario 2 0.3 0.3 0.3 0.3 0.3 Trade & Ind 0.4 0.2 0.1 0.2 0.2 CFET Scenario 1 0.2 0.1 0.1 0.2 0.2 CFET Scenario 2 0.2 0.1 0.1 0.1 0.2 Agriculture 25.3 12.4 13.2 8.9 8.3 CFET Scenario 1 1.4 1.4 1.5 1.6 1.6 CFET Scenario 2 1.4 1.3 1.5 1.5 1.6 Education 45.8 39.4 33.9 33.7 33.2 CFET Scenario 1 18.3 17.6 19.4 20.2 20.9 CFET Scenario 2 18.3 16.2 17.9 18.8 19.5
Health 30.2 16.1 10.7 15.4 15.9 CFET Scenario 1 7.1 8.9 9.7 15.4 15.9 CFET Scenario 2 7.1 8.7 9.5 15.2 15.7 Labour & Solidarity 10.9 10.3 10.0 10.0 9.2 CFET Scenario 1 0.5 0.5 0.5 0.5 0.5 CFET Scenario 2 0.5 0.4 0.4 0.5 0.5 Foreign Affairs 1.2 1.1 1.1 1.1 1.1 CFET Scenario 1 1.2 1.1 1.1 1.1 1.1 CFET Scenario 2 1.2 1.1 1.0 1.0 1.1 Planning & Finance 13.3 20.0 16.0 6.2 6.2 CFET Scenario 1 5.1 4.2 4.4 4.4 4.6 CFET Scenario 2 5.1 3.9 4.1 4.1 4.3 Trans, Com & PW 40.5 31.9 30.1 27.3 25.7 CFET Scenario 1 4.7 7.7 7.8 7.6 7.9 CFET Scenario 2 4.7 6.9 7.1 6.9 7.1
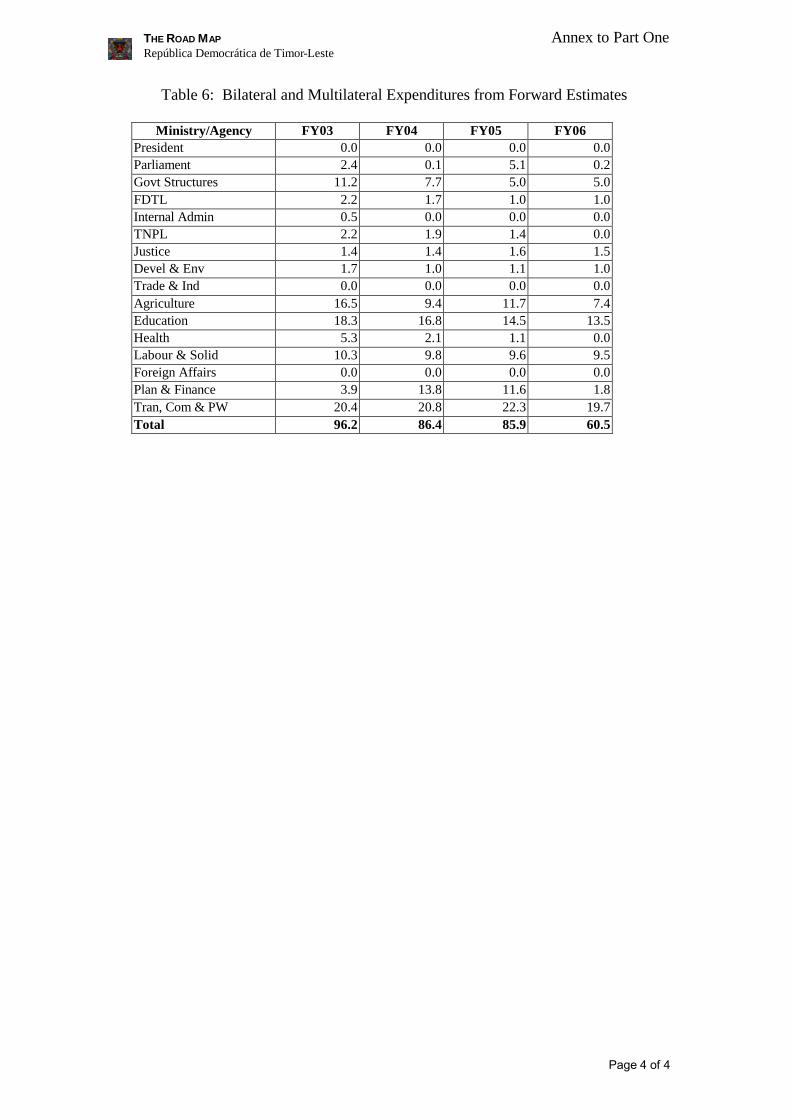
THE ROAD MAP Annex to Part One República Democrática de Timor-Leste
Page 4 of 4
Table 6: Bilateral and Multilateral Expenditures from Forward Estimates
Ministry/Agency FY03 FY04 FY05 FY06 President 0.0 0.0 0.0 0.0 Parliament 2.4 0.1 5.1 0.2 Govt Structures 11.2 7.7 5.0 5.0 FDTL 2.2 1.7 1.0 1.0 Internal Admin 0.5 0.0 0.0 0.0 TNPL 2.2 1.9 1.4 0.0 Justice 1.4 1.4 1.6 1.5 Devel & Env 1.7 1.0 1.1 1.0 Trade & Ind 0.0 0.0 0.0 0.0 Agriculture 16.5 9.4 11.7 7.4 Education 18.3 16.8 14.5 13.5 Health 5.3 2.1 1.1 0.0 Labour & Solid 10.3 9.8 9.6 9.5 Foreign Affairs 0.0 0.0 0.0 0.0 Plan & Finance 3.9 13.8 11.6 1.8 Tran, Com & PW 20.4 20.8 22.3 19.7 Total 96.2 86.4 85.9 60.5

The Road Map -- Annex 2
República Democrática de Timor-Leste
Stability Program
The Road Map – Annex 2
STABILITY PROGRAM República Democrática de Timor-Leste Page 2 of 25

The Road Map – Annex 2
STABILITY PROGRAM República Democrática de Timor-Leste Page 3 of 25
INTRODUCTION 4
STABILITY PROGRAM 5
Objectives 5
Scope 5 Governance area 6 Stability area 11 Planning for Poverty Reduction 13 Promoting Health 19 Special Situation of the Enclave of Oecussi 20
INDICATIVE COSTS AND FINANCING MODALITIES 21
Indicative Costs 21
Financing Modalities 23
IMPLEMENTATION AND COORDINATION 23
RISKS 23
REPORTING AND MONITORING 24

The Road Map – Annex 2
STABILITY PROGRAM República Democrática de Timor-Leste Page 4 of 25
INTRODUCTION Timor-Leste formulated its first National Development Plan (NDP) in record time with the participation of more than 38,000 citizens from all walks of life spread in all parts of the country. The Plan recognized that the people of Timor-Leste needed virtually everything and incorporated a wide range of strategies, policies, programs and actions to address their needs during the five-year period (2002/03 to 2006/07) within a twenty-year perspective. The Plan was finalized in early May 2002 and adopted by the Parliament after independence. Implementation of the Plan began with the FY2003 budget in July 2002. The Plan gave hope to the people about their future as well as that of their children and raised expectations. It recognized the likely direct and indirect adverse impacts of the reduction of the international presence due to the scale-down of the UN operations in mid-2002 on the demand for goods and services and employment. The unemployment rate was estimated to be of the order of about 17%. The economy was estimated to contract by about 4.8% in 2002 and 6.8% in 2003 and recover somewhat (by 3.5%) in 2004. The actual situation may have been somewhat worse than projected. Employment, especially in the urban areas and among youth, declined precipitously in the latter half of 2002 after withdrawal of a significant proportion of the UN personnel. The country is facing difficulties in attracting foreign direct investment, and in rapidly creating an enabling environment for private sector development. Also, the Government has not yet been able to address adequately the provision of social services for vulnerable groups. In general, delivery of services has not expanded to meet the high expectations of the people due to various factors that included (i) capacity limitations and technical difficulties in putting in place the necessary legislation and regulations supporting good governance, (ii) time absorbed in setting up the administrative and service delivery systems, and (iii) lack of prioritization and sequencing of the activities in the NDP. The Government realized the constraints and began (in October 2002) to see the need to refocus the development efforts on a limited number of priority activities. The events of 4 December 2002 added urgency to address the immediate needs of the people through tangible delivery of goods and services that are visible to the people. In the semi-annual Meeting with Development Partners held during 9-10 December 2002, the Prime Minister alluded to the types of priorities around which the Government intended to focus its efforts. In January 2003, these priorities were refined taking into account the feedback from the people in both the urban and rural areas and a possible list of immediate priorities was shared with Development Partners in a meeting on 21 January 2002. The suggestions emerging from the Partners were taken into account in finalizing the immediate priority areas, which were approved by the Council of Ministers on 22 January 2003. Eight immediate priorities in the three broad areas of governance, stability and poverty reduction have been identified and approved by the Council of Ministers (Government) in January 2003. The priorities are: in Governance area: (i) strengthening the respective institutions of the State and legitimizing the local authorities at the suco level first; (ii) strengthening the administrative capacities of the justice system including both customary and formal systems; (iii) strengthening the capacities of the institutions responsible for internal and external security (including appropriate equipment for communication and transport for Police) and Defense; in Stability area: (iv) job creation, which will be part of all

The Road Map – Annex 2
STABILITY PROGRAM República Democrática de Timor-Leste Page 5 of 25
programs from every sector, with particular emphasis on youth and ex-combatants; and in the Poverty Reduction area: (v) supporting the development of the agriculture sector to ensure food security and enhanced access to markets & distribution in the family (farming) sector, cooperative sector, private sector and private sector with the State’s participation (joint ventures); (vi) developing trade through cooperatives including domestic trade, import of basic products and export of local products such as cumin and copra; (vii) improving primary and secondary education and vocational training; and (viii) promoting health including extension of access to basic health services through increasing the number of mobile clinics and / or health posts in inaccessible areas. The Stability Program is formulated in the priority areas to cater to the urgent needs of the population over the next 18 months. The Government’s Prioritization and Sequencing exercise covering the remaining four years of the National Development Plan (NDP) takes into account explicitly the above immediate priorities, which are in tune with the priorities in the NDP. The Annual Action Plans for FY2004 draw upon the results of the Prioritization and Sequencing exercise. Thus, the activities in the Stability Program will form a subset of the actions in the AAPs and an integral part of the development efforts during FY2004. The initial implementation of the Program in the remaining three months (fourth quarter) of FY2003 is to be funded from reallocation of resources from the CFET budget and other sources while additional resources are being mobilized in the FY2004 combined sources budget. This paper provides the details on the objectives, scope, indicative costs, financing modalities, and implementation, coordination and monitoring arrangements for the Stability Program. STABILITY PROGRAM Objectives
The overall objectives of the stability program are to restore and sustain civil and economic security (including food security) and harmony in all parts of the country and empower the local communities and administrations. Scope The criteria for selection of programs and activities in different sectors for incorporation in the Stability Program include the following:
1. Address at least one of the immediate priorities 2. Generate tangible and visible benefit flows including improved and expanded delivery
of services in the next 3 to 15 months 3. Linked to medium and longer-term priorities and programs 4. Sustainable in the medium and long-term from both fiscal and development
perspectives 5. Promote poverty reduction and overall economic growth
The stability program should be seen as the first step to recovery, poverty reduction and accelerated economic growth in the medium and long-term. Good integration between sectors and programs, hitherto weak, is an important dimension to promote, especially under the Stability Program. The programs under the different priorities are presented in the following:
The Road Map – Annex 2
STABILITY PROGRAM República Democrática de Timor-Leste Page 6 of 25
GOVERNANCE AREA 1. Strengthening the respective institutions of the State and legitimizing the local
authorities at the Suco level first.
This would include strengthening the four organs of the State – President, Executive, Parliament and Judiciary – with appropriate assistance. In particular, strengthening the civil service including legislation and pay policy will receive priority. At the local level, election of the Chef de Sucos and strengthening the administrations at the sub-district level will be a priority. To start in this direction, the Government has recently appointed 65 Sub-District Administrators to guide, facilitate and monitor development activities undertaken by the Government, private sector, communities and civil society organizations. At the suco level, the legitimacy of the Chef de Sucos in the sucos numbering about 450, has to be clarified. Also, in some sucos, more than one person claims to be the Chef de Suco. This needs to be resolved. Election of the Chef de Sucos is seen as a means to resolve this problem and legitimize the role of the Chef de Suco. The appointment of district and sub-district administrators and the election of Chef de Sucos is an important step. They need to be provided with resources to respond to the complaints, concerns and priorities of the people in the districts, sub-districts, and sucos.1 The Government will initiate a block grants program to enable the suco, sub-district and district administrations to respond to complaints and local priority concerns. Initially, the grants will be modest. The funds could be used for eligible interventions such as minor repairs, rehabilitation and upgrading of public facilities including markets, roads, culverts, canals, channels, schools and community halls, and to ameliorate calamities such as pests and livestock diseases.2 The Decentralization Options study is to be launched in the latter part of March 2003 and completed by the end of May 2003. Based on a review of the options, the Government would consider the formation of a local development fund that would be administered within the existing Government structures, with appropriate technical assistance to the Government and other agencies. The Fund would cater to the populations at the grassroots, especially the rural residents, on a wide range of development priorities including employment generation, agriculture, education, health and infrastructure.
2. Strengthening the administrative capacities of the justice system including both
customary and formal systems to improve service delivery.3 In August 1999, the judicial system in Timor-Leste had some 70 persons with legal training. By 2000, after some intensive training, 25 judges, 13 public prosecutors, 10 public defenders and 12 registrars/clerks were appointed by UNTAET on a probationary basis.4 Today there are 17 trial judges, 6 investigating judges, 9 public prosecutors and 9 public defenders
1 The Chefes de Suco are provided a modest monthly allowance to cover the costs of travel, etc., for them and their colleagues from the aldeias, to attend meetings at the sub-district and district headquarters. 2 A list of eligible activities will be prepared in consultation with the people in each of the districts to cater to their specific circumstances. 3 The presentation in this sub-section draws heavily on the Joint Government-UNDP Assessment Mission (draft) Report on “Support to the Justice System in Timor-Leste,” Dili, 26 January 2003. 4 These figures do not take into account the number of international judges, prosecutors and public defenders appointed that were mostly assigned “Serious Crimes” cases.

The Road Map – Annex 2
STABILITY PROGRAM República Democrática de Timor-Leste Page 7 of 25
operating in four district courts (in Dili, Oecussi, Baucau and very recently in Suai). Apart from these state employees, there is still a general dearth of jurists in the country – a shortage that is likely to continue for some time. In addition, the UNTAET established Special Panels for Serious Crimes as part of the Dili District Court. The service delivery in the justice sector has encountered considerable problems giving rise to (i) a mounting backlog of unresolved cases,5 inconsistent rulings and illegal orders by the courts; (ii) the frequent ignoring of legal orders issued by judicial authorities; (iii) a relatively large prison population with a majority awaiting trial;6 (iv) inadequate legal assistance to the accused; and (v) low quality of services, among others. The factors contributing to this situation include a. Capacity and Complexity aspects
? Inadequate number of judges, prosecutors, public defenders and court clerks and
insufficient preparation (legal capacity) of these personnel; ? Insufficient sufficient support services including interpreters, translators and record
keeping; ? Transition from a Bahasa-based Indonesian legal system to a Tetun and Portuguese-based
national, civil law system and associated language difficulties; ? Lack of uniformity in procedures and weak case management practices; ? Difficulties in striking a balance between issues regarding abuses of the past; immediate
needs in the period of transition; and medium- and long-term development of an effective, independent, professionalized justice system operated by skilled professionals of highest professional integrity;
? Limited facilities and equipment; ? Gaps and inadequacies in existing laws; ? Lack of community awareness of the judicial process and the rights protected by the
judicial system and the Constitution; b. Management and Institutional aspects
? Difficulties in striking a balance between exercise of authority in the interest of
accountability and real or perceived interference with the independence and autonomy among the institutional components of the justice system;
5 For example, records maintained by prosecution administration staff indicate that from January to November 2002, 1285 cases were reported to the ordinary crimes Public Prosecution Service office. There is some concern regarding the accuracy of this information, as efficient case management systems are not currently in place in the ordinary crimes prosecution office. Of the total 1,285 cases reported from January to November 2002, 377 cases were solved by mediation and did not proceed through the formal court system. Despite frequent use of mediation to resolve criminal cases, there is no regulation or statute in Timor-Leste authorizing the use of mediation to settle such matters. Indictments were filed in only 140 cases. Of these indicted cases, the courts have so far finalized only 43. It should be noted that these figures do not include cases from 2001 that have yet to be indicted or tried. Some estimates put the total backlog of unresolved cases to be in excess of 2,300. At the Court of Appeal, currently there is no President and the Court is comprised of only one probationary judge. As a result, it has temporarily ceased to function leading to a backlog of 39 cases in October 2002. 6 There are three prisons operating in Dili (Becora Prison), Baucau, and Gleno. In October 2002, the prison population was estimated to be about 292 of whom 207 prisoners (71%) were awaiting trial. Of those awaiting trial, 79 prisoners (38% of the pre-trial population and 27% of the total prison population) were held without warrant.

The Road Map – Annex 2
STABILITY PROGRAM República Democrática de Timor-Leste Page 8 of 25
? A general atmosphere of lack of trust, confidence and willingness to communicate, much less cooperate, among the institutional components of the justice system;
? Tensions between some nationals and internationals working in the justice sector. The Ministry of Justice has made considerable progress in establishing the institutional structures including the (i) Superior Council for the Judiciary, the Court of Appeals and four District Courts; (ii) Office of the Prosecutor-General, (iii) Office of the Public Defender, and (iv) Judicial Training Center. Most of these are in the early stages and need substantial technical assistance to fully function. The Ministry has formulated plans to strengthen the capacity of the various institutions in the Justice sector, which is likely to generate benefits, including improved service delivery, in the medium and long-term. In the short-term, it is necessary to improve the delivery of services including especially the resolution of the backlog of cases and the high proportion of detainees awaiting trial for very long periods (many held well beyond the legally allowed duration).7 This cannot be handled by the formal justice system with the present complement of Timorese professionals and it will be necessary to seek help from international personnel in the short and medium-term. The specific activities in the Justice sector in the Stabilization Program will include the following: ? Recruit additional staff to fill the authorized positions in the Ministry of Justice; ? Train Judges, Prosecutors and other personnel in Portugal and other CPLP (Comunidade
dos Países de Língua Portuguesa or Portuguese-speaking) countries and in countries that adopted and practice Civil Law;
? Recruit international Judges, Prosecutors, Defense Lawyers and Court Clerks from countries that adopted and practice Civil Law to work together with Timorese colleagues in teams in handling the work-load while some of the other Timorese personnel are away on training and reduce the backlog of cases;
? Provide additional interpretation and translation services to support the smooth functioning of the courts;
? Provide additional assistance for mediation,8 for example to assist the proposed Commission to resolve land rights in the districts;
? Promote the use of functional registries for selection and tracking of cases, and adequate filing systems;
? Improve internal reporting systems in each entity including the Courts, Prosecutor-General’s Office, Public Defender’s Office, Prisons and the Ministry;
? Formulate necessary regulation(s) to allow for resolution of the less serious and minor cases through mediation;
? Strengthen the mediation and resolution mechanisms (including the customary ones) at the national, district, sub-district and community levels;
? Recruit trainers (from Malaysia) to train Timorese trainers to continue training of prison guards;9
? Help provide vocational training for detainees in collaboration with public and private vocational training centers;
7 In October 2002, about 77% of the prison population (total of about 207 prisoners) was awaiting trial. Of this number, 79 prisoners (38% of the pre-trial population and 27% of the total prison population) are held without warrant. 8 Already, an adviser is provided by the Canadian International Development Agency (CIDA) to assist the Land and Property Unit in the Ministry of Justice on mediation of land and property disputes. 9 About 170 prison guard positions were authorized of which about 120 has been recruited.

The Road Map – Annex 2
STABILITY PROGRAM República Democrática de Timor-Leste Page 9 of 25
? Provide literacy classes to illiterate detainees, possibly using as teachers other detainees with secondary schooling;
? Organize work programs for detainees to upgrade their skills and produce goods and services that could contribute to their upkeep; and
? Jointly with the Ministry of Education, Culture and Youth and the media (including Radio Timor-Leste), organize civic education on nationality, citizenship, essential elements of civil and penal code, land law, and rights and obligations of citizens.
3. Strengthening the capacities of the institutions responsible for internal and
external security (including appropriate equipment for communication and transport for Police) and Defense.
The institutions responsible for internal security include the National Police of Timor-Leste (PNTL) and the UN Police, while the Defense Force (F-FDTL) and the UN Peace-Keeping Forces or PKF are responsible for external security. In addition, the National State Security Service (Servico Nacional de Seguranca do Estado or SNSE) employing about 18 staff is involved in intelligence collection. Further, a cadre of unarmed Civil Security Guards numbering some 300 are deployed throughout the country to guard public buildings, facilities and property. The Constitution of Timor-Leste stipulates that internal security is the responsibility of the Police and external security the responsibility of F-FDTL. The main goal of the police (PNTL) is to provide service to the people and communities through protection of personnel and property, ensuring compliance with all laws, preventing crime and maintaining public order. The full strength of (ETPS) PNTL was indicated to be 3,500 in the FY2001/02 budget document. In light of the capacity and resource constraints, the FY2002/03 budget document targeted to mobilize a total of 2,830 officers during FY2002/03.10 In addition, provision has been made to recruit 25 cadets for the newly created Immigration Police Unit. The PNTL has already recruited and trained about 2,530 officers and another 325 cadets are to be recruited and trained during the rest of FY2003/03. In addition to normal police work, the PNTL’s responsibilities include border patrol and immigration. The Border Patrol Unit (BPU) was activated in June 2002 to enforce laws and regulations along the borders and ports, establish rapport and maintain liaison and cooperation with counterparts, and assist the Defense Force (F-FDTL) in cases of external threats. The BPU has 200 officers of whom 174 are deployed in the three border districts – Bobonaro (75), Cova Lima (46) and Oecussi (53) – with the rest at headquarters in Dili. The Immigration Police Unit too has been activated and the officers deployed alongside the border patrol in the border districts and at Comoro Airport and the Port in Dili. A Special Police Unit (now converted to the Rapid Intervention Unit or RIU) with 180 officers, of whom 120 are in Dili and 60 in Baucau, has been set up to respond to public/civil disorder situations and tactical responses, primarily in the two urban centers.11
10 This gave rise to some confusion regarding the authorized strength of the NPTL. 11 The Special Investigation Unit has been converted to the Rapid Intervention Unit. The responsibilities of the Unit include crowd control, riot control and management during outbreaks of massive civil disorder, control of protest actions by crowds, control of passive protest and clashes between rival gangs; and tactical response actions including assistance to SNSE during VIP outer layer escort, provision of initial response to bombing incidents, tackling barricaded armed criminals, assistance in apprehending violent armed criminals including through house entry and assault, mass arrest and escort of suspects, tackling hostage situations, responding to prison outbreaks and prisoner escape, and search and rescue operations during mishaps.
The Road Map – Annex 2
STABILITY PROGRAM República Democrática de Timor-Leste Page 10 of 25
Recent incidents in Los Palos and Ermera (Atsabe) were handled through the deployment of F-FDTL to restore order. However, there is a consensus that the F-FDTL should not be utilized to deal with internal security problems.12 Instead, a Rapid Deployment (Police) Group (RDG) of about 500 officers will be set up to address the internal security concerns in the Districts, such as the recent incidents in Los Palos, Ermera and Maliana. The RDG concept replaces the previously proposed Border Patrol Unit Specialist Response Team. Of the 500 officers in the RDG, 300 will be recruited and trained in FY2003 and the rest in FY2004. The RDG will be deployed in designated districts experiencing high-risk security threats. The allocation for the PNTL in the approved budget for FY2002/03 was US$7.8 million. Funding for the BPU and RIU was incorporated in the above budget, although the amounts allocated for these units may not be adequate.13 Funding for the recruitment and training of the 300 RDG officers is included in the revised FY2002/03 budget (following the Mid-Year Budget Review). Preliminary estimates indicate that it might cost around US$5 million to set up and equip the 500-strong RDG and the recurrent costs will be significant. The Defense Force (F-FDTL) was established in January 2001 with an authorized strength of 1,500 regular forces and 1,500 reservists. By early 2003, the actual strength has reached about 1,400 regular forces organized into two battalions14 and command and headquarters staff. There has been no recruitment of the reservists so far. The mission of F-FDTL is to defend Timor-Leste. Three overarching principles guide the achievement of this mission: (i) the country’s military strategy be defensive, (ii) the Force be capable of defending against small-scale incursions by hostile groups and of larger invading forces until external assistance arrives, and (iii) support the Government during natural disasters and other emergencies. The development of the F-FDTL has been occurring gradually and slowly with assistance from bilateral donors. However, there is considerable need for strengthening the forces with further training to renew the skills as well as provision of additional equipment and facilities. The mandate of United Nations Police is to maintain law and order in Timor-Leste and establish and train a professional National Police Service. The maximum authorized strength was 1,640 officers. In April 2002, there were 1,287 UN Police officers from 38 countries of whom 239 officers were in the Special Police Units in Dili and Baucau. The downsizing policy of the UN Police involves a gradual handover (transfer) of the police functions in the District to the National Police with a concomitant decrease in the number of international police officers. Thus, by early 2003, the police functions in five districts were handed over to PNTL and the number of UN Police officers has declined to about 700. Further withdrawal of the UN Police will be suspended and their numbers may be maintained at those prevailing in March/April 2003 until the end of December 2003. Recently, the Border Police Units have been deployed in the border areas in Bobonaro, Cova Lima and Oecussi Districts and are patrolling the borders side-by-side with the UN PKF. As
12 The Constitution of Timor-Leste mandates the use of F-FDTL to address external threats. 13 For example, the budget allocations and projections from FY2003 to FY2006 for the BPU are significantly lower than that required (e.g. to establish offices and housing and acquire additional equipment) for it to assume full responsibility for border security from the PKF. 14 The 1st battalion is located in temporary facilities previously occupied by the PKF in the Los Palos region and will move to the permanent facilities in Baucau after their refurbishment is completed. The 2nd Battalion, which is at the Training Center in Metinaro, will move into the temporary facilities (to be) vacated by the 1st Battalion in Los Palos, until a permanent base becomes available.

The Road Map – Annex 2
STABILITY PROGRAM República Democrática de Timor-Leste Page 11 of 25
with the UN Police, the schedule for further withdrawal of the UN PKF will be deferred and their numbers maintained at the prevailing level until the end of December 2003. However, the BPU will continue to operate side-by-side with the PKF in the border Districts. The BPU do not have adequate supplies (e.g. boots and uniforms), equipment (e.g. communications equipment, pepper spray, holsters for pepper spray, small arms and rifles), housing and furniture (e.g. beds) and transport.15 These need to be procured and supplied immediately to the BPU. At the time of independence in May 2002, the security situation in Timor-Leste has been relatively stable and the incidence of crime was low. The situation has deteriorated somewhat since then brought about largely by the economic downturn. The circumstances worsened in the first two months of 2003 with, among others, armed insurgency incidents. It is understood that further reductions in the UN Police numbers and the withdrawal of UN PKF will proceed in close observance of the law and order situation and social stability in the country. In order to be fully functional and fulfill its mandate, the PNTL needs support, among others, in the areas of training, management including human resources management, additional equipment and facilities. Adequate resources will be made available to meet the urgent needs through reallocation in the FY2003 budget and through the combined sources budget (CFET, TFET and Bilateral sources) to meet these requirements over the next four years.
STABILITY AREA 1. Job creation will be part of all programs in every sector, with particular
emphasis on youth and ex-combatants. It will include employment in the private sector and in the informal sector as well as training including vocational training, with particular emphasis on youth and ex-combatants. Examples of activities include (i) promotion of the private sector through such enabling legislation as investment and company laws on the one hand and rigorous implementation of existing regulations and laws including the new land law on the other, (ii) negotiation of preferential trade arrangements with main trading partners and/or major markets including Australia, and (iii) development of tourism and offshore fisheries through foreign direct investment and joint ventures. Other sources of demand for labor in the economy would be rejuvenated as well. One avenue is the introduction of “domestic content” requirements for successful bidders that provide out-sourced goods and services to the Government. The purpose is to require the successful bidders to add value domestically through training and employment of staff/labor and perhaps use some locally made products. A second avenue is to adopt policies that encourage development partners to subcontract to the maximum extent feasible the civil works components of their aid programs to local contractors/businesses. A third option is to request development partners and require line Ministries to tender civil works under a set of procurement rules that give generous preference to local contractors and/or foreign contractors that have partnerships with local contractors. For example, local contractors may
15 Information collected from field visit to Junction Point 3 In Oecussi.

The Road Map – Annex 2
STABILITY PROGRAM República Democrática de Timor-Leste Page 12 of 25
be given a 30% preference in procurement while foreign contractors partnering with local contractors may receive a 15% preference.16 A further initiative will encourage the oil and gas industry to utilise local materials and workers during the construction phase and source the supply of produce (fruits, vegetables and fish) to the offshore oil and gas workers from Timore-Leste. Further, the oil and gas companies would be encouraged to develop other enterprises that would have forward and backward linkages, which would be in the long-term interest of these industries and demonstrate the social responsibility of these companies to the people of Timor-Leste. A further initiative would involve inviting select groups of investors to discuss and develop niche areas such as in trade (e.g. organic coffee, sandalwood and other exotic products) and tourism including eco-tourism. In public infrastructure, employment creation will be promoted through
? Maintenance of primary roads, rehabilitation and maintenance of secondary roads and
construction and maintenance of farm to market roads using labour-intensive technologies and with community participation;
? River-training to protect bridges and roads and reduce damage due to floods; ? Other infrastructure rehabilitation and construction including public buildings, schools
and community centers; and ? Expansion and improvement of water, sanitation and environment schemes.
Government would create the enabling environment including policies and incentives with private sector, NGOs, Church, communities, groups and individuals implementing the activities. An inter-ministerial group for employment creation would be created to coordinate the activities. a. Technical and Vocational Training Currently, the responsibility for vocational training is spread across the Ministry of Education, Culture, Youth and Sports (MECYS) and the Secretary of State for Labour and Solidarity (SSLS). MECYS should provide technical training such as in engineering towards diplomas and degrees to expand the pool of skilled personnel in the medium and long-term; while SSLS will promote provision of vocational training (lasting between a few weeks to a few months) by capable local institutions (e.g. Don Bosco Center). The need for training in different areas will be determined by employment and livelihood opportunities in these areas (i.e. demand driven). Training to youth in organization and management of road maintenance and rehabilitation operations will be undertaken. A Vocational Training Council would be established to undertake coordination, set standards, certification and regulation. Incentives would be provided for private sector including contractors to provide training. Trainees would be provided support including credit to build businesses individually and in groups/cooperatives. The private sector will be supported through training of managers of small and medium enterprises (SMEs), business associations and others.
16 Variations on this have been or are a common practice in many developing countries in the Asia-Pacific Region.

The Road Map – Annex 2
STABILITY PROGRAM República Democrática de Timor-Leste Page 13 of 25
Much of the training will be implemented through existing NGO, Church and other organizations, which will be strengthened. In the medium-term, Government will develop policy for investment, laws and regulations on land and property, and a national policy on employment. b. Communications and credit services will be improved through ? Provision of a radio-receiver set with solar batteries and a megaphone to each aldeia; ? Supply of two-way radios to sucos, sub-districts and districts for multi-purpose use
including for administration, health emergencies, security and disasters; and ? Expansion of the Postal System with savings/money disbursement facilities initially to
each district and later to all sub-districts as a means to facilitate mobilization of savings, disbursement of funds/credit, collection of repayments and provide other financial services (e.g. money-orders). These would work as de facto financial intermediaries until such time that commercial banks expand to these areas.
In addition, the Government has initiated the Open Governance Program under which the Council of Ministers spend time (between one and two weeks) in each district talking and listening to the people, familiarising with the challenges and opportunities on the ground, and exploring means to address the priority concerns of the people.
PLANNING FOR POVERTY REDUCTION 1. Agriculture
Supporting the development of the agriculture sector to ensure food security and enhanced access to markets & distribution in the family (farming) sector, cooperative sector, private sector and private sector with the State’s participation (joint ventures)
Poverty in Timor-Leste is primarily a rural phenomenon with almost nine-in-ten poor located in rural areas. Supporting the development of the agriculture sector to ensure food security and enhanced access to markets and distribution will be an important means to poverty reduction in the short-term. This will include support to family farms,17 cooperatives, private sector and joint venture enterprises. The agriculture sector suffers from several handicaps including low access to inputs, minimal extension services, virtually no credit supply, rudimentary post-harvest facilities and practices, poor quality of produce and uncompetitive prices. The coffee and coconut plantations are old and not well maintained. Utilization of other produce (e.g. coconut) through appropriate processing is minimal. Certified seed imported from Surabaya was not good. The Ministry of Agriculture, Fisheries and Forestry (MAFF) are working with farmers to produce seeds. Although some irrigation systems have been rehabilitated at considerable expense, no significant increase in production of rice has materialized due to competition from imported rice and inadequate extension and inputs supply. Improving yields and post-harvest processing are important to enhance the competitiveness of domestic rice.
17 More than 85% of food production is from household (family) farming.
The Road Map – Annex 2
STABILITY PROGRAM República Democrática de Timor-Leste Page 14 of 25
Recognizing the challenges, the Government established the agricultural research and extension service only last year and a Horticulture unit is being established. Although the MAFF suggested the development of cooperatives, markets and transport to the Small Enterprise Project or SEP (funded through TFET), no action has been taken so far. Similarly, replanting coffee to allow for intercropping at least during the initial three years was proposed to SEP, with no follow-up so far. The World Bank has been requested to assist in obtaining information on markets for niche products. Some foreign private investors have expressed interest in replacing coconut with oil palm. Some Japanese and Korean firms as well as some Thai and Hong Kong (China) investors are interested in the fisheries sector. The companies/investors will also develop infrastructure including storage and processing. The University of Hawaii has been asked to help on mungbean and other agronomic aspects (under USAID support). In collaboration with the NCBA, which is doing good work on coffee and vanilla, planting of vanilla on 80 ha is being implemented. The Ministry has authorized import and distribution of Bali cattle to 500 families in Liquica, Dili and Manatuto districts. Cattle-raising in Oecussi, which is a traditional activity in the district will be improved as well. Building upon the above initiatives and experiences of MAFF and others in the public, NGO and private sectors, the following activities will be promoted under the Stability Program: ? Coffee plantation-renovation through replanting of new coffee crops ? Establishing and implementing and revolving rural credit system ? Stabilization of run-of river system’s for irrigation ? Increasing rice and vegetable production through access and utilization of fertilizer in
irrigated areas ? Improving the storage processing and marketing of food crops ? Promote cattle production – Cooperative ? Promoting dairy cooperatives ? Training youth for managing cooperatives in sucos and postos ? Promoting forest re-planting ? Developing offshore fisheries utilizing foreign investment ? Improving the storage and marketing of fish ? Promoting the replanting of new coconut varieties in agriculturally neglected areas ? Developing oil palm (nucleus estate) plantations, in cooperation with the private sector ? Procuring and distributing oil extraction machine for copra and candlenut to cooperatives
and farmers’ groups (pilot project) ? Developing trade through cooperatives, including domestic trade, the import of basic food
products, and the export of local products ? Animal traction ? Development of Agro-tourism ? Development of value-added agriculture product for domestic market and possibly for
export ? Community irrigation 2. Food Security Food security can be considered at the national, district, community and household levels. At present, Timor-Leste imports about 40% of its rice and a substantial proportion of cooking oil and other foodstuffs. The country aims to meet its food requirements through a combination

The Road Map – Annex 2
STABILITY PROGRAM República Democrática de Timor-Leste Page 15 of 25
of domestic production and imports. Food security at the district and community levels is often seen in terms of availability of adequate supplies. At the household level, food security involves the availability of adequate food (supply) at reasonable prices and the ability to buy the available food (income). Increasing production contributes to increased availability (supply) and incomes. However, many households do not have adequate incomes to buy the food and seasonal hunger is a common phenomenon throughout the country. Timor-Leste received some food aid (mainly rice, cooking oil and canned fish) and has been distributing this to the people during the lean months. However, the supplies were limited and inadequate to meet fully the requirements. Virtually all the stocks have been depleted and the Government will seek additional food aid to address hunger. 3. Cooperatives Developing trade through cooperatives including domestic trade, import of basic products and export of local products such as cumin and copra Promotion of trade within the country including through construction of markets and warehouses. This would include promotion of cooperatives to undertake import of basic products and exports of local products drawing upon such successful examples as in coffee. Training will be provided to youth and ex-combatants in the organization and management of marketing, production and other service (e.g. eco-tourism) cooperatives. Credit cooperatives should be developed later on building upon the successful experiences of the marketing and other cooperatives. Seed capital for the operation of the cooperatives would be mobilized from the commercial banks, where feasible, and other sources including the Postal System in due course. For import and export trade, the cooperatives would establish linkages with their counterparts in other countries, and seek partnerships for mutual benefit. 4. Improving Education Improving primary and secondary education and vocational training18 Improving primary and secondary education including increasing access as well as improving quality is an immediate priority. Also, delivery of vocational training that has a direct link to employment is a priority under the Stability Program.19 The background and actions on these areas are discussed in the following. Increased access to primary education has been identified as one of the immediate priorities. Almost half the population of Timor-Leste is below 16 years old20 and the demand for primary education will grow exponentially as the population dynamics work out. There has
18 This subsection draws heavily on the analysis presented in the final report of the Household Living Standards Measurement Survey or LSMS (2001), which is one of the three components of the Poverty Assessment. 19 It is recognized that employment generation could also be promoted through supply side interventions in certain areas of vocational training (supply-driven). However, it is difficult to identify the areas and the initial thrust will be demand-driven. 20 According to the Household LSMS (2001), about 47% of the population is below the age of 16 years; and the Multiple Indicator Cluster Survey (MICS) conducted in the latter half of 2002 estimates that about half the population are aged 15 or lower.

The Road Map – Annex 2
STABILITY PROGRAM República Democrática de Timor-Leste Page 16 of 25
been a significant increase in primary school enrollment overall and by the poor and girls in particular during the past two years, most likely due to abolition of school fees, requirements for uniform, and mandatory Parent-Teacher Association (PTA) contributions, as well as the distribution of free textbooks on the one hand and improved security on the other. This indicates that household demand for education is potentially strong and the Government is doing the right thing in expanding access to primary education through the rehabilitation of (old) schools and construction of (new) schools.
Notwithstanding the recent increases in enrolment, the percentage of out-of-school children between 5 and 1721 is still high and follows an elongated U-pattern (see chart below). The proportion declines from a high of 86% among 5-year olds to 67% or two-in-three among 6-year olds, 42% among 7-year olds and 35% among 8-year olds; to lows of 12.5% among 11 and 12-year olds and 11.5% among 13-year olds. The trend reverses thereafter and the proportion increases to 42% among 17-year olds, more than 60% among 19-year olds and more than 80% among 21-year olds.
Out of School Children and Youth by Age, 2001
0
20
40
60
80
100
5 7 9 11 13 15 17 19 21 23 25
Age
%
The gross enrollment ratio in primary schools is high (102%) due to over-aged students. Most Timorese children, especially in rural areas, start school late at age 7 or later largely due to the difficult access (walking distance of more than one hour from home to the nearest school). The net enrolment rate is only 64% if the starting age is at 6 and 73% if the starting age is at 7; that is, between one-in-three to one-in-four children of school age are not in school. Therefore, in spite of the increase in enrollment in recent years, a large number of children are still not in school, most of them 6 and 7-year-olds. The late start and the entry into the school system of those who did not enroll in the school years 1998/99 and 1999/2000 due to the insecurity and turmoil have resulted in the vast majority of students being over-aged for their grade. The years of schooling for late-starters are shorter than those who start earlier (e.g. at age 6) as they reach adolescence and start leaving school. They are learning very low skills. Further, the high repetition (over 20 %) and dropout (10%) rates per grade in primary education result in substantial wastage and high cost per graduate. Although the gross primary enrolment ratio is high (102%), only two-in-three students reach grade 4 and about one-in-two reach grade 6. About 47% of those entering grade 1 complete grade 6; or more than half the students that enter the primary school (grade 1) drop out without completing grade 6.
21 These are the relevant age groups for early childhood development (5-year olds), primary education (6 to 11-year olds), junior secondary education (12-14 year-olds) and senior secondary education (15 to 17-year olds).
The Road Map – Annex 2
STABILITY PROGRAM República Democrática de Timor-Leste Page 17 of 25
The objectives are to encourage the enrolment of those who are still not in primary education, starting with the 6-year-olds and progressively involving the 6-year-olds; continue to align age by grade by encouraging new comers to start at age 6 and by reducing repetition (but not automatic promotion); reduce dropout of existing students and make sure that they complete the primary cycle; and ensure that students become literate and numerate by the end of the primary cycle. According to the findings of the 2001 Suco Survey (Census), public schools (all levels) accounted for about 78% of the total (of 992 schools in 2001) with 19% of the schools run by the Church, 3% by private operators and less than 1% by others (civil society organizations including NGOs and communities). Primary schools accounted for 82% of the total, with 11% junior-secondary and 3% senior secondary schools. About 4% of the schools were not classified in the Suco Survey (Census) a. Primary Schools Public Schools: The Prioritization and Sequencing exercise in the Ministry of Education, Culture, Youth and Sports rightly gives priority to expansion of primary schooling through the rehabilitation and construction of more than 65 primary and pre-secondary schools, four Escolas Basicas and 7 Nucleus Schools (serving surrounding schools for improving quality), expansion of teacher training, and revision of curriculum (to begin in March 2003). At the same time, it is recognized that this would not be adequate to meet the increasing demand for primary education. Private/Community Schools: Private groups including communities have started a number of schools to provide education for their children. Often, these are in areas where access to public schools is difficult. Many of these schools have inadequate basic facilities (e.g. desks, tables, chairs and blackboards), textbooks and supplies. Most of the teachers are not trained. The fact that the private groups and communities have started these schools is a clear indication that the demand for education is high. The Government will assist these private/community schools with textbooks, essential facilities and supplies. Also, the teachers in these schools will be provided short-term training through the Nucleus Schools and other facilities. At the same time, in isolated and remote communities (aldeias) that lack adequate access to primary schools, the Government will encourage the communities to set up community schools with the help of two or three youth (people) from the area that have at least some secondary schooling. These community schools could admit 6, 7 and 8-year olds and teach from grades one to three. Upon completion of grade three in these schools, students should have adequate academic preparation and physical stamina to walk to the nearest public school in the area and continue in grade 4. As in the case of existing private/community schools, the Government will assist these community schools in isolated/remote communities (aldeias) with textbooks, essential facilities and supplies; and provide short-term training to the teachers working in these schools through the Nucleus Schools and other facilities. Church-run Schools: According to the 2001 Survey (Census) of Sucos, more than 15% of the primary schools are run by the Church. They provide access to quality schooling for a significant proportion of the children including especially the poor. The Ministry of Education, Culture, Youth and Sports have been providing support to these schools through, among others, supply of textbooks and payment of salaries of some teachers. Recently, there

The Road Map – Annex 2
STABILITY PROGRAM República Democrática de Timor-Leste Page 18 of 25
has been some concern about the lack of resources to continue this support (especially payment of teachers’ salaries) to the Church-run Schools. If required, additional resources will be allocated under the Stability Program to continue the support to Church-run schools. b. Secondary Education The high gross enrollment rate in primary due to over-aged students (102%) declines precipitously to 48% in junior secondary and 26% in senior secondary schools. If the starting age is at 7 as is the current practice, the net enrollment rates are 73% in primary, 25% in junior secondary, and 17% in senior secondary. If the starting age is at 6 as proposed, the net enrolment rates are 64% in primary, 16% in junior secondary, and 7% in senior secondary. Repetition and dropout rates are high in junior secondary as in primary education. There are no great differences between boys and girls, although girls are more persistent in schools with lower repetition and dropout rates and higher promotion rates. Senior secondary education has lower dropout and repetition rates than primary and junior secondary because students who move up to that level are more persistent and also tend to come from wealthier families who do not need their labor to support the family. The Government is trying to address this issue with the involvement of communities including through Parent-Teacher Associations. Public Schools: The Ministry will continue to improve access to secondary education through expansion of capacity and provision of scholarships to students from poor families including orphans and ex-combatants (veterans). This would enable older primary school children with necessary skills to enroll in the grade suitable for their age in junior secondary education, who hitherto were unable to do so due to a shortage of space and teachers in junior secondary schools. It would help maintain the transition rate from primary to secondary to accommodate the increasing number of students coming out of primary education; eventually provide education opportunity to adolescents; and preempt the problems of youth-at-risk (which would have implications for crime and violence and for public expenditures on police and correctional services). At the same time, improvements in the quality of secondary education through teacher training and more relevant curriculum will be pursued in order to impart the necessary skills and attitudes that would make them productive citizens. Church-run schools: These schools play a relatively larger role in secondary education, both in terms of quality and quantity, as compared to that in primary education. Government budgetary constraints are a significant factor in continuing support to these schools. However, the option of providing extra spaces to cater to the increasing demand for secondary education, including those that may be forced to move to public schools due to a decline in Government support to Church-run schools is recognized. Accordingly, additional resources will be located to assist the Church-run schools with textbooks, supplies and teachers’ salaries. c. Vocational Education There are two Government operated Vocational Training Centers in the country – one at Becora (in Dili) managed by the Ministry of Education, Culture, Youth and Sports (MECYS) and the other at Tiba (on the outskirts of Dili), which is managed by the Secretary of State for Labour and Solidarity (SSLS). In addition, there are a number of other Vocational Training Centers operated by Church groups and NGOs, some of which are being utilized for training

The Road Map – Annex 2
STABILITY PROGRAM República Democrática de Timor-Leste Page 19 of 25
by the SSLS. Further, there are a few Agricultural Training Centers including the one at Natabora, which are managed by the MECYS in cooperation with the Ministry of Agriculture, Fisheries and Forestry. The focus of MECYS will be on providing technical education offering diploma and degree courses to improve the skills of the Timorese in the medium and long-term. At the same time, the SSLS will focus on improving vocational skills through short-term vocational courses (ranging from a few days to a few months) in collaboration with the private sector and civil society organizations. d. Adult Literacy The adult population of Timor-Leste has a low level of education and about 46% of the population of all ages has never attended school. Among the age group of 19-29, 31% has never attended school. Among the age group of 30 and above, 72% has never attended school. Among the 19-29 age group that have attended school, 15% have completed Grade 6, 14% Grade 9, and 26% Grade 12. The rates vary among income classes, with those completing Grade 12 ranging from a low of 12% for the poorest 20% to a high of 32% for the richest 20%. Very few go beyond Grade 12, except the richest. Among the 30 plus age group, 20% completed Grade 6, 13% Grade 9, and 23% Grade 12. The grade level completed by the largest percentage among the poorest is Grade 6; for the richest, it was Grade 12. Almost half (49%) the total population cannot either read or write. More than one-in-three (37%) of those who claim to be able to read have difficulty reading. The younger age group is more literate due to higher levels of educational attainment. Recognizing that adult literacy is an important ingredient for improving productivity and reducing poverty, the Government has initiated adult literacy programs. However, these have encountered problems due, among others, lack of adequate resources and teachers and high dropout rates. The MECYS intends to rejuvenate the adult literacy programs and extend literacy classes in tandem with other livelihood skills training (e.g. weaving, agriculture and animal husbandry). Further, support will be provided to communities to organize adult literacy classes using educated youth in the communities/areas as teachers. Also, civil society organizations will be encouraged and supported to organize, continue and expand their adult literacy programs.
PROMOTING HEALTH Extension of access to basic health services through increasing the number of mobile clinics and / or health posts in inaccessible areas. The objective is to bring services closer to the people and respond to their most frequent complaints. The existing benchmark for access is a maximum of a two-hour walk to reach the nearest health facility. People claim that they don’t get such access. At present, the number of health personnel is limited, as are transport facilities. Under the circumstances, two main options will be considered. The first involves increasing the number of health posts (fixed facilities) and the second, increasing the number of mobile clinics. The latter may not work in the rainy season. One possibility is to phase out mobile facilities, replacing them with fixed facilities. This may be carried out gradually in the medium and long-term. It has significant implications for capital and operating costs. The Ministry of Health is in the process of replanning the available resources.

The Road Map – Annex 2
STABILITY PROGRAM República Democrática de Timor-Leste Page 20 of 25
Some proposals for consideration in the Health Sector in the Stability Program are: ? Community-based health services to be provided by trained community health workers,
who could be youth or young adults with some education. They would receive short-term training in diagnosing and administering to common (minor) ailments such as cold, cough and fever. The activity should be promoted through Church or civil society organizations to avoid the risk of getting the community health workers (para-medics) on the Government payroll. There are some successful pilot experiences in Aileu, Same and Liquica on these types of activities which may be suitable for replication in other areas/districts. Church organs and other civil society organizations will be supported to prepare communities. Ministry of Health personnel, in collaboration with Church and other civil society organizations with appropriate capacity, will provide basic training to community health workers. Ministry of Health will supply Health Kits to the community health workers and replenish them as appropriate.
? To improve the mobility of existing health personnel for service delivery, additional transport facilities such as horses and motorcycles with necessary support for operation and maintenance would be provided.
? Two-way radios in the communities/villages (sucos) will be provided and operated by the Ministry of Internal Administration to get emergency medical help. Health centers, posts and mobile clinics are already equipped with such radio communication facilities.
? Health professionals will be encouraged to be leaders in their communities
SPECIAL SITUATION OF THE ENCLAVE OF OECUSSI The lack of access to markets is an overriding constraint facing the people in Oecussi. Access to East Nusa Tengara (NTB) or West Timor, which has been the traditional market and transit point (e.g. Kupang) for the products and services generated in Oecussi is virtually non-existent. The district is largely cut off from the rest of Timor-Leste with no regular ferry service and travel by land through West Timor is unsafe. The UN operates air services (fixed wing and helicopter) primarily to serve the UN PKF and other personnel and there is inadequate capacity (space) to cater to the ordinary citizens. Similarly communications within Oecussi and with the outside including the rest of Timor-Leste is lacking. The existing Government systems are confined to Oecussi town and have very limited range (about 100 meters?). The UN facilities (PKF and UN Police) are the sole means for communication within Oecussi and with outside. It is necessary to put in place Government and/or private sector communications facilities before the withdrawal of the UN from Oecussi. Local markets in the district are flooded with goods from West Timor/Indonesia and local businesses complain that they can’t compete with the imports not only in urban centers but also in the sub-districts. A number of income and employment generation schemes have been promoted by civil society organizations and projects/programs funded by bilateral donor and TFET. The success of these initiatives depends critically on their ability to market the products and services or access to markets. Many of the initiatives are said to face difficulties in marketing their products due to lack of access to the markets in West Timor and lack of transport and high transport costs to send the goods to Dili or other parts of East Timor.

The Road Map – Annex 2
STABILITY PROGRAM República Democrática de Timor-Leste Page 21 of 25
At least two options are available to address the constraints. The first involves negotiations with Indonesia [including the local authorities in NTB such as the Bupati and those who control the border (TNI)] to allow traditional export of such items as garlic, onions and cattle and movement of people from Oecussi to West Timor with minimal restrictions. A second option is to provide regular and reliable ferry service linking Oecussi to the rest of Timor-Leste at affordable prices. This may involve state subsidy, but can be justified on the basis of providing essential service (like roads) to an integral part of the nation. Action on both options (fronts) would be necessary to put the economy of Oecussi back on a sustainable growth path. Action on these should precede any new initiatives on income and employment generation. The income and employment generation activities for which support under the Stability Program would be appropriate include the following: ? Garlic and onion production to supply to the rest of Timor-Leste and export to Indonesia; ? Improving rice yields and production to meet local demand (largely substitution for
imports from Indonesia); ? Small-scale agro-processing including improved rice milling; ? Tourism development to cater to visitors from Indonesia (NTB), other parts of Timor-
Leste and from other countries; ? Bricks and other construction materials to supply local market; ? Furniture to supply local market; ? Other small-scale industries and services; ? Strengthen the new Vocational Training Center established by a civil society
organization; ? Aquaculture; ? Production of eucalyptus oil; and, ? Re-planting of sandalwood. A number of other activities to be implemented in all districts under the Stability Program will also be implemented in Oecussi. INDICATIVE COSTS AND FINANCING MODALITIES Indicative Costs
The indicative costs of the various components of the Stability Program are presented in the following. Implementation of some of the activities within the ambit of the Government while the others depend critically on the active participation of other stakeholders including the beneficiary groups, communities and civil society organizations including the Church. As a result, it is more difficult to provide cost estimates on the latter.

The Road Map – Annex 2
STABILITY PROGRAM República Democrática de Timor-Leste Page 22 of 25
Table 1. Indicative Costs of Stability Program
Area/Component Indicative Costs (in thousands of dollars)
FY02-03 FY03-04 Total 1. Governance Area a) Strengthening the respective institutions of the State and legitimizing the local authorities at the Suco level first.
i) Election of Chef de Sucos ii) Block grants iii) Local development fund iv) Other Sub-total
975
100
1,075
250 2,105 5,000 500 7,855
250 3,080 5,000 600 8,930
b) Strengthening the administrative capacities of the justice system including both customary and formal systems to improve service delivery
3,650
3,650
c) Strengthening the capacities of the institutions responsible for internal and external security (including appropriate equipment for communication and transport for Police) and Defense.
i) Police ii) Defense Sub-total
5,000 150 5,150
5,000 150 5,150
d) Open Governance 200 200 Governance Area Total 1,075 16,855 17,930
2. Stability Area a) Job creation will be part of all programs in every sector, with particular emphasis on youth and ex-combatants
i) Job Creation ii) Vocational Training iii) Organisation of Cooperatives iv) Communications
2,330 2,100 350 1,175
2,330 2,100
350 1,175
Stability Area Total 5,955 5,955
3. Planning for Poverty Reduction a) Agriculture 6,420 6,420 b) Food Security 10,000 10,000 c) Developing trade through cooperatives
i) Domestic Trade ii) Import of basic goods iii) Export of niche commodities
Sub-total
150 250 100 500
150 250 100 500
d) Improving Education i) Primary Education
Community Schools Church Schools
ii) Secondary Education Church schools
Education Sub-total
250 500
1,250 2,000
250 500
1,250 2,000
e) Promoting Health i) Community health services ii) Support to health personnel Health Sub-total
150 450 600
150 450 600

The Road Map – Annex 2
STABILITY PROGRAM República Democrática de Timor-Leste Page 23 of 25
f) Special Situation of the Enclave of Oecussi i) Transport (Ferry) ii) Communications iii) Other support services iv) Sub-total
1,000
750 680
2,430
1,000
750 680
2,430 Planning for Poverty Reduction Total 21,950 21,950
Grand Total 1,075 44,760 45,835 Financing Modalities Most of the costs presented in Table 1 are over and above those included in the FY2003/04 CFET budget requests presented by the Ministries and Agencies. Assistance from development partners is needed to cover most of the costs. The resources required in the balance of FY2002/03 will be mobilized from the current year CFET Budget. The funding for some components or subcomponents for the following 15 months in FYs 2003/04 and 2004/05 could be accommodated through adjustments in ongoing bilateral and multi-lateral programs and projects. New assistance for other activities under the Stability Program could be made available through a range of funding modalities including the following: (i) direct funding through Government, (ii) channeling the funds through an intermediary such as a multilateral agency, (iii) direct funding by development partner(s), and (iv) a combination of two or more above options. The Government accords the highest priority to implementation of the activities proposed under the Stability Program. It welcomes support from development partners for the Stability Program under modalities most appropriate to the activities and in tune with the preferences of the partners. IMPLEMENTATION AND COORDINATION The Stability Program will be coordinated by the Council of Ministers. Inter-Ministerial Sub-committees will be set up to facilitate day-to-day coordination of activities in different areas of the Program [i.e. on Governance, Stability (Job Creation) and Development]. Implementation of the Program will be carried out by line Ministries and Agencies in collaboration with private sector, civil society organizations (including the Church) and communities. The emphasis will be on strengthening and utilizing existing Government and other stakeholder institutions and mechanisms as much as possible. RISKS Political commitment by the Council of Ministers to the Stability Program is clear and many of the activities proposed under the Program have been successfully piloted in the country. However, implementation of the Program may encounter a number of risks. These are discussed in the following: ? It is necessary for the Ministries and Agencies to work together on a number of activities.
This is new for most of them and requires significant coordination and inter-face between their activities. Overall coordination of the activities at the national level is to be facilitated through inter-ministerial committees or working groups. District and Sub-district Administrators would carry out coordination at the district and sub-district levels.

The Road Map – Annex 2
STABILITY PROGRAM República Democrática de Timor-Leste Page 24 of 25
? Implementation of some of the activities involves the active participation of and
partnerships with civil society organizations including the Church as well as communities and beneficiary groups. While experience on such partnerships is available from pilot projects, many Government officials have limited orientation and exposure to and experience in nurturing them. It will require understanding (including attitudinal change) capacity and commitment to promote such partnerships. Training and technical assistance are included under the Program to facilitate this process.
? Several components in the Stability Program entail entrusting funds and provision of
equipment and supplies to beneficiary groups and civil society organizations. Appropriate mechanisms for ensuring transparency and accountability in these transactions are essential. Examples of these are available from successful pilot projects in the country and will be drawn upon as appropriate.
? Legitimising Chefe de Sucos and empowering them as well as the Sub-district and
District Administrators is a new initiative. It too requires appropriate mechanisms for ensuring transparency and accountability, especially in the use of block grants. The criteria for use of the funds including eligible activities in each district will be determined in consultation with the people to cater better to local needs and priorities. Information about the block grants and their utilization will be made available widely to the public to ensure accountability to the people.
? The Stability Program requires substantial additional resources outside the CFET budgets.
Adequate assistance from development partners is necessary to mobilize the funds. The proposed policy dialogue with development partners (in the context of formulation of their country assistance strategies) scheduled for April 2003 would provide an opportunity to seek the latter’s interest in and commitment to provide the funds.
Overall, the Stability Program, which is somewhat ambitious when viewed in the context of the Government’s capacity and implementation performance so far, can be implemented in partnership with other stakeholders, with appropriate resource support and technical assistance. REPORTING AND MONITORING Progress on implementation of the activities under the Program will be through the Quarterly Reporting Matrices (QRMs) as the Stability Program will be an integral part of the Government’s Annual Action Plans (AAPs). Monitoring indicators by Program component/sub-component will be specified in consultation with line Ministries and Agencies.22 The Program will be monitored by the Council of Ministers each quarter and more frequently, if the need arises. Line Ministries and Agencies will monitor the activities through normal administrative channels. Any constraints encountered will be resolved either at the individual 22 Examples of indicators include reduction in number of security incidents, reduction in backlog of pending cases in the judicial system, number of jobs created, number of people trained and number employed, increases in rice production, increases in primary and secondary enrolment, and increases in number of cases attended by health personnel. Given the short 18-month duration of the Program, it will be more difficult to capture its impacts, which take a longer time to show up in the data.

The Road Map – Annex 2
STABILITY PROGRAM República Democrática de Timor-Leste Page 25 of 25
Ministry/Agency or by the concerned Inter-Ministerial Sub-committee, as appropriate, and reported to the Council of Ministers each quarter. An overall review of the program will be undertaken in the Third Quarter of FY2003/04. This would be based on a survey of and/or focus group discussions with beneficiary groups. The results including follow-up actions will be discussed with key stakeholder representatives.

The Road Map -- Annex 3
República Democrática de Timor-Leste
Programme Matrix
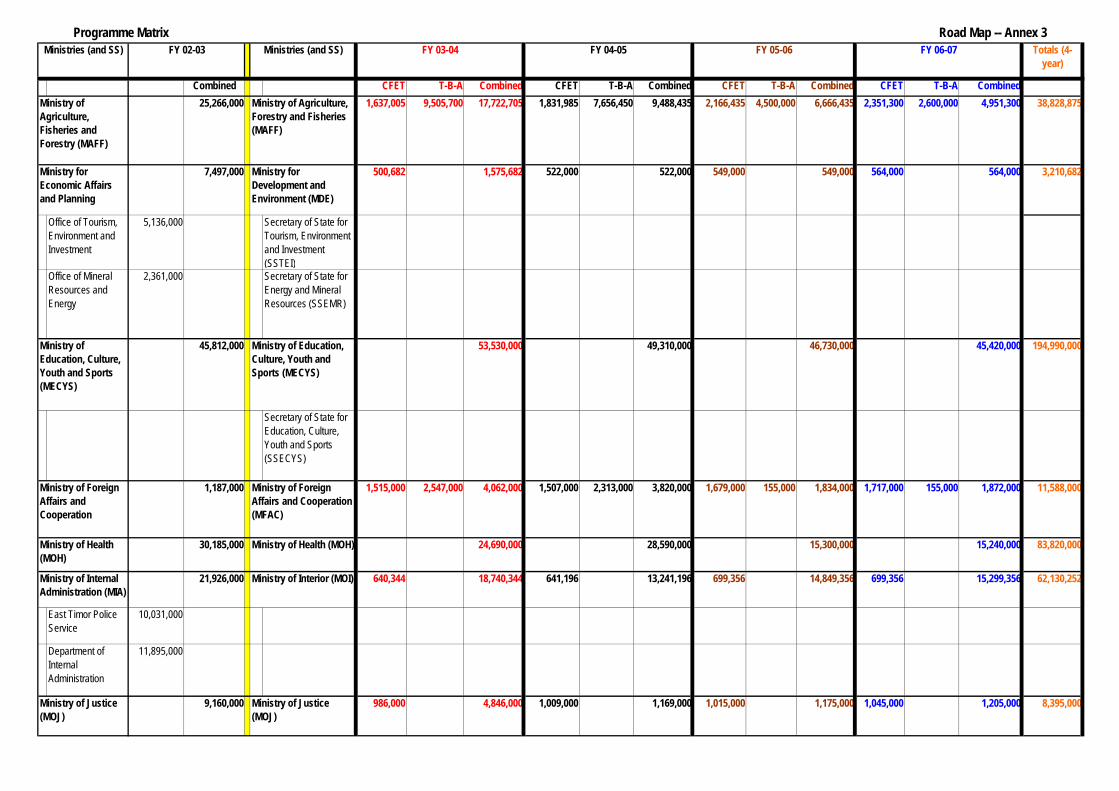
Programme Matrix Road Map -- Annex 3Totals (4-
year)
Combined CFET T-B-A Combined CFET T-B-A Combined CFET T-B-A Combined CFET T-B-A Combined
25,266,000 1,637,005 9,505,700 17,722,705 1,831,985 7,656,450 9,488,435 2,166,435 4,500,000 6,666,435 2,351,300 2,600,000 4,951,300 38,828,875
7,497,000 500,682 1,575,682 522,000 522,000 549,000 549,000 564,000 564,000 3,210,682
Office of Tourism, Environment and Investment
5,136,000 Secretary of State for Tourism, Environment and Investment (SSTEI)
Office of Mineral Resources and Energy
2,361,000 Secretary of State for Energy and Mineral Resources (SSEMR)
45,812,000 53,530,000 49,310,000 46,730,000 45,420,000 194,990,000
Secretary of State for Education, Culture, Youth and Sports (SSECYS)
1,187,000 1,515,000 2,547,000 4,062,000 1,507,000 2,313,000 3,820,000 1,679,000 155,000 1,834,000 1,717,000 155,000 1,872,000 11,588,000
30,185,000 24,690,000 28,590,000 15,300,000 15,240,000 83,820,000
21,926,000 640,344 18,740,344 641,196 13,241,196 699,356 14,849,356 699,356 15,299,356 62,130,252
East Timor Police Service
10,031,000
Department of Internal Administration
11,895,000
9,160,000 986,000 4,846,000 1,009,000 1,169,000 1,015,000 1,175,000 1,045,000 1,205,000 8,395,000
FY 03-04 FY 04-05 FY 05-06 FY 06-07FY 02-03
Ministry of Health (MOH)
Ministry of Internal Administration (MIA)
Ministries (and SS) Ministries (and SS)
Ministry for Development and Environment (MDE)
Ministry of Agriculture, Forestry and Fisheries (MAFF)
Ministry of Justice (MOJ)
Ministry of Foreign Affairs and Cooperation (MFAC)
Ministry of Health (MOH)
Ministry of Interior (MOI)
Ministry of Justice (MOJ)
Ministry of Agriculture, Fisheries and Forestry (MAFF)
Ministry of Education, Culture, Youth and Sports (MECYS)
Ministry of Foreign Affairs and Cooperation
Ministry for Economic Affairs and Planning
Ministry of Education, Culture, Youth and Sports (MECYS)

Programme Matrix Road Map -- Annex 3Totals (4-
year)
Combined CFET T-B-A Combined CFET T-B-A Combined CFET T-B-A Combined CFET T-B-A Combined
FY 03-04 FY 04-05 FY 05-06 FY 06-07FY 02-03Ministries (and SS) Ministries (and SS)
11,913,000 3,139,162 4,122,460 7,311,622 3,065,606 2,664,960 5,730,566 3,209,194 2,346,210 5,555,404 3,333,253 2,196,210 5,529,463 24,127,055
WoG Funds 11,200,000986,000 11,737,000 686,000 4,143,000 686,000 6,144,000 686,000 8,146,000 30,170,000
47,001,000 2,130,599 68,914,583 1,803,776 61,728,286 1,191,276 60,636,284 1,258,476 63,951,693 255,230,846
Department of Water and Public Works
37,866,000 Secretary of State for Water and Electricity (SSWE)
Department of Communications and Transport
4,396,000 Secretary of State for Public Works (SSPW)
Power Service 4,739,000 Power Service (self-funded)
5,000,000
Aviation (self-funded)
845,000
Sea transport (self-funded)
537,000
404,000 0 0 0 0 0
3,390,000 1,208,000 6,208,000 1,008,000 1,008,000 9,432,000
22,272,000 81,099 30,613,891 57,250 20,437,042 53,370 10,432,162 51,672 430,464 61,913,559
Office of the Prime Minister and COM
9,606,000 Office of the Prime Minister
Office of the Prime Minister/SS
771,000
Provedor 65,000 Provedor Direitos Humanos e Justica
Government Structures
Ministry for State Administration (MSA)
Ministry of Transportation, Communications and Public Works
Office of the President
National Parliament
Office of the President
Office of the Prime Minister
Ministry of Planning and Finance (MPF)
Ministry of Transportation, Communications and Public Works (MTCPW)
Ministry of Planning and Finance (MPF)
National Parliament

Programme Matrix Road Map -- Annex 3Totals (4-
year)
Combined CFET T-B-A Combined CFET T-B-A Combined CFET T-B-A Combined CFET T-B-A Combined
FY 03-04 FY 04-05 FY 05-06 FY 06-07FY 02-03Ministries (and SS) Ministries (and SS)
Office of the Inspector-General
634,000 Office of the Inspector-General
Promotion of Equality
288,000 Office of the Promotion of Equality
Independent Electoral Commission
2,087,000
Banking and Payments Authority (BPA)
221,000
East Timor Defense Force
6,600,000
Secretary of State for Parliament Affairs (SSPA)
Capacity Development Coordination Unit
Timor Sea Office
National Security Service of the State (NSSS)
0 0 0 0 0
367,000 239,000 274,000 273,000 273,000 297,000 297,000 310,000 310,000 1,154,000
6,586,000 8,736,000 6,811,000 6,811,000 6,811,000 6,811,000 6,811,000 6,811,000 29,169,000
10,850,000 1,020,215 17,233,553 1,049,400 2,817,150 1,126,050 2,855,050 1,210,650 3,040,150 25,945,903
50,000 30,000 30,000 30,000 140,000
Secretary of State for Labour and Solidarity (SSLS)
Secretary of State for Defence (SSD)
Secretary of State for Labour and Solidarity (SSLS)
Secretary of State for Commerce and Industry (SSCI)
Office of Trade and Industry
Secretary of State for the Council of Ministers (SSCOM)
Secretary of State for National Security (SSNS)

Programme Matrix Road Map -- Annex 3Totals (4-
year)
Combined CFET T-B-A Combined CFET T-B-A Combined CFET T-B-A Combined CFET T-B-A Combined
FY 03-04 FY 04-05 FY 05-06 FY 06-07FY 02-03Ministries (and SS) Ministries (and SS)
86,500 66,500 72,000 131,500 356,500
1,602,000 1,602,000 0 0 0 1,602,000
Total 223,164,000 Total 272,933,880 214,385,175 180,944,691 173,939,926 842,203,672
Banking and Payments Authority (BPA)
Independent Electoral Commission (IEC)

Programme Matrix Road Map - Annex 3
CFET TFET (and other
funding sources)
Combined Total
CFET Other Funding Sources
Combined Total
CFET Other Funding Sources
Combined Total
CFET Other Funding Sources
Combined Total
n.a. 1. Staffinga. Core Administrative Staff (MAFF) 69,000 0 69,000 69,000 0 69,000 69,000 0 69,000 69,000 0 69,000 276,000
b. Administrative Support for 3 Regions & Districts
30,000 0 30,000 30,000 0 30,000 30,000 0 30,000 30,000 0 30,000 120,000
n.a. 2. Operational Support a. Finance and Budget 132,000 63,000 195,000 132,000 0 132,000 132,000 0 132,000 132,000 0 132,000 591,000b. Procurement and Logistics 175,000 0 175,000 175,000 0 175,000 175,000 0 175,000 175,000 0 175,000 700,000
3. Policy and Planning 1 a. Policy Development and Links with
other ministries15,000 130,000 145,000 15,000 130,000 145,000 15,000 0 15,000 15,000 0 15,000 320,000
9 b. Donor/NGO Coordination 15,000 50,000 65,000 15,000 50,000 65,000 15,000 0 15,000 15,000 0 15,000 160,0004. Capacity Building for Ministry Staff
50,000 150,000 200,000 50,000 150,000 200,000 50,000 0 50,000 50,000 0 50,000 500,000
1. Support to Communities for:
4 a. Community Irrigation and Roads 113,765 165,000 278,765 77,765 0 77,765 73,765 0 73,765 66,000 0 66,000 496,2957 b. Water Users' Associations 20,000 25,000 45,000 10,000 15,000 25,000 15,000 0 15,000 15,000 0 15,000 100,000
16 c. Water Harvesting 40,000 0 40,000 50,000 0 50,000 50,000 0 50,000 50,000 0 50,000 190,0002. Rehabilitation and Maintenance of Major Schemes
24 a. Rehabilitation 5,000 3,780,700 3,785,700 17,000 3,764,700 3,781,700 18,000 1,900,000 1,918,000 0 0 0 9,485,40015 b. Maintenance and Repair 0 0 0 50,000 0 50,000 50,000 0 50,000 150,000 0 150,000 250,000SP 3. Community irrigation 450,000 0 0 0 450,000
SP 4. Stabilization of run-of river system's for irrigation
200,000 0 0 0 200,000
1. Support to Communities for Integrated Farming Systems:
6 a. Food Production 50,000 0 50,000 50,000 0 50,000 50,000 0 50,000 50,000 0 50,000 200,0009 b. Commercial and Industrial Crops 40,000 0 40,000 44,000 0 44,000 47,000 0 47,000 51,700 0 51,700 182,700
22 c. Post-Harvest and Marketing 25,000 0 25,000 27,500 0 27,500 28,000 0 28,000 30,800 0 30,800 111,30024 d. Support to Farmers' Associations 36,100 521,000 557,100 39,710 0 39,710 40,000 0 40,000 42,000 0 42,000 678,810
Overall Totals2006/72003/4 2004/5 2005/6Priority Rank
Programs and/or Components
Program: General Administration
Program: Irrigation
Program: Crops
Ministry of Agriculture, Forestry and Fisheries MAFF Page 5 of 105

Programme Matrix Road Map - Annex 3
CFET TFET (and other
funding sources)
Combined Total
CFET Other Funding Sources
Combined Total
CFET Other Funding Sources
Combined Total
CFET Other Funding Sources
Combined Total
Overall Totals2006/72003/4 2004/5 2005/6Priority Rank
Programs and/or Components
SP e. Coffee plantation-renovation throguh replanting of new coffee crops
500,000 0 0 0 500,000
SP f. Increasing rice and vegetable production through access and utilization of fertilizer in irrigated areas
850,000 0 0 0 850,000
SP g. Improving the storage processing and marketing of food crops
400,000 0 0 0 400,000
SP i. Developing oil palm (nucleus estate) plantations in cooperation with the private sector
100,000 0 0 0 100,000
SP j. Procuring and distributing oil extraction machine for copra and candlenut to cooperatives and farmers' groups (Pilot project)
100,000 0 0 0 100,000
SP k. Developing trade through cooperatives, including domestic trade, the import of basic food products and the export of local products
500,000 0 0 0 500,000
SP l. Development of agro-tourism 200,000 0 0 0 200,000SP m. Development of value added
agriculture product for domestic market and possibly for export
400,000 0 0 0 400,000
SP n. Animal traction 100,000 0 0 0 100,000SP o. Garlic and onion production --
Special situation of the enclave of Oecussi
10,000 0 0 0 10,000
SP p. Improving rice yields 100,000 0 0 0 100,000SP q. Small scale agro processing
including improved rice-milling50,000 0 0 0 50,000
37 2. Data Collection and Analysis 15,000 0 15,000 16,500 0 16,500 17,000 0 17,000 18,000 0 18,000 66,500SP 3. Promote and develop cooperativeSP a. Establish and implement a revolving rural
credit system1,250,000 0 0 0 1,250,000
SP b. Training youth for managing cooperatives in sucos and postos
100,000 0 0 0 100,000
Ministry of Agriculture, Forestry and Fisheries MAFF Page 6 of 105

Programme Matrix Road Map - Annex 3
CFET TFET (and other
funding sources)
Combined Total
CFET Other Funding Sources
Combined Total
CFET Other Funding Sources
Combined Total
CFET Other Funding Sources
Combined Total
Overall Totals2006/72003/4 2004/5 2005/6Priority Rank
Programs and/or Components
19 1. Land Use Survey 40,000 0 40,000 50,000 0 50,000 65,000 0 65,000 75,000 0 75,000 230,00023 2. Border Demarcation 40,000 0 40,000 35,000 0 35,000 40,000 0 40,000 50,000 0 50,000 165,00035 3. Geodetic Points Densification 38,000 0 38,000 39,000 0 39,000 58,000 0 58,000 50,000 0 50,000 185,000
2 1. Licensing and Regulations 10,000 150,000 160,000 10,000 200,000 210,000 15,000 100,000 115,000 20,000 100,000 120,000 605,000
24 2. Monitoring, Control and Surveillance of Marine Resources
20,000 150,000 170,000 20,000 150,000 170,000 25,000 200,000 225,000 30,000 100,000 130,000 695,000
2 3. Support to Communities for Fisheries (community based management; aquaculture)
45,000 100,000 145,000 50,000 100,000 150,000 55,000 100,000 155,000 60,000 100,000 160,000 610,000
20 4. Marine Protected Areas 20,000 50,000 70,000 15,000 50,000 65,000 20,000 50,000 70,000 20,000 200,000 220,000 425,00029 5. Collaboration with Private Sector for
Fisheries Industry Development10,000 1,500,000 1,510,000 15,000 1,000,000 1,015,000 20,000 1,000,000 1,020,000 25,000 1,000,000 1,025,000 4,570,000
32 6. National Hatchery Management 20,000 50,000 70,000 25,000 75,000 100,000 30,000 100,000 130,000 35,000 100,000 135,000 435,00041 / 33 7. Fisheries Stock Assessment and Data
Collection (Assessment, Survey and Studies - 41; Fisheries Statistics - 33)
30,000 1,300,000 1,330,000 40,000 1,500,000 1,540,000 50,000 1,000,000 1,050,000 60,000 1,000,000 1,060,000 4,980,000
SP 8. Promote offshore fisheries through foreign direct investment and possibly joint ventures
150,000 0 0 0 150,000
SP 9. Improve storage and marketing of fish 100,000 0 0 0 100,000
18 1. Support to Communities for Forest and
Watershed Management72,760 200,000 272,760 80,950 200,000 280,950 95,120 0 95,120 126,200 0 126,200 775,030
28 2. Community Partnerships in Commercial Forestry
43,520 0 43,520 55,450 0 55,450 75,450 0 75,450 75,900 0 75,900 250,320
6 3. Protected Natural Areas (PNA) 43,520 0 43,520 46,330 0 46,330 54,810 0 54,810 54,900 0 54,900 199,56011 4. Regulation and Policy 28,560 0 28,560 11,020 0 11,020 18,570 0 18,570 40,400 0 40,400 98,55014 5. Forest Protection/Forest Guardians 28,360 0 28,360 29,940 0 29,940 50,860 0 50,860 38,000 0 38,000 147,160
30 6. Forest Inventory 20,800 0 20,800 22,320 0 22,320 48,360 0 48,360 24,400 0 24,400 115,880
Program: Geography and Cadastre
Program: Fisheries
Program: Forestry
Ministry of Agriculture, Forestry and Fisheries MAFF Page 7 of 105

Programme Matrix Road Map - Annex 3
CFET TFET (and other
funding sources)
Combined Total
CFET Other Funding Sources
Combined Total
CFET Other Funding Sources
Combined Total
CFET Other Funding Sources
Combined Total
Overall Totals2006/72003/4 2004/5 2005/6Priority Rank
Programs and/or Components
SP 7. Promote forest re-planting 300,000 0 0 0 300,000SP 8. Promoting the replanting of new coconut
varieties in agriculturally neglected areas120,000 0 0 0 120,000
1. Prevention and Eradication of Livestock Diseases:
16 a. Vaccination 37,370 235,000 272,370 134,500 134,500 269,000 290,000 0 290,000 324,000 0 324,000 1,155,37033 b. Village Livestock Workers/Service
and Treatment37,250 430,000 467,250 60,000 137,250 197,250 50,000 50,000 100,000 50,000 0 50,000 814,500
40 c. Inspection and Regulation 5,000 0 5,000 5,000 0 5,000 5,000 0 5,000 5,000 0 5,000 20,00012 2. Support to Communities for Livestock
Production and Development50,000 0 50,000 50,000 0 50,000 50,000 0 50,000 50,000 0 50,000 200,000
31 3. Livestock Statistics/Data Collection 10,000 0 10,000 10,000 0 10,000 10,000 0 10,000 10,000 0 10,000 40,000
SP 4. Promote cattle production- cooperative 400,000 0 0 0 400,000
SP 5. Promoting dairy cooperative 200,000 0 0 0 200,000SP 6. Cattle raising (free range and feedlot) --
Special situation of the enclave of Oecussi50,000 0 0 0 50,000
1. Research and Laboratory
33 a. Laboratory Services 15,000 116,000 131,000 15,000 0 15,000 18,800 0 18,800 18,800 0 18,800 183,60039 b. Research and Development 10,000 0 10,000 15,000 0 15,000 15,200 0 15,200 15,200 0 15,200 55,400
2. Information and Extension 0 0 0 0 0 0 0 04 a. Information 25,000 190,000 215,000 27,000 0 27,000 27,000 0 27,000 27,000 0 27,000 296,000
12 b. Extension Support 20,000 0 20,000 23,000 0 23,000 23,000 0 23,000 23,000 0 23,000 89,00037 3. Agricultural Land Use and Geographic
Information System and Agro-Climatologic Information
21,000 0 21,000 24,000 0 24,000 24,000 0 24,000 24,000 0 24,000 93,000
24 1. Quarantine Legislation 10,000 100,000 110,000 10,000 0 10,000 10,000 0 10,000 10,000 0 10,000 140,00021 2. Quarantine Services 55,000 50,000 105,000 45,000 0 45,000 47,500 0 47,500 50,000 0 50,000 247,500
Total 1,637,005 9,505,700 17,772,705 1,831,985 7,656,450 9,488,435 2,166,435 4,500,000 6,666,435 2,351,300 2,600,000 4,951,300 38,878,875
Program: Quarantine
Program: Livestock
Program: Research and Extension Center
Ministry of Agriculture, Forestry and Fisheries MAFF Page 8 of 105

Programme Matrix Road Map -- Annex 3
TFET (and other
funding sources)
Combined Total
CFET Other Funding Sources
Combined Total
CFET Other Funding Sources
Combined Total
CFET Other Funding Sources
Combined Total
57,682 0 57,682 68,000 0 68,000 68,000 0 68,000 85,000 0 85,000 278,682
4 1. Investment Promotiona. Investment Service Center (one-stop Shop)
b. Liaison with Tourism to Support National Tourism Boardc. Industrial Products and Trade Exposition Centerd. Investment Promotion for Regional Trading Partnerse. Promotion project to include East Timor in Foreign Databasesf. Production of Investment Promotion Literatureg. Production of Website for Investment promotionh. Marketing of East Timor's Investment opportunitiesi. Promotional packages for investorsj. Small Enterprises Project I and II Business Skills Trainingk. SEP II Market Rehabilitation Projectl. ADB Micro-finance Development Projectm. Conference and Media interface project
SP n. Investor brochure 50,000 0 0 0 50,000
1 2. Policy and Regulatory Developmenta. Enactment of a Foreign Investment andCompany Lawb. Foreign Investor Registry systemc. Processing system for applications andcertificationsd. Coordination of investment with Customsand Tradee. Licensing requirements for foreignenterprises
Priority Rank
Programs and/or Components Overall Totals
2006/72003/4 2004/5 2005/6
Program: Division of Investment
Ministry of Development and Environment MDE Page 9 of 105

Programme Matrix Road Map -- Annex 3
TFET (and other
funding sources)
Combined Total
CFET Other Funding Sources
Combined Total
CFET Other Funding Sources
Combined Total
CFET Other Funding Sources
Combined Total
Priority Rank
Programs and/or Components Overall Totals
2006/72003/4 2004/5 2005/6
SP f. Preferential trade arrangements 50,000 0 0 0 50,0004 3. Divisional Training and Development
a. Capacity Building for foreign languagematerialsb. Technical assistance for promotion offoreign investmentc. SEP II Civil Service Economic Policy SkillsTrainingd. Technical Assistance for FDI processingand management
2 4. Foreign Investment Managementa. Foreign Investment Databaseb. Foreign Investment Certificationc. Feasibility Studies for Investment Sectorsd. Feasibility Studies for Major Capital Foreign Investmentse. Investment Coordination for Industrial Zone
f. Joint Projects for Seaport and Airport Development
SP g. Investment Forums 50,000 0 0 0 50,00065,000 0 65,000 72,000 0 72,000 87,000 0 87,000 87,000 0 87,000 311,000
1. Tourism Promotion a. Website development for tourism
promotion b. Multimedia materials and public relations
activitiesc. Packaged feasibility studies for FDI in Tourismd. Interactive and internal databases on Tourism attractionse. Visitor and touris reception centersf. Dissemination of Tourism information through overseas missions
Program: Division of Tourism
Ministry of Development and Environment MDE Page 10 of 105

Programme Matrix Road Map -- Annex 3
TFET (and other
funding sources)
Combined Total
CFET Other Funding Sources
Combined Total
CFET Other Funding Sources
Combined Total
CFET Other Funding Sources
Combined Total
Priority Rank
Programs and/or Components Overall Totals
2006/72003/4 2004/5 2005/6
g. Establishment of Tourism Statistics Systems and Databaseh. Accede to World Trade Organization
i. Support for the establishment of Tourism Business Association
SP j. Tourism Development -- Special situation of the enclave of Oecussi
75,000 0 0 0 75,000
2. Policy and Regulatory Development a. Creation of National Tourism Board
b. Legal and regulatory framework for tourism
c. Tourism policy frameworkd. Joint planning on airport tourist facilities
e. Joint planning for seaport tourist facilities
f. Strategic planning for resort and coastal development
g. Cooperative projects on water and sanitation with public works3. Divisional Training and Development
a. Training materials, seminars and workshops on tourismb. Overseas capacity building trainingc. Technical assistance for sector planning skillsd. Establishment of a tourism-related performing arts centere. Prepare and manage hospitality trainingf. Workshop and seminar materials database
86,000 0 86,000 132,000 0 132,000 133,000 0 133,000 134,000 0 134,000 485,000 1. Environment Regulation
a. Establishment of EIA regulations and pollution supervisionb. Establishment of Watershed and Beach policy
Program: Division of Environment
Ministry of Development and Environment MDE Page 11 of 105

Programme Matrix Road Map -- Annex 3
TFET (and other
funding sources)
Combined Total
CFET Other Funding Sources
Combined Total
CFET Other Funding Sources
Combined Total
CFET Other Funding Sources
Combined Total
Priority Rank
Programs and/or Components Overall Totals
2006/72003/4 2004/5 2005/6
c. Establishment of National Environment Policy
2. Divisional Training and Developmenta. Short EIA study courses in Indonesiab. Portuguese and English Language Training
c. Capacity Building workshops for District Development Officersd. Environmental supervision and Chemical Training for Laboratory staffe. Environmental Administration Management Coursef. Other environmental training courses
3. Environmental assessment, monitoring and investigation
a. Reduction of pollution in Dili and urban areasb. Establishment of environmental laboratoryc. Preparation of Licensing and Pollution standards for business and governmentd. Environmental Impact Assessment and Monitoring
4. Environmental Awareness and Educationa. Production of brochures, posters and other materials about the Environment and Division activitiesb. World Clean-up Dayc. Local campaign for protection of threatened species
5. Protection and Conservation of Natural Resources and Biodiversity
a. Establishment and management of inter-departmental environmental working groups
b. Undertake baseline research on natural resources and biodiversity
Ministry of Development and Environment MDE Page 12 of 105

Programme Matrix Road Map -- Annex 3
TFET (and other
funding sources)
Combined Total
CFET Other Funding Sources
Combined Total
CFET Other Funding Sources
Combined Total
CFET Other Funding Sources
Combined Total
Priority Rank
Programs and/or Components Overall Totals
2006/72003/4 2004/5 2005/6
89,000 0 89,000 131,000 0 131,000 152,000 0 152,000 153,000 0 153,000 525,000
1 1. Institutions and Capacity Building of Public and Private Sector
a. Institutional Development 1) Provision of financial resources/budget to raise the
organization
2) Planning, designing and operationalizing the organization3) Recruitment of local staff and placement of international staff
4) Allocation of office space5) Procurement of office equipment/transport, etc.6) Technical laboratory equipment and database development with supoprt from USAID
7) Technical library and Map cell b. Capacity Building
1) Assessment of the public and private sector existing capacity vis-à-vis the skills need and identifying the gap.
2) Public sector skill and capacity building through in-house training, out-of-country specialized training and hands-on apprenticeships
3) Developing a core mass of 20 East Timorese in the critical areas of expertise for the development of the oil and gas and mining sector
4) Commencement of an extensive and dynamic private sector skills and capacity building training for East Timorese enabling them to benefit from the emerging employment opportunities from the mining and oil and gas sector development
2 2. Putting in place enabling legal and regulatory framework
Program: Division of Mineral Resources and Energy Policy
Ministry of Development and Environment MDE Page 13 of 105

Programme Matrix Road Map -- Annex 3
TFET (and other
funding sources)
Combined Total
CFET Other Funding Sources
Combined Total
CFET Other Funding Sources
Combined Total
CFET Other Funding Sources
Combined Total
Priority Rank
Programs and/or Components Overall Totals
2006/72003/4 2004/5 2005/6
a. Mining and oil and Gas laws and legal regimes1) Enabling legal and regulatory framework for Mining Law and Petroleum Law
b. Mining and oil and Gas Sector Management Systems and Procedures
1) Enabling legal and regulatory framework for Mining System and Procedure and Petroleum System and Procedure
3. Sectoral Development and Promotion
a. Survey, mapping and reliable, relevant and representative inventory of the Mining and Oil and Gas Resource Base
b. Mineral Resources potential promotion49,000 0 49,000 27,000 0 27,000 25,000 0 25,000 24,000 0 24,000 125,000
1. Finance
2. Administration
3. Human Resources
154,000 0 154,000 92,000 0 92,000 84,000 0 84,000 81,000 0 81,000 411,000
1. Company’s Training, Information and Capacity Building Section:
2. Cooperatives’ Support and Attendance Section
3. Small and Micro Enterprises’ Support and Attendance Section
4. Informal Sector and Self-employment SupportSection.
Program: Administration and Finance
Program: Office of Support to Development
Ministry of Development and Environment MDE Page 14 of 105
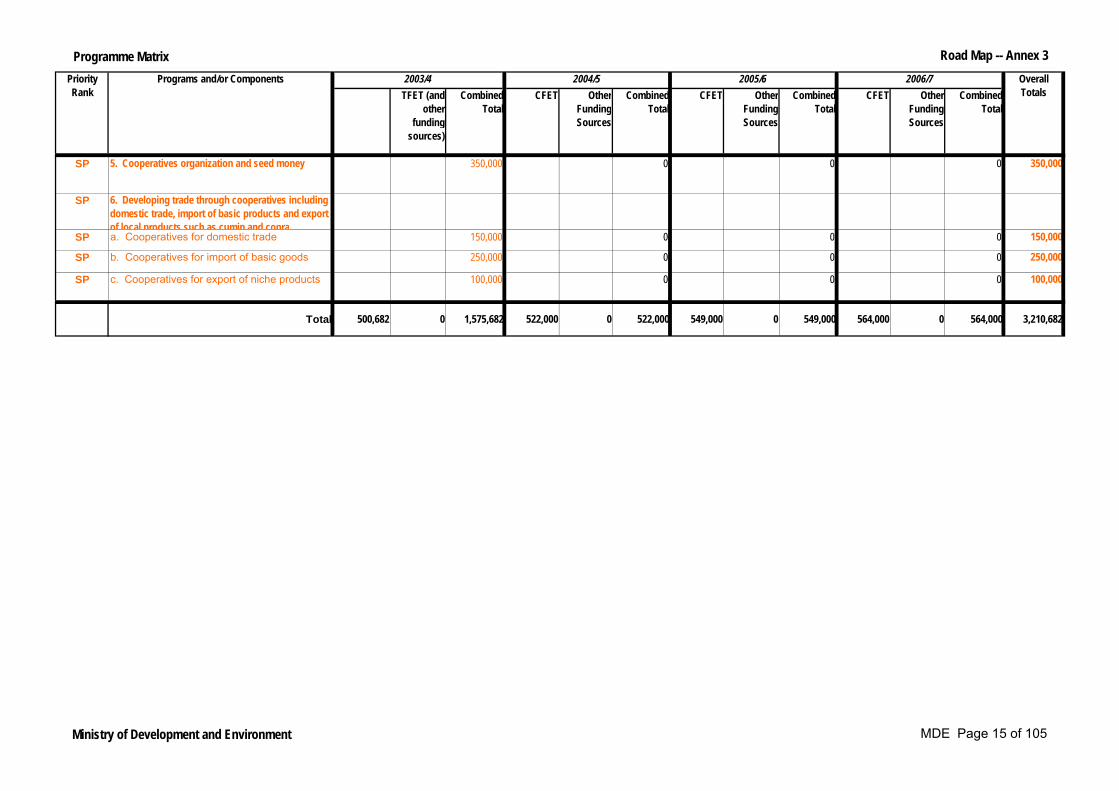
Programme Matrix Road Map -- Annex 3
TFET (and other
funding sources)
Combined Total
CFET Other Funding Sources
Combined Total
CFET Other Funding Sources
Combined Total
CFET Other Funding Sources
Combined Total
Priority Rank
Programs and/or Components Overall Totals
2006/72003/4 2004/5 2005/6
SP 5. Cooperatives organization and seed money 350,000 0 0 0 350,000
SP 6. Developing trade through cooperatives including domestic trade, import of basic products and export of local products such as cumin and copra
SP a. Cooperatives for domestic trade 150,000 0 0 0 150,000
SP b. Cooperatives for import of basic goods 250,000 0 0 0 250,000
SP c. Cooperatives for export of niche products 100,000 0 0 0 100,000
Total 500,682 0 1,575,682 522,000 0 522,000 549,000 0 549,000 564,000 0 564,000 3,210,682
Ministry of Development and Environment MDE Page 15 of 105

Programme Matrix Road Map -- Annex 3
Program/Project 2003/4 2004/5 2005/6 2006/7Director/Asdir Priority
Program 1: Expand Access and Improve Internal Efficiency 18.83 18.98 19.69 20.49Manage and deliver Early Childhood Education Jardim da Infância High/Routine 0.22 0.23 0.23 0.23Manage and deliver primary education Ensino Primária High/Routine 8.25 8.94 9.22 9.41Manage and deliver lower secondary education Pre Secundario High/Routine 2.33 2.94 3.27 3.59Manage and deliver upper secondary education Ensino Secundário High/Routine 1.42 1.85 2.12 2.36Manage and deliver technical and vocational education ETV High/Routine 0.70 0.99 1.00 1.13Information Campaign on the Importance of Schooling Ensino Primária High/03 0.10Children Drop-out and Repetition Prevention Ensino Primária High/03 2.80 2.80 2.70 2.50Multi-grade Schools Ensino Primária Medium/04 0.10 0.10 0.10Community-Based Pre-School Development Jardim da Infância Medium/04 0.05 0.05 0.05School Location Planning Pólitica e Planificação Medium/04 0.08School Health and Nutrition Ensino Primária Low/06 1.00 1.00 1.00 1.10
SP Support to Community schools 0.25 SP Support to Church schools 0.50 SP Support to Church schools -- Secondary education 1.25
Program 2: Improve the Quality of Education 20.16 20.13 19.55 18.01Manage and deliver teacher training IFCP High/Routine 0.12 0.11 0.11 0.11Establishment Parent Teacher associations Vice Director Geral High/03 0.05 0.05 0.05National Examinations Exame Nacional High/Routine 0.30 0.30 0.30 0.30School Supervision and Improvement Supervisão High/Routine 0.05 0.05 0.05 0.05Introduction of Teaching Diploma IFCP High/03 0.30 0.40 0.50 0.50Teacher and Headmaster Training [IFCP] IFCP High/03 0.23 0.42 0.50 0.50Language of Instruction Development (Tetun and Portuguese) IFCP High/03 1.50 1.50 1.50Curriculum Review and Development Curriculo High/03 0.70 0.30Rehabilitation and Capacity Building of the Institute for Continuing Education IFCP High/03 0.06Fundamental School Quality (TFET2) FSQP /João Alves High/03 15.30 15.00 15.00 15.00International Cooperation and Linkages Política e Planificação Medium/03 0.05 0.05 0.05 0.05100 Schools Project (UNICEF-assisted) Ensino Primária Medium/03 1.50 1.50 1.50 1.50Teachers’ Career Development and Welfare As Professores Medium/04 0.03Textbooks and Teaching Materials Development Curriculo Medium/04 0.40Redefine Technical-Vocational Education. ETV Medium/04 0.03
Program 3: Build Internal Management Capacity and Improve Services Delivery 2.15 1.78 1.52 1.46Manage and administer central and district functions Adm/ Finanças High/Routine 1.35 1.38 1.42 1.41Strengthening planning,policy formulation,project devt.monitoring and evaluation Política e Planificação High/03 0.10 0.05 0.05 0.05
NDP Priority Programs and sequenced Activities 2003/4 to 2006/7
Ministry of Education, Culture, Youth and Sports MECYS Page 16 of 108

Programme Matrix Road Map -- Annex 3
Establish legislative, regulatory and policy framework for education sector [FSQP] Política e Planificação High/03 0.50 0.10 0.05Training for Educational Managers IFCP High/03 0.10 0.05Project to Build Capacity for Policy Formulation, Planning and Project Development Política e Planificação High/03 0.05 0.05EMIS Development Política e Planificação High/03 0.05 0.05Warehousing Expansion and Logistics Development. Administração Medium/04 0.10
Program 4: Non-Formal Education and Adult Literacy 0.39 0.44 0.44 0.46Manage and deliver literacy program Ensino Não Formal High/Routine 0.12 0.14 0.13 0.13Literacy Campaign Ensino Não Formal High/03 0.27 0.27 0.27 0.27Distance Learning Project. Ensino Não Formal Medium/03Literacy Project for Young Illiterate Women Ensino Não Formal Medium/04 0.02 0.04Community Reading Centers Project. Ensino Não Formal Low/06 0.05Livelihood project 1.00 1.00 1.00 1.00
Program 5: Develop Tertiary Education 11.23 6.74 4.30 4.27Manage and deliver tertiary education Ensino Universitário High/Routine 10.83 6.14 4.20 4.27Curriculum Development Ensino Universitário High/03 0.40 0.30Textbooks and Teaching Materials Development Ensino Universitário Medium/04 0.30Staff Development Ensino Universitário Medium/05 0.10
Program 6: Promote East Timorese Culture and the Arts 0.28 0.66 0.66 0.26Manage and deliver cultural program Cultura High/Routine 0.13 0.16 0.16 0.16Survey and Documentation of Traditional Culture/Arts Project Cultura High/03 0.12 0.40 0.40Institutional Capacity Building for Culture Project Cultura High/03 0.03Cultural Renewal and Promotion Project Cultura Medium/04 0.10 0.10 0.10
Program 7: Promote Youth Welfare Juventude 0.19 0.29 0.29 0.29Manage and deliver youth program Juventude High/Routine 0.12 0.13 0.13 0.13Structuring and Institutional Support to Youth Sector Development Juventude High/03 0.07 0.07 0.07 0.07Project to Train Unskilled Youth Juventude Medium/04 0.10 0.10 0.10
Program 8: Promote Physical Education and Sports 0.30 0.29 0.29 0.18Manage and deliver sports program Desporto High/Routine 0.15 0.14 0.14 0.13Structuring and Capacity-Building of Sports Institutions Project Desporto High/03 0.10Information Campaign Project on the Importance of Physical Education and Sports. Desporto High/03 0.05Teachers/Coaches Training Project Desporto Medium/04 0.05 0.05 0.05Rehabilitation of Sports Facilities Project. Desporto Medium/04 0.10 0.10
TOTAL 53.53 49.31 46.73 45.42Notes: 1. Bilateral inputs for programs like the University are not distributed for years after 2003/4 so years after this are understated2. High/Routine indicates that the priority is high and the activity is a core function of the Ministry, other priorities are designated High, Medium or Low with a recommended commencement year added eg High/03 or Medium/04.3. Activities marked in red have been added to the original NDP activities to fill service delivery or priority gaps [see attached justification]
Ministry of Education, Culture, Youth and Sports MECYS Page 17 of 108

Programme Matrix Road Map -- Annex 3
CFET TFET (and other
funding sources)
Combined Total
CFET Other Funding Sources
Combined Total
CFET Other Funding Sources
Combined Total
CFET Other Funding Sources
Combined Total
1. Office of the Director-General 16,000 16,000 15,000 15,000 15,000 15,000 15,000 15,000 61,000
1 a. Establish the Office of the Director-General
1 b. Provision of policy advice to the Office of the Minister
1 c. Management of the Ministry
2. Bilateral Affairs 76,000 76,000 76,000 76,000 96,000 96,000 76,000 76,000 324,000
1 a. Establishment of 3 embassies
b. Accompany Minister and attendofficial bilateral meetings
c. Participate in Joint MinisterialCommission between Timor-Leste andIndonesia to finalize border demarcation
d. Capacity Building
e. Appointment of 4 honorary consuls
f. Construct and fit-out HQ building inMarconi area
g. Timor-Leste Embassy support1) Establish office and recruit staff
2) Support and liaise with Timor-Lesteembassies
3) Capacity building
3. Multilateral Affairs 70,000 70,000 70,000 70,000 90,000 90,000 270,000 270,000 500,000
1 a. Support Timor-Leste's interests at international events
1) UN General Assembly
2) CPLP meetings
3) Conferences on international issues
Program: Foreign Affairs and Cooperation
Programs and/or ComponentsPriority Rank
Overall Totals2003/4 2004/5 2005/6 2006/7
Ministry of Foreign Affairs and Cooperation MFAC Page 18 of 108
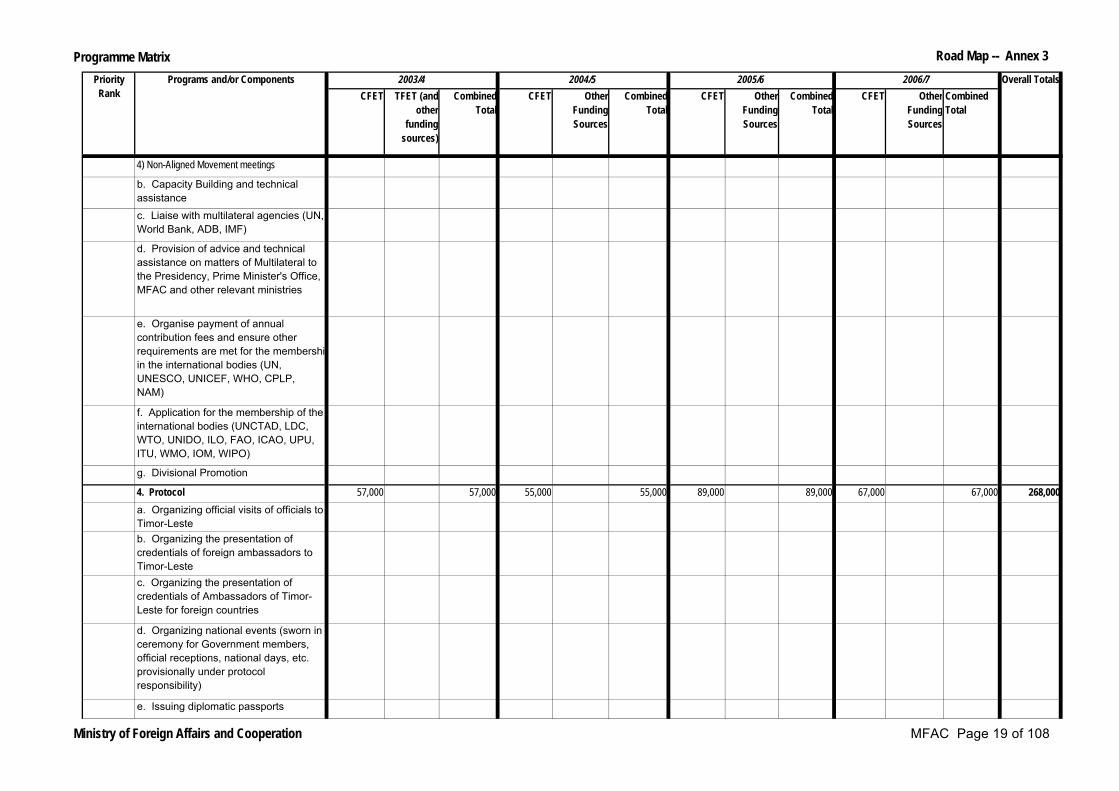
Programme Matrix Road Map -- Annex 3
CFET TFET (and other
funding sources)
Combined Total
CFET Other Funding Sources
Combined Total
CFET Other Funding Sources
Combined Total
CFET Other Funding Sources
Combined Total
Programs and/or ComponentsPriority Rank
Overall Totals2003/4 2004/5 2005/6 2006/7
4) Non-Aligned Movement meetings
b. Capacity Building and technical assistance
c. Liaise with multilateral agencies (UN, World Bank, ADB, IMF)
d. Provision of advice and technical assistance on matters of Multilateral to the Presidency, Prime Minister's Office, MFAC and other relevant ministries
e. Organise payment of annual contribution fees and ensure other requirements are met for the membership in the international bodies (UN, UNESCO, UNICEF, WHO, CPLP, NAM)
f. Application for the membership of the international bodies (UNCTAD, LDC, WTO, UNIDO, ILO, FAO, ICAO, UPU, ITU, WMO, IOM, WIPO)
g. Divisional Promotion
4. Protocol 57,000 57,000 55,000 55,000 89,000 89,000 67,000 67,000 268,000
a. Organizing official visits of officials to Timor-Lesteb. Organizing the presentation of credentials of foreign ambassadors to Timor-Lestec. Organizing the presentation of credentials of Ambassadors of Timor-Leste for foreign countries
d. Organizing national events (sworn in ceremony for Government members, official receptions, national days, etc. provisionally under protocol responsibility)
e. Issuing diplomatic passports
Ministry of Foreign Affairs and Cooperation MFAC Page 19 of 108

Programme Matrix Road Map -- Annex 3
CFET TFET (and other
funding sources)
Combined Total
CFET Other Funding Sources
Combined Total
CFET Other Funding Sources
Combined Total
CFET Other Funding Sources
Combined Total
Programs and/or ComponentsPriority Rank
Overall Totals2003/4 2004/5 2005/6 2006/7
f. Issuing ID card for diplomatic consular and international organization staff. Regular process
g. Recommendation for the issuances of car plates for diplomatic, consular and international organizations' official cars
h. Issuing recommendation for diplomatic exemption tax (ref Vienna Convention)i. Issuing of recommendations for aircraft clearancej. Co-organizing security service for diplomatic mission, international organization, accredited in Timor-Leste and for official foreign visitors
k. Development and enhancement of protocol guidelines for diplomatic and consular corps
l. Provision of advice and technical assistance on matters of protocol to the Presidency, Prime Minister's Office, MFAC and other relevant ministries
m. Maintain and publish diplomatic contact list. Regular process; annually reviewed.
n. Capacity building and technical assistance5. Regional Affairs 24,000 24,000 24,000 24,000 44,000 44,000 24,000 24,000 116,000a. Accompany Minister and participate in regional meetings -- Southwest Pacific Dialogue Forum, Pacific Islands Forum, ASEAN, ACP/EU Cotonou Agreement, ASEAN Regional Forum and others
b. Capacity Building
Ministry of Foreign Affairs and Cooperation MFAC Page 20 of 108

Programme Matrix Road Map -- Annex 3
CFET TFET (and other
funding sources)
Combined Total
CFET Other Funding Sources
Combined Total
CFET Other Funding Sources
Combined Total
CFET Other Funding Sources
Combined Total
Programs and/or ComponentsPriority Rank
Overall Totals2003/4 2004/5 2005/6 2006/7
c. Divisional promotiond. A comprehensive study on future direction of Southwest Pacific Dialogue (SwPD)d. Cooperation and Economic Affairs
6. Legal, Treaties and Human Rights Affairs 21,000 21,000 21,000 21,000 41,000 41,000 21,000 21,000 104,000
a. Complete ratification of internatinal treaties which are still in process in the National Parliamentb. Draft national legislation on deposited international treatiesc. Finalize all country agreementsd. Provide policy advice on proposed international treaties to the MFAC, COM, and the National Parliament
e. Information campaigns on proposed international treaties to civil society
f. Capacity building and TAg. Participate in Joint Ministerial Commission betwee Timor-Leste and Indonesia and other related meetings concerning legal (such as border demarcation) and human rights
h. Provision of legal advice to Ministry
i. Research, Planning and Development office
7. Public Affairs 25,000 25,000 25,000 25,000 45,000 45,000 25,000 25,000 120,000a. Capacity building and TAb. Provision of press releases (including planned activities of the Minister)
Ministry of Foreign Affairs and Cooperation MFAC Page 21 of 108
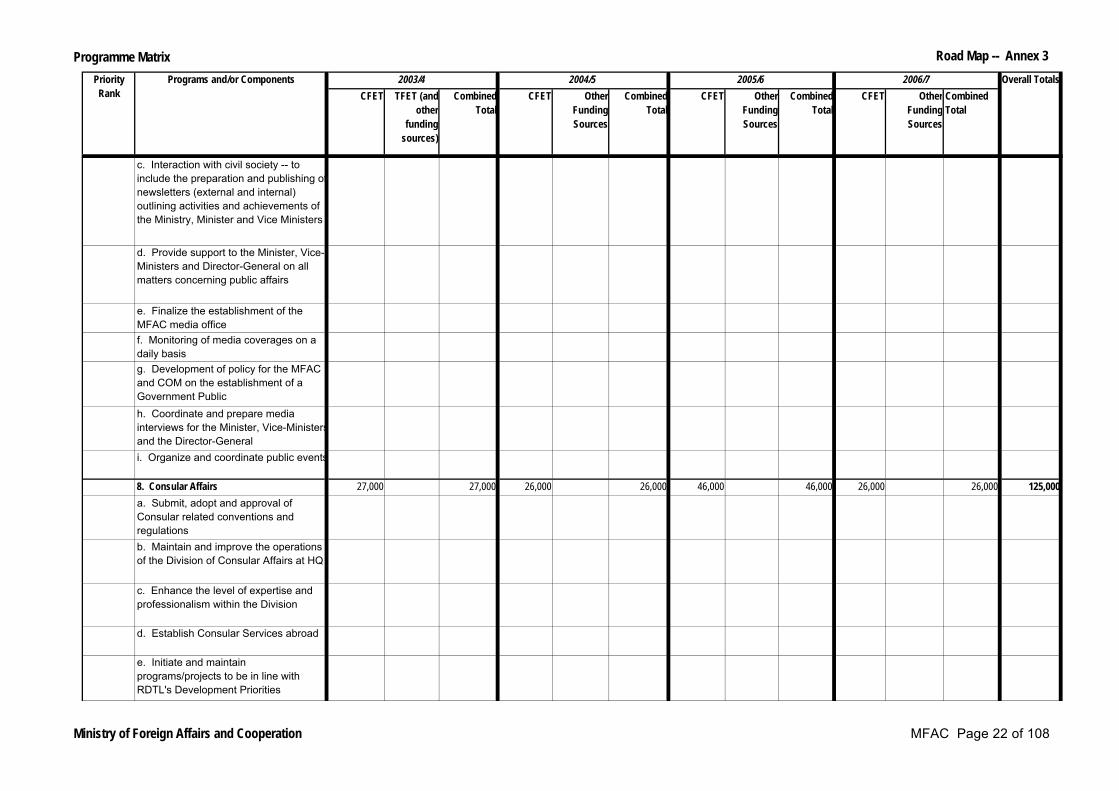
Programme Matrix Road Map -- Annex 3
CFET TFET (and other
funding sources)
Combined Total
CFET Other Funding Sources
Combined Total
CFET Other Funding Sources
Combined Total
CFET Other Funding Sources
Combined Total
Programs and/or ComponentsPriority Rank
Overall Totals2003/4 2004/5 2005/6 2006/7
c. Interaction with civil society -- to include the preparation and publishing of newsletters (external and internal) outlining activities and achievements of the Ministry, Minister and Vice Ministers
d. Provide support to the Minister, Vice-Ministers and Director-General on all matters concerning public affairs
e. Finalize the establishment of the MFAC media officef. Monitoring of media coverages on a daily basisg. Development of policy for the MFAC and COM on the establishment of a Government Public h. Coordinate and prepare media interviews for the Minister, Vice-Ministers and the Director-Generali. Organize and coordinate public events
8. Consular Affairs 27,000 27,000 26,000 26,000 46,000 46,000 26,000 26,000 125,000a. Submit, adopt and approval of Consular related conventions and regulations
b. Maintain and improve the operations of the Division of Consular Affairs at HQ
c. Enhance the level of expertise and professionalism within the Division
d. Establish Consular Services abroad
e. Initiate and maintain programs/projects to be in line with RDTL's Development Priorities
Ministry of Foreign Affairs and Cooperation MFAC Page 22 of 108

Programme Matrix Road Map -- Annex 3
CFET TFET (and other
funding sources)
Combined Total
CFET Other Funding Sources
Combined Total
CFET Other Funding Sources
Combined Total
CFET Other Funding Sources
Combined Total
Programs and/or ComponentsPriority Rank
Overall Totals2003/4 2004/5 2005/6 2006/7
f. Promote public awareness of consular services
g. Casework Services Provision (to citizens in the circumstances of a consular nature)h. Engage, liaise and network with foreign consulates, institutions, church groups, NGOs
i. Inter-agencies coordiantion and cooperation9. Administration 117,000 117,000 116,000 116,000 136,000 136,000 116,000 116,000 485,000a. Financeb. Administrationc. IT&Cd. Logisticse. Human Resource Managementf. Translation and Interpretation
Total 1,515,000 2,547,000 4,062,000 1,507,000 2,313,000 3,820,000 1,676,000 155,000 1,831,000 1,717,000 155,000 1,872,000 11,585,000
Ministry of Foreign Affairs and Cooperation MFAC Page 23 of 108
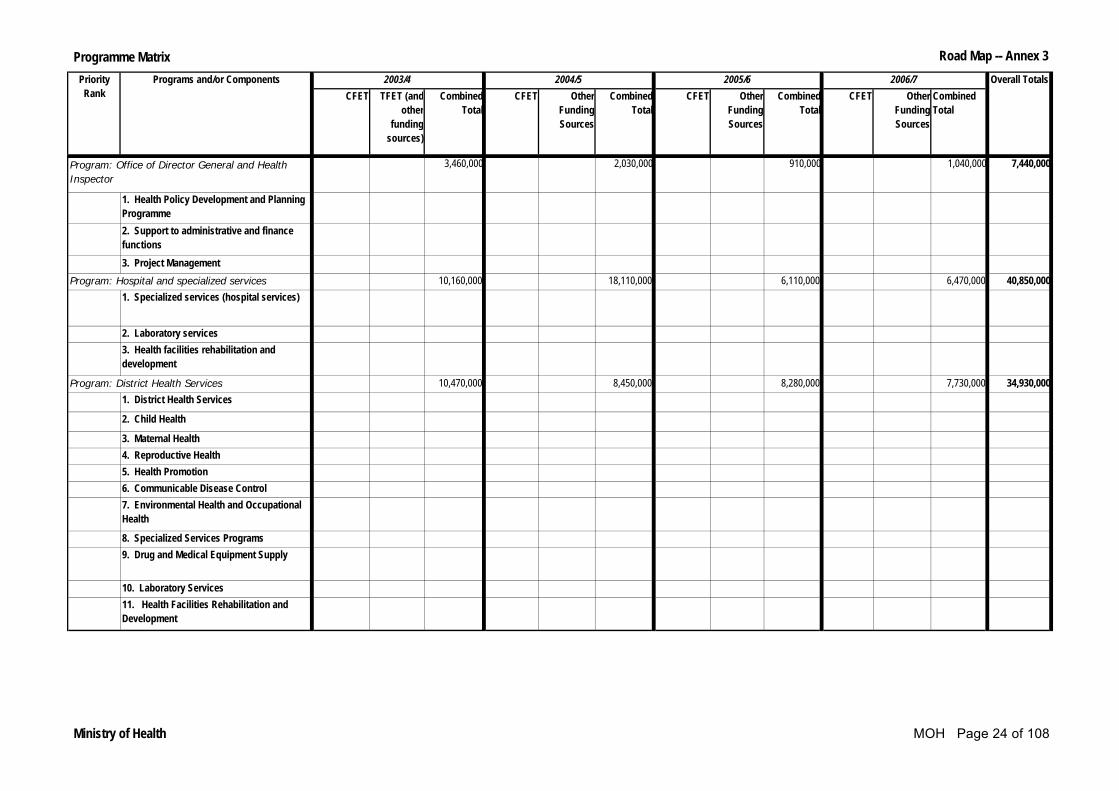
Programme Matrix Road Map -- Annex 3
CFET TFET (and other
funding sources)
Combined Total
CFET Other Funding Sources
Combined Total
CFET Other Funding Sources
Combined Total
CFET Other Funding Sources
Combined Total
3,460,000 2,030,000 910,000 1,040,000 7,440,000
1. Health Policy Development and Planning Programme
2. Support to administrative and finance functions
3. Project Management
10,160,000 18,110,000 6,110,000 6,470,000 40,850,000 1. Specialized services (hospital services)
2. Laboratory services3. Health facilities rehabilitation and development
10,470,000 8,450,000 8,280,000 7,730,000 34,930,0001. District Health Services
2. Child Health
3. Maternal Health4. Reproductive Health5. Health Promotion
6. Communicable Disease Control 7. Environmental Health and Occupational
Health
8. Specialized Services Programs9. Drug and Medical Equipment Supply
10. Laboratory Services11. Health Facilities Rehabilitation and Development
Program: Hospital and specialized services
Program: District Health Services
Program: Office of Director General and Health Inspector
Programs and/or ComponentsPriority Rank
Overall Totals2003/4 2004/5 2005/6 2006/7
Ministry of Health MOH Page 24 of 108

Programme Matrix Road Map -- Annex 3
CFET TFET (and other
funding sources)
Combined Total
CFET Other Funding Sources
Combined Total
CFET Other Funding Sources
Combined Total
CFET Other Funding Sources
Combined Total
Programs and/or ComponentsPriority Rank
Overall Totals2003/4 2004/5 2005/6 2006/7
SP 1. Provide health kits 50,000 0 0 0 50,000
SP 2. Support Church and NGOs in health service delivery
100,000 0 0 0 100,000
SP 3. Horses for health workers 200,000 0 0 0 200,000SP 4. Motorcycles for health workers 250,000 0 0 0 250,000
Total 0 0 24,690,000 0 0 28,590,000 0 0 15,300,000 0 0 15,240,000 83,820,000
Program: Promoting Health: Extension of access to basic health services through increasing the number of mobile clinics and/or health posts in inaccessible areas
Ministry of Health MOH Page 25 of 108

Programme Matrix Road Map -- Annex 3
CFET TFET (and other
funding sources)
Combined Total
CFET Other Funding Sources
Combined Total
CFET Other Funding Sources
Combined Total
CFET Other Funding Sources
Combined Total
1. Police College 1,400,000 1,600,000 1,800,000 1,900,000 6,700,000
a. Recruit Training
b. Field Training Program
c. Supervision and Management Training
d. Specialist Training
e. Training of Trainers
2. Police Operations 7,500,000 7,500,000 9,000,000 9,000,000 33,000,000
a. General Duties
b. Criminal Investigations
c. Internal Security and Intelligence d. Traffic Control and Investigatione. Community Policing3. Administration 900,000 1,500,000 1,000,000 1,100,000 4,500,000a. Planning and Finance
b. Human Resources Management c. Logistics
4. Border Patrol 2,000,000 1,200,000 1,400,000 1,500,000 6,100,000a. Border Patrol b. Marine Unit 5. Immigration Service 800,000 200,000 250,000 300,000 1,550,000a. Establishment of an effective Immigration Service
6. Rapid Intervention Units 500,000 600,000 700,000 800,000 2,600,000a. Maintain effective RIU in Dilib. Maintain effective RIU in Baucau
SP 7. Recruitment of 500 new Police Cadets for Rapid Deployment Group (including appropriate equipment for communication and transport)
5,000,000 0 0 0 5,000,000
Programs and/or ComponentsPriority Rank
Overall Totals2003/4 2004/5 2005/6 2006/7
Program: Timor-Leste Police Service
Ministry of Interior Page 26 of 108

Programme Matrix Road Map -- Annex 3
CFET TFET (and other
funding sources)
Combined Total
CFET Other Funding Sources
Combined Total
CFET Other Funding Sources
Combined Total
CFET Other Funding Sources
Combined Total
Programs and/or ComponentsPriority Rank
Overall Totals2003/4 2004/5 2005/6 2006/7
1. Drawing up of Laws, Regulations and
Procedures (Organic law: its approval and implementation)
0 0 0 0 0
2. Institutional Development of the Fire fighters
467,340 0 467,340 467,340 0 467,340 532,000 0 532,000 532,000 0 532,000 1,998,680
a. Training b. Protection and safety of the lives and goods of citizens against fires, accidents and other serious hazards
1. Creation of a National Systems of Communication for the Disaster Management Areas
a. Study for the creation of an internal communication system
2,500 0 2,500 0 0 0 0 0 0 0 0 0 2,500
b. Setting up the communication system 10,000 0 10,000 10,000 0 10,000 10,000 0 10,000 10,000 0 10,000 40,000
c. Acquisition of equipments 0 0 0 0 0d. Installation of equipments 0 0 0 0 02. Development of trust to vulnerable communities
a. Civic education and awareness campaign to the vulnerable population
10,000 0 10,000 8,000 0 8,000 8,000 0 8,000 8,000 0 8,000 34,000
b. Creation of a pre-warning system 10,000 0 10,000 5,000 0 5,000 5,000 0 5,000 5,000 0 5,000 25,000
3. Assisting Disaster victims a. Supplying of food for the disasters victims (flood, eroision, tropical hurricanes, rural fires, drought, etc.)
50,000 0 50,000 50,000 0 50,000 50,000 0 50,000 50,000 0 50,000 200,000
b. Acquisition of materials for building of houses
30,000 0 30,000 30,000 0 30,000 30,000 0 30,000 30,000 0 30,000 120,000
Program: Firefighters (Bombeiros)
Program: National Disasters Management Office
Ministry of Interior Page 27 of 108

Programme Matrix Road Map -- Annex 3
CFET TFET (and other
funding sources)
Combined Total
CFET Other Funding Sources
Combined Total
CFET Other Funding Sources
Combined Total
CFET Other Funding Sources
Combined Total
Programs and/or ComponentsPriority Rank
Overall Totals2003/4 2004/5 2005/6 2006/7
c. Acquisition of non-edible products 10,000 0 10,000 10,000 0 10,000 10,000 0 10,000 10,000 0 10,000 40,000
4. Redefinition of the organic structure, staff, tasks and responsibilities of the National Disaster Management Office
a. Drawing up of the organic law, procedures and the National Disasters Management Plan, inlcuding approval and distribution
1,500 0 1,500 1,500 0 1,500 0 0 0 0 0 0 3,000
b. Restructuring the staff 29,004 0 29,004 34,356 0 34,356 34,356 0 34,356 34,356 0 34,356 132,072c. Professional Trainings 10,000 0 10,000 15,000 0 15,000 10,000 0 10,000 10,000 0 10,000 45,0001) District Disaster Management Orientation (DDMO)
2) Emergency Management (EM)3) City Block Disaster Management (CBDM)
4) Seminars and colloquiumd. Buildings and equipment 10,000 0 10,000 10,000 0 10,000 10,000 0 10,000 10,000 0 10,000 40,0001) Rehabilitation of the NDMO building2) Acquisition of equipments
1. Institutional capacity building of the Civil Protection Board
a. Organization of the Services 0 0 0 0 01) Setting up of the Civil Protection Board
2) Drawing up of Laws, regulations and procedures
2. Institutional Development of the Civil Security
a. Drawing up of Lwas, Regulations and Proceedings
0 0 0 0 0
Program: Civil Protection Board
Ministry of Interior Page 28 of 108

Programme Matrix Road Map -- Annex 3
CFET TFET (and other
funding sources)
Combined Total
CFET Other Funding Sources
Combined Total
CFET Other Funding Sources
Combined Total
CFET Other Funding Sources
Combined Total
Programs and/or ComponentsPriority Rank
Overall Totals2003/4 2004/5 2005/6 2006/7
b. Redefinition of the Organic structure, proposal regarding staff, tasks and responsibilities
0 0 0 0 0
c. Training/Capacity Building 0 0 0 0 0d. Building, equipment and transport 0 0 0 0 0
1) Rehablitation/ Construction of installations for the Civil Security
2) Acquisition of equipments
3) Acquisition of transports
e. Creation of a national communication system, in coordination with the communication system of the Police
0 0 0 0 0
1) Study for the creation of a Civil Service internal communication system
2) Setting up of the electronic control system on some buildings (President and PM offices)
3 3. Security Management for Public Buildings
0 0 0 0 0
2 4. Creation of a National Communication System
a. Study for the creation of a Civil Service internal communication system
0 0 0 0 0
b. Setting up of the electronic control system on some buildings
0 0 0 0 0
Total 640,344 0 18,740,344 641,196 0 13,241,196 699,356 0 14,849,356 699,356 0 15,299,356 62,130,252
Ministry of Interior Page 29 of 108
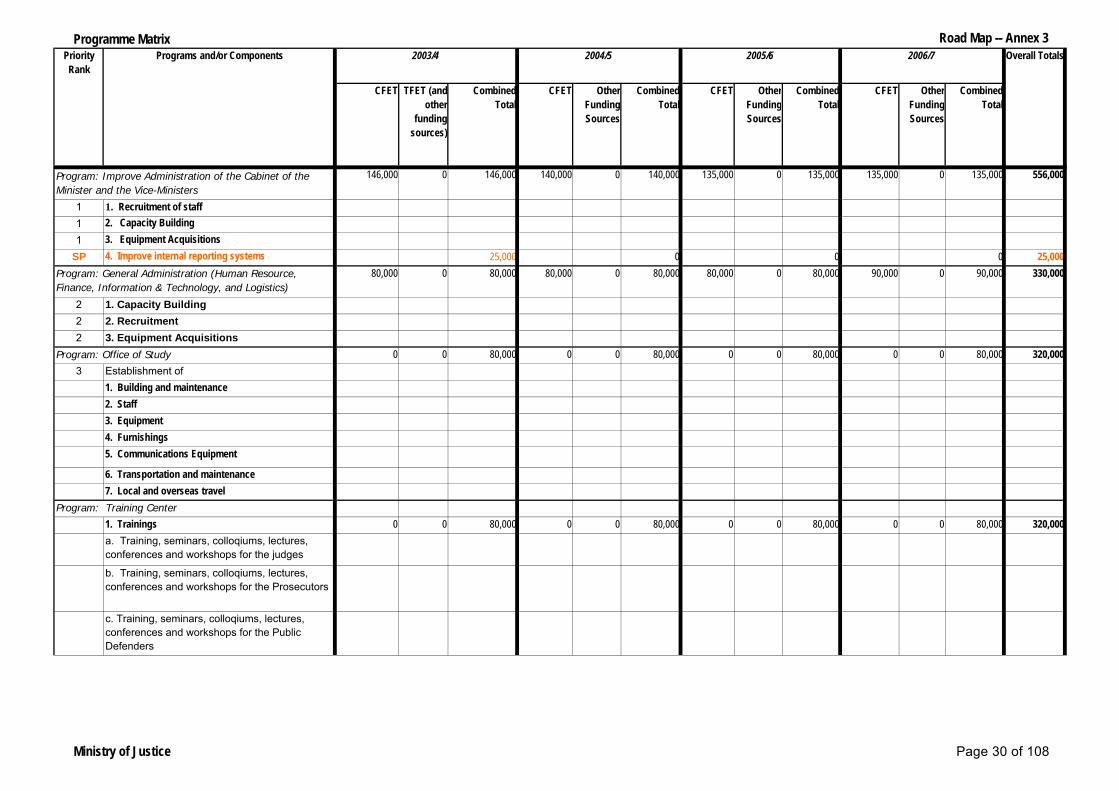
Programme Matrix Road Map -- Annex 3
CFET TFET (and other
funding sources)
Combined Total
CFET Other Funding Sources
Combined Total
CFET Other Funding Sources
Combined Total
CFET Other Funding Sources
Combined Total
146,000 0 146,000 140,000 0 140,000 135,000 0 135,000 135,000 0 135,000 556,000
1 1. Recruitment of staff1 2. Capacity Building
1 3. Equipment Acquisitions
SP 4. Improve internal reporting systems 25,000 0 0 0 25,00080,000 0 80,000 80,000 0 80,000 80,000 0 80,000 90,000 0 90,000 330,000
2 1. Capacity Building2 2. Recruitment2 3. Equipment Acquisitions
0 0 80,000 0 0 80,000 0 0 80,000 0 0 80,000 320,0003 Establishment of
1. Building and maintenance2. Staff3. Equipment4. Furnishings5. Communications Equipment
6. Transportation and maintenance7. Local and overseas travel
1. Trainings 0 0 80,000 0 0 80,000 0 0 80,000 0 0 80,000 320,000a. Training, seminars, colloqiums, lectures, conferences and workshops for the judges
b. Training, seminars, colloqiums, lectures, conferences and workshops for the Prosecutors
c. Training, seminars, colloqiums, lectures, conferences and workshops for the Public Defenders
Priority Rank
Programs and/or Components
Program: Training Center
Program: Improve Administration of the Cabinet of the Minister and the Vice-Ministers
Program: General Administration (Human Resource, Finance, Information & Technology, and Logistics)
Program: Office of Study
Overall Totals2003/4 2004/5 2005/6 2006/7
Ministry of Justice Page 30 of 108

Programme Matrix Road Map -- Annex 3
CFET TFET (and other
funding sources)
Combined Total
CFET Other Funding Sources
Combined Total
CFET Other Funding Sources
Combined Total
CFET Other Funding Sources
Combined Total
Priority Rank
Programs and/or Components Overall Totals2003/4 2004/5 2005/6 2006/7
d. Training, seminars, colloqiums, lectures, conferences and workshops for the Court Officers
e. Training, seminars, colloqiums, lectures, conferences and workshops for the Paralegal techniciansf. Training, seminars, colloqiums, lectures, conferences and workshops for the Criminal Investigation Officersg. Training, seminars, colloqiums, lectures, conferences and workshops for the Prison Guards
h. Training, seminars, colloqiums, lectures, conferences and workshops for the Civil Registrars and Notary Office staff2. Establish a Public Library 0 0 0 0 0a. Registry systemb. Archive systemc. Internet for the research center3. Administration and Finance Division 0 0 0 0 04. Cooperation, discussion on legal matters within the legal community
0 0 0 0 0
5. Comparative Study/Tour 0 0 0 0 0SP 6. Recruit trainers (from Malaysia) to train Timorese
trainers to continue training of prison guards75,000 0 0 0 75,000
1. Staff Recruitment 40,000 0 40,000 40,000 0 40,000 40,000 0 40,000 40,000 0 40,000 160,0002. Meeting Room3. General Office Room4. Furniture acquistions for CSM5. Equipment acquisitions6. Internet installation7. Car acquisition
Program: Superior Council for the Judiciary
Ministry of Justice Page 31 of 108

Programme Matrix Road Map -- Annex 3
CFET TFET (and other
funding sources)
Combined Total
CFET Other Funding Sources
Combined Total
CFET Other Funding Sources
Combined Total
CFET Other Funding Sources
Combined Total
Priority Rank
Programs and/or Components Overall Totals2003/4 2004/5 2005/6 2006/7
8. Communication equipment acquisition
1. Establishment of Office, additional staff and acquisition of equipment
31,000 0 31,000 59,000 0 59,000 60,000 0 60,000 70,000 0 70,000 220,000
2. Capacity Development (mentoring, legal course, administration and filing system)
3. Legislative Proposals (for the MOJ, other ministries and institutions; workshops)
4. Provide advice to the Ministry5. Comparative studies (ministerial institutions, other institutions)
6. Organizing documents and legal information (clippings-references, internet access, users journal, translators and interpreters)
SP 7. Formulate necessary regulation (s) to allow for resolution of less serious and minor cases through mediation
50,000 0 0 0 50,000
SP 8. Strengthen the mediation and resolution mechanisms at the national, district, sub-district and community levels
50,000 0 0 0 50,000
1. Establishment of Administrationa. Recruitmentb. Building Capacity (Trainings)c. Equipment acquisition (computers, laptops, tables, chairs, printer, photocopier, telephones, fax machine and internet access)
d. Furnishing2. Access to Court
a. Criminal Casesb. Civil Cases
Program: Advisory and Legislation
Program: Public Defender
Ministry of Justice Page 32 of 108

Programme Matrix Road Map -- Annex 3
CFET TFET (and other
funding sources)
Combined Total
CFET Other Funding Sources
Combined Total
CFET Other Funding Sources
Combined Total
CFET Other Funding Sources
Combined Total
Priority Rank
Programs and/or Components Overall Totals2003/4 2004/5 2005/6 2006/7
3. Specialised Technical ServicesSP 4. Train public Defenders in Portugal and CPLP
countries30,000 0 0 0 30,000
SP 5. Recruit international Defense Lawyers 600,000 0 0 0 600,000
1. Establishment of the Secretariat of the Central Prison
a. Recuitment of Staffb. Supply information, communications, and office equipment, and other diverse equipment
c. Funishingd. Maintenance of building infrastructure and equipment
e. Building capacity of personnelf. Seminar and workshop
SP 2. Vocational training for detainees 10,000 0 0 0 10,000SP 3. Provide literacy classes to illiterate
detainees5,000 0 0 0 5,000
SP 4. Work programs for detainees 10,000 0 0 0 10,000
1. Civil Registry 380,000 0 380,000 380,000 0 380,000 380,000 0 380,000 380,000 0 380,000 1,520,000
a. Campaign to register newborn children and deathsb. Issuing of certificatesc. Electoral and population registryd. Printing certificatese. Socialization of laws regarding certificate taxesf. Legal costs of the Civil Registry2. Registry and Notary
a. Socialization of the Organic Law of the Civil Registry and Notary
Program: Civil Registry and Notary
Program: Secretariat of the Central Prison
Ministry of Justice Page 33 of 108

Programme Matrix Road Map -- Annex 3
CFET TFET (and other
funding sources)
Combined Total
CFET Other Funding Sources
Combined Total
CFET Other Funding Sources
Combined Total
CFET Other Funding Sources
Combined Total
Priority Rank
Programs and/or Components Overall Totals2003/4 2004/5 2005/6 2006/7
b. Socialization of Notary Laws
c. Draft Commercial Law, Property Law, Vehicle Lawd. Community Organization/Civil Society Registration Acte. Campaign regarding registry law3. Central Database
a. Changes to computer systems (software)
b. Central data collectionc. Technical Assistanced. Orientation of Notaries4. Financial administration and logisticsa. Human Resources (Language translator, technical assistance and staff recruitment)b. Training and workshopc. Construction of 3 new buildings in the regions of Dili, Baucau and Aileud. Generatorse. Rehabilitation of District Offices in Same, Manatuto, Aileu and Dili
f. Communications, transportation equipment acquisition
5. Identification of Civil Criminala. Issue of passportsb. Printing of Identity cardsc. Issueance of Identity Cardsd. Production of passport document, common, work permits and foreignerse. Criminal registry
SP 6. Promote the use of functional registries, etc. 25,000 0 0 0 25,000
Ministry of Justice Page 34 of 108
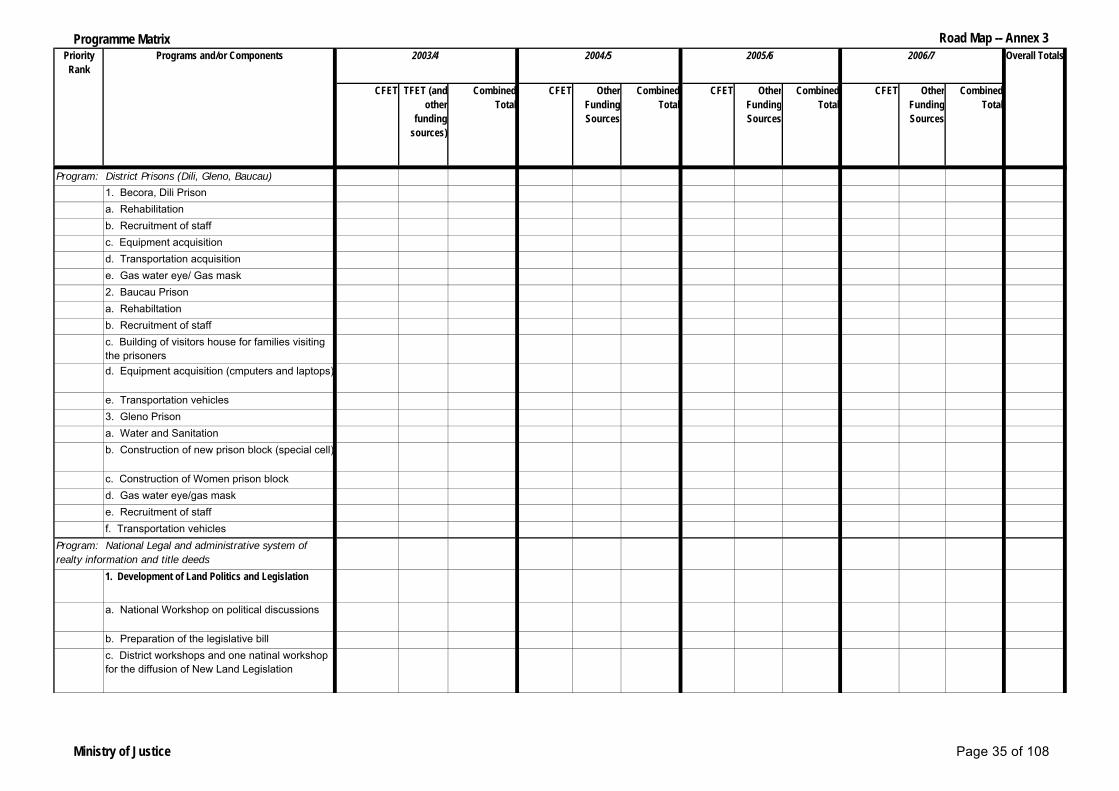
Programme Matrix Road Map -- Annex 3
CFET TFET (and other
funding sources)
Combined Total
CFET Other Funding Sources
Combined Total
CFET Other Funding Sources
Combined Total
CFET Other Funding Sources
Combined Total
Priority Rank
Programs and/or Components Overall Totals2003/4 2004/5 2005/6 2006/7
1. Becora, Dili Prisona. Rehabilitationb. Recruitment of staffc. Equipment acquisition d. Transportation acquisitione. Gas water eye/ Gas mask2. Baucau Prisona. Rehabiltationb. Recruitment of staffc. Building of visitors house for families visiting the prisonersd. Equipment acquisition (cmputers and laptops)
e. Transportation vehicles3. Gleno Prisona. Water and Sanitationb. Construction of new prison block (special cell)
c. Construction of Women prison blockd. Gas water eye/gas maske. Recruitment of stafff. Transportation vehicles
1. Development of Land Politics and Legislation
a. National Workshop on political discussions
b. Preparation of the legislative billc. District workshops and one natinal workshop for the diffusion of New Land Legislation
Program: District Prisons (Dili, Gleno, Baucau)
Program: National Legal and administrative system of realty information and title deeds
Ministry of Justice Page 35 of 108

Programme Matrix Road Map -- Annex 3
CFET TFET (and other
funding sources)
Combined Total
CFET Other Funding Sources
Combined Total
CFET Other Funding Sources
Combined Total
CFET Other Funding Sources
Combined Total
Priority Rank
Programs and/or Components Overall Totals2003/4 2004/5 2005/6 2006/7
d. Radio program diffusing property related laws and procedurese. National and international information campaign on the records of claims, disputes and data on foreign land owners (1 year)2. Traditional and Land Law Study Program
a. Preparation of the Study Program with the University (1 month)b. Study (field visits, interviews, seminars, reports) 12 months in 7 districts
c. Final report: support to National staff3. Abandoned and State Properties management program
a. Identification of abandoned and state properties (several miles)b. Notification procedures to achieve regularization or ejectmentc. Rental of abandoned or state propertiesd. Definition of a table of general rent values (Ministerial Diploma)e. Rented properties revenue collection control
4. Training the Land and Property Division staff
a. Legal training for the national and district staff of the LPDb. National workshops on title deeds and claims record systemsc. National workshop on abandoned and State property administration and on notification/administrative ejectmentd. National workshops on surveying and register of assessment systemse. District workshop on administration, staff and finance
Ministry of Justice Page 36 of 108

Programme Matrix Road Map -- Annex 3
CFET TFET (and other
funding sources)
Combined Total
CFET Other Funding Sources
Combined Total
CFET Other Funding Sources
Combined Total
CFET Other Funding Sources
Combined Total
Priority Rank
Programs and/or Components Overall Totals2003/4 2004/5 2005/6 2006/7
f. National workshops on mediation or arbitration processesg. Land information systems and surveying techniques, computer and software training
5. National Program on Land disputes mediation
a. Establish mediation procedures
b. Prepare the legislative bill for land disputes mediationc. District seminars for mediators training under the supervision of the Land and Property Division mediatord. Diffusion of procedures and mediation policies by the LPDe. Natinal supervision of the program and specific casesf. Specific mediation for community reported cases6. Land Data System (Maps, LIS and property record)
a. Establish a Property Record Systemb. Establish a system and procedures to evaluate (all) realty
c. Surveying (pilot project)d. Surveying (survey of all district properties)
e. Training actions for surveyors (LIS) at the national and distirct officesf. Training actions for the administrative staff on East Timor gaps (national office)7. Program of restitution and record of title deeds
a. Record of claims and disputes ove Land (national citizens)b. Record of data on foreign landowners and assets identification
Ministry of Justice Page 37 of 108

Programme Matrix Road Map -- Annex 3
CFET TFET (and other
funding sources)
Combined Total
CFET Other Funding Sources
Combined Total
CFET Other Funding Sources
Combined Total
CFET Other Funding Sources
Combined Total
Priority Rank
Programs and/or Components Overall Totals2003/4 2004/5 2005/6 2006/7
c. Design and implementation of a Title Deeds records systemd. National seminars for staff training on claims and disputes processinge. District seminars for staff training on title deeds record, mediation agreements, legal decisions, etc8. Rehabilitation of LPD National and District Buildings
a. Rehabilitation of the National Building - Colmera (Design and Construction)b. Rehabilitation of the National Building - Balide (Design and Construction)c. Rehabilitation of the National Building - Ainaro (Design and Construction)d. Rehabilitation of the National Building - Aileu (Design and Construction)e. Rehabilitation of the National Building - Same (Design and Construction)f. Rehabilitation of the National Building - Liquica (Design and Construction)g. Rehabilitation of the National Building - Ermera (Design and Construction)h. Rehabilitation of the National Building - Oecussi (Design and Construction)i. Rehabilitation of the National Building - Lospalos (Design and Construction)9. Equipment Acquisitions10. Recruitment of 78 workers
50,000 0 50,000 50,000 0 50,000 60,000 0 60,000 70,000 0 70,000 230,000
1. Capacity building and Human Resources
a. Increase human resourcesb. Training-orientation2. Establish equipment3. Campaign/dissemination of lawsa. Seminars/workshops
Program: Directorate of Gender and Citizenship
Ministry of Justice Page 38 of 108

Programme Matrix Road Map -- Annex 3
CFET TFET (and other
funding sources)
Combined Total
CFET Other Funding Sources
Combined Total
CFET Other Funding Sources
Combined Total
CFET Other Funding Sources
Combined Total
Priority Rank
Programs and/or Components Overall Totals2003/4 2004/5 2005/6 2006/7
b. Promotion of the rights of women, men and childrenc. Field visits to 13 districtsd. Dialog from television and Radio TL4. Public information/promotions
179,000 0 179,000 180,000 0 180,000 180,000 0 180,000 180,000 0 180,000 719,0001. Attorney-General of the Republic2. Dili District Attorney3. District Attorney of Baucau4. District Attorney of Suai5. District Attorney of Oecussi
SP 6. Train Prosecutors in Portugal and other CPLP countries
30,000 0 0 0 30,000
SP 7. Recruit international Public Prosecutors 600,000 0 0 0 600,000SP 8. Civic Education 30,000 0 0 0 30,000
80,000 0 80,000 80,000 0 80,000 80,000 0 80,000 80,000 0 80,000 320,0001. Additional Human Resources2. Office equipment and fixtures acquisitions for 9 persons
3. Vehicles for 5 judges of the Court of Appeals
4. Compensatory allowance5. Internet access
SP 6. Provide additional assistance for mediation
150,000 0 0 0 150,000
SP 1. Train judges in Portugal and other CPLP countries 40,000 0 0 0 40,000
SP 2. Recruit international judges, court clerks and interpreters
1,970,000 0 0 0 1,970,000
Total 986,000 0 4,846,000 1,009,000 0 1,169,000 1,015,000 0 1,175,000 1,045,000 0 1,205,000 8,395,000
*Programs for District Courts and some other components, missing.
Program: District Courts
Program: National and District programs
Program: Court of Appeals
Ministry of Justice Page 39 of 108

Programme Matrix Road Map -- Annex 3
CFET TFET (and other
funding sources)
Combined Total
CFET Other Funding Sources
Combined Total
CFET Other Funding Sources
Combined Total
CFET Other Funding Sources
Combined Total
1. Budget Formulation and management within a sustainable Medium Term Fiscal Framework (MTFF)
1 a. Continuation of Department's core function
2 b. Technical Assistance in support of core function and strengthened capacity building
0 1,610,000 1,610,000 0 1,555,000 1,555,000 0 1,500,000 1,500,000 0 1,500,000 1,500,000 6,165,000
3 c. Development of Annual Citizen's Guide to Budget
25,000 0 25,000 10,000 0 10,000 10,000 0 10,000 10,000 - 10,000 55,000
4 d. Strengthened level of budget department support to ministries through recruitment of additional 7 staff and purchase of vehicle and motorbike
63,800 0 63,800 28,000 0 28,000 27,000 0 27,000 27,000 - 27,000 145,800
2. Policy Development
1 a. Supporting East Timor's Transition toAdministrative Independence
0 50,000 50,000 0 0 0 0 0 0 0 - 0 50,000
1 b. Strengthening Public Expenditure Management in Independent East Timor
0 5,000 5,000 0 0 0 0 0 0 0 - 0 5,000
2 c. Targeted financial management and Budget execution training for MPF and Departmental Finance Officers
0 300,000 300,000 0 0 0 0 0 0 0 - 0 300,000
1. Government Expenditure Management and reporting
246,000 509,000 755,000 246,000 0 246,000 246,000 0 246,000 246,000 - 246,000 1,493,000
2. District Operations 116,000 33,000 149,000 116,000 0 116,000 116,000 0 116,000 116,000 - 116,000 497,000 3. Internal and External Audit 103,000 38,000 141,000 103,000 0 103,000 103,000 0 103,000 103,000 - 103,000 450,000 4. Capacity Development 25,000 145,000 170,000 25,000 0 25,000 25,000 0 25,000 25,000 - 25,000 245,000
Programs and/or ComponentsPriority Rank
Overall Totals2003/4 2004/5 2005/6 2006/7
Program: Budget Department
Program: Treasury
Ministry of Planning and Finance MPF Page 40 of 108

Programme Matrix Road Map -- Annex 3
CFET TFET (and other
funding sources)
Combined Total
CFET Other Funding Sources
Combined Total
CFET Other Funding Sources
Combined Total
CFET Other Funding Sources
Combined Total
Programs and/or ComponentsPriority Rank
Overall Totals2003/4 2004/5 2005/6 2006/7
1. Timor Sea Divisiona. Compliance activities that needs to be undertaken to achieve targeted forecast revenue from taxpayers
0 0 0 100,000 100,000 0 100,000 100,000 0 100,000 100,000 300,000
b. Capacity Development of Timor Sea Taxation Officers
0 0 0 5,000 5,000 0 5,000 5,000 0 5,000 5,000 15,000
c. Communication equipment (fax, phones, computers)
0 0 0 10,000 10,000 0 0 0 0 - 0 10,000
d. Set-up representative office in Perth to handle compliance activities, advising and taxpayer education
40,000 0 40,000 50,000 0 50,000 50,000 0 50,000 50,000 - 50,000 190,000
2. Operational Divisiona. Good management of budget appropriations to support taxation management
414,000 0 414,000 0 0 0 0 0 0 0 - 0 414,000
b. Professional Trainings (Audit, Accounting, Admin, Legislation, English course, SIGTAS system, etc)
0 242,960 242,960 0 232,960 232,960 0 189,210 189,210 0 189,210 189,210 854,340
c. Implementation of all aspects of SIGTAS system
0 45,000 45,000 0 45,000 45,000 0 45,000 45,000 0 45,000 45,000 180,000
d. Support for the creation of Taxation and Customs Resources Council
79,008 0 79,008 60,000 0 60,000 60,000 0 60,000 60,000 60,000 259,008
3. LBD Divisiona. Auditing in Baucau and Maliana 4,000 0 4,000 6,000 0 6,000 6,000 0 6,000 6,000 6,000 22,000b. Socialization 250 0 250 500 0 500 500 0 500 500 500 1,750c. International visit to Taxpayers 7,000 0 7,000 7,000 0 7,000 7,000 0 7,000 7,000 7,000 28,000
100,000 100,000 0 0 0 0 0 0 0 0 0 100,0001 1. Human Resources and Capacity Building
Development35,776 35,776 33,276 33,276 32,276 32,276 32,776 32,776 134,104
a. Coordination of recruitment for all MPFb. Undertake a training and staff development needs assessment study (to be regularly updated) in liaison with substantive offices
Program: Administration and IT
Program: ETRS
Ministry of Planning and Finance MPF Page 41 of 108

Programme Matrix Road Map -- Annex 3
CFET TFET (and other
funding sources)
Combined Total
CFET Other Funding Sources
Combined Total
CFET Other Funding Sources
Combined Total
CFET Other Funding Sources
Combined Total
Programs and/or ComponentsPriority Rank
Overall Totals2003/4 2004/5 2005/6 2006/7
c. Develop an HR Development Plan
d. Develop succession plans for all line positions held by expatriatese. Advertise books available in Knowledge Center and coordinate/organize lectures on topics of general /cross-sector interest.
2 2. Information Technology Support Services 69,414 69,414 259,914 259,914 248,414 248,414 169,164 169,164 746,906
a. Organize an appropriate database of information for all MPF departments, ie., SIGTAS, FREEBALANCE, CHRIS, ASYCUDA, CATAPULT & System Management
b. Control & maintenance of IT equipment and network services
c. Organize formal specialized lectures and on-the-job training for all of MPF
3 3. A service oriented General Services 204,385 204,385 202,068 202,068 200,035 200,035 203,702 203,702 810,190
a. Publication of MPF Newsletter
b. Technical translation and interpretation for all Department of MPF which is serving all of Government
c. Maintenance of MPF building in addition to all logistic support (A/C, 100% electrical/generator power, water and sanitation, tight vehicle maintenance to prevent high level of replacement, etc.)
d. Special project: Paving of MPF 8000 m2 parking lot
Ministry of Planning and Finance MPF Page 42 of 108

Programme Matrix Road Map -- Annex 3
CFET TFET (and other
funding sources)
Combined Total
CFET Other Funding Sources
Combined Total
CFET Other Funding Sources
Combined Total
CFET Other Funding Sources
Combined Total
Programs and/or ComponentsPriority Rank
Overall Totals2003/4 2004/5 2005/6 2006/7
4 4. Coordination of MOPF Budget and NDP 5,529 5,529 4,848 4,848 5,379 5,379 5,462 5,462 21,218
1 1. Recruitment of Macroeconomic and Tax Policy staff
12,000 0 12,000 1,000 0 1,000 1,000 0 1,000 1,000 1,000 15,000
2 2. Capacity Building 40,000 40,000 40,000 40,000 0 40,000 40,000 0 40,000 40,000 160,0003 3. Forecast Revenue and recommend
changes in revenue policy and overall balance of revenu expenditure, savings-deficit on budget
15,000 60,000 75,000 15,000 60,000 75,000 15,000 60,000 75,000 15,000 60,000 75,000 300,000
4 4. Forecast growth in Macroeconomy for Budget
6,000 60,000 66,000 6,000 60,000 66,000 6,000 60,000 66,000 6,000 - 6,000 204,000
5 5. Develop policies to promote economic growth and poverty reduction and promote high levels of savings and investment
5,000 20,000 25,000 5,000 20,000 25,000 5,000 20,000 25,000 5,000 20,000 25,000 100,000
1 1. Improve and maintain the operation of the PEAMD
164,000 0 164,000 163,400 0 163,400 174,240 0 174,240 193,154 - 193,154 694,794
2 2. Establish and operate an effective Data Management System
5,000 67,000 72,000 7,000 37,000 44,000 10,000 17,000 27,000 8,000 7,000 15,000 158,000
3 3. Mobilize budgetary support and TA 0 200,000 200,000 0 100,000 100,000 0 70,000 70,000 0 50,000 50,000 420,0004 4. Coordinate Government's annual
planning exercise including assisting line ministries prepare their AAPs and QRMs
0 130,000 130,000 0 110,000 110,000 0 80,000 80,000 0 40,000 40,000 360,000
5 5. Enhance the level of expertise and professionalism within PEAMD
0 100,000 100,000 0 80,000 80,000 0 60,000 60,000 0 40,000 40,000 280,000
6 6. Engage Development Partners to promote partnership
55,000 0 55,000 60,500 0 60,500 66,550 0 66,550 73,205 - 73,205 255,255
Program: Macroeconomic and Tax Policy
Program: Planning and External Assistance Coordination
Ministry of Planning and Finance MPF Page 43 of 108

Programme Matrix Road Map -- Annex 3
CFET TFET (and other
funding sources)
Combined Total
CFET Other Funding Sources
Combined Total
CFET Other Funding Sources
Combined Total
CFET Other Funding Sources
Combined Total
Programs and/or ComponentsPriority Rank
Overall Totals2003/4 2004/5 2005/6 2006/7
1. Statistics Office Operations 33,000 0 33,000 31,000 0 31,000 31,000 0 31,000 31,000 - 31,000 126,0002. Compilation and dissemination of 2004 Census
17,000 0 17,000 20,000 0 20,000 2,000 0 2,000 2,000 - 2,000 41,000
3. Compilation and dissemination of Prices Statistics
25,000 0 25,000 25,000 0 25,000 25,000 0 25,000 25,000 - 25,000 100,000
4. Compilation and dissemination of Trade Statistics (including ASYCUDA)
16,000 0 16,000 16,000 0 16,000 16,000 0 16,000 16,000 - 16,000 64,000
5. Compilation and dissemination of specific social statistics (Education, Health)
0 8,000 8,000 2,000 100,000 102,000 2,000 50,000 52,000 2,000 50,000 52,000 214,000
6. National accounts (Gross Domestic Product)
0 100,000 100,000 0 100,000 100,000 0 50,000 50,000 0 50,000 50,000 300,000
Undertaking Demographic Health Survey (DHS)
2,000 0 2,000 0 0 0 0 0 0 0 - 0 2,000
1. Implement existing laws and the ones to be approved
801,000 0 801,000 794,000 0 794,000 819,000 0 819,000 819,000 0 819,000 3,233,000
2. Operationalize services 0 0 0 0 0 0 0 0 0 0 0 0 03. Communication 0 0 0 0 0 0 0 0 0 0 0 0 04. Information 50,000 0 50,000 0 0 0 0 0 0 0 0 0 50,0005. Infrastructures 40,000 0 40,000 0 0 0 0 0 0 0 0 0 40,0006. Capacity Building 10,000 0 10,000 0 0 0 0 0 0 0 0 0 10,0007. Mobility 0 0 0 0 0 0 0 0 0 0 0 0 0
8. Membership to International Organizations
0 0 0 0 0 0 0 0 0 0 0 0 0
1. Capacity Development
a. Study visits 93,500 10,000 103,500 50,000 10,000 60,000 40,000 0 40,000 35,000 0 35,000 238,500b. Computer courses in 3 levels 10,000 0 10,000 15,000 0 15,000 15,000 0 15,000 10,000 0 10,000 50,000c. Study visits for 7 persons on Contract Commissioning
48,500 0 48,500 0 0 0 0 0 0 0 0 0 48,500
Program: Government Corporate Service
Program: Statistics
Program: Customs
Ministry of Planning and Finance MPF Page 44 of 108

Programme Matrix Road Map -- Annex 3
CFET TFET (and other
funding sources)
Combined Total
CFET Other Funding Sources
Combined Total
CFET Other Funding Sources
Combined Total
CFET Other Funding Sources
Combined Total
Programs and/or ComponentsPriority Rank
Overall Totals2003/4 2004/5 2005/6 2006/7
2. Supply Management and Inventory
a. Train staff within the unit to learn the Catapult program and Freebalance
1,000 0 1,000 13,000 0 13,000 19,500 0 19,500 30,810 0 30,810 64,310
b. Storage of stocke in warehouse and dispatch to various departments
50,000 0 50,000 65,000 0 65,000 97,500 0 97,500 154,100 0 154,100 366,600
c. Establish barcode on government properties
40,000 0 40,000 52,000 0 52,000 78,000 0 78,000 123,200 0 123,200 293,200
d. Compilation and publication of training to staff within the unit and other government departments on the Manual of Operations
4,000 0 4,000 5,200 0 5,200 7,800 0 7,800 12,320 0 12,320 29,320
e. Dispatch, receive and inspection of all equipment incoming/received by the government
3,000 0 3,000 3,900 0 3,900 58,500 0 58,500 92,430 0 92,430 157,830
f. Repair and maintain 3 warehouses in Dili
30,000 0 30,000 39,000 0 39,000 58,500 0 58,500 92,430 0 92,430 219,930
g. Establishment of 4 district warehouses, Los Palos, Viqueque, Suai and Oecussi
0 0 0 400,000 0 400,000 400,000 0 400,000 400,000 0 400,000 1,200,000
3. Procurement a. Receive and monitor correct CPVs 115,000 0 115,000 125,000 0 125,000 125,000 0 125,000 125,000 0 125,000 490,000
b. Establishment of Property Disposal warehouse facility
50,000 0 50,000 0 0 0 0 0 0 0 0 0 50,000
c. Revision of Procurement regulations inlcuding review of manuals
0 249,500 249,500 0 0 0 0 0 0 0 0 0 249,500
d. Promote cottage industries through evaluating new methods of procurement
0 0 0 0 0 0 0 0 0 0 0 0 0
e. Assignment of procurement staff to the line ministries
SP f. Domestic content, preferential procurement for private sector
50,000 0 0 0 0 0 0 0 50,000
Total 3,139,162 4,122,460 7,311,622 3,065,606 2,664,960 5,730,566 3,209,194 2,346,210 5,555,404 3,333,253 2,196,210 5,529,463 24,127,055
Ministry of Planning and Finance MPF Page 45 of 108

Programme Matrix Road Map -- Annex 3
CFET TFET (and other
funding sources)
Combined Total
CFET Other Funding Sources
Combined Total
CFET Other Funding Sources
Combined Total CFET Other Funding Sources
Combined Total
1 1. Program to strengthen the capacity of civil service including in administration/management, finance and budgeting
a. Develop training program and manuals for ALGD staff in coordination with CSA to enhance capacity for ALGD staff
500,000 60,000 60,000 60,000 680,000
b. Implementation of programmed training for al ALGD staff in coordination and trainers provided from CSA
0 0 0 0 0
1 2. Law on local government, specifying the rolesand responsibilities of district and lower levelgovernment administrations
a. Commence the planned study on "Mostappropriate units of sub-national governmentin East Timor". The study will be carried outwithin the framework provided in theapproved Terms of Reference.
1,000,000 2,000,000 4,000,000 6,000,000 13,000,000
b. Draft a Policy Document on localgovernment and governanceat the suco andaldeia level, based on the options adopted bythe COM provided in the study
0 0 0 0 0
c. Translate the policy options adopted bythe Government into a supportive legalframework for review and approval bylegislating bodies
0 0 0 0 0
Overall Totals2006/72003/4 2004/5 2005/6Priority Rank
Programs and/or Components
Program: Administration for Local Government and Development
Ministry for State Administration Page 46 of 108

Programme Matrix Road Map -- Annex 3
CFET TFET (and other
funding sources)
Combined Total
CFET Other Funding Sources
Combined Total
CFET Other Funding Sources
Combined Total CFET Other Funding Sources
Combined Total
Overall Totals2006/72003/4 2004/5 2005/6Priority Rank
Programs and/or Components
d. In cooperation with Ministry of Planningand Finance, translate the policy optionsadopted by the Government into a financialframework for allocation of resources amongdistricts
0 0 0 0 0
e. Institutional development andimplementation of the phases set in thedecentralization process according to theadopted legal framework
0 0 0 0
f. Activity letter e will be implemented down to the grassroots level, and parallel with a government capacity building program involving local government and civil society organizations, MIA and other central government support and monitoring agencies.
0 0 0 0 0
1 3. Program to create and/or strengtheninstitutional mechanisms for coordination ofdevelopment activities in regions and districtsthat are relatively disadvantaged
a. Continue support and capacity building ofDistrict Community DevelopmentCommittees (DCDC), and other stakeholdersat district and sub-district levels, to enablethe districts to better coordinate developmentactivities in all 13 districts
950,000 950,000 950,000 950,000 3,800,000
Ministry for State Administration Page 47 of 108
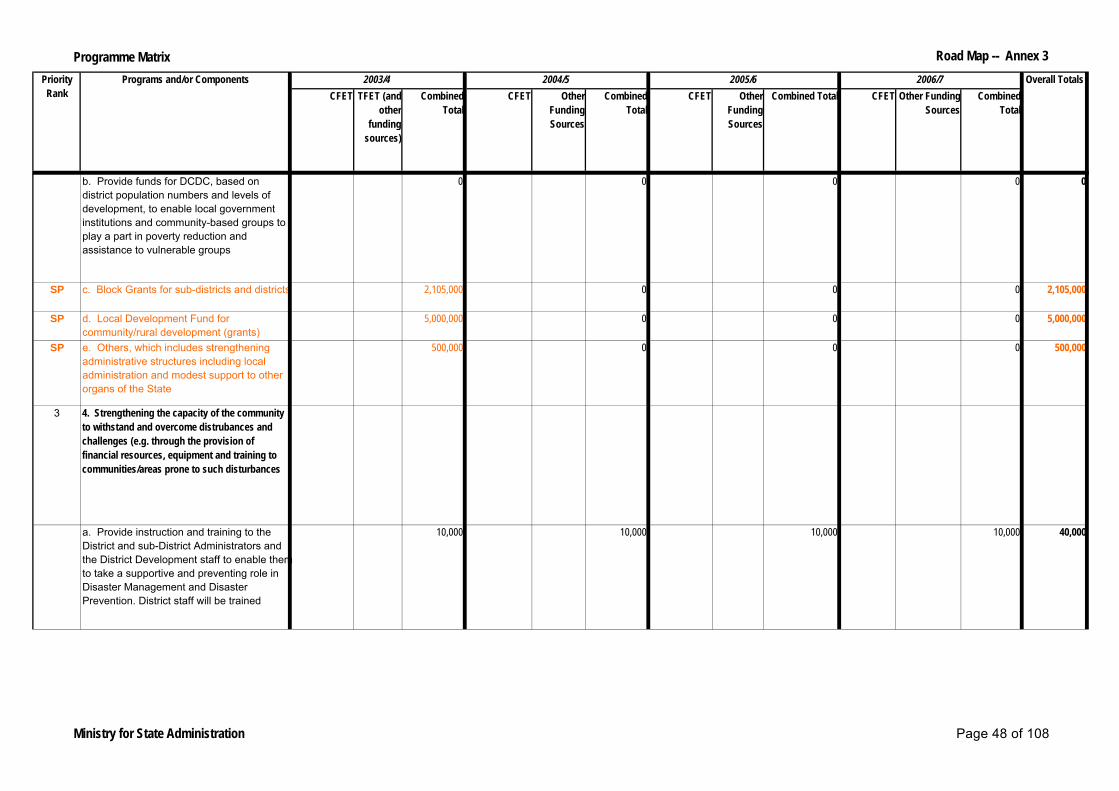
Programme Matrix Road Map -- Annex 3
CFET TFET (and other
funding sources)
Combined Total
CFET Other Funding Sources
Combined Total
CFET Other Funding Sources
Combined Total CFET Other Funding Sources
Combined Total
Overall Totals2006/72003/4 2004/5 2005/6Priority Rank
Programs and/or Components
b. Provide funds for DCDC, based on district population numbers and levels of development, to enable local government institutions and community-based groups to play a part in poverty reduction and assistance to vulnerable groups
0 0 0 0 0
SP c. Block Grants for sub-districts and districts 2,105,000 0 0 0 2,105,000
SP d. Local Development Fund for community/rural development (grants)
5,000,000 0 0 0 5,000,000
SP e. Others, which includes strengthening administrative structures including local administration and modest support to other organs of the State
500,000 0 0 0 500,000
3 4. Strengthening the capacity of the community to withstand and overcome distrubances and challenges (e.g. through the provision of financial resources, equipment and training to communities/areas prone to such disturbances
a. Provide instruction and training to the District and sub-District Administrators and the District Development staff to enable them to take a supportive and preventing role in Disaster Management and Disaster Prevention. District staff will be trained
10,000 10,000 10,000 10,000 40,000
Ministry for State Administration Page 48 of 108
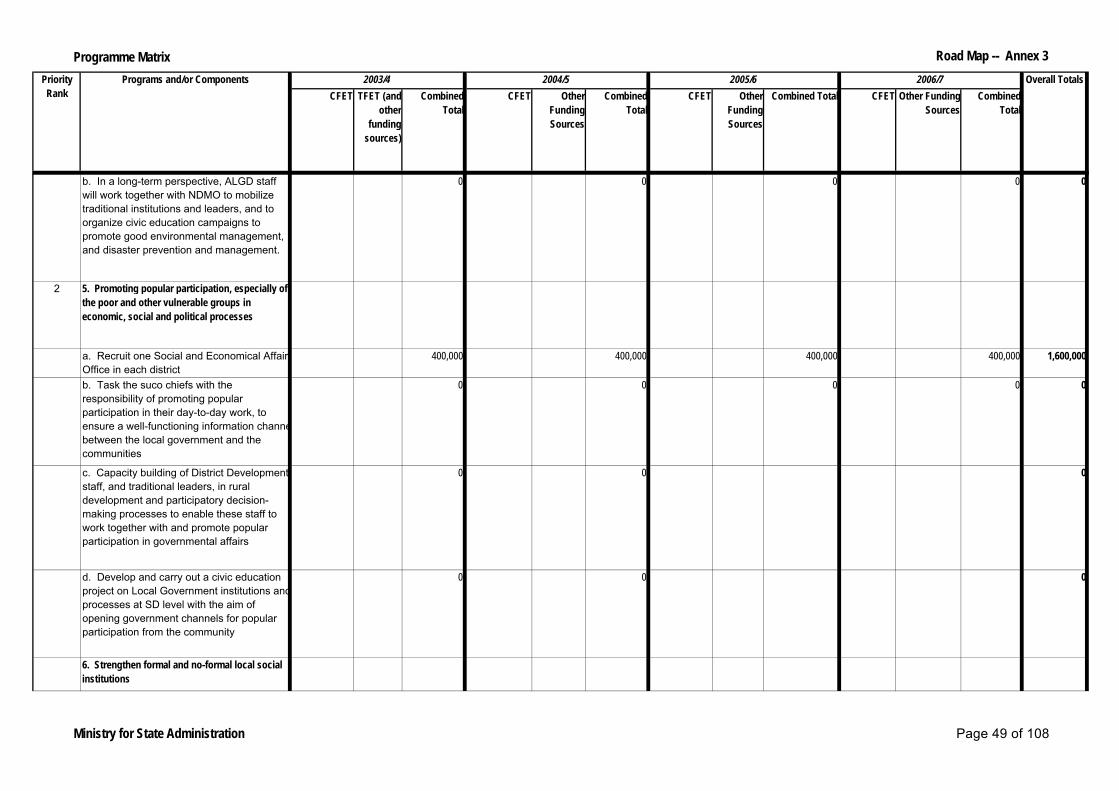
Programme Matrix Road Map -- Annex 3
CFET TFET (and other
funding sources)
Combined Total
CFET Other Funding Sources
Combined Total
CFET Other Funding Sources
Combined Total CFET Other Funding Sources
Combined Total
Overall Totals2006/72003/4 2004/5 2005/6Priority Rank
Programs and/or Components
b. In a long-term perspective, ALGD staff will work together with NDMO to mobilize traditional institutions and leaders, and to organize civic education campaigns to promote good environmental management, and disaster prevention and management.
0 0 0 0 0
2 5. Promoting popular participation, especially of the poor and other vulnerable groups in economic, social and political processes
a. Recruit one Social and Economical Affairs Office in each district
400,000 400,000 400,000 400,000 1,600,000
b. Task the suco chiefs with the responsibility of promoting popular participation in their day-to-day work, to ensure a well-functioning information channel between the local government and the communities
0 0 0 0 0
c. Capacity building of District Development staff, and traditional leaders, in rural development and participatory decision-making processes to enable these staff to work together with and promote popular participation in governmental affairs
0 0 0
d. Develop and carry out a civic education project on Local Government institutions and processes at SD level with the aim of opening government channels for popular participation from the community
0 0 0
6. Strengthen formal and no-formal local social institutions
Ministry for State Administration Page 49 of 108
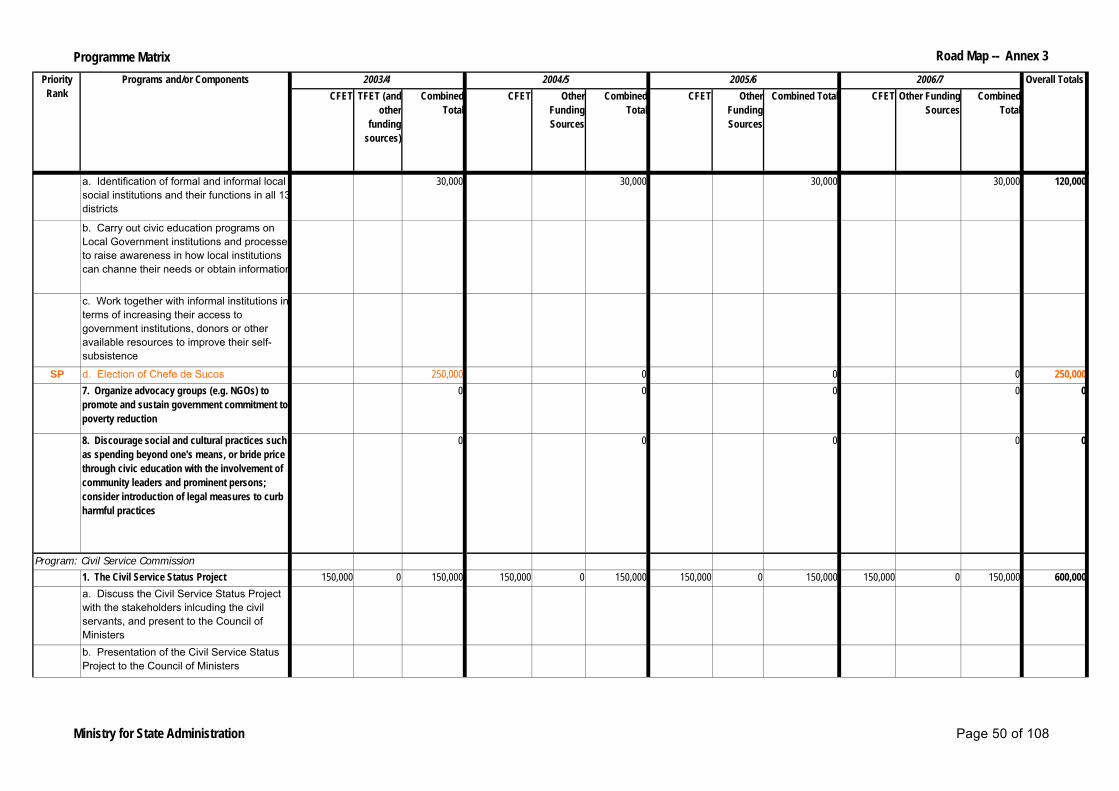
Programme Matrix Road Map -- Annex 3
CFET TFET (and other
funding sources)
Combined Total
CFET Other Funding Sources
Combined Total
CFET Other Funding Sources
Combined Total CFET Other Funding Sources
Combined Total
Overall Totals2006/72003/4 2004/5 2005/6Priority Rank
Programs and/or Components
a. Identification of formal and informal local social institutions and their functions in all 13 districts
30,000 30,000 30,000 30,000 120,000
b. Carry out civic education programs on Local Government institutions and processes to raise awareness in how local institutions can channe their needs or obtain information
c. Work together with informal institutions in terms of increasing their access to government institutions, donors or other available resources to improve their self-subsistence
SP d. Election of Chefe de Sucos 250,000 0 0 0 250,0007. Organize advocacy groups (e.g. NGOs) to promote and sustain government commitment to poverty reduction
0 0 0 0 0
8. Discourage social and cultural practices such as spending beyond one's means, or bride price through civic education with the involvement of community leaders and prominent persons; consider introduction of legal measures to curb harmful practices
0 0 0 0 0
1. The Civil Service Status Project 150,000 0 150,000 150,000 0 150,000 150,000 0 150,000 150,000 0 150,000 600,000
a. Discuss the Civil Service Status Project with the stakeholders inlcuding the civil servants, and present to the Council of Ministersb. Presentation of the Civil Service Status Project to the Council of Ministers
Program: Civil Service Commission
Ministry for State Administration Page 50 of 108

Programme Matrix Road Map -- Annex 3
CFET TFET (and other
funding sources)
Combined Total
CFET Other Funding Sources
Combined Total
CFET Other Funding Sources
Combined Total CFET Other Funding Sources
Combined Total
Overall Totals2006/72003/4 2004/5 2005/6Priority Rank
Programs and/or Components
c. Presentation of the Civil Service Status Project for approval by the National Parliament and by the Council of Ministers
d. Dissemination of the Civil Service Status and of the Disciplinary Regulation2. Project on the Disciplinary Regulation 0 0 0 0 0
a. Draw-up the Disciplinary Regulation project
b. Discuss the Disciplinary Regulation project with the stakeholders and submit it for approval by the Council of Ministers
c. Submission of the Disciplinary Regulation Project for approval by the Council of Ministers3. The Performance Evaluation and Promotion Regulation project
0 0 0 0 0
a. Draw-up the Civil Service Performance Evaluation and Promotion project
b. Submission of the Civil Service Performance Evaluation and Regulation project for approval by the Council of Ministers
4. The Conflict of Interests Regulation project 0 0 0 0 0
a. Draw-up the Conflict of Interests project for the Civil Serviceb. Submission of the Conflict of Interests project for approval by the Council of Ministers5. The Duty of Secrecy Regulation project 0 0 0 0 0
a. Draw-up the Duty of Secrecy Regulation project
Ministry for State Administration Page 51 of 108

Programme Matrix Road Map -- Annex 3
CFET TFET (and other
funding sources)
Combined Total
CFET Other Funding Sources
Combined Total
CFET Other Funding Sources
Combined Total CFET Other Funding Sources
Combined Total
Overall Totals2006/72003/4 2004/5 2005/6Priority Rank
Programs and/or Components
b. Submission of the Duty of Secrecy Regulation project for approval by the Council of Ministers6. The Retirement and Survival Regulation project
0 0 0 0 0
a. Draw-up the Civil Service Retirement and Survival projectb. Submission of the Civil Service Retirement and Survival project for approval by the Council of Ministers7. The Scholarship Regulation project 0 0 0 0 0a. Draw-up the Civil Service Scholarship projectb. Submission of the Civil Service Scholarship Regulation project for approval by the Council of Ministers8. The Allowances Regulation project 0 0 0 0 0a. Draw-up the Civil Service Allowances projectb. Submission of the Civil Service Allowances project for approval by the Council of Ministers
1. Human Resources Management Development
a. Policies, regulation and Procedures 50,000 0 50,000 50,000 0 50,000 50,000 0 50,000 50,000 0 50,000 200,000
b. Design and organize the Human Resources Management General System
100,000 0 100,000 100,000 0 100,000 100,000 0 100,000 100,000 0 100,000 400,000
c. Monitor (track, check and instruct) the executiion of Policies, Laws, regulations and instructions within the scope of Human Resources Management
10,000 0 10,000 10,000 0 10,000 10,000 0 10,000 10,000 0 10,000 40,000
Program: Civil Service Board
Ministry for State Administration Page 52 of 108

Programme Matrix Road Map -- Annex 3
CFET TFET (and other
funding sources)
Combined Total
CFET Other Funding Sources
Combined Total
CFET Other Funding Sources
Combined Total CFET Other Funding Sources
Combined Total
Overall Totals2006/72003/4 2004/5 2005/6Priority Rank
Programs and/or Components
d. Design and implement the Human Resources Information General System
50,000 0 50,000 50,000 0 50,000 50,000 0 50,000 50,000 0 50,000 200,000
e. Training/Capacity Building of the Civil Service Board staff and that of the Human Resources management sector units
100,000 0 100,000 100,000 0 100,000 100,000 0 100,000 100,000 0 100,000 400,000
f. Suppplying of equipment and facilities 100,000 0 100,000 100,000 0 100,000 100,000 0 100,000 100,000 0 100,000 400,000
1 1. Archive system creation and training program 0 0 0 0 0
a. Cretae a registry systemb. Prepare materials for trainingc. Make all departments aware of the system
d. Implement the traininge. Apply the Documentation Registry system to all departments and districts2. Program to create legislation and to design the symbol of the National Archive
0 0 0 0 0
a. Consult and correct legislations as a the symbol for the National Archiveb. Review the Symbolc. Approval at the Council of Ministers and National Parliament
3. Program to build the National Archive for the RDTL
0 0 0 0 0
a. Repair of the 3 attics at the National Archive, and carry-out the projectb. Continue or conlude the project and use of the rooms in attics 1,2, and 3c. Depositing of archives being prepared
d. Organize and select archive documents
Program: National Archives
Ministry for State Administration Page 53 of 108
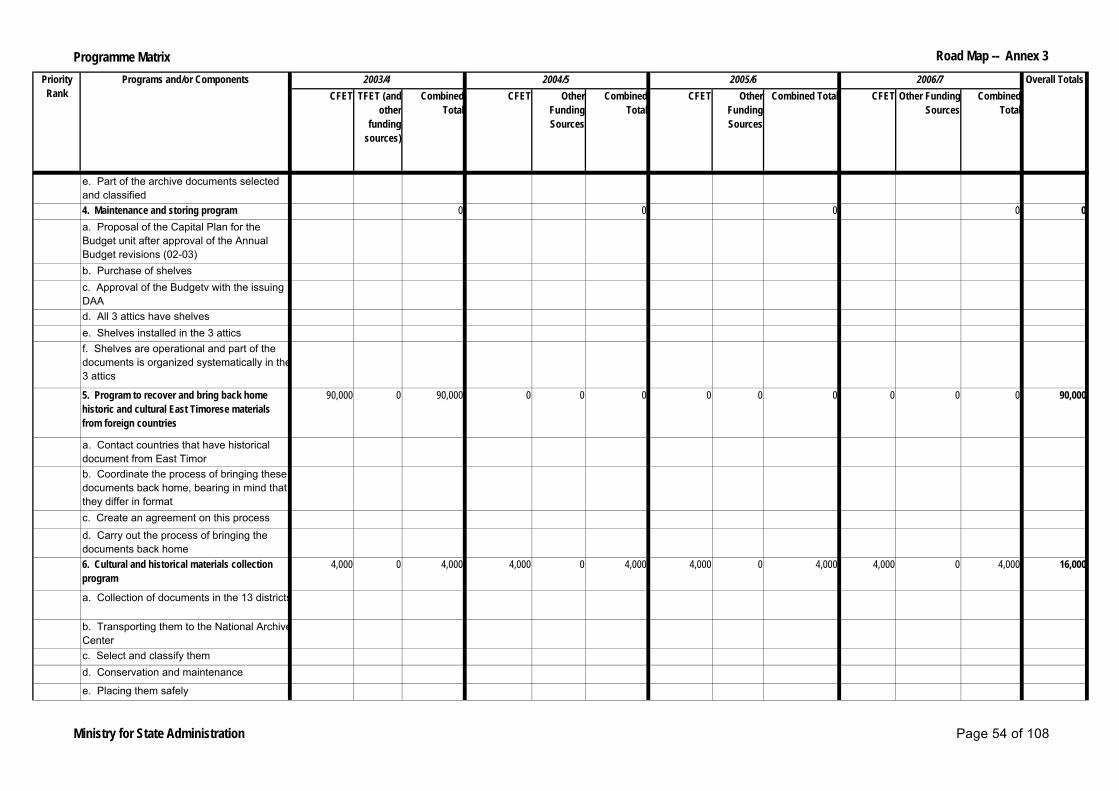
Programme Matrix Road Map -- Annex 3
CFET TFET (and other
funding sources)
Combined Total
CFET Other Funding Sources
Combined Total
CFET Other Funding Sources
Combined Total CFET Other Funding Sources
Combined Total
Overall Totals2006/72003/4 2004/5 2005/6Priority Rank
Programs and/or Components
e. Part of the archive documents selected and classified4. Maintenance and storing program 0 0 0 0 0a. Proposal of the Capital Plan for the Budget unit after approval of the Annual Budget revisions (02-03)b. Purchase of shelvesc. Approval of the Budgetv with the issuing DAAd. All 3 attics have shelvese. Shelves installed in the 3 atticsf. Shelves are operational and part of the documents is organized systematically in the 3 attics
5. Program to recover and bring back home historic and cultural East Timorese materials from foreign countries
90,000 0 90,000 0 0 0 0 0 0 0 0 0 90,000
a. Contact countries that have historical document from East Timorb. Coordinate the process of bringing these documents back home, bearing in mind that they differ in formatc. Create an agreement on this process
d. Carry out the process of bringing the documents back home6. Cultural and historical materials collection program
4,000 0 4,000 4,000 0 4,000 4,000 0 4,000 4,000 0 4,000 16,000
a. Collection of documents in the 13 districts
b. Transporting them to the National Archive Centerc. Select and classify themd. Conservation and maintenance
e. Placing them safely
Ministry for State Administration Page 54 of 108
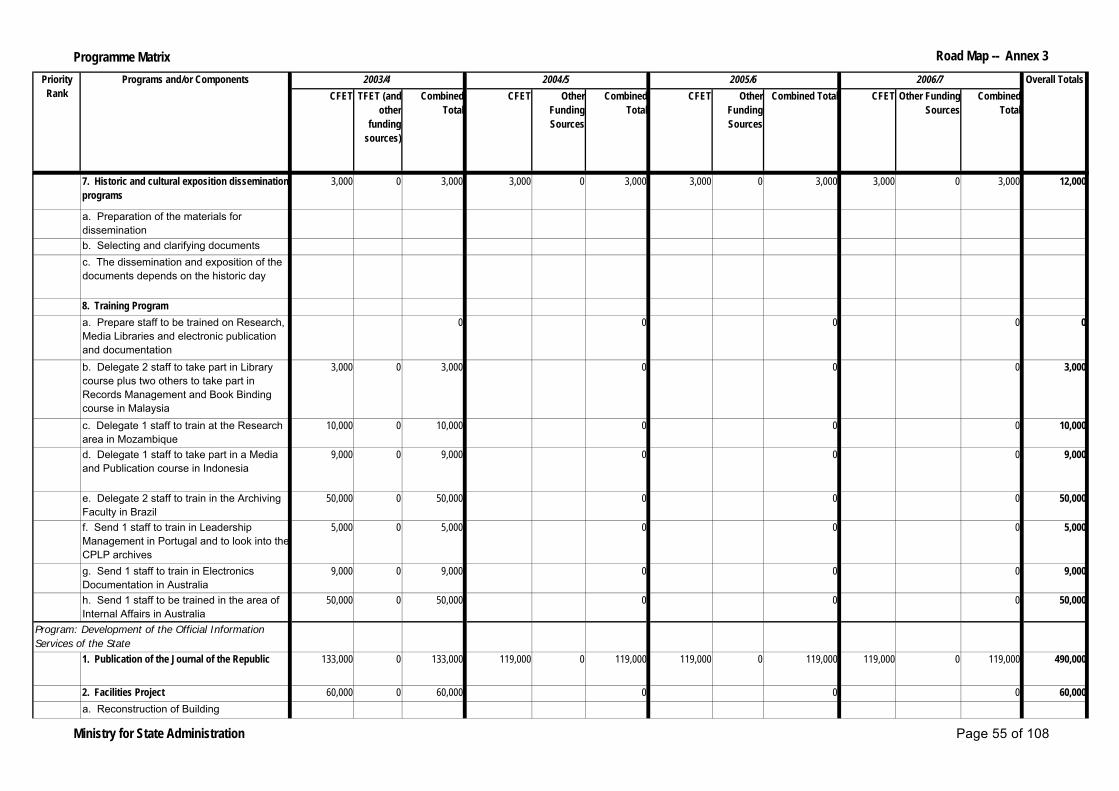
Programme Matrix Road Map -- Annex 3
CFET TFET (and other
funding sources)
Combined Total
CFET Other Funding Sources
Combined Total
CFET Other Funding Sources
Combined Total CFET Other Funding Sources
Combined Total
Overall Totals2006/72003/4 2004/5 2005/6Priority Rank
Programs and/or Components
7. Historic and cultural exposition dissemination programs
3,000 0 3,000 3,000 0 3,000 3,000 0 3,000 3,000 0 3,000 12,000
a. Preparation of the materials for disseminationb. Selecting and clarifying documentsc. The dissemination and exposition of the documents depends on the historic day
8. Training Programa. Prepare staff to be trained on Research, Media Libraries and electronic publication and documentation
0 0 0 0 0
b. Delegate 2 staff to take part in Library course plus two others to take part in Records Management and Book Binding course in Malaysia
3,000 0 3,000 0 0 0 3,000
c. Delegate 1 staff to train at the Research area in Mozambique
10,000 0 10,000 0 0 0 10,000
d. Delegate 1 staff to take part in a Media and Publication course in Indonesia
9,000 0 9,000 0 0 0 9,000
e. Delegate 2 staff to train in the Archiving Faculty in Brazil
50,000 0 50,000 0 0 0 50,000
f. Send 1 staff to train in Leadership Management in Portugal and to look into the CPLP archives
5,000 0 5,000 0 0 0 5,000
g. Send 1 staff to train in Electronics Documentation in Australia
9,000 0 9,000 0 0 0 9,000
h. Send 1 staff to be trained in the area of Internal Affairs in Australia
50,000 0 50,000 0 0 0 50,000
1. Publication of the Journal of the Republic 133,000 0 133,000 119,000 0 119,000 119,000 0 119,000 119,000 0 119,000 490,000
2. Facilities Project 60,000 0 60,000 0 0 0 60,000a. Reconstruction of Building
Program: Development of the Official Information Services of the State
Ministry for State Administration Page 55 of 108

Programme Matrix Road Map -- Annex 3
CFET TFET (and other
funding sources)
Combined Total
CFET Other Funding Sources
Combined Total
CFET Other Funding Sources
Combined Total CFET Other Funding Sources
Combined Total
Overall Totals2006/72003/4 2004/5 2005/6Priority Rank
Programs and/or Components
b. Installation of machinery3. Database creation 0 0 0 0 0a. Designb. Approvalc. Implementation4. Human Resources Capacity Development 0 0 0 0 0
a. Management Trainingb. Technical trainings5. Study of the financial feasibility of the services and their organizational options
0 0 0 0 0
1 1. Capacity Buiding of the Public Service Human Resources
0 0 0 0 0
a. Training in Human Resources Management (Human Resources Management, Office management, Management and finances, Property management and procurement)
b. Training in Office Management (Reception, Filing, Reporting, Correspondence, Communication)
c. Training in Local Administration and Development (Leadership, Local Government Administration, Decision-making, Local Government Administration and Finances, Planning and Local Development)
Program: Public Service Training Center (CSA)
Ministry for State Administration Page 56 of 108

Programme Matrix Road Map -- Annex 3
CFET TFET (and other
funding sources)
Combined Total
CFET Other Funding Sources
Combined Total
CFET Other Funding Sources
Combined Total CFET Other Funding Sources
Combined Total
Overall Totals2006/72003/4 2004/5 2005/6Priority Rank
Programs and/or Components
d. Training in General Induction (Work ethics, rights and obligations; Terms and employment conditions; Coordination; Participation and Monitoring; Conduct of Meetings; Management of materials; Constitution; Public Administration techniques; Project Management; Organization and evaluation; Problem analysis/solving; Finance management
e. Computer training (basic level; intermediate level)
f. Train the Trainer (Academy's permanent trainers; Part-time trainers; District trainers; Trainers to train other trainers for other training centers
g. Seminars/Workshops to collect/contribute ideas of departments to develop methodology or a curriculum for the Public Service Training Center
3,000 4,000 4,000 5,000 16,000
h. Mobile group of trainers fort he District (General induction course; Office and Management course
3,000 3,000 4,000 5,000 15,000
1 2. Development of Training capacity 0 0 0 0 0
a. Structure and institutional capacity building (Organic Regulation; Staff Capacity Building; Campus Management, internship, etc.; Study on the Institutional permanent co-operation (duplication)
b. Develop a curriculum (Curriculum for Local Government training; Curriculum for general induction; Curriculum for basic level training; Curriculum for intermediate level training; Curriculum for advance level training)
Ministry for State Administration Page 57 of 108

Programme Matrix Road Map -- Annex 3
CFET TFET (and other
funding sources)
Combined Total
CFET Other Funding Sources
Combined Total
CFET Other Funding Sources
Combined Total CFET Other Funding Sources
Combined Total
Overall Totals2006/72003/4 2004/5 2005/6Priority Rank
Programs and/or Components
c. Educational materials and equipment (development of training materials)
d. Building fittings/infrastructures (training rooms, dormitory fitting, electrical fitting)
e. Library (books, internet access and sources of computer science; bulletins)
f. Inter-relation and co-operation with similar institutions (IFAPA-Mozambique; INA-Portugal; INTAN-Malaysia; ANU-Australia; others)
g. Identification of co-operation mechanisms (Cooperation with agencies involved in programs conception)
h. Two years assistance from UNDP to strengthen the institution
i. Survey on training needsj. Assessment of training impact on students (seminars and workshops; surveys)
Total 986,000 0 11,737,000 686,000 0 4,143,000 686,000 0 6,144,000 686,000 0 8,146,000 30,170,000
Ministry for State Administration Page 58 of 108

Programme Matrix Road Map -- Annex 3
CFET TFET (and other
funding sources)
Combined Total
CFET Other Funding Sources
Combined Total
CFET Other Funding Sources
Combined Total
CFET Other Funding Sources
Combined Total
1. Human Resourcesa. Recruitment of Staff 35,000 0 35,000 45,000 0 45,000 52,000 0 52,000 65,000 0 65,000 197,000b. Capacity Building 50,000 0 50,000 45,000 0 45,000 35,000 0 35,000 30,000 0 30,000 160,000
2. Frequency Database Maintenance 500,000 500,000 10,000 20,000 1,030,000
a. Training Database from ITU b. Handover Database from UN-PKF to RDTL
c. Maintenance d. Monitoring Frequency
3. Regulations 10,000 10,000 10,000 20,000 50,000 a. Make draft of Communications Authority
b. Make draft frequency license c. Make draft frequency license fess
d. Make draft emission electromagnetic frequency radio
e. Make draft standardization 4. International Telecommunication Union 50,000 50,000 50,000 50,000 200,000
a. Register as a member of ITU b. Participate meeting CPLP and ITU c. Member of APT 5. Standardization and Quality 50,000 50,000 25,000 25,000 150,000 a. Communications equipment standardization b. Supervision equipment c. Control operation 6. VHF project 214,500 100,000 87,000 85,000 486,500 a. Installation VHF b. VHF Network Maintenance
15,000 15,000 15,000 15,000 60,0001. Policy formulation related to the effective delivery of essential services, management and operation of the divisions/directorate of Public Works, Roads, Bridges and Flood Control, R&D and Equipment and Material Production
Overall Totals2006/72003/4 2004/5 2005/6Priority Rank
Programs and/or Components
Program:Communications Regulatory Authority
Program: Director-General for Public Works
Ministry of Transportation, Communications and Public Works MTCPW Page 59 of 108
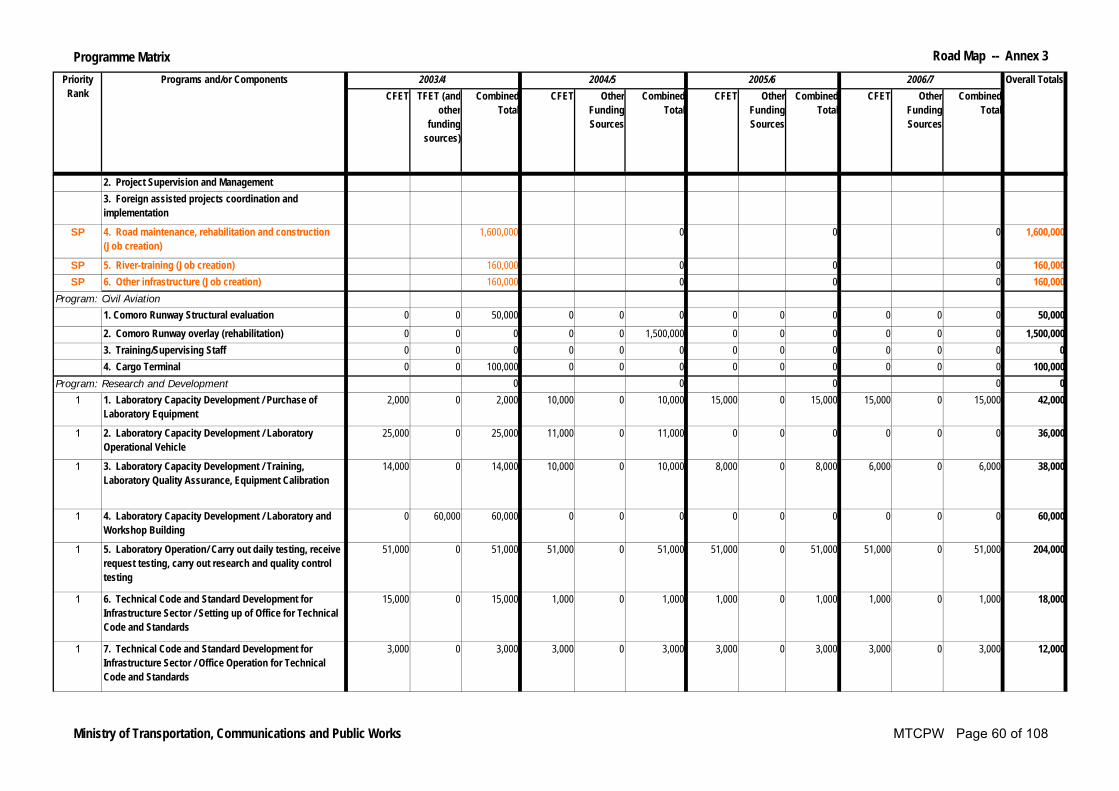
Programme Matrix Road Map -- Annex 3
CFET TFET (and other
funding sources)
Combined Total
CFET Other Funding Sources
Combined Total
CFET Other Funding Sources
Combined Total
CFET Other Funding Sources
Combined Total
Overall Totals2006/72003/4 2004/5 2005/6Priority Rank
Programs and/or Components
2. Project Supervision and Management 3. Foreign assisted projects coordination and
implementation
SP 4. Road maintenance, rehabilitation and construction (Job creation)
1,600,000 0 0 0 1,600,000
SP 5. River-training (Job creation) 160,000 0 0 0 160,000SP 6. Other infrastructure (Job creation) 160,000 0 0 0 160,000
1. Comoro Runway Structural evaluation 0 0 50,000 0 0 0 0 0 0 0 0 0 50,000
2. Comoro Runway overlay (rehabilitation) 0 0 0 0 0 1,500,000 0 0 0 0 0 0 1,500,000 3. Training/Supervising Staff 0 0 0 0 0 0 0 0 0 0 0 0 0 4. Cargo Terminal 0 0 100,000 0 0 0 0 0 0 0 0 0 100,000
0 0 0 0 01 1. Laboratory Capacity Development / Purchase of
Laboratory Equipment2,000 0 2,000 10,000 0 10,000 15,000 0 15,000 15,000 0 15,000 42,000
1 2. Laboratory Capacity Development / Laboratory Operational Vehicle
25,000 0 25,000 11,000 0 11,000 0 0 0 0 0 0 36,000
1 3. Laboratory Capacity Development / Training, Laboratory Quality Assurance, Equipment Calibration
14,000 0 14,000 10,000 0 10,000 8,000 0 8,000 6,000 0 6,000 38,000
1 4. Laboratory Capacity Development / Laboratory and Workshop Building
0 60,000 60,000 0 0 0 0 0 0 0 0 0 60,000
1 5. Laboratory Operation/ Carry out daily testing, receive request testing, carry out research and quality control testing
51,000 0 51,000 51,000 0 51,000 51,000 0 51,000 51,000 0 51,000 204,000
1 6. Technical Code and Standard Development for Infrastructure Sector / Setting up of Office for Technical Code and Standards
15,000 0 15,000 1,000 0 1,000 1,000 0 1,000 1,000 0 1,000 18,000
1 7. Technical Code and Standard Development for Infrastructure Sector / Office Operation for Technical Code and Standards
3,000 0 3,000 3,000 0 3,000 3,000 0 3,000 3,000 0 3,000 12,000
Program: Civil Aviation
Program: Research and Development
Ministry of Transportation, Communications and Public Works MTCPW Page 60 of 108

Programme Matrix Road Map -- Annex 3
CFET TFET (and other
funding sources)
Combined Total
CFET Other Funding Sources
Combined Total
CFET Other Funding Sources
Combined Total
CFET Other Funding Sources
Combined Total
Overall Totals2006/72003/4 2004/5 2005/6Priority Rank
Programs and/or Components
1 8. Technical Code and Standard Development for Infrastructure Sector/ Technical Assistance for setting up Standard System for Infrastructure Sector
15,000 0 15,000 5,000 0 5,000 5,000 0 5,000 5,000 0 5,000 30,000
2 9. Construction Project Quality Control / Construction materials on site inspection
3,000 0 3,000 3,000 0 3,000 3,000 0 3,000 3,000 0 3,000 12,000
2 10. Construction Project Quality Control / Workshop for construction material quality control
10,000 0 10,000 5,000 0 5,000 5,000 0 5,000 5,000 0 5,000 25,000
3 11. Research Programs - Quarry Survey and Aggregate Quality Test
1,000 0 1,000 0 0 0 0 0 0 0 0 0 1,000
3 12. Research Programs - Study on preventing house cracking and collapse caused by landslides
5,000 0 5,000 0 0 0 0 0 0 0 0 0 5,000
3 13. Research Programs - Feasibility study on cement production
10,000 0 10,000 0 0 0 0 0 0 0 0 0 10,000
3 14. Research Programs - Bamboo House construction Technology
4,000 0 4,000 0 0 0 0 0 0 0 0 0 4,000
3 15. Research Programs - Setting up of office for Research and Technology Development
12,000 0 12,000 5,000 0 5,000 5,000 0 5,000 5,000 0 5,000 27,000
4 16. Setting up Record and Technical Reference Support Division / Setting up Office
2,000 0 2,000 1,000 0 1,000 1,000 0 1,000 1,000 0 1,000 5,000
4 17. Setting up Record and Technical Reference Support Division / Office Operation
2,000 0 2,000 1,000 0 1,000 1,000 0 1,000 1,000 0 1,000 5,000
18,000 18,000 18,000 18,000 72,000
1 1. Policy formulation related to the effective delivery of essential services, management and operation of the divisions/directorate of Telecommunications, Information Technology, Postal Services, Land Transport, Government Transport, Civil Aviation, Maritime
Program:Director-General for Transport and Communications
Ministry of Transportation, Communications and Public Works MTCPW Page 61 of 108

Programme Matrix Road Map -- Annex 3
CFET TFET (and other
funding sources)
Combined Total
CFET Other Funding Sources
Combined Total
CFET Other Funding Sources
Combined Total
CFET Other Funding Sources
Combined Total
Overall Totals2006/72003/4 2004/5 2005/6Priority Rank
Programs and/or Components
1 2. Project Supervision and Management SP 3. Radio receivers with solar batteries (Stability area) 250,000 0 0 0 250,000
SP 4. Two-way radio sets with batteries (Stability area) 600,000 0 0 0 600,000
SP 5. Postal system with financial services in districts 325,000 0 0 0 325,000
1 1. Institution Building a. Staff Recruitment 142,476 0 142,476 171,216 0 171,216 171,216 0 171,216 171,216 0 171,216 656,124 b. Planning Regulation 25,000 0 25,000 0 0 0 0 0 0 0 0 0 25,000 c. Housing Policy 25,800 0 25,800 0 0 0 0 0 0 0 0 0 25,800
d. Capacity Building for National and District Staff 150,000 100,000 50,000 50,000 350,000
1 2. Spatial Planning and Housing 0 0 0 0 0a. Establishment of Urban and Regional Information System (URISET)
480,000 200,000 200,000 150,000 1,030,000
b. Slum Improvement Program 0 0 0 0 01) Drafting of the Program 250,000 150,000 150,000 150,000 700,0002) Construction 72,000 400,000 500,000 600,000 1,572,000c. Drafting of Dili Master Plan 10,000 0 10,000 0 0 0 0 0 0 0 0 0 10,000d. Promotion of Bamboo Low-Cost Housing1) Development of Bamboo House Proto-type within the premises of the Department located in Dili
20,000 0 20,000 0 0 0 0 0 0 0 0 0 20,000
2) Replication of Bamboo House proto-type in 13 districts 0 0 0 150,000 0 150,000 0 0 0 0 0 0 150,000
3) Replication of Bamboo House Proto-type in 40 selected villages
0 0 0 200,000 0 200,000 0 0 0 0 0 0 200,000
4) Establishment of National Bamboo Construction Institute 0 0 0 0 0 0 0 0 0 50,000 0 50,000 50,000
1 3. Development of Office Space 0 0 0 0 0a. Establishment of Training Centre 0 0 0 0 01) Refurbishment of Training Center Building 20,000 0 20,000 0 0 0 0 0 0 0 0 0 20,000
Program: Public Works
Ministry of Transportation, Communications and Public Works MTCPW Page 62 of 108

Programme Matrix Road Map -- Annex 3
CFET TFET (and other
funding sources)
Combined Total
CFET Other Funding Sources
Combined Total
CFET Other Funding Sources
Combined Total
CFET Other Funding Sources
Combined Total
Overall Totals2006/72003/4 2004/5 2005/6Priority Rank
Programs and/or Components
2) Site Development and Utility 20,000 0 20,000 0 0 0 0 0 0 0 0 0 20,0003) Building maintenance 5,000 0 5,000 10,000 0 10,000 15,000 0 15,000 20,000 0 20,000 50,000b. Establishment of National Department Office 0 0 01) . Refurbishment of ex-KANWIL-PU Building 359,000 0 359,000 0 0 0 0 0 0 0 0 0 359,0002) Purchase of motorcycle and 4-wheel drive pick-up 54,000 0 54,000 54,000 0 54,000 0 0 0 0 0 0 108,000
3) Building maintenance 0 0 0 10,000 0 10,000 10,000 0 10,000 10,000 0 10,000 30,000c. Establishment of District Public Works Offices 0 0 0 0 0
1) Provision of 13 Public Works District Offices including purchase of office furniture and vehicle
351,000 0 351,000 0 0 0 0 0 0 0 0 0 351,000
2) Purchase of motrocycle and 4-wheel drive pick-up 26,000 0 26,000 208,000 0 208,000 0 0 0 0 0 0 234,000
3) Building maintenance 0 0 0 7,000 0 7,000 7,000 0 7,000 7,000 0 7,000 21,0002 1. Institution Building 0 0 0 0 0
a. Inter-governmental coordination 1,000 0 1,000 1,000 0 1,000 1,000 0 1,000 1,000 0 1,000 4,000b. Overseas Study Tour 42,000 0 42,000 60,000 0 60,000 60,000 0 60,000 60,000 0 60,000 222,000
2 2. Spatial Planning and Housing 0 0 0 0 0a. Delineation of Urban built Up zone for National Capital and 12 District Capitals
10,000 0 10,000 10,000 0 10,000 10,000 0 10,000 10,000 0 10,000 40,000
b. Drafting of Area Development Plans for strategically significant zones
10,000 0 10,000 20,000 0 20,000 25,000 0 25,000 30,000 0 30,000 85,000
2 3. Provision of Technical Assistance to Government Agencies, the Public and the Private sector
0 0 0 0 0 0 0 0 0 0 0 0 0
1. Urban Water Supply 0 0 0 0 0a. Water resources management legislation: Policy and Regulation
0 0 0 0 0
b. Water service legislation and tariff policy: Policy and regulation
0 0 0 0 0
c. Strategic plan for water resources management and environmental impact study: strategic planning
0 0 0 0 0
Program: Water and Sanitation
Ministry of Transportation, Communications and Public Works MTCPW Page 63 of 108
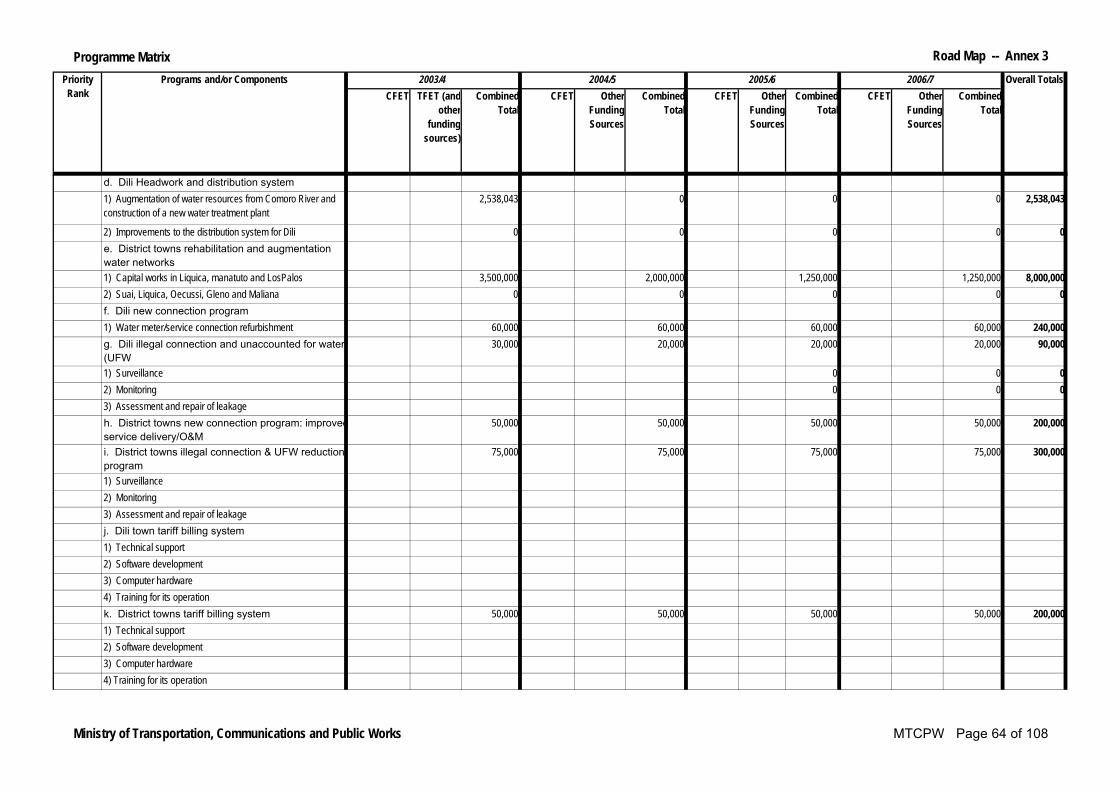
Programme Matrix Road Map -- Annex 3
CFET TFET (and other
funding sources)
Combined Total
CFET Other Funding Sources
Combined Total
CFET Other Funding Sources
Combined Total
CFET Other Funding Sources
Combined Total
Overall Totals2006/72003/4 2004/5 2005/6Priority Rank
Programs and/or Components
d. Dili Headwork and distribution system 1) Augmentation of water resources from Comoro River and construction of a new water treatment plant
2,538,043 0 0 0 2,538,043
2) Improvements to the distribution system for Dili 0 0 0 0 0e. District towns rehabilitation and augmentation water networks
1) Capital works in Liquica, manatuto and LosPalos 3,500,000 2,000,000 1,250,000 1,250,000 8,000,0002) Suai, Liquica, Oecussi, Gleno and Maliana 0 0 0 0 0f. Dili new connection program 1) Water meter/service connection refurbishment 60,000 60,000 60,000 60,000 240,000g. Dili illegal connection and unaccounted for water (UFW
30,000 20,000 20,000 20,000 90,000
1) Surveillance 0 0 02) Monitoring 0 0 03) Assessment and repair of leakageh. District towns new connection program: improved service delivery/O&M
50,000 50,000 50,000 50,000 200,000
i. District towns illegal connection & UFW reduction program
75,000 75,000 75,000 75,000 300,000
1) Surveillance2) Monitoring3) Assessment and repair of leakagej. Dili town tariff billing system1) Technical support2) Software development3) Computer hardware4) Training for its operationk. District towns tariff billing system 50,000 50,000 50,000 50,000 200,0001) Technical support2) Software development3) Computer hardware4) Training for its operation
Ministry of Transportation, Communications and Public Works MTCPW Page 64 of 108

Programme Matrix Road Map -- Annex 3
CFET TFET (and other
funding sources)
Combined Total
CFET Other Funding Sources
Combined Total
CFET Other Funding Sources
Combined Total
CFET Other Funding Sources
Combined Total
Overall Totals2006/72003/4 2004/5 2005/6Priority Rank
Programs and/or Components
l. Updating of Dili water supply: Improved service deliverym. Asset database & As-Built drawing: Improved service deliveryn. Water resources management systems and procedures: Improved service delivery
25,000 25,000 25,000 25,000 100,000
2. Urban Sanitationa. Urban Sanitation Management legislation: Policy and regulationb. Urban sanitation strategic plans1) Strategic plannning for Dili' 15,000 15,0002) Strategic planning for District townsc. Capital upgrading of solid waste management infrastructure in Dili; priority work in Tibar dump
20,000 40,000 40,000 40,000 140,000
d. Capital works and upgrading of waste water collection and treatment in Dili1) Urban waste water policy and regulation (Dili and district main towns)
2) Urban waste water strategic planning (Dili and district main towns)
3) Urban waste water capital works (Dili) 30,000 30,000 30,000 30,000 120,000e. Augmentation of Dili drainage system in Dili1) Urban drainage policy and regulation (Dili and District main towns)
2) Urban drainage strategic planning (Dili and district towns)
3) Urban drainage priority rehabilitation - Dili4) Dili drainage clean and repair 100,000 100,000 100,000 100,000 400,000f. Capital works implementation for district towns of solid waste and waste water collection systems; capital works
200,000 200,000 200,000 200,000 800,000
g. Update to efficient sanitation operation and maintenance for Dili
280,000 280,000 280,000 280,000 1,120,000
Ministry of Transportation, Communications and Public Works MTCPW Page 65 of 108

Programme Matrix Road Map -- Annex 3
CFET TFET (and other
funding sources)
Combined Total
CFET Other Funding Sources
Combined Total
CFET Other Funding Sources
Combined Total
CFET Other Funding Sources
Combined Total
Overall Totals2006/72003/4 2004/5 2005/6Priority Rank
Programs and/or Components
1) Household, markets, RDTL office rubbish collection and street cleaning
2) Capital works; solid waste bins/bunkers3. Community Water and Sanitationa. Best practice methodologies for community water supply and sanitation; strategic planning
90,000 90,000
b. Community water supply and sanitation implementation
3,250,000 3,250,000 3,250,000 3,250,000 13,000,000
1) Monitoring and evaluation2) Capital worksc. Emergency response facility 780,000 780,000 780,000 780,000 3,120,000d. Guidelines for CWSS; improved service delivery
SP e. Water and Sanitation (Job creation) 160,000 0 0 0 160,0004. Institution and Capacity Buildinga. General HRD programs1) WSS capacity building and HRD2) Recruitment of staff 232,272 395,676 395,676 395,676 1,419,300b. IEC programs 50,000 50,000 50,000 50,000 200,0001) Community development2) Hygiene promotion3) Water tariff campaigfn
1. Maintenance of Government buildings 7,000 0 7,000 7,000 0 7,000 7,000 0 7,000 7,000 0 7,000 28,0002. Recruitment of Personnel 609,000 0 609,000 609,000 0 609,000 609,000 0 609,000 609,000 0 609,000 2,436,0003. Institutional Development a. Equipment acquisition 3,500 0 3,500 2,000 0 2,000 2,500 0 2,500 2,500 0 2,500 10,500b. Transport facilities 29,700 0 29,700 0 0 0 0 0 0 0 0 0 29,700
1. Institutional Development and Regulations -- Harbour component
Program: Maintenance Division
Program: Sea Transportation
Ministry of Transportation, Communications and Public Works MTCPW Page 66 of 108

Programme Matrix Road Map -- Annex 3
CFET TFET (and other
funding sources)
Combined Total
CFET Other Funding Sources
Combined Total
CFET Other Funding Sources
Combined Total
CFET Other Funding Sources
Combined Total
Overall Totals2006/72003/4 2004/5 2005/6Priority Rank
Programs and/or Components
a. Organizational structure of harbour administration -- APORTIL -- Central and regional
Ministry of Transportation, Communications and Public Works MTCPW Page 67 of 108

Programme Matrix Road Map -- Annex 3
CFET TFET (and other
funding sources)
Combined Total
CFET Other Funding Sources
Combined Total
CFET Other Funding Sources
Combined Total
CFET Other Funding Sources
Combined Total
Overall Totals2006/72003/4 2004/5 2005/6Priority Rank
Programs and/or Components
b. Basic regulation of operations and revision of the harbour ratesc. Regulation regulating the activities of harbour operator, navigation agent and stowage operator
d. Ratification of harbour conventionsSP 2. Special situation of the enclave of OecussiSP a. Ferry Service -- OECUSSI 1,000,000 0 0 0 1,000,000SP b. Communications -- OECUSSI 750,000 0 0 0 750,000
1. Administration and Development of Human Resources
14,760 0 14,760 14,760 0 14,760 14,760 0 14,760 14,760 0 14,760 59,040
2. Administrative services and coordination between Departments
14,760 0 14,760 14,760 0 14,760 14,760 0 14,760 14,760 0 14,760 59,040
3. Financial plan, budget management and control 14,760 0 14,760 14,760 0 14,760 14,760 0 14,760 14,760 0 14,760 59,040
4. Pre-qualitifcation and coordination with Supply (provisioning) office
14,760 0 14,760 14,760 0 14,760 14,760 0 14,760 14,760 0 14,760 59,040
5. Extensive supervision, control and General inspection
14,760 0 14,760 14,760 0 14,760 14,760 0 14,760 14,760 0 14,760 59,040
6. Property administration 14,760 0 14,760 14,760 0 14,760 14,760 0 14,760 14,760 0 14,760 59,0407. Equipment for support of services in the Division of Administraiton
12,563 0 12,563 0 0 0 0 0 0 1,200 0 1,200 13,763
0 0 0 0 0 0 0 0 0 0 0 0 01. National Roadsa. Betterment of NATIONAL ROADS from the region of Baucau
285,432 292,567 299,882 307,379 1,185,260
b. Betterment of NATIONAL ROADS from the region of Dili
356,790 365,709 374,852 384,223 1,481,574
c. Betterment of NATIONAL ROADS from the region of Same
249,753 255,996 262,396 268,956 1,037,101
d. Betterment of NATIONAL ROADS from the region of Maliana
285,432 292,567 299,882 307,379 1,185,260
e. Betterment of NATIONAL ROADS from the region of Oecusse
107,037 109,712 112,455 115,267 444,471
Program: Betterment of Roads
Program: Administration
Ministry of Transportation, Communications and Public Works MTCPW Page 68 of 108
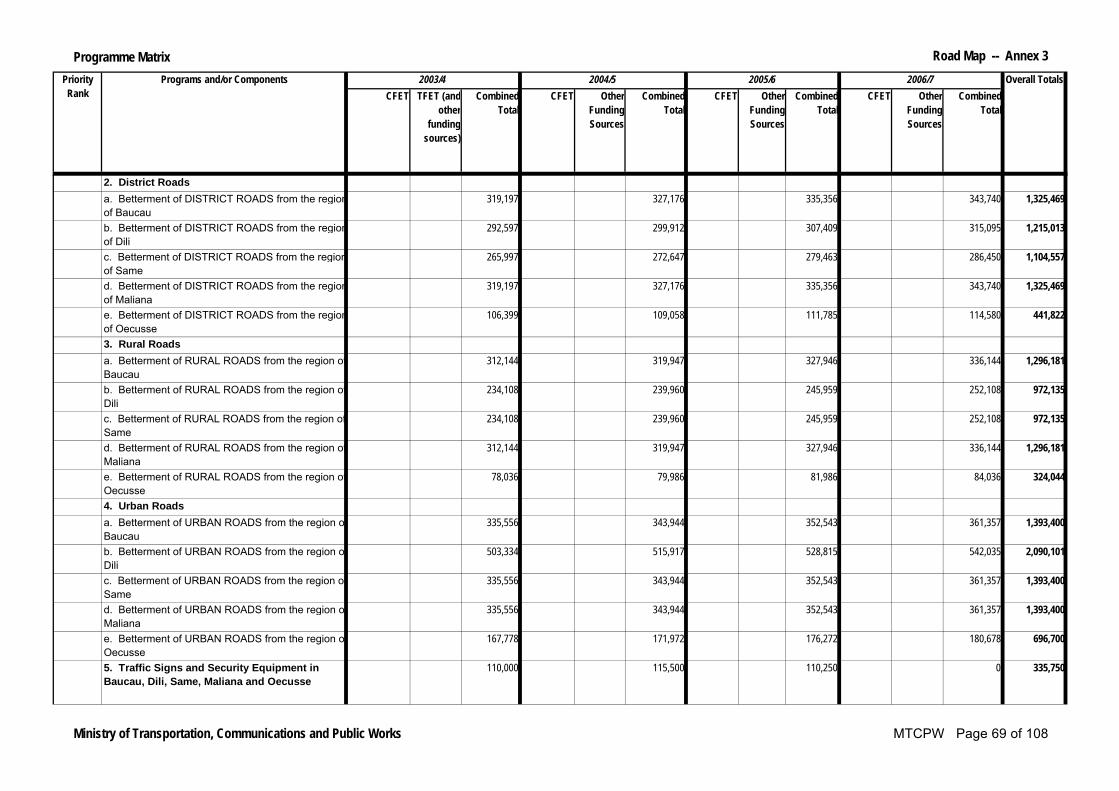
Programme Matrix Road Map -- Annex 3
CFET TFET (and other
funding sources)
Combined Total
CFET Other Funding Sources
Combined Total
CFET Other Funding Sources
Combined Total
CFET Other Funding Sources
Combined Total
Overall Totals2006/72003/4 2004/5 2005/6Priority Rank
Programs and/or Components
2. District Roadsa. Betterment of DISTRICT ROADS from the region of Baucau
319,197 327,176 335,356 343,740 1,325,469
b. Betterment of DISTRICT ROADS from the region of Dili
292,597 299,912 307,409 315,095 1,215,013
c. Betterment of DISTRICT ROADS from the region of Same
265,997 272,647 279,463 286,450 1,104,557
d. Betterment of DISTRICT ROADS from the region of Maliana
319,197 327,176 335,356 343,740 1,325,469
e. Betterment of DISTRICT ROADS from the region of Oecusse
106,399 109,058 111,785 114,580 441,822
3. Rural Roadsa. Betterment of RURAL ROADS from the region of Baucau
312,144 319,947 327,946 336,144 1,296,181
b. Betterment of RURAL ROADS from the region of Dili
234,108 239,960 245,959 252,108 972,135
c. Betterment of RURAL ROADS from the region of Same
234,108 239,960 245,959 252,108 972,135
d. Betterment of RURAL ROADS from the region of Maliana
312,144 319,947 327,946 336,144 1,296,181
e. Betterment of RURAL ROADS from the region of Oecusse
78,036 79,986 81,986 84,036 324,044
4. Urban Roadsa. Betterment of URBAN ROADS from the region of Baucau
335,556 343,944 352,543 361,357 1,393,400
b. Betterment of URBAN ROADS from the region of Dili
503,334 515,917 528,815 542,035 2,090,101
c. Betterment of URBAN ROADS from the region of Same
335,556 343,944 352,543 361,357 1,393,400
d. Betterment of URBAN ROADS from the region of Maliana
335,556 343,944 352,543 361,357 1,393,400
e. Betterment of URBAN ROADS from the region of Oecusse
167,778 171,972 176,272 180,678 696,700
5. Traffic Signs and Security Equipment in Baucau, Dili, Same, Maliana and Oecusse
110,000 115,500 110,250 0 335,750
Ministry of Transportation, Communications and Public Works MTCPW Page 69 of 108

Programme Matrix Road Map -- Annex 3
CFET TFET (and other
funding sources)
Combined Total
CFET Other Funding Sources
Combined Total
CFET Other Funding Sources
Combined Total
CFET Other Funding Sources
Combined Total
Overall Totals2006/72003/4 2004/5 2005/6Priority Rank
Programs and/or Components
6. Flood Control in Baucau, Dili, Same, Maliana and Oecusse
490,000 580,000 630,000 580,000 2,280,000
7. Human Resources 2,600,700 2,862,770 3,145,547 3,461,601 12,070,618a. Recruitment of new officers for RBFC Division (national and of district)b. Capacity traiing for officers of the RBFC Division 30,000 35,000 35,000 40,000 140,000
c. TA to the 5 regions 0d. Salary and Wages 184,800 203,280 223,608 245,968 857,656e. Goods and Services 2,385,900 2,624,490 2,886,939 3,175,632 11,072,9618. Research and Investigations a. Roads Classification 45,000 0 0 0 45,000b. Geometrical standards of roadways 40,000 0 0 0 40,000c. Researches for self-financing of roadways 0 50,000 0 0 50,000
d. Traffic counting 25,200 26,460 27,783 29,172 108,615e. Minor Capital 283,400 0 0 0 283,400
1. National Roads 0a. Rehabilitation of NATIONAL ROADS from the region of Baucau
1,561,896 1,600,943 1,640,966 1,681,991 6,485,796
b. Rehabilitation of NATIONAL ROADS from the region of Dili
1,561,896 1,600,943 1,640,966 1,681,991 6,485,796
c. Rehabilitation of NATIONAL ROADS from the region of Same
1,171,422 1,200,707 1,230,725 1,261,493 4,864,347
d. Rehabilitation of NATIONAL ROADS from the region of Maliana
1,561,896 1,600,943 1,640,966 1,681,991 6,485,796
e. Rehabilitation of NATIONAL ROADS from the region of Oecusse
780,948 800,471 820,483 840,995 3,242,897
2. District Roads 0a. Rehabilitation of DISTRICT ROADS from the region of Baucau
731,377 749,661 768,403 787,613 3,037,054
b. Rehabilitation of DISTRICT ROADS from the region of Dili
292,551 299,864 307,361 315,045 1,214,821
c. Rehabilitation of DISTRICT ROADS from the region of Same
585,102 599,729 614,722 630,090 2,429,643
Program: Rehabilitation of Roads
Ministry of Transportation, Communications and Public Works MTCPW Page 70 of 108
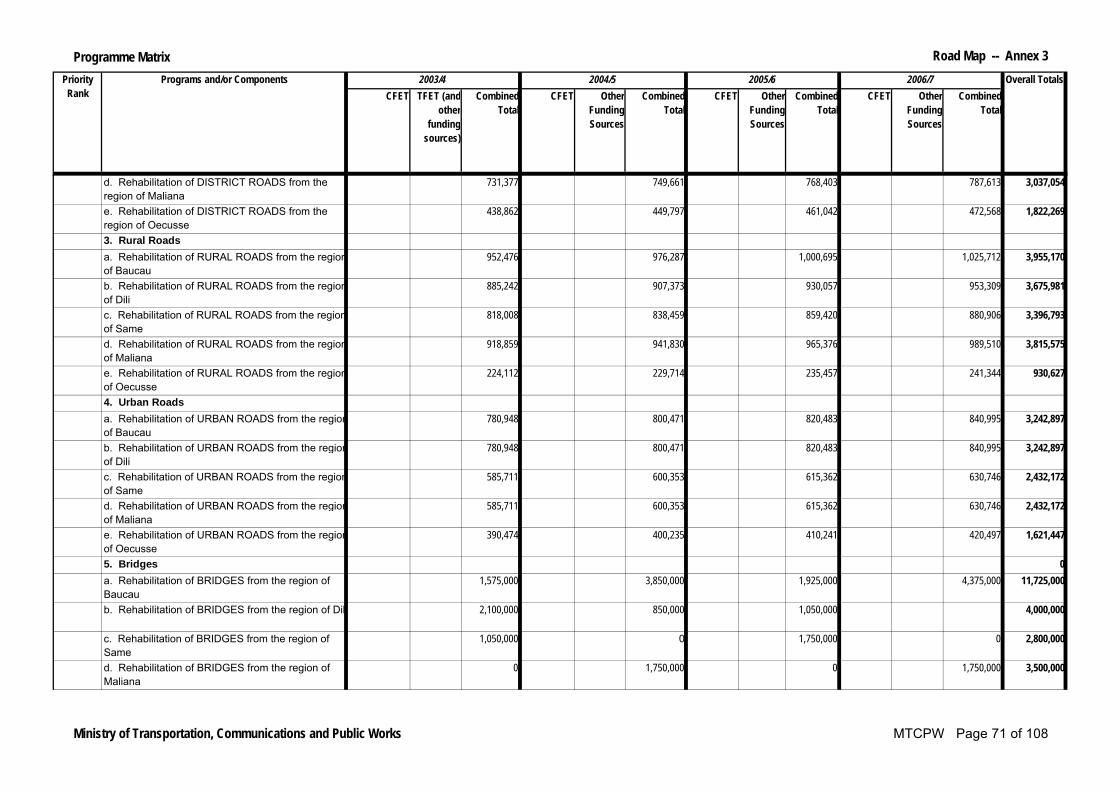
Programme Matrix Road Map -- Annex 3
CFET TFET (and other
funding sources)
Combined Total
CFET Other Funding Sources
Combined Total
CFET Other Funding Sources
Combined Total
CFET Other Funding Sources
Combined Total
Overall Totals2006/72003/4 2004/5 2005/6Priority Rank
Programs and/or Components
d. Rehabilitation of DISTRICT ROADS from the region of Maliana
731,377 749,661 768,403 787,613 3,037,054
e. Rehabilitation of DISTRICT ROADS from the region of Oecusse
438,862 449,797 461,042 472,568 1,822,269
3. Rural Roads a. Rehabilitation of RURAL ROADS from the region of Baucau
952,476 976,287 1,000,695 1,025,712 3,955,170
b. Rehabilitation of RURAL ROADS from the region of Dili
885,242 907,373 930,057 953,309 3,675,981
c. Rehabilitation of RURAL ROADS from the region of Same
818,008 838,459 859,420 880,906 3,396,793
d. Rehabilitation of RURAL ROADS from the region of Maliana
918,859 941,830 965,376 989,510 3,815,575
e. Rehabilitation of RURAL ROADS from the region of Oecusse
224,112 229,714 235,457 241,344 930,627
4. Urban Roadsa. Rehabilitation of URBAN ROADS from the region of Baucau
780,948 800,471 820,483 840,995 3,242,897
b. Rehabilitation of URBAN ROADS from the region of Dili
780,948 800,471 820,483 840,995 3,242,897
c. Rehabilitation of URBAN ROADS from the region of Same
585,711 600,353 615,362 630,746 2,432,172
d. Rehabilitation of URBAN ROADS from the region of Maliana
585,711 600,353 615,362 630,746 2,432,172
e. Rehabilitation of URBAN ROADS from the region of Oecusse
390,474 400,235 410,241 420,497 1,621,447
5. Bridges 0a. Rehabilitation of BRIDGES from the region of Baucau
1,575,000 3,850,000 1,925,000 4,375,000 11,725,000
b. Rehabilitation of BRIDGES from the region of Dili 2,100,000 850,000 1,050,000 4,000,000
c. Rehabilitation of BRIDGES from the region of Same
1,050,000 0 1,750,000 0 2,800,000
d. Rehabilitation of BRIDGES from the region of Maliana
0 1,750,000 0 1,750,000 3,500,000
Ministry of Transportation, Communications and Public Works MTCPW Page 71 of 108

Programme Matrix Road Map -- Annex 3
CFET TFET (and other
funding sources)
Combined Total
CFET Other Funding Sources
Combined Total
CFET Other Funding Sources
Combined Total
CFET Other Funding Sources
Combined Total
Overall Totals2006/72003/4 2004/5 2005/6Priority Rank
Programs and/or Components
e. Rehabilitation of BRIDGES from the region of Oecusse
2,100,000 0 2,100,000 2,100,000 6,300,000
1. National Roadsa. Routine Maintenance of NATIONAL ROADS from the region of Baucau
344,374 378,812 416,693 458,362 1,598,241
b. Routine Maintenance ofNATIONAL ROADS from the region of Dili
270,824 297,906 327,697 360,467 1,256,894
c. Routine Maintenance of NATIONAL ROADS from the region of Same
227,581 250,339 275,373 302,910 1,056,203
d. Routine Maintenance of NATIONAL ROADS from the region of Maliana
390,482 429,530 472,483 519,732 1,812,227
e. Routine Maintenance of NATIONAL ROADS from the region of Oecusse
84,176 92,594 101,853 112,038 390,661
2. District Roadsa. Routine Maintenance ofDISTRICT ROADS from the region of Baucau
226,800 249,480 274,428 301,870 1,052,578
b. Routine Maintenance of DISTRICT ROADS from the region of Dili
131,544 144,698 159,168 175,085 610,495
c. Routine Maintenance of DISTRICT ROADS from the region of Same
172,704 189,974 208,971 229,869 801,518
d. Routine Maintenance of DISTRICT ROADS from the region of Maliana
137,760 151,536 166,689 183,358 639,343
e. Routine Maintenance of DISTRICT ROADS from the region of Oecusse
61,320 67,452 74,197 81,616 284,585
3. Rural Roads a. Routine Maintenance of RURAL ROADS from the region of Baucau
288,792 317,671 349,438 384,382 1,340,283
b. Routine Maintenance of RURAL ROADS from the region of Dili
268,380 295,218 324,739 357,213 1,245,550
c. Routine Maintenance of RURAL ROADS from the region of Same
247,590 272,349 299,583 329,542 1,149,064
d. Routine Maintenance of RURAL ROADS from the region of Maliana
279,720 307,692 338,461 372,307 1,298,180
e. Routine Maintenance of RURAL ROADS from the region of Oecusse
41,580 45,738 50,311 55,342 192,971
Program: Maintenance of Roads
Ministry of Transportation, Communications and Public Works MTCPW Page 72 of 108

Programme Matrix Road Map -- Annex 3
CFET TFET (and other
funding sources)
Combined Total
CFET Other Funding Sources
Combined Total
CFET Other Funding Sources
Combined Total
CFET Other Funding Sources
Combined Total
Overall Totals2006/72003/4 2004/5 2005/6Priority Rank
Programs and/or Components
4. Urban Roads a. Routine Maintenance of URBAN ROADS from the region of Baucau
79,531 484 96,232 105,856 282,103
b. Routine Maintenance of URBAN ROADS from the region of Dili
159,062 174,968 192,465 211,712 738,207
c. Routine Maintenance of URBAN ROADS from the region of Same
48,888 53,776 59,154 65,069 226,887
d. Routine Maintenance of URBAN ROADS from the region of Maliana
53,222 58,544 64,399 70,839 247,004
e. Routine Maintenance of URBAN ROADS from the region of Oecusse
20,160 22,176 24,393 26,832 93,561
5. Bridges a. Periodic Maintenance of BRIDGES from the region of Baucau
1,246,512 1,277,675 1,309,617 1,342,537 5,176,341
b. Periodic Maintenance of BRIDGES from the region of Dili
980,358 1,004,867 1,029,988 1,055,738 4,070,951
c. Periodic Maintenance of BRIDGES from the region of Same
823,875 844,472 865,584 887,223 3,421,154
d. Periodic Maintenance of BRIDGES from the region of Maliana
1,130,153 1,158,407 1,187,367 1,217,051 4,692,978
e. Periodic Maintenance of BRIDGES from the region of Oecusse
378,921 388,394 398,104 408,056 1,573,475
6. District Roads - Periodic Maintenance a. Periodic Maintenance of DISTRICT ROADS from the region of Baucau
672,782 689,602 706,842 724,513 2,793,739
b. Periodic Maintenance of DISTRICT ROADS from the region of Dili
398,686 408,653 418,869 429,341 1,655,549
c. Periodic Maintenance of DISTRICT ROADS from the region of Same
512,311 525,119 538,247 551,703 2,127,380
d. Periodic Maintenance of DISTRICT ROADS from the region of Maliana
408,653 418,869 429,341 440,074 1,696,937
e. Periodic Maintenance of DISTRICT ROADS from the region of Oecusse
199,343 204,326 209,434 214,670 827,773
7. Urban Roads -- Periodic Maintenance a. Periodic Maintenance of URBAN ROADS from the region of Baucau
629,252 644,983 661,107 677,635 2,612,977
Ministry of Transportation, Communications and Public Works MTCPW Page 73 of 108

Programme Matrix Road Map -- Annex 3
CFET TFET (and other
funding sources)
Combined Total
CFET Other Funding Sources
Combined Total
CFET Other Funding Sources
Combined Total
CFET Other Funding Sources
Combined Total
Overall Totals2006/72003/4 2004/5 2005/6Priority Rank
Programs and/or Components
b. Periodic Maintenance of URBAN ROADS from the region of Dili
1,242,772 1,273,772 1,305,688 1,338,330 5,160,562
c. Periodic Maintenance of URBAN ROADS from the region of Same
393,282 403,114 413,192 423,522 1,633,110
d. Periodic Maintenance of URBAN ROADS from the region of Maliana
424,745 453,363 446,247 457,404 1,781,759
e. Periodic Maintenance of URBAN ROADS from the region of Oecusse
157,313 161,245 165,276 169,408 653,242
8. Roads -- Emergency Maintenance a. Emergency Maintenance of the ROADS from the region of Baucau
57,117 62,829 69,112 76,023 265,081
b. Emergency Maintenance of the ROADS from the region of Dili
40,236 44,260 48,686 53,555 186,737
c. Emergency Maintenance of the ROADS from the region of Same
40,028 44,031 48,434 53,277 185,770
d. Emergency Maintenance of the ROADS from the region of Maliana
52,824 58,106 63,917 70,309 245,156
e. Emergency Maintenance of the ROADS from the region of Oecusse
14,549 16,004 17,605 19,365 67,523
9. Bridges -- Periodic Maintenance a. Periodic Maintenance of the BRIDGES from the region of Baucau
60,000 66,000 72,600 79,860 278,460
b. Periodic Maintenance of the BRIDGES from the region of Dili
50,000 55,000 60,500 66,550 232,050
c. Periodic Maintenance of the BRIDGES from the region of Same
60,000 66,000 72,600 79,860 278,460
d. Periodic Maintenance of the BRIDGES from the region of Maliana
60,000 66,000 72,600 79,860 278,460
e. Periodic Maintenance of the BRIDGES from the region of Oecusse
20,000 22,000 24,200 26,620 92,820
TOTAL 2,130,599 60,000 68,914,583 1,803,776 0 61,728,286 1,191,276 0 60,636,284 1,258,476 0 63,951,693 255,230,846
Ministry of Transportation, Communications and Public Works MTCPW Page 74 of 108
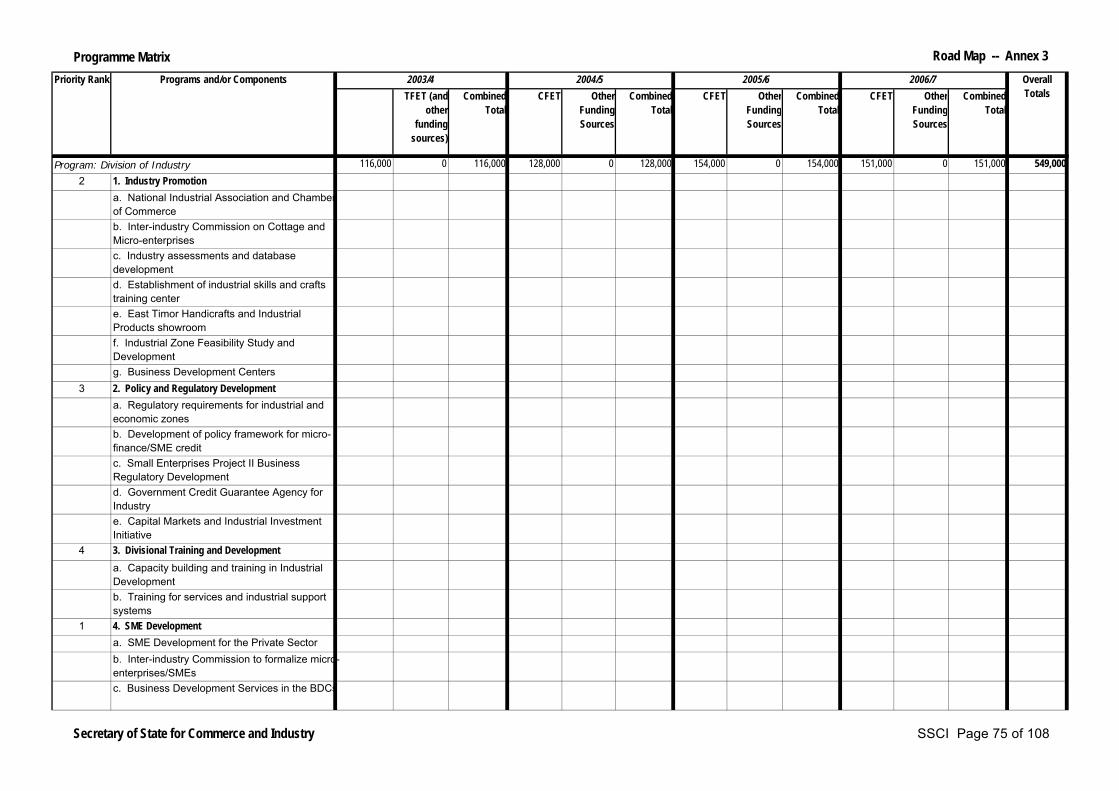
Programme Matrix Road Map -- Annex 3
TFET (and other
funding sources)
Combined Total
CFET Other Funding Sources
Combined Total
CFET Other Funding Sources
Combined Total
CFET Other Funding Sources
Combined Total
116,000 0 116,000 128,000 0 128,000 154,000 0 154,000 151,000 0 151,000 549,000
2 1. Industry Promotion a. National Industrial Association and Chamber
of Commerce b. Inter-industry Commission on Cottage and
Micro-enterprises c. Industry assessments and database
developmentd. Establishment of industrial skills and crafts training centere. East Timor Handicrafts and Industrial Products showroomf. Industrial Zone Feasibility Study and Developmentg. Business Development Centers
3 2. Policy and Regulatory Developmenta. Regulatory requirements for industrial and economic zonesb. Development of policy framework for micro-finance/SME creditc. Small Enterprises Project II Business Regulatory Developmentd. Government Credit Guarantee Agency for Industrye. Capital Markets and Industrial Investment Initiative
4 3. Divisional Training and Development
a. Capacity building and training in Industrial Developmentb. Training for services and industrial support systems
1 4. SME Developmenta. SME Development for the Private Sectorb. Inter-industry Commission to formalize micro-enterprises/SMEs
c. Business Development Services in the BDCs
Overall Totals
2006/72003/4 2004/5 2005/6
Program: Division of Industry
Priority Rank Programs and/or Components
Secretary of State for Commerce and Industry SSCI Page 75 of 108

Programme Matrix Road Map -- Annex 3
TFET (and other
funding sources)
Combined Total
CFET Other Funding Sources
Combined Total
CFET Other Funding Sources
Combined Total
CFET Other Funding Sources
Combined Total
Overall Totals
2006/72003/4 2004/5 2005/6Priority Rank Programs and/or Components
d. Project on competition policy and competitivenesse. Business information and entrepreneurship promotion
SP f. Bricks and other construction materials to supply local market -- OECUSSI
5,000 0 0 0 5,000
SP g. Furniture to supply local market -- OECUSSI 10,000 0 0 0 10,000
SP h. Other small-scale industries and services -- OECUSSI
20,000 0 0 0 20,000
123,000 0 123,000 145,000 0 145,000 143,000 0 143,000 159,000 0 159,000 570,0001 1. Trade Promotion
a. Establishment of Trade Exposition Center
b. Capitalization and Enlargement of Industrial Zonec. Seaport and Airport Enhancement for Trade Facilitation Logisticsd. Support for Export-related industry inclusion in Industrial zonee. Domestic Trade promotion and domestic market linkagesf. Trade-related marketing and promotion for SMEsg. Support for export finance and export transactionsh. Export and trade show participation and hostingi. Infrastructure imporvements in support of export enhancementj. Enhancing foreign trade relations (Indonesia/Australia)k. Web-based linkages to international trade networksl. Promotional packages of trade opportunity informationm. Database management of exporters and importers
Program: Division of Trade
Secretary of State for Commerce and Industry SSCI Page 76 of 108

Programme Matrix Road Map -- Annex 3
TFET (and other
funding sources)
Combined Total
CFET Other Funding Sources
Combined Total
CFET Other Funding Sources
Combined Total
CFET Other Funding Sources
Combined Total
Overall Totals
2006/72003/4 2004/5 2005/6Priority Rank Programs and/or Components
2 2. Policy and Regulatory Developmenta. Domestic trade policyb. Foreign trade policyc. Cooperative development of trade and customs lawd. Regulatory system for foreign trade licensing and monitoringe. International trade agreement accession
f. Policy instruments for export and import substitution programsg. Trade-related support for domestic SMEs
h. Liaison function with Environment unit4 3. Divisional Training and Development
a. Training materials on Trade, Regulation and Transaction Financeb. Foreign Language Training to enhance trade promotionc. Technical assistance on trade practices, customs and imports
d. Web-based tools for information dissemination and archiving
e. Media management for public relations and trade-related news
3 4. Business Registrationa. Improved and effective registration process
b. Clarification of different types of registered businessesc. Database development and enhancement
d. Linkage of registration and companies and foreign Investment Law
50,000 0 50,000 54,000 0 54,000 85,000 0 85,000 165,000 0 165,000 354,000Program: Administration
Secretary of State for Commerce and Industry SSCI Page 77 of 108
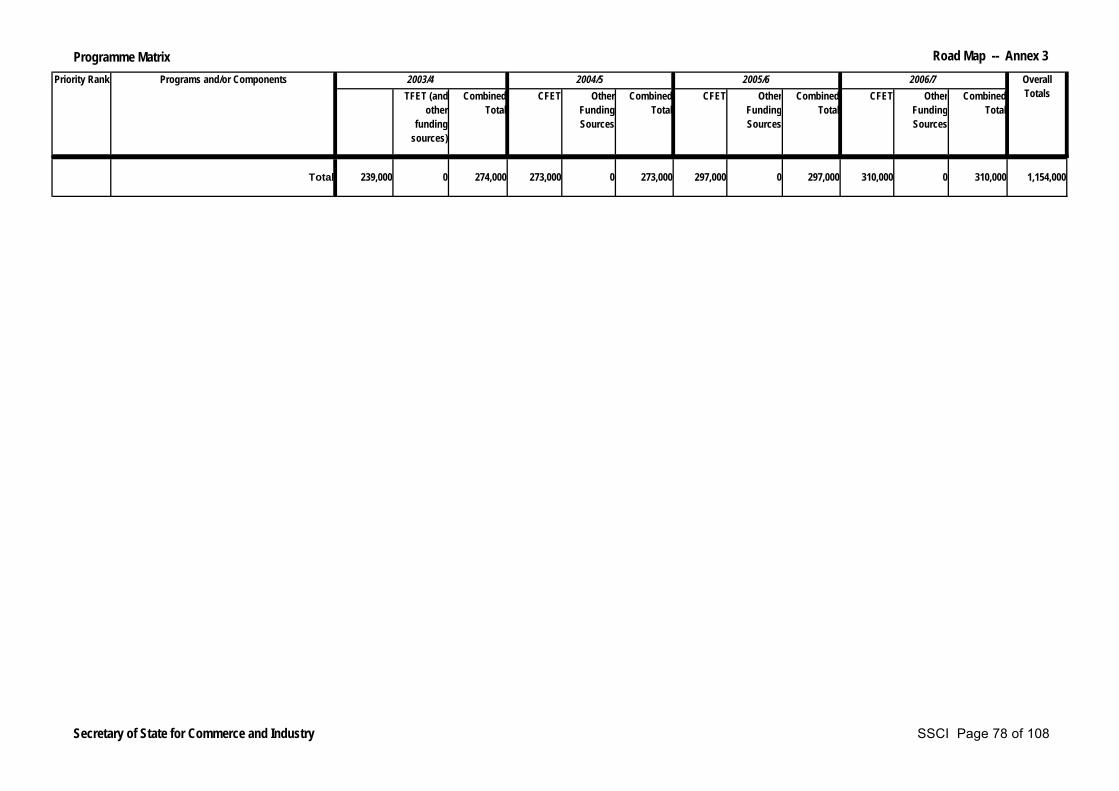
Programme Matrix Road Map -- Annex 3
TFET (and other
funding sources)
Combined Total
CFET Other Funding Sources
Combined Total
CFET Other Funding Sources
Combined Total
CFET Other Funding Sources
Combined Total
Overall Totals
2006/72003/4 2004/5 2005/6Priority Rank Programs and/or Components
Total 239,000 0 274,000 273,000 0 273,000 297,000 0 297,000 310,000 0 310,000 1,154,000
Secretary of State for Commerce and Industry SSCI Page 78 of 108

Programme Matrix Road Map -- Annex 3
CFET TFET (and other
funding sources)
Combined Total
CFET Other Funding Sources
Combined Total
CFET Other Funding Sources
Combined Total
CFET Other Funding Sources
Combined Total
1 1. Structure the Secretariat of the State of the Council of Ministers and define the status on the tasks and responsibilities of all Secretatiat staff
0 0 0 0 0 0 0 0 0 0 0 0 0
2. Capacity building of the SSCOM in the following sectors:
a. Legislative process at the SSCOM
b. Support services for the Council of Ministers
3. Study and analysis, based on the Regulation of the Council of Ministers, of the submission presented by the Ministries
4. Draw-up the Act of all the meetings of the COM and register every decision taken
5. Draw-up the Action Matrix for the Legislative Program of theSSCOM)
6. Inform the population through the appropriate means, namelythrough press statements issued after the meetings of the Councilof Ministers on the decisions taken by the Government, and inparticular regarding the Poverty Reduction Program
7. Furbishing of the meting room of the Council of Minsiters withfurniture and electronic equipment
2 8. Plan and budget for the Secretary of State of the Council ofMinisters and process requisition of the budgeted grants for allMinisters, Vice-Ministers and Secretaries of State, including the 3consultants for the Prime Minister
1. Translate the Government's documents and programs to the official and working languages, in conformity with the Constitution of the RDTL
Total 0 0 0 0 0 0 0 0 0 0 0 0 0
Overall Totals2003/4 2004/5 2005/6 2006/7
Program: Secretary of State of the Council of Ministers (SSCOM) - Secretariat Board
Program: Secretary of State of the Council of Ministers -- Translation Board
Programs and/or ComponentsPriority Rank
Secretary of State for the Council of Ministers SSCOM Page 79 of 108

Programme Matrix Road Map -- Annex 3
CFET TFET (and other
funding sources)
Combined Total
CFET Other Funding Sources
Combined Total
CFET Other Funding Sources
Combined Total
CFET Other Funding Sources
Combined Total
1. Recruit personnel for the Defense Force 6,586,000 0 6,586,000 6,811,000 0 6,811,000 6,811,000 0 6,811,000 6,811,000 0 6,811,000 27,019,000
2. Complete basic training for 220 recruits by June 2004 2,000,000 0 0 0 2,000,000
3. Recruit civilian personnel 0 0 0 0 04. Train civilian personnel 0 0 0 0 0
5. Budget tracking 0 0 0 0 0 6. Procurement and Logistic Training 0 0 0 0 0 7. Continue individual and collective skills training for land
and maritime forces 0 0 0 0 0
8. Procure goods and services 0 0 0 0 09. Maintain facilities to efficient standards within budget forecast
0 0 0 0 0
1. Procure capital equipment 0 0 0 0 0 2. Seek donations of specialised equipment 0 0 0 0 0
1. Creation of accommodation, messing, administration and logistics facility in the Baucau region
0 0 0 0 0
2. Construct security fence around HQ compound in Dili 0 0 0 0 0
3. Seek donor support for acquisition of capital facilities
SP 4. Provision of facilities for Batallion 2 150,000 0 0 0 150,000
Total 6,586,000 0 8,736,000 6,811,000 0 6,811,000 6,811,000 0 6,811,000 6,811,000 0 6,811,000 29,169,000
Overall Totals2006/72003/4 2004/5 2005/6
Program: Capital Facilities Investment
Priority Rank
Programs and/or Components
Program: Defence Organization
Program: Capital Equipment Investment
Secretary of State for Defence SSD Page 80 of 108

Programme Matrix Road Map -- Annex 3
CFET TFET (and
other funding
sources)
Combined Total
CFET Other Funding Sources
Combined Total
CFET Other Funding Sources
Combined Total
CFET Other Funding Sources
Combined Total
1. Worker protection and good industrial relations 19,000 15,000 34,000 13,200 15,000 28,200 16,400 5,000 21,400 16,600 5,000 21,600 105,200
a. Settle labour dispute b. Inspect and monitor the implementation of labor code
c. Conduct socialization campaignd. Conduct inspection of labor disputese. Collect the data of companiese. Establish and maintain a comprehensive statistical database on all components of the Labour Relations System as is required by our ILO membership and ensure that the database and method of statistical data collection is compatible with systems used by the Employment and Skills Development Division of the Department and with other Government statistical collection system.
2. Program for the promotion of mediation/ arbitration oflabor dispute
17,000 10,000 27,000 18,000 10,000 28,000 21,000 10,000 31,000 22,000 10,000 32,000 118,000
a. Consultation with ILO Simpler to conduct workshop
b. Promotion of the procedure on strikes c. Promotion on the procedure to settle labor disputes
d. Provide and maintain financial and administrative support for the Labour Relations Board to enable it to carry out all its powers and functions as required by the Labour Code
3. Minimum Wage Policy 6,000 20,000 26,000 0 20,000 20,000 7,500 20,000 27,500 7,500 20,000 27,500 101,000 a. Formulate Draft of Directive b. Undertake research on the Minimum Wage
Overall Totals
2006/72003/4 2004/5 2005/6Priority Rank
Programs and/or Components
Program: Labour
Secretary of State for Labour and Solidarity SSLS Page 81 of 108

Programme Matrix Road Map -- Annex 3
CFET TFET (and
other funding
sources)
Combined Total
CFET Other Funding Sources
Combined Total
CFET Other Funding Sources
Combined Total
CFET Other Funding Sources
Combined Total
Overall Totals
2006/72003/4 2004/5 2005/6Priority Rank
Programs and/or Components
c. Conduct socialization campaignd. Provide and maintain financial and administrative support for the Minimum Wage Board to enable it tocarry out all of the powers and functions as required by the Labour Code
4. Program for the promotion of occupational safety and environmental health
12,000 6,000 7,500 7,500 33,000
a. Formulate Draft of Directive and Codes of Practice
b. Conduct socialization on Directives and Codes of Practicec. Provide detailed training and technical equipment to inspectors to permit proper application of Directives and Codes of Practice
d. Provide detailed training and technical advice to inspectors to ensure proper application of Directives and Codes of practice
e. Conduct inspection and monitor the implementation of the Directive5. Program to promote formation of labour groups/unions to protect workers' rights
13,000 10,000 12,500 12,500 48,000
a. Registration of trade union and employer's organizationsb. Issuance of certificate of trade union and employers organizationsc. Formulate draft directived. Inspection and monitoring of the implementation of the Directive
Secretary of State for Labour and Solidarity SSLS Page 82 of 108

Programme Matrix Road Map -- Annex 3
CFET TFET (and
other funding
sources)
Combined Total
CFET Other Funding Sources
Combined Total
CFET Other Funding Sources
Combined Total
CFET Other Funding Sources
Combined Total
Overall Totals
2006/72003/4 2004/5 2005/6Priority Rank
Programs and/or Components
e. Consultation with ILO Simpler to have a seminar in relation to ORTUEO6. Project to promote job security; program for the promotion of retirement pension schemes; program for the promotion of disability insurance
30,000 12,000 7,500 7,500 57,000
a. Formulate draft of social security insurance directive
b. Conduct tripartite consultation on the directivec. Conduct socialization on the draft social security insurance directived. Conduct of inspection and monitoring of the implementation of the Directive7. Project on working hours, policies on leave and other workers' rights
17,000 6,000 7,500 7,500 38,000
a. Formulate draft of Directiveb. Conduct of socialization on the Directive
c. Conduct of inspection and monitoring of the implementation of Directive8. Program on Policy and Guidelines on workplace facilities for women (e.g., child care centers, separate washrooms and recreation areas); laws against harassment of women in workplace
15,000 17,000 12,500 12,500 57,000
a. Formulate draft of policy on discrimination against women in workplace
b. Formulate draft policy on sexual harassment against womenc. Conduct socialization on the draft policiesd. Conduct of inspection and monitoring of the implementation of the Policies
Secretary of State for Labour and Solidarity SSLS Page 83 of 108

Programme Matrix Road Map -- Annex 3
CFET TFET (and
other funding
sources)
Combined Total
CFET Other Funding Sources
Combined Total
CFET Other Funding Sources
Combined Total
CFET Other Funding Sources
Combined Total
Overall Totals
2006/72003/4 2004/5 2005/6Priority Rank
Programs and/or Components
e. Consultation with ILO Simpler to have a workshop in relation to discrimination and sexual harassment against women in workplace
9. Program to create an enabling environment for the employment of women in remunerative jobs (i.e., incentives to employers)
0 0 55,000 7,500 62,500
a. Formulate draft Directiveb. Conduct socialization on the Directivec. Conduct inspection and monitoring of the implementation of the Directive10. Project on the policy favoring employment of women 0 0 0 21,000 21,000
a. Formulate draft directiveb. Conduct socialization on the Directivec. Conduct inspection and monitoring of the implementation of the Directive
1. Draw-up draft for skill training regulation 20,000 20,000 20,000 20,000 80,000
a. Establish Regulation Draft of Vocational Training
b. Carry out consultation with ILO, NGO’s, Religion Institution and Government about the Regulation
c. Set up Workshop d. Sent to Council of Ministers to approve
d. Establish Socialization of the Regulatione. Establish and maintain the parameters to be met by vocational education providers to ensure uniformity of education outcomes.
Program: Employment and Skills Development
Secretary of State for Labour and Solidarity SSLS Page 84 of 108

Programme Matrix Road Map -- Annex 3
CFET TFET (and
other funding
sources)
Combined Total
CFET Other Funding Sources
Combined Total
CFET Other Funding Sources
Combined Total
CFET Other Funding Sources
Combined Total
Overall Totals
2006/72003/4 2004/5 2005/6Priority Rank
Programs and/or Components
2. Program to market labor 25,000 25,000 25,000 25,000 100,000a. Set up schedule for district visiting in order to collect employers data
b. Record and processing the data according to skill and education qualification c. Fill employers data into database format of “Pedido de Emprego and Oferta de Emprego” (Job Request and Job Announces)d. Ensure that th labour market database is compatible with the labour relations database established by the Labour Relations Division and with databases operated and maintained by other government departments.
3. Cooperation with CNEFP ILO Portugal to set up skills training centers
650,000 225,000 225,000 225,000 1,325,000
a. Establish vocational training center and dormitory of trainers and trainees in cooperation with ILO (Portugal) Projectb. Carry out selection for all candidates in each area of training, such as : Carpenter, Electrician, Mason, and Plumberc. Conduct the training for 6 monthsd. Establish Monitoring evaluation of training4. Program to announce to industry and community regarding labor requirement as well as providing needed workers to companies.
25,000 30,000 35,000 35,000 125,000
a. Identify instances where capital intensive means of production are being used in Timor Leste.
Secretary of State for Labour and Solidarity SSLS Page 85 of 108

Programme Matrix Road Map -- Annex 3
CFET TFET (and
other funding
sources)
Combined Total
CFET Other Funding Sources
Combined Total
CFET Other Funding Sources
Combined Total
CFET Other Funding Sources
Combined Total
Overall Totals
2006/72003/4 2004/5 2005/6Priority Rank
Programs and/or Components
b. Identify and disseminate alternative labour intensive means of production which can be adopted by employers.c. Provide support to existing employers and potential employers and investors to replace capital intensive means of production with labour intensive means of production.
d. Provide information service to employers through print media, electronic media, posters and brochures in cooperation with ILO, and other NGO’s in order to print the brochures and Posters
e. Conduct registration and interview for job seekers
f. Match Job Seekers profile against job vacancies
g. Conduct selection for job seekers according to education and skill level
h. Placement job seekers as needed by companies
i. Conduct monitoring employers in the companies
5. Provide professional profile and established credit regulation of field of and skills training initially under the TIM/OIT Portugal project.
14,500 14,500 14,500 14,500 58,000
a. Establish co-operation with TIM/OIT Portugal Project in order to provide funding for Vocational Training and Employment program which compost of: Vocational Training, Micro-Credit and Subsidized Employment
Secretary of State for Labour and Solidarity SSLS Page 86 of 108

Programme Matrix Road Map -- Annex 3
CFET TFET (and
other funding
sources)
Combined Total
CFET Other Funding Sources
Combined Total
CFET Other Funding Sources
Combined Total
CFET Other Funding Sources
Combined Total
Overall Totals
2006/72003/4 2004/5 2005/6Priority Rank
Programs and/or Components
b. Set-up standing Committee for Vocational Training and Employment, which consist of Government, Worker and Enterpriser
c. Establish funding regulation for Vocational Training and Employment in order to maintain the mechanism , criteria as well as objective want to achieve.
d. Evaluation of the proposal e. Provide guidance and counseling f. Evaluation and monitoring 6. Program of dissemination of labor-market information and manpower plan
20,000 20,000 25,000 25,000 90,000
a. Provide information to communities and companies on labor marketb. Conduct promotion of skilled employers skilled to companiesc. Interviewed and record employers on qualification of skill and education as needed by companies
7. Fund assistance to the skills training of formed groups (to continue the micro-credit project for trained groups after finished ILO Portugal project)
350,000 350,000
8. Technical and vocational training (Job creation)
a. Support to training centers 500,000 0 0 0 500,000
b. Support to trainees 1,500,000 0 0 0 1,500,000
c. Small grants 100,000 0 0 0 100,000
d. Strengthen the new Vocational Training Center -- Special situation of the enclave of Oecussi
60,000 0 0 0 60,000
Secretary of State for Labour and Solidarity SSLS Page 87 of 108

Programme Matrix Road Map -- Annex 3
CFET TFET (and
other funding
sources)
Combined Total
CFET Other Funding Sources
Combined Total
CFET Other Funding Sources
Combined Total
CFET Other Funding Sources
Combined Total
Overall Totals
2006/72003/4 2004/5 2005/6Priority Rank
Programs and/or Components
1. Children Unita. Social Service for Neglected Children: Orphanages, Street Children, Poor and mistreated children
1) Preparation of policy and service standard criteria at the orphanage and dormitory
86,838 86,838 86,838
2) Preparation of adoption and fostering policy through a consultation with institutions concerned
3) Internal policy on child protection4) Child separated reunification5) Monitoring orphans in orphanages/ dormitory and other assistance or activities for children
b. Social Service for Children1) Fund support to the NGO’s / to conduct Child Services: 30,000 0 30,000 33,000 0 33,000 36,000 0 33,000 39,000 0 33,000 129,000
- To select and determine NGO/orphan in which fulfill the criteria of services (4 NGO’s/orphans)
- Make agreement to carry out activity of child services and hand over fund in accordance with the necessity
2) Child separated reunification: 16,500 0 16,500 19,000 0 19,000 0 0 0 0 0 0 35,500- Coordinate with the agency be connected (UNHCR, IRC, UNICEF, DEPLU) and to contact the other agency be related in Indonesia
- To make a visitation or direct contact with the agency be connect in Jakarta/Indonesia
- Make contact with family of child3) School equipment assistance for the neglected child (4 district, 400 children):
20,400 0 20,400 22,500 0 22,500 24,600 0 24,600 26,600 0 26,600 94,100
- Data survey and selection
Program:Social Services and Solidarity
Secretary of State for Labour and Solidarity SSLS Page 88 of 108

Programme Matrix Road Map -- Annex 3
CFET TFET (and
other funding
sources)
Combined Total
CFET Other Funding Sources
Combined Total
CFET Other Funding Sources
Combined Total
CFET Other Funding Sources
Combined Total
Overall Totals
2006/72003/4 2004/5 2005/6Priority Rank
Programs and/or Components
- Provision assistance - Distribution assistance 4) Scholarships assistance to the orphanage child and the child from the poverty parents:
9,500 0 9,500 10,500 0 10,500 12,600 0 12,600 14,600 0 14,600 47,200
- Coordinate with Institutions of school (Elementary and Secondary) 50 children
- Data collection, selection and determining5) Orphanage and dormitory services socialization policy and adoption and the child fostering
1,250 0 1,250 0 0 0 0 0 0 0 0 0 1,250
6) Composing of the child care center : 0 0 5,650 0 5,650 1,250 0 1,250 6,900- Coordinate with agency to be connected- Organize Regional seminar (3 regions) and national (Dili)
- Compose draft and re-spread to the agency to be connected and comment on.
- Improve the draft according to the comment from the agency to be connected through the meeting with the representative from the agency be connected.
- Offer the draft to the Council of Ministry - Socialization and implementation7) Orphanage and dormitory monitoring and other activity of the services to the child
500 0 500 500 0 500 500 0 500 500 0 500 2,000
1 2. Social Services for Disaster and Humanitarian
a. Improve the condition of poverty through food assistance and provision of other basic needs including building equipment
106,150 0 106,150 106,650 0 106,650 106,850 0 106,850 106,850 0 106,850 426,500
1) Coordinate with the Chief of District Administration (DDO)
2) Data collection, selection and determining.
Secretary of State for Labour and Solidarity SSLS Page 89 of 108

Programme Matrix Road Map -- Annex 3
CFET TFET (and
other funding
sources)
Combined Total
CFET Other Funding Sources
Combined Total
CFET Other Funding Sources
Combined Total
CFET Other Funding Sources
Combined Total
Overall Totals
2006/72003/4 2004/5 2005/6Priority Rank
Programs and/or Components
3) Provision of food, clothe and building equipment (35 Zinc/Household x 750 houses)
4) Involving the volunteer staff in distribution action 5) Monitoring b. Warehouse Management 10,500 0 10,500 10,500 0 10,500 11,000 0 11,000 11,000 0 11,000 43,0001) Continuing contract for the warehouse temporary staff and maintenance
c. Management and Maintenance of warehouse 0 0 0 0 0 0 0 0 0 0 0 0 0
d. Provision stock (food item and non-food items) 0 0 0 0 0 0 0 0 0 0 0 0 0
e. Coordination with other agencies about social assistance for vulnerable groups
0 0 0 0 0 0 0 0 0 0 0 0 0
f. Survey to the food hazard area and food distribution 0 0 0 0 0 0 0 0 0 0 0 0 0
1) Survey 2) Food distribution to the food hazard people and poverty people
3. Social Services for weaker group in detention/connecting with the law (Child, Women, Disable and Elderly)
0 0 0 0 0 0 0 0 0 0 0 0 0
a. Social Counseling for prisoners 500 0 500 500 0 500 500 0 500 500 0 500 2,0001) Coordinate and cooperate with the agency to be connected
2) Companion and counseling b. Skills training for prisoners 10,200 0 10,200 15,200 0 15,200 17,700 0 17,700 20,200 0 20,200 63,3001) Coordinate with prison officers 2) Provision of equipment for training (TV, radio, tape recorder, watch) and instructor
c. Re-socialization in family and society 5,050 0 5,050 5,600 0 5,600 5,600 0 5,600 5,950 0 5,950 22,2001) Family contact (visitation) 2) Facilitating family contact
Secretary of State for Labour and Solidarity SSLS Page 90 of 108

Programme Matrix Road Map -- Annex 3
CFET TFET (and
other funding
sources)
Combined Total
CFET Other Funding Sources
Combined Total
CFET Other Funding Sources
Combined Total
CFET Other Funding Sources
Combined Total
Overall Totals
2006/72003/4 2004/5 2005/6Priority Rank
Programs and/or Components
3) Returning Ex-prisoners to their family 4) Support to the NGO/FCJ and Resident of convent Maubara
that provide temporary lodge for children who release from the prison and for who have family outside from the capital Dili/district.
d. Monitoring 1,000 0 1,000 1,250 0 1,250 1,500 0 1,500 1,750 0 1,750 5,5003 4. Social Services for Disabled/Handicap
a. Assessment of basic data 0 0 0 0 0 b. Preparation of national policy assistance for disabled 0 0 0 0 0
c. Assistance to small scale productive economics (small grants)
0 0 0 0 0
d. Assistance of aid tools 0 0 0 0 0 e. Seminar of the working group for the disabled 0 0 0 0 0
f. Monitoring business assistance and other activities for disabled
0 0 0 0 0
4 5. Social Service for Women and Victims of violence and social economic weakens
0 0 0 0 0
a. Assistance to small-scale productive economic (small grants)
0 0 0 0 0
b. Monitoring shelter and other activities or assistance for women
0 0 0 0 0
c. Social counselling for victim of violence through support to the NGO (Fokupers/ETWAVE)
10,000 0 10,000 10,000 0 10,000 11,000 0 11,000 12,000 0 12,000 43,000
1) Work agreement making with NGOs2) Fund support according to necessity
d. Assistance to small scale productive economic 23,500 0 23,500 25,000 0 25,000 30,000 0 30,000 35,000 0 35,000 113,500
1) Data survey, selection and determining2) Group formation
Secretary of State for Labour and Solidarity SSLS Page 91 of 108

Programme Matrix Road Map -- Annex 3
CFET TFET (and
other funding
sources)
Combined Total
CFET Other Funding Sources
Combined Total
CFET Other Funding Sources
Combined Total
CFET Other Funding Sources
Combined Total
Overall Totals
2006/72003/4 2004/5 2005/6Priority Rank
Programs and/or Components
3) Establishment and skills training for small business management
4) Assistance for small businesses (15 groups in 13 districts)
e. Monitoring of all activities 300 0 300 300 0 300 300 0 300 300 0 300 1,2005 6. Social Services for disability a. Vocational training (sewing) 33,615 0 33,615 40,900 0 40,900 49,400 0 49,400 57,900 0 57,900 181,815
1) Survey and data collection2) Group Formation3) Implementation of the establishment and training4) Work practice (apprenticeship)5) Distribute the small grant assistance6) Monitoringb. Aid tools services 14,750 0 14,750 12,750 0 12,750 10,700 0 10,700 10,700 0 10,700 48,9001) Data collection2) Motivation3) Aid tool assistance4) Monitoring
c. Continuing compose draft of social services for disability
17,250 0 17,250 0 0 0 0 0 0 0 0 0 17,250
1) Seeking and determine consultant2) collect information by involving agencies concerned through seminar
3) socializationd. To help elderly with basic needs and arrange recreation group
0 0 0 14,550 0 14,550 18,750 0 18,750 23,950 0 23,950 57,250
1) Survey and select data2) Provision of basic needs (food, clothing and bath needs)
Secretary of State for Labour and Solidarity SSLS Page 92 of 108
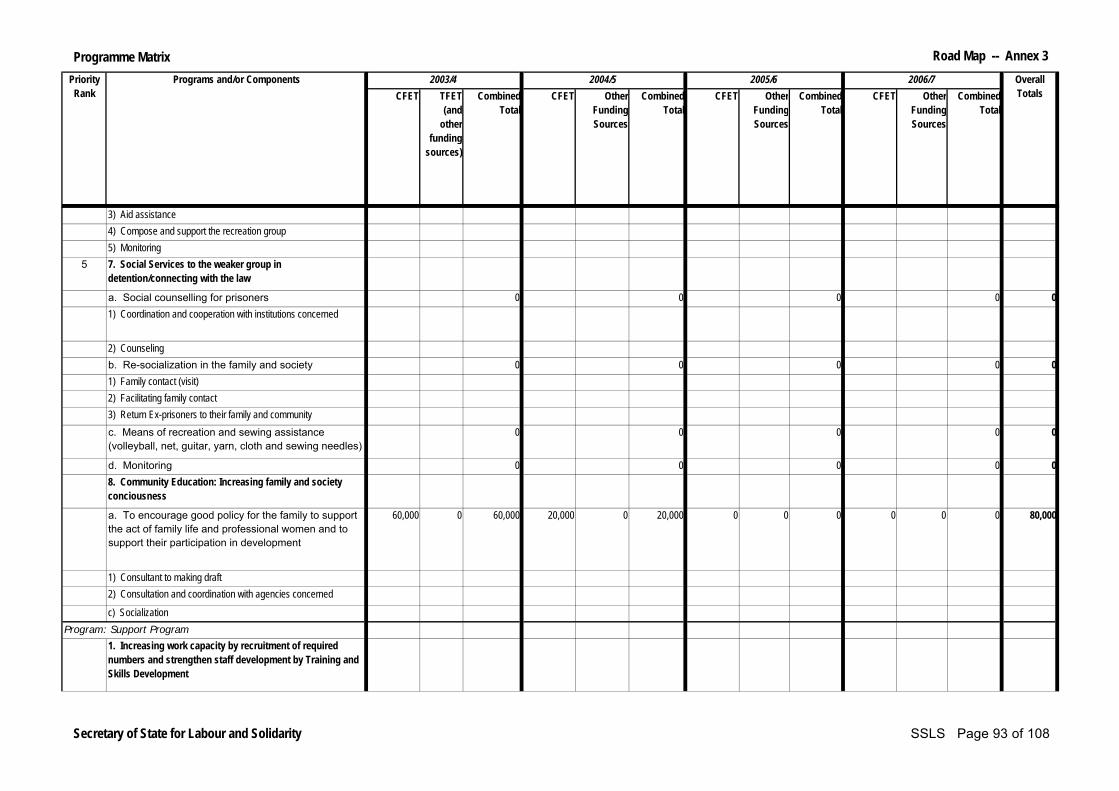
Programme Matrix Road Map -- Annex 3
CFET TFET (and
other funding
sources)
Combined Total
CFET Other Funding Sources
Combined Total
CFET Other Funding Sources
Combined Total
CFET Other Funding Sources
Combined Total
Overall Totals
2006/72003/4 2004/5 2005/6Priority Rank
Programs and/or Components
3) Aid assistance4) Compose and support the recreation group5) Monitoring
5 7. Social Services to the weaker group in detention/connecting with the law
a. Social counselling for prisoners 0 0 0 0 01) Coordination and cooperation with institutions concerned
2) Counseling b. Re-socialization in the family and society 0 0 0 0 0
1) Family contact (visit)2) Facilitating family contact3) Return Ex-prisoners to their family and community
c. Means of recreation and sewing assistance (volleyball, net, guitar, yarn, cloth and sewing needles)
0 0 0 0 0
d. Monitoring 0 0 0 0 0 8. Community Education: Increasing family and society
conciousness
a. To encourage good policy for the family to support the act of family life and professional women and to support their participation in development
60,000 0 60,000 20,000 0 20,000 0 0 0 0 0 0 80,000
1) Consultant to making draft2) Consultation and coordination with agencies concerned
c) Socialization
1. Increasing work capacity by recruitment of required numbers and strengthen staff development by Training and Skills Development
Program: Support Program
Secretary of State for Labour and Solidarity SSLS Page 93 of 108

Programme Matrix Road Map -- Annex 3
CFET TFET (and
other funding
sources)
Combined Total
CFET Other Funding Sources
Combined Total
CFET Other Funding Sources
Combined Total
CFET Other Funding Sources
Combined Total
Overall Totals
2006/72003/4 2004/5 2005/6Priority Rank
Programs and/or Components
a. Increasing the work capacity by recruitment of required numbers
20,000 0 20,000 25,000 0 25,000 25,000 0 25,000 30,000 0 30,000 100,000
b. Training and skills transfer1) 4x seminars and workshops (local) 40,000 0 40,000 40,000 0 40,000 40,000 0 40,000 40,000 0 40,000 160,0002) 4x Training courses in accounting and Finance, IT development
40,000 0 40,000 40,000 0 40,000 48,000 0 48,000 48,000 0 48,000 176,000
3) Hiring of consultants 150,000 0 150,000 150,000 0 150,000 150,000 0 150,000 150,000 0 150,000 600,0004) 4 Overseas courses 40,000 0 40,000 50,000 0 50,000 50,000 0 50,000 50,000 0 50,000 190,0005) Participation in overseas seminars/workshops 40,000 0 40,000 50,000 0 50,000 50,000 0 50,000 50,000 0 50,000 190,0006) Language Training 25,000 0 25,000 25,000 0 25,000 30,000 0 30,000 30,000 0 30,000 110,000c. Provision of equipment 25,000 0 25,000 20,000 0 20,000 15,000 0 15,000 15,000 0 15,000 75,000d. Provision of translation services 25,000 0 25,000 25,000 0 25,000 25,000 0 25,000 25,000 0 25,000 100,000e. Develop and maintain a comprehensive procedural and descriptive Manual covering internal departmental practices and the specific requirements imposed on the Department by law and distribute copies to the social partners in order to increase transparency of decision-making
8,000 0 8,000 1,500 0 1,500 1,500 0 1,500 1,500 0 1,500 12,500
2 2. Budget planning, coordination with Ministry of Planning and Finance, Centralizing expenditures, asset transfers for the substantive divisions and district offices
a. Oversight of budgeting and planning in coordination with the Ministry of Planning and Finance
1) Synchronization of objectives, terms of reference procurement procedures with PEAMD and Procurement Division
5,000 0 5,000 5,000 0 5,000 10,000 0 10,000 20,000 0 20,000 40,000
2) Audit of accounts and Budget performance report 15,000 0 15,000 20,000 0 20,000 30,000 0 30,000 40,000 0 40,000 105,000
Secretary of State for Labour and Solidarity SSLS Page 94 of 108
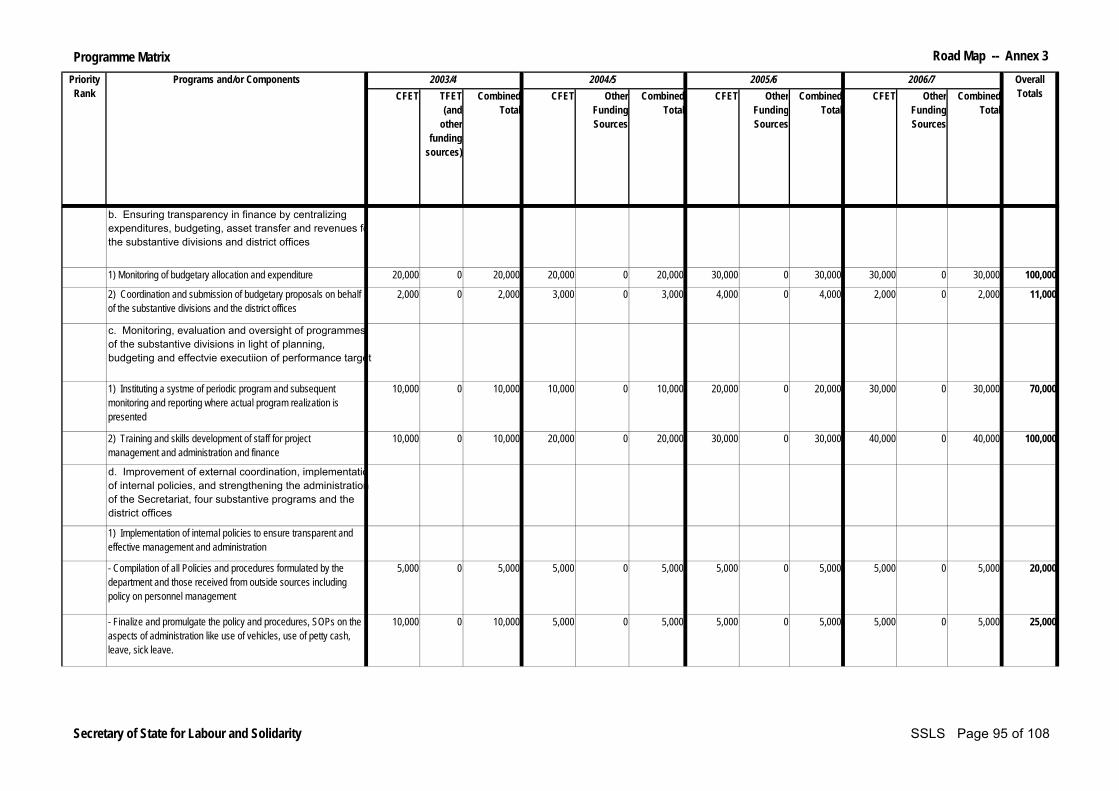
Programme Matrix Road Map -- Annex 3
CFET TFET (and
other funding
sources)
Combined Total
CFET Other Funding Sources
Combined Total
CFET Other Funding Sources
Combined Total
CFET Other Funding Sources
Combined Total
Overall Totals
2006/72003/4 2004/5 2005/6Priority Rank
Programs and/or Components
b. Ensuring transparency in finance by centralizing expenditures, budgeting, asset transfer and revenues for the substantive divisions and district offices
1) Monitoring of budgetary allocation and expenditure 20,000 0 20,000 20,000 0 20,000 30,000 0 30,000 30,000 0 30,000 100,000
2) Coordination and submission of budgetary proposals on behalf of the substantive divisions and the district offices
2,000 0 2,000 3,000 0 3,000 4,000 0 4,000 2,000 0 2,000 11,000
c. Monitoring, evaluation and oversight of programmes of the substantive divisions in light of planning, budgeting and effectvie executiion of performance target
1) Instituting a systme of periodic program and subsequent monitoring and reporting where actual program realization is presented
10,000 0 10,000 10,000 0 10,000 20,000 0 20,000 30,000 0 30,000 70,000
2) Training and skills development of staff for project management and administration and finance
10,000 0 10,000 20,000 0 20,000 30,000 0 30,000 40,000 0 40,000 100,000
d. Improvement of external coordination, implementation of internal policies, and strengthening the administration of the Secretariat, four substantive programs and the district offices
1) Implementation of internal policies to ensure transparent and effective management and administration
- Compilation of all Policies and procedures formulated by the department and those received from outside sources including policy on personnel management
5,000 0 5,000 5,000 0 5,000 5,000 0 5,000 5,000 0 5,000 20,000
- Finalize and promulgate the policy and procedures, SOPs on the aspects of administration like use of vehicles, use of petty cash, leave, sick leave.
10,000 0 10,000 5,000 0 5,000 5,000 0 5,000 5,000 0 5,000 25,000
Secretary of State for Labour and Solidarity SSLS Page 95 of 108
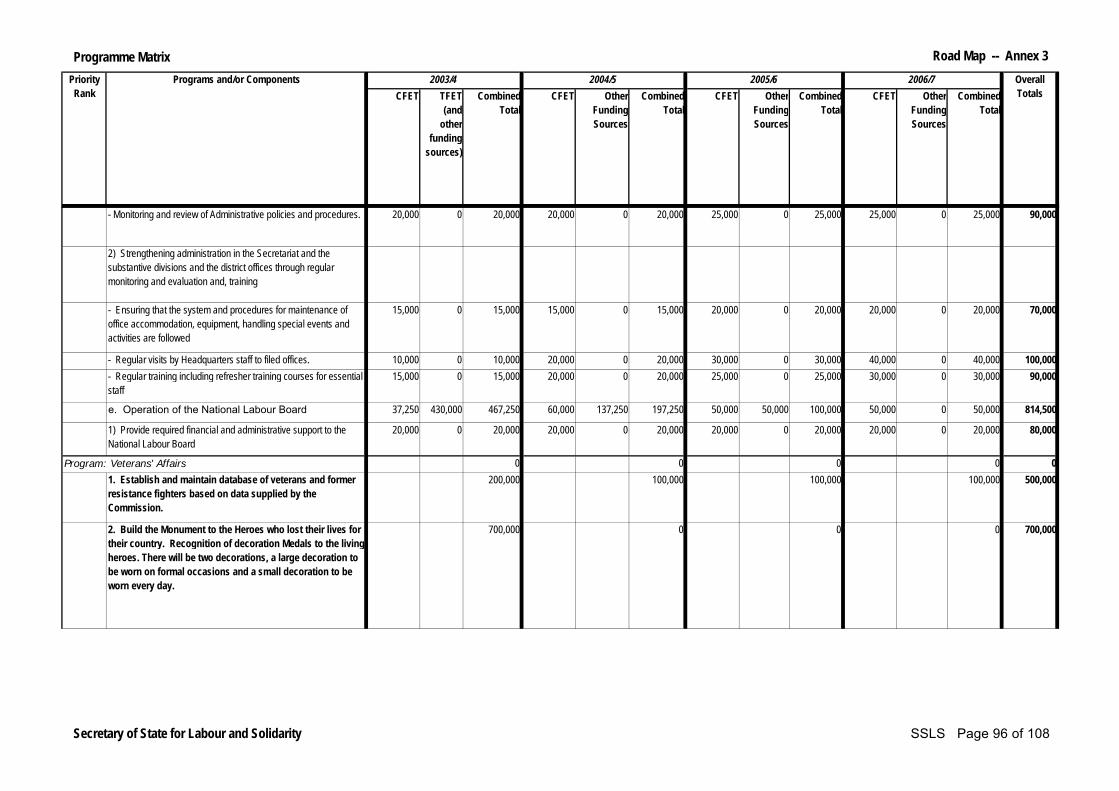
Programme Matrix Road Map -- Annex 3
CFET TFET (and
other funding
sources)
Combined Total
CFET Other Funding Sources
Combined Total
CFET Other Funding Sources
Combined Total
CFET Other Funding Sources
Combined Total
Overall Totals
2006/72003/4 2004/5 2005/6Priority Rank
Programs and/or Components
- Monitoring and review of Administrative policies and procedures. 20,000 0 20,000 20,000 0 20,000 25,000 0 25,000 25,000 0 25,000 90,000
2) Strengthening administration in the Secretariat and the substantive divisions and the district offices through regular monitoring and evaluation and, training
- Ensuring that the system and procedures for maintenance of office accommodation, equipment, handling special events and activities are followed
15,000 0 15,000 15,000 0 15,000 20,000 0 20,000 20,000 0 20,000 70,000
- Regular visits by Headquarters staff to filed offices. 10,000 0 10,000 20,000 0 20,000 30,000 0 30,000 40,000 0 40,000 100,000- Regular training including refresher training courses for essential staff
15,000 0 15,000 20,000 0 20,000 25,000 0 25,000 30,000 0 30,000 90,000
e. Operation of the National Labour Board 37,250 430,000 467,250 60,000 137,250 197,250 50,000 50,000 100,000 50,000 0 50,000 814,500
1) Provide required financial and administrative support to the National Labour Board
20,000 0 20,000 20,000 0 20,000 20,000 0 20,000 20,000 0 20,000 80,000
0 0 0 0 01. Establish and maintain database of veterans and former resistance fighters based on data supplied by the Commission.
200,000 100,000 100,000 100,000 500,000
2. Build the Monument to the Heroes who lost their lives for their country. Recognition of decoration Medals to the living heroes. There will be two decorations, a large decoration to be worn on formal occasions and a small decoration to be worn every day.
700,000 0 0 0 700,000
Program: Veterans' Affairs
Secretary of State for Labour and Solidarity SSLS Page 96 of 108

Programme Matrix Road Map -- Annex 3
CFET TFET (and
other funding
sources)
Combined Total
CFET Other Funding Sources
Combined Total
CFET Other Funding Sources
Combined Total
CFET Other Funding Sources
Combined Total
Overall Totals
2006/72003/4 2004/5 2005/6Priority Rank
Programs and/or Components
3. Micro-credit support for the Veterans including adult youth. (Young people means those persons who were young at the time of the Resistance and who as a result of the involvement in the Resistance were denied the opportunity of participating in normal family, social, educational or career opportunities)
600,000 200,000 100,000 80,000 980,000
4. Additional Specific Support to the Veterans. (Important additional Support to the Veterans. Very important for Resistance Veterans of 75 & 99. Political prisoners who are still suffering. Orphans who lost their parents in the war to continue their studies. For the widows who lost their husbands and sons.)
800,000 900,000 1,000,000 1,200,000 3,900,000
a. Health and psychologic treatmentb. Support for the elderly housing
10,000,000 0 0 0 10,000,000
Total 1,020,215 561,838 17,233,553 1,049,400 182,250 2,817,150 1,126,050 85,000 2,855,050 1,210,650 35,000 3,040,150 25,945,903
Program: Food Security (Food Aid) -- SP
Secretary of State for Labour and Solidarity SSLS Page 97 of 108
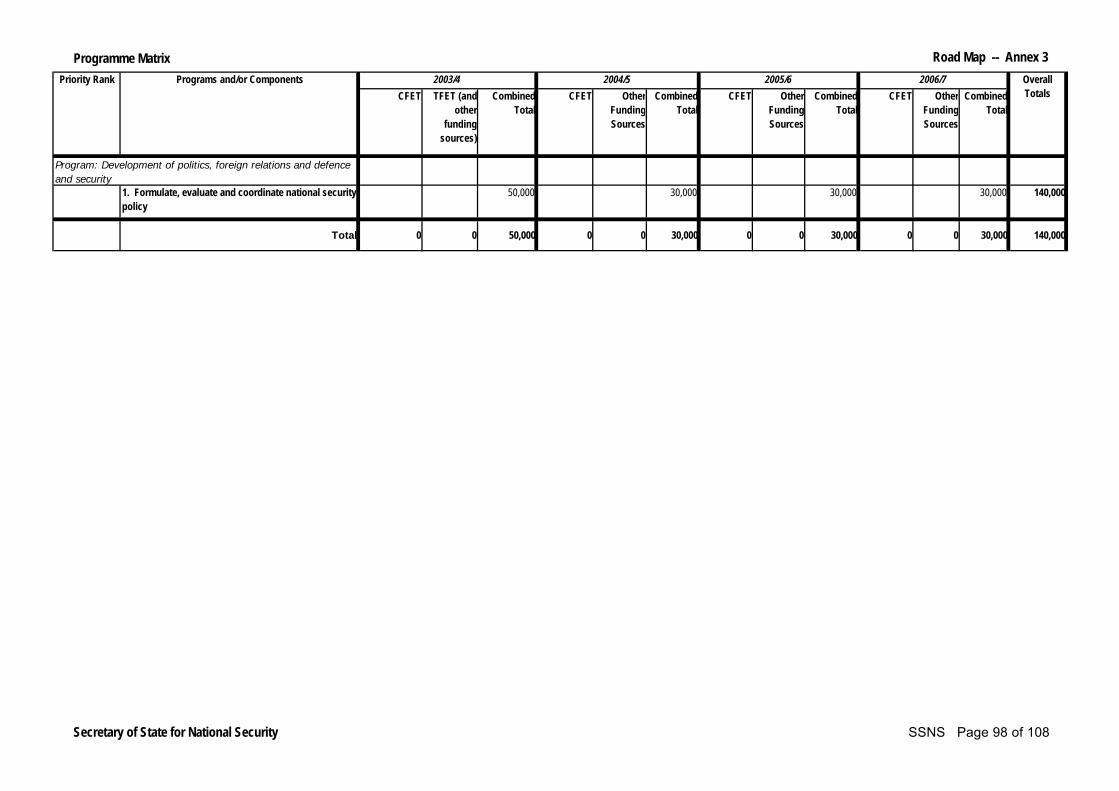
Programme Matrix Road Map -- Annex 3
CFET TFET (and other
funding sources)
Combined Total
CFET Other Funding Sources
Combined Total
CFET Other Funding Sources
Combined Total
CFET Other Funding Sources
Combined Total
1. Formulate, evaluate and coordinate national security policy
50,000 30,000 30,000 30,000 140,000
Total 0 0 50,000 0 0 30,000 0 0 30,000 0 0 30,000 140,000
Priority Rank Programs and/or Components
Program: Development of politics, foreign relations and defence and security
Overall Totals
2006/72003/4 2004/5 2005/6
Secretary of State for National Security SSNS Page 98 of 108
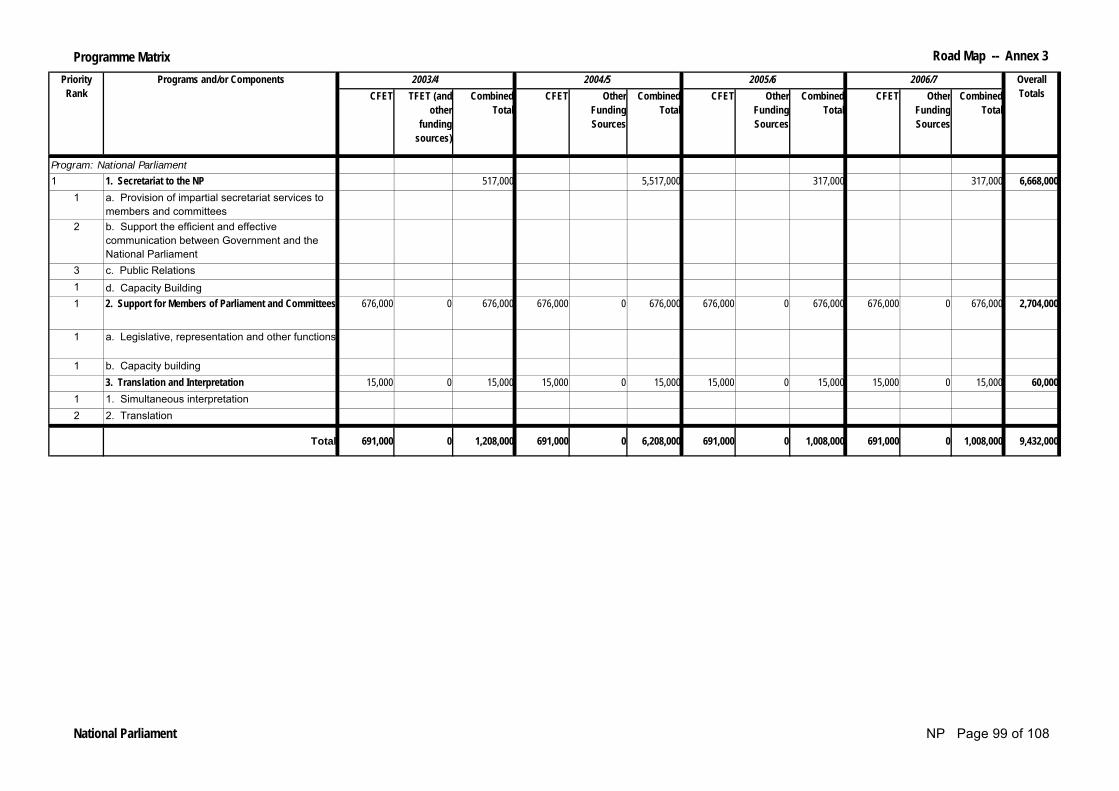
Programme Matrix Road Map -- Annex 3
CFET TFET (and other
funding sources)
Combined Total
CFET Other Funding Sources
Combined Total
CFET Other Funding Sources
Combined Total
CFET Other Funding Sources
Combined Total
1 1. Secretariat to the NP 517,000 5,517,000 317,000 317,000 6,668,0001 a. Provision of impartial secretariat services to
members and committees2 b. Support the efficient and effective
communication between Government and the National Parliament
3 c. Public Relations 1 d. Capacity Building1 2. Support for Members of Parliament and Committees 676,000 0 676,000 676,000 0 676,000 676,000 0 676,000 676,000 0 676,000 2,704,000
1 a. Legislative, representation and other functions
1 b. Capacity building 3. Translation and Interpretation 15,000 0 15,000 15,000 0 15,000 15,000 0 15,000 15,000 0 15,000 60,0001 1. Simultaneous interpretation2 2. Translation
Total 691,000 0 1,208,000 691,000 0 6,208,000 691,000 0 1,008,000 691,000 0 1,008,000 9,432,000
Program: National Parliament
Priority Rank
Programs and/or Components Overall Totals
2005/6 2006/72003/4 2004/5
National Parliament NP Page 99 of 108

Programme Matrix Road Map -- Annex 3
CFET TFET (and other
funding sources)
Combined Total
CFET Other Funding Sources
Combined Total
CFET Other Funding Sources
Combined Total
CFET Other Funding Sources
Combined Total
1 1. Gender mainstreaming in Government departments
a. Training on Gender Budget Analysis for OPE staff, and senior staff in Ministry of Planning and Finance
4,000 4,000
b. Workshops with Ministries of Agriculture, Justice, Industry and Commerce, Environment, and Labour and Solidarity to support implementation of gender mainstreaming and develop action plans for implementation
20,000 20,000
c. Ongoing support, monitoring and evaluation of implementation of action plans on gender mainstreaming in Ministries of Education, Internal Administration, Health, Agriculture, Justice, Industry and Commerce, Environment, and Labour and Solidarity
15,000 15,000 15,000 15,000 60,000
d. On-going coordination with CISPE to ensure that appropriate input on gender mainstreaming is integrated into in-service training
0 0 0 0 0
e. Training and ongoing liaison with government media to ensure gender is mainstreamed in all government media programming
2,000 1,000 1,000 1,000 5,000
2 2. Promoting a culture of equality in East Timor
a. Ensuring the effective implementation of CEDAW- ongoing training of government ministries, civil society and wider public on the principles and provisions of CEDAW, state obligation, reporting requirements and methodologies
5,000 5,000 5,000 5,000 20,000
b. Production of awareness raising materials on equality -- including booklets, pamphlets, broshures, posters. Planned media programmes on key topics to the equality agenda. Training of media personnel in gender awareness
6,000 6,000 6,000 6,000 24,000
2003/4Priority Rank
Program and/or Components Overall Totals
2004/5 2005/6 2006/7
Program: Office of the Promotion of Equality
Office of the Prime Minister OPM Page 100 of 108
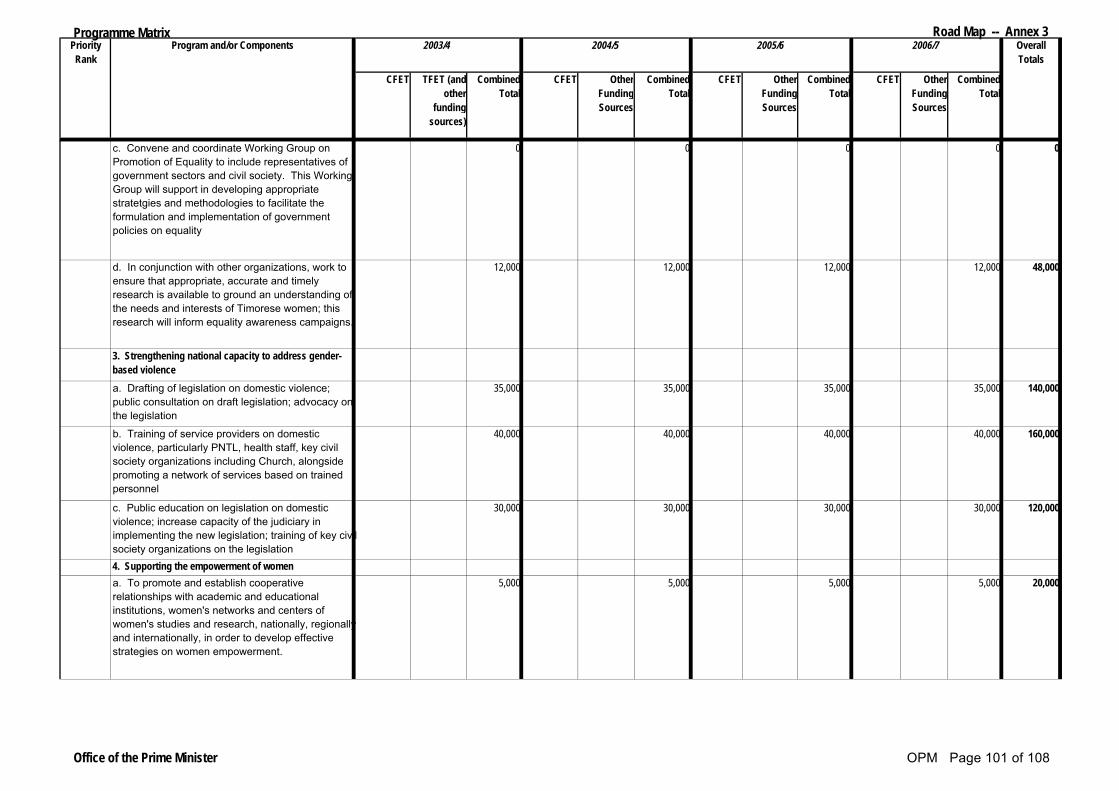
Programme Matrix Road Map -- Annex 3
CFET TFET (and other
funding sources)
Combined Total
CFET Other Funding Sources
Combined Total
CFET Other Funding Sources
Combined Total
CFET Other Funding Sources
Combined Total
2003/4Priority Rank
Program and/or Components Overall Totals
2004/5 2005/6 2006/7
c. Convene and coordinate Working Group on Promotion of Equality to include representatives of government sectors and civil society. This Working Group will support in developing appropriate stratetgies and methodologies to facilitate the formulation and implementation of government policies on equality
0 0 0 0 0
d. In conjunction with other organizations, work to ensure that appropriate, accurate and timely research is available to ground an understanding of the needs and interests of Timorese women; this research will inform equality awareness campaigns.
12,000 12,000 12,000 12,000 48,000
3. Strengthening national capacity to address gender-based violence
a. Drafting of legislation on domestic violence; public consultation on draft legislation; advocacy on the legislation
35,000 35,000 35,000 35,000 140,000
b. Training of service providers on domestic violence, particularly PNTL, health staff, key civil society organizations including Church, alongside promoting a network of services based on trained personnel
40,000 40,000 40,000 40,000 160,000
c. Public education on legislation on domestic violence; increase capacity of the judiciary in implementing the new legislation; training of key civil society organizations on the legislation
30,000 30,000 30,000 30,000 120,000
4. Supporting the empowerment of womena. To promote and establish cooperative relationships with academic and educational institutions, women's networks and centers of women's studies and research, nationally, regionally and internationally, in order to develop effective strategies on women empowerment.
5,000 5,000 5,000 5,000 20,000
Office of the Prime Minister OPM Page 101 of 108
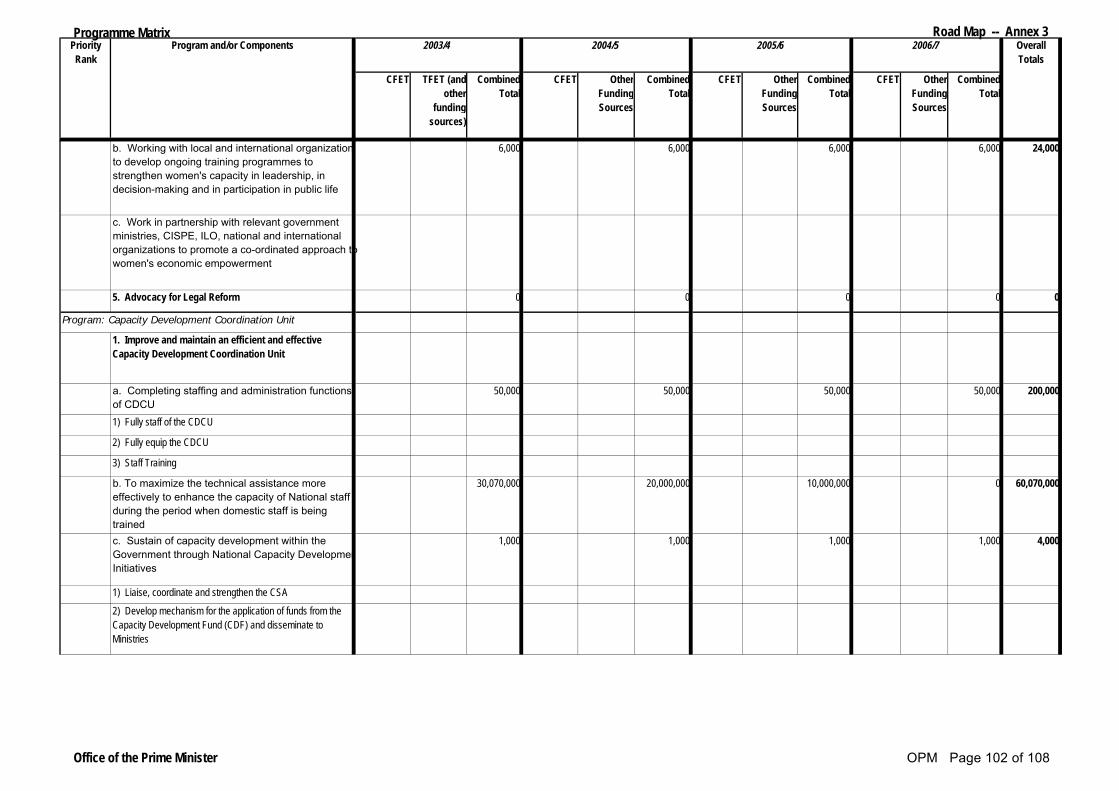
Programme Matrix Road Map -- Annex 3
CFET TFET (and other
funding sources)
Combined Total
CFET Other Funding Sources
Combined Total
CFET Other Funding Sources
Combined Total
CFET Other Funding Sources
Combined Total
2003/4Priority Rank
Program and/or Components Overall Totals
2004/5 2005/6 2006/7
b. Working with local and international organizations to develop ongoing training programmes to strengthen women's capacity in leadership, in decision-making and in participation in public life
6,000 6,000 6,000 6,000 24,000
c. Work in partnership with relevant government ministries, CISPE, ILO, national and international organizations to promote a co-ordinated approach to women's economic empowerment
5. Advocacy for Legal Reform 0 0 0 0 0
1. Improve and maintain an efficient and effective Capacity Development Coordination Unit
a. Completing staffing and administration functions of CDCU
50,000 50,000 50,000 50,000 200,000
1) Fully staff of the CDCU
2) Fully equip the CDCU
3) Staff Training
b. To maximize the technical assistance more effectively to enhance the capacity of National staff during the period when domestic staff is being trained
30,070,000 20,000,000 10,000,000 0 60,070,000
c. Sustain of capacity development within the Government through National Capacity Development Initiatives
1,000 1,000 1,000 1,000 4,000
1) Liaise, coordinate and strengthen the CSA
2) Develop mechanism for the application of funds from the Capacity Development Fund (CDF) and disseminate to Ministries
Program: Capacity Development Coordination Unit
Office of the Prime Minister OPM Page 102 of 108

Programme Matrix Road Map -- Annex 3
CFET TFET (and other
funding sources)
Combined Total
CFET Other Funding Sources
Combined Total
CFET Other Funding Sources
Combined Total
CFET Other Funding Sources
Combined Total
2003/4Priority Rank
Program and/or Components Overall Totals
2004/5 2005/6 2006/7
3) Determine selection of public servants to attend overseas training/scholarships
d. Policy and planning within CDCU through 1,000 1,000 1,000 1,000 4,000
1) Continue coordination with PEAMD, MPF
2) Finalize, coordinate and monitor Governance and Public Sector Management (GPSM) framework3) Disseminate/socialize the GPSM to ministries and donors
4) Coordinate with UNDP on developing the technical cooperation between Developing Countries Programme (TCDC)
1. Inspection and control of the Government's activities 127,000 69,000 68,000 68,000 332,000
2. Imporve accountability within public administration
3. Promote anti-corruption practices and integrity in the Public sector
0 0 0 0 0
4. Capacity building including anti-corruption 0 0 0 0 05. Monitor recommendations to improve accountability within public administration
0 0 0 0 0
1. Provision of policy and legal advice to the PM and the COM on matters concerning Timor Sea Petroleum negotiations
a. Provision of legal and fiscal advice -- amendments to existing production sharing contracts, review proposed amendments to tax laws of Timor-Leste and the proposed stability agreement in respect of the tax regime
b. Provision of policy advice -- amendments to existing production sharing contracts, review proposed amendments to tax laws of Timor-Leste and the proposed stability agreement in respect of the tax regime
Program: Timor Sea Office
Program: Office of the Inspector-General
Office of the Prime Minister OPM Page 103 of 108

Programme Matrix Road Map -- Annex 3
CFET TFET (and other
funding sources)
Combined Total
CFET Other Funding Sources
Combined Total
CFET Other Funding Sources
Combined Total
CFET Other Funding Sources
Combined Total
2003/4Priority Rank
Program and/or Components Overall Totals
2004/5 2005/6 2006/7
c. Maritime boundary negotiations with Australia and Indonesiad. Capacity building and TA2. Negotiating the best possible share for Timor-Leste of oil and gas revenues in the Timor Sea on behalf of the Government of Timor-Leste
a. Travel to venues where negotiations is required -- with Australian Government and Petroleum companiesb. Capacity Building3. Management of TFET Grant Agreementa. Project Managementb. Capacity Building and TA
1. Development of politics, foreign relations, defence and security
a. Collect information 66,156 66,156 66,156 66,156 264,624b. Analyse information and disseminate intellegence 37,636 37,636 37,636 37,636 150,544
81,099 0 81,099 57,250 0 57,250 53,370 0 53,370 51,672 0 51,672 243,391
1. Promulgation of the Organic Law2. Selection and appointment of the Provedor3. Launching of activities4. Treatment of complaints and information as received in the Provedor's Office
5. Active contribution to/collaboration in the design and development of an annual national human rights plans of actions
6. Drafting of internal codes, manuals and processes rules for the Office
7. Preparation of an annual strategic plan to fight and prevent corruption
8. Implementation of the Office's HR Education Plan
9. Implementation of the strategic plan to fight and prevent corruption
Program: Office of the Provedor de Direitos Humanos e Juustica
Program: National Security Service of the State
Office of the Prime Minister OPM Page 104 of 108
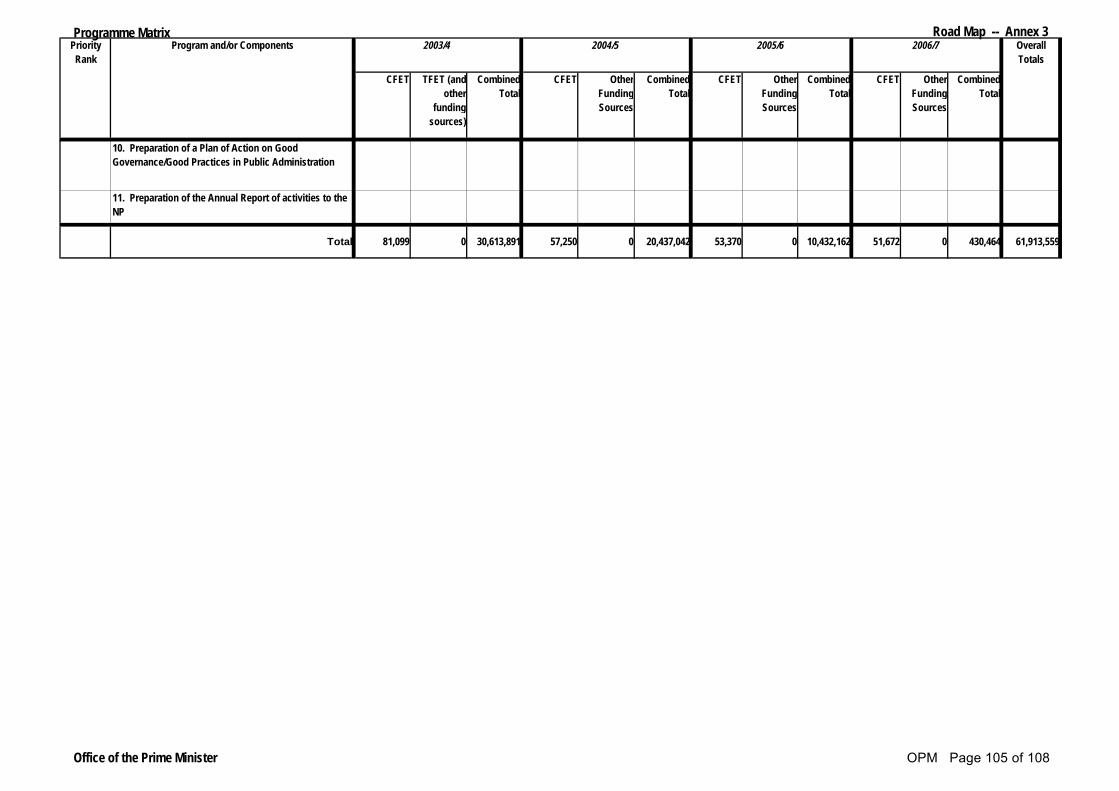
Programme Matrix Road Map -- Annex 3
CFET TFET (and other
funding sources)
Combined Total
CFET Other Funding Sources
Combined Total
CFET Other Funding Sources
Combined Total
CFET Other Funding Sources
Combined Total
2003/4Priority Rank
Program and/or Components Overall Totals
2004/5 2005/6 2006/7
10. Preparation of a Plan of Action on Good Governance/Good Practices in Public Administration
11. Preparation of the Annual Report of activities to the NP
Total 81,099 0 30,613,891 57,250 0 20,437,042 53,370 0 10,432,162 51,672 0 430,464 61,913,559
Office of the Prime Minister OPM Page 105 of 108

Programme Matrix Road Map -- Annex 3
CFET TFET (and other
funding sources)
Combined Total
CFET Other Funding Sources
Combined Total
CFET Other Funding Sources
Combined Total
CFET Other Funding Sources
Combined Total
1. Secretariat to the President 0 0 0 0 0 0 0 0 0 0 0 0 0 a. Protocol 0 0 0 0 0 0 0 0 0 0 0 0 0
b. Advisors 0 0 0 0 0 0 0 0 0 0 0 0 0c. Archives and IT 0 0 0 0 0 0 0 0 0 0 0 0 0
d. Press 0 0 0 0 0 0 0 0 0 0 0 0 0 e. Capacity Building and TA 0 0 0 0 0 0 0 0 0 0 0 0 0 2. Support for Representative Duties 0 0 0 0 0 0 0 0 0 0 0 0 0
a. Residential Services 0 0 0 0 0 0 0 0 0 0 0 0 0b. Capacity building and TA 0 0 0 0 0 0 0 0 0 0 0 0 0
Total 0 0 0 0 0 0 0 0 0 0 0 0 0
Priority Rank Programs and/or Components
Program: Office of the President
Overall Totals
2006/72003/4 2004/5 2005/6
Office of the President OP Page 106 of 108

Programme Matrix Road Map -- Annex 3
CFET TFET (and other
funding sources)
Combined Total
CFET Other Funding Sources
Combined Total
CFET Other Funding Sources
Combined Total
CFET Other Funding Sources
Combined Total
1. Institutional Development 154,000 0 154,000 0 0 0 0 0 0 0 0 0 154,000 a. Capitalization
b. Capacity building & trainingc. Installation of Governing Board
d. Develop Corporate Plan e. Formulate Central Bank framework 349,000 0 349,000 0 0 0 0 0 0 0 0 0 349,000 2. Financial Sector Development
a. Insurance regulatory frameworkb. Bank regulation and supervision3 Currency & Payment Systems 983,000 0 983,000 0 0 0 0 0 0 0 0 0 983,000
a. Management of Government Accounts b. Coin minting project
c. Importation & distribution of currency4. Economics & Statistics 116,000 0 116,000 0 0 0 0 0 0 0 0 0 116,000a. Publication of Economic Bulletin
1,602,000 0 1,602,000 0 0 0 0 0 0 0 0 0 1,602,000
Priority Rank Programs and/or Components
Program: Banking and Payments Authority
Overall Totals
2006/72003/4 2004/5 2005/6
Banking Payments Authority BPA Page 107 of 108

Programme Matrix The Road Map -- Annex 3
CFET TFET (and other
funding sources)
Combined Total
CFET Other Funding Sources
Combined Total
CFET Other Funding Sources
Combined Total
CFET Other Funding Sources
Combined Total
1. Development of a Legal Framework for future elections
a. Liaison with legislators and others on the legal framework and draft electoral law
5,000 0 5,000 5,000 0 5,000 5,000 0 5,000 6,500 0 6,500 21,500
b. Gather and analyse information on electoral policy and administration in other countries
5,500 0 5,500 5,500 0 5,500 5,500 0 5,500 6,000 0 6,000 22,500
c. Capacity building and TA 7,500 0 7,500 7,500 0 7,500 7,500 0 7,500 7,500 0 7,500 30,0002. Provision of advice to the Government on electoral matters
a. Timely provision of advice 5,000 0 5,000 5,000 0 5,000 5,000 0 5,000 5,000 0 5,000 20,000b. Capacity building and TA 5,500 0 5,500 5,500 0 5,500 5,500 0 5,500 6,000 0 6,000 22,500
3. Develop capacity to respond to calls to administernational and local elections
a. Finalise establishment of the Office of theIndependent Electoral Commission
5,000 0 5,000 5,000 0 5,000 5,000 0 5,000 6,500 0 6,500 21,500
b. Maintain and enhance an electoral officerprogramme and database
5,500 0 5,500 5,500 0 5,500 5,500 0 5,500 6,000 0 6,000 22,500
c. Establish district electoral offices 0 0 0 0 0 0 0 0 0 0 0 0 0
d. Support the maintenance of civil electoral roll7,500 0 7,500 7,500 0 7,500 6,000 0 6,000 8,000 0 8,000 29,000
e. Information campaigns: Electoral workshopsand voters' education
15,000 0 15,000 8,000 0 8,000 15,000 0 15,000 30,000 0 30,000 68,000
f. Road to elections: Voters registration, pollingcenter survey, nominations of candidates, politicalparty/independent registration, polling officialrecruitment, polling and counting training, ballotpaper printing, facilitation, transportation andcommunications
15,000 0 15,000 5,000 0 5,000 5,000 0 5,000 35,000 0 35,000 60,000
g. Capacity building and TA -- electoral course,conferences, observations, workplacements
10,000 0 10,000 7,000 0 7,000 7,000 0 7,000 15,000 0 15,000 39,000
Total 86,500 0 86,500 66,500 0 66,500 72,000 0 72,000 131,500 0 131,500 356,500
Priority Rank Programs and/or Components
Program: Independent Electoral Commission
Overall Totals
2006/72003/4 2004/5 2005/6
Independent Electoral Commission IEC Page 108 of 108

MINISTRY OF PLANNING AND FINANCE
OVERVIEW OF SECTOR INVESTMENT PROGRAMS
Volume I: Strategies and Priorities for the Medium-term
APRIL 2005

Timor-Leste: Overview of Sector Investment Programs – Volume 1
i
PREFACE Over the past three years, the Government has made a concerted effort to strengthen the links between policy formulation and programs to achieve the goals and objectives set out in the National Development Plan (NDP), improve capacities to translate these objectives into annual budgetary allocations, and strengthen capacities. Thus, it presents a clear guidance to Development Partners regarding priorities for assistance and for various initiatives to be taken in this regard. Annual Action Plans has been developed to establish clear links to budget processes and to monitor progress towards development objectives. In 2003 the Government undertook the so-called “Road Map” exercise that aimed to establish an expenditure framework for the medium-term that could guide decisions on allocation of CFET and available resources from development partners to particular sectors and programs. The Sector Investment Program (SIP) exercise had its origins in the “Road Map” exercise of 2003. As a result of that exercise the Government saw the need to have in place comprehensive statements development objectives, policies and programs for each of the key sectors of the economy and to strengthen the linkages among programs across agencies and sectors. Prior to the launch of the SIP exercise; the Government had been heavily dependent on TFET and other joint donor missions to ensure systematic development of sector policies and programs. The SIP exercise was launched in August 2003 with the express purpose of building capacities of staff and state institutions for the development of sectoral policy frameworks and related programs that could provide a basis for decisions on the allocation of scarce donor and CFET resources required to achieve particular development objectives. This overview report integrates the results of the Sector Investment Program. The report consists of two volumes. The present report, Volume I, provides a strategic view of the prospects for growth and poverty reduction and key challenges facing the country in the medium and longer term. It also aggregates the expenditures from the 15 SIPs and within the framework of financial availabilities for CFET and development partner resources projected to 2015, outlines priorities for expenditures on a combined sources basis. Annexes to this main report provide more details on the SIP process as well as underlying the analytical framework, data sources and details of macroeconomic and demographic projections to 2015. Volume II of the report provides a summary of each of the 15 individual SIPs, along with expenditure and other analysis for each sector. Individual reports for each of the 15 SIP sectors have also been completed. For each sector, these provide details on the goals and objectives for each sector, the policy framework, the program for the medium-term, and the associated expenditure framework. The Ministry of Planning and Finance wishes to express its appreciation to those development partners who have provided support for this undertaking over the past year. The work would not have been possible without the contributions of Australia, Japan and New Zealand (UNDP-DAS Program), United States of America, the Asian Development Bank, the World Bank, UNDP and UNICEF. The Ministry also wishes to acknowledge the extraordinary support and cooperation that was provided by many staff and national technical officials who have contributed to the success of this process.
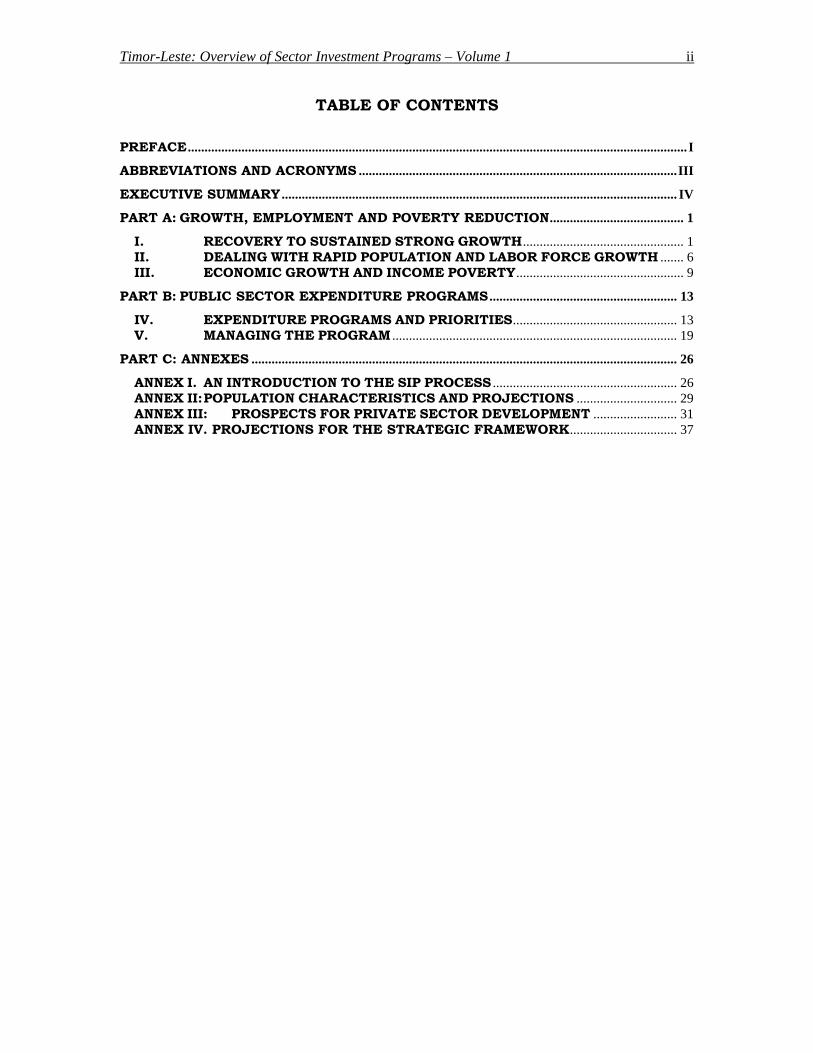
Timor-Leste: Overview of Sector Investment Programs – Volume 1 ii
TABLE OF CONTENTS
PREFACE ..................................................................................................................................................... I ABBREVIATIONS AND ACRONYMS ...............................................................................................III EXECUTIVE SUMMARY ...................................................................................................................... IV PART A: GROWTH, EMPLOYMENT AND POVERTY REDUCTION........................................ 1
I. RECOVERY TO SUSTAINED STRONG GROWTH................................................ 1 II. DEALING WITH RAPID POPULATION AND LABOR FORCE GROWTH ....... 6 III. ECONOMIC GROWTH AND INCOME POVERTY.................................................. 9
PART B: PUBLIC SECTOR EXPENDITURE PROGRAMS ........................................................ 13 IV. EXPENDITURE PROGRAMS AND PRIORITIES................................................. 13 V. MANAGING THE PROGRAM ..................................................................................... 19
PART C: ANNEXES ............................................................................................................................... 26 ANNEX I. AN INTRODUCTION TO THE SIP PROCESS ....................................................... 26 ANNEX II: POPULATION CHARACTERISTICS AND PROJECTIONS .............................. 29 ANNEX III: PROSPECTS FOR PRIVATE SECTOR DEVELOPMENT ......................... 31 ANNEX IV. PROJECTIONS FOR THE STRATEGIC FRAMEWORK................................ 37

Timor-Leste: Overview of Sector Investment Programs – Volume 1 iii
ABBREVIATIONS AND ACRONYMS
ADB Asian Development Bank CCT Cooperative Café Timor CDR Crude Death Rate CFET Consolidated Fund for East Timor DAS Development Advisory Services FY Fiscal Year GDP Gross National Product GNI Gross National Income IMF International Monetary Fund M&E Monitoring and Evaluation MDG Millennium Development Goal MICS Multiple Indicator Cluster Survey NDP National Development Plan NGO Non-Government Organization PKF Police Keeping Force PNTL Policia Nacional de Timor-Leste PSM Public Sector Management REA Registry of External Assistance SIP Sector Investment Program SWG Sector Working Group TFET Trust Fund for East Timor TFR Total Fertility Rate TLDHS Timor-Leste Demographic and General Health Survey TLSS Timor-Leste Living Standard Measurement Survey TSP Transition Support Program UK United Kingdom UN United Nations UNDP United Nations Development Program UNICEF United Nations Children’s Fund UNPOL United Nations Police WTO World Trade Organization
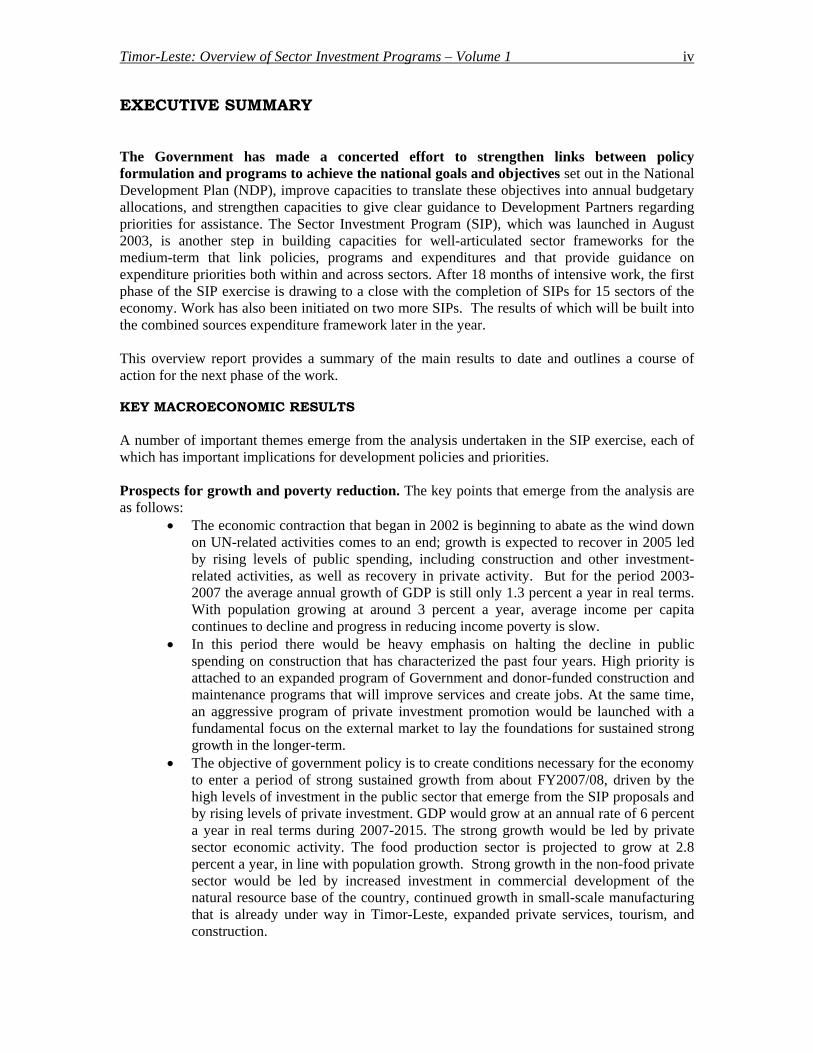
Timor-Leste: Overview of Sector Investment Programs – Volume 1 iv
EXECUTIVE SUMMARY The Government has made a concerted effort to strengthen links between policy formulation and programs to achieve the national goals and objectives set out in the National Development Plan (NDP), improve capacities to translate these objectives into annual budgetary allocations, and strengthen capacities to give clear guidance to Development Partners regarding priorities for assistance. The Sector Investment Program (SIP), which was launched in August 2003, is another step in building capacities for well-articulated sector frameworks for the medium-term that link policies, programs and expenditures and that provide guidance on expenditure priorities both within and across sectors. After 18 months of intensive work, the first phase of the SIP exercise is drawing to a close with the completion of SIPs for 15 sectors of the economy. Work has also been initiated on two more SIPs. The results of which will be built into the combined sources expenditure framework later in the year. This overview report provides a summary of the main results to date and outlines a course of action for the next phase of the work. KEY MACROECONOMIC RESULTS A number of important themes emerge from the analysis undertaken in the SIP exercise, each of which has important implications for development policies and priorities. Prospects for growth and poverty reduction. The key points that emerge from the analysis are as follows:
• The economic contraction that began in 2002 is beginning to abate as the wind down on UN-related activities comes to an end; growth is expected to recover in 2005 led by rising levels of public spending, including construction and other investment-related activities, as well as recovery in private activity. But for the period 2003-2007 the average annual growth of GDP is still only 1.3 percent a year in real terms. With population growing at around 3 percent a year, average income per capita continues to decline and progress in reducing income poverty is slow.
• In this period there would be heavy emphasis on halting the decline in public spending on construction that has characterized the past four years. High priority is attached to an expanded program of Government and donor-funded construction and maintenance programs that will improve services and create jobs. At the same time, an aggressive program of private investment promotion would be launched with a fundamental focus on the external market to lay the foundations for sustained strong growth in the longer-term.
• The objective of government policy is to create conditions necessary for the economy to enter a period of strong sustained growth from about FY2007/08, driven by the high levels of investment in the public sector that emerge from the SIP proposals and by rising levels of private investment. GDP would grow at an annual rate of 6 percent a year in real terms during 2007-2015. The strong growth would be led by private sector economic activity. The food production sector is projected to grow at 2.8 percent a year, in line with population growth. Strong growth in the non-food private sector would be led by increased investment in commercial development of the natural resource base of the country, continued growth in small-scale manufacturing that is already under way in Timor-Leste, expanded private services, tourism, and construction.

Timor-Leste: Overview of Sector Investment Programs – Volume 1 v
• In these circumstances, there would be faster progress in reducing the incidence of poverty. Even so, there will still be a hard core of around 200,000 in severe poverty by 2015. Specially targeted programs will be needed to address the needs of this group of people.
• Despite uneven progress in the incidence of income poverty, there is likely to be good progress in improving access to basic services. The proposed program does enable a transition to nine years of basic schooling for all by 2015, for example. Health indicators are expected to improve as the coverage and quality of health services are raised.
• Even after taking account of income from oil and gas, the non-oil Gross Domestic Product of Timor-Leste will only be around $550 per capita by 2015 (at 2000 constant prices). This means that Timor-Leste will still be classified as a low income developing country, even after allowing for income from oil and gas.
Rapid population growth translates into high rates of urbanization.
• The high rate of increase in population is expected to translate into continued rapid growth in urban areas. For the purpose of estimating urban services requirements, the SIP model assumes the urban population will grow at 5 percent a year. An additional 150,000 people will live in urban areas by 2015. Can this growth be distributed among urban areas throughout the country? Or will continued uneven levels of urban services and job opportunities lead to population concentration in Dili and Baucau, which already account for approximately 90 percent of the urban population of the country? What are the implications for local government and decentralization?
• More work is needed on urbanization policies and programs, including anticipating housing and other service requirements. The cost of providing public services to these burgeoning urban populations may put considerable strains on financial resources of the Government. Hence, it is even more important that measures are taken in order to develop this area, by investing in the development of basic infrastructures that contribute to raising the living standards in rural areas, making them more appealing to the population.
Creating enough productive employment will be a major challenge for the decade ahead.
• Continued rapid population growth of 3 percent a year and the relatively young population translates into rapid growth in the labor force. In the event that the labor force participation rate remains at its current estimated level of 59 percent, which is low by international standards, the labor force would grow at about 3 percent a year, adding about 10,000 new entrants to the labor force each year seeking employment. In the event that the participation rate rises to levels that are common among low income developing countries around the world, the labor force growth rate could be as high as 5 percent a year. In this case, the number of new entrants seeking employment would be in the range of 17,000 to 20,000 a year in the decade ahead.
• At the present time, the agricultural sector employs about 77 percent of the entire labor force at low levels of productivity. The challenge is to promote rapid growth in the non-food private sector, which currently employs about 70,000 workers at much higher average levels of productivity. Rapid growth in the latter will allow for a gradual shift out of low productivity employment in rural areas. With rising levels of labor productivity, the incidence of income poverty will decline.
• For the medium-term, a key issue is the extent to which the agricultural sector can create productive employment for the projected 5,000-9,000 new entrants into the rural work force each year. Three critical policy issues emerge. Can the agricultural

Timor-Leste: Overview of Sector Investment Programs – Volume 1 vi
growth rate be increased through private investment that results in larger production of marketable surpluses for the domestic and export markets? Will much larger numbers of people move to urban areas looking for work? Can the non-farm sector grow fast enough to absorb larger numbers of people into productive employment?
Increased levels of private investment are the key to sustained strong economic growth, which, in turn, is essential for significant reductions in the incidence of poverty in the country.
• The SIP exercise estimates that a growth rate of 8 percent a year in real terms will be required in the non-farm private sector, if the overall target of 6 percent growth in non-oil GDP is to be achieved and poverty reduced. The key to more rapid growth in the non-farm sector will be increased levels of investment, with a strong orientation on export markets. Achieving 8 percent real growth will require an average of about $60 million of new private investment in the non-food private sector each year over the medium-term.
• In the event that private investment levels remain stuck at current levels of around $15 million a year, the growth of the non-food private sector would be substantially lower – perhaps around 3 percent a year in real terms. In this case, non-oil GDP would only grow at about 4 percent a year in real terms. Pressures in the labor market would rise and there would be little or no progress in reducing the incidence of income poverty
PROPOSED PUBLIC EXPENDITURE PROGRAMS FOR THE MEDIUM-TERM Meeting the various goals and objectives set forth in the SIPs, would require combined CFET and donor expenditures of about $1.28 billion for the five-year period ending FY2008/09. This compares with about $900 million during the five-year period ending FY2003/04. These totals cover recurrent and capital spending. The pattern of expenditures on a combined sources basis would undergo significant change over the next five years. In recent years aggregate levels of spending on a combined sources basis have remained in the range of $200 million a year. Over the next five years combined sources expenditures would average about $230 million a year. The higher levels of spending stem primarily from a large program of capital investment in the power sector and in other basic infrastructure. A number of very important shifts in the pattern of spending emerge during the next five years.
• First, the relative importance of CFET in the combined sources framework continues to rise. In FY2000/01 for example CFET resources funded only 12 percent of combined sources expenditures, after allowing for the CFET budget support provided by donors. In the current fiscal year, CFET expenditures account for close to 40 percent of total expenditures. By FY2008/09, CFET is expected to account for almost 50 percent of total outlays.
• Second, dependence on funding of recurrent spending from the development partners of Timor-Leste would decline substantially over the next five years. By FY2008/09, CFET would account for almost 80 percent of recurrent outlays, compared with about 45 percent at the present time. Total recurrent expenditures on a combined sources basis would remain in the range of $140 million a year, sufficient to ensure steady progress towards the NDP, MDG and other objectives set in the SIP exercise for the medium-term.
Timor-Leste: Overview of Sector Investment Programs – Volume 1 vii
• Third, capital spending on a combined sources basis would rise steadily over the next five years. Underpinning this increase are important shifts in the pattern of spending. CFET capital expenditures would rise sharply from recent levels of around $13 million a year to $25 million a year by FY2008/09. Much of the increase would be allocated to capital replacement to ensure that public assets are kept in good working order. Funding from the development partners of Timor-Leste on capital expenditures would rise from the recent low levels of about $40 million a year. Much of the development partner funding of capital expenditures would be for new asset creation (power systems, improved roads, new schools, expanded provision of safe water and sanitation, for example), with CFET making larger capital replacement expenditures on the public assets.
Meeting the various goals and objectives set forth in the SIPs will require important shifts in the sectoral allocation of expenditures. The SIP analysis for each sector has brought out the need for shifts in resource allocations among sectors.
• The most significant change is in the area of basic infrastructure, whose share of the total combined sources budget would rise from 23 percent in the past five years to 36 percent during the next five years. A large part of this jump relates to the inclusion in the program of the Ira Lalaro hydro-power project and transmission line to Dili at an estimated total cost of $112 million.
• The second important point is that the resources allocated to basic services (health and education) remains at the current level of about $60 million a year. These levels of spending will ensure steady progress towards the interim MDGs set out in the SIPs for these important sectors.
• Spending on activities in the production-related sectors rises by about 20 percent to $20 million a year in the next five years, largely because of a very sharp increase in proposed spending on investigation of onshore and near-shore petroleum resources and on support for private sector development.
• The allocation for security and external relations remains unchanged at 11 percent of total spending.
• Allocations for capacity building in the national government decline from about 13 percent to about 9 percent of total spending, largely because of the sharp phase down in reliance on expensive expatriate advisory services over the next five years. At the same time, there is a large rise in spending on in-country training programs for national staff.
• There is increased support for programs aimed at improving other aspects of governance, including rights, equality and justice and local government, with these expenditures rising from $40 million in the past five years to $70 million over the next five years.
Proposals for donor funding for the next five years are lower than past allocations of such assistance.
• The activities proposed for donor funding would require new approvals of about $550 million over the next five years, including about $150 million for a small number of large investments in the power sector. The average level of new approvals is thus about $110 million a year, $80 million a year of which is proposed for sectors other than power.
• This proposed level of new on-budget commitments of development and technical assistance compares with actual commitments for the same category of donor assistance that averaged $150 million a year over the past five years.
Timor-Leste: Overview of Sector Investment Programs – Volume 1 viii
• In other words, the Government is already factoring possible lower levels of donor assistance into its medium-term expenditure planning.
• For the longer term, the SIP exercise assumes that donor-funded development and technical assistance will be in the range of $80 million a year. This is based on the current per capita allocations of aid to low-income countries that have a strong commitment to sound development policies and, with a few exceptions, have experienced sustained strong economic growth.
FURTHER DEVELOPMENT OF THE SIP PROCESS The Government has benefited from the SIP process in a variety of ways and intends to strengthen and broaden the process. It will be used to guide decisions on priorities and resources allocations for the medium-term by building the results of the work into the budget and other planning activities of the Government. A number of specific actions are underway or are planned:
• Under TSP III, the Government has committed itself to the development of a combined resources budget for FY2005/06. The SIP framework will be integrated into this process.
• Follow-up work is planned to review existing performance benchmarks and interim MDG targets in the light of the SIP analysis and findings.
• The strategic planning framework developed for the SIP will be strengthened and as information becomes available from the 2004 census, the demographic and other elements of the framework will be revised.
• Additional work is planned to address the current deficiencies in information about public assets, and the costs of maintenance and capital replacement.
NEXT STEPS WITH DEVELOPMENT PARTNERS The proposed program for accelerated growth and steady progress towards the NDP and MDG objectives will not be without difficulties, given the daunting task in the immediate future of building the capacities of national institutions and staff to manage successfully the changing development requirements of the country. It will require strong support from our Development Partners, including continued access to expertise and advice on the successes and failures in development in other countries around the world. Given the importance of CFET funding for capital expenditures, it will also require a major build up in capacities of national staff to manage the identification, design and implementation of these capital development programs. It will require changes in the management of development programs that are responsive to the changing circumstances and capacities of the country. There is a need for immediate follow-up with development partners on funding for proposed new activities. As noted above, the SIP process has identified a large number of new activities for start up during the next five years that are suitable for funding by Development Partners. Within each sector, the responsible line agencies have given close attention to prioritizing and sequencing new activities and programs. More than 200 new activities have been identified for implementation over the next five years. A start date for implementation has been established for each new activity. The Government would like to come to early understanding with Development Partners regarding funding arrangements for the proposed program. With this in mind the following steps are being taken.
• The Government will consolidate these proposals into a smaller number of programs and project packages that would be well suited for funding by Development Partners,

Timor-Leste: Overview of Sector Investment Programs – Volume 1 ix
with due attention being given to known partners (donors) interests and funding capacities.
• The Government would then like to engage in a round of discussions with its partners, perhaps on a sectoral basis, to determine the degree of interest in individual program proposals or in a series of such proposals for implementation over the next three years. The Government will want to ascertain the extent to which some partners may wish to collaborate with others under any one of several forms of cofinancing arrangements.
• With early agreement on funding arrangements, work can begin immediately on the most urgent activities that are scheduled for implementation this year.
• For those programs that do not attract support from our partners, the Government will consider other options, including funding from CFET or alternative sources, or deferral of the program to a later date.
Sector working groups are being set up to facilitate coordination within and across sectors, among donors and between Government and donors. The SIP process has highlighted the need to strengthen capacities within the Government for longer-term strategic planning across various sectors that integrates concerns about the growth and movement of the population, with the provision of economic opportunities, basic services and national security. The Government intends to take steps to strengthen these capacities. As a first step, the Government has begun the formation of Sector working Groups (SWGs) for some or all sectors. These working groups are to be chaired by a senior Government official and are open to any donor who has an interest in the particular sector. Sector Working Groups for the Health Care, Agriculture and Basic Infrastructure have already been formally established. The Government expects the formal establishment of the SWG for Education and Training by May 2005, followed by the gradual establishment of the remaining groups within this calendar year. The responsibilities of the groups will evolve in the light of experience, but are expected to range from informal advice to the agencies of Government that are responsible for the sector in question to a more wide-ranging role. The groups will have the onerous task of mobilizing the necessary resources to carry out the proposed SIP program, and at the same time ensure coordination of activities within the sector. Given their critical role in driving the SIP process, extensive support will be needed from the donor community to ensure the success of these groups. One of the biggest challenges for the Government is strengthening the role and function of the secretariat within each SWG. Increased attention to monitoring and evaluation in each sector. In reviewing various drafts of the SIPs, a number of our development partners have made the point that there was discussion of the arrangements needed within each sector for monitoring and evaluation (M&E) of progress towards goals and objectives. With the release of the final versions of the SIPs, the Government believes that the basis now exists for serious work on the detailed definition of an M&E framework for each sector. The issue of monitoring and evaluation of sector objectives should be discussed within the respective SWGs. It is proposed that a pilot initiative for the design and implementation of an M&E system be developed within one SWG as soon as possible. Experience with the development of this pilot initiative can then be transferred to other sectors. The Government would welcome the support of one or more donors for this pilot initiative. The Government would like to engage Development Partners in a dialogue on the transition to the next phase of cooperation as TFET comes to a close. The Government would like to explore with development partners various options for the next phase of donor cooperation and coordination as TFET draws to a close. The CFET framework used for the SIP exercise also

Timor-Leste: Overview of Sector Investment Programs – Volume 1 x
foresees the gradual phase down of budget support over the next few years. New mechanisms will be needed to enhance donor coordination. This report sets out a number of different options that move donor cooperation and coordination in the direction of relying on sector coordination groups led by senior government officials. Within the sector coordination framework, increased reliance on bilateral funding on a project basis, which may also involve cofinancing, would also be pursued where there is a clear understanding of the priorities within each sector. The guiding principle will be to marry the preferred modalities of Development Partners to sector requirements and Government priorities.

Timor-Leste: Overview of Sector Investment Programs – Volume 1 1
PART A: GROWTH, EMPLOYMENT AND POVERTY REDUCTION
I. RECOVERY TO SUSTAINED STRONG GROWTH
Since restoration of Independence, the Government has articulated clearly its vision for the development of the country and, with the help of the donor community, has set about the pursuit of this vision. The National Development Plan, widely discussed during the course of preparation, sets out the strategy for the five year period 2002-2007. This strategy is driven by two key objectives:
• The reduction of poverty in all sectors and regions of the Nation; and • The promotion of economic growth that is equitable and sustainable, and that
improves the health, education and well-being of the entire country. The population is growing rapidly and, in the absence of sustained and broad-based economic growth over the last five years, there has been only limited progress in reducing poverty and improving food security. The incidence of poverty remains high with an estimated 42 percent of the population below the national poverty line. However, there has been significant progress in expanding access to health and education services in many parts of the country. Despite progress on these and other fronts, the country continues to face a daunting set of challenges. With approximately 50 percent of the population below the age of 18 for example, there will be great pressures on the education system to equip these young people for productive lives and to create employment opportunities for a very large number of new entrants into the labor force each year. Poverty reduction in Timor-Leste is closely linked to economic growth. Analysis by the World Bank and others draw attention to the large numbers of people who are vulnerable to poverty and who can benefit from the income and employment effects of sustained economic growth. A key objective for the next five years is to promote a recovery to sustained strong economic growth. PROMOTING RECOVERY TO SUSTAINED STRONG ECONOMIC GROWTH Recent trends in the economy. Table 1 summarizes estimates of GDP by industrial origin at current market prices. The estimates for the period 2000 through 2003, recently prepared by the National Statistics Directorate, affect perceptions about the growth of the economy during this period. In analyzing these trends, it is convenient to group the sectors in the national accounts into three broad sets of economic activity: (a) all public sector activity which includes, government activities, the United Nations , public sector construction and utilities, which are essentially government-owned and operated; (b) the food production sector (food crops, livestock and fisheries) which approximates the largely private subsistence sector of the economy; and (c) the remainder of the national accounts sectors which are essentially all other private production and services in the economy, including commercial agricultural production, forestry, mining and quarrying (excluding oil and gas), manufacturing, transportation, financial and other services. For convenience, this group of sectors is called the non-food private sector. The first important point that emerges from Table 1 is that as measured by value added, the non-food private sector is the largest of the three components of the economy, accounting for about 40 percent of non-oil GDP. The public sector and food sector account for about 38 percent and 22 percent respectively. The second important point that emerges is that the growth experience of

Timor-Leste: Overview of Sector Investment Programs – Volume 1 2
these three sectors varied widely during 2000-2003. These differences have important implications for the short- and medium-term outlook for the economy.
• Value added in the food crop, livestock and fisheries sector within agriculture, after recovering strongly in 2001, declined steadily thereafter and by 2003 was back to the 2000 level. With population growth at around three percent a year in this period, the real value of food production per capita declined throughout the period, exacerbating problems of food insecurity.
• The non-food private sector grew at an average of 5.6 percent a year in real terms during 2000-2003. The commercial agricultural sector recorded strong growth throughout the period, as did manufacturing, financial services and the transport sector. These gains were partly offset by contraction in private construction and wholesale and retail trade, both of which were heavily influenced by the departure of international personnel from 2002 onwards
• Value added in the public sector grew by 26 percent in 2001 only to be followed by a sharp contraction as the UN phased down its presence in Timor-Leste. These contractionary effects more than offset to very strong growth performance of the national government sector in which value added registered a threefold increase in three years. There were two opposing trends in the sector in the past five years: value added by United Nations activities declined very sharply, as did public construction, whereas value added by the remainder of the government activities grew rapidly in real terms with the build-up of the national government.
Sector 2000 2003 2007 2010 2015 2000-2003 2003-2007 2007-2015
Food, livestock & fisheries 68.6 68.9 77.0 83.6 96.0 0.2 2.8 2.8 Non-food private sector 111.1 130.8 149.0 186.6 278.0 5.6 3.3 8.1 Public sector Government 22.9 65.9 81.0 93.8 119.7 42.2 5.3 5.0 Construction & utilities 30.2 18.3 32.5 39.8 50.8 (15.4) 15.4 5.7 United Nations 83.4 38.6 - - - (22.7) - - Sub-total 136.5 122.8 113.5 133.6 170.5 (3.5) (2.0) 5.2 Non-oil GDP 316.2 322.5 339.5 403.8 544.5 0.7 1.3 6.1 Oil & gas mining 77.5 51.9 GDP 393.7 374.4 GDP deflator (2000=100.0) 100.0 104.1 114.9 123.7 140.0 1.4 2.5 2.5 Non-oil GDP (at current prices) 316.2 335.7 390.1 499.5 762.3 2.0 3.8 8.7 Population ('000) 819.4 898.0 1,005.1 1,095.4 1,266.8 3.1 2.9 2.9 Non-oil GDP per capita ($) 386 374 388 456 602 (1.1) 0.9 5.6 Source: National income accounts for 2000-2003 provided by National Statistics Directorate
Value added (at 2000 constant prices US$ millions) Growth rates (% p.a.)
Table 1: Gross Domestic Product by Industrial Origin
In real terms, non-oil GDP increased by a total of two percent during 2000-2003 – substantially less than the population which grew at around three percent a year in the same period. At current market prices, non-oil GDP stood at about $375 in 2003. Future growth of the economy. A set of projections for 2005 through 2015 have been prepared for the SIP exercise. These are built up from the proposed public expenditure programs and expectations about private investment activity. The underlying expectation is that during 2005-2007 the economy will gradually recover from the contraction of recent years and will be able to make a transition to sustained strong growth of 6 percent a year in real terms in the longer-term. A key driver is sustained high levels of investment spending by the Government and donors that
Timor-Leste: Overview of Sector Investment Programs – Volume 1 3
supports expansion in construction, a recovery in private economic activity and an improved performance in the agriculture sector. These projections are built around a series of policy judgments that are embedded in the SIPs for the various sectors. The public sector is expected to continue to contract for several more years as a result of the complete phase-out on UN-related activities. In the medium-term at least these contractionary effects outweigh the contributions of the proposed strong expansion in public construction activity (discussed below) and continued steady growth in the provision of public services. For the longer-term, the public sector is expected to grow at about five percent a year in real terms, driven by population growth of close to three percent a year and an aggressive program of spending and service delivery that aims to expand substantially the current low levels of access to public services throughout the country by meeting the MDGs for 2015. The growth of the food production sector is projected to approximate that of population growth – that is about 2.8 percent a year in real terms. With the rural population projected to grow at about 2.2 percent a year, the implication is that food output per person in rural areas would rise moderately – in other words, the proposed strategy for improved food security as spelled out in the SIP for agriculture and livestock would bring some improvements in food supplies and security. Increased private investment in commercial activities such as palm oil, live animal exports, and other specialty products for overseas markets as discussed below, would lift the overall agricultural growth rate to around four percent a year in real terms in the longer-term. The performance would still fall short of the NDP target of six percent real growth for agriculture in the medium-term, but it would put Timor-Leste among a small, select group of low income developing countries that have experienced sustained strong agricultural growth over the past two decades.1
The third key element of the strategy for making a transition to sustained strong growth in the medium and longer term has to do with the further development of the non-food private sector. As noted above, this is already the largest sector in the economy and it is one that, under the right policies, offers the best prospects for sustained strong growth that can create jobs and improve living standards for large numbers of Timorese. A two-pronged approach in being taken to the further development of the sector:
• An aggressive expansion of publicly-funded construction activity to rehabilitate and expand infrastructure and facilities, with an emphasis on labor-intensive methods to create employment. This will require strong support for the domestic private construction sector.
• Increased emphasis on the promotion of private investment, including foreign direct investment, in a broad range of business opportunities in the non-food private sector, namely commercial agricultural activities, manufactures, including various wood products such as furniture, and a range of processed food products, tourism, and other activities.
Promotion of construction activities. The Government intends to give a high priority to construction activities that are funded from the CFET budget and by donors. There is a clear need to improve infrastructure services in the country and to continue with an aggressive program rehabilitate public facilities that are in poor condition, as well as build new facilities such as
1 For all low income developing countries, the agricultural sector grew in real terms at three percent a year in the 1980s and 2.5 percent a year in the 1990s. A small group of these countries (including Benin, Chad, Laos and Mozambique) have managed sustained strong growth of four percent a year or more in agriculture over an extended period.

Timor-Leste: Overview of Sector Investment Programs – Volume 1 4
schools and clinics. These outlays will improve service delivery, support the growth of private business activities and create employment. The Government has been very encouraged by experience with Japan’s ongoing $13 million road construction project which currently employs approximately 2,000 people using labor-intensive methods. The SIPs include an ambitious program to expand construction sector activities, with particular attention being given to the use of labor-intensive methods. Table 2 gives the estimated value of public construction activity in recent years and projected levels of expenditures based on the proposals included in the individual SIPs.
(In US$ mill)Activity 2000/01 2001/02 2002/03 2003/04 2006/07 2008/09
Road works Maintenance 1.0 1.5 2.3 3.1 3.9 6.8 Construction 4.3 16.3 15.8 3.7 21.5 27.3 Sub-total 5.3 17.8 18.1 6.8 25.4 34.1 Other construction 46.8 25.1 19.6 15.7 33.9 37.3 Total value of construction 52.1 42.9 37.7 22.5 59.3 71.4 Source: various SIPs.
Table 2: Estimated Value of Public Construction Activity in Timor-Leste
The first point that emerges from Table 2 is that spending on public construction activity has declined sharply since the peak of 2000/01. By 2003/04 public construction activities were less than half that in 2000/01. Declining levels of public construction have had a significant contractionary effect in the economy, with substantial employment effects. The SIPs call for a substantial build-up in publicly funded construction over the next five years. If the programs can be implemented as proposed, public spending on these activities would rise to around $70 million a year by 2008/09. The employment effects of this increased level of spending would be substantial, perhaps adding as many as 10,000 jobs to the labor market in this five-year period. The Government is well aware of the challenge associated with lifting public spending in these areas. Although there has been progress in developing the domestic construction industry much more remains to be done. There is an urgent need to build the capacities of the relevant line agencies for the proposed larger volume of work that flows from this strategy. The development partners have an important role to play in this regard. The domestic construction industry must also be strengthened. Further development of the industry will require a move towards equipment leasing arrangements for small and medium-sized domestic construction firms, improved information for the private sector on the expected flow of new construction contracts for the public sector, along with early completion of the Government’s procurement guidelines that are currently under preparation, improved access to working capital lines of credit from the banking sector, as well as increased emphasis on skills development in the labor force and for local entrepreneurs. Ongoing projects such as the EU-funded $5 million employment training program have a major role to play in this regard. Given that it will take time to build capacities in the local construction industry, the Government recognizes that at least in the early phases, the program may require increased use of foreign contractors, preferably under joint-venture and other partnership arrangements such as sub-contracting, that will strengthen the domestic industry. Promotion of private investment and the non-food private sector. The second key part of the strategy for a successful transition to sustained strong growth is to accelerate the growth of the non-food private sector. For non-oil GDP to grow at six percent a year, the non-food private sector must grow at around eight percent a year (both in real terms). This will require two things: first, aggressive action to improve the enabling environment for private investment, including improved infrastructure services, continued adequate domestic security and streamlined
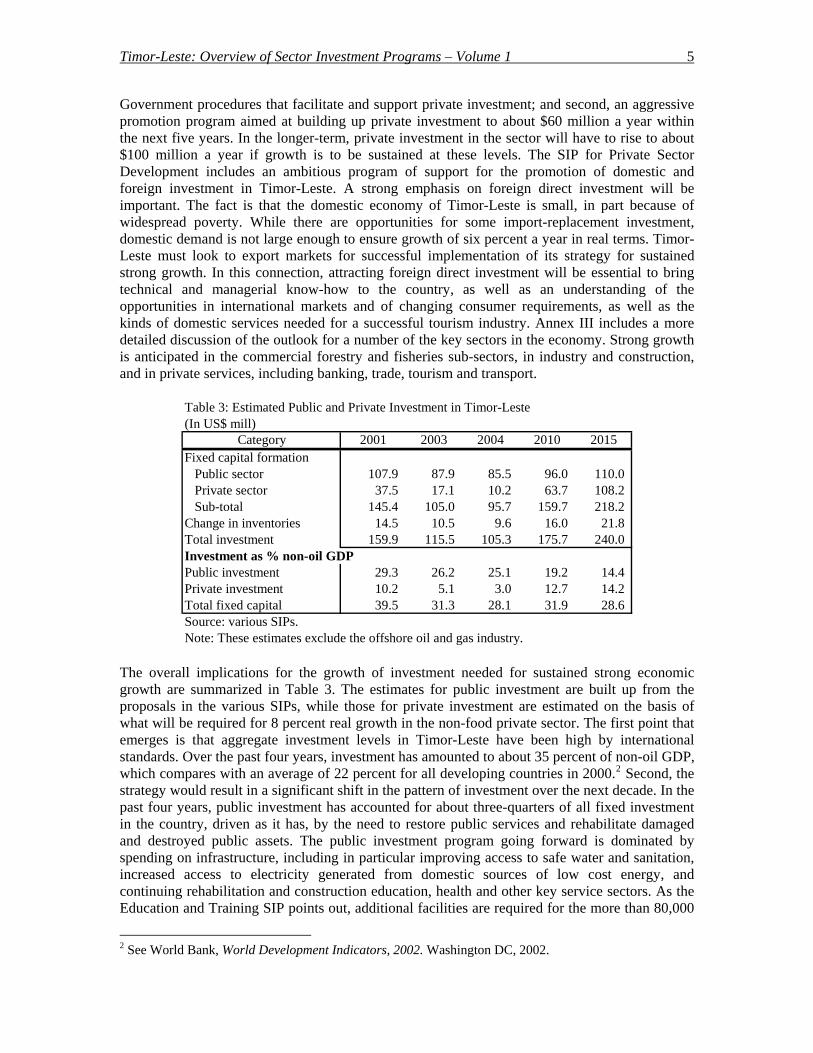
Timor-Leste: Overview of Sector Investment Programs – Volume 1 5
Government procedures that facilitate and support private investment; and second, an aggressive promotion program aimed at building up private investment to about $60 million a year within the next five years. In the longer-term, private investment in the sector will have to rise to about $100 million a year if growth is to be sustained at these levels. The SIP for Private Sector Development includes an ambitious program of support for the promotion of domestic and foreign investment in Timor-Leste. A strong emphasis on foreign direct investment will be important. The fact is that the domestic economy of Timor-Leste is small, in part because of widespread poverty. While there are opportunities for some import-replacement investment, domestic demand is not large enough to ensure growth of six percent a year in real terms. Timor-Leste must look to export markets for successful implementation of its strategy for sustained strong growth. In this connection, attracting foreign direct investment will be essential to bring technical and managerial know-how to the country, as well as an understanding of the opportunities in international markets and of changing consumer requirements, as well as the kinds of domestic services needed for a successful tourism industry. Annex III includes a more detailed discussion of the outlook for a number of the key sectors in the economy. Strong growth is anticipated in the commercial forestry and fisheries sub-sectors, in industry and construction, and in private services, including banking, trade, tourism and transport.
(In US$ mill)Category 2001 2003 2004 2010 2015
Fixed capital formation Public sector 107.9 87.9 85.5 96.0 110.0 Private sector 37.5 17.1 10.2 63.7 108.2 Sub-total 145.4 105.0 95.7 159.7 218.2 Change in inventories 14.5 10.5 9.6 16.0 21.8 Total investment 159.9 115.5 105.3 175.7 240.0 Investment as % non-oil GDPPublic investment 29.3 26.2 25.1 19.2 14.4 Private investment 10.2 5.1 3.0 12.7 14.2 Total fixed capital 39.5 31.3 28.1 31.9 28.6 Source: various SIPs.Note: These estimates exclude the offshore oil and gas industry.
Table 3: Estimated Public and Private Investment in Timor-Leste
The overall implications for the growth of investment needed for sustained strong economic growth are summarized in Table 3. The estimates for public investment are built up from the proposals in the various SIPs, while those for private investment are estimated on the basis of what will be required for 8 percent real growth in the non-food private sector. The first point that emerges is that aggregate investment levels in Timor-Leste have been high by international standards. Over the past four years, investment has amounted to about 35 percent of non-oil GDP, which compares with an average of 22 percent for all developing countries in 2000.2 Second, the strategy would result in a significant shift in the pattern of investment over the next decade. In the past four years, public investment has accounted for about three-quarters of all fixed investment in the country, driven as it has, by the need to restore public services and rehabilitate damaged and destroyed public assets. The public investment program going forward is dominated by spending on infrastructure, including in particular improving access to safe water and sanitation, increased access to electricity generated from domestic sources of low cost energy, and continuing rehabilitation and construction education, health and other key service sectors. As the Education and Training SIP points out, additional facilities are required for the more than 80,000
2 See World Bank, World Development Indicators, 2002. Washington DC, 2002.
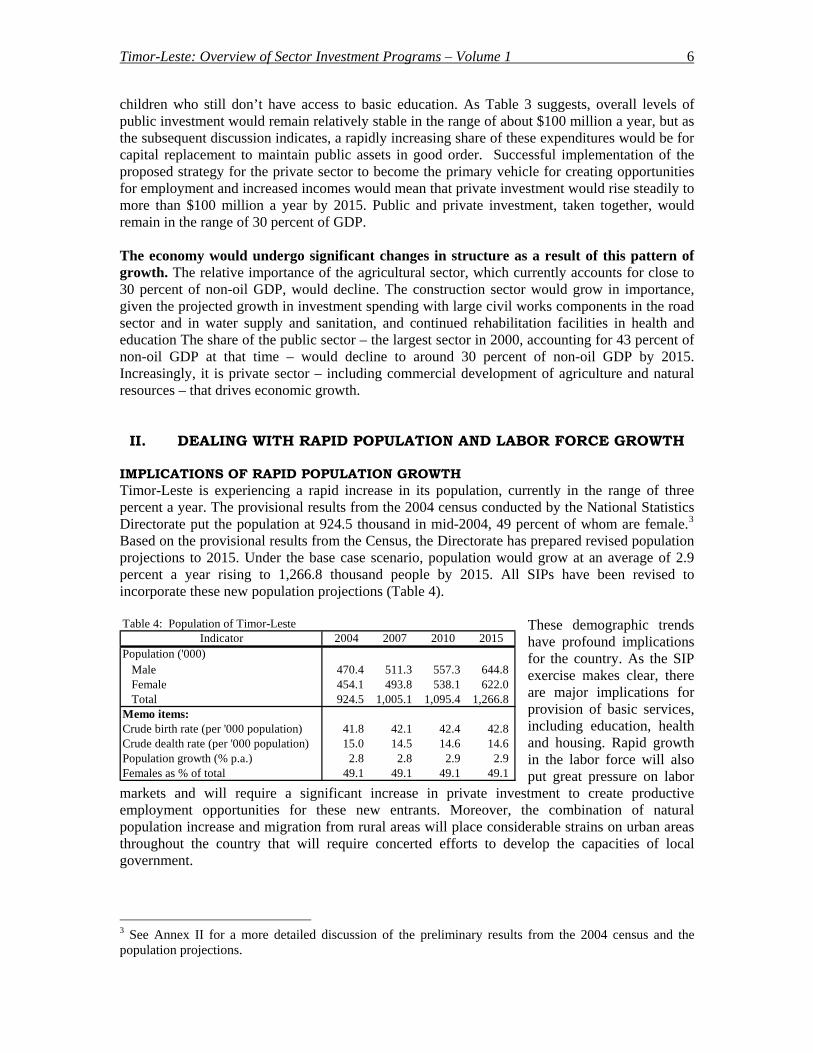
Timor-Leste: Overview of Sector Investment Programs – Volume 1 6
children who still don’t have access to basic education. As Table 3 suggests, overall levels of public investment would remain relatively stable in the range of about $100 million a year, but as the subsequent discussion indicates, a rapidly increasing share of these expenditures would be for capital replacement to maintain public assets in good order. Successful implementation of the proposed strategy for the private sector to become the primary vehicle for creating opportunities for employment and increased incomes would mean that private investment would rise steadily to more than $100 million a year by 2015. Public and private investment, taken together, would remain in the range of 30 percent of GDP. The economy would undergo significant changes in structure as a result of this pattern of growth. The relative importance of the agricultural sector, which currently accounts for close to 30 percent of non-oil GDP, would decline. The construction sector would grow in importance, given the projected growth in investment spending with large civil works components in the road sector and in water supply and sanitation, and continued rehabilitation facilities in health and education The share of the public sector – the largest sector in 2000, accounting for 43 percent of non-oil GDP at that time – would decline to around 30 percent of non-oil GDP by 2015. Increasingly, it is private sector – including commercial development of agriculture and natural resources – that drives economic growth. II. DEALING WITH RAPID POPULATION AND LABOR FORCE GROWTH
IMPLICATIONS OF RAPID POPULATION GROWTH Timor-Leste is experiencing a rapid increase in its population, currently in the range of three percent a year. The provisional results from the 2004 census conducted by the National Statistics Directorate put the population at 924.5 thousand in mid-2004, 49 percent of whom are female.3 Based on the provisional results from the Census, the Directorate has prepared revised population projections to 2015. Under the base case scenario, population would grow at an average of 2.9 percent a year rising to 1,266.8 thousand people by 2015. All SIPs have been revised to incorporate these new population projections (Table 4).
These demographic trends have profound implications for the country. As the SIP exercise makes clear, there are major implications for provision of basic services, including education, health and housing. Rapid growth in the labor force will also put great pressure on labor
markets and will require a significant increase in private investment to create productive employment opportunities for these new entrants. Moreover, the combination of natural population increase and migration from rural areas will place considerable strains on urban areas throughout the country that will require concerted efforts to develop the capacities of local government.
Indicator 2004 2007 2010 2015Population ('000) Male 470.4 511.3 557.3 644.8 Female 454.1 493.8 538.1 622.0 Total 924.5 1,005.1 1,095.4 1,266.8 Memo items:Crude birth rate (per '000 population) 41.8 42.1 42.4 42.8 Crude dealth rate (per '000 population) 15.0 14.5 14.6 14.6 Population growth (% p.a.) 2.8 2.8 2.9 2.9 Females as % of total 49.1 49.1 49.1 49.1
Table 4: Population of Timor-Leste
3 See Annex II for a more detailed discussion of the preliminary results from the 2004 census and the population projections.

Timor-Leste: Overview of Sector Investment Programs – Volume 1 7
Another consequence is that non-oil GDP per capita, which was about $375 in 2003 (at 2000 constant prices), does not increase significantly during the next few years. The likely implication is continued slow progress in reducing income poverty, at least until there is a recovery to strong economic growth from 2007 onwards. By 2015, GDP per capita would have risen to about $600 in real terms (at constant 2000 prices). In other words, Timor-Leste will continue to be classified as a low income developing country for at least another decade.4 The Government is committed to strong programs aimed at reducing poverty and food insecurity, and improving health and education. It is therefore very likely that the current high crude death rates will decline as a result of these programs. What are the implications for population growth? The answer depends on whether improved living conditions lead to a decline in fertility rates. Table 5 therefore summarizes the results of two possible scenarios both of which assume a rapid decline in mortality rates:
• Alternative A assumes there is no change in the current very high fertility rates, but that there is a decline in mortality.
• Alternative B assumes that fertility rates also decline.
Scenario2005 2015 2005 2015 Total 0-11 years
Base case scenario 41.8 42.8 15 14.6 1,266.8 453.2A. Constant fertility rate 41.8 42.2 14.8 10.9 1,291.1 467.8B. Declining fertility rate 41.2 36.7 14.7 10.3 1,250.4 427.1
Crude birth rate (per '000) Crude death rate (per '000) Population 2015 ('000)
Table 5: Alternative Scenarios for Population Growth
In Scenario A the population growth rises to an average of 3.1 percent a year as a result of the assumed decline in the CDR to 10.9 per thousand by 2015. Such a decline is very plausible, given that the average CDR for all low income developing countries was 11 in 2000. The result is a population of approximately 1.3 million by 2015. However, if the current very high total fertility rate of 6.3 births per woman were to decline, the population growth comes down (Scenario B). In this case, population could be lower than in the Base case used for the SIP exercise. An even more rapid drop in total fertility cannot be ruled out. By way of comparison, the average total fertility rate for women in low income developing countries was 5.3 in 1980, but it had declined to 3.8 by 2000. The alternative population projections have significant implications for service provision in urban and rural areas. For example, the number of children in 2015 aged less than 12 years will be determined by fertility and mortality rates in the decade ahead. The number in this group in Scenario B is 40,000 more than in Scenario A in 2015. The Scenario B outcome will add $2-3 million a year to the costs of providing primary and junior secondary education services to these additional children by 2015. EMERGING ISSUES IN URBAN DEVELOPMENT Reliable estimates of urban populations are currently not available because of the lack of formally gazetted boundaries that define the administrative jurisdictions of urban areas.5 Preliminary analysis of the census data suggests an urban population of approximately 206,200 last year – 4 Under World Bank country classifications, a low income developing country is defined as one with a GNI per capita of $755 at 1999 prices. Even with the benefits of income from oil and gas and from related investment income, the GNI of Timor-Leste will be about $700 per capita (at 2000 constant prices) in 2015. 5 See the SIP for Housing and Urban Development for a further discussion of issues associated with urban development and definition of town boundaries.
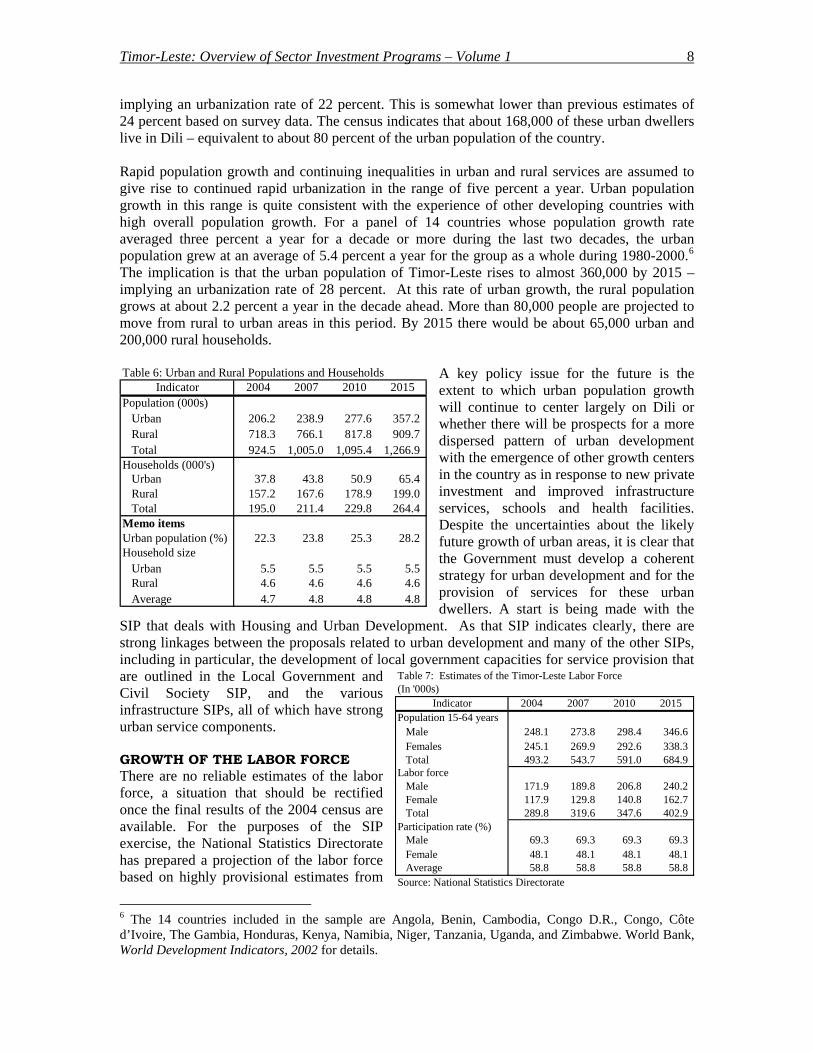
Timor-Leste: Overview of Sector Investment Programs – Volume 1 8
implying an urbanization rate of 22 percent. This is somewhat lower than previous estimates of 24 percent based on survey data. The census indicates that about 168,000 of these urban dwellers live in Dili – equivalent to about 80 percent of the urban population of the country. Rapid population growth and continuing inequalities in urban and rural services are assumed to give rise to continued rapid urbanization in the range of five percent a year. Urban population growth in this range is quite consistent with the experience of other developing countries with high overall population growth. For a panel of 14 countries whose population growth rate averaged three percent a year for a decade or more during the last two decades, the urban population grew at an average of 5.4 percent a year for the group as a whole during 1980-2000.6 The implication is that the urban population of Timor-Leste rises to almost 360,000 by 2015 – implying an urbanization rate of 28 percent. At this rate of urban growth, the rural population grows at about 2.2 percent a year in the decade ahead. More than 80,000 people are projected to move from rural to urban areas in this period. By 2015 there would be about 65,000 urban and 200,000 rural households.
al government capacities for service provision that
ROWTH OF THE LABOR FORCE
A key policy issue for the future is the extent to which urban population growth will continue to center largely on Dili or whether there will be prospects for a more dispersed pattern of urban development with the emergence of other growth centers in the country as in response to new private investment and improved infrastructure services, schools and health facilities. Despite the uncertainties about the likely future growth of urban areas, it is clear that the Government must develop a coherent strategy for urban development and for the provision of services for these urban dwellers. A start is being made with the
SIP that deals with Housing and Urban Development. As that SIP indicates clearly, there are strong linkages between the proposals related to urban development and many of the other SIPs, including in particular, the development of locare outlined in the Local Government and Civil Society SIP, and the various infrastructure SIPs, all of which have strong urban service components.
Indicator 2004 2007 2010 2015Population (000s) Urban 206.2 238.9 277.6 357.2 Rural 718.3 766.1 817.8 909.7 Total 924.5 1,005.0 1,095.4 1,266.9 Households (000's) Urban 37.8 43.8 50.9 65.4 Rural 157.2 167.6 178.9 199.0 Total 195.0 211.4 229.8 264.4 Memo itemsUrban population (%) 22.3 23.8 25.3 28.2 Household size Urban 5.5 5.5 5.5 5.5 Rural 4.6 4.6 4.6 4.6 Average 4.7 4.8 4.8 4.8
Table 6: Urban and Rural Populations and Households
(In '000s)Indicator 2004 2007 2010 2015
Population 15-64 years Male 248.1 273.8 298.4 346.6
Females 245.1 269.9 292.6 338.3 Total 493.2 543.7 591.0 684.9 Labor force Male 171.9 189.8 206.8 240.2 Female 117.9 129.8 140.8 162.7 Total 289.8 319.6 347.6 402.9 Participation rate (%) Male 69.3 69.3 69.3 69.3
Female 48.1 48.1 48.1 48.1 Average 58.8 58.8 58.8 58.8
Source: National Statistics Directorate
Table 7: Estimates of the Timor-Leste Labor Force
GThere are no reliable estimates of the labor force, a situation that should be rectified once the final results of the 2004 census are available. For the purposes of the SIP exercise, the National Statistics Directorate has prepared a projection of the labor force based on highly provisional estimates from
6 The 14 countries included in the sample are Angola, Benin, Cambodia, Congo D.R., Congo, Côte d’Ivoire, The Gambia, Honduras, Kenya, Namibia, Niger, Tanzania, Uganda, and Zimbabwe. World Bank, World Development Indicators, 2002 for details.
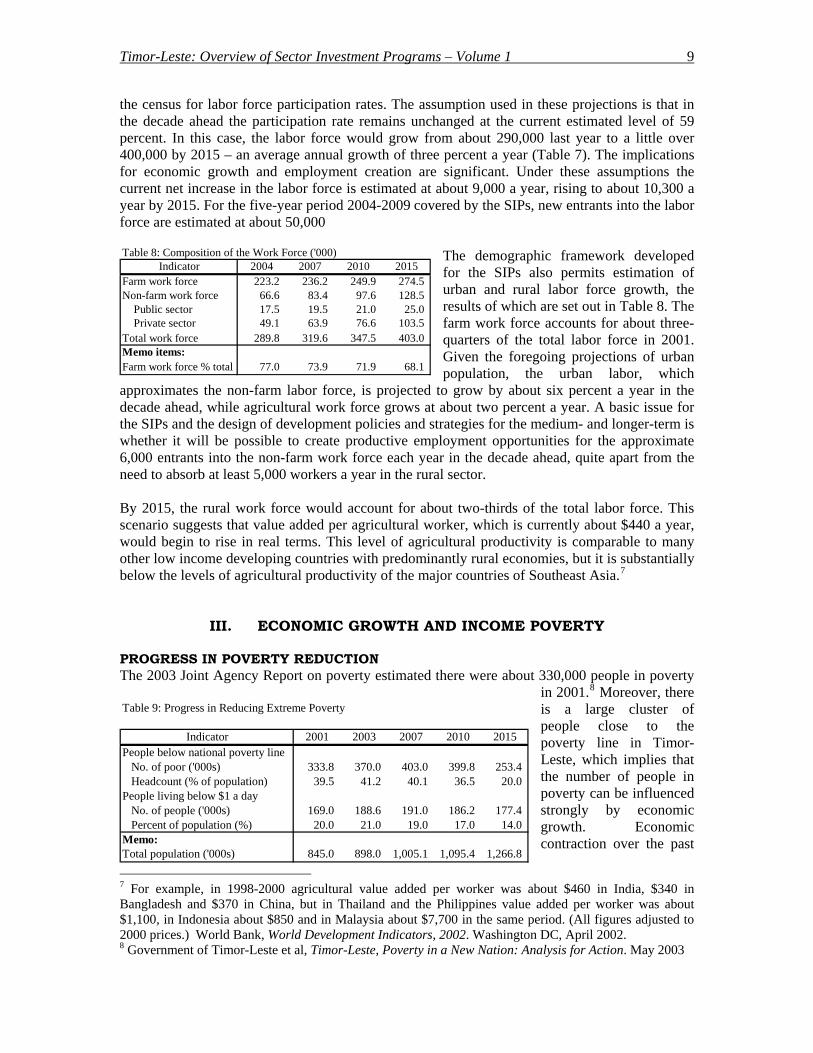
Timor-Leste: Overview of Sector Investment Programs – Volume 1 9
the census for labor force participation rates. The assumption used in these projections is that in the decade ahead the participation rate remains unchanged at the current estimated level of 59 percent. In this case, the labor force would grow from about 290,000 last year to a little over 400,000 by 2015 – an average annual growth of three percent a year (Table 7). The implications for economic growth and employment creation are significant. Under these assumptions the current net increase in the labor force is estimated at about 9,000 a year, rising to about 10,300 a year by 2015. For the five-year period 2004-2009 covered by the SIPs, new entrants into the labor force are estimated at about 50,000
The demographic framework developed for the SIPs also permits estimation of urban and rural labor force growth, the results of which are set out in Table 8. The farm work force accounts for about three-quarters of the total labor force in 2001. Given the foregoing projections of urban population, the urban labor, which
approximates the non-farm labor force, is projected to grow by about six percent a year in the decade ahead, while agricultural work force grows at about two percent a year. A basic issue for the SIPs and the design of development policies and strategies for the medium- and longer-term is whether it will be possible to create productive employment opportunities for the approximate 6,000 entrants into the non-farm work force each year in the decade ahead, quite apart from the need to absorb at least 5,000 workers a year in the rural sector.
Indicator 2004 2007 2010 2015Farm work force 223.2 236.2 249.9 274.5 Non-farm work force 66.6 83.4 97.6 128.5 Public sector 17.5 19.5 21.0 25.0 Private sector 49.1 63.9 76.6 103.5 Total work force 289.8 319.6 347.5 403.0 Memo items:Farm work force % total 77.0 73.9 71.9 68.1
Table 8: Composition of the Work Force ('000)
By 2015, the rural work force would account for about two-thirds of the total labor force. This scenario suggests that value added per agricultural worker, which is currently about $440 a year, would begin to rise in real terms. This level of agricultural productivity is comparable to many other low income developing countries with predominantly rural economies, but it is substantially below the levels of agricultural productivity of the major countries of Southeast Asia.7
III. ECONOMIC GROWTH AND INCOME POVERTY PROGRESS IN POVERTY REDUCTION The 2003 Joint Agency Report on poverty estimated there were about 330,000 people in poverty
in 2001.8 Moreover, there is a large cluster of people close to the poverty line in Timor-Leste, which implies that the number of people in poverty can be influenced strongly by economic growth. Economic contraction over the past
Indicator 2001 2003 2007 2010 2015People below national poverty line No. of poor ('000s) 333.8 370.0 403.0 399.8 253.4 Headcount (% of population) 39.5 41.2 40.1 36.5 20.0 People living below $1 a day No. of people ('000s) 169.0 188.6 191.0 186.2 177.4 Percent of population (%) 20.0 21.0 19.0 17.0 14.0 Memo:Total population ('000s) 845.0 898.0 1,005.1 1,095.4 1,266.8
Table 9: Progress in Reducing Extreme Poverty
7 For example, in 1998-2000 agricultural value added per worker was about $460 in India, $340 in Bangladesh and $370 in China, but in Thailand and the Philippines value added per worker was about $1,100, in Indonesia about $850 and in Malaysia about $7,700 in the same period. (All figures adjusted to 2000 prices.) World Bank, World Development Indicators, 2002. Washington DC, April 2002. 8 Government of Timor-Leste et al, Timor-Leste, Poverty in a New Nation: Analysis for Action. May 2003

Timor-Leste: Overview of Sector Investment Programs – Volume 1 10
three years has likely resulted in an increase in the number of people below the income poverty line. The SIP framework includes an estimate of some 370,000 people – or 41 percent of the population below the national poverty line in 2003 (Table 9). Moreover, it is likely that more than 20 percent of the population continues to live on less than US$1 a day, which translates into about 190,000 or more who are in extreme poverty. Survey information also suggests that a large numbers of rural dwellers, particularly in upland and dryland farming areas, continue to face problems of food insecurity. Table 9 also sets out the planned progression towards the MDG goal of halving the incidence of extreme poverty by 2015. As the Table indicates, even with progress in reducing the incidence of poverty, the total numbers of people affected is likely to rise over the medium-term. The combination of weak growth for two more years and continued rapid population growth results in a steady increase in the number of people in poverty. Strong growth beyond 2007 begins to have an impact on poverty, but even though the incidence of poverty begins to decline and by 2010 drops to 36.5 percent – an improvement over the situation in 2001 – the total number of people in poverty is still about 400,000 in 2010. With sustained strong growth of six percent a year, there is a reasonable expectation that the incidence of income poverty can be reduced to 20 percent by 2015. Even so, there would still be about 250,000 below the income poverty line at that time. The core of the poverty problem over the longer term centers on the 175,000 in extreme poverty who, for various reasons, continue to subsist on the equivalent of less than $1 a day, and who continue to have inadequate levels of food intake. Over the longer term, poverty reduction programs must be able to identify these people and address the root causes of their poverty with appropriate targeted interventions. The above prospects for income poverty reduction need to be balanced against progress in providing access to basic services. In this regard there has been progress, the details of which are discussed elsewhere in this report. Some 250,000 children now attend school. Health services have been expanded and now reach larger numbers of people. There has also been progress in expanding access to safe water and improved sanitation in urban and rural areas. And as discussed elsewhere in this report, implementation of the programs set out in the various SIPs will result in significant increase in access to basic health and education services throughout the country, a large increase in the number of urban and rural families that have access to safe water and sanitation, and within the next five years, good progress in laying the foundations for substantially enhanced access to low cost electricity in many parts of the country. UNCERTAINTIES ABOUT GROWTH AND POVERTY REDUCTION These prospects for a sharp reduction in the incidence of income poverty must be qualified, however; a number of major uncertainties surround these growth forecasts and their impact on poverty. Among the major downside risks are the following:
• Slower overall economic growth because of a poor performance in agriculture. • An inability of Timor-Leste to attract $60 million a year of private capital for
investment in the non-food private sector, as discussed in Chapter 1. As a result, the growth of the non-food private sector is much lower as is GDP growth.
• Higher population growth as a result of a successful reduction in mortality rates, but with no corresponding reduction in fertility rates.
• A rapid growth in the labor force as a result of rising participation rates (and also because of natural increase).
Given that the bulk of the population will continue to reside in rural areas and depend on agriculture for their livelihood, the growth performance of the agricultural sector will have a

Timor-Leste: Overview of Sector Investment Programs – Volume 1 11
significant bearing on the extent of poverty reduction. Annex III includes a brief review of the potential for commercial agriculture. A key issue is developing better links with markets and other interventions that will improve incentives for farmers to produce marketable surpluses and for business to invest larger amounts in commercial opportunities. If however, the long-term agricultural growth rate is only say 2 percent a year – not the 3.5 percent a year built into the base case projections, the GDP growth would be about 10 percent lower. In this scenario, average output per laborer in agriculture would decline in real terms throughout the decade ahead. In these circumstances, it is very likely that the exodus from agriculture would accelerate; led by younger, better education people who are looking for work. A sustained poor performance in agriculture would very likely place substantially greater strains on urban areas to create opportunities for an improved life. Another major uncertainty centers on whether the country can successfully attract $60 million a year of new investment into the non-food private sector. Much work remains to be done in identifying these business opportunities, lowering the costs of infrastructure services, improving the overall environment for investment and in developing suitable export markets. What happens if the level of private investment remains stuck in the range of $15 million a year – close to the estimated recent levels? In this case, the growth rate of the non-food private sector would average about three percent a year – not the eight percent a year in real terms called for in Chapter 1. As a result, non-oil GDP would grow at no more than four percent a year in real terms. In these circumstances, it is very unlikely that the non-food private sector would create anywhere near enough new employment to meet the needs of an urban labor force projected to grow at six percent a year in the decade ahead. In the absence of other measures, this would almost certainly result in continued high levels of unemployment and under employment, especially among young people, that in turn could lead to increased social and political strains.
(Non-oil GDP at 2000 constant prices)Growth Scenario
2003 2007 2015 2003-2007 2007-2015A. High GDP growth & slower labor force growth Non-oil GDP (US$ mill) 322.5 339.9 545.0 1.3 6.1 Non-oil GDP per capita (US$) 360 340 430 (1.4) 3.0 Labor force ('000) 281.1 319.6 402.9 3.2 2.9 Non-oil GDP per worker (US$) 1,147 1,064 1,353 (1.9) 3.1 B. High GDP growth & high labor force growth Labor force ('000) 281.1 344.0 515.7 5.2 5.2 Non-oil GDP per worker (US$) 1,147 988 1,057 (3.7) 0.9 C. Low GDP growth & slower labor force growth Non-oil GDP (US$ mill) 322.5 339.9 465.0 1.3 4.0 Non-oil GDP per capita (US$) 360 340 370 (1.4) 1.1 Labor force ('000) 281.1 319.6 402.9 3.2 2.9 Non-oil GDP per worker (US$) 1,147 1,064 1,154 (1.9) 1.0 D. Low GDP growth & high labor force growth Labor force ('000) 281.1 344.0 515.7 5.2 5.2 Non-oil GDP per worker (US$) 1,147 988 902 (3.7) (1.1)
Growth rate (% p.a.)Amount
Table 10: Alternative Scenarios for GDP and Labor Force Growth
Yet another major uncertainty relates to the growth in the labor force. The estimates for new entrants into the labor force discussed in the previous Chapter are lower than previous estimates based on survey and other data. There is reason to believe that the current labor force participation rate for Timor-Leste of 59 percent is on the low side. The average labor force participation rate for all low income developing countries has been remarkably stable over time at
Timor-Leste: Overview of Sector Investment Programs – Volume 1 12
about 78 percent.9 At about 70 percent, the participation rate for males in Timor-Leste looks especially low. The average male participation rate for low income countries is over 90 percent according to World Bank data. This raises the possibility that labor force participation rate may rise in the decade ahead as more children have access to basic and advanced education and population continues to move from rural to urban areas. More rapid increases in participation rates would raise the labor force growth rates. The National Statistics Directorate has prepared an alternative scenario for labor force growth in which the participation rate rise to about 75 percent by 2015 – a level that prevailed in Timor-Leste in the 1990s. In this case, the labor force would rise to about 515,000 by 2015. In this scenario, the number of new entrants into the labor force would average 20,500 a year in the decade ahead – double that in Table 7 above. The four scenarios set out in Table 10 give different combinations of economic and labor force growth:
• Scenario A is the base case discussed in Chapter I above – a recovery to sustained strong economic growth, with steady improvement in output per workers and rising income per person. As discussed earlier, there is steady progress in reducing the incidence of income poverty in this scenario.
• In Scenario B there is no change in the economic growth performance of the country, but labor force participation rates rise and the labor force grows at 5 percent a year. In this scenario, output per worker essentially stagnates for the decade ahead. In these circumstances it is difficult to see much progress in reducing the current high incidence of income poverty.
• Scenarios C and D summarize the implications of slower economic growth when the labor force grows at 3 percent and 5 percent a year respectively. In these two cases, non-oil GDP per capita stagnates at current levels and in the case of rising labor force participation rates (Scenario D), output per worker declines steadily throughout the decade. In these scenarios, it is very likely that the incidence of income poverty in the country would rise beyond current levels of about 42 percent – perhaps to around 50 percent within the decade ahead.
These alternative scenarios serve to underscore the importance of a successful implementation of the strategies set out in the SIPs for growth, investment and service delivery.
9 According to the World Bank, the average labor force participation rate for low income countries was 79.2 percent in 1980 and 77.3 percent 2000. See World Development Indicators, 2002.
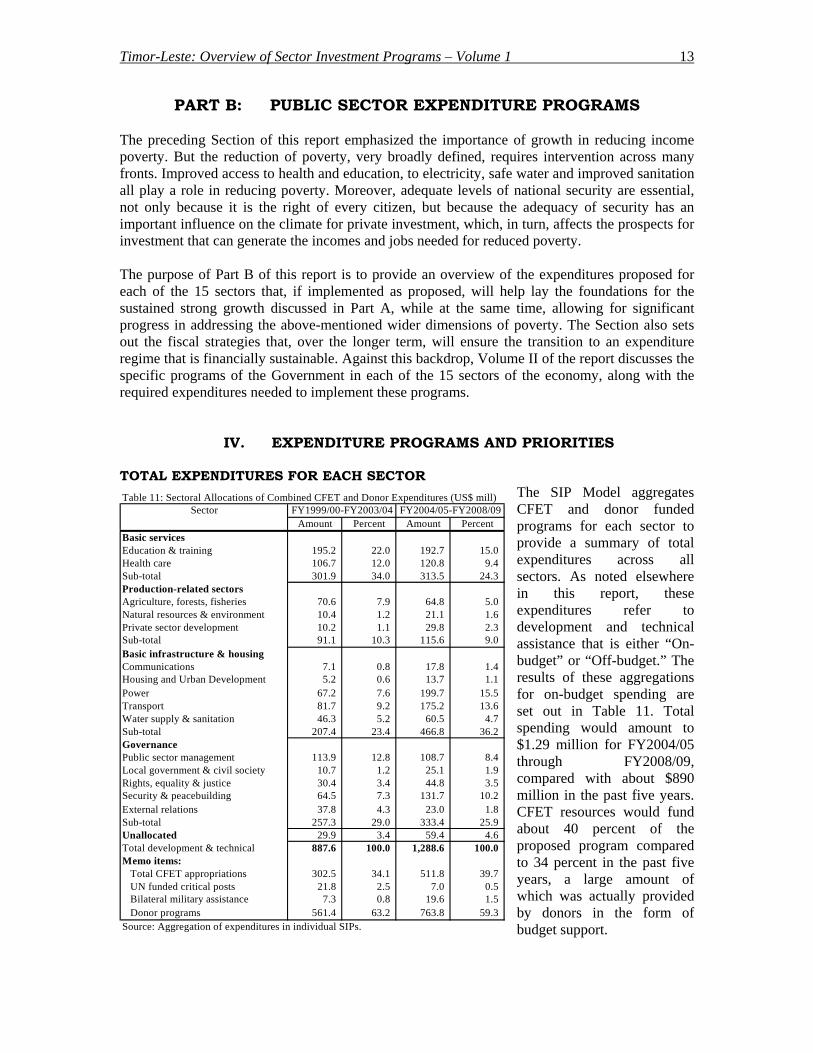
Timor-Leste: Overview of Sector Investment Programs – Volume 1 13
PART B: PUBLIC SECTOR EXPENDITURE PROGRAMS
The preceding Section of this report emphasized the importance of growth in reducing income poverty. But the reduction of poverty, very broadly defined, requires intervention across many fronts. Improved access to health and education, to electricity, safe water and improved sanitation all play a role in reducing poverty. Moreover, adequate levels of national security are essential, not only because it is the right of every citizen, but because the adequacy of security has an important influence on the climate for private investment, which, in turn, affects the prospects for investment that can generate the incomes and jobs needed for reduced poverty. The purpose of Part B of this report is to provide an overview of the expenditures proposed for each of the 15 sectors that, if implemented as proposed, will help lay the foundations for the sustained strong growth discussed in Part A, while at the same time, allowing for significant progress in addressing the above-mentioned wider dimensions of poverty. The Section also sets out the fiscal strategies that, over the longer term, will ensure the transition to an expenditure regime that is financially sustainable. Against this backdrop, Volume II of the report discusses the specific programs of the Government in each of the 15 sectors of the economy, along with the required expenditures needed to implement these programs.
IV. EXPENDITURE PROGRAMS AND PRIORITIES TOTAL EXPENDITURES FOR EACH SECTOR
The SIP Model aggregates CFET and donor funded programs for each sector to provide a summary of total expenditures across all sectors. As noted elsewhere in this report, these expenditures refer to development and technical assistance that is either “On-budget” or “Off-budget.” The results of these aggregations for on-budget spending are set out in Table 11. Total spending would amount to $1.29 million for FY2004/05 through FY2008/09, compared with about $890 million in the past five years. CFET resources would fund about 40 percent of the proposed program compared to 34 percent in the past five years, a large amount of which was actually provided by donors in the form of budget support.
SectorAmount Percent Amount Percent
Basic servicesEducation & training 195.2 22.0 192.7 15.0 Health care 106.7 12.0 120.8 9.4 Sub-total 301.9 34.0 313.5 24.3 Production-related sectorsAgriculture, forests, fisheries 70.6 7.9 64.8 5.0 Natural resources & environment 10.4 1.2 21.1 1.6 Private sector development 10.2 1.1 29.8 2.3 Sub-total 91.1 10.3 115.6 9.0 Basic infrastructure & housingCommunications 7.1 0.8 17.8 1.4 Housing and Urban Development 5.2 0.6 13.7 1.1 Power 67.2 7.6 199.7 15.5 Transport 81.7 9.2 175.2 13.6 Water supply & sanitation 46.3 5.2 60.5 4.7 Sub-total 207.4 23.4 466.8 36.2 GovernancePublic sector management 113.9 12.8 108.7 8.4 Local government & civil society 10.7 1.2 25.1 1.9 Rights, equality & justice 30.4 3.4 44.8 3.5 Security & peacebuilding 64.5 7.3 131.7 10.2 External relations 37.8 4.3 23.0 1.8 Sub-total 257.3 29.0 333.4 25.9 Unallocated 29.9 3.4 59.4 4.6 Total development & technical 887.6 100.0 1,288.6 100.0 Memo items: Total CFET appropriations 302.5 34.1 511.8 39.7 UN funded critical posts 21.8 2.5 7.0 0.5 Bilateral military assistance 7.3 0.8 19.6 1.5 Donor programs 561.4 63.2 763.8 59.3 Source: Aggregation of expenditures in individual SIPs.
Table 11: Sectoral Allocations of Combined CFET and Donor Expenditures (US$ mill)FY1999/00-FY2003/04 FY2004/05-FY2008/09

Timor-Leste: Overview of Sector Investment Programs – Volume 1 14
The proposed program would result in significant shifts in allocations of resources among sectors. The allocation for the power sector rises sharply because of the inclusion in the program of some $112 million for the Ira Lalaro hydro-power project and associated 180 km. transmission line to Dili. With a sharply increased allocation for the transport sector as well, the share of infrastructure spending rises to about 36 percent of the total program, compared to 23 percent in the past five years. Education and training continues to receive a large allocation of resources, even though there is a drop in the share of total spending. As indicated in Chapter II of Volume II, the proposed levels of spending are sufficient to meet the interim MDG enrolment targets over the next five years. Spending on health care also rises, largely because of the proposed program for rehabilitation of hospitals and health clinics. The amount of resources allocated to the production-related sectors rises because of the substantially larger programs associated with the possible development of onshore and nearshore oil and gas. The share of resources allocated to security and peacebuilding also rises, largely because of increased allocations for capacity building in the PNTL. In the previous five years, Public Sector Management (PSM) received the second largest allocation on a combined sources basis after education and training. For the five-year period ending FY2008/09, the PSM share of total spending drops to about 8.4 percent, largely because of the planned sharp reduction in expatriate advisers. The ‘unallocated’ category also shows a large increase. There are several reasons for the increase. A notional provision has been included here for the requirements of the two SIP programs that are still under preparation: these are the “Other Pillars of the State” and “Social, Civil and Heritage Protection”. When these two SIPs are completed in the coming months, the aggregate combined sources requirements will be revised to reflect the results of the work. The “unallocated” category also includes a modest amount of additional CFET expenditures for capital replacement and recurrent expenditures that are not yet allocated to specific sectors. The basis for these additional allocations is discussed later in this Chapter. These proposed reallocations reflect the intention of the Government to adjust overall patterns of spending among sectors in the light of changing circumstances. The guidelines that will shape these reallocations are as follows:
• The Government remains committed to allocating a large share of total resources to health and education. The combined total for these two sectors would remain in the range of 25 percent of total spending, at least for the medium term. The past high allocations reflect, to some extent, the inclusion of development partner-funded compensation for the large numbers of expatriate staff in these sectors.
• The Government wants to see a larger share of resources going into building and maintaining the basic infrastructure of the country. Under the proposed programs the share of resources allocated for infrastructure rises from 23 percent to 36 percent. If the $112 million allocated for the Ira Lalaro power project and transmission line were excluded from the above, infrastructure would then be about 30 percent of total spending.
• The Government also recognizes the importance of ensuring national security and therefore intends to allocate a somewhat larger share of resources to these programs.
RECURRENT AND CAPITAL EXPENDITURES In the course of the SIP exercise, an effort was made to estimate capital and recurrent spending that is “on-budget” in each sector. An aggregation of the results is set out in Table 12. Two important sets of issues about expenditure policy emerge from this Table. The first concerns capital expenditures. Over the past five years, capital spending by the public sector on development-related activities is estimated at about $300 million, three-quarters of which was

Timor-Leste: Overview of Sector Investment Programs – Volume 1 15
funded by the partners of Timor-Leste. A matter of growing concern for the Government is to ensure that the public assets of the country are adequately maintained and, as necessary, rehabilitated. At this time, there are no reliable estimates for the total value of the public assets, including infrastructure, of the country. A very informal estimate developed as part of the SIP exercise puts the replacement cost of these assets in the range of $500-600 million. If the average life of the assets is 15 years, capital replacement expenditures would need to average around $35 million a year. This is substantially higher than what is currently provided for in the CFET budget. In recognition of these needs, the Government intends to raise the allocations for maintenance and replacement of capital in the coming years. While no final decisions have been made on the amounts involved, the SIP exercise includes an increase in CFET-funded capital expenditures to $25 million by FY2008/09. This would lift CFET capital spending from the level of about 3.5 percent of non-oil GDP in the recent past to almost 6 percent by FY2008/09. For the longer-term, CFET funding of capital expenditures would need to rise to around 9 percent of GDP to meet requirements for capital replacement as well as new asset creation. The sharp rise in donor funding of capital expenditures in FY2005/06 through FY2008/09 stems mainly from the large investment program for the Power Sector discussed earlier in this Chapter.
Type of Expenditure FY2000/01 FY2001/02 FY2002/03 FY2003/04 FY2004/05 FY2005/06 FY2006/07 FY2007/08 FY2008/09Recurrent expenditures CFET 29.5 46.7 64.0 66.1 66.7 76.7 84.7 92.4 101.7 Donor programs 69.4 76.3 70.3 68.9 80.1 68.0 55.8 49.6 30.6 Sub-total 98.9 123.0 134.3 135.0 146.8 144.7 140.5 142.0 132.3 Capital expenditures CFET 21.7 10.5 14.6 13.2 11.2 14.8 17.6 21.0 25.1 Donor programs 51.2 69.4 48.8 39.0 39.1 74.7 100.9 99.0 75.8 Sub-total 72.9 79.9 63.4 52.2 50.3 89.5 118.5 120.0 100.9 Total expenditures CFET 51.2 57.2 78.6 79.3 77.9 91.5 102.3 113.4 126.8 Donor programs 120.6 145.7 119.1 107.9 119.2 142.7 156.7 148.6 106.4 Total 171.8 202.9 197.7 187.2 197.1 234.2 259.0 262.0 233.2 Memo itemsCFET as % total expenditures 29.8 28.2 39.8 42.4 39.5 39.1 39.5 43.3 54.4 Recurrent as % GDP 28.9 34.6 39.6 39.9 42.3 40.2 37.1 34.9 30.0 Capital as % GDP 21.3 22.5 18.7 15.4 14.5 24.9 31.3 29.5 22.8
Table 12: Trends in Capital and Recurrent Expendtures by the Public Sector in Timor-Leste (US$ millions)
The second set of issues relates to recurrent spending policies. As Table 12 indicates, the Government expects a gradual reduction in funding by the partners of Timor-Leste of recurrent expenditures. The SIP exercise makes provision for CFET allocations for recurrent outlays to rise to about $100 million by FY2008/09, with partner funding declining to $30 million. This means that CFET would be funding more than three-quarters of recurrent expenditures by FY2008/09. This represents a significant shift from the past four years when CFET domestic resources financed only about 20 percent of recurrent expenditures, with the balance covered by donor-funded budget support and direct bilateral financing. CFET funding of recurrent expenditures, which is currently equivalent to about 19 percent of non-oil GDP, would rise to about 23 percent by FY2008/09, consistent with the levels of funding required for steady progress towards the MDGs and other objectives set out in the various SIPs. As Table 12 makes clear, by FY2008/09 CFET would be funding about 54 percent of total expenditures called for under the SIPs, compared with only 12 percent in FY2001/02 for example, when large amounts of CFET budget support were provided being provided by the partners of Timor-Leste. The proposed program sets forth a manageable transition to financial sustainability, while at the same time, addressing many of Timor-Leste’s most urgent and difficult development challenges that center on poverty reduction.
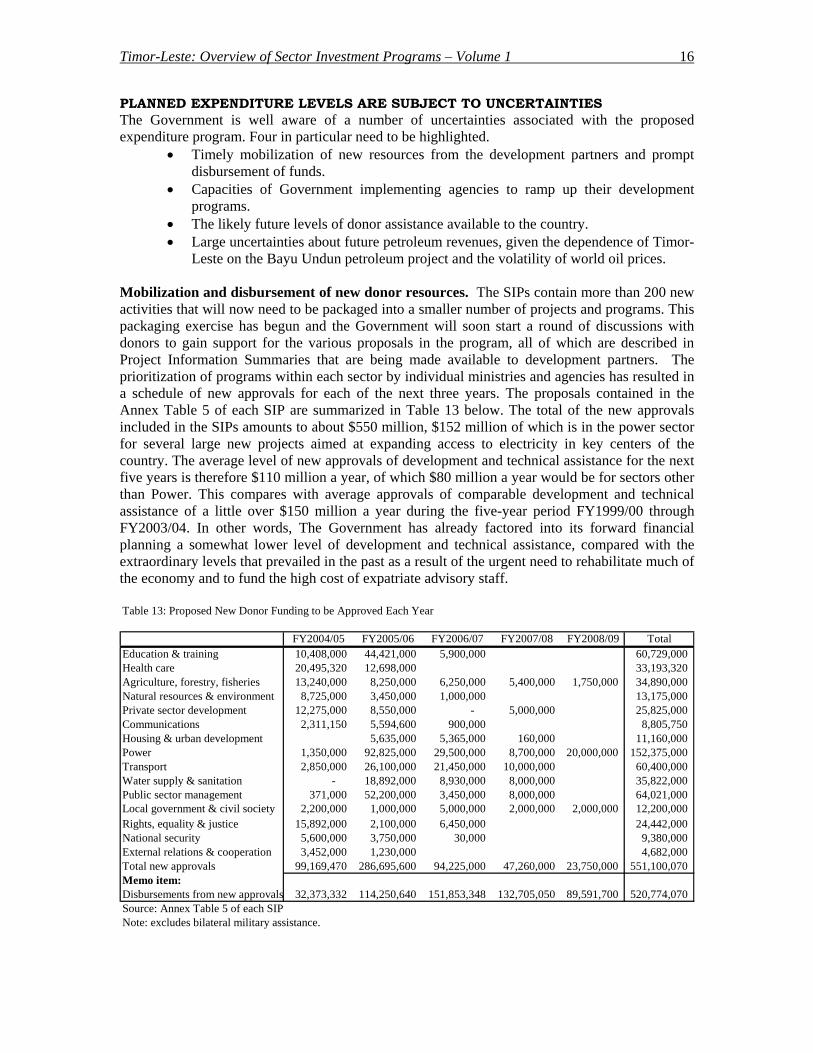
Timor-Leste: Overview of Sector Investment Programs – Volume 1 16
PLANNED EXPENDITURE LEVELS ARE SUBJECT TO UNCERTAINTIES The Government is well aware of a number of uncertainties associated with the proposed expenditure program. Four in particular need to be highlighted.
• Timely mobilization of new resources from the development partners and prompt disbursement of funds.
• Capacities of Government implementing agencies to ramp up their development programs.
• The likely future levels of donor assistance available to the country. • Large uncertainties about future petroleum revenues, given the dependence of Timor-
Leste on the Bayu Undun petroleum project and the volatility of world oil prices. Mobilization and disbursement of new donor resources. The SIPs contain more than 200 new activities that will now need to be packaged into a smaller number of projects and programs. This packaging exercise has begun and the Government will soon start a round of discussions with donors to gain support for the various proposals in the program, all of which are described in Project Information Summaries that are being made available to development partners. The prioritization of programs within each sector by individual ministries and agencies has resulted in a schedule of new approvals for each of the next three years. The proposals contained in the Annex Table 5 of each SIP are summarized in Table 13 below. The total of the new approvals included in the SIPs amounts to about $550 million, $152 million of which is in the power sector for several large new projects aimed at expanding access to electricity in key centers of the country. The average level of new approvals of development and technical assistance for the next five years is therefore $110 million a year, of which $80 million a year would be for sectors other than Power. This compares with average approvals of comparable development and technical assistance of a little over $150 million a year during the five-year period FY1999/00 through FY2003/04. In other words, The Government has already factored into its forward financial planning a somewhat lower level of development and technical assistance, compared with the extraordinary levels that prevailed in the past as a result of the urgent need to rehabilitate much of the economy and to fund the high cost of expatriate advisory staff.
FY2004/05 FY2005/06 FY2006/07 FY2007/08 FY2008/09 TotalEducation & training 10,408,000 44,421,000 5,900,000 60,729,000 Health care 20,495,320 12,698,000 33,193,320 Agriculture, forestry, fisheries 13,240,000 8,250,000 6,250,000 5,400,000 1,750,000 34,890,000 Natural resources & environment 8,725,000 3,450,000 1,000,000 13,175,000 Private sector development 12,275,000 8,550,000 - 5,000,000 25,825,000 Communications 2,311,150 5,594,600 900,000 8,805,750 Housing & urban development 5,635,000 5,365,000 160,000 11,160,000 Power 1,350,000 92,825,000 29,500,000 8,700,000 20,000,000 152,375,000 Transport 2,850,000 26,100,000 21,450,000 10,000,000 60,400,000 Water supply & sanitation - 18,892,000 8,930,000 8,000,000 35,822,000 Public sector management 371,000 52,200,000 3,450,000 8,000,000 64,021,000 Local government & civil society 2,200,000 1,000,000 5,000,000 2,000,000 2,000,000 12,200,000 Rights, equality & justice 15,892,000 2,100,000 6,450,000 24,442,000 National security 5,600,000 3,750,000 30,000 9,380,000 External relations & cooperation 3,452,000 1,230,000 4,682,000 Total new approvals 99,169,470 286,695,600 94,225,000 47,260,000 23,750,000 551,100,070 Memo item:Disbursements from new approvals 32,373,332 114,250,640 151,853,348 132,705,050 89,591,700 520,774,070 Source: Annex Table 5 of each SIPNote: excludes bilateral military assistance.
Table 13: Proposed New Donor Funding to be Approved Each Year

Timor-Leste: Overview of Sector Investment Programs – Volume 1 17
The Government is taking steps to create Sector Working Groups (SWGs) for each of the key sectors. The steps being taken in this regard are discussed in more detail later in this Section. The intention is to build the SWGs as the primary mechanism for discussing with donors proposed programs and priorities within each sector and for ensuring that appropriate funding arrangements are in place for each sectoral program. The most urgent task is to reach early agreement with donors on the proposed new approvals amounting to $126 million of projects that the Government would like to start implementing in the year ahead. In the case of Education and Training for example, Table 13 indicates that some $60 million of new proposals would require donor support over the next three years, equivalent to an average level of new commitments of $20 million a year. To the extent that some proposals do not attract donor support, the Government may have to consider alternative funding arrangements or may need to defer the start-up of the project or program. Absorptive capacities of Government agencies. The proposed program calls for disbursements from these new approvals in the amount of $32 million this year. There has been some progress in mobilizing these required new levels of support, but at this stage this estimate of new disbursements appears overly optimistic. It is unlikely that a sufficient number of these new projects can be started quickly enough to allow for this level of disbursements, even if funding agreements are in place for all activities. A substantial part of the program is technical assistance that can probably be mobilized quickly. However, there are also a number of large civil works programs involving construction and/or rehabilitation of facilities such as schools and hospitals, procurement action for which may take time. The disbursements for the current fiscal year will almost certainly be somewhat lower than projected in the current versions of the individual SIPs. In subsequent tables in this chapter, the disbursement schedules for new projects have been adjusted to reflect more realistic levels of expenditures from new projects and programs. The Government is very conscious of the fact that in some cases, proposals for increased levels of spending may only be realized if the planned improvements in capacities of the relevant agencies to manage larger programs are in fact realized. The SIPs have built in various programs to help expand these capacities, but slippage in some areas cannot be ruled out, in which case there may be a slower build up in expenditures over the medium-term. As has been the case in recent years, the Government will monitor spending capacities closely and, if need be, adjust sectoral allocations should that prove to be needed. In any event, the Government attaches a very high priority to the range of programs built into the SIPs that aim to build institutional and human capacities for effective design and implementation of public programs. The Government will want to work closely with development partners to ensure that appropriate attention is given to building implementation capacities in each of the sectors. Overall levels of donor assistance. The third area of uncertainty relates to overall levels of assistance that are likely to be available to Timor-Leste in the medium and longer term. Table 14 provides a summary of the trends in international financial support for Timor-Leste for the ten years under review in the SIPs. The main point is that there is a steady downward trend in levels of support. If UNPOL and PKF operations are excluded, total support (as measured by annual disbursements) trends down from the high of $236 million in FY2000/01 to about $106 in FY2008/09, assuming that the programs in the SIPs are implemented as proposed. If UNPOL and PKF operations are included, the peak level of assistance was $519 million in FY2000/01.

Timor-Leste: Overview of Sector Investment Programs – Volume 1 18
Type of Assistance FY1999/00 FY2000/01 FY2001/02 FY2002/03 FY2003/04 FY2004/05 FY2005/06 FY2006/07 FY2007/08 FY2008/09Development & TA on-budget Ongoing 63.0 120.6 145.7 119.1 107.9 108.2 57.7 31.7 13.6 6.4 Proposed new (adjusted) 11.0 85.0 125.0 135.0 100.0 Sub-total 63.0 120.6 145.7 119.1 107.9 119.2 142.7 156.7 148.6 106.4 Development & TA off-budget 26.6 33.6 33.4 36.7 25.8 16.3 7.7 3.0 3.1 - UN Security Council posts 13.8 8.0 7.0 Humanitarian assistance 84.1 29.7 11.8 3.4 1.8 0.9 Budget & commodity support 27.1 44.6 31.8 31.1 32.6 21.8 1.5 Donor administrative expenses 1.1 7.3 5.5 4.6 4.5 3.9 3.3 1.1 0.5 Total assistance 201.9 235.8 228.2 208.7 180.6 169.1 155.2 160.8 152.2 106.4 Memo items: UNPOL & related 33.1 51.9 45.4 26.7 15.7 5.1 UN PKF 65.6 231.1 145.0 104.4 74.7 12.9 Grand total 300.6 518.8 418.6 339.8 271.0 187.1 155.2 160.8 152.2 106.4 Source: REA Database.
Note: bilateral military assistance programs not included in these data.
Table 14: Trends in International Assistance for Timor-Leste (US$ millions)
In preparing the SIPs, the Government has looked beyond FY2006/07 to gauge, for planning purposes, possible levels of support that may be available while bearing in mind that Timor-Leste will still be classified as a low income developing country. Data published by the World Bank indicates wide variation in levels of aid per capita. After excluding post-conflict countries such as Bosnia Herzegovina and Macedonia, these data suggest upper levels of around $100 per capita per year. These higher levels are often associated with countries that have strong economic performance supported by effective development policies. A sample of eight countries that receive high levels of aid per capita, but have varying degrees of development performance yields an average of $80 per capita per year for 2000.10 For planning purposes, the Government has factored into its longer term financial planning an assumption of official assistance of $80 per capita per year. Given the population projections set out in Table 3 above (Chapter II), this suggests access to external assistance in the range of $85 million from 2010 onwards. The second point concerns the use of donor funding. The Government expects to phase out direct budgetary support during the period under review, but does want to maintain “On-budget” development and technical assistance programs in the range of $110 million a year on an approval basis through the end of the NDP period, 2002-2007. This level of support is essential for an effective transition to a more sustainable financial position and to maintain the high levels of investment needed to lay the foundations for a strong economic recovery. Beyond the Plan period, and assuming that domestic revenues improve along the lines projected, the Government anticipates some decline in levels of development and technical assistance from donors. As noted in the previous section, this assistance is assumed to run at about $80-85 million in the longer term, and as long as Timor-Leste is designated as a low developing income country. Uncertainties about petroleum revenues. Timor-Leste is subject to extremely large uncertainties about the amount of revenues that it will raise itself. The principle cause for these uncertainties concerns its petroleum revenues. Three issues in particular are important in this regard:
• First, the domestic revenues of Timor-Leste are heavily dependent on petroleum. This is despite the considerable efforts being made to expand non-petroleum revenues. While petroleum revenues are uncertain, they will probably account for about 80 to 90 percent of total revenues over the medium-term.
• Second, the only material source of petroleum revenues is from one petroleum project, the Bayu Undan field (although within the next two or three years, the Phoenix field exploration may commence).While that may change with a successful
10 The eight counties are Albania, Lao D.R., Mauritania, Mongolia, Mozambique, Namibia, Papua New Guinea and Zambia. With the exception of Mongolia and Zambia these countries all experienced strong economic growth during the 1990s that averaged almost 5% a year (on an unweighted average basis).
Timor-Leste: Overview of Sector Investment Programs – Volume 1 19
resolution of maritime boundary disputes with Australia or if new petroleum projects proceed, currently any technical or production problems with Bayu Undan have a direct effect on Timor-Leste revenues. For example, the drilling problems at Bayu Undan in late 2003 led to a dramatic fall in expected revenues. While the operating companies were subsequently able to recover from some of these problems, and rising world oil prices more than restored revenues, similar problems could occur in future. The Bayu Undan project will not be completed until the pipeline and LNG plant are built and fully operational. Risks to revenue remain particularly high until the development phase of Bayu Undan is fully completed and operations have proven to be successful.
• Third, world oil prices have been, and will continue to be extremely volatile. Over the last ten years, world oil prices per barrel have ranged from a low of about $10 in the late 1990s to a high of about $55 in 2004. For half of the last ten years the price has been below $24. With current world oil prices still around $50 there is considerable risk that they will fall again. Indeed, world oil futures markets expect the price to decline to about $45 in 2005 and to continue to decline thereafter.
Furthermore, volatility in world oil prices leads to a disproportionate change in Timor-Leste revenues. Much of this revenue is based on the profits of Bayu Undan rather than its sales. When high capital costs are considered, a 10 percent change in world oil prices could lead to a 20 or 30 percent change in Timor-Leste revenues over the medium to long term. Therefore, changes in Timor-Leste revenue will probably be even larger in percentage terms than changes in world oil prices. For these reasons, changes in Timor-Leste revenues are to be expected, though it is unclear whether these will involve higher or lower revenues, or whether the changes will be large or small. Prudent financial management suggests that the country should plan on the basis that the current very high levels of petroleum prices will not be sustained and that they will trend down in the coming years. It is for this reason that the Government intends to take a cautious approach towards the future use of periodic windfall gains from temporarily high petroleum prices. Any significant downward revisions to the petroleum revenues would require Timor-Leste and Development Partners to reconsider their development strategy for reducing poverty and reaching the MDGs in Timor-Leste.
V. MANAGING THE PROGRAM
The proposed program for accelerated growth and steady progress towards the NDP and MDG objectives will not be without difficulties, given the daunting task in the immediate future of building the capacities of national institutions and staff to manage successfully the changing development requirements of the country. It will require strong support from our Development Partners, including continued access to expertise and advice on the successes and failures in development in other countries around the world. Given the importance of CFET funding for capital expenditures, it will also require a major build up in capacities of national staff to manage the identification, design and implementation of these capital development programs. It will require changes in the management of development programs that are responsive to the changing circumstances and capacities of the country. THE TRANSITION FROM DEPENDENCE ON TFET Management of the program over the medium-term will require flexibility in adjusting funding arrangements to the changing circumstances of the country. In this period, the TFET operation as

Timor-Leste: Overview of Sector Investment Programs – Volume 1 20
we know it today will come to a close. Moreover, within a few years the Government expects to discontinue reliance on direct support of the kind that is currently provided under the TSP program. Other mechanisms will be required for the provision of development assistance over the medium- and longer-term, given that the Government expects that in time an increasingly large share of the ongoing partner assistance will be used for capital investments of one kind or another. The Government has already opened a dialogue with donors regarding the transition from TFET and in that connection several options have been tabled. The Government would like to continue these discussions with the donor community and reach agreement on the mechanisms that will be needed for the medium and longer term. Guidelines need to be developed to facilitate close cooperation and clear understandings between Development Partners and the Government regarding options for funding. The following outlines some of the key considerations for these discussions. First, given that the Government expects to continue to rely on some form of program support for several more years, the current TSP arrangements would continue to be used to channel donor resources direct to the budget, within a new perspective – that of Consolidation – and within the scope of the recently adopted Consolidation Support Programme I (CSP I). This mechanism would continue to be used to establish benchmarks for performance related to the formulation and implementation of policies, and to program design and implementation. Second, to facilitate the transition from TFET, the Government foresees reliance on three mechanisms for the delivery of those aid resources that are not channeled through the TSP program. These would be applicable to specific projects and program assistance:
• One is to continue to rely on established mechanisms for the design and implementation of individual bilateral and multilateral projects and programs. Under these arrangements, our partners are expected to give close attention to the priorities for projects and programs as articulated in the SIPs and align their support with these activities. In these cases, the donors would continue to assume primary responsibility for the design and execution of each program, in close consultation and coordination with the relevant ministry that is the agreed domestic counterpart.
• The second possible mechanism will be increased reliance on existing cofinancing arrangements among development partners. Under these arrangements, the Government would look to the Asian Development Bank, UN agencies and the World Bank to act as executing agent on behalf of those donors who, for one reason or another, don’t wish to take on the task of identifying, designing and implementing particular projects. The UN Agencies and the World Bank have already been active in using this mechanism. The Government would want to explore with its partners further possible use on such arrangements on a case by case basis.
• A third possible mechanism would be a variant of the already established cofinancing mechanism. Under this third option, a particular partner may act as executing agent on behalf of one or more other partners. But the Government of Timor-Leste would assume greater responsibilities for the design and management of the project, while working very closely with the partner designated as the executing agent. The responsible Government agency would play a major role in project design, in drawing up procurement procedures, in undertaking environmental and other assessments as necessary, and in oversight and supervision of project implementation, along with the many other activities typically associated with the project cycle. Under these arrangements the agency within the Government who is responsible for the project would be expected to play an active role in making decisions on the release of funds that might be held in a special project account. The objective under this mechanism is to accelerate the training of national staff in all
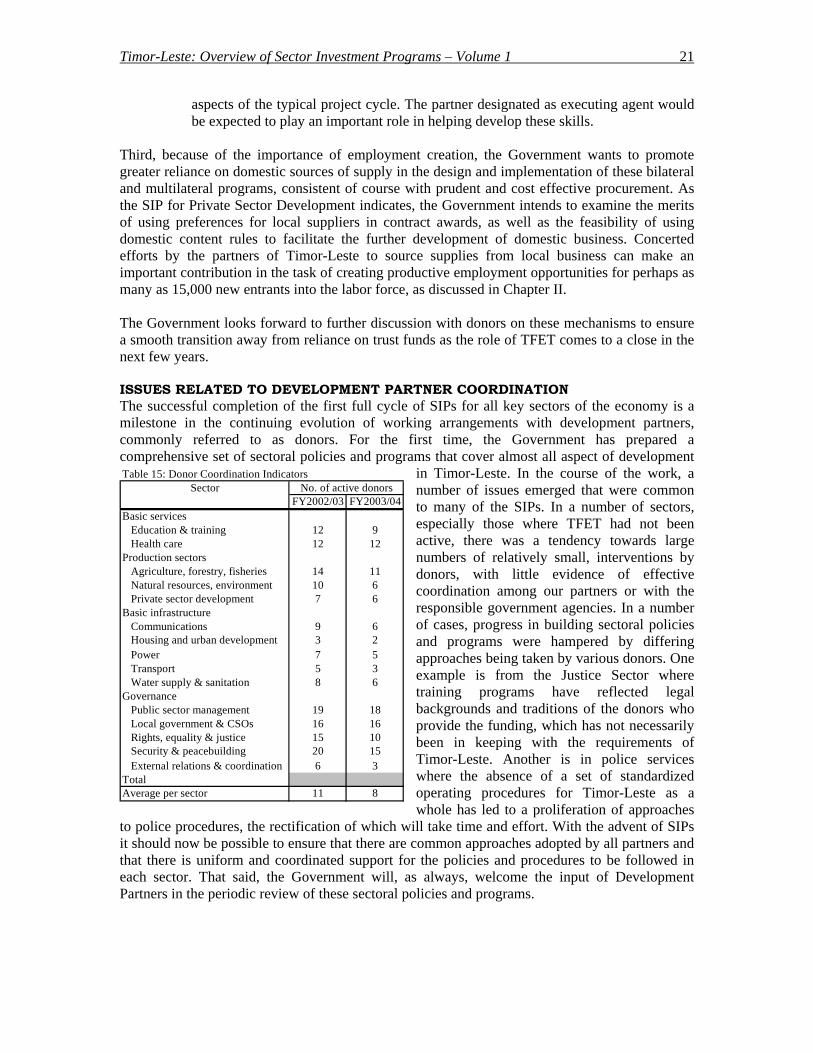
Timor-Leste: Overview of Sector Investment Programs – Volume 1 21
aspects of the typical project cycle. The partner designated as executing agent would be expected to play an important role in helping develop these skills.
Third, because of the importance of employment creation, the Government wants to promote greater reliance on domestic sources of supply in the design and implementation of these bilateral and multilateral programs, consistent of course with prudent and cost effective procurement. As the SIP for Private Sector Development indicates, the Government intends to examine the merits of using preferences for local suppliers in contract awards, as well as the feasibility of using domestic content rules to facilitate the further development of domestic business. Concerted efforts by the partners of Timor-Leste to source supplies from local business can make an important contribution in the task of creating productive employment opportunities for perhaps as many as 15,000 new entrants into the labor force, as discussed in Chapter II. The Government looks forward to further discussion with donors on these mechanisms to ensure a smooth transition away from reliance on trust funds as the role of TFET comes to a close in the next few years. ISSUES RELATED TO DEVELOPMENT PARTNER COORDINATION The successful completion of the first full cycle of SIPs for all key sectors of the economy is a milestone in the continuing evolution of working arrangements with development partners, commonly referred to as donors. For the first time, the Government has prepared a comprehensive set of sectoral policies and programs that cover almost all aspect of development
in Timor-Leste. In the course of the work, a number of issues emerged that were common to many of the SIPs. In a number of sectors, especially those where TFET had not been active, there was a tendency towards large numbers of relatively small, interventions by donors, with little evidence of effective coordination among our partners or with the responsible government agencies. In a number of cases, progress in building sectoral policies and programs were hampered by differing approaches being taken by various donors. One example is from the Justice Sector where training programs have reflected legal backgrounds and traditions of the donors who provide the funding, which has not necessarily been in keeping with the requirements of Timor-Leste. Another is in police services where the absence of a set of standardized operating procedures for Timor-Leste as a whole has led to a proliferation of approaches
to police procedures, the rectification of which will take time and effort. With the advent of SIPs it should now be possible to ensure that there are common approaches adopted by all partners and that there is uniform and coordinated support for the policies and procedures to be followed in each sector. That said, the Government will, as always, welcome the input of Development Partners in the periodic review of these sectoral policies and programs.
Table 15: Donor Coordination IndicatorsSector
FY2002/03 FY2003/04Basic services Education & training 12 9 Health care 12 12Production sectors Agriculture, forestry, fisheries 14 11 Natural resources, environment 10 6 Private sector development 7 6Basic infrastructure Communications 9 6 Housing and urban development 3 2 Power 7 5 Transport 5 3 Water supply & sanitation 8 6Governance Public sector management 19 18 Local government & CSOs 16 16 Rights, equality & justice 15 10 Security & peacebuilding 20 15 External relations & coordination 6 3TotalAverage per sector 11 8
No. of active donors
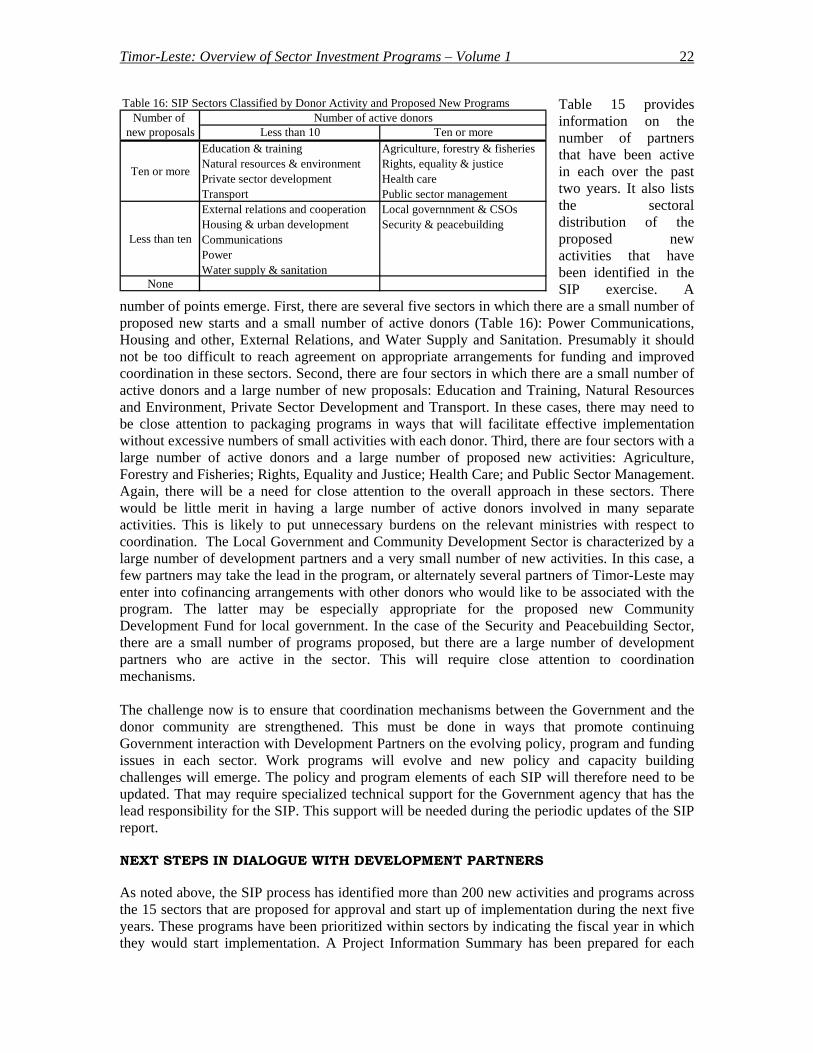
Timor-Leste: Overview of Sector Investment Programs – Volume 1 22
Table 15 provides information on the number of partners that have been active in each over the past two years. It also lists the sectoral distribution of the proposed new activities that have been identified in the SIP exercise. A
number of points emerge. First, there are several five sectors in which there are a small number of proposed new starts and a small number of active donors (Table 16): Power Communications, Housing and other, External Relations, and Water Supply and Sanitation. Presumably it should not be too difficult to reach agreement on appropriate arrangements for funding and improved coordination in these sectors. Second, there are four sectors in which there are a small number of active donors and a large number of new proposals: Education and Training, Natural Resources and Environment, Private Sector Development and Transport. In these cases, there may need to be close attention to packaging programs in ways that will facilitate effective implementation without excessive numbers of small activities with each donor. Third, there are four sectors with a large number of active donors and a large number of proposed new activities: Agriculture, Forestry and Fisheries; Rights, Equality and Justice; Health Care; and Public Sector Management. Again, there will be a need for close attention to the overall approach in these sectors. There would be little merit in having a large number of active donors involved in many separate activities. This is likely to put unnecessary burdens on the relevant ministries with respect to coordination. The Local Government and Community Development Sector is characterized by a large number of development partners and a very small number of new activities. In this case, a few partners may take the lead in the program, or alternately several partners of Timor-Leste may enter into cofinancing arrangements with other donors who would like to be associated with the program. The latter may be especially appropriate for the proposed new Community Development Fund for local government. In the case of the Security and Peacebuilding Sector, there are a small number of programs proposed, but there are a large number of development partners who are active in the sector. This will require close attention to coordination mechanisms.
Number of new proposals Less than 10 Ten or more
Ten or more
Education & training Natural resources & environment Private sector development Transport
Agriculture, forestry & fisheries Rights, equality & justice Health care Public sector management
Less than ten
External relations and cooperation Housing & urban development Communications Power Water supply & sanitation
Local governnment & CSOs Security & peacebuilding
None
Number of active donorsTable 16: SIP Sectors Classified by Donor Activity and Proposed New Programs
The challenge now is to ensure that coordination mechanisms between the Government and the donor community are strengthened. This must be done in ways that promote continuing Government interaction with Development Partners on the evolving policy, program and funding issues in each sector. Work programs will evolve and new policy and capacity building challenges will emerge. The policy and program elements of each SIP will therefore need to be updated. That may require specialized technical support for the Government agency that has the lead responsibility for the SIP. This support will be needed during the periodic updates of the SIP report. NEXT STEPS IN DIALOGUE WITH DEVELOPMENT PARTNERS As noted above, the SIP process has identified more than 200 new activities and programs across the 15 sectors that are proposed for approval and start up of implementation during the next five years. These programs have been prioritized within sectors by indicating the fiscal year in which they would start implementation. A Project Information Summary has been prepared for each

Timor-Leste: Overview of Sector Investment Programs – Volume 1 23
activity and program. These summaries give details about the activity, including for example, objectives for the program, the Government agency responsible for the program, start-up dates, and disbursement activities. The total amount of the proposed new approvals adds to about $550 million. The Government would give priority to early agreement with donors on the approximate $130 million of new approvals proposed for the year ahead. A process of consultation has already been launched to achieve this objective. Not all of these proposals would necessarily be implemented as separate projects and programs. The expectation is that a number of the smaller activities would be packaged into larger programs and projects within each sector. A simple example: there are several separate activities listed for the Prisons program. The Government would like to agree with a donor on a single Prisons Project that includes all components. In some cases, there may be a need to package programs across sectors to ensure appropriate coordination of activities among sectors. An example may be some of the watershed protection activities that involve a number of different agencies. In the event that some of the high priority programs are not funded by our partners in FY2004/05, various adjustments may be required in the program or alternate arrangements made for their funding. Moreover, there are many important cross-sectoral linkages among these programs. Steps are being taken as part of the SIP program to strengthen inter-agency coordination in the design and implementation of programs among sectors. Examples include timely support from the Water and Sanitation Sector for new school construction programs, close collaboration between the programs that expand access to safe water and the Health Ministry. NEXT STEPS IN THE SIP PROCESS The Government has benefited from the preparation of these SIPs in a variety of ways and intends to strengthen and broaden the process. The SIP process will be continued. It will be used to guide decisions on resource allocations for the medium term by building the results of the work into the budget and other planning activities of the Government. A number of initiatives are already underway or are being planned:
• Under TSP III the Government has committed itself to the development of a combined resources budget for FY2005/06. The integration of the SIPs with the combined resources budget is central to the Government’s efforts to have at its disposal an integrated framework that will allow informed decision making on the deployment of both CFET and donor resources in pursuit of agreed development objectives.
• Additional work is needed to review and refine a number of the proposed development benchmarks for the medium-term that have been built into the draft SIPs. Such reviews will focus on development of institutional and financial capacities to achieve these targets, and in some cases whether there is a need for more aggressive progress towards key objectives identified in the SIPs.
• Closely related to ongoing assessments of the financial costs of various programs, is the need to improve the reliability of information on the unit costs for delivery of various government services. Many of the historical data currently available are heavily influenced by the inclusion of expensive expatriate labor services in the cost estimates. More work is needed to improve the reliability of these cost estimates.
• The SIP exercise has also been hampered by incomplete information about the assets of the country the upkeep and management of which is the responsibility of the Government. These include various types of equipment, facilities such as schools and hospitals, and infrastructure such as roads and ports. Incomplete information has
Timor-Leste: Overview of Sector Investment Programs – Volume 1 24
hampered efforts to determine appropriate allowance for maintenance and capital replacement expenditures. Steps are to be taken to address this problem.
Formation of sector working groups. The SIP process has highlighted the need to strengthen capacities within the Government for longer term strategic planning across various sectors that integrates concerns about the growth and movement of the population, with the provision of economic opportunities, basic services and national security. The Government intends to take steps to strengthen these capacities. As a first step, the Government has begun the formation of Sector working Groups (SWGs) for some or all sectors. These working groups to be chaired by a senior Government official and are open to any donor who has an interest in the particular sector. Sector Working Groups for the Health Care, Agriculture and Basic Infrastructure have already been formally established. The Government expects the formal establishment of the SWG for Education and Training by May 2005, followed by the gradual establishment of the remaining groups within this calendar year. The responsibilities of the groups will evolve in the light of experience, but are expected to range from informal advice to the agencies of Government that are responsible for the sector in question to a more wide-ranging role. The groups will have the onerous task of mobilizing the necessary resources to carry out the proposed SIP program, and at the same time ensure coordination of activities within the sector. The role of the group might be further enhanced by asking donors with ongoing programs in the sector to share lessons learned from their programs that can in turn be used to improve the design and execution of proposed new programs and projects. Each working group would also assist in various ways with the periodic updating of the SIP for their sector. Given their critical role in driving the SIP process, extensive support will be needed from the donor community to ensure the success of these groups. One of the biggest challenges for the Government is strengthening the role and function of the secretariat within each SWG. Some SWGs will require technical support in the initial establishment phase of the secretariat, as well additional equipment and materials to assist the work of the SWG. The Government foresees that some sectors will also require the services of short-term technical consultants on annual basis to update the existing SIP reports; however technical support may also be needed during the course of the year for other important activities discussed within the SWG. Within the next few months the SWGs, with the assistance of the Ministry of Planning and Finance, will actively seek funding support from the development partner community to strengthen the role and function of the SWGs. Increased attention to monitoring and evaluation in each sector. In reviewing various drafts of the SIPs, a number of donors have made the point that there was discussion of the arrangements needed within each sector for monitoring and evaluation (M&E) of progress towards goals and objectives. This was not an oversight on the part of the Government, but stemmed from a decision early in the SIP process to defer serious M&E work for each sector until the goals, objectives and programs were clearly established and agreed upon within government. With the release of the final versions of the SIPs, the Government believes that the basis now exists for serious work on the detailed definition of an M&E framework for each sector. The issue of monitoring and evaluation of sector objectives should be discussed within the respective SWGs. To ensure a fully effective system of M&E, the government is of the opinion that thorough discussions must be conducted before actual implementation of an M&E system for each sector. Such discussions will need to provide a consensus on what indicators are to be used, how information for each indicator will be collected (from surveys, or from periodic reporting by civil servants, for example), the frequency with which data will be collected, the assignment among government
Timor-Leste: Overview of Sector Investment Programs – Volume 1 25
agencies for the collection, storage and analysis of these data, related training programs and the costs of such M&E programs. The development partners involved in these sectors will be expected to guide the SWG in this issue and provide the necessary institutional support to ensure its effectiveness. It is proposed that a pilot initiative for the design and implementation of an M&E system be developed within one SWG as soon as possible. Experience with the development of this pilot can then be transferred to other sectors. The Government would welcome the support of one or more partners for this pilot initiative.
Timor-Leste: Overview of Sector Investment Programs – Volume 1 26
PART C: ANNEXES ANNEX I. AN INTRODUCTION TO THE SIP PROCESS THE ANALYTICAL FRAMEWORK The framework developed for the SIP process has three components: (i) a strategic analytical model with projections to 2015; (ii) SIPs for each of 15 sectors of the economy that, taken together, cover the activities of the Executive Branch of Government and the Judiciary.; and (iii) brief summaries for each of the proposed new programs and activities identified in the SIPs. In addition, two other SIPs are currently being prepared. The SIP for Pillars of the State will deal with other key institutions of the country, including the Office of the President, the National Parliament, the Office of the Prime Minister, the Council of Ministers, and the Bank Payments Authority. The focus of the other SIP, which is titled Social, Civil and Heritage Protection, is on providing support to those sections of the population identified as most in need of special assistance or social protection. It also includes the need for civil protection in the event of small-scale periodic or seasonal adverse events, or large-scale unpredictable adverse events. These two SIPs will be completed within the next few months, after which the results will be incorporated into the overall SIP framework. An integrated strategic framework has been developed to anchor the entire SIP exercise to key parameters such as population, GDP, labor force, and likely aggregate levels of CFET and development partner spending. The SIP strategic framework includes projections to 2015 for GDP by sector, population, including the numbers of people by age group and by sex category, urban and rural population, farm and non-farm labor force, and likely aggregate CFET and the resource availabilities of our partners. The demographic components of the model are all linked thereby ensuring a consistent set of projections for population, labor force and rural-urban migration. The fifteen sectors for which SIPs have already been prepared are grouped around four main themes A. Provision of basic services 1. Education and training 2. Health care B. Support for the production sectors 3. Agriculture, forestry & fisheries 4. Natural resources & environment 5. Private sector development C. Development of infrastructure services 6. Communications and housing 7. Housing and Urban Development 8. Power 9. Transport 10. Water supply and sanitation D. Strengthening governance 11. Public sector management 12. Local government & civil society
13. Rights, equality and justice 14. Security, peacebuilding & reconciliation 15. External relations and cooperation

Timor-Leste: Overview of Sector Investment Programs – Volume 1 27
Preparation of the individual SIPs was done in a progressive fashion, with experience from the initial phases of the work being used to strengthen subsequent analysis and support inter-agency discussions on sectoral priorities and linkages. Key points about the process used to prepare the individual SIPs are as follows:
• Each SIP includes a statement of goals and objectives for the sector as set forth in the Constitution, the NDP or the MDG framework. Where practical, these have been translated into specific performance benchmarks. For example, all the MDG targets for 2015 are included in the framework, along with targets for 2007 and 2010.
• Each SIP includes the existing or proposed policy framework for the sector, and a review of the major challenges facing the sector.
• A proposed sector work program for the medium-term is outlined in each SIP, along with ongoing and proposed new expenditures required to implement the work program. Where possible, estimates of expenditures are based on information about the unit costs of service delivery, capital replacement and maintenance costs of public infrastructure and other assets. These provided a basis for estimating the expenditures needed to meet specific targets for 2007 for such things as school enrolments, connections to safe water, and other indicators.
• Ongoing and proposed new expenditures of donors and CFET are included in the analysis, thereby ensuring that the expenditure framework is presented on a combined resources basis.
The SIP exercise has identified more than 200 high priority program and project activities that are proposed for funding and implementation over the next three years. The estimated cost of each activity is included in the sectoral expenditure framework, along with information for all ongoing activities. Within each sector, these proposed new activities have been prioritized by designating the year in which implementation would begin. Brief descriptions have been prepared for each activity. These individual activities can be readily fed into ongoing mechanisms that focus on likely donor and CFET funding. COVERAGE AND SOURCES FOR INFORMATION The SIPs include a large number of development and performance indicators and estimates of unit costs for delivery of various services. These data have been drawn from a variety of sources including the provision results of the 2004 census, and various surveys undertaken in 2001, 2002 and 2003 with the help of development partners. Where required information was not available, estimates have been made. The SIPs have also drawn heavily on the vision of the NDP and the recently published report on MDG targets for Timor-Leste.11 However, in almost all sectors, the ministries and agencies concerned have been constrained by the absence of agreed performance and service delivery targets for the medium-term. Individual agencies have begun to address the problem in the SIP exercise by formulating benchmarks and targets for 2007 and 2010 wherever practical. While the SIP exercise has helped address this gap in the planning framework, more work remains to be done in this regard. These fifteen sectors account for the entire CFET budget, except for allocations to the Office of the President and the National Parliament. Similarly, they account for the majority of the development and technical assistance, as well as budget support, provided by Development Partners. Not included in the expenditure analysis, unless otherwise indicated, is humanitarian 11 Government of Timor-Leste and United Nations, Timor-Leste: Millennium Development Goals Report, February 2004.

Timor-Leste: Overview of Sector Investment Programs – Volume 1 28
and emergence assistance and the bilateral programs of military assistance that are provided by several donors. Complete information is not currently available for the bilateral military assistance programs. Expenditure data have been provided by the Ministry of Planning and Finance. Unless otherwise specified, these data are drawn from two sources. CFET budget appropriations data have been provided by the Budget Office for FY2001/02 onwards. CFET data for FY1999/00 and FY2000/01 are rough estimates based on aggregate data for CFET expenditures included in the National Development Plan. Information about external assistance to Timor-Leste that is included in the reports is obtained from the Registry of External Assistance (REA) database of the Ministry of Planning and Finance. Data for external assistance are as of December 31, 2004. These data have been made available through the generous cooperation of Timor-Leste’s Development Partners. Development partner data has been supplemented with information provided by individual government agencies that have responsibilities for particular partner-funded projects and programs. The information about these programs includes assistance channeled by donors through international and local NGOs, as well as programs implemented directly by individual donors. Some data provided by donors is provisional and subject to change as work on individual projects and programs progresses. The data presented in these reports covers capital and recurrent expenditures and therefore aims to present a total picture of development spending in Timor-Leste. However, as the report indicates, information on these two categories is incomplete in a number of areas. Estimates are based on the limited information that was available for individual activities and programs.

Timor-Leste: Overview of Sector Investment Programs – Volume 1 29
ANNEX II: POPULATION CHARACTERISTICS AND PROJECTIONS
A guiding principle for the Sector Investment Program (SIP) exercise was the use of a common set of demographic data across all sectors to ensure comparability and consistency on all matters related to the population of Timor-Leste. The purpose of this Annex is to describe briefly the basis for the population projections used in the SIP exercise. The preliminary population projections were prepared by the Direcção Nacional de Estatistica. The SIP exercise required six broad sets of information about the population of the country:
• Total population, with projections to 2015 • Current and projected age structure of the population • Male and female composition of the population • Current and projected urban and rural population • Current and projected number of urban and rural households. • Current and projected labor force.
The “Preliminary” status of these projections must be emphasized. These are a first set of projections, based on the information available in January 2005; the projections will be revised at a later time. The most important constraint is the currently available data. Provisional results from the 2004 Population and Housing Census were used as the starting point, but these will be replaced by the final Census results. Additionally, for the three key demographic variables; fertility (births), mortality (deaths) and migration, the data available for Timor-Leste are still limited and uncertain. It is important that users understand that these population projections are neither predictions nor forecasts. They present the statistical outcomes of the selected assumptions about demographic factors that underlie population change. Many non-demographic factors are excluded from the projection assumptions, including the possibility of future catastrophic events such as epidemics, natural disasters and conflict. Nonetheless, these preliminary projections do provide a useful indication of the possible population for Timor-Leste up until 2015. This is particularly the case for the age groups above 11 years, because the people who will be in these ages in 2015 were born before the 2004 Census, and the majority will remain at younger ages where few deaths occur. The projections for ages 11 and under are less reliable, because these depend on assumptions about future fertility, and to a lesser extent infant and child mortality. Methodology for the projections The base population was taken from provisional data from the 2004 Census of Population and Housing, including population by single year of age and sex, urban and rural population, and male/female labour force participation and farm/non-farm occupations. The projections used a cohort component methodology, by single year of age, so that the impact of the current age structure is fully taken into account. Age-specific fertility and mortality rates for Timor-Leste were derived by applying international model fertility patterns and life tables to the assumed total fertility rate (TFR) and crude death rate (CDR). The projection for each year was derived by ageing the years population forward by one year with births estimated by applying age-specific fertility rates to the female population in the childbearing ages (15-49), and deaths estimated by applying male and female age-specific death rates to the entire population. In addition to the main population projection, preliminary projections were also made for sub-populations of importance, including the urban/rural population, the labour force, and farm/non

Timor-Leste: Overview of Sector Investment Programs – Volume 1 30
farm occupations. These sub-projections are simple extrapolations based on assumptions about total rates that have been applied to the total population. There has been no allowance for age patterns that would apply to migration, labour force participation, and farm/non farm occupations. Assumptions used in projections Fertility and mortality. Recent estimates for both fertility and mortality in Timor-Leste have shown a wide range, leaving uncertainty about the current level and even the future direction for these key demographic factors. For the projection of population, a TFR of 6.3 and CDR of 15 per thousand were assumed, levels that are near the middle range of the recent estimates, and plausible given the rates from other low income countries in recent years. To illustrate the outcome of maintaining high fertility and mortality levels, no change was assumed for both fertility and mortality through to 2015, although small shifts in the TFR and the crude rates occur from applying constant age specific rates to a changing age structure. Migration. Zero external migration was assumed throughout. Urban and rural population growth. The urban population was projected by assuming an urban population annual growth rate 2.2 percent higher than the projected annual national population growth rate. The assumption implies steady rural to urban migration, in line with the experience of most developing countries. The rural population was derived by subtracting the urban projection from the total. Household size. Urban and rural household numbers were projected using the projected populations and assuming average household sizes of 5.5 persons for urban and 4.6 persons for rural households. Labour force participation. The future growth of the labour force projection was based upon the projected populations in the working ages (15-64 years) and labour force participation rates of 48.1 percent for females and 69.3 percent for males, as indicated by provisional census data. These participation rates were assumed for the entire 2004-2015 projection period.12 The number of farm and non-farm workers is assumed to grow in line with the rural and urban population growth rates.
12 There is some basis for thinking that these participation rates may be too low, or may rise in the future. The assumed levels are substantially lower than those for comparable developing countries. The World Development Indicators 2002 reports the average participation rate in low income developing countries in 2000 was 95 percent for males and 59 percent for females, with an overall average participation rate of 80 percent for all low income countries.
Timor-Leste: Overview of Sector Investment Programs – Volume 1 31
ANNEX III: PROSPECTS FOR PRIVATE SECTOR DEVELOPMENT WHAT ARE THE PROSPECTS FOR PRIVATE SECTOR GROWTH? The private sector currently accounts for about $220 million, or about two-thirds of GDP. The agricultural sector accounts for almost half of the private output in the economy. The extent to which private investment can be increased over the next five years depends on business opportunities and the enabling environment for investment. The make-up of the non-agricultural private sector is changing rapidly now as investors who focused on donor-funded reconstruction business are winding down, or changing the focus of their activities. The Government believes that there are significant opportunities in a number of areas. Vigorous investment promotion could lead to increased domestic and international investment in tourism, commercial development of natural resources and increased agricultural surpluses for domestic and export markets. A carefully targeted and aggressive promotional program could lift the level of private investment to about 8% of GDP by 2008, with aggregate investment in the range of 28% of GDP. In combination with close attention to policies and measures that supported the domestic construction industry and increased local procurement on government account, the outlook for growth in the non-farm production, incomes and farm employment would be considerably enhanced. Nonetheless, creating enough employment in the non-farm private sector to absorb the large number of new entrants each year will be a major challenge. With appropriate supporting policies, private sector growth could make a significant contribution to employment creation. As the foregoing discussion highlights, the construction sector can make an important contribution to employment creation, as can sub-contracting arrangements related to Government procurement. There are attractive possibilities for employment creation in the construction sector, and the financial sector as service coverage expands and in the tourism sector. Increased emphasis on outsourcing government procurement to local suppliers can also contribute to employment growth. These domestic programs are likely to be supplemented with an overseas workers program. In the year ahead the Government plans to start an overseas workers program. While no final agreements have been reached, a program that sends 1,000 laborers a year would take some pressures from the domestic market and would likely result in an important inflow of remittances from abroad, thereby boosting domestic demand. POTENTIAL FOR COMMERCIAL AGRICULTURE Timor-Leste is a predominantly rural economy with a majority of the population dependent on agriculture for their livelihood. Agriculture, forestry and fisheries currently accounts for about 30 percent of GDP and provides a livelihood for about 720,000 people or about 77 percent of the population. Although agriculture is the main employer and contributor for private sector non-oil GDP it is characterized by a system of subsistence production. There are approximately 160,000 rural households, at least 70,000 of which are engaged in subsistence farming, producing no saleable surplus, and generating no non-farm income. Approximately 70,000 rural households produced saleable surplus – mainly rice and coffee. Coffee is the main commercial industry within the sector, accounting for $7 million of the $8 million of exports in 2004. The main market player is “Cooperative Café Timor (CCT)” which is organized under a cooperative system of production “Cooperatives of Organic Coffee”. Timorese organic coffee has reached an important position in world organic coffee market.
Timor-Leste: Overview of Sector Investment Programs – Volume 1 32
Timor-Leste has approximately 600,000 hectares of land suitable for crop and livestock production, with 67,000 hectares said to be suitable for wetland rice and 160,000 hectares suitable for other field crops. The remainder is suitable for grazing cattle and goats. Emphasis to date has been on the rehabilitation of irrigation schemes as the primary means of realizing agricultural production gains. Irrigation schemes in Timor-Leste are essentially small "run-of -the -river" schemes. Because of the nature of the terrain and the rainfall pattern the numerous rivers are basically large storm water drains. It is essential to carry out feasibility studies to determine the possibilities regarding the construction of reservoirs for storing substantial amounts of water for irrigation during the dry season. Most community level irrigation systems are small, frequently covering an irrigable area of around 100 hectares. Maintenance is a chronic problem with river-in-flood damage and siltation the main reasons for damage. Historically, farmers in Timor-Leste have been unable or unwilling to maintain these schemes, relying on government and donors for maintenance and, eventually, rehabilitation. There are some 420 schemes in total, of which only about 10 have modest water storage and thus the potential to produce two crops a year. There is agronomic potential to increase rice production and to introduce other high value crops in rehabilitated irrigation schemes. Intensification of production, resulting from improved water use efficiency will be dependent on effective extension programs, access to credit and improved technology and will include moves towards farm mechanization. Further exploitation of this potential is hampered by lack of reliable access to markets for surpluses, which need to be competitive in price and quality with imports. Significant post-harvest losses, sometimes as high as 40 percent, are common for rice (and other crops such as maize). Poor processing of rice, mainly because of poorly maintained and outmoded machines, often results in poorer prices because of high levels of cracked and broken grain. Improved milling efficiency and reduced post-harvest losses have the potential to make a rapid impact on rice availability and some impact on prices. Similarly reduced post-harvest losses in rice and maize through improved storage can improve food supplies by up to 30%. Reducing post harvest losses of food crops through proven and simple technology offers one of the fastest ways of improving food security and self reliance. The total area cultivated for crops falls well short of the potential and may only be some 80 percent of the area judged to be suitable for cropping, either alone or in association with livestock farming. It is generally agreed that the potential exists to increase crop, pasture and livestock production in three ways: (i) expansion in the area cultivated; (ii) more intensive use of land; and (iii) increased productivity in production systems. However, the exploitation of this potential must take account of uncertainties stemming from uneven rainfall and droughts. The mountainous topography results in a diversity of microclimates that affects production levels and types of crops grown. This diversity adds complexity to the design of programs and information services aimed at boosting farm productivity. However, the dominant influence on the slow rate of actual productivity growth has been lack of access to functioning markets, which were severely disrupted during 1999. Restricted market access translates into weak incentives for farmers to adopt improved practices or to increase output above subsistence levels. Anecdotal evidence from several projects suggests that many farmers are willing and able to increase production but can see little incentive to do so because of low prices, high input costs and market-related uncertainties. Unrealistic expectations about prices for rice, resulting from long experience of government purchases at fixed prices, are also reported to be a problem as farmers adjust slowly to the new competitive marketing environment. It seems that livestock numbers generally have returned to pre-independence levels with the exception of goats. Goats currently number about 85,000 compared with quoted figures of well
Timor-Leste: Overview of Sector Investment Programs – Volume 1 33
over 200,000 in 1997-1998 and in 1972. Timor Leste is considered to have the potential to support over 400,000 ruminants (cattle, buffalo, goats and sheep), compared with about 350,000. There is potential for increasing the livestock production, with possible development for exportation of live cattle. It is expected that the increase in numbers will be accompanied by an equivalent improvement in the grazing fields, so as to ensure sustainability. This is not a new practice as the occurrence of roadside and living fences (Leucaena in particular) is common. There is potential for additional development and integration of forager leguminous plants within the production systems. Given the importance of dry-season paddy land to livestock production, there may be scope to consider irrigated pasture in some areas in the future. This might be incorporated into work on existing farming systems or as a component in forestry programs. If there is not a parallel development of cut and carry forages, an animal population of more than 400,000 ruminants, 400,000 pigs (and horses) and over 600,000 chickens and ducks, may be unsustainable. There is ample evidence in other areas in the region to show that improved fodder can improve animal growth rates by at least 50 percent and may have at least as significant an impact on productivity as vaccination programs. However, it is recognized that efforts to introduce forage improvements will be limited by the degree to which farmers are constrained by the security of land tenure. The programs for development of commercial agriculture are outlined in Chapter I of Volume II and therefore will not be included here. Suffice to say that the primary investment opportunities in areas related to agriculture include commercial crops to meet domestic demand and in some cases, replace imports, post harvesting processing, storage and marketing, agricultural exports, and food processing. The SIP for Agriculture, Forestry and Fisheries identifies a number of specific opportunities, including expansion of the coconut oil industry to replace imported vegetable, increased production under irrigation, honey production for domestic and export markets, edible bamboos shoots that might be the basis for a canning industry aimed at export markets, and specialty export crops such as vanilla. There may also be prospects for meat and poultry production. There are also prospects for development of forest products industries that center on revival of the sandalwood industry and on specialty products such as rattan for furniture making. The greatest challenge in the fisheries sector is the need to develop a legal framework for the sustainable management of the resources and to develop an effective monitoring, control and management of the surveillance systems to encourage domestic and external investment so as to obtain substantial benefits for the country. There has also been some interest shown in the investment on fishery operations, and the Ministry will begin to issue fishery licences within a very limited scale, for the seas of Timor, implementing at the same time the monitoring of catches and a surveillance system, so as to start the collection of data on the state of resources, as well as fishery activities. CONSTRUCTION ACTIVITIES AS A SOURCE OF EMPLOYMENT Policies and programs for the construction industry are of particular interest at this time because of their potential for job creation. Construction activities grew rapidly during the 1999-2002 period, but with investment expenditures are declining in Timor-Leste from the extraordinary levels that prevailed during 2000-2002 there was some slowdown in construction during 2003. There are no precise estimates at this stage for the civil works component of planned capital spending for the next four years. However, the SIP for Private Sector Development includes a rough estimate of the total value of construction work that may be undertaken during the next five years under the assumption that the proposed expenditure programs in the various SIPs could be funded and implemented. The estimate includes new construction as well as maintenance expenditures on roads and public buildings, including education and health care facilities and makes a small allowance for other public and private construction activities (for example, housing and so on). This is a significant market that provides an important opportunity for
Timor-Leste: Overview of Sector Investment Programs – Volume 1 34
business development and job creation, especially with labour intensive methods of construction, repair and maintenance. The challenge will be to ensure that the majority of this work goes to local contractors and, where appropriate, uses labour intensive methods of construction. As noted earlier, there has been progress over the past four years in developing a domestic construction industry, but realizing this employment potential will require further concerted action. These include policies that encourage development partners to subcontract to the maximum extent feasible the civil works components of their aid programs to local contractors/businesses. Another option is to adopt a set of procurement rules that give generous preferences to local contractors and foreign contractors bid on Government tenders and that have partnerships with local contractors. Besides vocational and technical training in order to increase productivity of the work force, one of the constraints for local business is access to machinery and equipment. The development of a leasing industry that provides access to construction equipment at reasonable cost would strengthen the capacity of small firms to compete more effectively. MANUFACTURES AND SERVICES Investment in production of manufactures has, to date, been very limited. Most domestic needs are met from imports. There has been a reasonable level of investment in trading businesses, both formal trading houses in Dili as well as sizable, but less formal trading businesses along the border with West Timor. There has been disinvestment in restaurants targeting internationals, and investment in hotels and guesthouses has leveled off. There are growing indications of increased private sector capacities in a number of areas of manufacturing, including as furniture, tais weaving, tailoring or bakeries as well as in services like business services and consulting, information technology and vehicle and electrical repair. One potential avenue for further development of domestic business relates to Government spending on goods and services. Currently planned CFET appropriations suggest that the Government will spend a total of $125 million on various services and $70 million on supplies and equipment over the next four years, or about $50 million a year. (These estimates exclude fuel imports, construction and building maintenance.) At the time that the SIPs were prepared information was not available on the extent to which these goods and services are tendered to the private sector and the extent to which domestic business is successful in winning tenders. A high proportion of the services required can be provided locally (maintenance of equipment and vehicles, for example), and perhaps some of the supplies can also be sourced locally, with modest amounts of value added as a result of local processing or preparation. The growth in spending on these items is projected in the budget at about six percent a year, or about $2-3 million a year. The issue is the extent to which a growing share of these expenditures can be channeled to the local market. Even if the import content of some of the required goods and services is high, there may still be scope for using Government procurement to foster domestic business activities in ways that adds some value and thereby create employment. One example is the development of a domestic furniture industry using local materials that can meet the needs of the school system, as well as private demand. A number of other governments have used “domestic content” rules in the public procurement of goods and services. The purpose is to require the successful bidders to add value domestically through training and employment of staff/labour and use of some locally made products, where suitable supplies are available PETROLEUM AND MINING The potential of the Timor Sea Project is well known and need not be recounted here. The Project is expected to generate substantial revenues from royalties and corporate taxes for an extended period. There has also been a long history of onshore petroleum exploration in Timor-Leste, with

Timor-Leste: Overview of Sector Investment Programs – Volume 1 35
the first series of wells being drilled during 1900-1914. Despite the long history of exploration, not much is known about the onshore and near-shore potential, in part because the Government does not have access to records from the exploratory drilling. Non-commercial quantities of oil and gas were recovered from a number of wells drilled, with more than 20 wells having been capped. In addition, over 30 oil or gas seepages have been documented along the southern coast, suggesting further reserves in the area. In 2001 the Timor Oil Company which had carried out much of the exploration during 1910-1975 submitted a proposal for some $67 million of onshore and near-shore exploration and development work. An unsolicited proposal related to the gas seeps was also received from the Independent Oil and Gas Joint Venture. The willingness of these investors to make additional sizable investments in exploration suggests that the country may have important onshore and near shore reserves suitable for commercial development. The Government has commissioned additional survey work to obtain up-to-date and reliable assessments of these resources before entering into discussions with potential investors who may wish to undertake exploration programs. Commercial development of onshore resources would offer significant opportunities for the further development of a range of domestic businesses. FINANCIAL SECTOR DEVELOPMENT Although a better understanding of the overall national demand for banking and financial services is needed, it is already clear that further development of the financial sector will be essential for sustained growth of the private business sector. The reconstitution of the financial sector is still at an early stage in Timor-Leste, having experienced a major contraction following the departure of Indonesia in 1999.13 An important feature of the period was that savings far exceeded lending.14 There was a demand for safe institutional arrangements for savings. In the aftermath of the referendum, Timor-Leste was left with four functional credit unions and no commercial banks. Three commercial banks have begun operations, but the services are largely confined to major urban centers, namely Dili. Outstanding credits totaled $43 million at end March 2004, and total deposits of private and non-financial public companies stood at $75 million. Several other foreign banks have expressed interest in obtaining banking licenses. There has been no investment in non-banking parts of the financial sector, including leasing, insurance and other services. Work on establishing these financial services needs to be expedited. It is expected that the legislation in the insurance and banking areas now undergoing consultation will foster development of the non-banking financial sector. Banking services also need to be re-established in rural areas. The ADB (and other Development Partners) have provided support for the development of microfinance services organizations and for the institutional development of aspects of the financial sector. Training of lenders and lending staff is expected to help ensure that micro-enterprises and small businesses have maximum ability to access formal credit. In the course of preparing the master plan for development of postal services, proposals were developed to extend the range of services to be provided through postal outlets, including postal banking services that provide cash and demand accounts, payments capabilities and certain approved lending.
13 Prior to the referendum, Timor-Leste was served by 18 banking units, including five branches of Indonesian state banks, 10 regional development banks and 3 Indonesian private banks. Bank Rakyat operated a number of village banks that provided general savings and loan services at the village level. Moreover, some 27 credit unions were in operation at that time. 14 In early 1999, savings accounts totaled $68 million whereas loans outstanding amounted to only $18 million.

Timor-Leste: Overview of Sector Investment Programs – Volume 1 36
PRIVATE PARTICIPATION IN INFRASTRUCTURE With the major reconstruction phase over, the Government feels there is a need to consider additional ways of encouraging private participation in infrastructure. The 15-year BOT franchise with Timor Telecom is operational and the EDTL management contract became effective at the beginning of 2004. Other possible involvement of private investors in infrastructure services might extend to ports as a way of financing expansion and improvements without drawing on the national budget. There is also opportunity for investment in private land and property that may, in due course, be divested by Government, as well as in carbon reducing investments in the energy sector through which the Government may derive income. Further private participation in infrastructure to support foreign direct investment might also need to be considered. TOURISM DEVELOPMENT The tourism sector in Timor-Leste has considerable potential with a large range of high value tourism products. Investment by private businesses will be the key driver of growth in this sector. Private investments in the tourism sector, especially by dive and tour operators and hotels, seem to have grown in the period since Independence, apparently often taking the form of expansion of existing businesses. Further development of the tourism sector, even of modest proportions, has the potential to deliver considerable national development benefits, particularly as a source of employment creation. The Government intends to take active role in promoting tourism and assisting private sector operators to develop the potential of this important economy. The Government has already, under its own budget, reviewed the potential scope of tourism in Timor-Leste, engaged support from Portugal, Australia, Thailand, Macau (PR China) and worked with the private sector to establish the Tourism Association of Timor-Leste. Also the World Tourism Organization is ready to develop a Project for “Sustainable Tourism Sector Development and Institutional Strengthening” (National Tourism Development Plan) coming out with a short, medium and long term policy for tourism (This project is now being reviewed by the Office of the Prime Minister office and will be funded by WTO and UNDP.) The Government would like to build on these efforts, with a focus on supporting infrastructure development, statistics, policy and regulatory development, planning and zoning, and by underwriting national promotion efforts in support of private operators. The key objective is to build a tourism industry that generates employment, is sensitive to environmental concerns and maintains culture.

Timor-Leste: Overview of Sector Investment Programs – Volume 1 37
ANNEX IV. PROJECTIONS FOR THE STRATEGIC FRAMEWORK
Indicator 2004 2005 2006 2007 2008 2009 2010 2011 2012 2013 2014 2015Population Males 470,343 483,416 497,035 511,305 526,268 541,614 557,333 573,609 590,512 608,207 626,288 644,810 Females 454,119 466,770 479,975 493,775 508,213 522,983 538,107 553,746 569,974 586,957 604,271 622,007 Total 924,462 950,187 977,009 1,005,080 1,034,481 1,064,597 1,095,440 1,127,355 1,160,486 1,195,164 1,230,559 1,266,817
Population Growth Rate (%) 2.8 2.8 2.9 2.9 2.9 2.9 2.9 2.9 3.0 3.0 2.9 Crude Birth Rate (per 000) 41.8 41.9 42.1 42.5 42.6 42.4 42.4 42.6 43.0 43.0 42.8 Crude Death Rate (per 000) 15.0 14.7 14.5 14.4 14.6 14.6 14.5 14.5 14.4 14.6 14.6 Total Fertility rate 6.3 6.3 6.3 6.3 6.3 6.3 6.3 6.3 6.3 6.3 6.3
Births (annual) 39,747 40,894 42,289 43,917 45,320 46,429 47,786 49,441 51,355 52,868 54,204 Deaths (annual) 13,956 14,196 14,487 15,140 15,567 15,860 16,291 16,668 17,410 17,929 18,319
Population distribution Urban 206,155 216,463 227,373 238,947 251,236 264,120 277,629 291,873 306,923 322,900 339,622 357,160 Rural 718,307 733,724 749,636 766,133 783,246 800,476 817,811 835,482 853,563 872,264 890,936 909,657 Total 924,462 950,187 977,009 1,005,080 1,034,481 1,064,597 1,095,440 1,127,355 1,160,486 1,195,164 1,230,559 1,266,817 Urban population (% of total) 22.3 22.8 23.3 23.8 24.3 24.8 25.3 25.9 26.4 27.0 27.6 28.2 Urban growth rate (%) 5.0 5.0 5.1 5.1 5.1 5.1 5.1 5.2 5.2 5.2 5.2 Rural-Urban migration 4,571 4,800 5,042 5,298 5,571 5,856 6,156 6,472 6,806 7,160 7,531 Rural-Urban migration rate (%) 0.6 0.6 0.7 0.7 0.7 0.7 0.7 0.8 0.8 0.8 0.8 Number of households Urban 37,776 39,665 41,664 43,785 46,037 48,398 50,873 53,484 56,241 59,169 62,233 65,447 Rural 157,167 160,540 164,021 167,631 171,375 175,145 178,938 182,805 186,761 190,853 194,938 199,034 Total 194,943 200,205 205,686 211,416 217,412 223,543 229,812 236,288 243,002 250,022 257,171 264,481 Average size of households Urban 5.5 5.5 5.5 5.5 5.5 5.5 5.5 5.5 5.5 5.5 5.5 5.5 Rural 4.6 4.6 4.6 4.6 4.6 4.6 4.6 4.6 4.6 4.6 4.6 4.6 Overall average 4.7 4.7 4.8 4.8 4.8 4.8 4.8 4.8 4.8 4.8 4.8 4.8
Age distribution of population < 1 years 29,746 34,886 35,893 37,118 38,546 39,778 40,751 41,942 43,395 45,075 46,403 47,576 1-5 years 147,938 149,215 153,092 155,140 159,934 167,783 177,237 182,810 188,553 194,524 200,754 207,068 6-11 years 150,655 157,628 157,049 165,667 167,460 170,037 170,329 176,448 181,015 183,975 189,850 198,596 12-14 years 70,844 66,614 75,133 69,937 78,701 74,892 79,299 77,484 80,691 84,819 88,395 87,762 15-17 years 58,290 62,613 62,761 70,348 66,143 74,604 69,446 78,145 74,365 78,739 76,937 80,122 18-25 years 125,815 131,256 137,145 143,899 150,637 156,744 163,084 164,594 172,970 176,569 183,820 188,699 26-49 years 236,430 241,386 247,187 253,290 261,557 263,536 273,136 281,921 291,258 301,314 306,167 315,403 50-64 years 72,700 73,077 76,065 76,212 78,475 80,920 85,321 87,162 91,805 93,218 100,574 100,729 65 and over 32,045 33,511 32,685 33,470 33,028 36,304 36,835 36,849 36,435 36,932 37,659 40,863 Total 924,462 950,187 977,009 1,005,080 1,034,481 1,064,597 1,095,440 1,127,355 1,160,486 1,195,164 1,230,559 1,266,817 Source: National Statistics Directorate
Annex Table 1: Projection of Population with Constant Fertility and Mortality Rates
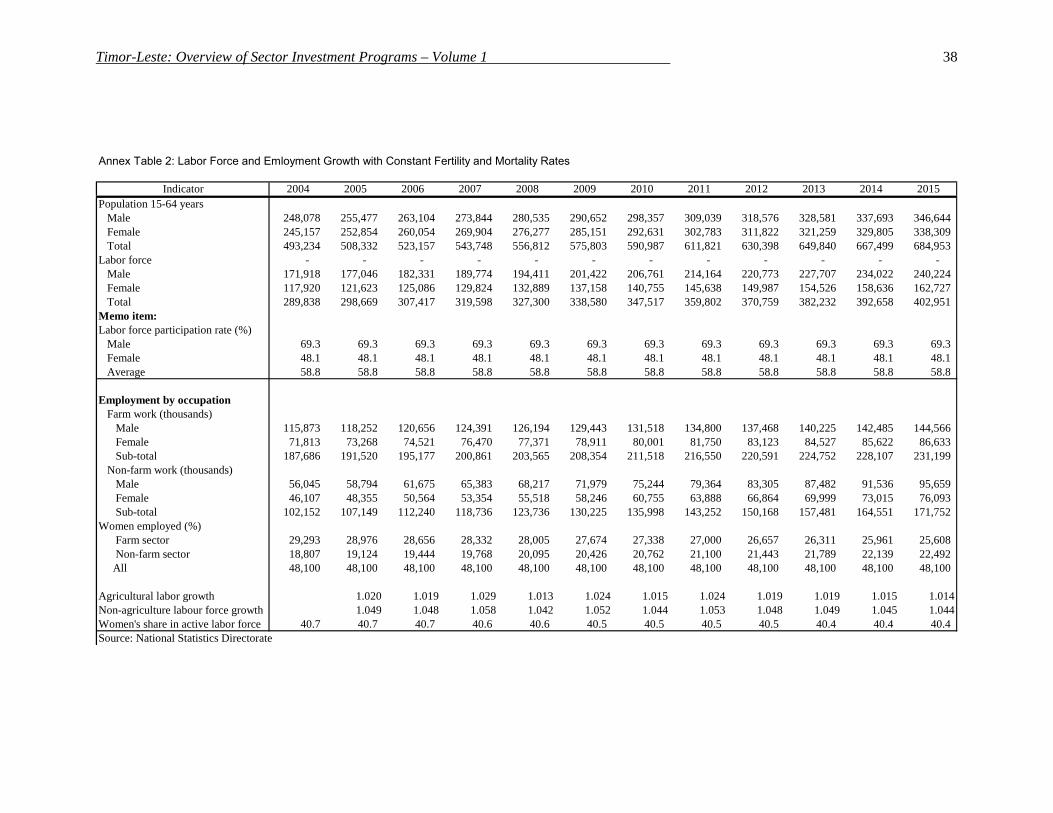
Timor-Leste: Overview of Sector Investment Programs – Volume 1 38
Indicator 2004 2005 2006 2007 2008 2009 2010 2011 2012 2013 2014 2015Population 15-64 years Male 248,078 255,477 263,104 273,844 280,535 290,652 298,357 309,039 318,576 328,581 337,693 346,644 Female 245,157 252,854 260,054 269,904 276,277 285,151 292,631 302,783 311,822 321,259 329,805 338,309 Total 493,234 508,332 523,157 543,748 556,812 575,803 590,987 611,821 630,398 649,840 667,499 684,953 Labor force - - - - - - - - - - - - Male 171,918 177,046 182,331 189,774 194,411 201,422 206,761 214,164 220,773 227,707 234,022 240,224 Female 117,920 121,623 125,086 129,824 132,889 137,158 140,755 145,638 149,987 154,526 158,636 162,727 Total 289,838 298,669 307,417 319,598 327,300 338,580 347,517 359,802 370,759 382,232 392,658 402,951 Memo item:Labor force participation rate (%) Male 69.3 69.3 69.3 69.3 69.3 69.3 69.3 69.3 69.3 69.3 69.3 69.3 Female 48.1 48.1 48.1 48.1 48.1 48.1 48.1 48.1 48.1 48.1 48.1 48.1 Average 58.8 58.8 58.8 58.8 58.8 58.8 58.8 58.8 58.8 58.8 58.8 58.8
Employment by occupation Farm work (thousands) Male 115,873 118,252 120,656 124,391 126,194 129,443 131,518 134,800 137,468 140,225 142,485 144,566 Female 71,813 73,268 74,521 76,470 77,371 78,911 80,001 81,750 83,123 84,527 85,622 86,633 Sub-total 187,686 191,520 195,177 200,861 203,565 208,354 211,518 216,550 220,591 224,752 228,107 231,199 Non-farm work (thousands) Male 56,045 58,794 61,675 65,383 68,217 71,979 75,244 79,364 83,305 87,482 91,536 95,659 Female 46,107 48,355 50,564 53,354 55,518 58,246 60,755 63,888 66,864 69,999 73,015 76,093 Sub-total 102,152 107,149 112,240 118,736 123,736 130,225 135,998 143,252 150,168 157,481 164,551 171,752 Women employed (%) Farm sector 29,293 28,976 28,656 28,332 28,005 27,674 27,338 27,000 26,657 26,311 25,961 25,608 Non-farm sector 18,807 19,124 19,444 19,768 20,095 20,426 20,762 21,100 21,443 21,789 22,139 22,492 All 48,100 48,100 48,100 48,100 48,100 48,100 48,100 48,100 48,100 48,100 48,100 48,100
Agricultural labor growth 1.020 1.019 1.029 1.013 1.024 1.015 1.024 1.019 1.019 1.015 1.014Non-agriculture labour force growth 1.049 1.048 1.058 1.042 1.052 1.044 1.053 1.048 1.049 1.045 1.044Women's share in active labor force 40.7 40.7 40.7 40.6 40.6 40.5 40.5 40.5 40.5 40.4 40.4 40.4 Source: National Statistics Directorate
Annex Table 2: Labor Force and Emloyment Growth with Constant Fertility and Mortality Rates
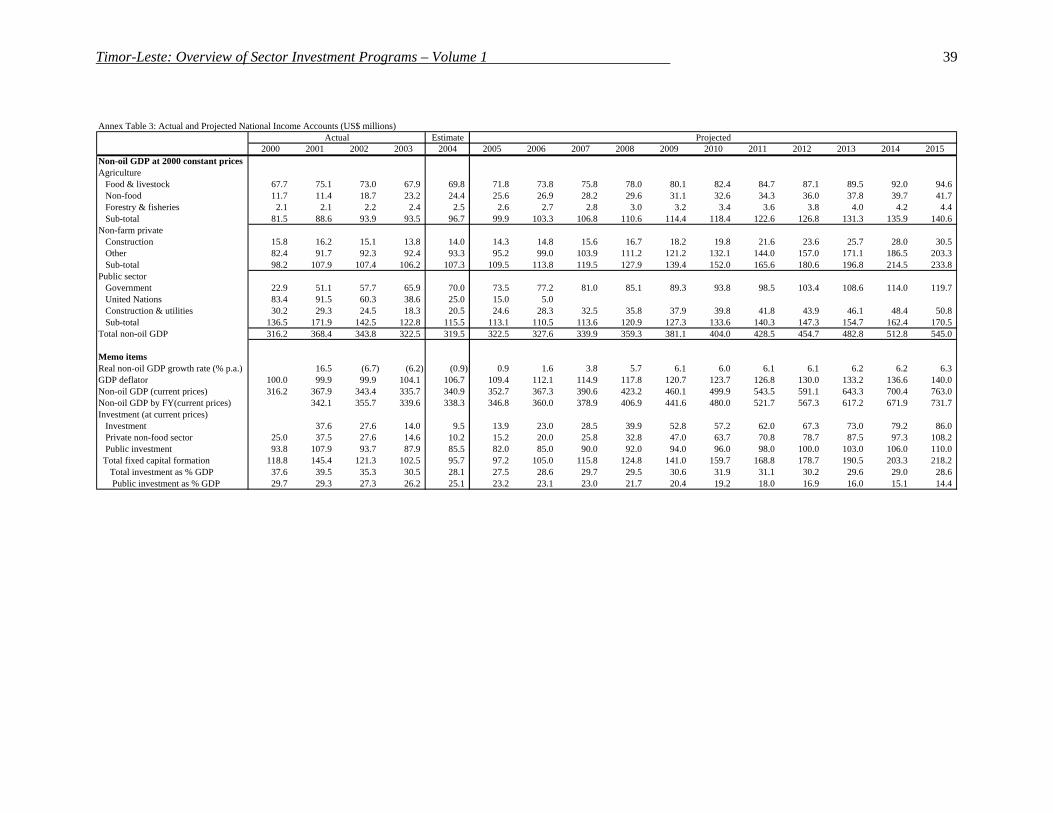
Timor-Leste: Overview of Sector Investment Programs – Volume 1 39
Annex Table 3: Actual and Projected National Income Accounts (US$ millions)Estimate
2000 2001 2002 2003 2004 2005 2006 2007 2008 2009 2010 2011 2012 2013 2014 2015Non-oil GDP at 2000 constant pricesAgriculture Food & livestock 67.7 75.1 73.0 67.9 69.8 71.8 73.8 75.8 78.0 80.1 82.4 84.7 87.1 89.5 92.0 94.6 Non-food 11.7 11.4 18.7 23.2 24.4 25.6 26.9 28.2 29.6 31.1 32.6 34.3 36.0 37.8 39.7 41.7 Forestry & fisheries 2.1 2.1 2.2 2.4 2.5 2.6 2.7 2.8 3.0 3.2 3.4 3.6 3.8 4.0 4.2 4.4 Sub-total 81.5 88.6 93.9 93.5 96.7 99.9 103.3 106.8 110.6 114.4 118.4 122.6 126.8 131.3 135.9 140.6 Non-farm private Construction 15.8 16.2 15.1 13.8 14.0 14.3 14.8 15.6 16.7 18.2 19.8 21.6 23.6 25.7 28.0 30.5 Other 82.4 91.7 92.3 92.4 93.3 95.2 99.0 103.9 111.2 121.2 132.1 144.0 157.0 171.1 186.5 203.3 Sub-total 98.2 107.9 107.4 106.2 107.3 109.5 113.8 119.5 127.9 139.4 152.0 165.6 180.6 196.8 214.5 233.8 Public sector Government 22.9 51.1 57.7 65.9 70.0 73.5 77.2 81.0 85.1 89.3 93.8 98.5 103.4 108.6 114.0 119.7 United Nations 83.4 91.5 60.3 38.6 25.0 15.0 5.0 Construction & utilities 30.2 29.3 24.5 18.3 20.5 24.6 28.3 32.5 35.8 37.9 39.8 41.8 43.9 46.1 48.4 50.8 Sub-total 136.5 171.9 142.5 122.8 115.5 113.1 110.5 113.6 120.9 127.3 133.6 140.3 147.3 154.7 162.4 170.5 Total non-oil GDP 316.2 368.4 343.8 322.5 319.5 322.5 327.6 339.9 359.3 381.1 404.0 428.5 454.7 482.8 512.8 545.0
Memo itemsReal non-oil GDP growth rate (% p.a.) 16.5 (6.7) (6.2) (0.9) 0.9 1.6 3.8 5.7 6.1 6.0 6.1 6.1 6.2 6.2 6.3 GDP deflator 100.0 99.9 99.9 104.1 106.7 109.4 112.1 114.9 117.8 120.7 123.7 126.8 130.0 133.2 136.6 140.0 Non-oil GDP (current prices) 316.2 367.9 343.4 335.7 340.9 352.7 367.3 390.6 423.2 460.1 499.9 543.5 591.1 643.3 700.4 763.0 Non-oil GDP by FY(current prices) 342.1 355.7 339.6 338.3 346.8 360.0 378.9 406.9 441.6 480.0 521.7 567.3 617.2 671.9 731.7 Investment (at current prices) Investment 37.6 27.6 14.0 9.5 13.9 23.0 28.5 39.9 52.8 57.2 62.0 67.3 73.0 79.2 86.0 Private non-food sector 25.0 37.5 27.6 14.6 10.2 15.2 20.0 25.8 32.8 47.0 63.7 70.8 78.7 87.5 97.3 108.2 Public investment 93.8 107.9 93.7 87.9 85.5 82.0 85.0 90.0 92.0 94.0 96.0 98.0 100.0 103.0 106.0 110.0 Total fixed capital formation 118.8 145.4 121.3 102.5 95.7 97.2 105.0 115.8 124.8 141.0 159.7 168.8 178.7 190.5 203.3 218.2 Total investment as % GDP 37.6 39.5 35.3 30.5 28.1 27.5 28.6 29.7 29.5 30.6 31.9 31.1 30.2 29.6 29.0 28.6 Public investment as % GDP 29.7 29.3 27.3 26.2 25.1 23.2 23.1 23.0 21.7 20.4 19.2 18.0 16.9 16.0 15.1 14.4
Actual Projected
![DEMOCRATIC REPUBLIC OF TIMOR-LESTE Decree …migracao.gov.tl/pdf/[0503-04]31-2008ORGANICSTRUCTUREMinDef-EN… · Republic of Timor-Leste. Thus, ... in jeopardy; k) To develop civic](https://img.dokumen.tips/doc/110x75/5ad109027f8b9a4e7a8e9f70/democratic-republic-of-timor-leste-decree-0503-0431-2008organicstructuremindef-enrepublic.jpg)