Embed Size (px)
Citation preview

Timor-Leste
Demographic andHealth Survey 2009-10
Timor-Leste 2009-10
Dem
ographic and Health Survey

�������
Timor-Leste Demographic and Health Survey
2009-10
National Statistics Directorate Ministry of Finance
Democratic Republic of Timor-Leste Dili, Timor-Leste
ICF Macro Calverton, Maryland, U.S.A.
December 2010

This report summarizes the findings of the 2009-10 Timor-Leste Demographic and Health Survey (TLDHS) carried out by the National Statistics Directorate of the Ministry of Finance. ICF Macro provided financial and technical assistance for the survey through the USAID-funded MEASURE DHS program, which is designed to assist developing countries to collect data on fertility, family planning, and maternal and child health. Financial support was provided by USAID, the Government of Australia (AusAID), the Government of Ireland (Irish AID), the United Nations Population Fund (UNFPA), the United Nations Children’s Fund (UNICEF), the United Nations Development Fund (UNDP), and the World Health Organization (WHO). UNFPA supported the survey with administrative, logistical, and technical assistance. The opinions expressed in this report are those of the authors and do not necessarily reflect the views of USAID or donor organizations. Additional information about the 2009-2010 TLDHS may be obtained from the National Statistics Directorate, P.O. Box 10, Timor-Leste; Telephone: (977-1) 670-3339527; Internet: www.dne.mof.gov.tl. Additional information about the MEASURE DHS program may be obtained from MEASURE DHS, ICF Macro, 11785 Beltsville Drive, Suite 300, Calverton, MD 20705, U.S.A.; Telephone: 1-301-572-0200; Fax: 1-301-572-0999; Email: [email protected]. Suggested citation: National Statistics Directorate (NSD) [Timor-Leste], Ministry of Finance [Timor-Leste], and ICF Macro. 2010. Timor-Leste Demographic and Health Survey 2009-10. Dili, Timor-Leste: NSD [Timor-Leste] and ICF Macro.

Contents | iii
CONTENTS
TABLES AND FIGURES .............................................................................................................. ix FOREWORD ........................................................................................................................... xvii ACKNOWLEDGMENTS ........................................................................................................... xix CONTRIBUTORS TO THE REPORT ........................................................................................ xxi SUMMARY OF FINDINGS ..................................................................................................... xxiii MILLENNIUM DEVELOPMENT GOAL INDICATORS ............................................................ xxxi MAP OF TIMOR-LESTE ......................................................................................................... xxxii CHAPTER 1 INTRODUCTION
1.1 History, Geography, and Economy ..................................................................... 1 1.1.1 History.................................................................................................... 1 1.1.2 Geography .............................................................................................. 2 1.1.3 Economy ................................................................................................ 2
1.2 Population .......................................................................................................... 3 1.3 Population and Reproductive Health Policies and Programs ................................ 3 1.4 Objectives of the Survey ..................................................................................... 4 1.5 Organization of the Survey ................................................................................. 5 1.6 Sample Design .................................................................................................... 5
1.6.1 Sampling Frame ...................................................................................... 5 1.6.2 Sample Selection .................................................................................... 5
1.7 Questionnaires ................................................................................................... 6 1.8 Hemoglobin Testing ............................................................................................ 7 1.9 Pretest, Training, and Fieldwork .......................................................................... 7
1.9.1 Pretest .................................................................................................... 7 1.9.2 Training .................................................................................................. 7 1.9.3 Fieldwork ............................................................................................... 8
1.10 Data Processing .................................................................................................. 8 1.11 Response Rates ................................................................................................... 8
CHAPTER 2 HOUSEHOLD POPULATION AND HOUSING CHARACTERISTICS
2.1 Household Population by Age and Sex ............................................................. 11 2.2 Household Composition ................................................................................... 12
2.2.1 Children’s Living Arrangements and Orphanhood ................................. 13 2.2.2 School Attendance by Survivorship of Parents ....................................... 14
2.3 Educational Attainment of Household Members ............................................... 15 2.3.1 Grade Repetition and Dropout Rates .................................................... 20
2.4 Housing Characteristics ..................................................................................... 22 2.5 Household Durable Goods ............................................................................... 26 2.6 Wealth Quintiles .............................................................................................. 27 2.7 Birth Registration .............................................................................................. 28

iv | Contents
CHAPTER 3 CHARACTERISTICS OF RESPONDENTS
3.1 Characteristics of Survey Respondents .............................................................. 31 3.2 Educational Attainment and Literacy ................................................................. 32 3.3 Access to Mass Media ....................................................................................... 36 3.4 Employment ..................................................................................................... 38
3.4.1 Employment Status ............................................................................... 38 3.4.2 Occupation .......................................................................................... 41 3.4.3 Earnings, Employers, and Continuity of Employment ............................. 43
3.5 Knowledge and Attitudes Concerning Tuberculosis ........................................... 44 3.6 Use of Tobacco ................................................................................................ 46
CHAPTER 4 FERTILITY
4.1 Current Fertility ................................................................................................ 49 4.2 Fertility Differentials .......................................................................................... 50 4.3 Fertility Trends .................................................................................................. 52 4.4 Children Ever Born and Surviving ...................................................................... 54 4.5 Birth Intervals ................................................................................................... 55 4.6 Age at First Birth ............................................................................................... 56 4.7 Adolescent Pregnancy and Motherhood ........................................................... 57
CHAPTER 5 FAMILY PLANNING
5.1 Knowledge of Contraceptive Methods .............................................................. 60 5.2 Knowledge of Contraceptive Methods by Background Characteristics ............... 61 5.3 Ever Use of Contraception ................................................................................ 62 5.4 Current Use of Contraception ........................................................................... 64 5.5 Trend in Current Use of Contraception ............................................................. 66 5.6 Current Use of Contraception by Background Characteristics ............................ 66 5.7 Number of Children at First Use of Contraception ............................................ 68 5.8 Knowledge of Fertile Period .............................................................................. 69 5.9 Timing of Female Sterilization ........................................................................... 70 5.10 Source of Modern Contraception Methods ....................................................... 70 5.11 Payment of Fees for Modern Contraceptive Methods ........................................ 71 5.12 Informed Choice .............................................................................................. 71 5.13 Future Use of Contraception ............................................................................. 72 5.14 Reasons for Non-use of Contraception in the Future ......................................... 73 5.15 Preferred Method of Contraception for Future Use ........................................... 73 5.16 Exposure to Family Planning Messages .............................................................. 74 5.17 Contact of Non-users with Family Planning Providers ........................................ 75 5.18 Husband’s Knowledge of Wife’s Use of Contraception ..................................... 76
CHAPTER 6 OTHER PROXIMATE DETERMINANTS OF FERTILITY
6.1 Current Marital Status ....................................................................................... 79 6.2 Polygyny ........................................................................................................... 80 6.3 Age at First Marriage ......................................................................................... 81 6.4 Age at First Sexual Intercourse .......................................................................... 83 6.5 Recent Sexual Activity ....................................................................................... 85 6.6 Postpartum Amenorrhea, Abstinence, and Insusceptibility ................................ 88 6.7 Menopause ...................................................................................................... 89

Contents | v
CHAPTER 7 FERTILITY PREFERENCES
7.1 Desire for More Children .................................................................................. 91 7.2 Desire to Limit Childbearing by Background Characteristics .............................. 92 7.3 Need for Family Planning Services .................................................................... 94 7.4 Ideal Family Size ............................................................................................... 95 7.5 Fertility Planning ............................................................................................... 97
CHAPTER 8 INFANT AND CHILD MORTALITY
8.1 Definition, Data Quality, and Methodology ...................................................... 99 8.2 Assessment of Data Quality............................................................................... 99 8.3 Levels and Trends in Infant and Child Mortality .............................................. 100 8.4 Socioeconomic Differentials in Mortality ......................................................... 102 8.5 Demographic Characteristics and Child Mortality ............................................ 103 8.6 Perinatal Mortality .......................................................................................... 105 8.7 High-Risk Fertility Behavior ............................................................................. 106
CHAPTER 9 ADULT AND MATERNAL MORTALITY
9.1 Data Quality Analysis ...................................................................................... 109 9.2 Adult Mortality ............................................................................................... 111 9.3 Maternal Mortality .......................................................................................... 111
CHAPTER 10 MATERNAL HEALTH
10.1 Antenatal Care ................................................................................................ 113 10.2 Number and Timing of Antenatal Visits ........................................................... 115 10.3 Components of Antenatal Care ....................................................................... 115 10.4 Tetanus Toxoid Vaccination ............................................................................ 117 10.5 Knowledge of Danger Signs During Pregnancy ................................................ 118 10.6 Delivery Care ................................................................................................. 119
10.6.1 Place of Delivery ................................................................................ 119 10.6.2 Assistance during Delivery .................................................................. 121
10.7 Newborn Care ................................................................................................ 122 10.7.1 Knowledge of Danger Signs for Newborns .......................................... 122 10.7.2 Care for Umbilical Cord ...................................................................... 123 10.7.3 Drying and Bathing of Newborns ........................................................ 125
10.8 Timing of First Postnatal Checkup ................................................................... 126 10.9 Type of Provider of First Postnatal Checkup .................................................... 127 10.10 Problems in Accessing Health Care ................................................................. 128
CHAPTER 11 CHILD HEALTH
11.1 Child’s Size at Birth ......................................................................................... 131 11.2 Vaccination Coverage ..................................................................................... 132 11.3 Trends in Vaccination Coverage ...................................................................... 135 11.4 Acute Respiratory Infection ............................................................................. 136 11.5 Fever .............................................................................................................. 137

vi | Contents
11.6 Diarrheal Disease ........................................................................................... 139 11.6.1 Incidence and Treatment of Diarrhea ................................................. 139 11.6.2 Feeding Practices ................................................................................ 141
11.7 Knowledge of ORS Packets ............................................................................. 143 11.8 Stool Disposal ................................................................................................. 144
CHAPTER 12 NUTRITION OF CHILDREN AND WOMEN
12.1 Nutritional Status of Children .......................................................................... 147 12.1.1 Nutritional Status of Children .............................................................. 147 12.1.2 Trends in Children’s Nutritional Status ................................................ 151
12.2 Initiation of Breastfeeding ............................................................................... 153 12.3 Breastfeeding Status by Age ............................................................................ 154 12.4 Duration and Frequency of Breastfeeding ....................................................... 156 12.5 Types of Complementary Foods ...................................................................... 157 12.6 Infant and Young Child Feeding (IYCF) Practices ............................................. 158 12.7 Anemia in Children ........................................................................................ 160 12.8 Micronutrient Intake among Children ............................................................. 162 12.9 Nutritional Status of Women .......................................................................... 165 12.10 Foods Consumed by Mothers ......................................................................... 166 12.11 Micronutrient Intake among Mothers .............................................................. 167 12.12 Prevalence of Anemia in Women ................................................................... 170
CHAPTER 13 MALARIA
13.1 Mosquito Nets ................................................................................................ 174 13.1.1 Ownership of Mosquito Nets .............................................................. 174 13.1.2 Use of Mosquito Nets by Children ...................................................... 175 13.1.3 Use of Mosquito Nets by Women ....................................................... 176 13.1.4 Prevalence and Management of Childhood Malaria ............................ 178
CHAPTER 14 HIV/AIDS-RELATED KNOWLEDGE, ATTITUDES, AND BEHAVIOR
14.1 Knowledge of HIV/AIDS and of Transmission and Prevention Methods ........... 182 14.1.1 Knowledge of AIDS............................................................................. 182 14.1.2 Knowledge of HIV Prevention Methods .............................................. 183 14.1.3 Comprehensive Knowledge of HIV Transmission ................................ 184
14.2 Attitudes toward People Living with HIV/AIDS ................................................ 187 14.3 Risky Behaviors ............................................................................................... 189
14.3.1 Multiple Sexual Partners and Higher-risk Sexual Intercourse ............... 189 14.3.2 Paid Sex ............................................................................................. 190
14.4 Knowledge of HIV Testing .............................................................................. 191 14.5 Male Circumcision .......................................................................................... 193 14.6 Reports of Recent Sexually Transmitted Infections .......................................... 193 14.7 Prevalence of Medical Injections ..................................................................... 195

Contents | vii
14.8 HIV/AIDS-related Knowledge and Behavior among Youth ............................... 197 14.8.1 Comprehensive Knowledge about HIV/AIDS and Source for Condoms 197 14.8.2 Age at First Sex and Condom Use at First Sexual Intercourse ............... 199 14.8.3 Recent Sexual Activity among Never-married Youth ........................... 201 14.8.4 Drunkenness during Sex among Young Adults .................................... 201
CHAPTER 15 WOMEN’S EMPOWERMENT AND DEMOGRAPHIC AND HEALTH
OUTCOMES
15.1 Employment and Form of Earnings.................................................................. 203 15.2 Control Over and Relative Magnitude of Women’s Earnings ........................... 204 15.3 Control Over Men’s Cash Earnings .................................................................. 206 15.4 Women’s Participation in Decisionmaking ...................................................... 208 15.5 Attitudes toward Wife Beating ........................................................................ 213 15.6 Attitudes toward Refusing Sex with Husband .................................................. 216 15.7 Current Use of Contraception by Women’s Status .......................................... 222 15.8 Ideal Family Size and Unmet Need by Women’s Status .................................. 222 15.9 Reproductive Health Care by Women’s Status ................................................ 224
CHAPTER 16 DOMESTIC VIOLENCE
16.1 Measurement of Violence ............................................................................... 226 16.1.1 The Use of Valid Measures of Violence ............................................... 226 16.1.2 Ethical Considerations ......................................................................... 227 16.1.3 Special Training for Implementing the Domestic Violence Module ...... 227 16.1.4 Characteristics of the Sub-sample of Respondents for the Domestic
Violence Module ................................................................................ 228
16.2 Experience of Domestic Violence by Women ................................................. 228 16.3 Perpetrators of Physical Violence Against Women ........................................... 230 16.4 Women’s Experience of Force at Sexual Initiation ........................................... 231 16.5 Experience of Sexual Violence and Perpetrators of Sexual Violence ................ 231 16.6 Experience of Different Types of Violence ...................................................... 233 16.7 Violence during Pregnancy ............................................................................. 233 16.8 Marital Control ............................................................................................... 234 16.9 Types of Spousal Violence .............................................................................. 236 16.10 Violence by Spousal Characteristics and Empowerment Indicators .................. 240 16.11 Frequency of Spousal Violence ....................................................................... 241 16.12 Onset of Spousal Violence .............................................................................. 242 16.13 Types of Injuries to Women Resulting from Spousal Violence ......................... 242 16.14 Physical Violence by Women against Their Spouse ......................................... 243 16.15 Help-seeking Behavior of Women who Experience Violence .......................... 245 16.16 Family Support for Abused Women in Need ................................................... 245 16.17 Social Norms and Values ................................................................................ 247
REFERENCES .......................................................................................................................... 249 APPENDIX A SAMPLE IMPLEMENTATION ......................................................................... 255 APPENDIX B ESTIMATES OF SAMPLING ERRORS ............................................................. 261 APPENDIX C DATA QUALITY ............................................................................................. 281 APPENDIX D SURVEY PERSONNEL ..................................................................................... 289 APPENDIX E QUESTIONNAIRES ........................................................................................ 293


Tables and Figures | ix
TABLES AND FIGURES
CHAPTER 1 INTRODUCTION Table 1.1 Results of the household and individual interviews ............................................. 8 CHAPTER 2 HOUSEHOLD POPULATION AND HOUSING CHARACTERISTICS Table 2.1 Household population by age, sex, and residence ............................................ 12 Table 2.2 Household composition .................................................................................... 13 Table 2.3.1 Children’s living arrangements and orphanhood ............................................... 14 Table 2.3.2 School attendance by survivorship of parents .................................................... 15 Table 2.4.1 Educational attainment of the female household population ............................. 16 Table 2.4.2 Educational attainment of the male household population ................................ 18 Table 2.5 School attendance ratios ................................................................................... 19 Table 2.6 Grade repetition and dropout rates ................................................................... 21 Table 2.7 Household drinking water ................................................................................ 23 Table 2.8 Household sanitation facilities ........................................................................... 24 Table 2.9 Household characteristics ................................................................................. 25 Table 2.10 Household durable goods ................................................................................. 27 Table 2.11 Wealth quintiles ............................................................................................... 28 Table 2.12 Birth registration of children under age five ....................................................... 29 Figure 2.1 Population Pyramid .......................................................................................... 12 Figure 2.2 Percentage of Women and Men with No Education, by Age Group .................. 17 Figure 2.3 Age-specific Attendance Rates of the de facto Population 5 to 24 Years ............ 22 CHAPTER 3 CHARACTERISTICS OF RESPONDENTS Table 3.1 Background characteristics of respondents ........................................................ 32 Table 3.2.1 Educational attainment: Women ...................................................................... 33 Table 3.2.2 Educational attainment: Men ............................................................................ 34 Table 3.3.1 Literacy: Women .............................................................................................. 35 Table 3.3.2 Literacy: Men ................................................................................................... 36 Table 3.4.1 Exposure to mass media: Women ..................................................................... 37 Table 3.4.2 Exposure to mass media: Men .......................................................................... 38 Table 3.5.1 Employment status: Women ............................................................................. 39 Table 3.5.2 Employment status: Men .................................................................................. 40 Table 3.6.1 Occupation: Women ........................................................................................ 41 Table 3.6.2 Occupation: Men ............................................................................................. 42 Table 3.7 Type of employment: Women .......................................................................... 43 Table 3.8.1 Knowledge and attitude concerning tuberculosis: Women ................................ 44 Table 3.8.2 Knowledge and attitude concerning tuberculosis: Men ..................................... 46 Table 3.9.1 Use of tobacco: Women ................................................................................... 47 Table 3.9.2 Use of tobacco: Men ........................................................................................ 48

x | Tables and Figures
CHAPTER 4 FERTILITY Table 4.1 Current fertility ................................................................................................. 49 Table 4.2 Fertility by background characteristics ............................................................... 51 Table 4.3 Trends in age-specific fertility rates ................................................................... 52 Table 4.4 Trends in fertility ............................................................................................... 53 Table 4.5 Children ever born and living ............................................................................ 54 Table 4.6 Birth intervals .................................................................................................... 55 Table 4.7 Age at first birth ................................................................................................ 56 Table 4.8 Median age at first birth .................................................................................... 57 Table 4.9 Teenage pregnancy and motherhood ............................................................... 58 Figure 4.1 Age-specific Fertility Rates by Urban-Rural Residence ....................................... 50 Figure 4.2 Trends in Total Fertility Rates 1995-2010 .......................................................... 53 CHAPTER 5 FAMILY PLANNING Table 5.1 Knowledge of contraceptive methods ............................................................... 60 Table 5.2 Knowledge of contraceptive methods by background characteristics ................. 61 Table 5.3.1 Ever use of contraception: Women ................................................................... 63 Table 5.3.2 Ever use of contraception: Men ........................................................................ 64 Table 5.4 Current use of contraception by age ................................................................. 65 Table 5.5 Current use of contraception by background characteristics .............................. 67 Table 5.6 Number of children at first use of contraception ............................................... 69 Table 5.7 Knowledge of fertile period ............................................................................... 69 Table 5.8 Source of modern contraception methods ........................................................ 70 Table 5.9 Informed choice ............................................................................................... 72 Table 5.10 Future use of contraception .............................................................................. 73 Table 5.11 Reason for not intending to use contraception in the future .............................. 73 Table 5.12 Preferred method of contraception for future use ............................................. 74 Table 5.13 Exposure to family planning messages ............................................................... 75 Table 5.14 Contact of nonusers with family planning providers .......................................... 76 Table 5.15 Husband/partner’s knowledge of women’s use of contraception ....................... 77 Figure 5.1 Trends in Use of Contraception among Currently Married Women,
1997-2010 ....................................................................................................... 66 CHAPTER 6 OTHER PROXIMATE DETERMINANTS OF FERTILITY Table 6.1 Current marital status ........................................................................................ 79 Table 6.2 Number of co-wives and wives ......................................................................... 80 Table 6.3 Age at first marriage .......................................................................................... 81 Table 6.4.1 Median age at first marriage: Women ............................................................... 82 Table 6.4.2 Median age at first marriage: Men .................................................................... 83 Table 6.5 Age at first sexual intercourse ............................................................................ 84 Table 6.6 Median age at first intercourse: Men ................................................................. 85 Table 6.7.1 Recent sexual activity: Women ......................................................................... 86 Table 6.7.2 Recent sexual activity: Men .............................................................................. 87 Table 6.8 Postpartum amenorrhea, abstinence and insusceptibility .................................. 88 Table 6.9 Median duration of amenorrhea, postpartum abstinence and postpartum
insusceptibility .................................................................................................. 89 Table 6.10 Menopause ...................................................................................................... 90

Tables and Figures | xi
CHAPTER 7 FERTILITY PREFERENCES Table 7.1 Fertility preferences by number of living children .............................................. 92 Table 7.2.1 Desire to limit childbearing: Women ................................................................ 93 Table 7.2.2 Desire to limit childbearing: Men ...................................................................... 93 Table 7.3 Need and demand for family planning among currently married women .......... 95 Table 7.4 Ideal number of children .................................................................................. 96 Table 7.5 Mean ideal number of children......................................................................... 97 Table 7.6 Fertility planning status ..................................................................................... 98 Table 7.7 Wanted fertility rates ........................................................................................ 98 CHAPTER 8 INFANT AND CHILD MORTALITY Table 8.1 Early childhood mortality rates ........................................................................ 101 Table 8.2 Early childhood mortality rates by socioeconomic characteristics .................... 103 Table 8.3 Early childhood mortality rates by demographic characteristics ....................... 104 Table 8.4 Perinatal mortality .......................................................................................... 105 Table 8.5 High-risk fertility behavior ............................................................................... 106 Figure 8.1 Mortality Trends ............................................................................................. 102 CHAPTER 9 ADULT AND MATERNAL MORTALITY Table 9.1 Completeness of information on siblings ......................................................... 110 Table 9.2 Year of birth of respondents and siblings ......................................................... 110 Table 9.3 Sibship size and sex ratio of siblings ................................................................ 111 Table 9.4 Adult mortality rates ....................................................................................... 111 Table 9.5 Direct estimates of maternal mortality ............................................................. 112 CHAPTER 10 MATERNAL HEALTH Table 10.1 Antenatal care ................................................................................................ 114 Table 10.2 Number of antenatal care visits and timing of first visit .................................... 115 Table 10.3 Components of antenatal care ........................................................................ 116 Table 10.4 Tetanus toxoid injections ................................................................................ 117 Table 10.5 Knowledge of danger signs during pregnancy .................................................. 119 Table 10.6 Place of delivery ............................................................................................. 120 Table 10.7 Assistance during delivery ............................................................................... 121 Table 10.8 Knowledge of danger signs for newborns ........................................................ 123 Table 10.9 Instruments used to cut the umbilical cord ...................................................... 124 Table 10.10 Application of material after the umbilical cord was cut .................................. 125 Table 10.11 Drying and bathing of newborns ..................................................................... 126 Table 10.12 Timing of first postnatal checkup..................................................................... 127 Table 10.13 Type of provider of first postnatal checkup ..................................................... 128 Table 10.14 Problems in accessing health care ................................................................... 129 CHAPTER 11 CHILD HEALTH Table 11.1 Child’s weight and size at birth ....................................................................... 132 Table 11.2 Vaccinations by source of information ............................................................ 133 Table 11.3 Vaccinations by background characteristics ..................................................... 134

xii | Tables and Figures
Table 11.4 Vaccinations in first year of life........................................................................ 135 Table 11.5 Prevalence and treatment of symptoms of ARI ................................................ 137 Table 11.6 Prevalence and treatment of fever .................................................................. 138 Table 11.7 Prevalence of diarrhea .................................................................................... 139 Table 11.8 Diarrhea treatment ......................................................................................... 141 Table 11.9 Feeding practices during diarrhea ................................................................... 142 Table 11.10 Knowledge of ORS packets or pre-packaged liquids ........................................ 143 Table 11.11 Disposal of children’s stools ............................................................................ 144 Figure 11.1 Immunization Coverage of Children 12-23 Months......................................... 133 Figure 11.2 Trends in Children 12-23 Months Fully Immunized ........................................ 136 CHAPTER 12 NUTRITION OF CHILDREN AND WOMEN Table 12.1 Nutritional status of children ........................................................................... 149 Table 12.2 Initial breastfeeding ........................................................................................ 153 Table 12.3 Breastfeeding status by age ............................................................................. 155 Table 12.4 Median duration and frequency of breastfeeding ............................................ 157 Table 12.5 Foods and liquids consumed by children in the day or night preceding the
interview ........................................................................................................ 158 Table 12.6 Infant and young child feeding (IYCF) practices ............................................... 160 Table 12.7 Prevalence of anemia in children .................................................................... 161 Table 12.8 Micronutrient intake and food supplementation among children .................... 163 Table 12.9 Signs of night blindness among children .......................................................... 164 Table 12.10 Nutritional status of women ............................................................................ 166 Table 12.11 Foods consumed by mothers in the day or night preceding the interview ........ 167 Table 12.12 Micronutrient intake among mothers .............................................................. 169 Table 12.13 Prevalence of anemia in women ..................................................................... 170 Figure 12.1 Nutritional Status of Children by Age .............................................................. 150 Figure 12.2 Trends in Nutritional Status of Children, 2002-2010 ....................................... 152 Figure 12.3 Trends in Nutritional Status of Children, 2007-2010, WHO Child Growth
Standards........................................................................................................ 152 Figure 12.4 Infant Feeding Practices by Age ...................................................................... 156 Figure 12.5 Infant and Young Child Feeding (IYCF) Practices ............................................. 159 CHAPTER 13 MALARIA Table 13.1 Ownership of mosquito nets ........................................................................... 174 Table 13.2 Use of mosquito nets by children .................................................................... 175 Table 13.3 Use of mosquito nets by women ..................................................................... 176 Table 13.4 Use of mosquito nets by pregnant women ...................................................... 177 Table 13.5 Prevalence and prompt treatment of fever ...................................................... 178 Table 13.6 Type and timing of antimalarial drugs ............................................................. 179 CHAPTER 14 HIV/AIDS-RELATED KNOWLEDGE, ATTITUDES, AND BEHAVIOR Table 14.1 Knowledge of AIDS......................................................................................... 182 Table 14.2 Knowledge of HIV prevention methods .......................................................... 184 Table 14.3.1 Comprehensive knowledge about AIDS: Women ........................................... 185 Table 14.3.2 Comprehensive knowledge about AIDS: Men ................................................. 186

Tables and Figures | xiii
Table 14.4.1 Accepting attitudes toward those living with HIV/AIDS: Women ..................... 187 Table 14.4.2 Accepting attitudes toward those living with HIV/AIDS: Men .......................... 188 Table 14.5 Multiple sexual partners in the past 12 months: Men ...................................... 190 Table 14.6 Payment for sexual intercourse: Men .............................................................. 191 Table 14.7 Knowledge of a place to get an HIV test .......................................................... 192 Table 14.8 Male circumcision .......................................................................................... 193 Table 14.9 Self-reported prevalence of sexually-transmitted infections (STIs) and STIs
symptoms ....................................................................................................... 194 Table 14.10 Prevalence of medical injections ..................................................................... 196 Table 14.11 Comprehensive knowledge about AIDS and of a source of condoms
among youth .................................................................................................. 198 Table 14.12 Age at first sexual intercourse among youth .................................................... 199 Table 14.13 Condom use at first sexual intercourse among youth ....................................... 200 Table 14.14 Premarital sexual intercourse during premarital sexual intercourse
among youth .................................................................................................. 201 Table 14.15 Drunkenness during sexual intercourse among youth ...................................... 202 Figure 14.1 Women and Men Seeking Advice or Treatment for STIs ................................. 195 Figure 14.2 Source of Last Medical Injection ..................................................................... 197 CHAPTER 15 WOMEN’S EMPOWERMENT AND DEMOGRAPHIC AND HEALTH
OUTCOMES Table 15.1 Employment and cash earnings of currently married women........................... 204 Table 15.2.1 Control over women’s cash earnings and relative magnitude of women’s
earnings: Women ........................................................................................... 205 Table 15.2.2 Control over men’s cash earnings .................................................................... 207 Table 15.3 Women’s control over her own earnings and over those of her husband ......... 208 Table 15.4.1 Women’s participation in decision making ..................................................... 209 Table 15.4.2 Women’s participation in decision making according to men .......................... 209 Table 15.5.1 Women’s participation in decision making by background characteristics ....... 211 Table 15.5.2 Men’s attitude toward wives’ participation in decision making ........................ 212 Table 15.6.1 Attitude toward wife beating: Women ............................................................ 214 Table 15.6.2 Attitude toward wife beating: Men ................................................................. 215 Table 15.7.1 Attitude toward refusing sexual intercourse with husband: Women ................ 217 Table 15.7.2 Attitude toward refusing sexual intercourse with husband: Men ...................... 218 Table 15.7.3 Men’s attitude toward a husband’s rights when his wife refuses to have
sexual intercourse ........................................................................................... 219 Table 15.8 Indicators of women’s empowerment ............................................................. 221 Table 15.9 Current use of contraception by women’s status ............................................. 222 Table 15.10 Women’s empowerment and ideal number of children and unmet need for
family planning ............................................................................................... 223 Table 15.11 Reproductive health care by women’s empowerment ..................................... 224 Figure 15.1 Number of Household Decisions in Which Women Participate ...................... 210 CHAPTER 16 DOMESTIC VIOLENCE Table 16.1 Experience of physical violence ...................................................................... 229 Table 16.2 Persons committing physical violence ............................................................. 230 Table 16.3 Force at sexual initiation ................................................................................. 231

xiv | Tables and Figures
Table 16.4 Experience of sexual violence ......................................................................... 232 Table 16.5 Experience of different forms of violence ........................................................ 233 Table 16.6 Violence during pregnancy ............................................................................. 234 Table 16.7 Degree of marital control exercised by husbands ............................................ 235 Table 16.8 Forms of spousal violence ............................................................................... 237 Table 16.9 Spousal violence by background characteristics............................................... 238 Table 16.10 Spousal violence by husband’s characteristics and empowerment indicators ... 241 Table 16.11 Frequency of spousal violence among those who report violence ................... 242 Table 16.12 Onset of marital violence ................................................................................ 243 Table 16.13 Injuries to women due to spousal violence ..................................................... 245 Table 16.14 Violence by women against their spouse ......................................................... 246 Table 16.15 Help seeking to stop violence ......................................................................... 248 Figure 16.1 Percentage of Ever-married Women Who Have Experienced Specific Forms
of Physical and Sexual Violence Committed by Their Husband/Partner ........... 238 APPENDIX A SAMPLE IMPLEMENTATION Table A.1 Sample allocation of clusters and households according to district and by
type of residence, Timor-Leste 2009-10 .......................................................... 256 Table A.2 Sample allocation of expected number of completed women and men
interviews according to district and by type of residence, Timor-Leste 2009-10 ......................................................................................................... 256
Table A.3 Sample implementation: Women ................................................................... 258 Table A.4 Sample implementation: Men ........................................................................ 259 APPENDIX B ESTIMATES OF SAMPLING ERRORS Table B.1 List of selected variables for sampling errors, Timor-Leste 2009-10 ................. 263 Table B.2 Sampling errors for National sample, Timor-Leste 2009-10 ............................. 264 Table B.3 Sampling errors for Urban sample, Timor-Leste 2009-10 ................................ 265 Table B.4 Sampling errors for Rural sample, Timor-Leste 2009-10 .................................. 266 Table B.5 Sampling errors for Aileu sample, Timor-Leste 2009-10 .................................. 267 Table B.6 Sampling errors for Ainaro sample, Timor-Leste 2009-10 ................................ 268 Table B.7 Sampling errors for Baucau sample, Timor-Leste 2009-10 ............................... 269 Table B.8 Sampling errors for Bobonaro sample, Timor-Leste 2009-10 ........................... 270 Table B.9 Sampling errors for Covalima sample, Timor-Leste 2009-10 ............................ 271 Table B.10 Sampling errors for Dili sample, Timor-Leste 2009-10 ..................................... 272 Table B.11 Sampling errors for Ermera sample, Timor-Leste 2009-10 ............................... 273 Table B.12 Sampling errors for Lautem sample, Timor-Leste 2009-10............................... 274 Table B.13 Sampling errors for Liquiçá sample, Timor-Leste 2009-10 ............................... 275 Table B.14 Sampling errors for Manatuto sample, Timor-Leste 2009-10 ........................... 276 Table B.15 Sampling errors for Manufahi sample, Timor-Leste 2009-10 ........................... 277 Table B.16 Sampling errors for Oecussi sample, Timor-Leste 2009-10 .............................. 278 Table B.17 Sampling errors for Viqueque sample, Timor-Leste 2009-10 ........................... 279 APPENDIX C DATA QUALITY Table C.1 Household age distribution ............................................................................. 281 Table C.2.1 Age distribution of eligible and interviewed women ........................................ 282 Table C.2.2 Age distribution of eligible and interviewed men ............................................ 282

Tables and Figures | xv
Table C.3 Completeness of reporting .............................................................................. 283 Table C.4 Births by calendar years .................................................................................. 283 Table C.5 Reporting of age at death in days .................................................................... 284 Table C.6 Reporting of age at death in months ............................................................... 285 Table C.7 Nutritional status of children ........................................................................... 286 Table C.8 Completeness of information on siblings ......................................................... 287 Table C.9 Indicators on data quality ............................................................................... 287 Table C.10 Sibship size and sex ratio of siblings ................................................................ 287


Foreword | xvii
FOREWORD
The 2009-10 Timor-Leste Demographic and Health Survey (TLDHS) is the first national level population and health survey conducted as part of the global Demographic and Health Surveys (DHS) program supported by USAID, but the second Demographic and Health survey in the country. The first DHS was done in 2003 under the guidance of ACIL Australia Pty Ltd, University of Newcastle and the Australian National University. The TLDHS 2009-10 is implemented by the National Statistics Directorate of the General Directorate for Policy Analysis and Research of the Ministry of Finance, under the aegis of the Ministry of Health.
The 2009-10 TLDHS supplements and complements the information collected through the censuses, updates the available information on population and health issues, and provides guidance in planning, implementing, monitoring and evaluating Timor-Leste’s health programs. Further, the results of the survey assist in monitoring the progress made towards meeting the Millennium Development Goals (MDGs) and other international initiatives.
The 2009-10 TLDHS includes topics related to fertility levels and determinants; family planning; fertility preferences; infant, child, adult and maternal mortality; maternal and child health; nutrition; malaria; domestic violence; knowledge of HIV/AIDS and women’s empowerment. The 2009-10 TLDHS for the first time also includes anemia testing among women age 15-49 and children age 6-59 months. As well as providing national estimates, the survey also provides disaggregated data at the level of various domains such as administrative district, as well as for urban and rural areas. This being the third survey of its kind in the country (after the 2002 MICS and the 2003 DHS), there is considerable trend information on demographic and reproductive health indicators.
This survey is the result of concerted effort on the part of various individuals and institutions, and it is with great pleasure that we would like to acknowledge the work put in to produce this very important and useful document. The participation and cooperation that was extended by the members of the Steering Committee in the different phases of the survey is greatly appreciated.
On behalf of the Government of Timor-Leste, we the Ministers of Finance and of Health, would like to extend our appreciation for the technical support by ICF Macro International and financial support from our development partners namely; the United States Agency for International Development (USAID), the Government of Australia (AusAID), the Government of Ireland (Irish Aid), the United Nations Population Fund (UNFPA), the United Nations Children’s Fund (UNICEF), the United Nations Development Fund (UNDP) and the World Health Organization (WHO).
This report contains enormous valuable information that when used correctly and consistently will undoubtedly improve the lives of many of our people. It is now time for program managers and policy makers to use the information to enable us to achieve our health and social targets as set by the Government.


Acknowledgments | xix
ACKNOWLEDGMENTS
The 2009-10 Timor-Leste Demographic and Health Survey (TLDHS) with the main objective to generate demographic, health and social indicators, was conducted between August 2009 and January 2010. It is the second DHS to be carried out in the country since independence. Preliminary results were launched in April 2010. This report is the main output from the DHS project and will be followed by other thematic analyses depending on the program needs of the country. The 2009-10 TLDHS is a classic example of a project involving many interested groups; the Ministry of Health as the main users, the National Statistics Directorate as the implementer and a consortium of development partners who have provided both technical and financial/administrative support to implement the survey.
As a result of the huge demand for data from the TLDHS, its success was accomplished through the concerted efforts of many organizations, institutions, government ministries and individuals who assisted in a variety of ways to plan, prepare, collect, process, analyze and publish the results. The Government through the Director of National Statistics Directorate under the General Directorate of Policy Analysis and Research in Ministry of Finance wishes to thank them all for their inputs into this noble process.
We express our deep sense of appreciation to the technical experts from ICF Macro, the National Statistics Directorate staff who worked on the project, UNFPA for mobilizing the resources to cover local costs and administrative support; and to members of the Steering Committee who provided critical inputs at all levels. Additionally, we would like to thank the various technical experts in the fields of population and health for their valuable input in the various phases of the survey. Their expertise was invaluable during the finalization of the questionnaires, training of field staff, reviewing the draft tables and finalizing the report. Our gratitude goes to the national staff who worked during data collection, data capture and cleaning. More importantly, all the Timorese who provided the data during interviews deserve special thanks for their patience and willingness to provide the requisite information.
The Government extends sincere gratitude to the development partners for their financial contributions to this project, particularly the United States Agency for International Development (USAID), the Government of Australia (AusAID), the Government of Ireland (Irish Aid), the United Nations Population Fund (UNFPA), the United Nations Children’s Fund (UNICEF), the United Nations Development Fund (UNDP), and the World Health Organization (WHO).
We sincerely hope that the information in this report will be fully utilized in the national development planning process by all stakeholders for the welfare of the Timorese people.
Antonío Freitas Director General, Analysis and Research Ministry of Finance


Contributors to the Report | xxi
CONTRIBUTORS TO THE REPORT
Elias dos Santos Ferreira, National Statistics Directorate Americo Soares, National Statistics Directorate Lourenco Soares, National Statistics Directorate Juselina Corte-Real, National Statistics Directorate Cesar Melito dos Santos Martins, National Statistics Directorate Isabel Gomes, Maternal and Child Health, Ministry of Health Aurea Celina Martins, Family Planning Section, Ministry of Health Misliza Vital, Child Health, Ministry of Health Jose Lima, Immunization Section, Ministry of Health Fatima Isabel C. Guzmao, Maternal and Reproductive Health, Ministry of Health Dirce Maria Soares, Nutrition Section, Ministry of Health Feliciano, Nutrition Section, Ministry of Health Maria do Rosario de Fatima Mota, Malaria Program, Ministry of Health Elizabeth Dos Reis, HIV/AIDS Section, Ministry of Health Teresa d.j. Vaz Cabral, University of Timor-Leste Dominique Freire, Health Alliance International Beth Elson, Health Alliance International Kiyoe Narita, Health Alliance International Melanie M. Soares, Health Alliance International Ruhul Amin, TAIS/USAID Brett Sutton, TAIS/USAID Asecelina J.M., Family Planning Unit, TAIS/USAID Fredrick Otieno Okwayo, UNFPA Anusara Singhkamarwang, World Food Program Crystal Karakochuk, UNICEF Faraja Chiwile, UNICEF Christine Chan, SEPI Pav Govindasamy, ICF Macro Anjushree Pradhan, ICF Macro Consultant Joy Fishel, ICF Macro Lyndsey Wilson-Williams, ICF Macro Velma Lopez, ICF Macro

Summary of Findings | xxiii
SUMMARY OF FINDINGS
The 2009-10 Timor-Leste Demographic and Health Survey (TLDHS) is the second national-level population and health survey conducted in Timor-Leste and the first conducted as part of the global Demographic and Health Surveys (DHS) program. The sample for the survey was selected independently in every stratum, through a two-stage selection process, to provide estimates for each of the 13 districts and for both urban and rural areas of the country. The 2009-10 TLDHS was designed to cover a nationally representative sample of residential households, taking into account nonresponse; to obtain completed inter-views of women age 15-49 in every selected household; and to obtain completed interviews of men age 15-49 in every third selected household.
Each household selected for the TLDHS was eligible for interview with the Household Questionnaire, and a total of 11,463 households were interviewed. All eligible women age 15-49 in the selected households and all eligible men age 15-49 in every third household were inter-viewed with the Women’s and Men’s Question-naires, respectively. A total of 13,137 women age 15-49 and 4,076 men age 15-49 were interviewed. Data collection took place over a six-month period, from early August 2009 to early February 2010.
The survey obtained detailed information on fertility, fertility preferences, marriage, sexual activity, awareness and use of family planning methods, breastfeeding practices, nutritional status of women and young children, childhood mortality, maternal and child health, awareness and behavior regarding HIV and AIDS, and other sexually transmitted infections (STIs). In addition, the 2009-10 TLDHS collected informa-tion on domestic violence, malaria and use of mosquito nets, and anemia testing and anthropo-metric measurements for women and children.
The survey was implemented by the National Statistics Directorate of the Directorate General for Analysis and Research of the Ministry of Finance, under the aegis of the Ministry of Health (MOH) of Timor-Leste.
Technical support was provided by ICF Macro, and financial support was provided by USAID, the Government of Australia (AusAID),
the Government of Ireland (Irish AID), the United Nations Population Fund (UNFPA), the United Nations Children’s Fund (UNICEF), the United Nations Development Fund (UNDP), and the World Health Organization (WHO). UNFPA supported the survey with administrative, logistical, and technical assistance. A steering committee was formed to be responsible for coordination, oversight, advice, and decision-making on all major aspects of the survey. The steering committee was composed of representatives from various ministries and key stakeholders, including the MOH, National Statistics Directorate, USAID, and international nongovernmental organizations (INGOs).
FERTILITY
Fertility Levels and Trends. The total fertility rate for Timor-Leste for the three years preceding the survey is 5.7 births per woman and is the highest in South East Asia and in Asia (together with Afghanistan) (PRB, 2010) but below the levels of Africa. At this level, it is estimated that the population will increase from its current size of 1.2 million to 1.9 million by the year 2025 and to 3.2 million by the year 2050.
Fertility Differentials. As expected, fertility is considerably higher in rural areas than in urban areas. Rural women have on average about one child more than urban women (6.0 compared with 4.9 births per woman). As the age-specific fertility rates (ASFRs) show, the pattern of high rural fertility is prevalent in all age groups. The rural-urban difference in fertility is most pro-nounced for women age 20-24 (236 births per 1,000 women in rural areas versus 187 births per 1,000 women in urban areas). There are considerable differentials in fertility among districts, with fertility ranging from a low of 4.4 births per woman in Covalima to a high of 7.2 births per woman in Ainaro. The level of fertility is inversely related to women’s educational attainment, decreasing rapidly from 6.1 births among women with no education to 2.9 births among women with more than secondary education. Fertility is also inversely associated with wealth quintile. Women in the lowest wealth quintile have an average of 7.3 births,

xxiv | Summary of Findings
about three children more than women in the highest quintile (4.2 births).
Unplanned Fertility. Despite a marked increase in the level of contraceptive use over the past eight years, the 2009-10 TLDHS data indicate that unplanned pregnancies are not uncommon. Overall, 86 percent of births are wanted, 12 percent of births in the country are mistimed (wanted later), and 2 percent are unwanted. Data from the 2003 DHS show that there has been little change in the status of planning for children, with 86 percent of births in the five years preceding the survey planned and 11 percent mistimed. Unwanted births declined from 4 percent in 2003 to 2 percent in 2009-10.
Fertility Preferences. There is considerable desire among currently married Timorese to control the timing and number of births. Thirty-five percent of currently married women would like to wait two or more years before the next birth, and 36 percent do not want to have another child, or are sterilized. About one in ten (9 percent) of currently married women would like to have a child soon (within two years). In addition, 17 percent are undecided about whether to have a child or not. The proportion of currently married women who want no more children more than doubled in the last seven years, from 17 percent as reported in the 2003 DHS to 36 percent in the 2009-10 TLDHS.
Currently married women and men prefer about six children. Data from the 2003 DHS show that the ideal number of children preferred by currently married women has changed little over the last seven years.
FAMILY PLANNING
Knowledge of Contraception. Findings from the 2009-10 TLDHS show that 78 percent of currently married women and 66 percent of currently married men in Timor-Leste know of at least one modern method of family planning. The most widely known modern contraceptive methods among currently married women are injectables (70 percent) and the pill (58 percent). Currently, married men are most likely to know of the male condom (54 percent) and injectables (46 percent). Twenty-seven percent of currently married men mentioned knowledge of a tradi-tional method compared with 22 percent of currently married women.
Over the past seven years there has been a considerable increase in the overall knowledge of contraceptive methods in the country.
Use of Contraception. More than one in five currently married women (22 percent) is using a method of family planning, with 21 percent using a modern contraceptive method. This indicates that modern contraceptive methods are highly favored over either natural family planning methods or other traditional methods. One percent of women report currently using a traditional method. The rhythm method is slightly more popular than withdrawal.
Injectables are by far the most popular modern method, and they are used by 16 percent of currently married women. Two percent of women use the pill, and about 1 percent of women each use the IUD or implants, or they are sterilized. Most women who are sterilized are over age 30. Injectables are popular among women age 20-44.
Trends in Contraceptive Use. There has been a marked increase in the use of contra-ception by currently married women since 2002. Use of modern methods doubled in the five years between 2002 and 2007 and rose by nearly 50 percent in the three years between 2007 and the 2010. The increase in use of modern methods contributed to a three-fold increase in overall contraceptive use, from 7 percent to 21 percent, in a matter of 7 to 8 years.
Differentials in Contraceptive Use. Women in urban areas (30 percent) are more likely to use a family planning method than rural women (20 percent), reflecting wider availability and easier access to methods in urban than in rural areas. Contraceptive use varies by district with much of the difference due to the use of injectables. Use of a modern method among currently married women is highest in Covalima (43 percent) and lowest in Baucau (8 percent). Current use varies markedly between women who have some education and those who have none, however, there is little variation among educated women by specific level of education. Wealth has a positive effect on women’s contraceptive use, with modern contraceptive use increasing markedly as household wealth increases, from 15 percent among currently married women in the lowest wealth quintile to 32 percent among those in the highest wealth quintile.

Summary of Findings | xxv
Source of Modern Methods. Forty-five percent of all users are served by community health centers, 20 percent by health posts, 17 percent by government and referral hospitals, 3 percent by integrated community health services (SISCa), and 2 percent by mobile clinics. In the private medical sector, most users are served by private hospitals/clinics (8 percent of all users). Most contraceptives sold in private hospitals/ clinics are provided through the Timor-Leste Contraceptive Retail Sales Company.
Unmet Need for Family Planning. About one in three currently married women has an unmet need for family planning, with 21 percent having an unmet need for spacing and 10 percent having an unmet need for limiting. Twenty-two percent of women have a met need for family planning. If all currently married women who say they want to space or limit their children were to use a family planning method, the contraceptive prevalence rate would increase to 53 percent from the current 22 percent. Currently, only 42 percent of the family planning needs of currently married women are being met.
MATERNAL HEALTH
Antenatal Care. Antenatal care from a skilled birth attendant, that is, from a doctor, nurse, midwife, or assistant nurse, is very common in Timor-Leste, with 86 percent of women reporting receipt of such care. The majority of women received care from a nurse or midwife (80 percent). Four percent of women received care from a doctor, and less than 2 percent received care from an assistant nurse. One percent of women received care from a traditional birth attendant. Thirteen percent of women did not receive care from a health provider for their last birth in the five years preceding the survey. Antenatal care from a skilled provider is lowest in Ermera (71 percent) and highest in Dili (96 percent).
There has been a significant improvement in the proportion of women receiving antenatal care from a skilled provider—an increase of 41 percent, from 61 percent in the 2003 DHS to 86 percent in the 2009-10 TLDHS.
Neonatal tetanus is a leading cause of neonatal death in developing countries where a high proportion of deliveries occur at home or in places where hygienic conditions may be poor. Tetanus toxoid (TT) vaccinations are given to pregnant women to prevent neonatal tetanus. The survey results show that three-quarters of
mothers with a live birth in the five years preceding the survey received two or more tetanus toxoid injections during their last preg-nancy, and four-fifths were protected for their last birth.
Mothers in Manatuto are most likely to have received two or more tetanus toxoid injections (92 percent) and to have had their last birth protected against neonatal tetanus (95 percent) compared with mothers in all other districts; tetanus toxoid coverage is lowest among mothers in Ermera and Ainaro.
With regard to antimalarial indicators, the results show that overall, 39 percent of all women and 45 percent of pregnant women slept under some sort of net the night before the interview. Thirty-seven percent of all women and 43 percent of pregnant women slept under an ever-treated net, and 34 percent and 41 percent, respectively, slept under an ITN. In households that own at least one ITN, a substantially larger proportion of women slept under an ITN the night before the survey (77 percent of all women and 84 percent of pregnant women).
Delivery Care. Just over one in five births are delivered in a health facility, with the vast majority delivered in a public (21 percent) rather than in a private (1 percent) facility. The majority of births (78 percent) are delivered at home. Delivery in a health facility is most common among young mothers (25 percent), mothers of first-order births (31 percent), and mothers who have had at least four antenatal visits (31 percent). Half (53 percent) of the children in urban areas are born in a health facility, compared with only 12 percent in rural areas. Delivery in a health facility also varies by district, with facility delivery in Dili being much more likely than in any other district (63 percent). Less than 10 percent of births in Ermera, Oecussi, and Ainaro are delivered in a health facility.
Thirty percent of births are delivered by a skilled provider (doctor, nurse, assistant nurse, or midwife), with a nurse or midwife being the most common skilled provider. Three percent of deliveries are performed by a doctor, and less than 1 percent are performed by an assistant nurse. Nearly one-fifth of deliveries are carried out by traditional birth attendants (18 percent). Women receive assistance from a relative or some other person for nearly one in two births (49 percent), while 3 percent of births take place without any type of assistance at all.
xxvi | Summary of Findings
Postnatal Care. The majority of women (68 percent) did not receive a postnatal check. Among those who received postnatal care, 16 percent received it in less than four hours after delivery, 5 percent received care within 4 to 23 hours, and 3 percent received care within the first two days. Seven percent received postnatal care 3 to 41 days following delivery.
Maternal Mortality. Maternal mortality in Timor-Leste is high relative to many developed countries. Respondents reported 120 maternal deaths in the seven years preceding the survey. The maternal mortality rate, which is the annual number of maternal deaths per 1,000 women age 15-49, for the period zero to six years preceding the survey, is 0.96. Maternal deaths accounted for 42 percent of all deaths to women age 15-49; in other words, more than two in five Timorese women who died in the seven years preceding the survey died from pregnancy or pregnancy-related causes. The maternal mortality ratio, which measures the obstetric risk associated with each live birth for the seven years preceding the survey is 557 deaths per 100,000 live births (or alternatively, about 6 deaths per 1,000 live births). The 95 percent confidence interval places the true MMR for 2009-10 anywhere between 408 and 706.
CHILD HEALTH
Childhood Mortality. Under-5 mortality for the most recent period (0-4 years before the survey or, roughly, during the calendar years 2005-2009) is 64 deaths per 1,000 live births. This means that 1 in 16 children born in Timor-Leste dies before the fifth birthday. Seventy percent of deaths among children under age 5 occur during the first year of life: infant mortality is 45 deaths per 1,000 live births. During infancy, the risk of neonatal deaths and postneonatal deaths is 22 and 23 per 1,000 live births, respectively.
Data from the TLDHS for the three five-year periods preceding the survey indicate a decline in childhood mortality. This is consistent with comparison of the TLDHS 2009-10 mortality data with the 2003 DHS survey results, which shows a substantial (23 percent) improvement in child survival. For example, under-5 mortality declined from 83 per 1,000 live births during the period 1999-2003 to 64 per 1,000 live births during the period 2005-2009. This decline is caused principally by a decrease in the infant mortality rate, from 60 deaths per 1,000 for the zero to four years preceding the 2003 DHS to 45
per 1,000 during the same period prior to the 2009-10 TLDHS.
Childhood Vaccination Coverage. Fifty-three percent of Timorese children age 12-23 months are fully immunized, and 23 percent received no vaccinations. Forty-seven percent of children age 12-23 months are fully vaccinated by 12 months of age. The percentage of children fully vaccinated nearly tripled from 18 percent in 2003.
Seventy-seven percent of children received the BCG vaccination, 75 percent received the first DPT dose, and 75 percent received the first polio dose. Coverage for all three vaccinations declines with subsequent doses; 66 percent of children received the recommended three doses of DPT, and 56 percent received three doses of polio. These figures reflect dropout rates (which represent the proportion of children who received the first dose of a vaccine but who did not get the third dose) of 12 percent for DPT and 25 percent for polio, respectively. This is a huge improve-ment from 2003 when the dropout rates for DPT and polio were 45 and 62 percent, respectively. Sixty-eight percent of children received the measles vaccine. Hepatitis B coverage varies slightly from DPT coverage, although they have been given together in a tetravalent vaccine since 2007. This difference is likely due to the inclusion of a small number of children who received the DPT vaccine before the tetravalent vaccine was introduced.
Childhood Illness and Treatment. Among children under 5 years of age, 2 percent had symptoms of acute respiratory infection (ARI) in the two weeks preceding the survey. Seven in ten children with symptoms of ARI (71 percent) were taken to a health facility or provider, and 45 percent were prescribed antibiotics.
One-fifth of children (19 percent) under 5 years of age were reported to have had fever in the past two weeks. Seventy-three percent of children with a fever were taken to a health facility or provider for treatment. Six percent of children under age 5 with fever in the two weeks preceding the survey were given antimalarial drugs, and 36 percent received antibiotics.
Sixteen percent of all children under the age of 5 had diarrhea in the two weeks before the survey, and 1 percent had diarrhea with blood. Overall, 72 percent of children with diarrhea were taken to a health provider for treatment of diarrhea. Seventy-eight percent of children with

Summary of Findings | xxvii
diarrhea were treated either with oral rehydration salts (ORS) (71 percent) or recommended home fluids (RHF) (40 percent). Ten percent of children were given increased fluids. Overall, 79 percent of children under age 5 with diarrhea were treated with ORS, RHF, or increased fluids. Six percent of children with diarrhea were treated with antibiotics, home remedies were given to 18 percent of children with diarrhea, and 13 percent of children with diarrhea were given no treatment at all. Six percent of children with diarrhea received zinc only.
NUTRITION
Nutritional Status of Children. Fifty-eight percent of children under age 5 are stunted, and 33 percent are severely stunted. Nineteen percent of children under age 5 are wasted, and 7 percent are severely wasted. The weight-for-age indicator shows that 45 percent of children under age 5 are underweight, and 15 percent are severely underweight. In addition, 5 percent of Timorese children under age 5 are overweight.
There has been a slight rise in the level of stunting, wasting, and underweight over the past 6 years. Stunting increased from 49 percent to 53 percent, wasting increased from 12 percent to 17 percent, and underweight increased from 46 percent to 52 percent.
Breastfeeding Practices. Breastfeeding is nearly universal in Timor-Leste, with 97 percent of children born in the five years preceding the survey having been breastfed at some time. On average, four in five children are breastfed within the first hour of birth (82 percent), and 96 percent are breastfed within one day of birth. Thirteen percent of children are given a pre-lacteal feed, that is, something other than breast milk, during the first three days of life. The percentage of children who are breastfed early has increased in the past six years, the increase being more pronounced for children breastfed within one hour of birth. There has been a rise in the percentage of children breastfed within one hour of birth by about 74 percent, from 47 percent in the 2003 DHS to 82 percent in 2009-10 TLDHS.
Contrary to WHO’s recommendations, how-ever, only about half (52 percent) of children under age 6 months are exclusively breastfed in Timor-Leste. The 2009-10 TLDHS results also indicate that the proportion of children receiving complementary foods in a timely fashion is encouraging, with 78 percent of children age 6-8
months receiving complementary foods. The practice of bottle-feeding with a nipple is not widespread in Timor-Leste.
Intake of Vitamin A. Ensuring that children age 6-59 months receive enough vitamin A may be the single most effective child survival intervention. Deficiencies in this micronutrient can cause blindness and can increase the severity of infections such as measles and diarrhoea. Nearly four-fifths (79 percent) of last-born children age 6-35 months consumed vitamin A-rich foods, and 52 percent of young children consumed foods rich in iron in the 24-hour period before the survey. One in two children (51 percent) age 6-59 months received a vitamin A supplement in the six months before the survey. This is an improvement over the last five years.
Along with vitamin A deficiency, the preva-lence of worm infestation has been high in Timor-Leste. Thirty-five percent of children age 6-59 months received deworming tablets in the six months preceding the survey.
Prevalence of anemia. Iron-deficiency anemia is a major threat to maternal health and child health. More than one in three (38 percent) Timorese children age 6-59 months old are anemic, with 25 percent mildly anemic, 13 percent moderately anemic, and less than 1 percent severely anemic. Children in Manatuto district have the highest prevalence of anemia (68 percent), and children in Ermera district have the lowest prevalence (15 percent).
Nutritional Status of Women. Overall, 15 percent of women are shorter than 145 cm. Women in rural areas are much shorter on average than women in urban areas, with 17 percent falling below the 145 cm cutoff compared with only 9 percent of women in urban areas. Women living in Dili are least likely to be below 145 cm (7 percent), while women in Ermera are most likely (31 percent).
Twenty-seven percent of women were found to be malnourished with BMI <18.5 indicating that malnutrition among women is a serious public health concern in Timor-Leste. About 5 percent of Timorese women are overweight or obese.
Women’s nutritional status has improved over the years. The proportion of malnourished women (BMI <18.5) has decreased by 29 percent in the past decade, from 38 percent in the 2003 DHS to 27 percent in the 2009-10 TLDHS.

xxviii | Summary of Findings
However, the level of chronic energy deficiency among nonpregnant women is still high, with more than one-quarter of women having a BMI less than 18.5. The mean BMI has increased only slightly over the years from 19.5 in the 2003 DHS to 20.2 in the 2009-10 TLDHS.
A mother’s nutritional status during preg-nancy is important both for the child’s intra-uterine development and for protection against maternal morbidity and mortality. Night blind-ness is an indicator of severe vitamin A deficiency, and pregnant women are especially prone to experience it. More than nine in ten mothers (94 percent) consumed vitamin A-rich foods, and more than one-half (53 percent) consumed iron-rich foods in the 24 hours preced-ing the survey. Fifty-five percent of women received vitamin A postpartum, an improvement from the 23 percent of women who received vitamin A postpartum reported in the 2003 TLDHS.
Iron supplementation during pregnancy has been a key health initiative in Timor-Leste since 2003. The proportion of women who took iron supplements during pregnancy has risen from 43 percent in 2003 to 61 percent in 2009-10. However, 37 percent of women did not take any iron supplements during their most recent preg-nancy. Further, only 16 percent of women took the recommended dose of iron supplements for 90 days or more during their pregnancy. In addition, 13 percent of women received deworming medication during pregnancy, 31 percent received supplementary food while pregnant with their last birth, and 29 percent received supplementary food while breastfeeding their last-born child.
Thirteen percent of mothers reported having difficulty seeing at night but, when this figure is adjusted to include only those mothers who had no difficulty seeing in the daytime, only 2 percent of mothers suffered from night blindness during their most recent pregnancy in the last five years. This is a decrease from the 13 percent of mothers reported with night blindness in the DHS 2003 survey.
Iron deficiency anemia is one of the most common nutritional problems in Timor-Leste. Overall 21 percent of Timorese women age 15-49 are anemic, with 18 percent mildly anemic, 4 percent moderately anemic, and less than 1 percent severely anemic. However, pregnant women are more likely to be anemic (28 percent) than women who are breastfeeding (25 percent)
and women who are neither pregnant nor breast-feeding (19 percent).
HIV AND AIDS
Knowledge of HIV and AIDS. Forty-four percent of women and 61 percent of men have heard of HIV and AIDS. Women are most aware that the chances of getting the HIV virus can be reduced by limiting sex to one uninfected partner who has no other partners (36 percent). In addition, 26 percent mention that abstaining from sexual intercourse will prevent the transmission of HIV. Among men, the most commonly known prevention method is also limiting sex to one uninfected partner who has no other partners (49 percent). Knowledge of condoms and the role that they can play in preventing the transmission of HIV is much less common among women than among men (30 percent versus 45 percent). Fewer women and men (27 percent and 42 percent, respectively) are also aware that both using condoms and limiting sex to one uninfected partner can reduce the risk of getting the HIV virus.
Many Timorese adults lack accurate knowledge about the ways in which the HIV virus can and cannot be transmitted, with women being much less knowledgeable than men. Only 33 percent of women and 46 percent of men know that a healthy-looking person can have the HIV virus. One in four women and two in five men know that HIV cannot be transmitted by mosquito bites, or that a person cannot become infected by sharing food with a person who has HIV or sharing clothes with a person who has HIV. About twice as many men as women (28 percent and 15 percent, respectively) say that a healthy looking person can have the virus and reject the two most common local misconcep-tions (that HIV can be transmitted by mosquito bites and by sharing food).
Attitudes towards People Living with HIV and AIDS. Knowledge and beliefs affect how people treat those they know to be living with HIV or AIDS. In the 2009-10 TLDHS, a number of questions were posed to respondents to measure their attitudes towards people living with HIV or AIDS (PLWA). Twice as many women as men (55 percent and 26 percent, respectively) state that they would be willing to care for a family member with the AIDS virus in their home. Eighty-four percent of women and 87 percent of men say that they would not want to keep secret that a family member was infected with the AIDS virus, while 44 percent of women

Summary of Findings | xxix
and 28 percent of men say that a female teacher with AIDS should be allowed to continue teaching. A relatively lower proportion of women and men (34 percent and 22 percent, respectively) say they would buy fresh vege-tables from a shopkeeper with AIDS. The percentage expressing accepting attitudes on all four measures is low: 11 percent among women and 3 percent among men.
HIV-Related Behavioral Indicators. Just over 1 percent of men age 15-49 reported having had two or more sexual partners during the 12 months prior to the survey, with men reporting a mean number of just under two partners in their lifetime. Among men with two or more partners in the 12 months preceding the survey, 19 percent used a condom at last sex. Five percent of men reported that they had engaged in paid sex in the year before the survey, and among those who paid for sex, only 26 percent reported using a condom the last time they paid for sex.
DOMESTIC VIOLENCE
The 2009-10 TLDHS included a series of questions that focus on specific aspects of domestic and interpersonal violence, including acts of physical, sexual, and emotional violence. Due to ethical considerations, only one woman was administered the domestic violence module in each selected household, and the violence module was not administered if privacy could not be obtained.
Approximately one-third of women (38 percent) have experienced physical violence since age 15. One percent of women experienced physical violence often, while 28 percent experienced physical violence sometimes in the past 12 months. Urban women are more likely than rural women to have experienced physical violence since the age of 15 (49 percent compared with 35 percent). This is corroborated by the fact that more than half of the women in Dili district, which is primarily urban, reported experiencing physical violence since the age of 15 years. Women in Manufahi (76 percent) are most likely to report having ever experienced physical violence. Experience of physical violence in the past 12 months is highest among women in Manufahi (65 percent) and lowest in Ainaro (8 percent). Among ever-married women who have ever experienced physical violence, 74 percent reported that a current husband or partner committed the physical violence against them, while 6 percent reported that they experienced physical violence by a former husband/partner.
Other perpetrators commonly reported by ever-married women were mother/stepmother (34 percent) and father/stepfather (26 percent), sisters and brothers (11 percent), and other relatives (6 percent).
About 3 percent of women have experienced sexual violence, with the proportion of women who have experienced sexual violence ranging from less than 1 percent in Viqueque to 7 percent in Baucau, Lautem, and Aileu. For 16 percent of women who ever experienced sexual violence, the first experience of such violence occurred at age 15-19; 6 percent first experienced sexual violence at age 10-14; and less than 1 percent first experienced sexual violence before age 10. One in ten women who experienced sexual violence first experienced it at age 20-49. The main perpetrators of sexual violence against ever-married women are current husbands/ partners (71 percent) or former husbands/partners (9 percent).
The findings from the survey also indicate that overall, 4 percent of women in Timor-Leste experienced physical violence during pregnancy.
Violence by husbands against wives is not the only form of spousal violence; women may sometimes be the perpetrators of violence. Six percent of married women report that they have initiated physical violence against their current or most recent husbands, while 5 percent say that they have committed such violence in the 12 months preceding the survey.
About one in five women (24 percent) who experience violence seek help. Women who experience both physical and sexual violence (50 percent) are most likely to seek help. Seven percent of women who experienced violence in Manufahi sought help, compared with one in two women in Covalima (51 percent).


Millennium Development Goal Indicators | xxxi
MILLENNIUM DEVELOPMENT GOAL INDICATORS
Millennium Development Goal Indicators
Timor-Leste 2009-10
Indicator
Sex Total Male Female
1.8 Prevalence of underweight children under five years of age 45.5 43.8 44.7 2.1 Net attendance ratio in primary school1 70.3 77.4 71.1 2.3 Literacy rate of 15-24 year-olds 86.1 84.1 na 3.1 Ratio of girls to boys in primary, secondary and tertiary education na na 93.3 4.1 Under five mortality rate2 85 76 64 4.2 Infant mortality rate2 59 53 45 4.3 Percentage of 1 year old children immunized against measles 69.0 66.5 67.8 5.1 Maternal mortality ratio3 na na 557 5.2 Percentage of births attended by skilled health personnel na na 29.9 5.3 Contraceptive prevalence rate4 na 22.3 na 5.4 Adolescent birth rate5 na 51 na 5.5 Antenatal care coverage At least one visit na 87.5 na Four or more visits na 55.1 na 5.6 Unmet need for family planning na 30.8 na 6.2 Condom use at last high-risk sex6 13.2 * na
6.3 Proportion of population aged 15-24 years with comprehensive
correct knowledge of HIV/AIDS 19.7 12.2 na
6.4 Ratio of school attendance of orphans to school attendance of
non-orphans aged 10-14 years 0.82 0.68 0.75 6.7 Percentage of children under five sleeping under ITN 40.7 41.4 41.0
6.8 Percentage of children under five with fever treated with
appropriate antimalarial drugs 6.4 5.1 5.7
Urban Rural Total
7.8 Percentage of population with sustainable access to an improved
water source 88.2 56.6 64.0 7.9 Percentage of population with access to improved sanitation 65.9 35.8 43.0
Note: An asterisk indicates that a figure is based on fewer than 25 unweighted cases and has been suppressed. 1 Net attendance ratio measured in the TLDHS approximates MDG indicator 2.1, Net enrollment ratio. 2 Expressed in terms of deaths per 1,000 live births 3 Expressed in terms of maternal deaths per 100,000 live births 4 Percentage of currently married women using any method of contraception 5 Equivalent to the age-specific fertility rate for women age 15-19, expressed in terms of births per 1,000 women age 15-19. 6 High-risk sex is defined as sexual intercourse with a non-marital, non-cohabiting partner. Expressed as a percentage of men and women age 15-24 who had high-risk sex in the past 12 months.
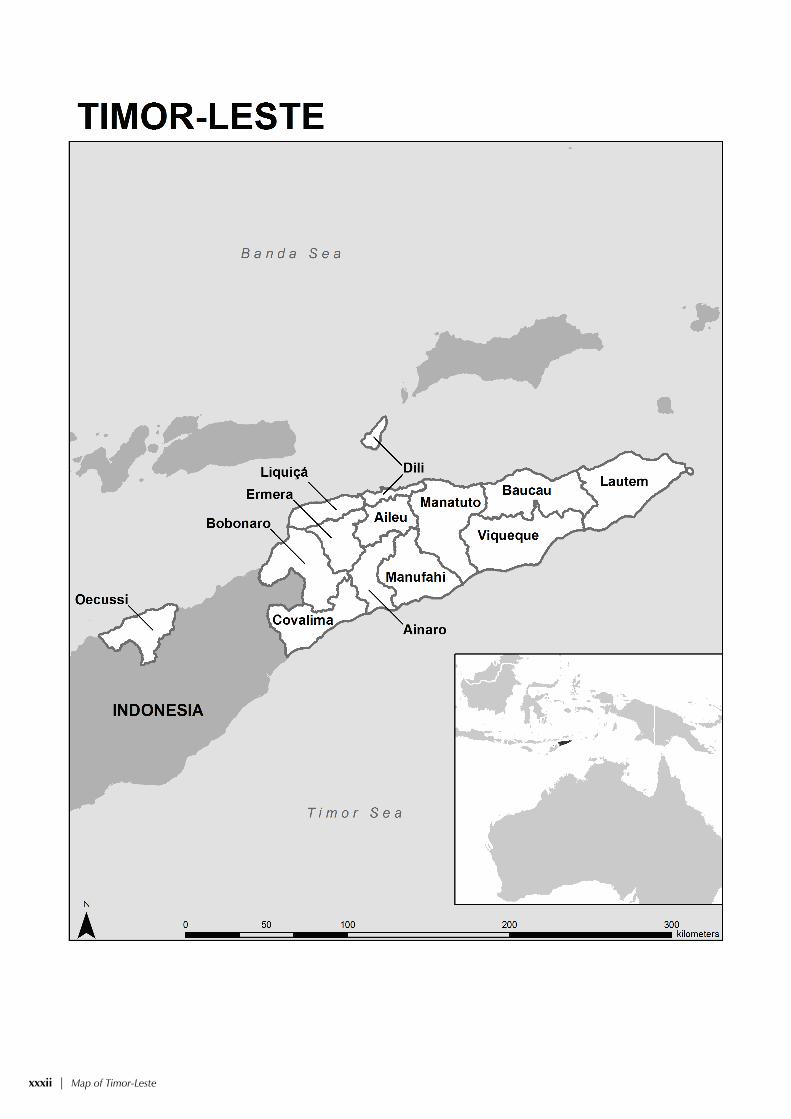
xxxii | Map of Timor-Leste

Introduction | 1
INTRODUCTION 1
1.1 HISTORY, GEOGRAPHY, AND ECONOMY
1.1.1 History
Timor-Leste is a small country in Southeast Asia. It occupies primarily the eastern half of the island of Timor, with West Timor being part of the Republic of Indonesia. Timor-Leste includes the nearby islands of Ataúro and Jaco, and also Oecussi, an exclave in Indonesian West Timor. The first inhabitants are thought to be descended from Australoid and Melanesian people. Contact between the Portuguese and the island of Timor began in the early 16th century, with trade and eventual colonization occurring in the middle of the century. In 1859, the western portion of the island was ceded to the Dutch. During World War II, Japan occupied Timor-Leste from 1942 to 1945. Portugal resumed colonial authority after the Japanese defeat.
The country declared independence from Portuguese rule on November 28, 1975, but was invaded and occupied by Indonesian forces just nine days later on December 7, 1975. It was incorporated into Indonesia in July 1976 as a province known as Timor-Timur. Between 1974 and 1999, there were an estimated 102,800 conflict-related deaths (approximately 18,600 killings and 84,200 “excess” deaths from hunger and illness), the majority of which occurred during the Indonesian occupation (UNESCO, 2009).
On August 30, 1999, in a UN-sponsored referendum, an overwhelming majority of the Timorese people voted for independence from Indonesia. Immediately following the referendum, however, anti-independence Timorese militias organized with support from the Indonesian military and began a punitive “scorched-earth” campaign. The majority of the country’s infrastructure was destroyed, including homes, irrigation and water supply systems, schools, and nearly all of the country’s electrical grid. The militias killed approximately 1,400 Timorese and forcibly pushed 300,000 people into West Timor as refugees (CIA, 2010). On September 20, 1999, the International Force for East Timor (INTERFET) began deploying to the country and brought the violence to an end. Following a transitional period administered by the United Nations under the United Nations administration in East Timor (UNTAET), Timor-Leste was internationally recognized as an independent country on May 20, 2002. The country became officially known as the Democratic Republic of Timor-Leste. Kay Rala Xanana Gusmão became the first president, and Mari Alkatiri assumed the role of first prime minister.
The relationship between the armed forces and the police remained fragile, and the authority of the state faced multiple challenges. In early 2006, following claims of discrimination within the military of Timor-Leste, nearly 600 military personnel deserted their barracks and were eventually relieved of duty. In April, riots broke out in Dili among rival groups within the military and police. Renewed fighting between the pro-government troops and disaffected Falentil troops broke out in May 2006 and resulted in further destruction of property. Forty people were reported as killed, and more than 20,000 residents fled their homes to internally displaced persons camps outside of the city (Head, 2006). In July 2006, after calls for his resignation, Prime Minister Alkatiri stepped down and was replaced by Jose Ramos-Horta. Following the most recent presidential elections held in April 2007, Jose Ramos-Horta became the president on May 20, 2007 and Kay Rala Xanana Gusmão was sworn in as the Prime Minister on August 8, 2007 (Wikipedia, 2010).

2 | Introduction
1.1.2 Geography
Timor-Leste is variously known as Timor-Timur, timur meaning “east” in Malay; Timor-Leste, leste meaning “east” in Portuguese; and Timor Lorosa’e, Lorosa’e meaning “rising sun” in Tetum. The island of Timor is part of the Malay Archipelago and is the largest and easternmost of the Lesser Sunda Islands. To the north of the mountainous island are the Ombai Strait and Wetar Strait, to the south is the Timor Sea, which separates the island from Australia, and to the west lies the Indonesian province of East Nusa Tenggara. The highest point of Timor-Leste is Mount Tatamailau at 2,963 meters. The island of Timor is located at coordinates between 8°50′S and 125°55′E, and the country covers a total area of 14,919 square kilometers (National Statistics Directorate, 2006).
The local climate is tropical and generally hot and humid, characterized by distinct rainy and dry seasons. Timor-Leste is divided into 13 administrative districts, 65 sub-districts, and 442 Sucos and 2,225 aldeias. The 13 districts are Ainaro, Alieu, Baucau, Bobonaro, Covalima, Dili, Ermera, Lautem, Liquiçá, Manatuto, Manufahi, Oecussi, and Viqueque.
Thirty percent of the population lives in the urban areas, and the rest live in rural areas (NSD, 2010). Dili is the capital. It is the largest city and the main port. The second-largest city is the eastern town of Baucau. Dili has the only functioning international airport, though there is also an airstrip in Baucau that is used for domestic flights.
Several languages are spoken in the country. Tetum is the most common language in Timor-Leste and is the first official national language. Portuguese, spoken by fewer people, is the other official language. English and Indonesian are working languages.
1.1.3 Economy
Timor-Leste’s economy is one of the poorest in the world (CIA, 2010). During colonization and even before then, Timor-Leste was best known for its sandalwood. In late 1999, about 70 percent of the economic infrastructure of Timor-Leste was destroyed by Indonesian troops and anti-independence militias. Some 300,000 people fled westward. Over the next three years, a massive international program led by the United Nations and manned by civilian advisers, peacekeepers, and police officers led to substantial reconstruction in the country (CIA, 2010).
Timor-Leste still suffers from the aftereffects of the conflict. The country faces great challenges in continuing to rebuild infrastructure and strengthen the civil administration. One promising long-term project has been the joint development with Australia of petroleum and natural gas resources in the southeastern waters off Timor. Following independence, Timor-Leste negotiated the Timor Sea Treaty with Australia. This treaty replaced a previous agreement, the Timor Gap treaty, brokered between Indonesia and Australia in 1989. The Timor Sea Treaty established the Joint Petroleum Development Area (JPDA), which is administered jointly by both countries. Under the terms of the treaty, Timor-Leste receives 90 percent of the revenue from petroleum production in the JPDA, and Australia receives the remaining 10 percent.
Agriculture and fishery are the backbone of the Timorese economy, and coffee plantations have been of major significance. In 2007, a poor harvest led to deaths from starvation in several parts of the country, and 11 districts required food supplies through international aid.
The 2007 Timor-Leste Survey of Living Standards reported that nearly 50 percent of the Timorese lived below the national poverty line, estimated at $0.88 per capita per day. Based on a recent survey-to-survey imputation calculation, the incidence of poverty in the country is predicted to have declined by 9 percentage points between 2007 and 2009 (MOF, 2010). Timor-Leste’s Human Development Index for 2010 is 0.502—positioning the country at 120 out of 169 countries and areas (UNDP, 2010). This is an increase of 17 percent from 0.428 in 2005. During the same period, Timor-Leste’s life expectancy at birth increased by over 2 years.

Introduction | 3
The government of Timor-Leste has laid out the Fourth Constitutional Government Program for 2007-2012 as the country’s development strategy for the current five years. It defines the long-term development goals in terms of reducing poverty and promoting the equitable growth and life of the Timorese population. The Office of the Prime Minister is preparing the Strategic Development Plan to address the national priorities for the country over the period 2011-2030.
1.2 POPULATION
The first census following independence was conducted in 2004, and the second census was completed in August 2010. According to the 2004 Census, the population of Timor-Leste is 923,198 and the annual growth rate is 5.3 percent (NSD, 2006). The population increased by 24 percent over the last 15 years, growing from 747,547 in 1990 to 923,198 in 2004 (NSD, 2006). The population is currently estimated at 1,066,582 with an annual growth rate of 2.4 percent between the 2004 Census and the 2010 Census (NSD, 2010). According to the 2004 Census, life expectancy was estimated at 59 years, and increased to 62 years according to the 2010 Census.
1.3 POPULATION AND REPRODUCTIVE HEALTH POLICIES AND PROGRAMS
Shortly after the country gained independence, the Ministry of Health initiated the first National Health Policy Framework (NHPF) for 2002-12, which prioritizes the health needs of the Timorese people and emphasizes the importance of understanding the social determinants of health within the local cultural context. The NHFP seeks to “provide quality of health for the East Timorese by establishing and developing a cost-effective and needs-based health system which will specially address the health issues and problems of women, children, and other vulnerable groups, particularly the poor, in a participatory way” (MOH, 2002a).
The NHPF serves as the basis for the formulation of the National Health Promotion Strategy (NHPS) and the National Reproductive Health Strategy (NRHS), which is an outcome of the 1994 International Conference on Population and Development (ICPD) held in Cairo (MOH, 2004a). The primary objectives of the NRHS are:
• to substantially increase the level of knowledge in the general population on issues related to sexuality and reproductive health;
• to promote family planning in order to stabilize the population growth rate and reduce the incidence of unintended, unwanted, and mistimed pregnancies;
• to ensure that all women and men have access to basic reproductive health care services, health promotion, and information on issues related to reproduction;
• to reduce the level of maternal mortality and morbidity; • to reduce the level of prenatal and neonatal mortality and morbidity; • to reduce the burden of STIs/HIV; • to meet changing reproductive health needs over the life cycle and to improve the health
status of people of reproductive age.
Family planning is one of the major components of the Timor-Leste planned development activities under the First Development Plan, 2002-2007. The Timor-Leste Family Planning and Maternal and Child Health project (FP/MCH) functions under the Ministry of Health. The Ministry of Health endorsed the National Family Planning Policy for Timor-Leste in March 2004. The primary objective of this policy is to address population growth and provide guidance on the development and implementation of family planning programs and activities in Timor-Leste (MOH, 2004b).
The FP/MCH project began in 2002, and since then it has gradually involved all 13 districts of Timor-Leste. Family planning services have become an integral part of government health services. Currently, temporary modern family planning methods (male condoms, contraceptive pills, and injectables) are provided by peripheral health workers and volunteers on a regular basis through national, regional, zonal, and district hospitals; primary health care centers/health centers; and health
4 | Introduction
posts and sub-health posts. Services such as implants and IUD insertions are available only at a limited number of hospitals, health centers, and selected health posts where trained personnel are available. Depending on the district, sterilization services are provided at some static sites in the 13 districts through scheduled “seasonal” or mobile outreach services. A number of local nongovernmental organizations (NGOs) and international nongovernmental organizations (INGOs) also are currently involved in the delivery of family planning services at the grass roots level.
1.4 OBJECTIVES OF THE SURVEY
The principal objective of the 2009-10 Timor-Leste Demographic and Health Survey (TLDHS) was to provide current and reliable data on fertility and family planning behavior, child mortality, adult and maternal mortality, child nutritional status, the utilization of maternal and child health services, and knowledge of HIV/AIDS. The specific objectives of the survey were to:
• collect data at the national level that will allow the calculation of key demographic rates; • analyze the direct and indirect factors that determine the levels and trends in fertility; • measure the level of contraceptive knowledge among women and men, and measure the
level of practice among women by method, according to urban or rural residence; • collect quality data on family health, including immunization coverage among children,
prevalence and treatment of diarrhea and other diseases among children under age 5, and maternity care indicators, including antenatal visits, assistance at delivery, and postnatal care;
• collect data on infant and child mortality and on maternal and adult mortality; • obtain data on child feeding practices, including breastfeeding, and collect anthropometric
measures to use in assessing the nutritional status of women and children; • collect information on knowledge of tuberculosis (TB), knowledge of the spread of TB,
and attitudes towards people infected with TB among women and men; • collect data on use of treated and untreated mosquito nets, persons who sleep under the
nets, use of drugs for malaria during pregnancy, and use of antimalarial drugs for treatment of fever among children under age 5;
• collect data on knowledge and attitudes of women and men about sexually transmitted infections and HIV/AIDS, and evaluate patterns of recent behavior regarding condom use;
• collect information on the sexual practices of women and men; their number of sexual partners in the past 12 months, and over their lifetime; risky sexual behavior, including condom use at last sexual intercourse; and payment for sex;
• conduct hemoglobin testing on women age 15-49 and children age 6-59 months in a sub-sample of households selected for the survey to provide information on the prevalence of anemia among women of reproductive age and young children;
• collect information on domestic violence
This information is essential for informed policy decisions, planning, monitoring, and evaluation of programs on health in general, and on reproductive health in particular, at both the national and district levels. A long-term objective of the survey is to strengthen the technical capacity of government organizations to plan, conduct, process, and analyze data from complex national population and health surveys. Moreover, the 2009-10 TLDHS provides national and district-level estimates on population and health that are comparable to data collected in similar surveys in other developing countries. The first Demographic and Health Survey (DHS) in Timor-Leste was done in 2003. Unlike the 2003 DHS, however, the 2009-10 TLDHS was conducted under the worldwide MEASURE DHS program, funded by the United States Agency for International Development (USAID) and with technical assistance provided by ICF Macro. Data from the 2009-10 TLDHS allow for comparison of information gathered over a longer period of time and add to the vast and growing international database on demographic and health variables.

Introduction | 5
1.5 ORGANIZATION OF THE SURVEY
The TLDHS 2009-10 was implemented by the National Statistics Directorate of the Directorate General for Analysis and Research of the Ministry of Finance, under the aegis of the Ministry of Health (MOH) of Timor-Leste.
Technical support was provided by ICF Macro, and financial support was provided by USAID, the Government of Australia (AusAID), the Government of Ireland (Irish AID), the United Nations Population Fund (UNFPA), the United Nations Children’s Fund (UNICEF), the United Nations Development Fund (UNDP), and the World Health Organization (WHO). UNFPA supported the survey with administrative, logistical, and technical assistance.
A steering committee was formed to be responsible for coordination, oversight, advice, and decision making on all major aspects of the survey. The steering committee was composed of representatives from various ministries and key stakeholders, including the MOH, National Statistics Directorate, USAID, and international NGOs.
1.6 SAMPLE DESIGN
The primary focus of the 2009-10 TLDHS was to provide estimates of key population and health indicators, including fertility and mortality rates, for the country as a whole and for urban and rural areas separately. In addition, the sample was designed to provide estimates of most key variables for the 13 districts.
1.6.1 Sampling Frame
The TLDHS used the sampling frame provided by the list of census enumeration areas (EAs) with population and household information from the 2004 Population and Housing Census (PHC). Administratively, Timor-Leste is divided into 13 districts. Stratification is achieved by separating each of the 13 districts into urban and rural areas. In total, 26 sampling strata were created. Samples were selected independently in every stratum, through a two-stage selection process. Implicit stratification was achieved at each of the lower administrative levels by sorting the sampling frame before sample selection, both according to administrative units and also by using a probability proportional-to-size selection at the first stage of sampling. The implicit stratification also allowed for the proportional allocation of sample points at each of the lower administrative levels.
1.6.2 Sample Selection
At the first stage of sampling, 455 enumeration areas (116 urban areas and 339 rural areas) were selected with probability proportional to the EA size, which is the number of households residing in the EA at the time of the census. A complete household listing operation in all of the selected EAs is the usual procedure to provide a sampling frame for the second-stage selection of households. However, a complete household listing was only carried out in select clusters in Dili, Ermera, and Viqueque, where more than 20 percent of the households had been destroyed. In all other clusters, a complete household listing was not possible because the country does not have written boundary maps for clusters. Instead, using the GPS coordinate locations for structures in each selected cluster as provided for by the 2004 PHC, households were randomly selected using their Geographic Information System (GIS) location identification in the central office. A map for each cluster was then generated, marking the households to be surveyed with their location identification. The maps also contained all the other households, roads, rivers, and major landmarks for easier location of selected households in the field. To provide statistically reliable estimates of key demographic and health variables and to cater for nonresponse, 27 households each were selected.

6 | Introduction
The survey was designed to cover a nationally representative sample of 12,285 residential households, taking into account nonresponse; to obtain completed interviews of 11,800 women age 15-49 in every selected household; and to obtain completed interviews of 3,800 men age 15-49 in every third selected household.
1.7 QUESTIONNAIRES
Three questionnaires were administered in the TLDHS: the Household Questionnaire, the Woman’s Questionnaire, and the Man’s Questionnaire. These questionnaires were adapted from the standard MEASURE DHS core questionnaires to reflect the population and health issues relevant to Timor-Leste based on a series of meetings with various stakeholders from government ministries and agencies, NGOs, and international donors. The final draft of each questionnaire was discussed at a questionnaire design workshop organized by NSD on March 10, 2009, in Dili. These questionnaires were then translated and back translated from English into the two main local languages−Tetum and Bahasa—and pretested prior to the main fieldwork to ensure that the original meanings of the questions were not lost in translation.
The Household Questionnaire was used to list all the usual members and visitors in the selected households. Some basic information was collected on the characteristics of each person listed, including age, sex, education, and relationship to the head of the household. For children under age 18, survival status of the parents was determined. The main purpose of the Household Questionnaire was to identify women and men who were eligible for the individual interview. The Household Questionnaire also collected information on characteristics of the household’s dwelling unit, such as the source of water, type of toilet facilities, materials used for the floor of the house, ownership of various durable goods, and ownership of mosquito nets. Additionally, the Household Questionnaire was used to record height and weight measurements for women age 15-49 and children under age 5, and to list hemoglobin measurements for women age 15-49 and children age 6-59 months.
The Woman’s Questionnaire was used to collect information from women age 15-49. These women were asked questions on the following topics:
• Background characteristics (education, residential history, media exposure, etc.) • Birth history and childhood mortality • Knowledge and use of family planning methods • Fertility preferences • Antenatal, delivery, and postnatal care • Breastfeeding and infant feeding practices • Vaccinations and childhood illnesses • Marriage and sexual activity • Woman’s work and husband’s background characteristics • Awareness and behavior regarding AIDS and other sexually transmitted infections (STIs) • Maternal mortality • Domestic violence
The Man’s Questionnaire was administered to all men age 15-49 living in every third household. The Man’s Questionnaire collected much of the same information found in the Woman’s Questionnaire but was shorter because it did not contain a detailed reproductive history or questions on maternal and child health, nutrition, maternal mortality, or domestic violence.

Introduction | 7
1.8 HEMOGLOBIN TESTING
In one-third of the households selected for the 2009-10 TLDHS, women age 15-49 and children age 6-59 months were tested for anemia. Anemia testing was only carried out if consent was provided by the respondent and, in the case of a minor, by the parent or guardian. The protocol for hemoglobin testing was approved by the Ministry of Health in Timor-Leste.
Hemoglobin testing is the primary method for diagnosis of anemia. In the 2009-10 TLDHS, testing was done using the HemoCue system. A consent statement was read to the eligible woman and to the parent or responsible adult of young children and women age 15-17. This statement explained the purpose of the test, informed prospective subjects and/or their caretakers that the results would be made available as soon as the test was completed, and requested permission for the test to be carried out.
Before the blood was taken, the finger was wiped with an alcohol prep swab and allowed to air-dry. Then the palm side of the end of one finger was punctured with a sterile, nonreusable, self-retractable lancet. A drop of blood was collected with a HemoCue microcuvette and placed in a HemoCue photometer where the results were displayed. For children age 6-11 months who were particularly undernourished and thin, a heel puncture was made to draw a drop of blood. The results were recorded in the Household Questionnaire, as well as on a brochure, given to each woman, parent, or responsible adult, which explained what the results meant.
1.9 PRETEST, TRAINING, AND FIELDWORK
1.9.1 Pretest
For the pretest, 10 interviewers were recruited to interview in the two local languages. The training for the pretest and fieldwork took place from April 27 to May 23, 2009. Both rural and urban households were selected for the pretest in three districts (Bobonaro, Viqueque, and Dili). Based on the findings of the pretest, the Household, the Woman’s, and the Man’s Questionnaires were further refined in both of the local languages.
1.9.2 Training
The National Statistics Directorate (NSD), in close coordination with the MOH, recruited and trained 101 persons for the fieldwork to serve as supervisors, field editors, male and female interviewers, quality control staff, and reserves. They participated in the main training held in Dili from July 13 – August 8, 2009. Staff from MOH, NSD, and ICF Macro led the four-week training course, which was conducted mainly in Tetum and included lectures, presentations, practical demonstrations, and practice interviewing in small groups as well as several days of field practice. The participants also received anthropometric training and training in hemoglobin testing.
After the training on how to complete the Household, Woman’s, and Man’s Questionnaires was completed, all trainees were given written and oral tests to gauge their understanding of the TLDHS questionnaires and interviewing techniques. On the basis of their scores on the exam and overall performance in the classroom and during field practice, 88 trainees were selected to participate in the main fieldwork. From the group, 10 of the best trainees were selected as quality control staff, 13 of the best male trainees were selected as supervisors, and 13 of the best female interviewers were identified as field editors. The remaining 52 trainees were selected to be interviewers. All selected field staff were trained in anthropometric measurement taking.
After completing the interviewers’ training, the field editors and supervisors were trained for an additional three days on how to supervise the fieldwork and edit questionnaires in the field, in order to ensure data quality. The participants also received training on hemoglobin testing.

8 | Introduction
1.9.3 Fieldwork
Data collection began on August 10, 2009, by 13 teams consisting of three female interviewers, one male interviewer, a male supervisor, and a female field editor. Fieldwork was completed on February 7, 2010. Fieldwork supervision was coordinated at NSD; 6 quality control teams made up of one male and one female member each, monitored data quality. Additionally, close contact between NSD and the teams was maintained through field visits by senior staff, members of the steering committee, and ICF Macro staff. Regular communication was also maintained through cell phones.
1.10 DATA PROCESSING
The processing of the TLDHS results began soon after the start of fieldwork. Completed questionnaires were returned periodically from the field to the NSD data processing center in Dili, where they were entered and edited by 13 data processing personnel who were specially trained for this task. The data processing personnel included a supervisor, a questionnaire administrator, 2 office editors, and 13 data entry operators. The concurrent processing of the data was an advantage because field check tables could be generated to monitor various data quality parameters while the teams were still in the field. As a result, specific feedback was given to the teams to improve performance. The data entry and editing phase of the survey was completed by the end of February 2010.
1.11 RESPONSE RATES
Table 1.1 shows household and individual response rates for the 2009-10 TLDHS. A total of 12,128 households were selected for the sample, of which 11,671 were found to be occupied during data collection. Of these existing households, 11,463 were successfully interviewed, giving a household response rate of 98 percent.
Table 1.1 Results of the household and individual interviews
Number of households, number of interviews, and response rates, according to residence (unweighted), Timor-Leste 2009-10
Result
Residence Total
Urban Rural
Household interviews Households selected 3,012 9,116 12,128 Households occupied 2,851 8,820 11,671 Households interviewed 2,745 8,718 11,463
Household response rate1 96.3 98.8 98.2
Interviews with women age 15-49 Number of eligible women 3,625 10,171 13,796 Number of eligible women interviewed 3,233 9,904 13,137
Eligible women response rate2 89.2 97.4 95.2
Interviews with men age 15-49 Number of eligible men 1,183 3,238 4,421 Number of eligible men interviewed 1,015 3,061 4,076
Eligible men response rate2 85.8 94.5 92.2
1 Households interviewed/households occupied2 Respondents interviewed/eligible respondents

Introduction | 9
In these households, 13,796 women were identified as eligible for the individual interview. Interviews were completed with 13,137 women, yielding a response rate of 95 percent. Of the 4,421 eligible men identified in the selected sub-sample of households, 4,076 or 92 percent were successfully interviewed. Response rates were higher in rural than urban areas, with the rural-urban difference in response rates more marked among eligible men than among eligible women. The tabulations in the rest of the report discuss in detail the main demographic and health findings from interviews with these eligible women and men.


Household Population and Housing Characteristics | 11
HOUSEHOLD POPULATION AND HOUSING CHARACTERISTICS 2
This chapter presents descriptive summaries of the social, economic, and demographic characteristics of households sampled for the survey. The basic characteristics of the sampled population (i.e., age, sex, education, and place of residence) coupled with the socioeconomic conditions of the households form the basis of the background information used to analyze most key demographic and health indices in this report. This information is crucial for the interpretation of key demographic and health indicators. From these indicators, meaningful policies and programs for interventions are drawn, and the representativeness of the survey is measured.
One focus of this chapter is to describe the environment in which men, women, and children live. This description presents the general characteristics of the population, such as the age-sex structure, literacy and education, household arrangements (headship, size), and housing facilities (sources of water supply, sanitation facilities, dwelling characteristics, and household possessions). A distinction is made between urban and rural areas because many of these indicators differ depending on place of residence.
In the 2009-10 TLDHS, a household is defined as a person or a group of persons, related or unrelated, who live together in the same house or compound, share the same housekeeping arrange-ments, and eat together as a unit. The Household Questionnaire was used to collect information on all usual residents and visitors who spent the night preceding the survey in the household. This mode of data collection allows the analysis of either the de jure (usual) residents of the household or the de facto household population (all individuals who spent the night preceding the interview in the household, including visitors).
Wherever possible, the 2009-10 TLDHS data are compared with data from other surveys conducted in the country, such as the 1997 Indonesia DHS (CBS et al., 1998), the 2002 Multiple Indicator Cluster Survey (MICS) (UNICEF, 2003), the 2003 DHS (MOH et al., 2004), and the 2007 Timor-Leste Survey of Living Standards (TLSLS) (NSD, 2007). However, when comparing the 2009-10 TLDHS with other surveys, caution should be exercised in interpreting the results because the sample size, design, study population, period of coverage, and methods of estimation of key indicators may differ and therefore not be exactly comparable.
2.1 HOUSEHOLD POPULATION BY AGE AND SEX
Age and sex are important variables in analyzing demographic trends. Table 2.1 and Figure 2.1 present the distribution of the de facto household population in the 2009-10 TLDHS survey by five-year age groups, according to sex and urban-rural residence. The age structure is typical of a young population characterized by high fertility. This type of population structure imposes a heavy burden on the social and economic assets of a country. Although the results of the 2009-10 TLDHS indicate that 45 percent of the population is under age 15, this percentage represents a small improvement over the results of the 2003 survey in which 51 percent of the population was under age 15. About four percent of the population is in the older age groups (age 65 or older), and this percentage has not changed since 2003.

12 | Household Population and Housing Characteristics
Table 2.1 Household population by age, sex, and residence
Percent distribution of the de facto household population by five-year age groups, according to sex and residence, Timor-Leste 2009-10
Age
Urban Rural Total Male Female Total Male Female Total Male Female Total
<5 14.8 14.7 14.8 15.3 15.0 15.2 15.2 15.0 15.1 5-9 16.1 15.0 15.6 16.3 15.7 16.0 16.3 15.6 15.9 10-14 12.7 13.0 12.8 14.4 13.9 14.1 14.0 13.7 13.8 15-19 11.1 11.0 11.1 10.4 9.7 10.1 10.6 10.0 10.3 20-24 8.4 10.0 9.2 6.2 6.9 6.6 6.8 7.6 7.2 25-29 7.4 7.7 7.6 5.1 5.5 5.3 5.7 6.0 5.8 30-34 5.4 5.7 5.5 4.0 4.6 4.3 4.3 4.8 4.6 35-39 6.2 5.1 5.6 5.1 5.3 5.2 5.4 5.3 5.3 40-44 4.7 4.7 4.7 4.6 4.3 4.4 4.6 4.4 4.5 45-49 3.6 3.4 3.5 4.1 3.6 3.8 3.9 3.6 3.8 50-54 3.2 3.3 3.3 3.4 4.2 3.8 3.3 4.0 3.7 55-59 2.1 1.5 1.8 2.6 2.3 2.5 2.5 2.1 2.3 60-64 1.9 2.0 2.0 4.1 4.6 4.3 3.6 4.0 3.8 65-69 1.1 1.2 1.1 2.3 2.3 2.3 2.0 2.1 2.0 70-74 0.6 0.7 0.6 1.0 1.2 1.1 0.9 1.1 1.0 75-79 0.3 0.2 0.3 0.6 0.4 0.5 0.5 0.4 0.4 80+ 0.3 0.6 0.4 0.5 0.5 0.5 0.4 0.5 0.5
Total 100.0 100.0 100.0 100.0 100.0 100.0 100.0 100.0 100.0 Number 8,072 7,618 15,689 25,555 25,647 51,202 33,626 33,265 66,891
Figure 2.1 Population Pyramid
80 +75-7970-7465-6960-6455-5950-5445-4940-4435-3930-3425-2920-2415-1910-14
5-9<5
Age
0246810 0 2 4 6 8 10
Timor-Leste 2009-10
Percent
Female Male
2.2 HOUSEHOLD COMPOSITION
The size and composition of households and the sex of the head of household are important factors affecting the welfare of the household. Table 2.2 shows the information collected in the 2009-10 TLDHS on the sex of the head of household and the mean household size. More than four in five (88 percent) households are headed by males, while one-eighth (12 percent) of households are headed by females. The percentage of female-headed households is higher in rural areas (13 percent) than in urban areas (11 percent).
The mean household size in Timor-Leste is 5.8 persons, with households in urban areas only marginally larger (5.9 persons) than those in rural areas (5.8 persons). Three percent of all households are single-person households, and the proportion of single-person households does not differ much between urban and rural areas. A sizeable proportion of households (15 percent) have 9 or more usual members, with urban households slightly more likely to be large than rural households.

Household Population and Housing Characteristics | 13
Table 2.2 Household composition
Percent distribution of households by sex of head of household and by household size; mean size of household, and percentage of households with orphans and foster children under 18, according toresidence, Timor-Leste 2009-10
Characteristic Residence
Total Urban Rural
Household headshipMale 88.8 87.4 87.7Female 11.2 12.6 12.3
Total 100.0 100.0 100.0
Number of usual members0 0.1 0.0 0.01 2.9 3.2 3.12 6.2 6.8 6.73 9.4 9.4 9.44 14.4 12.4 12.95 16.0 14.6 14.96 15.3 15.4 15.47 11.1 13.5 13.08 8.8 10.2 9.99+ 15.8 14.4 14.7
Total 100.0 100.0 100.0Mean size of households 5.9 5.8 5.8
Percentage of households with orphans and foster children under 18 Foster children1 18.0 17.6 17.7Double orphans 1.4 1.7 1.6Single orphans2 7.6 10.1 9.5Foster and/or orphan children 21.6 23.6 23.1
Number of households 2,695 8,768 11,463
Note: Table is based on de jure household members, i.e., usual residents. 1 Foster children are those under age 18 living in households where neither their mother nor their father is a de jure resident. 2 Single orphans includes children with one dead parent and an unknown survival status of the other parent.
2.2.1 Children’s Living Arrangements and Orphanhood
The 2009-10 TLDHS also collected information on the presence of foster children and orphans in the households. Foster children are defined here as children under age 18 living in households with neither their mother nor their father present; orphans are children with one or both parents dead. Foster children and orphans are of concern because they may be at increased risk of neglect or exploitation when their mothers or fathers are not present to assist them. Table 2.2 also shows that 23 percent of the households have orphans or foster children under age 18. The proportion of households in Timor-Leste with orphans or foster children is high and reflects the political turmoil in the country over the past two decades. Rural households are slightly more likely to have orphans or foster children than urban households. Eighteen percent of households have foster children, 10 percent have at least one single orphan (either parent is dead), and 2 percent have at least one double orphan (both parents are dead).
Detailed information on living arrangements and orphanhood for children under age 18 is presented in Table 2.3.1. Of the 34,411 children under age 18 reported in the 2009-10 TLDHS, about 82 percent live with both parents. About 7 percent live with their mother but not their father, with 4 percent living with their mother only even though their father is alive. About 2 percent live with their father but not their mother, with less than 1 percent living with their father even though their mother is alive. Nine percent of children under age 18 live with neither of their natural parents. Table 2.3.1 also provides data on the extent of orphanhood. Less than 1 percent of children under age 18 have lost both parents, while 7 percent have lost either their mother or father.

14 | Household Population and Housing Characteristics
The percentage of children not living with a biological parent increases with age from 4 percent of children age 0-4 years to 19 percent of children age 15-17 years. The highest proportion of children not living with a parent is in Bobonaro and Covalima (12 percent each), and the lowest is in Lautem and Oecussi (7 percent each). By wealth status, the proportion of children under age 18 not living with a natural parent rises from 8 percent among those in the lowest two wealth quintiles to 12 percent among those in the highest wealth quintile.
Table 2.3.1 Children’s living arrangements and orphanhood
Percent distribution of de jure children under age 18 by living arrangements and survival status of parents, the percentage of children not living with a biological parent, and the percentage of children with one or both parents dead, according to background characteristics, Timor-Leste 2009-10
Background characteristic
Living with both
parents
Living with mother but not
with father
Living with father but not with
mother Not living with either parent Missing information on father/ mother Total
Percentage not living
with a biological
parent
Percentage with one or
both parents dead1
Number of
children Father alive
Father dead
Mother alive
Mother dead
Both alive
Only father alive
Only mother
alive Both dead
Age 0-4 88.6 5.5 1.5 0.5 0.3 3.0 0.3 0.2 0.2 0.0 100.0 3.7 2.5 10,075 <2 89.7 6.7 1.3 0.2 0.1 1.6 0.2 0.1 0.1 0.0 100.0 2.0 1.8 3,876 2-4 87.9 4.7 1.6 0.6 0.4 3.9 0.3 0.3 0.2 0.0 100.0 4.7 2.9 6,198 5-9 84.5 3.3 2.5 0.8 1.3 5.9 0.6 0.7 0.5 0.0 100.0 7.6 5.6 10,672 10-14 77.0 2.3 4.7 1.1 2.4 8.9 1.1 1.4 1.0 0.0 100.0 12.4 10.6 9,284 15-17 68.4 2.5 6.3 1.2 2.5 13.0 1.6 2.4 2.0 0.1 100.0 19.1 14.9 4,381
Sex Male 81.7 3.7 3.3 0.8 1.5 6.6 0.8 0.9 0.7 0.0 100.0 9.0 7.2 17,607 Female 81.5 3.4 3.2 0.9 1.4 6.9 0.8 1.0 0.7 0.0 100.0 9.5 7.2 16,804
Residence Urban 81.8 3.2 2.9 1.3 0.9 7.5 0.7 1.0 0.7 0.1 100.0 9.8 6.2 7,890 Rural 81.6 3.7 3.4 0.7 1.6 6.6 0.8 0.9 0.7 0.0 100.0 9.0 7.5 26,521
District Aileu 85.8 1.6 3.3 0.1 1.8 5.4 0.3 1.1 0.6 0.0 100.0 7.5 7.2 1,424 Ainaro 77.2 5.7 3.9 1.3 2.7 6.4 1.2 0.7 0.8 0.0 100.0 9.1 9.4 2,041 Baucau 83.0 2.6 2.7 0.1 1.6 7.2 0.7 1.2 0.7 0.1 100.0 9.9 7.0 3,921 Bobonaro 77.1 3.8 4.4 1.3 1.7 9.0 0.7 1.2 0.8 0.0 100.0 11.7 8.8 3,175 Covalima 77.9 4.8 4.4 0.4 0.8 7.9 1.1 1.2 1.4 0.0 100.0 11.7 8.9 1,981 Dili 85.3 2.0 2.3 1.4 0.8 6.4 0.5 0.8 0.5 0.1 100.0 8.2 4.9 5,279 Ermera 77.4 7.2 3.3 1.5 1.3 6.6 0.9 0.9 0.8 0.0 100.0 9.2 7.3 4,429 Lautem 82.9 3.7 4.4 0.5 1.6 4.9 0.6 0.9 0.5 0.0 100.0 6.9 8.0 2,546 Liquiçá 81.2 3.8 3.0 0.8 1.9 6.9 0.6 1.0 0.7 0.0 100.0 9.3 7.2 2,042 Manatuto 85.0 1.7 2.9 0.5 0.8 7.3 0.4 0.7 0.6 0.0 100.0 9.0 5.5 1,553 Manufahi 80.1 4.5 2.1 1.5 1.2 8.5 1.0 0.5 0.6 0.0 100.0 10.6 5.4 1,305 Oecussi 86.4 1.7 3.2 0.1 1.4 4.4 1.2 0.9 0.6 0.0 100.0 7.1 7.3 2,260 Viqueque 82.3 2.3 3.5 0.1 1.9 7.3 0.6 0.9 1.0 0.0 100.0 9.9 8.0 2,455
Wealth quintile Lowest 82.7 3.3 4.5 0.4 1.5 5.3 0.9 0.5 0.9 0.0 100.0 7.6 8.3 7,204 Second 81.6 3.6 4.0 0.8 2.6 5.3 0.5 1.1 0.7 0.0 100.0 7.5 8.8 6,857 Middle 83.1 4.2 2.8 0.6 1.2 5.5 0.8 1.0 0.8 0.0 100.0 8.1 6.6 6,788 Fourth 79.5 3.7 3.1 1.2 1.2 8.6 1.1 1.0 0.7 0.0 100.0 11.4 7.0 6,772 Highest 81.1 3.2 1.9 1.1 0.8 9.3 0.5 1.2 0.6 0.1 100.0 11.6 5.1 6,790
Total <15 83.6 3.7 2.8 0.8 1.3 5.9 0.6 0.7 0.5 0.0 100.0 7.8 6.1 30,031
Total <18 81.6 3.6 3.3 0.8 1.5 6.8 0.8 1.0 0.7 0.0 100.0 9.2 7.2 34,411
Note: Table is based on de jure members, i.e., usual residents. 1 Includes children with father dead, mother dead, both dead, and one parent dead but missing information on survival status of the other parent.
2.2.2 School Attendance by Survivorship of Parents
Children who are orphaned may be at a greater risk of dropping out of school because of lack of financial and psychological support. The TLDHS included information to monitor such situations and collected information on school attendance of children age 10-14 by parental survival, which is presented in Table 2.3.2. The data confirm that children age 10-14 whose parents are both dead are less likely to be attending school (66 percent) than children whose parents are both living, with the child residing with at least one parent (87 percent). The overall ratio of school attendance of the former group to the latter group is 0.75. Further breakdown by background characteristics was not possible due to the low number of orphans.

Household Population and Housing Characteristics | 15
Table 2.3.2 School attendance by survivorship of parents
For de jure children 10-14 years of age, the percentage attending school by parental survival, according to background characteristics, Timor-Leste 2009-10
Background characteristic
Percentage attending school by survivorship of parents
Ratio1
Both parents
deceased Number
Both parents alive and
living with at least one parent Number
Sex Male 71.4 50 87.5 3,790 0.82 Female (58.8) 40 86.9 3,685 (0.68)
Residence Urban (77.8) 20 89.4 1,627 (0.87) Rural 62.3 70 86.6 5,847 0.72
Total 65.8 91 87.2 7,474 0.75
Note: Table is based only on children who usually live in the household. Figures in parentheses are based on 25-49 unweighted cases. 1 Ratio of the percentage with both parents deceased to the percentage with both parents alive and living with a parent
2.3 EDUCATIONAL ATTAINMENT OF HOUSEHOLD MEMBERS
Timor-Leste is beginning to rebuild itself and move forward as an independent nation following years of unrest and instability created by Indonesian rule, UN governance, and internal conflict. Education is important to this effort because it helps individuals make informed decisions that have a positive impact on their health and well-being. The educational system was completely disrupted from 1999 until 2000, with more than 90 percent of the schools damaged and no longer functional (UNESCO, 2009; Fleischhacker and Uhlin, 2004). Indonesian teachers left the country, and the textbooks and the school curricula were no longer relevant under a new government. Schools were vandalized and destroyed yet again after the 2006 crisis. Renewed efforts have since been under way to reconstruct the educational system in the country.
The country has gone through three different systems of education. The Portuguese introduced a western curriculum during the colonial period (1511-1975). Portuguese was the medium of instruction in schools; however, the vast majority of Timorese had limited access to education. Only a few elite Timorese men, primarily those who supported the Portuguese and who carried out administrative functions of the country, were educated (Fleischhacker and Uhlin, 2004). The basic compulsory education comprised nine years in the Portuguese system, with the first cycle (1o Ciclo) lasting four years (age 6 -9), the second cycle (2 o Ciclo) lasting two years (age 10-12), and the third cycle (3 o Ciclo) lasting three years (age 13-15). The first cycle is equivalent to primary education (escolas básicas), while the second and third cycles combined are equivalent to secondary (secundárias) education (AngloINFO, 2010).
During the Indonesian occupation, education was made accessible to the public. Indonesian teachers devoted themselves to promoting education in the country, with Bahasa Indonesia as the medium of instruction in schools. The Indonesian education system included six years of primary education, three years of lower secondary education (SMP), and three years of upper secondary education (SMA). In addition, higher education through a university was divided into Sarjana (S1) comprising four years, Pasca Sarjana (S2) comprising 2 years, and PhD (S3) comprising two years. There were also two years of pre-primary education, or kindergarten, known as Taman Kanak-Kanak.
The current system of education, which began in October 2008, consists of 6 years of basic or primary education (from age 6-11 for grades 1 through 6; 3 years of pre-secondary education (from age 12-14 for grades 7 through 9); and an additional three years of secondary education (from age 15-17 for grades 10 through 12). Secondary education is organized through two modalities (1) general secondary education, preparing students for university education, and (2) technical professional secondary education, preparing students for entry into the labor market (UNESCO, 2009).

16 | Household Population and Housing Characteristics
The Early Childhood Care and Education (ECCE) is not compulsory in Timor-Leste and is not considered a part of the formal educational system, although the National Education Policy 2007-2012 recognizes the importance of preschool education (UNESCO, 2009).
The impact of these three different systems of formal education in the country is reflected in the educational attainment of women and men interviewed in the 2009-10 TLDHS.
Early studies have reported that primary school enrolment among children changed little between 1999 and 2007, growing from 65 percent to 74 percent (UNESCO, 2009). In 2007 only 47 percent of children had completed primary school. The government set as a target the completion of primary school by all children by 2015 (NSD, 2007).
Table 2.4.1 shows the percent distribution of the de facto female household population age 6 and older by highest level of education attended or completed and according to background characteristics. Thirty-seven percent of women have never been to school, about 30 percent have some primary education, 5 percent completed only primary school, 26 percent have some secondary education or have completed secondary school, and about 2 percent have more than secondary school education.
Table 2.4.1 Educational attainment of the female household population
Percent distribution of the de facto female household populations age 6 and over by highest level of schooling attended or completed and median grade completed, according to background characteristics, Timor-Leste 2009-10
Background characteristic
No education
Some primary
Completed primary1
Some secondary
Completed secondary2
More than secondary
Don’t know/ missing Total Number
Median years
completed
Age 6-9 31.7 67.9 0.1 0.2 0.0 0.0 0.1 100.0 4,243 0.2 10-14 9.4 67.8 1.7 21.2 0.0 0.0 0.0 100.0 4,560 3.4 15-19 12.1 15.1 4.1 64.6 3.4 0.6 0.0 100.0 3,329 7.0 20-24 16.0 12.5 7.5 33.1 24.4 6.5 0.0 100.0 2,538 8.6 25-29 25.1 13.5 10.8 20.6 24.9 5.0 0.0 100.0 2,000 6.3 30-34 31.2 13.2 13.9 17.6 18.9 5.1 0.0 100.0 1,601 5.4 35-39 37.4 15.8 12.3 17.1 14.9 2.5 0.0 100.0 1,751 4.4 40-44 55.5 15.2 7.5 8.9 10.8 2.0 0.0 100.0 1,451 0.0 45-49 68.5 15.9 5.2 4.8 3.4 2.1 0.2 100.0 1,186 0.0 50-54 86.8 8.3 1.5 1.7 1.1 0.5 0.1 100.0 1,334 0.0 55-59 89.4 6.5 1.0 1.6 0.7 0.3 0.5 100.0 701 0.0 60-64 96.4 2.2 0.8 0.1 0.3 0.0 0.2 100.0 1,325 0.0 65+ 97.6 1.7 0.1 0.2 0.2 0.0 0.2 100.0 1,325 0.0
Residence Urban 21.9 28.4 4.1 24.1 15.6 5.8 0.2 100.0 6,259 4.9 Rural 42.0 30.3 4.8 17.4 5.0 0.5 0.0 100.0 21,095 1.0
District Aileu 36.1 32.8 4.6 21.2 4.7 0.4 0.0 100.0 1,140 1.8 Ainaro 47.9 26.9 2.5 16.9 4.9 0.9 0.0 100.0 1,554 0.1 Baucau 38.1 30.4 3.6 20.4 6.7 0.7 0.1 100.0 3,195 1.7 Bobonaro 44.7 29.5 4.9 15.8 4.5 0.7 0.1 100.0 2,687 0.7 Covalima 32.8 31.0 5.5 23.4 6.4 0.8 0.1 100.0 1,701 2.3 Dili 16.1 27.9 4.1 25.0 18.7 7.8 0.3 100.0 4,239 5.9 Ermera 51.9 28.2 3.4 13.3 3.1 0.1 0.0 100.0 3,331 0.0 Lautem 30.3 33.5 6.4 22.2 7.1 0.5 0.0 100.0 1,803 2.7 Liquiçá 42.3 31.2 4.0 16.3 5.7 0.5 0.0 100.0 1,665 1.0 Manatuto 34.2 30.6 5.4 19.9 8.9 1.0 0.0 100.0 1,299 2.3 Manufahi 39.4 29.3 4.0 20.4 6.0 0.7 0.2 100.0 1,100 1.6 Oecussi 45.4 30.6 9.8 11.2 2.6 0.5 0.0 100.0 1,698 0.2 Viqueque 40.2 31.0 4.6 18.0 5.3 0.9 0.0 100.0 1,943 1.4
Wealth quintile Lowest 52.3 31.1 4.4 10.8 1.3 0.1 0.0 100.0 5,397 0.0 Second 46.5 31.6 4.3 14.8 2.7 0.1 0.0 100.0 5,488 0.3 Middle 41.9 29.2 5.1 18.6 4.8 0.4 0.0 100.0 5,564 1.1 Fourth 31.3 29.9 5.2 23.7 8.4 1.5 0.1 100.0 5,500 2.9 Highest 14.8 27.6 4.1 26.7 19.9 6.7 0.2 100.0 5,405 6.2
Total 37.4 29.9 4.6 18.9 7.4 1.7 0.1 100.0 27,354 1.8
Note: Total includes 10 cases with information missing on age.1 Completed grade 6 at the primary level 2 Completed grade 12 at the secondary level

Household Population and Housing Characteristics | 17
The data show that the proportion of women with no education has declined by age, suggesting some improvement in education over the years. During the Portuguese era, the proportion of women who were educated was low. As seen in Figure 2.2, there has been a steady increase in the percentage of the population who has ever attended school in each sequential age cohort. Rapid increases in school attendance among women start in the cohort of women who were age 50-54 at the time of the survey. At the time of the Indonesian invasion in 1975, these women were age 16-20.
Figure 2.2 Percentage of Women and Men withNo Education, by Age Group
32
9 1216
2531
37
56
69
87 8996 98
35
10 11 1421 22 22
30
39
56
66
8489
6-9 10-14 15-19 20-24 25-29 30-34 35-39 40-44 45-49 50-54 55-59 60-64 65+
Age group
0
20
40
60
80
100Percent
Women MenTimor-Leste 2009-10
Increases in secondary education have also been substantial: 10 percent of women age 45-49 have attended any secondary school or higher compared with 69 percent of women age 15-19. It is also important to note that 32 percent of girls age 6-9 have no education; however, many of the girls in this age group may not yet have attained the official age required to start school by the start of the ongoing school year.
Education varies by place of residence. The proportion of women with no education is almost twice as high in rural (42 percent) as in urban areas (22 percent). Conversely, three times as many urban women as rural women have completed secondary school (16 percent compared with 5 percent).
Women’s educational attainment varies by district. More than half of the female population in Ermera has no education compared with 16 percent in Dili. As expected, women in households belonging to the highest wealth quintile are least likely to be uneducated (15 percent) compared with those in the lowest quintile (52 percent).
Table 2.4.2 shows that 30 percent of men have never been to school, 39 percent have had some primary education or have completed primary education, 29 percent have had some secondary or have completed secondary education, and 3 percent have more than secondary education. Men exhibit a trend similar to that for women with regard to the level of educational attainment over the years (Figure 2.2). Differences in educational attainment among men by background characteristics are similar to those discussed for women.

18 | Household Population and Housing Characteristics
Table 2.4.2 Educational attainment of the male household population
Percent distribution of the de facto male household populations age 6 and older by highest level of schooling attended or completed and median grade completed, according to background characteristics, Timor-Leste 2009-10
Background characteristic
No education
Some primary
Completed primary1
Some secondary
Completed secondary2
More than secondary
Don’t know/ missing Total Number
Median years
completed
Age 6-9 34.5 65.2 0.1 0.1 0.0 0.0 0.0 100.0 4,532 0.1 10-14 9.5 71.2 1.6 17.7 0.0 0.0 0.0 100.0 4,695 3.1 15-19 10.8 19.6 3.6 62.1 3.1 0.7 0.2 100.0 3,559 6.7 20-24 14.0 12.4 6.2 34.8 25.3 7.3 0.1 100.0 2,276 11.7 25-29 20.5 16.3 7.7 15.1 30.3 10.1 0.0 100.0 1,908 8.1 30-34 21.8 15.0 11.3 12.3 28.5 11.0 0.1 100.0 1,459 7.1 35-39 22.2 16.5 11.7 17.6 23.6 8.0 0.3 100.0 1,807 5.9 40-44 30.4 18.9 8.2 12.9 25.1 4.4 0.1 100.0 1,546 5.1 45-49 39.4 23.9 7.3 10.1 16.2 3.1 0.0 100.0 1,327 2.4 50-54 56.4 26.1 5.0 4.5 6.8 1.3 0.1 100.0 1,117 0.0 55-59 65.9 21.3 5.3 3.4 2.4 1.7 0.0 100.0 843 0.0 60-64 83.6 11.5 2.7 0.8 1.0 0.4 0.1 100.0 1,196 0.0 65+ 89.1 8.8 0.8 0.7 0.4 0.0 0.2 100.0 1,311 0.0
Residence Urban 16.5 31.8 4.2 21.7 17.3 8.3 0.3 100.0 6,629 5.2 Rural 33.8 35.0 4.6 17.3 8.0 1.3 0.0 100.0 20,947 2.0
District Aileu 32.2 35.8 6.2 17.0 7.2 1.5 0.0 100.0 1,182 2.1 Ainaro 38.8 33.2 3.4 17.1 6.5 1.0 0.0 100.0 1,580 1.5 Baucau 29.3 36.8 3.4 18.7 10.3 1.4 0.1 100.0 3,135 2.4 Bobonaro 36.2 34.2 5.1 15.0 8.2 1.3 0.0 100.0 2,572 1.8 Covalima 23.7 36.2 5.9 20.7 11.7 1.8 0.1 100.0 1,731 3.2 Dili 13.0 30.4 4.1 21.8 20.0 10.4 0.3 100.0 4,622 6.0 Ermera 42.9 31.6 4.2 16.2 4.7 0.4 0.0 100.0 3,299 0.9 Lautem 21.5 37.8 4.3 22.4 12.2 1.9 0.0 100.0 1,828 3.4 Liquiçá 31.1 37.6 4.2 17.8 6.9 2.3 0.0 100.0 1,724 2.3 Manatuto 28.6 35.2 4.9 17.9 11.1 2.1 0.1 100.0 1,222 2.9 Manufahi 31.1 30.3 6.2 21.8 8.7 1.6 0.2 100.0 1,153 3.0 Oecussi 42.5 34.5 5.8 11.1 4.3 1.9 0.0 100.0 1,618 0.6 Viqueque 30.2 37.2 3.3 18.2 8.9 2.3 0.0 100.0 1,910 2.3
Wealth quintile Lowest 44.5 34.6 4.4 12.8 3.3 0.5 0.0 100.0 5,391 0.4 Second 37.9 35.3 4.4 16.0 5.8 0.5 0.1 100.0 5,462 1.4 Middle 33.8 34.8 5.3 17.2 7.8 1.1 0.1 100.0 5,448 2.0 Fourth 23.3 34.8 4.7 22.3 12.5 2.4 0.0 100.0 5,479 3.7 Highest 10.1 31.9 3.6 23.0 21.1 10.1 0.2 100.0 5,797 6.4
Total 29.6 34.2 4.5 18.3 10.2 3.0 0.1 100.0 27,576 2.7
Note: Total includes 2 cases with information missing on age.1 Completed grade 6 at the primary level 2 Completed grade 12 at the secondary level
Males are more likely to be educated than females at all levels of education, with the
exception of completion of primary education where there is little difference. The median number of years of schooling completed is about one year higher for males (2.7 years) than females (1.8 years). There has been improvement in the proportion of the population with no education since the 2003 DHS survey. The proportion of females with no education decreased from 47 percent in 2003 to 37 percent in 2009-10. Similarly, the proportion of males with no education decreased from 37 to 30 percent. The male-female gap in educational attainment has narrowed slightly over the years.
The 2009-10 TLDHS collected information on school attendance for the population age 5-24 that allows the calculation of net attendance ratios (NARs) and gross attendance ratios (GARs) (see Table 2.5). The NAR for primary school is the percentage of the primary-school-age (age 6-11) population that is attending primary school. The NAR for secondary school is the measure of the secondary-school-age (age 12-17) population that is attending secondary school. By definition, the NAR cannot exceed 100 percent. The GAR however, measures participation at each level of schooling among persons age 5-24. The GAR is almost always higher than the NAR for the same level because the GAR includes participation by those who may be older (because they may have started school late, repeated one or more grades, or dropped out and returned) or may be younger than the official age range for that level.

Household Population and Housing Characteristics | 19
Table 2.5 presents data on the NAR and GAR for the de facto household population by level of schooling and sex, according to place of residence, region, and wealth quintile. Seventy-one percent of children age 6-11, who should be attending primary school, are currently doing so. The net enrolment rate for primary school was reported to be 77 percent in the 2007 TLSLS.
Table 2.5 School attendance ratios
Net attendance ratios (NAR) and gross attendance ratios (GAR) for the de facto household population by sex and level of schooling; and the gender parity index (GPI), according to background characteristics, Timor-Leste 2009-10
Background characteristic
Net attendance ratio Gross attendance ratio
Male Female Total Gender
Parity Index Male Female Total Gender
Parity Index
PRIMARY SCHOOL
Residence Urban 77.1 79.8 78.3 1.04 100.9 101.5 101.2 1.01 Rural 68.3 69.9 69.1 1.02 100.6 99.3 99.9 0.99
District Aileu 72.0 76.0 73.9 1.06 113.8 119.6 116.6 1.05 Ainaro 64.3 67.2 65.7 1.04 103.9 94.5 99.3 0.91 Baucau 72.8 73.4 73.1 1.01 103.3 101.6 102.5 0.98 Bobonaro 71.2 74.0 72.6 1.04 102.9 98.7 100.8 0.96 Covalima 82.6 83.5 83.0 1.01 113.7 108.7 111.3 0.96 Dili 75.0 76.8 75.8 1.02 91.5 93.9 92.6 1.03 Ermera 56.4 57.2 56.8 1.01 89.2 88.4 88.8 0.99 Lautem 80.0 80.9 80.4 1.01 108.1 115.0 111.2 1.06 Liquiçá 62.7 65.1 63.8 1.04 105.5 101.2 103.5 0.96 Manatuto 77.5 79.9 78.7 1.03 103.8 104.1 104.0 1.00 Manufahi 75.6 76.1 75.8 1.01 108.4 102.4 105.4 0.95 Oecussi 58.5 63.6 60.9 1.09 87.0 93.5 90.1 1.07 Viqueque 71.4 74.6 72.9 1.04 105.5 102.1 103.9 0.97
Wealth quintile Lowest 56.9 62.2 59.4 1.09 90.2 94.4 92.2 1.05 Second 68.2 67.7 67.9 0.99 103.9 100.6 102.3 0.97 Middle 69.7 72.1 70.9 1.03 105.1 102.5 103.9 0.98 Fourth 75.9 77.6 76.7 1.02 105.3 102.9 104.1 0.98 Highest 82.0 82.1 82.0 1.00 100.2 98.7 99.5 0.98
Total 70.3 72.1 71.1 1.03 100.6 99.8 100.2 0.99
SECONDARY SCHOOL
Residence Urban 57.7 61.2 59.4 1.06 89.6 94.5 92.0 1.05 Rural 38.6 43.6 41.0 1.13 62.0 62.6 62.3 1.01
District Aileu 32.3 46.4 39.8 1.44 61.6 69.5 65.8 1.13 Ainaro 38.9 48.0 43.2 1.23 57.2 64.1 60.5 1.12 Baucau 44.4 50.6 47.4 1.14 69.0 68.2 68.6 0.99 Bobonaro 36.1 42.3 39.2 1.17 60.8 65.5 63.2 1.08 Covalima 48.6 62.0 55.0 1.28 78.7 91.8 85.0 1.17 Dili 59.3 64.3 61.7 1.08 90.2 97.3 93.7 1.08 Ermera 33.4 29.7 31.6 0.89 59.6 47.5 53.7 0.80 Lautem 53.6 49.5 51.6 0.92 78.3 72.3 75.5 0.92 Liquiçá 35.4 37.1 36.2 1.05 59.1 57.8 58.5 0.98 Manatuto 48.7 57.4 53.4 1.18 73.5 71.8 72.5 0.98 Manufahi 48.1 53.6 50.7 1.12 74.5 77.7 76.0 1.04 Oecussi 25.0 26.5 25.8 1.06 38.9 44.1 41.6 1.13 Viqueque 41.4 48.1 44.6 1.16 65.6 69.2 67.3 1.05
Wealth quintile Lowest 27.8 28.5 28.1 1.03 45.2 41.3 43.3 0.91 Second 32.4 35.9 34.1 1.11 56.3 54.1 55.3 0.96 Middle 38.4 46.1 42.3 1.20 63.5 66.9 65.2 1.05 Fourth 52.2 57.0 54.6 1.09 83.6 83.9 83.8 1.00 Highest 63.5 70.3 66.7 1.11 92.6 102.7 97.4 1.11
Total 43.0 47.5 45.2 1.10 68.4 69.7 69.1 1.02
1 The NAR for primary school is the percentage of the primary-school age (6-11 years) population that is attending primary school. The NAR for secondary school is the percentage of the secondary-school age (12-17 years) population that is attending secondary school. By definition the NAR cannot exceed 100 percent. 2 The GAR for primary school is the total number of primary school students, expressed as a percentage of the official primary-school-age population. The GAR for secondary school is the total number of secondary school students, expressed as a percentage of the official secondary-school-age population. If there are significant numbers of overage and underage students at a given level of schooling, the GAR can exceed 100 percent. 3 The Gender Parity Index for primary school is the ratio of the primary school NAR(GAR) for females to the NAR(GAR) for males. The Gender Parity Index for secondary school is the ratio of the secondary school NAR(GAR) for females to the NAR(GAR) for males.

20 | Household Population and Housing Characteristics
The GAR at the primary school level is 100 percent. The distribution shows that both the NAR and GAR are much lower at the secondary school level: 45 percent of students age 12-17 who should be attending secondary school are in school (NAR). The GAR for secondary school is 69 percent. A UNESCO report in 2008 estimated that the GER (gross enrollment ratio) in secondary school in 2005 was 53 percent (UNESCO, 2009).
The results show that the NARs for females and males are similar in primary school. In secondary school, the NAR for females (48 percent) is only slightly higher than for males (43 percent), suggesting that there is not much of a gender gap in school attendance in Timor-Leste. The GAR at primary level is slightly higher for males than females, however, indicating relatively higher over-age or under-age attendance among males compared with attendance among females.
School attendance ratios at both the primary and secondary levels are lower in rural than in urban areas. For instance, the NAR at the primary school level in rural areas is 69 percent compared with 78 percent in urban areas. Similarly, the GAR at the secondary school level is 62 percent in rural areas, compared with 92 percent in urban areas. Regional differences are obvious for the NAR and GAR at the primary school levels, with attendance ratios being notably lower in Ermera and Oecussi compared with all other districts. The GAR at the secondary school level is especially low for Oecussi (42 percent).
There is a strong relationship between household economic status and school attendance that can be seen at both the primary and secondary levels and among males and females. For example, the NAR for primary school increases from 59 percent among students from poorer households (lowest wealth quintile) to 82 percent among pupils from richer households (highest wealth quintile).
The Gender Parity Index (GPI) represents the ratio of the NAR (or GAR) for females to the NAR (or GAR) for males. It is presented in Table 2.5 at both the primary and secondary levels and offers a summary measure of gender differences in school attendance rates. A GPI of less than 1 indicates that a smaller proportion of females than males attends school. In Timor-Leste, the GPI for the GAR is almost 1 (0.99) for primary school attendance and slightly higher than 1 (1.02) for secondary school attendance, indicating the virtual non-existence of a gender gap in education in the country.
2.3.1 Grade Repetition and Dropout Rates
According to UNESCO, 16 percent of children in Timor-Leste repeat grades, 25 percent drop out, and only 46 percent reach Grade 6 (UNESCO, 2009). At the pre-secondary level the completion rate is 49 percent, and among all children age 12 to 14 years in the country, only 28 percent of them complete the pre-secondary level, indicating a considerable number of dropouts.
The 2009-10 TLDHS also assessed grade repetition and dropout rates. Table 2.6 presents these rates for the de facto household population age 5-24 who attended primary school in the previous school year. Repetition and drop-out rates describe the flow of pupils through the educational system. Repetition rates indicate the percentage of pupils who attended a particular class during the previous school year who are repeating that grade in the current school year; that is, they attended the same grade during the 2009-10 academic year as they had attended during the 2008-09 year1. Dropout rates show the percentage of pupils who attended class during the 2008-09 academic year but who did not attend school the following year. Repetition and dropout rates approach zero when pupils nearly always progress to the next grade at the end of the school year. They often vary across grades, indicating points in the school system where pupils are not regularly promoted to the next grade or they decide to drop out of school.
1 The TLDHS covered the academic years 2007-08 as previous and 2008-09 as current for households interviewed in academic year 2008-09. Similarly, for households interviewed in 2009-10 the current academic year was considered as 2009-10 and the previous as 2008-09. The tabulation takes this into account.

Household Population and Housing Characteristics | 21
Table 2.6 Grade repetition and dropout rates
Repetition and dropout rates, for the de facto household population age 5-24 who attended primary school in the previous school year, by school grade, according to background characteristics, Timor-Leste 2009-10
Background characteristic
School grade 1 2 3 4 5 6
REPETITION RATE1
Sex Male 2.0 0.6 0.4 0.7 0.5 0.2 Female 1.4 0.7 0.3 0.3 0.6 0.1
Residence Urban 2.4 0.6 0.1 0.8 1.6 0.3 Rural 1.6 0.7 0.4 0.4 0.2 0.1
District Aileu 0.8 0.8 0.6 0.0 0.0 0.9 Ainaro 1.0 0.0 0.0 0.8 0.0 0.0 Baucau 0.5 0.0 1.4 0.0 0.0 0.0 Bobonaro 1.7 1.1 0.7 0.9 0.0 0.0 Covalima 2.3 0.5 0.0 0.0 0.4 0.0 Dili 1.7 0.5 0.0 0.7 2.1 0.0 Ermera 2.9 1.1 0.7 0.0 1.3 0.0 Lautem 2.5 1.9 0.3 1.6 0.0 0.0 Liquiçá 2.6 0.3 0.0 2.3 0.5 1.9 Manatuto 0.0 0.6 0.0 0.0 0.0 0.0 Manufahi 0.5 0.0 0.0 0.0 0.0 0.0 Oecussi 2.1 0.7 0.0 0.0 0.0 0.0 Viqueque 1.6 0.5 0.0 0.0 0.0 0.0
Wealth quintile Lowest 1.2 0.2 0.8 0.3 0.5 0.3 Second 1.4 0.7 0.0 0.3 0.0 0.0 Middle 2.4 0.5 0.7 1.0 0.4 0.0 Fourth 2.2 1.4 0.0 0.4 0.0 0.2 Highest 1.5 0.5 0.3 0.6 1.6 0.2
Total 1.7 0.6 0.4 0.5 0.5 0.1
DROPOUT RATE2
Sex Male 1.1 1.0 2.2 2.4 2.6 4.1 Female 1.4 2.0 2.2 2.2 2.2 4.4
Residence Urban 3.5 1.1 3.3 6.2 3.4 10.1 Rural 0.6 1.6 1.9 1.2 2.2 2.4
District Aileu 0.4 0.0 0.0 0.0 0.6 0.9 Ainaro 0.0 0.4 0.0 0.0 1.4 0.7 Baucau 0.0 0.5 0.0 0.0 0.0 1.1 Bobonaro 0.0 0.0 0.3 0.0 0.0 0.0 Covalima 2.5 1.6 3.8 3.5 3.3 8.8 Dili 7.2 8.9 12.2 13.7 14.6 15.9 Ermera 0.0 0.0 0.0 0.0 0.0 0.0 Lautem 0.0 0.0 0.0 0.0 0.0 2.8 Liquiçá 0.0 0.0 0.9 0.0 0.0 0.0 Manatuto 0.8 0.8 0.6 0.0 0.0 0.8 Manufahi 1.1 0.0 0.7 0.7 0.0 2.6 Oecussi 0.0 0.0 0.0 0.0 0.7 2.2 Viqueque 0.0 0.5 0.0 0.8 0.7 0.5
Wealth quintile Lowest 0.5 0.2 0.9 1.3 0.7 2.5 Second 0.1 0.6 0.2 0.4 1.2 1.4 Middle 0.6 0.8 0.6 0.0 0.4 1.2 Fourth 1.5 1.4 2.5 1.6 3.0 5.3 Highest 3.6 4.9 6.5 8.2 6.6 8.7
Total 1.2 1.5 2.2 2.3 2.4 4.3
1 The repetition rate is the percentage of students in a given grade in the previous school year who are repeating that grade in the current school year. 2 The dropout rate is the percentage of students in a given grade in the previous school year who no longer attend school.
For both sexes the repetition rate is higher in grade 1 than in grades 2 through 6. In grade 1
the repetition rate is 2 percent for males, compared with 1 percent for females, but in grade 2 the repetition rate for females is slightly higher than that for males. There are small variations by urban-rural residence in almost all grades, except in grade 5 where urban residents have a higher repetition

22 | Household Population and Housing Characteristics
rate (2 percent) than their rural counterparts (0.2 percent). Larger differentials are observed by districts, especially in grade 1. While as high as 3 percent of pupils in the Ermera, Lautem, and Liquiçá districts, respectively, repeat grade 1, there is no grade repetition in grade 1 in Manatuto. In grade 6 only, pupils in Liquiçá (2 percent) and Aileu (1 percent) repeat the grade.
In general, dropout rates are higher than repetition rates for all grades. Dropout rates across grades are similar (1 to 2 percent), except for grade 6 (4 percent). Males and females have similar dropout rates for almost all grades. It is interesting to note that the dropout rates are higher at all levels in urban areas than in rural areas, except for grade 2. There are wide regional variations in dropout rates. Dropout rates are markedly higher in Dili than in all other districts, and this may be attributed to the displacement of the population, particularly in Dili, due to the political strife and subsequent instability in years 2006-2008.
Figure 2.3 shows the age-specific attendance rates (ASAR) for the de facto household population, age 5-24, by sex. The ASAR shows participation in schooling at any level, from primary through higher education. The closer the ASAR is to 100, the higher the participation of a given age population at that level. A little more than 66 percent of children who are age 7 attend school. School attendance rises markedly up to age 12, remains high up to age 13, and then gradually declines. There are no marked differences in the proportion of males and females attending school up to age 18, after which there are substantially higher proportions of males than females attending school.
Figure 2.3 Age-specific Attendance Rates of the de facto Population 5 to 24 Years
13
42
67
8083
88 87 8986
82 81
73 73
60
48
38
27
16 15
711
35
69
76
85 8589 89
8684
7975
71
6258
4441
32
1613
5 6 7 8 9 10 11 12 13 14 15 16 17 18 19 20 21 22 23 24
Age (years)
0
20
40
60
80
100Percent
Female MaleTimor-Leste 2009-10
2.4 HOUSING CHARACTERISTICS
There is a strong correlation between the socioeconomic condition of households and the vulnerability of their members, especially children, to common diseases. The amenities and assets available to households are important in determining the general socioeconomic status of the population. The 2009-10 TLDHS included questions on household access to electricity, sources of drinking water, types of sanitation facilities, flooring materials, and ownership of durable goods.
The availability of and accessibility to improved drinking water may, to a large extent, minimize the prevalence of waterborne diseases among household members, especially young children. The source of drinking water is important because potentially fatal diarrheal diseases, such as typhoid, cholera, and dysentery, are common in Timor-Leste. Table 2.7 shows the percent

Household Population and Housing Characteristics | 23
distribution of households by main source of drinking water, time taken to collect drinking water, person in the household who usually collects drinking water, and treatment of water, according to residence.
Table 2.7 Household drinking water
Percent distribution of households and de jure population by source, time to collect, and person who usually collects drinking water; and percentage of households and the de jure population by treatment of drinking water, according toresidence, Timor-Leste 2009-10
Characteristic
Households Population Urban Rural Total Urban Rural Total
Source of drinking water Improved source
Piped water into
dwelling/yard/plot 38.1 11.7 17.9 38.8 12.2 18.5 Public tap/standpipe 25.1 27.1 26.6 24.5 28.1 27.3 Tube well or borehole 10.3 3.2 4.9 10.6 3.1 4.9 Protected dug well 3.1 4.9 4.5 3.1 4.6 4.3 Protected spring 4.1 8.4 7.4 4.2 8.4 7.4 Rainwater 0.0 0.2 0.1 0.0 0.1 0.1 Non-improved source Unprotected dug well 4.6 7.0 6.5 4.9 6.7 6.3 Unprotected spring 5.8 32.6 26.3 5.7 32.1 25.8 Tanker truck/cart with small tank 0.2 0.5 0.5 0.3 0.5 0.5 Surface water 0.7 3.3 2.7 0.7 3.2 2.6
Bottled water, improved source for cooking/washing1 7.7 0.1 1.9 6.9 0.1 1.7
Bottled water, non-improved source for cooking/washing1 0.1 0.0 0.0 0.1 0.0 0.0
Other 0.2 1.0 0.8 0.2 0.9 0.8 Total 100.0 100.0 100.0 100.0 100.0 100.0
Percentage using any improved source of drinking water 88.4 55.6 63.3 88.2 56.6 64.0
Time to obtain drinking water
(round trip) Water on premises 78.3 38.1 47.5 78.8 38.6 48.1 Less than 30 minutes 13.7 26.3 23.3 13.0 26.1 23.0 30 minutes or longer 7.4 34.4 28.1 7.4 34.2 27.9 Don’t know/missing 0.7 1.2 1.1 0.8 1.1 1.0 Total 100.0 100.0 100.0 100.0 100.0 100.0
Person who usually collects
drinking water Adult female 15+ 13.4 42.3 35.5 13.1 41.8 35.0 Adult male 15+ 3.7 7.4 6.5 3.0 6.5 5.7 Female child under age 15 3.2 8.5 7.2 3.7 9.4 8.0 Male child under age 15 0.8 2.5 2.1 1.1 2.6 2.2 Other 0.5 1.3 1.1 0.3 1.1 0.9 Water on premises 78.3 38.1 47.5 78.8 38.6 48.1 Total 100.0 100.0 100.0 100.0 100.0 100.0
Water treatment prior to drinking2 Boiled 74.9 84.0 81.9 75.8 85.3 83.0 Bleach/chlorine 4.4 1.9 2.5 5.2 2.0 2.8 Strained through cloth 58.0 62.0 61.0 58.6 62.6 61.6 Ceramic, sand, or other filter 0.1 0.2 0.2 0.1 0.2 0.2 Solar disinfection 0.0 0.1 0.0 0.0 0.0 0.0 Other 9.8 6.4 7.2 8.1 6.1 6.6 No treatment 22.2 15.1 16.8 21.6 13.9 15.7
Percentage using an appropriate treatment method3 77.4 84.5 82.8 78.1 85.8 84.0
Number 2,695 8,768 11,463 15,852 51,134 66,985
1 Because the quality of bottled water is not known, households using bottled water for drinking are classified as using an improved or non-improved source, according to their water source for cooking and washing. 2 Respondents may report multiple treatment methods, so the sum of treatment may exceed 100 percent. 3 Appropriate water treatment methods include boiling, bleaching, straining, filtering, and solar disinfecting.
Overall, 63 percent of households obtain their drinking water from an improved source.
Eighteen percent of households have access to piped water in their dwelling, yard, or plot, while 27 percent access drinking water from a public tap. Nine percent of households get their drinking water from a tube well or borehole or a protected dug well, and 7 percent have access to protected spring

24 | Household Population and Housing Characteristics
water. Thirty-six percent of households use non-improved sources of drinking water. There is a big difference between urban and rural households in access to improved sources of drinking water (88 and 56 percent, respectively).
The major source of drinking water for rural households is unprotected springs (33 percent). Twenty-seven percent of rural households use a public tap or standpipe as their main source of drinking water. Access to piped drinking water has increased since 2003 when 38 percent of the households had access to it compared with 45 percent in 2009-10.
Nearly one in two households has access to drinking water on the premises, just under one in four takes less than 30 minutes, and three in ten take 30 minutes or longer to get to and return from their nearest source of drinking water. Not surprisingly most urban households have water on their premises or take less than 30 minutes to access their water source.
Table 2.7 also provides information on the person who usually collects drinking water. Adult females age 15 and older are most likely to collect drinking water for the household if it is not on the premises (36 percent), followed by female children and adult men (7 percent each).
Seventeen percent of households do not treat their water prior to drinking. The most common treatment methods are boiling (82 percent) and straining through cloth (61 percent). In the 2009-10 TLDHS, it was possible for households to report more than one method of treatment.
An improved toilet facility is considered the most efficient and hygienic method of human waste disposal. Table 2.8 shows the percent distribution of households by type of toilet facility, according to residence. Overall, 41 percent of households use improved, not shared, toilet facilities. There are marked differences by urban-rural residence. Sixty-five percent of urban households and 34 percent of rural households use improved toilet facilities that are not shared with other households. However, 37 percent of households have no toilet facilities, a situation that is more common in rural areas (45 percent) than in urban areas (14 percent).
Table 2.8 Household sanitation facilities
Percent distribution of households and de jure population by type of toilet/latrine facilities, according to residence, Timor-Leste 2009-10
Type of toilet/latrine facility
Households Population Urban Rural Total Urban Rural Total
Improved, not shared facility 65.3 33.9 41.3 65.9 35.8 43.0
Flush/pour flush to piped sewer system 14.7 6.9 8.7 15.6 7.3 9.3
Flush/pour flush to septic tank 33.6 4.5 11.4 31.5 4.9 11.2 Flush/pour flush to pit latrine 9.4 8.8 9.0 10.4 8.8 9.2
Ventilated improved pit (VIP) latrine 4.1 2.8 3.1 4.7 3.0 3.4
Pit latrine with slab 3.3 10.1 8.5 3.5 11.0 9.2 Composting toilet 0.2 0.8 0.6 0.2 0.8 0.7
Non-improved facility 34.7 66.1 58.6 34.2 64.2 57.1
Any facility shared with other households 16.7 6.2 8.6 17.0 6.2 8.7
Flush/pour flush not to sewer/ septic tank/pit latrine 0.6 0.5 0.5 0.6 0.5 0.5
Pit latrine without slab/open pit 1.1 2.4 2.1 1.0 2.6 2.3 Bucket 0.6 0.4 0.4 0.6 0.4 0.5 Hanging toilet/hanging latrine 0.2 0.1 0.1 0.2 0.1 0.1 No facility/bush/field 13.5 44.7 37.4 12.7 43.0 35.8 Other 2.0 11.8 9.5 2.1 11.4 9.2
Total 100.0 100.0 100.0 100.0 100.0 100.0 Number 2,695 8,768 11,463 15,852 51,134 66,985

Household Population and Housing Characteristics | 25
Table 2.9 presents the distribution of households by household characteristics, according to residence. Overall, 38 percent of households in Timor-Leste have electricity; four-fifths (83 percent) of households in urban areas have electricity, compared with about one in four (24 percent) households in rural areas. The 2009-10 TLDHS findings show that the proportion of households with electricity has increased over the past five years, growing from 26 percent in 2003.
Table 2.9 Household characteristics
Percent distribution of households and de jure population by housing characteristics and percentage using solid fuel for cooking; and among those using solid fuels, percent distribution by type of fire/stove, according to residence, Timor-Leste 2009-10
Housing characteristic
Households Population Urban Rural Total Urban Rural Total
Electricity Yes 83.4 24.0 38.0 84.4 24.8 38.9 No 16.6 76.0 62.0 15.6 75.2 61.1 Total 100.0 100.0 100.0 100.0 100.0 100.0
Flooring material Earth, sand 27.1 70.4 60.2 26.1 69.2 59.0 Dung 0.5 0.7 0.7 0.5 0.7 0.7 Wood/planks 1.4 1.6 1.5 1.5 1.4 1.4 Palm/bamboo 1.5 2.1 1.9 1.4 1.8 1.7 Parquet or polished wood 0.2 0.1 0.2 0.2 0.1 0.1 Vinyl or asphalt strips 0.0 0.0 0.0 0.0 0.0 0.0 Ceramic tiles 14.8 1.2 4.4 13.6 1.3 4.2 Cement 53.9 23.7 30.8 56.1 25.3 32.6 Carpet 0.2 0.1 0.1 0.3 0.1 0.1 Other 0.3 0.1 0.1 0.3 0.0 0.1 Total 100.0 100.0 100.0 100.0 100.0 100.0
Rooms used for sleeping One 11.9 16.2 15.2 8.6 12.6 11.7 Two 31.7 35.3 34.5 28.8 32.8 31.8 Three or more 56.2 47.9 49.8 62.4 54.1 56.1 Missing 0.3 0.6 0.5 0.2 0.5 0.4 Total 100.0 100.0 100.0 100.0 100.0 100.0
Place for cooking In the house 13.5 10.4 11.1 12.8 8.8 9.7 In a separate building 78.9 85.8 84.2 80.0 87.7 85.9 Outdoors 7.4 3.8 4.6 6.9 3.5 4.3 Other 0.0 0.0 0.0 0.0 0.0 0.0 Missing 0.1 0.0 0.0 0.2 0.0 0.1 Total 100.0 100.0 100.0 100.0 100.0 100.0
Cooking fuel Electricity 8.2 0.3 2.2 7.1 0.3 1.9 LPG/natural gas/biogas 1.7 0.1 0.5 1.2 0.0 0.3 Kerosene 8.9 0.5 2.5 8.0 0.4 2.2 Coal/lignite 0.0 0.0 0.0 0.0 0.0 0.0 Charcoal 0.3 0.3 0.3 0.4 0.3 0.3 Wood 80.7 98.8 94.5 83.0 98.9 95.2 Straw/shrubs/grass 0.2 0.1 0.1 0.3 0.1 0.1 Total 100.0 100.0 100.0 100.0 100.0 100.0
Percentage using solid fuel for cooking1 81.2 99.1 94.9 83.7 99.3 95.6
Number of households 2,695 8,768 11,463 15,852 51,134 66,985
Type of fire/stove among households using solid fuel1
Closed stove with chimney 1.0 0.2 0.3 0.9 0.1 0.3 Open fire/stove with chimney 0.6 0.4 0.4 0.7 0.4 0.4 Open fire/stove with hood 14.9 14.1 14.2 16.0 15.4 15.6 Open fire/stove without chimney or hood 83.0 83.4 83.3 82.0 82.2 82.2 Other 0.5 1.9 1.6 0.5 1.8 1.5 Missing 0.0 0.1 0.1 0.0 0.1 0.1
Total 100.0 100.0 100.0 100.0 100.0 100.0
Number of households/population using solid fuel 2,189 8,691 10,880 13,268 50,773 64,041
LPG = Liquid petroleum gas 1 Includes coal/lignite, charcoal, wood/straw/shrubs/grass, agricultural crops, and animal dung

26 | Household Population and Housing Characteristics
The type of flooring material used in dwellings is a proxy indicator of the socioeconomic status of a household as well as a potential source of exposure to disease-causing agents. Most households in Timor-Leste have rudimentary or natural flooring made of earth, sand, or mud mixed with dung. Finished floors made of tiles, cement, polished wood, and carpet are seen in just over one in three households (36 percent). However, over the past five years there has been a small increase in the percentage of households with finished floors, (28 percent in 2003 compared with 36 percent in 2009-10). Rural households are much more likely to have earth and sand floors (70 percent) than urban households (27 percent). The second most common flooring material in rural areas is cement (24 percent). About 15 percent of urban households have ceramic floors, and less than 2 percent have palm/bamboo floors.
The number of rooms used for sleeping indicates the extent of crowding in households. Overcrowding increases the risk of contracting infectious diseases like acute respiratory infections and skin diseases, which particularly affect children. In the 2009-10 TLDHS, about half of the households had three or more rooms for sleeping; 35 percent had two rooms, and 15 percent had one room. Households in rural areas are less likely than those in urban areas to have three or more rooms for sleeping (48 and 56 percent, respectively).
The presence and extent of indoor pollution is dependent on whether food is cooked inside the house, the type of fuel used for cooking, and whether households have a chimney or hood to ventilate cooking fumes. One in ten households (11 percent) cooks inside the house, 84 percent cook in a separate building, and 5 percent cook outdoors. This pattern was observed in both urban and rural areas. The majority of households in Timor-Leste use solid fuels (primarily wood) for cooking (95 percent). Although nearly all households in rural areas use wood for cooking (99 percent), 81 percent of urban households use wood. Urban households are also much more likely to use kerosene (9 percent) and electricity (8 percent) for cooking. The data also indicate that among households that use solid fuel for cooking, more than four in five do not use a chimney or hood (83 percent), and there is no marked difference between urban and rural areas. A closed fire or stove with a chimney is used by less than 1 percent of households in Timor-Leste.
2.5 HOUSEHOLD DURABLE GOODS
Information was collected in the 2009-10 TLDHS on the availability of household durable goods, such as household effects, means of transportation, and ownership of agricultural land and farm animals. Table 2.10 shows that 40 percent of households own a mobile telephone, 35 percent own a radio, 23 percent own a television, and 9 percent own a refrigerator. Urban households are much more likely than rural households to own these goods. For example, 49 percent of urban households own a radio, compared with 30 percent of rural households. Mobile telephones are available in 74 percent of households in urban areas and 30 percent of rural households, while 60 percent of urban households have a television and only 11 percent of households in rural areas have a television.
The most common means of transportation in the country is a motorcycle or scooter, owned by 13 percent of households, and another 11 percent of households own a bicycle, 9 percent own an animal-drawn cart, and 4 percent own a car or truck. Less than 1 percent of households own a boat with a motor. In general, urban households are much more likely to own a means of transport than rural households.

Household Population and Housing Characteristics | 27
Table 2.10 Household durable goods
Percentage of households and de jure population possessing various household effects, means of transportation, agricultural land, and livestock/farm animals by residence, Timor-Leste 2009-10
Possession
Households Population Urban Rural Total Urban Rural Total
Household effects Radio 49.0 30.1 34.5 49.6 32.1 36.2 Television 60.4 10.9 22.5 62.1 12.1 23.9 Mobile telephone 73.5 29.8 40.1 75.6 33.3 43.3 Non-mobile telephone 1.5 0.3 0.6 1.8 0.4 0.7 Refrigerator 30.6 2.2 8.9 29.7 2.5 8.9
Means of transport Bicycle 24.1 6.9 11.0 26.2 7.7 12.0 Animal drawn cart 15.2 7.6 9.4 16.9 8.4 10.4 Motorcycle/scooter 32.4 7.5 13.4 33.5 8.5 14.4 Car/truck 12.3 1.4 3.9 11.8 1.5 4.0 Boat with a motor 0.6 0.7 0.7 0.8 0.7 0.7
Ownership of agricultural land 42.7 91.6 80.1 45.4 92.0 81.0
Ownership of farm animals1 70.6 93.4 88.1 74.3 94.1 89.4
Number 2,695 8,768 11,463 15,852 51,134 66,985
1 Cattle, cows, bulls, horses, donkeys, goats, sheep, or chickens
Four in five households (80 percent) own agricultural land, and 88 percent have farm animals.
Table 2.10 shows that rural households are more than two times as likely to own agricultural land as urban households (92 and 43 percent, respectively). Similarly, 93 percent of rural households own farm animals, compared with only 71 percent of urban households.
2.6 WEALTH QUINTILES
The wealth quintile provides information on the economic status of households in a surveyed country. Wealth quintiles provide a consistent measure of combined indicators of household income and expenditures. The wealth quintile, as constructed, uses information on household ownership of various consumer items, ranging from household assets like a television, means of transport like a bicycle, and ownership of land and farm animals, to dwelling characteristics, such as source of drinking water, sanitation facilities, and type of building materials used in the construction of houses.
Each asset is assigned a weight (factor score) generated through principal components analysis, and the resulting asset scores are standardized in relation to a normal distribution with a mean of zero and standard deviation of one. Each household is then assigned a score for each asset, and the scores are summed for each household; individuals are ranked according to the total score of the household in which they reside. The sample is then divided into quintiles from one (lowest) to five (highest). A single asset index is developed for the whole sample; separate indices are not prepared for the urban and rural populations.
The 2009-10 TLDHS provides an opportunity to examine the distribution of the population in Timor-Leste by household economic status. Table 2.11 shows the percent distribution of the de jure population by wealth quintiles, according to residence and districts. Fifty-eight percent of the urban population is in the highest wealth quintile, compared with only 9 percent of the rural population. The rural population is more likely to be in the lowest three lowest quintiles. Dili is by far the wealthiest district in the country, with 71 percent of its population in the highest quintile. Nearly one in two households in Oecussi is in the poorest wealth quintile, and more than three in five households in Ainaro, Oecussi, and Viqueque are in the lowest two quintiles.

28 | Household Population and Housing Characteristics
Table 2.11 Wealth quintiles
Percent distribution of the de jure population by wealth quintiles, according to residence and region, Timor-Leste 2009-10
Residence/ region
Wealth quintile Total
Number of population Lowest Second Middle Fourth Highest
Residence Urban 4.5 6.1 9.3 22.2 57.8 100.0 15,852 Rural 24.6 24.2 23.3 19.2 8.7 100.0 51,134
District Aileu 20.6 27.9 25.1 18.2 8.2 100.0 2,785 Ainaro 30.9 32.2 19.7 12.1 5.2 100.0 3,830 Baucau 26.9 28.9 19.3 13.4 11.5 100.0 7,590 Bobonaro 15.2 19.7 26.1 27.8 11.1 100.0 6,323 Covalima 17.2 17.7 23.1 25.1 16.8 100.0 3,993 Dili 0.4 2.1 6.5 20.1 71.0 100.0 10,905 Ermera 9.8 30.2 31.9 21.5 6.6 100.0 8,132 Lautem 28.0 16.7 20.4 24.5 10.4 100.0 4,547 Liquiçá 15.7 18.8 25.3 25.1 15.2 100.0 4,082 Manatuto 22.2 10.9 22.5 27.7 16.8 100.0 3,088 Manufahi 28.3 25.1 18.1 16.6 12.0 100.0 2,699 Oecussi 46.6 17.1 14.4 14.2 7.6 100.0 4,281 Viqueque 35.3 25.5 17.4 13.0 8.7 100.0 4,730
Total 19.9 19.9 20.0 19.9 20.3 100.0 66,985
2.7 BIRTH REGISTRATION
Birth registration by definition means ensuring that the birth of a child is officially registered with the state (UNICEF, 2007). The Convention on the Rights of the Child (UN General Assembly, 1989) states that every child has the right to a name and a nationality and the right to protection from being deprived of his or her identity. Parents are required to give their children a name and to register the child because the child has a right to know who his or her parents are and to have a nationality through registration in accordance with national laws and international standards. Studies have shown that in Timor-Leste, parents preferred to register the name and identity of their children through baptism (UNICEF, 2007). Although there was an attempt to register vital events, such as births, deaths, and marriages, prior to 1999, the ensuing violence and destruction left little record of such registration.
Since Timor-Leste has gained independence, UNICEF and Plan International have been instrumental in promoting birth registration in Timor-Leste. In 2000, the United Nations Transitional Administration in East Timor (UNTAET) set up the first civil registration administration in Timor-Leste. This was followed by the establishment of the Central Civil Registry within the Ministry of Internal Affairs, whereby births, marriages, and deaths were registered. The responsibility of vital registration was then shifted to the Ministry of Justice under the Division of Civil Registry and Notary in 2002. Since 2003 UNICEF has supported the efforts of the Ministry of Justice to run mobile registration campaigns in the districts (UNICEF, 2005). Further, Plan International has collaborated with UNICEF in two districts to promote universal birth registration and by 2007 had facilitated birth registration of about 90,000 children in Timor-Leste (Plan, 2009; Cody, 2009).
The 2009-10 TLDHS collected information on the percentage of children under age 5 whose births were officially registered with the civil authority. Excluded were registrations with the church during baptism.
Table 2.12 shows the percentage of children under age 5 whose births were officially registered and the percentage with a birth certificate at the time of the survey, by background characteristics. Not all children reported as registered had a birth certificate at the time of the survey, so some certificates may have been lost or never issued.
The births of 55 percent of children under age 5 have been registered: 41 percent have a birth certificate, and 15 percent do not have a birth certificate. Data from the 2003 DHS showed that 53

Household Population and Housing Characteristics | 29
percent of children under age 5 were reported to have been registered (hospital record, village record, proof of birth, and birth certificate), but only 9 percent had a birth certificate. The significant increase in the number of children with a birth certificate is probably due to the mobile registration campaigns launched by the Ministry of Justice in the districts.
Nearly two-thirds of children age 2-4 years have been registered (65 percent), compared with two-fifths of children below age 2 (40 percent). About 14-16 percent of all these children do not have a birth certificate. There is no substantial variation in birth registration by sex of child. Rural children are more likely to be registered (57 percent) than urban children (50 percent). Most children in Manufahi are registered (91 percent), in contrast with children living in Viqueque, Covalima, Dili, and Liquiçá, where 40 percent or fewer are registered. The percentage of children registered ranges from a low of 50 percent among those in the lowest wealth quintile to a high of 59 percent among those in the middle wealth quintile.
Table 2.12 Birth registration of children under age 5
Percentage of de jure children under age 5 whose births are registered with the civil authorities, according to background characteristics, Timor-Leste 2009-10
Background characteristic
Percentage of children whose births are registered
Number of children
Had a birth certificate
Did not have a birth
certificate Total
registered
Age <2 26.7 13.5 40.1 3,876 2-4 49.1 15.5 64.6 6,198
Sex Male 40.5 14.4 54.8 5,112 Female 40.5 15.0 55.5 4,962
Residence Urban 37.7 12.0 49.7 2,341 Rural 41.3 15.5 56.8 7,734
District Aileu 50.7 18.4 69.1 370 Ainaro 33.0 26.9 59.9 596 Baucau 46.5 20.4 66.9 1,057 Bobonaro 55.9 4.1 60.0 954 Covalima 30.9 5.8 36.7 471 Dili 31.4 8.9 40.3 1,615 Ermera 63.4 3.4 66.8 1,279 Lautem 37.1 9.3 46.3 801 Liquiçá 27.9 12.4 40.3 583 Manatuto 45.8 22.1 67.8 460 Manufahi 43.7 47.6 91.3 384 Oecussi 26.9 33.3 60.2 789 Viqueque 21.6 12.6 34.3 715
Wealth quintile Lowest 30.9 19.1 50.0 2,164 Second 40.3 14.0 54.3 2,006 Middle 44.4 14.4 58.9 2,048 Fourth 43.9 13.1 56.9 1,961 Highest 43.8 12.4 56.1 1,895
Total 40.5 14.7 55.2 10,075

Characteristics of Respondents | 31
CHARACTERISTICS OF RESPONDENTS 3
This chapter describes the demographic and socioeconomic profile of respondents interviewed in the 2009-10 TLDHS. This information is useful in the interpretation of findings and in understanding the results presented later in the report. The survey collected basic information on respondents’ age, level of education, marital status, religion, ethnicity, and wealth status. In addition, information was collected on respondents’ exposure to mass media and literacy status, employment status, occupation, and type of earnings. Additional information collected includes knowledge and attitudes concerning tuberculosis and use of tobacco.
For the first time, the 2009-10 TLDHS gathered information from all women and men irrespective of their marital status, in contrast with the 2003 DHS, which sampled only ever-married women and men. The discussion in this report therefore refers to both unmarried and married women and men. In addition, tables in this report show detailed information for men age 15-49, so that characteristics associated with women in the same age group may be compared.
Throughout this report, numbers in the tables reflect weighted numbers. In most cases, percentages based on 25 to 49 unweighted cases are shown in parentheses. Percentages based on fewer than 25 unweighted cases are suppressed and replaced with an asterisk to caution readers when interpreting data that a percentage based on fewer than 50 cases may not be statistically reliable1.
3.1 CHARACTERISTICS OF SURVEY RESPONDENTS
A description of the background characteristics of the 13,137 women age 15-49 and 4,076 men age 15-49 interviewed in the 2009-10 TLDHS is shown in Table 3.1.
More than half of the respondents (56 percent of women and 55 percent of men) are under age 30. In general, the proportion of women and men in each age group declines as age increases (with the exception of women and men in the age group 35-39), reflecting the comparatively young age structure of the population in Timor-Leste. Three-fifths of women (60 percent) and just over half of men (53 percent) are currently married or living together. Thirty-six percent of women in the sample have never married compared with 46 percent of men. On the other hand, women are more likely to be divorced, separated, or widowed than men (4 percent compared with 1 percent).
The place of residence is a background characteristic that determines access to services and exposure to information pertaining to reproductive health and other aspects of life. The majority of respondents reside in rural areas: nearly one in five respondents lives in Dili, and about one in ten lives in Baucau and Ermera. Respondents are least likely to reside in Manufahi.
Women are disadvantaged in terms of educational attainment. This is observed at all levels of education. The male-female difference is especially obvious among those with no education and those with secondary or higher levels of education. Nearly three in ten women have no education compared with one in five men. Similarly, 48 percent of women have secondary or higher levels of education compared with 55 percent of men.
The vast majority of respondents are Roman Catholic (98 percent), while 1 to 2 percent of women and men are Protestant.
1 For mortality rates, parentheses are used if based on 250 to 499 children exposed to the risk of mortality in any of the component rates, and suppressed if based on fewer than 250 children exposed to the risk of mortality in any of the component rates.

32 | Characteristics of Respondents
Table 3.1 Background characteristics of respondents
Percent distribution of women and men age 15-49 by selected background characteristics, Timor-Leste 2009-10
Background characteristic
Women Men
Weighted percent Weighted Unweighted
Weighted percent Weighted Unweighted
Age 15-19 23.9 3,144 3,243 24.4 994 1,009 20-24 17.8 2,343 2,323 15.8 643 643 25-29 14.4 1,897 1,877 14.4 586 575 30-34 11.7 1,534 1,478 10.8 439 437 35-39 12.8 1,684 1,722 13.6 553 544 40-44 10.6 1,388 1,358 11.3 462 460 45-49 8.7 1,146 1,136 9.8 400 408
Marital status Never married 35.6 4,675 4,706 45.8 1,865 1,869 Married 57.8 7,588 7,548 48.8 1,988 1,993 Living together 2.4 318 329 4.2 170 159 Divorced/separated 1.8 231 219 0.4 18 18 Widowed 2.5 325 335 0.8 35 37
Residence Urban 26.2 3,439 3,233 27.0 1,102 1,015 Rural 73.8 9,698 9,904 73.0 2,974 3,061
District Aileu 4.2 554 1,036 4.4 181 298 Ainaro 4.7 619 841 5.3 217 296 Baucau 10.7 1,408 1,007 10.2 415 297 Bobonaro 9.6 1,262 1,062 8.7 357 319 Covalima 5.9 781 989 5.8 236 297 Dili 18.8 2,466 1,227 19.5 797 403 Ermera 11.7 1,542 1,082 12.1 491 355 Lautem 6.6 864 1,023 7.6 308 366 Liquiçá 6.1 801 1,069 6.2 252 315 Manatuto 4.6 603 1,135 4.7 190 366 Manufahi 3.6 470 791 3.4 137 228 Oecussi 6.7 884 1,000 5.8 235 271 Viqueque 6.7 882 875 6.4 260 265
Education No education 29.3 3,854 3,922 19.4 791 798 Primary 22.9 3,005 3,112 25.7 1,046 1,070 Secondary 44.4 5,829 5,804 49.3 2,009 2,025 More than secondary 3.4 449 299 5.7 230 183
Religion Roman Catholic 97.7 12,840 12,833 98.2 4,003 4,006 Muslim 0.2 22 20 0.3 14 5 Protestant 1.9 253 264 1.3 53 56 Hindu 0.2 21 18 0.1 4 6 Other 0.0 1 2 0.1 3 3
Total 15-49 100.0 13,137 13,137 100.0 4,076 4,076
Note: Education categories refer to the highest level of education attended, whether or not that level was completed.
3.2 EDUCATIONAL ATTAINMENT AND LITERACY
Tables 3.2.1 and 3.2.2 show the distribution of respondents by educational attainment, according to background characteristics. Twenty-nine percent of women age 15-49 have never been to school, 14 percent have some primary education, 9 percent have completed primary education, 29 percent have some secondary education, and 19 percent have completed secondary or a higher level of education. Older women and those who reside in rural areas are most likely to have no education. The urban-rural difference in the level of education is pronounced among those who have completed secondary or higher levels of schooling. For example, women in urban areas are more than three times as likely as those in rural areas to have completed secondary education or a higher level of education (39 percent and 12 percent, respectively).

Characteristics of Respondents | 33
Table 3.2.1 Educational attainment: Women
Percent distribution of women age 15-49 by highest level of schooling attended or completed, and median years completed, according to background characteristics, Timor-Leste 2009-10
Background characteristic
Highest level of schooling
Total
Median years
completed Number of
women No
educationSome
primary Completed
primary1 Some
secondaryCompleted secondary2
More than secondary
Age 15-24 13.4 13.3 6.9 47.8 15.5 3.0 100.0 7.7 5,487 15-19 11.8 13.4 6.5 61.6 6.4 0.3 100.0 7.4 3,144 20-24 15.6 13.2 7.6 29.3 27.8 6.5 100.0 8.6 2,343 25-29 24.7 13.3 11.5 19.9 25.4 5.3 100.0 6.3 1,897 30-34 30.5 13.4 13.4 17.9 19.3 5.4 100.0 5.5 1,534 35-39 37.9 15.2 12.3 16.9 15.0 2.7 100.0 4.4 1,684 40-44 54.8 15.1 7.2 9.9 10.6 2.4 100.0 a 1,388 45-49 68.3 16.2 4.7 5.0 3.9 1.9 100.0 a 1,146
Residence Urban 14.5 10.1 5.8 30.6 28.8 10.2 100.0 11.2 3,439 Rural 34.6 15.4 10.0 27.9 11.2 1.0 100.0 5.0 9,698
District Aileu 31.4 15.3 9.6 32.6 10.3 0.8 100.0 5.3 554 Ainaro 39.9 10.7 5.9 28.5 13.4 1.7 100.0 4.8 619 Baucau 27.1 15.6 7.0 31.5 17.4 1.5 100.0 6.0 1,408 Bobonaro 39.6 14.6 10.1 24.3 10.1 1.3 100.0 4.1 1,262 Covalima 21.7 15.1 10.5 36.4 14.6 1.7 100.0 6.6 781 Dili 10.5 9.8 5.2 29.5 31.7 13.3 100.0 12.5 2,466 Ermera 49.3 12.9 8.2 21.6 7.6 0.2 100.0 1.2 1,542 Lautem 20.2 13.6 12.8 38.2 14.2 1.0 100.0 6.5 864 Liquiçá 33.5 19.1 7.9 27.1 11.6 0.8 100.0 4.5 801 Manatuto 24.5 15.9 8.9 30.5 18.9 1.4 100.0 6.0 603 Manufahi 27.2 14.4 8.1 34.3 14.5 1.5 100.0 6.0 470 Oecussi 41.0 17.6 18.4 16.6 5.5 0.9 100.0 3.4 884 Viqueque 32.1 15.4 9.5 29.7 11.8 1.6 100.0 5.2 882
Wealth quintile Lowest 49.0 19.1 10.3 18.0 3.4 0.1 100.0 0.9 2,314 Second 40.8 17.8 9.8 24.6 6.8 0.2 100.0 3.3 2,468 Middle 33.2 14.5 10.4 30.4 10.8 0.7 100.0 5.2 2,590 Fourth 22.7 13.1 9.2 34.4 17.5 3.0 100.0 7.0 2,687 Highest 8.0 7.4 5.4 33.0 35.1 11.1 100.0 13.1 3,077
Total 29.3 14.0 8.9 28.6 15.8 3.4 100.0 5.7 13,137
1 Completed grade 6 at the primary level 2 Completed grade 12 at the secondary level a = Omitted because less than 50 percent of women had any education before reaching the beginning of the age group.
Educational attainment is directly related to the economic status of respondents. An analysis
of education by wealth quintile indicates that women in the highest wealth quintile are most likely to complete secondary or a higher level of education. For example, nearly one in two women in the highest wealth quintile has completed secondary or higher education, compared with less than 4 percent of women in the lowest wealth quintile.
A similar pattern in educational attainment is found among men (Table 3.2.2). However, men are more educated than women in all categories. One in five men has never had formal schooling, one in five has some primary education, one in thirteen has completed primary school, three in ten have some secondary education, and more than one in four men has completed secondary or higher education.
Women have completed a median of 6 years of schooling compared with 7 years for men.

34 | Characteristics of Respondents
Table 3.2.2 Educational attainment: Men
Percent distribution of men age 15-49 by highest level of schooling attended or completed, and median years completed, according to background characteristics, Timor-Leste 2009-10
Background characteristic
Highest level of schooling
Total
Median years
completed Number of
men No
educationSome
primary Completed
primary1 Some
secondaryCompleted secondary2
More than secondary
Age 15-24 11.7 13.9 6.6 48.7 16.9 2.1 100.0 7.6 1,636 15-19 10.8 15.7 7.1 59.7 6.3 0.5 100.0 7.3 994 20-24 13.2 11.2 5.9 31.8 33.3 4.6 100.0 12.2 643 25-29 20.4 19.9 6.9 12.4 31.3 9.2 100.0 7.7 586 30-34 19.1 18.6 9.1 16.3 28.5 8.4 100.0 7.6 439 35-39 20.0 17.2 12.7 17.9 20.8 11.5 100.0 6.1 553 40-44 29.2 18.2 8.9 13.2 24.7 5.9 100.0 5.3 462 45-49 37.5 27.0 8.3 10.2 13.3 3.8 100.0 2.3 400
Residence Urban 9.3 11.4 5.9 27.6 31.0 14.9 100.0 13.1 1,102 Rural 23.2 19.7 9.0 28.2 17.7 2.2 100.0 5.7 2,974
District Aileu 17.9 17.7 11.1 31.2 19.7 2.4 100.0 6.6 181 Ainaro 29.7 16.7 7.0 31.0 14.0 1.6 100.0 5.4 217 Baucau 15.7 22.7 7.4 27.3 24.6 2.3 100.0 7.1 415 Bobonaro 28.9 16.8 8.5 25.2 18.2 2.4 100.0 5.5 357 Covalima 12.5 14.7 12.7 32.4 23.0 4.7 100.0 7.9 236 Dili 7.1 10.7 6.0 24.5 34.3 17.4 100.0 13.9 797 Ermera 37.1 20.9 6.9 23.4 11.0 0.7 100.0 3.7 491 Lautem 11.0 9.2 9.0 42.0 24.3 4.6 100.0 8.3 308 Liquiçá 17.5 24.4 6.6 30.5 18.1 2.9 100.0 6.0 252 Manatuto 17.8 20.1 8.2 28.0 23.1 2.8 100.0 6.6 190 Manufahi 20.0 14.3 7.9 37.7 16.6 3.6 100.0 6.9 137 Oecussi 29.1 27.3 13.7 18.2 7.9 3.7 100.0 4.0 235 Viqueque 19.0 21.7 8.4 28.7 18.1 4.1 100.0 6.0 260
Wealth quintile Lowest 32.3 22.0 10.7 26.2 8.2 0.5 100.0 4.2 728 Second 26.6 21.8 10.6 26.4 14.2 0.4 100.0 5.1 781 Middle 23.3 20.3 9.5 29.6 15.2 2.0 100.0 5.6 786 Fourth 15.0 17.5 5.8 30.2 27.4 4.1 100.0 8.1 849 Highest 4.0 8.0 5.2 27.4 36.9 18.5 100.0 14.1 932
Total 15-49 19.4 17.5 8.2 28.0 21.3 5.7 100.0 7.1 4,076
1 Completed grade 6 at the primary level 2 Completed grade 12 at the secondary level
Literacy is widely acknowledged as benefiting the individual and the society and is associated
with a number of positive outcomes for health, nutrition, and the overall well-being of both men and women. In the 2009-10 TLDHS, literacy was determined by the respondents’ ability to read all or part of a sentence. During data collection, interviewers carried a set of cards on which simple sentences were printed in five of the major languages. These cards were used to test a respondent’s reading ability. Only those who had never been to school and those who had not completed the primary level were asked to read the cards in the language they were most likely able to read. Those who had attended secondary school or received higher education were assumed to be literate.
Table 3.3.1 indicates that more than two-thirds of women in Timor-Leste (68 percent) are literate. The literacy status varies by place of residence. Four-fifths of women residing in urban areas are literate compared with three-fifths of their rural counterparts. The level of literacy by age shows a consistent decrease with increasing age. This suggests that the younger generations have had more opportunity to learn to read than the older generations. Eighty-six percent of women age 15-19 are literate compared with 29 percent of women age 45-49.

Characteristics of Respondents | 35
Table 3.3.1 Literacy: Women
Percent distribution of women age 15-49 by level of schooling attended and level of literacy, and percentage literate, according to background characteristics, Timor-Leste 2009-10
Background characteristic
Pre-secondary school or
higher
No schooling or primary school
Total Percentage
literate1 Number of
women
Can read a whole
sentence
Can read part of a sentence
Cannot read at all
No card with
required language
Blind/ visually
impaired Missing
Age 15-19 68.3 11.2 6.6 13.9 0.0 0.0 0.0 100.0 86.1 3,144 20-24 63.6 9.5 8.3 18.5 0.0 0.1 0.0 100.0 81.4 2,343 25-29 50.6 10.9 10.3 27.9 0.1 0.2 0.0 100.0 71.8 1,897 30-34 42.7 14.3 10.1 32.8 0.0 0.1 0.0 100.0 67.1 1,534 35-39 34.6 12.0 12.5 40.9 0.1 0.0 0.0 100.0 59.0 1,684 40-44 22.9 9.6 10.3 56.8 0.1 0.2 0.0 100.0 42.8 1,388 45-49 10.8 8.9 9.5 70.3 0.0 0.3 0.1 100.0 29.3 1,146
Residence Urban 69.6 8.0 6.1 16.1 0.0 0.1 0.0 100.0 83.8 3,439 Rural 40.0 12.0 10.4 37.4 0.1 0.1 0.0 100.0 62.4 9,698
District Aileu 43.6 11.6 9.8 35.0 0.0 0.0 0.0 100.0 65.0 554 Ainaro 43.5 5.1 9.2 42.2 0.0 0.0 0.1 100.0 57.8 619 Baucau 50.4 12.1 6.9 30.7 0.0 0.0 0.0 100.0 69.3 1,408 Bobonaro 35.6 10.8 11.6 41.4 0.1 0.4 0.0 100.0 58.0 1,262 Covalima 52.7 10.6 10.9 25.6 0.0 0.1 0.1 100.0 74.2 781 Dili 74.5 7.9 6.7 10.7 0.0 0.1 0.0 100.0 89.2 2,466 Ermera 29.5 5.5 12.2 52.5 0.2 0.1 0.0 100.0 47.2 1,542 Lautem 53.4 14.4 10.3 21.8 0.0 0.1 0.0 100.0 78.1 864 Liquiçá 39.5 11.0 12.3 37.1 0.0 0.0 0.1 100.0 62.8 801 Manatuto 50.8 14.5 8.4 26.3 0.0 0.0 0.0 100.0 73.7 603 Manufahi 50.3 11.6 8.4 29.6 0.0 0.1 0.0 100.0 70.3 470 Oecussi 23.0 20.6 8.0 48.3 0.0 0.1 0.0 100.0 51.6 884 Viqueque 43.1 15.3 8.2 33.1 0.1 0.1 0.0 100.0 66.6 882
Wealth quintile Lowest 21.6 14.9 10.0 53.2 0.1 0.2 0.0 100.0 46.5 2,314 Second 31.6 11.2 12.2 44.9 0.1 0.0 0.0 100.0 55.1 2,468 Middle 41.9 11.8 10.4 35.6 0.1 0.1 0.0 100.0 64.2 2,590 Fourth 55.0 10.5 9.3 25.2 0.0 0.1 0.0 100.0 74.7 2,687 Highest 79.1 7.4 5.2 8.1 0.0 0.1 0.1 100.0 91.8 3,077
Total 47.8 10.9 9.2 31.9 0.0 0.1 0.0 100.0 68.0 13,137
1 Refers to women who attended pre-secondary school or higher and women who can read a whole sentence or part of a sentence
Not surprisingly, literacy is highest in Dili, the most urban district in the country, with nine in
ten women being literate. Less than one in two women in Ermera is literate, however.
There is also a significant difference in literacy levels by women’s wealth status, with literacy rising from a low of 47 percent among women in the lowest wealth quintile to a high of 92 percent among women in the highest wealth quintile. This reaffirms the positive association between economic status and literacy.
Men are more likely to be literate than women (Table 3.3.2). Four-fifths of Timorese men age 15-49 are literate. The gap in urban-rural literacy among men is smaller than the gap among women, suggesting that men in rural areas are better able to access learning than women. The level of literacy ranges from a low of 56 percent of men in Oecussi to a high of 92 percent of men in Dili. Nearly all men (95 percent) in the highest wealth quintile are literate.

36 | Characteristics of Respondents
Table 3.3.2 Literacy: Men
Percent distribution of men age 15-49 by level of schooling attended and level of literacy, and percentage literate, according to background characteristics, Timor-Leste 2009-10
Background characteristic
Pre-secondary school or
higher
No schooling or primary school
Total Percentage
literate1 Number of
men
Can read a whole
sentence
Can read part of a sentence
Cannot read at all
No card with
required language
Blind/ visually
impaired
Age 15-19 66.4 13.4 6.9 13.2 0.2 0.0 100.0 86.6 994 20-24 69.7 8.8 6.8 14.6 0.0 0.0 100.0 85.4 643 25-29 52.8 12.8 12.9 21.3 0.0 0.1 100.0 78.6 586 30-34 53.2 16.6 10.7 19.5 0.0 0.0 100.0 80.5 439 35-39 50.2 17.3 9.1 23.4 0.0 0.0 100.0 76.6 553 40-44 43.7 14.2 11.7 30.1 0.0 0.3 100.0 69.6 462 45-49 27.2 20.0 12.2 40.6 0.0 0.0 100.0 59.4 400
Residence Urban 73.4 9.6 5.5 11.2 0.2 0.1 100.0 88.6 1,102 Rural 48.1 15.9 11.0 25.0 0.0 0.1 100.0 75.0 2,974
District Aileu 53.3 9.0 13.1 24.6 0.0 0.0 100.0 75.4 181 Ainaro 46.6 14.7 8.4 29.6 0.0 0.7 100.0 69.7 217 Baucau 54.2 20.8 8.1 17.0 0.0 0.0 100.0 83.0 415 Bobonaro 45.8 19.5 14.4 20.2 0.0 0.0 100.0 79.8 357 Covalima 60.0 4.6 17.1 18.3 0.0 0.0 100.0 81.7 236 Dili 76.2 9.5 5.8 8.2 0.2 0.0 100.0 91.6 797 Ermera 35.0 6.8 18.0 40.1 0.0 0.0 100.0 59.9 491 Lautem 70.8 14.2 3.5 11.5 0.0 0.0 100.0 88.5 308 Liquiçá 51.5 19.5 4.9 24.1 0.0 0.0 100.0 75.9 252 Manatuto 53.9 25.8 1.4 18.9 0.0 0.0 100.0 81.1 190 Manufahi 57.8 8.9 8.5 24.7 0.0 0.0 100.0 75.3 137 Oecussi 29.9 22.7 3.3 43.8 0.0 0.2 100.0 55.9 235 Viqueque 50.9 18.2 15.1 15.8 0.0 0.0 100.0 84.2 260
Wealth quintile Lowest 35.0 18.2 11.0 35.8 0.0 0.0 100.0 64.2 728 Second 41.1 16.7 13.0 29.1 0.0 0.2 100.0 70.7 781 Middle 46.9 16.5 12.7 23.9 0.0 0.0 100.0 76.1 786 Fourth 61.6 13.5 7.5 17.3 0.0 0.1 100.0 82.6 849 Highest 82.8 7.7 4.6 4.7 0.2 0.0 100.0 95.1 932
Total 15-49 54.9 14.2 9.5 21.3 0.0 0.1 100.0 78.6 4,076
1 Refers to men who attended pre-secondary school or higher and men who can read a whole sentence or part of a sentence
3.3 ACCESS TO MASS MEDIA
Access to information through the media is essential to increasing people’s knowledge and awareness of what is taking place around them, which may eventually affect their perceptions and behavior. In the 2009-10 TLDHS, exposure to media was assessed by asking respondents if they listened to a radio, watched television, or read newspapers or magazines at least once a week. This information is useful for program managers and planners engaged in determining which media may be most effective for disseminating health information to targeted audiences. The detailed results are presented in Tables 3.4.1 and 3.4.2 by background characteristics.
Media exposure in Timor-Leste is relatively low, with just over one in ten women and men exposed to all three specified types of mass media. Just over one-third of women are exposed to the radio, and a similar proportion is exposed to television at least once a week. Exposure to the radio and television is slightly higher among men, with two-fifths of men exposed to the radio and the television. Just over one-fifth of women and men read a newspaper at least once a week.
Media exposure declines with age among women, but the relationship is less clear among men. Young women under 24 years of age are more likely to be exposed to the mass media than older women, presumably in part because of their higher level of education. There is also a wide gap in exposure to mass media by place of residence. For example, the proportion of newspaper readers is
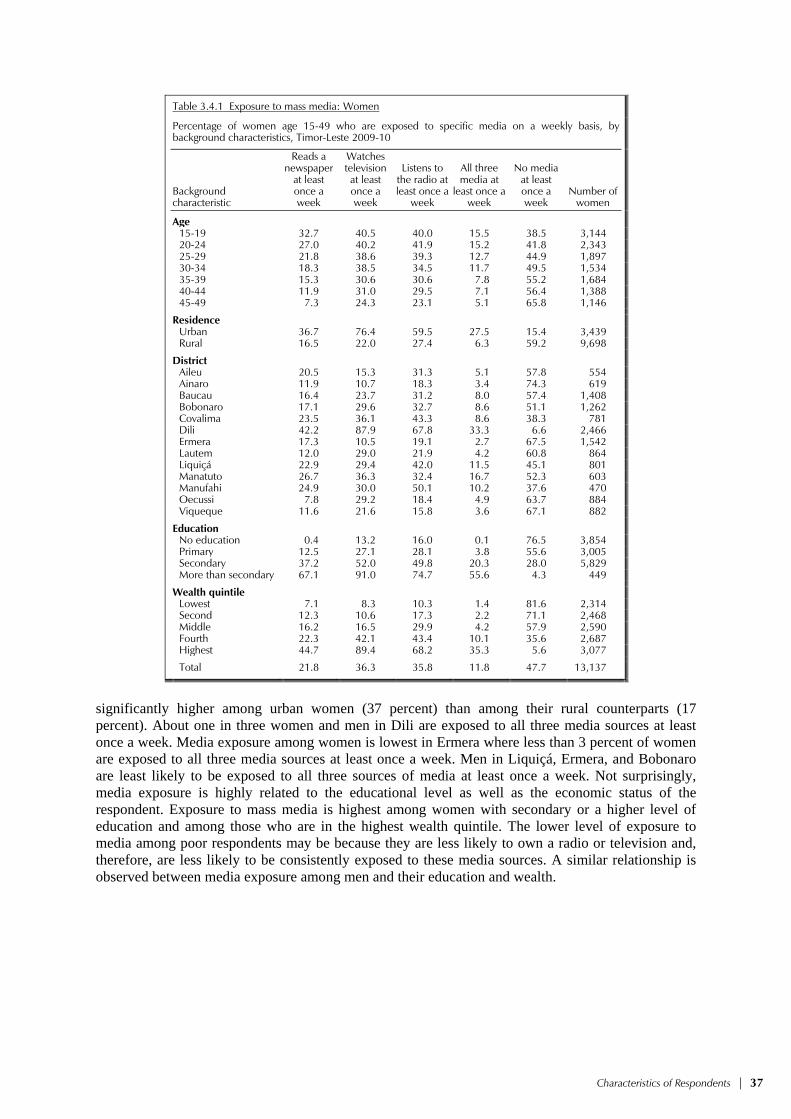
Characteristics of Respondents | 37
Table 3.4.1 Exposure to mass media: Women
Percentage of women age 15-49 who are exposed to specific media on a weekly basis, by background characteristics, Timor-Leste 2009-10
Background characteristic
Reads a newspaper
at least once a week
Watches television at least once a week
Listens to the radio at least once a
week
All three media at
least once a week
No media at least once a week
Number of women
Age 15-19 32.7 40.5 40.0 15.5 38.5 3,144 20-24 27.0 40.2 41.9 15.2 41.8 2,343 25-29 21.8 38.6 39.3 12.7 44.9 1,897 30-34 18.3 38.5 34.5 11.7 49.5 1,534 35-39 15.3 30.6 30.6 7.8 55.2 1,684 40-44 11.9 31.0 29.5 7.1 56.4 1,388 45-49 7.3 24.3 23.1 5.1 65.8 1,146
Residence Urban 36.7 76.4 59.5 27.5 15.4 3,439 Rural 16.5 22.0 27.4 6.3 59.2 9,698
District Aileu 20.5 15.3 31.3 5.1 57.8 554 Ainaro 11.9 10.7 18.3 3.4 74.3 619 Baucau 16.4 23.7 31.2 8.0 57.4 1,408 Bobonaro 17.1 29.6 32.7 8.6 51.1 1,262 Covalima 23.5 36.1 43.3 8.6 38.3 781 Dili 42.2 87.9 67.8 33.3 6.6 2,466 Ermera 17.3 10.5 19.1 2.7 67.5 1,542 Lautem 12.0 29.0 21.9 4.2 60.8 864 Liquiçá 22.9 29.4 42.0 11.5 45.1 801 Manatuto 26.7 36.3 32.4 16.7 52.3 603 Manufahi 24.9 30.0 50.1 10.2 37.6 470 Oecussi 7.8 29.2 18.4 4.9 63.7 884 Viqueque 11.6 21.6 15.8 3.6 67.1 882
Education No education 0.4 13.2 16.0 0.1 76.5 3,854 Primary 12.5 27.1 28.1 3.8 55.6 3,005 Secondary 37.2 52.0 49.8 20.3 28.0 5,829 More than secondary 67.1 91.0 74.7 55.6 4.3 449
Wealth quintile Lowest 7.1 8.3 10.3 1.4 81.6 2,314 Second 12.3 10.6 17.3 2.2 71.1 2,468 Middle 16.2 16.5 29.9 4.2 57.9 2,590 Fourth 22.3 42.1 43.4 10.1 35.6 2,687 Highest 44.7 89.4 68.2 35.3 5.6 3,077
Total 21.8 36.3 35.8 11.8 47.7 13,137
significantly higher among urban women (37 percent) than among their rural counterparts (17 percent). About one in three women and men in Dili are exposed to all three media sources at least once a week. Media exposure among women is lowest in Ermera where less than 3 percent of women are exposed to all three media sources at least once a week. Men in Liquiçá, Ermera, and Bobonaro are least likely to be exposed to all three sources of media at least once a week. Not surprisingly, media exposure is highly related to the educational level as well as the economic status of the respondent. Exposure to mass media is highest among women with secondary or a higher level of education and among those who are in the highest wealth quintile. The lower level of exposure to media among poor respondents may be because they are less likely to own a radio or television and, therefore, are less likely to be consistently exposed to these media sources. A similar relationship is observed between media exposure among men and their education and wealth.

38 | Characteristics of Respondents
Table 3.4.2 Exposure to mass media: Men
Percentage of men age 15-49 who are exposed to specific media on a weekly basis, by background characteristics, Timor-Leste 2009-10
Background characteristic
Reads a newspaper
at least once a week
Watches television at least once a week
Listens to the radio at least once a
week
All three media at
least once a week
No media at least once a week
Number of men
Age 15-19 18.0 45.7 42.0 9.2 38.7 994 20-24 22.3 48.8 52.3 15.0 32.6 643 25-29 24.5 43.6 47.8 13.4 35.7 586 30-34 24.4 40.4 43.2 12.5 39.9 439 35-39 22.9 39.6 40.5 14.9 44.5 553 40-44 21.7 34.4 41.9 12.9 46.5 462 45-49 12.1 27.3 34.9 4.9 51.1 400
Residence Urban 36.8 74.0 59.4 25.9 13.9 1,102 Rural 14.9 29.3 37.8 6.6 50.1 2,974
District Aileu 21.8 27.7 46.5 10.2 42.6 181 Ainaro 13.6 16.3 32.5 4.7 58.5 217 Baucau 29.0 35.3 40.5 9.0 36.2 415 Bobonaro 10.1 32.7 43.9 3.9 42.8 357 Covalima 12.0 35.7 43.3 7.0 43.6 236 Dili 43.0 80.4 62.3 31.0 9.7 797 Ermera 12.0 10.7 22.0 3.6 70.5 491 Lautem 10.5 36.8 26.2 4.6 53.0 308 Liquiçá 7.2 38.0 39.8 4.1 47.6 252 Manatuto 11.1 53.5 83.2 8.8 14.2 190 Manufahi 18.3 46.5 60.3 8.9 29.1 137 Oecussi 23.7 43.8 46.4 15.2 40.4 235 Viqueque 15.5 32.2 24.2 12.5 63.5 260
Education No education 0.2 15.8 21.1 0.0 71.1 791 Primary 10.6 28.9 35.5 4.2 51.9 1,046 Secondary 28.9 53.4 54.0 16.4 26.1 2,009 More than secondary 67.3 80.9 67.5 47.2 6.5 230
Wealth quintile Lowest 9.3 19.4 21.2 3.1 67.3 728 Second 12.1 18.4 30.1 2.9 59.0 781 Middle 12.3 23.8 39.8 4.9 49.2 786 Fourth 21.9 45.3 50.9 9.7 31.0 849 Highest 43.2 89.0 69.3 34.0 4.6 932
Total 15-49 20.8 41.4 43.7 11.9 40.3 4,076
3.4 EMPLOYMENT
3.4.1 Employment Status
The 2009-10 TLDHS asked respondents a number of questions regarding their employment status, including whether they were working in the seven days preceding the survey and, if not, whether they had worked in the 12 months before the survey. The results for women and men are presented in Tables 3.5.1 and 3.5.2. At the time of the survey, about two-fifths of women were currently employed, and less than one percent was not employed but had worked sometime during the past 12 months.
The proportion of women currently employed increases with age. Current employment is lowest among women age 15-19 (23 percent) and highest among those age 45-49 (58 percent). Women who are divorced, separated, or widowed are more likely to be currently employed than other women. Women who have three or more children are more likely to be currently employed than those with two or fewer children. Less than one-third of women in urban areas were currently working compared with two-fifths of women in rural areas. The higher rural rate of employment reflects the importance of farm work and perhaps a shortage of income, but the distinction between paid and

Characteristics of Respondents | 39
Table 3.5.1 Employment status: Women
Percent distribution of women age 15-49 by employment status, according to background characteristics, Timor-Leste 2009-10
Background characteristic
Employed in the 12 months preceding the survey
Not employed
in the 12 months precedingthe survey Total
Number of women
Currently
employed1 Not currently
employed
Age 15-19 22.7 0.3 77.0 100.0 3,144 20-24 31.1 0.5 68.4 100.0 2,343 25-29 38.2 0.7 61.1 100.0 1,897 30-34 44.3 0.5 55.0 100.0 1,534 35-39 48.6 0.4 50.9 100.0 1,684 40-44 56.7 0.9 42.2 100.0 1,388 45-49 58.1 0.5 41.2 100.0 1,146
Marital status Never married 28.7 0.4 70.9 100.0 4,675 Married or living together 43.1 0.6 56.2 100.0 7,906 Divorced/separated/widowed 65.2 1.0 33.8 100.0 556
Number of living children 0 30.3 0.4 69.2 100.0 5,178 1-2 38.8 0.4 60.7 100.0 2,350 3-4 45.8 0.6 53.3 100.0 2,554 5+ 47.9 0.7 51.4 100.0 3,055
Residence Urban 30.2 0.8 68.8 100.0 3,439 Rural 42.0 0.4 57.5 100.0 9,698
District Aileu 66.0 0.6 33.4 100.0 554 Ainaro 29.7 0.0 70.3 100.0 619 Baucau 26.1 0.2 73.7 100.0 1,408 Bobonaro 44.1 0.1 55.8 100.0 1,262 Covalima 41.6 0.2 58.2 100.0 781 Dili 28.8 1.2 69.8 100.0 2,466 Ermera 43.3 0.1 56.6 100.0 1,542 Lautem 17.5 0.5 82.0 100.0 864 Liquiçá 37.4 0.2 62.4 100.0 801 Manatuto 36.4 0.2 63.4 100.0 603 Manufahi 47.7 0.1 52.0 100.0 470 Oecussi 84.9 2.0 13.1 100.0 884 Viqueque 33.3 0.4 66.0 100.0 882
Education No education 51.6 0.6 47.8 100.0 3,854 Primary 43.6 0.5 55.9 100.0 3,005 Secondary 27.9 0.4 71.6 100.0 5,829 More than secondary 42.7 1.2 56.0 100.0 449
Wealth quintile Lowest 49.1 0.5 50.3 100.0 2,314 Second 42.0 0.5 57.4 100.0 2,468 Middle 41.1 0.5 58.4 100.0 2,590 Fourth 33.7 0.7 65.7 100.0 2,687 Highest 31.6 0.6 67.6 100.0 3,077
Total 38.9 0.5 60.5 100.0 13,137
1 “Currently employed” is defined as having done work in the past seven days. Includes persons who did not work in the past seven days but who are regularly employed and were absent from work for leave, illness, vacation, or any other such reason.
unpaid work may not be especially meaningful in a society with high rates of subsistence living. Current employment rises from 18 percent among women in Lautem to 85 percent among women in Oecussi. Current employment is highest among women with no education and lowest among women with secondary education. Current employment varies inversely with wealth quintile, rising from 32 percent among women in the wealthiest households to 49 percent among women in the poorest households.

40 | Characteristics of Respondents
Table 3.5.2 Employment status: Men
Percent distribution of men age 15-49 by employment status, according to background characteristics, Timor-Leste 2009-10
Background characteristic
Employed in the 12 months preceding the survey
Not employed
in the 12 months precedingthe survey Total
Number of men
Currently
employed1 Not currently
employed
Age 15-19 65.7 2.8 31.6 100.0 994 20-24 78.8 2.9 18.3 100.0 643 25-29 88.6 3.1 8.3 100.0 586 30-34 95.2 1.4 3.4 100.0 439 35-39 95.6 1.2 3.2 100.0 553 40-44 94.9 2.3 2.8 100.0 462 45-49 95.7 1.2 3.1 100.0 400
Marital status Never married 71.4 3.1 25.5 100.0 1,865 Married or living together 95.7 1.6 2.7 100.0 2,158 Divorced/separated/widowed 90.3 0.0 9.7 100.0 53
Number of living children 0 73.0 3.0 24.0 100.0 2,009 1-2 95.8 1.5 2.7 100.0 638 3-4 96.1 1.6 2.4 100.0 720 5+ 95.3 1.7 3.0 100.0 709
Residence Urban 65.4 4.4 30.2 100.0 1,102 Rural 91.6 1.5 6.9 100.0 2,974
District Aileu 84.5 0.4 15.1 100.0 181 Ainaro 86.7 1.5 11.8 100.0 217 Baucau 94.7 0.9 4.4 100.0 415 Bobonaro 85.6 5.2 9.2 100.0 357 Covalima 90.3 0.8 8.9 100.0 236 Dili 60.3 4.3 35.3 100.0 797 Ermera 99.4 0.1 0.5 100.0 491 Lautem 89.2 1.9 8.9 100.0 308 Liquiçá 91.3 5.5 3.2 100.0 252 Manatuto 95.1 2.4 2.5 100.0 190 Manufahi 74.9 1.2 23.9 100.0 137 Oecussi 95.8 0.4 3.8 100.0 235 Viqueque 81.0 1.2 17.9 100.0 260
Education No education 95.1 1.3 3.7 100.0 791 Primary 90.2 2.1 7.7 100.0 1,046 Secondary 77.9 2.9 19.2 100.0 2,009 More than secondary 80.9 0.9 18.3 100.0 230
Wealth quintile Lowest 91.8 0.9 7.3 100.0 728 Second 92.8 1.1 6.1 100.0 781 Middle 90.0 1.9 8.1 100.0 786 Fourth 82.6 2.9 14.5 100.0 849 Highest 69.1 4.1 26.8 100.0 932
Total 15-49 84.5 2.3 13.2 100.0 4,076
1 “Currently employed” is defined as having done work in the past seven days. Includes persons who did not work in the past seven days but who are regularly employed and were absent from work for leave, illness, vacation, or any other such reason.
The proportion currently employed is much higher among men than women (Table 3.5.2).
The majority of men age 15-49 (85 percent) were employed at the time of survey. The percentage of currently employed men rises with age, from 66 percent among men age 15-19 to 96 percent among men age 45-49. Never-married men, men with no children, urban men, those living in Dili, those with a secondary education, and those in the highest wealth quintile are least likely to be currently employed.
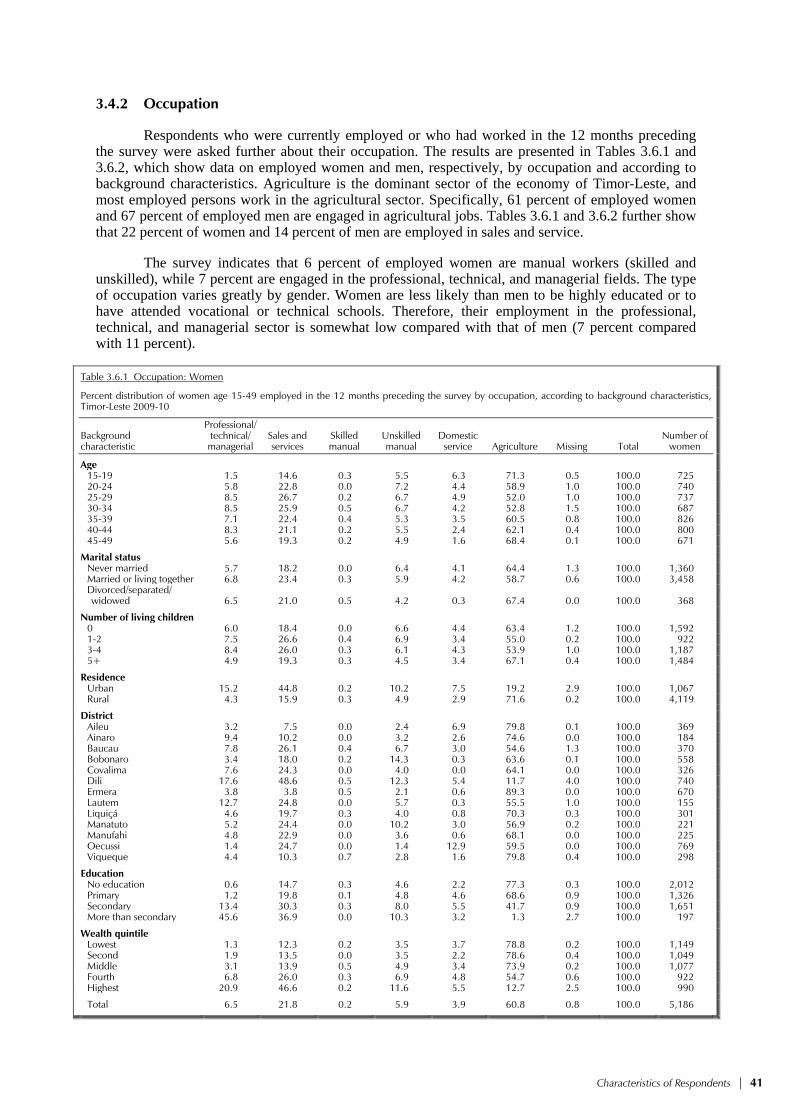
Characteristics of Respondents | 41
3.4.2 Occupation
Respondents who were currently employed or who had worked in the 12 months preceding the survey were asked further about their occupation. The results are presented in Tables 3.6.1 and 3.6.2, which show data on employed women and men, respectively, by occupation and according to background characteristics. Agriculture is the dominant sector of the economy of Timor-Leste, and most employed persons work in the agricultural sector. Specifically, 61 percent of employed women and 67 percent of employed men are engaged in agricultural jobs. Tables 3.6.1 and 3.6.2 further show that 22 percent of women and 14 percent of men are employed in sales and service.
The survey indicates that 6 percent of employed women are manual workers (skilled and unskilled), while 7 percent are engaged in the professional, technical, and managerial fields. The type of occupation varies greatly by gender. Women are less likely than men to be highly educated or to have attended vocational or technical schools. Therefore, their employment in the professional, technical, and managerial sector is somewhat low compared with that of men (7 percent compared with 11 percent).
Table 3.6.1 Occupation: Women
Percent distribution of women age 15-49 employed in the 12 months preceding the survey by occupation, according to background characteristics, Timor-Leste 2009-10
Background characteristic
Professional/ technical/ managerial
Sales and services
Skilled manual
Unskilled manual
Domestic service Agriculture Missing Total
Number of women
Age 15-19 1.5 14.6 0.3 5.5 6.3 71.3 0.5 100.0 725 20-24 5.8 22.8 0.0 7.2 4.4 58.9 1.0 100.0 740 25-29 8.5 26.7 0.2 6.7 4.9 52.0 1.0 100.0 737 30-34 8.5 25.9 0.5 6.7 4.2 52.8 1.5 100.0 687 35-39 7.1 22.4 0.4 5.3 3.5 60.5 0.8 100.0 826 40-44 8.3 21.1 0.2 5.5 2.4 62.1 0.4 100.0 800 45-49 5.6 19.3 0.2 4.9 1.6 68.4 0.1 100.0 671
Marital status Never married 5.7 18.2 0.0 6.4 4.1 64.4 1.3 100.0 1,360 Married or living together 6.8 23.4 0.3 5.9 4.2 58.7 0.6 100.0 3,458
Divorced/separated/ widowed 6.5 21.0 0.5 4.2 0.3 67.4 0.0 100.0 368
Number of living children 0 6.0 18.4 0.0 6.6 4.4 63.4 1.2 100.0 1,592 1-2 7.5 26.6 0.4 6.9 3.4 55.0 0.2 100.0 922 3-4 8.4 26.0 0.3 6.1 4.3 53.9 1.0 100.0 1,187 5+ 4.9 19.3 0.3 4.5 3.4 67.1 0.4 100.0 1,484
Residence Urban 15.2 44.8 0.2 10.2 7.5 19.2 2.9 100.0 1,067 Rural 4.3 15.9 0.3 4.9 2.9 71.6 0.2 100.0 4,119
District Aileu 3.2 7.5 0.0 2.4 6.9 79.8 0.1 100.0 369 Ainaro 9.4 10.2 0.0 3.2 2.6 74.6 0.0 100.0 184 Baucau 7.8 26.1 0.4 6.7 3.0 54.6 1.3 100.0 370 Bobonaro 3.4 18.0 0.2 14.3 0.3 63.6 0.1 100.0 558 Covalima 7.6 24.3 0.0 4.0 0.0 64.1 0.0 100.0 326 Dili 17.6 48.6 0.5 12.3 5.4 11.7 4.0 100.0 740 Ermera 3.8 3.8 0.5 2.1 0.6 89.3 0.0 100.0 670 Lautem 12.7 24.8 0.0 5.7 0.3 55.5 1.0 100.0 155 Liquiçá 4.6 19.7 0.3 4.0 0.8 70.3 0.3 100.0 301 Manatuto 5.2 24.4 0.0 10.2 3.0 56.9 0.2 100.0 221 Manufahi 4.8 22.9 0.0 3.6 0.6 68.1 0.0 100.0 225 Oecussi 1.4 24.7 0.0 1.4 12.9 59.5 0.0 100.0 769 Viqueque 4.4 10.3 0.7 2.8 1.6 79.8 0.4 100.0 298
Education No education 0.6 14.7 0.3 4.6 2.2 77.3 0.3 100.0 2,012 Primary 1.2 19.8 0.1 4.8 4.6 68.6 0.9 100.0 1,326 Secondary 13.4 30.3 0.3 8.0 5.5 41.7 0.9 100.0 1,651 More than secondary 45.6 36.9 0.0 10.3 3.2 1.3 2.7 100.0 197
Wealth quintile Lowest 1.3 12.3 0.2 3.5 3.7 78.8 0.2 100.0 1,149 Second 1.9 13.5 0.0 3.5 2.2 78.6 0.4 100.0 1,049 Middle 3.1 13.9 0.5 4.9 3.4 73.9 0.2 100.0 1,077 Fourth 6.8 26.0 0.3 6.9 4.8 54.7 0.6 100.0 922 Highest 20.9 46.6 0.2 11.6 5.5 12.7 2.5 100.0 990
Total 6.5 21.8 0.2 5.9 3.9 60.8 0.8 100.0 5,186

42 | Characteristics of Respondents
Table 3.6.2 Occupation: Men
Percent distribution of men age 15-49 employed in the 12 months preceding the survey by occupation, according to background characteristics, Timor-Leste 2009-10
Background characteristic
Professional/ technical/ managerial
Sales and services
Skilled manual
Unskilled manual
Domestic service Agriculture Missing Total
Number of men
Age 15-19 3.6 5.4 1.1 2.8 1.0 85.7 0.4 100.0 680 20-24 8.3 10.6 1.8 4.6 1.1 72.6 1.1 100.0 525 25-29 12.4 18.8 1.6 5.9 0.2 58.4 2.7 100.0 537 30-34 13.0 22.2 3.3 4.9 0.1 56.1 0.4 100.0 424 35-39 14.2 19.5 1.8 4.9 0.1 58.8 0.7 100.0 535 40-44 15.6 14.5 0.9 6.4 0.0 61.5 1.1 100.0 449 45-49 11.8 13.7 1.3 0.1 0.0 71.8 1.4 100.0 387
Marital status Never married 8.2 8.5 1.3 4.2 0.9 76.2 0.7 100.0 1,390 Married or living together 12.6 18.5 1.9 4.3 0.1 61.3 1.4 100.0 2,101
Divorced/separated/ widowed 4.9 5.1 2.1 5.0 0.0 82.9 0.0 100.0 47
Number of living children 0 8.8 9.4 1.3 4.2 0.8 74.6 1.0 100.0 1,527 1-2 10.3 20.4 2.6 4.7 0.4 59.1 2.5 100.0 621 3-4 13.1 22.1 1.2 5.4 0.0 57.4 0.7 100.0 703 5+ 13.3 12.3 2.0 2.8 0.0 69.2 0.4 100.0 688
Residence Urban 19.5 36.0 1.6 10.1 0.6 29.2 2.9 100.0 769 Rural 8.4 8.4 1.7 2.6 0.4 78.0 0.6 100.0 2,769
District Aileu 10.9 3.6 0.0 0.8 0.0 84.3 0.4 100.0 154 Ainaro 4.5 6.7 0.0 0.8 2.7 85.3 0.0 100.0 192 Baucau 5.4 13.4 2.9 3.7 0.0 72.2 2.4 100.0 396 Bobonaro 6.4 10.5 0.8 1.8 0.0 80.1 0.4 100.0 324 Covalima 15.1 11.9 3.0 3.3 0.0 66.6 0.0 100.0 215 Dili 24.3 45.9 2.4 11.9 0.4 10.9 4.2 100.0 515 Ermera 3.4 3.4 0.3 0.7 0.0 92.1 0.0 100.0 489 Lautem 7.2 8.2 1.5 3.9 1.5 77.7 0.0 100.0 280 Liquiçá 12.3 12.3 4.3 6.6 0.0 63.6 0.9 100.0 244 Manatuto 8.0 21.9 4.1 5.1 1.3 58.8 0.9 100.0 185 Manufahi 19.9 8.4 0.0 3.1 0.0 68.6 0.0 100.0 105 Oecussi 8.4 6.2 0.2 0.9 0.4 83.8 0.0 100.0 226 Viqueque 16.3 4.5 0.5 6.3 0.0 71.9 0.5 100.0 214
Education No education 4.2 6.4 1.7 0.9 0.0 86.7 0.1 100.0 762 Primary 8.1 9.8 2.5 2.8 0.2 76.2 0.3 100.0 965 Secondary 12.1 18.8 1.3 6.0 0.7 59.6 1.5 100.0 1,623 More than secondary 40.0 32.7 0.0 10.3 0.7 11.3 5.0 100.0 188
Wealth quintile Lowest 4.2 2.3 1.0 2.0 0.3 90.1 0.2 100.0 675 Second 5.2 5.2 1.2 2.0 0.3 85.4 0.8 100.0 733 Middle 8.0 6.4 2.4 2.0 0.4 80.2 0.6 100.0 722 Fourth 14.7 17.9 1.1 5.7 0.4 58.9 1.2 100.0 726 Highest 22.1 41.1 2.5 9.9 0.6 21.1 2.7 100.0 682
Total 15-49 10.8 14.4 1.6 4.3 0.4 67.4 1.1 100.0 3,538
The relationship between occupation and age is mixed. One notable finding is the relatively
higher percentages of women age 25-34 employed in sales and services and engaged in professional, technical, and managerial occupations.
Residence has a significant effect on the type of occupation. As expected, a high proportion of respondents in rural areas—seven in ten employed women, and eight in ten employed men—are engaged in agricultural work. Urban women are most likely to be engaged in sales and services compared with other occupations. Women and men in Dili are much more likely to be engaged in sales and services and in professional, technical, and managerial occupations, and are least likely to be engaged in agriculture. On the other hand, women and men in Ermera are most likely to be engaged in agriculture and least likely to be engaged in sales and services.

Characteristics of Respondents | 43
3.4.3 Earnings, Employers, and Continuity of Employment
Table 3.7 shows the percent distribution of women by type of earnings and employment characteristics. These tables also present data on whether respondents are involved in agricultural or nonagricultural occupations because all of the employment variables shown in the tables are strongly influenced by the sector of employment.
Table 3.7 Type of employment
Percent distribution of women age 15-49 employed in the 12 months preceding the survey by type of earnings, type of employer, and continuity of employment, according to type of employment (agricultural or nonagricultural), Timor-Leste 2009-10
Employment characteristic
Agricultural work
Nonagricultural work Total
Type of earnings Cash only 2.3 45.6 19.3 Cash and in-kind 0.3 2.1 1.0 In-kind only 1.1 0.5 0.9 Not paid 96.2 51.7 78.8 Missing 0.0 0.1 0.0
Total 100.0 100.0 100.0
Type of employer Employed by family member 19.3 11.1 16.1
Employed by nonfamily member 1.3 37.8 15.6
Self-employed 79.5 51.2 68.4
Total 100.0 100.0 100.0
Continuity of employment All year 26.9 68.0 42.9 Seasonal 57.0 22.7 43.7 Occasional 16.1 9.2 13.5
Total 100.0 100.0 100.0
Number of women employed during the last 12 months 3,154 1,992 5,186
Note: Total includes 40 women with missing information on type of employment who are not shown separately.
Four-fifths of working women are not paid for their work. This is because the vast majority of
women (96 percent) engaged in agricultural work are unpaid workers, most likely employed by family members at the peak of the agricultural season. On the other hand, almost one in two women employed in nonagricultural work will receive cash earnings.
More than two-thirds of women are self-employed, with self-employment much higher in the agricultural (80 percent) than in the nonagricultural sector (51 percent). Women are as likely to be employed by a family member as by a nonfamily member (16 percent each). One in five women working in the agricultural sector is working for a family member compared with only 11 percent of women working in the nonagricultural sector. In addition, the proportion of women employed by someone outside the family is higher among those working in the nonagricultural sector than among those working in the agricultural sector (38 percent versus 1 percent).
About two in five women work all year. A similar proportion works seasonally, while one in seven works occasionally. Continuity of employment also varies by sector. The majority of women employed in the agricultural sector are seasonal workers (57 percent), compared with only one in four among those working in the nonagricultural sector. On the other hand, 68 percent of women working in the nonagricultural sector work all year compared with 27 percent of women engaged in agricultural work.
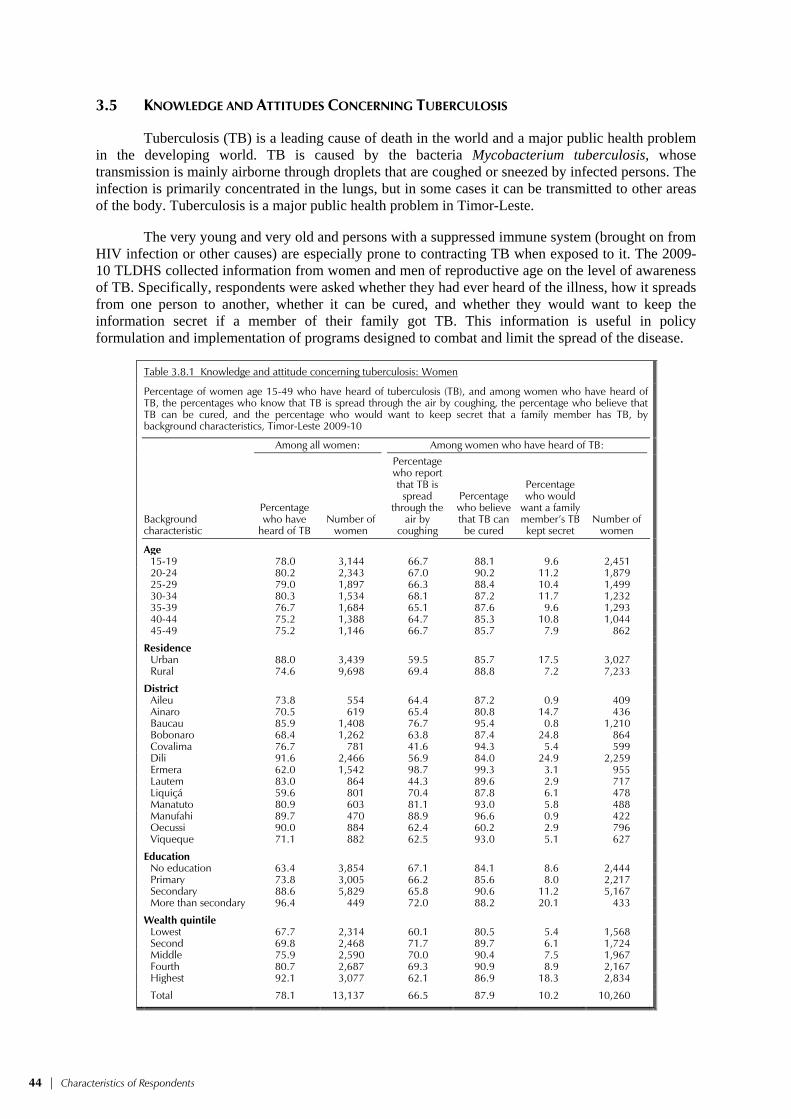
44 | Characteristics of Respondents
3.5 KNOWLEDGE AND ATTITUDES CONCERNING TUBERCULOSIS
Tuberculosis (TB) is a leading cause of death in the world and a major public health problem in the developing world. TB is caused by the bacteria Mycobacterium tuberculosis, whose transmission is mainly airborne through droplets that are coughed or sneezed by infected persons. The infection is primarily concentrated in the lungs, but in some cases it can be transmitted to other areas of the body. Tuberculosis is a major public health problem in Timor-Leste.
The very young and very old and persons with a suppressed immune system (brought on from HIV infection or other causes) are especially prone to contracting TB when exposed to it. The 2009-10 TLDHS collected information from women and men of reproductive age on the level of awareness of TB. Specifically, respondents were asked whether they had ever heard of the illness, how it spreads from one person to another, whether it can be cured, and whether they would want to keep the information secret if a member of their family got TB. This information is useful in policy formulation and implementation of programs designed to combat and limit the spread of the disease.
Table 3.8.1 Knowledge and attitude concerning tuberculosis: Women
Percentage of women age 15-49 who have heard of tuberculosis (TB), and among women who have heard of TB, the percentages who know that TB is spread through the air by coughing, the percentage who believe that TB can be cured, and the percentage who would want to keep secret that a family member has TB, by background characteristics, Timor-Leste 2009-10
Background characteristic
Among all women: Among women who have heard of TB:
Percentage who have
heard of TB Number of
women
Percentage who report that TB is
spread through the
air by coughing
Percentage who believe that TB can be cured
Percentage who would
want a family member’s TB kept secret
Number of women
Age 15-19 78.0 3,144 66.7 88.1 9.6 2,451 20-24 80.2 2,343 67.0 90.2 11.2 1,879 25-29 79.0 1,897 66.3 88.4 10.4 1,499 30-34 80.3 1,534 68.1 87.2 11.7 1,232 35-39 76.7 1,684 65.1 87.6 9.6 1,293 40-44 75.2 1,388 64.7 85.3 10.8 1,044 45-49 75.2 1,146 66.7 85.7 7.9 862
Residence Urban 88.0 3,439 59.5 85.7 17.5 3,027 Rural 74.6 9,698 69.4 88.8 7.2 7,233
District Aileu 73.8 554 64.4 87.2 0.9 409 Ainaro 70.5 619 65.4 80.8 14.7 436 Baucau 85.9 1,408 76.7 95.4 0.8 1,210 Bobonaro 68.4 1,262 63.8 87.4 24.8 864 Covalima 76.7 781 41.6 94.3 5.4 599 Dili 91.6 2,466 56.9 84.0 24.9 2,259 Ermera 62.0 1,542 98.7 99.3 3.1 955 Lautem 83.0 864 44.3 89.6 2.9 717 Liquiçá 59.6 801 70.4 87.8 6.1 478 Manatuto 80.9 603 81.1 93.0 5.8 488 Manufahi 89.7 470 88.9 96.6 0.9 422 Oecussi 90.0 884 62.4 60.2 2.9 796 Viqueque 71.1 882 62.5 93.0 5.1 627
Education No education 63.4 3,854 67.1 84.1 8.6 2,444 Primary 73.8 3,005 66.2 85.6 8.0 2,217 Secondary 88.6 5,829 65.8 90.6 11.2 5,167 More than secondary 96.4 449 72.0 88.2 20.1 433
Wealth quintile Lowest 67.7 2,314 60.1 80.5 5.4 1,568 Second 69.8 2,468 71.7 89.7 6.1 1,724 Middle 75.9 2,590 70.0 90.4 7.5 1,967 Fourth 80.7 2,687 69.3 90.9 8.9 2,167 Highest 92.1 3,077 62.1 86.9 18.3 2,834
Total 78.1 13,137 66.5 87.9 10.2 10,260

Characteristics of Respondents | 45
Tables 3.8.1 and 3.8.2 show the percentage of women and men who have heard of TB, and among those who have heard of it, their knowledge and attitudes concerning TB, according to background characteristics. TB awareness is very high in Timor-Leste, with 78 percent of women and 83 percent of men aware of it. Differences in awareness of TB by age are not prominent. Rural women and men are less likely to be aware of TB than their urban counterparts. Awareness of TB is lowest among women in Liquiçá and men in Ermera, and highest among women in Dili and men in Manatuto. Not surprisingly, awareness of TB rises with education and wealth quintile.
Sixty-seven percent of women and 64 percent of men age 15-49 reported that TB is spread through the air when coughing or sneezing. Knowledge of the spread of TB through the air is higher in rural than urban areas among women, but among men, it is higher in urban than in rural areas. Surprisingly, almost all women who are aware of TB in Ermera are also aware of how it is spread and that it can be cured. Knowledge of how it is spread is lowest in Covalima, although nearly all women in Covalima who are aware of TB believe it can be cured. All men in Manatuto who are aware of TB are also aware of how it is spread and that it can be cured. There is little difference in the knowledge of how TB is spread by education among women, but among men knowledge increases markedly with education. There is no clear pattern between knowledge of how TB is spread and wealth quintile.
Most respondents are aware that TB is curable. Eighty-eight percent of women, and 93 percent of men believe that TB can be cured. Women’s belief that TB can be cured varies minimally by education, wealth quintile, and place of residence.
A relatively small percentage of women and men mention that they would want to keep a family member’s TB a secret. However, women are five times more likely than men to want to keep secret that a family member has TB (10 percent compared with 2 percent). Differences by age are not large, although the oldest cohort of women is least likely to want to keep this secret. More than twice as many women in urban as in rural areas want to keep a family member’s TB a secret. Among women, wanting to keep secret a family member’s TB is much higher in Dili and Bobonaro, and highest among the most educated and wealthiest women. Differences by background characteristics are not as marked among men.

46 | Characteristics of Respondents
Table 3.8.2 Knowledge and attitude concerning tuberculosis: Men
Percentage of men age 15-49 who have heard of tuberculosis (TB), and among men who have heard of TB, the percentages who know that TB is spread through the air by coughing, the percentage who believe that TB can be cured, and the percentage who would want to keep secret that a family member has TB, by background characteristics, Timor-Leste 2009-10
Background characteristic
Among all men: Among men who have heard of TB:
Percentage who have
heard of TB Number of
men
Percentage who report that TB is
spread through the
air by coughing
Percentage who believe that TB can be cured
Percentage who would
want a family member’s TB kept secret
Number of men
Age 15-19 77.9 994 59.5 91.3 2.2 774 20-24 87.1 643 64.3 93.7 3.3 560 25-29 87.4 586 67.5 92.8 2.6 512 30-34 86.8 439 66.8 94.6 1.3 381 35-39 86.0 553 64.5 95.1 1.9 476 40-44 81.6 462 63.5 94.1 0.6 377 45-49 75.1 400 61.3 92.0 1.8 300
Residence Urban 94.3 1,102 76.6 95.9 2.9 1,039 Rural 78.7 2,974 57.9 92.0 1.7 2,340
District Aileu 71.3 181 77.8 79.9 0.9 129 Ainaro 90.9 217 41.6 83.9 0.3 197 Baucau 94.1 415 28.2 96.3 0.8 390 Bobonaro 85.4 357 11.3 81.1 9.3 304 Covalima 91.5 236 88.9 93.5 0.0 216 Dili 97.2 797 82.5 96.3 3.4 774 Ermera 39.5 491 47.2 95.2 1.0 194 Lautem 92.5 308 61.3 92.0 0.9 285 Liquiçá 63.3 252 78.1 91.6 0.5 159 Manatuto 99.7 190 100.0 100.0 0.0 189 Manufahi 63.9 137 98.7 99.4 0.0 88 Oecussi 95.7 235 66.5 98.0 1.1 225 Viqueque 87.5 260 77.5 96.9 1.0 228
Education No education 58.1 791 52.0 84.8 4.0 460 Primary 76.7 1,046 54.8 92.1 2.2 802 Secondary 94.0 2,009 67.4 95.1 1.5 1,888 More than secondary 99.7 230 87.1 98.5 2.2 230
Wealth quintile Lowest 77.0 728 59.7 92.0 1.4 561 Second 73.7 781 51.2 90.3 2.4 575 Middle 77.8 786 58.8 91.4 1.8 612 Fourth 85.8 849 63.2 95.1 2.0 729 Highest 96.9 932 77.6 95.5 2.6 903
Total 15-49 82.9 4,076 63.6 93.2 2.1 3,379
3.6 USE OF TOBACCO
Smoking has negative effects on health and is associated with increased risk of lung and heart diseases. Women and men interviewed in the 2009-10 TLDHS were asked about their smoking habits. Table 3.9.1 and 3.9.2 show the percentages of women and men who smoke cigarettes or tobacco and the percent distributions of female and male cigarette smokers by number of cigarettes smoked in the preceding 24 hours, according to background characteristics.
Use of tobacco is much more common among Timorese men than women. Sixty-six percent of men smoke cigarettes, while 25 percent consume other forms of tobacco, compared with just 3 percent of women who smoke cigarettes and 3 percent who consume other forms of tobacco. Use of tobacco is most common among older men, those living in rural areas, men with little or no education, and men in the lower wealth quintiles, with much of this difference due to the use of other tobacco. Use of tobacco varies little by background characteristics among women; however, it must be noted that 4 percent each of pregnant women and women currently breastfeeding use tobacco.

Characteristics of Respondents | 47
Table 3.9.1 Use of tobacco: Women
Percentage of women age 15-49 who smoke cigarettes or a pipe or use other tobacco products and the percent distribution of cigarette smokers by number of cigarettes smoked in preceding 24 hours, according to background characteristics and maternity status, Timor-Leste 2009-10
Background characteristic
Uses tobacco Does not
use tobacco
Number of women
Number of cigarettes in the last 24 hours
Total
Number of cigarette smokers Cigarettes Pipe
Other tobacco 1-2 3-5 6-9 10+
Don’t know/ missing
Age 15-19 0.4 0.0 0.2 99.6 3,144 * * * * * 100.0 11 20-24 1.8 0.1 0.7 98.1 2,343 (60.0) (20.9) (4.3) (6.4) (8.5) 100.0 42 25-29 2.2 0.0 1.7 97.2 1,897 (38.2) (38.6) (2.7) (13.3) (7.2) 100.0 42 30-34 2.7 0.2 2.6 95.7 1,534 48.3 32.0 8.0 11.7 0.0 100.0 42 35-39 4.9 0.1 4.8 92.3 1,684 52.6 21.7 14.4 11.3 0.0 100.0 82 40-44 6.4 0.1 7.3 89.0 1,388 53.7 26.2 13.2 4.2 2.7 100.0 89 45-49 6.5 0.4 10.2 86.4 1,146 44.4 31.2 11.0 13.4 0.0 100.0 75
Residence Urban 3.5 0.1 2.4 95.1 3,439 56.9 18.8 10.3 10.7 3.3 100.0 121 Rural 2.7 0.1 3.2 95.4 9,698 47.5 31.0 10.6 8.9 1.9 100.0 262
District Aileu 7.0 0.1 5.6 91.9 554 52.4 23.2 8.8 14.3 1.4 100.0 39 Ainaro 0.5 0.0 0.9 98.9 619 * * * * * 100.0 3 Baucau 1.3 0.0 1.5 97.6 1,408 * * * * * 100.0 18 Bobonaro 0.9 0.1 1.5 97.6 1,262 * * * * * 100.0 12 Covalima 1.2 0.0 4.1 95.0 781 * * * * * 100.0 9 Dili 3.4 0.1 1.8 95.7 2,466 64.3 16.2 7.3 7.3 4.9 100.0 83 Ermera 2.1 0.2 1.8 97.5 1,542 * * * * * 100.0 33 Lautem 4.2 0.4 3.1 93.2 864 (38.0) (46.6) (2.8) (7.0) (5.6) 100.0 37 Liquiçá 8.4 0.1 7.8 88.7 801 72.5 24.1 2.3 0.0 1.1 100.0 68 Manatuto 3.1 0.0 1.9 95.6 603 (58.8) (38.2) (0.0) (2.9) (0.0) 100.0 19 Manufahi 8.0 0.0 6.2 90.5 470 20.8 28.1 35.2 15.9 0.0 100.0 38 Oecussi 1.9 0.2 4.9 93.9 884 * * * * * 100.0 17 Viqueque 1.0 0.0 4.4 95.1 882 * * * * * 100.0 9
Education No education 4.9 0.2 6.8 90.9 3,854 45.2 30.8 10.1 13.1 0.9 100.0 188 Primary 3.4 0.1 2.9 94.9 3,005 56.8 26.6 10.0 2.9 3.7 100.0 103 Secondary 1.5 0.0 0.7 98.2 5,829 53.4 19.2 13.1 10.1 4.2 100.0 85 More than secondary 1.6 0.0 0.4 98.4 449 * * * * * 100.0 7
Maternity status Pregnant 2.8 0.0 2.1 96.3 899 (49.3) (23.0) (8.6) (11.2) (7.9) 100.0 26
Breastfeeding (not pregnant) 2.5 0.1 2.9 95.8 2,953 39.2 37.2 7.6 10.9 5.1 100.0 75
Neither 3.0 0.1 3.1 95.0 9,285 53.6 24.9 11.5 8.9 1.1 100.0 283
Wealth quintile Lowest 2.7 0.1 5.3 93.2 2,314 42.6 33.0 15.4 6.5 2.6 100.0 63 Second 3.6 0.1 3.8 94.7 2,468 43.8 32.2 9.2 12.7 2.0 100.0 89 Middle 2.9 0.2 3.0 95.6 2,590 54.1 26.1 9.6 8.8 1.3 100.0 76 Fourth 2.5 0.1 2.1 96.2 2,687 58.5 26.7 7.6 7.2 0.0 100.0 67 Highest 2.9 0.1 1.4 96.4 3,077 53.6 19.3 11.4 10.6 5.2 100.0 88
Total 2.9 0.1 3.0 95.3 13,137 50.5 27.2 10.5 9.5 2.3 100.0 383
Note: Figures in parentheses are based on 25-49 unweighted cases. An asterisk indicates that a figure is based on fewer than 25 unweighted cases and has been suppressed.
Among male cigarette smokers, two-fifths smoked 10 or more cigarettes, one-fourth smoked
3 to 5 cigarettes, one-fifth smoked 6 to 9 cigarettes, and one-eighth smoked 1 to 2 cigarettes in the 24 hours prior to the survey. Among women who smoked, half smoked just 1 to 2 cigarettes, one-fourth smoked 3 to 5 cigarettes, and one in ten smoked either 6 to 9 or 10 or more cigarettes in the past 24 hours.

48 | Characteristics of Respondents
Table 3.9.2 Use of tobacco: Men
Percentage of men age 15-49 who smoke cigarettes or a pipe or use other tobacco products and the percent distribution of cigarette smokers by number of cigarettes smoked in preceding 24 hours, according to background characteristics, Timor-Leste 2009-10
Background characteristic
Uses tobacco Does not
use tobacco
Number of men
Number of cigarettes in the last 24 hours
Total
Number of
cigarette smokers Cigarettes Pipe
Other tobacco 0 1-2 3-5 6-9 10+
Don’t know/ missing
Age 15-19 34.9 0.2 9.4 63.7 994 0.3 21.6 39.6 17.4 21.2 0.0 100.0 347 20-24 73.1 0.0 20.2 25.1 643 0.0 11.4 32.1 20.5 36.0 0.0 100.0 470 25-29 84.2 0.0 25.3 13.2 586 0.5 10.0 23.3 21.7 44.5 0.0 100.0 494 30-34 79.4 0.0 30.0 15.8 439 1.4 9.6 23.2 19.3 46.5 0.0 100.0 349 35-39 72.4 0.4 32.2 23.0 553 1.0 9.0 23.5 22.7 43.7 0.1 100.0 400 40-44 72.0 0.4 38.8 20.7 462 1.0 12.6 22.8 22.5 41.1 0.0 100.0 332 45-49 71.7 0.3 43.9 20.1 400 0.7 15.1 21.7 18.8 43.7 0.0 100.0 287
Residence Urban 62.5 0.0 9.9 36.0 1,102 0.1 9.8 23.7 20.2 46.2 0.0 100.0 689 Rural 66.9 0.2 31.2 28.5 2,974 0.9 13.3 27.8 20.7 37.3 0.0 100.0 1,990
District Aileu 70.5 0.0 26.4 27.2 181 0.0 13.3 24.6 29.1 33.1 0.0 100.0 127 Ainaro 65.8 0.0 38.2 28.1 217 0.0 20.6 27.4 25.4 26.6 0.0 100.0 143 Baucau 69.7 0.4 8.9 28.7 415 0.0 4.6 34.3 29.1 32.1 0.0 100.0 289 Bobonaro 49.6 0.0 20.8 34.5 357 0.0 11.4 29.9 26.9 31.8 0.0 100.0 177 Covalima 72.5 0.0 21.3 25.6 236 0.0 17.1 51.3 16.8 14.8 0.0 100.0 171 Dili 62.5 0.0 5.7 37.3 797 0.0 6.4 22.4 20.8 50.4 0.0 100.0 498 Ermera 76.5 0.4 51.2 23.2 491 0.0 11.0 34.3 25.7 29.1 0.0 100.0 376 Lautem 48.5 0.3 7.5 51.3 308 0.0 6.3 15.1 21.1 57.5 0.0 100.0 149 Liquiçá 65.4 0.0 32.6 27.4 252 0.5 33.6 25.9 10.5 29.6 0.0 100.0 165 Manatuto 72.1 0.0 20.9 25.1 190 0.0 1.5 1.9 5.1 91.0 0.4 100.0 137 Manufahi 61.9 0.0 44.5 21.5 137 0.0 23.6 32.7 15.6 28.0 0.0 100.0 85 Oecussi 79.0 0.4 66.3 16.9 235 9.1 30.8 26.6 13.3 20.2 0.0 100.0 186 Viqueque 67.5 0.4 33.1 29.4 260 0.0 3.5 11.7 13.2 71.7 0.0 100.0 176
Education No education 70.9 0.5 51.5 18.6 791 1.3 15.2 25.2 23.0 35.3 0.0 100.0 560 Primary 72.5 0.1 34.6 23.3 1,046 1.0 12.0 27.9 20.7 38.3 0.1 100.0 758 Secondary 60.8 0.1 12.5 38.0 2,009 0.2 11.8 27.3 19.7 41.1 0.0 100.0 1,221 More than secondary 60.6 0.0 7.1 39.4 230 0.0 8.1 22.2 18.4 51.2 0.0 100.0 140
Wealth quintile Lowest 65.4 0.7 42.0 26.5 728 2.2 18.3 26.4 17.3 35.7 0.0 100.0 476 Second 67.5 0.0 38.8 26.9 781 0.7 15.3 27.6 22.3 34.1 0.0 100.0 527 Middle 67.5 0.0 28.3 28.2 786 0.2 12.7 30.3 24.4 32.4 0.0 100.0 531 Fourth 67.3 0.2 18.7 30.8 849 0.4 10.3 27.6 19.2 42.5 0.0 100.0 571 Highest 61.5 0.0 5.0 38.5 932 0.0 6.6 22.1 19.5 51.6 0.1 100.0 574
Total 15-49 65.7 0.2 25.4 30.5 4,076 0.7 12.4 26.7 20.6 39.6 0.0 100.0 2,679

Fertility | 49
FERTILITY 4
One of the major objectives of the 2009-10 TLDHS was to examine levels, trends and differentials in fertility in Timor-Leste. Fertility is one of the three principal components of population dynamics that determines the size and structure of the population of a country. Analysis in this chapter is based on birth histories collected from women age 15-49 who were interviewed during the survey. These women were asked the number of children living at home, children living elsewhere, and children who had died, in order to obtain the total number of live births that the women had in their lifetime. For each live birth, information was collected on the name, sex, age, and survival status of the child. For children who had died, age at death was recorded. Information from the birth history was then used to assess current and completed fertility and factors related to fertility, such as age at first birth, birth intervals, and adolescent childbearing. In addition to information on live births, the survey included questions pertaining to pregnancies in the past five years that did not result in a live birth, including the month and year the pregnancy ended and the duration of the pregnancy.
This chapter analyzes the information collected in the 2009-10 TLDHS on current fertility and differentials by the background characteristics of the women. Trends in fertility and cumulative fertility in Timor-Leste are reported. The chapter also examines the length of birth intervals, age at first birth, and frequency of teenage pregnancy and motherhood. As is standard practice, the analysis of fertility presented here is based only on live births.
4.1 CURRENT FERTILITY
The level of current fertility is one of the most important demographic indicators for determining the status of women in a society. Health and family planning policy makers are aware of its direct relevance to population policy and programs. Measures of current fertility are presented in Table 4.1 for the three-year period preceding the survey, corresponding roughly to the calendar years 2007-2009. A three-year period was chosen because it reflects the most current information, while also allowing the rates to be calculated on a sufficient number of cases so as not to compromise the statistical precision of the estimate.
Several measures of fertility are shown in this table. Age-specific fertility rates (ASFRs)1, expressed as the number of births per thousand women in a specified age group, are calculated by dividing the number of live births to women in a specific age group by the number of woman-years lived in that age group. The total fertility rate (TFR) is the sum of the ASFRs and is defined as the total number of births a woman would have by the end of her childbearing period if she were to pass through those years bearing children at the currently observed ASFRs. 1 Numerators of the age-specific fertility rates are calculated by summing the number of live births that occurred in the period 1-36 months preceding the survey (determined by the date of interview and the date of birth of the child), and classifying them by the age (in 5-year groups) of the mother at the time of birth (determined by the mother’s date of birth). The denominators of the rates are the number of woman-years lived in each of the specified 5-year groups during the 1 to 36 months preceding the survey.
Table 4.1 Current fertility
Age-specific and total rate, the general fertility rate, and the crude birth rate for the three years preceding the survey, by residence, Timor-Leste 2009-10
Age group
Residence
Total Urban Rural
15-19 35 57 51 20-24 187 236 221 25-29 251 287 276 30-34 235 261 254 35-39 171 205 197 40-44 64 96 89 45-49 33 51 47
TFR (15-49) 4.9 6.0 5.7 GFR 153 183 175 CBR 33.1 33.2 33.2
Notes: Age-specific fertility rates are per 1,000 women. Rates for age group 45-49 may be slightly biased due to truncation. Rates are for the period 1-36 months prior to interview. TFR: Total fertility rate expressed per woman GFR: General fertility rate expressed per 1,000 women CBR: Crude birth rate, expressed per 1,000 population

50 | Fertility
The general fertility rate (GFR) is the number of live births occurring during a specified period per 1,000 women age 15-44. The crude birth rate (CBR) is the number of births per 1,000 population during a specified period.
Table 4.1 shows the current fertility for Timor-Leste at the national level and by urban-rural residence. The total fertility rate for Timor-Leste for the three years preceding the survey is 5.7 births per woman and is the highest in South East Asia and Asia (together with Afghanistan) (PRB, 2010) but below the levels of Africa. At this level, it is estimated that the population will increase from its current size of 1.2 million to 1.9 million by the year 2025 and 3.2 million by the year 2050 (PRB, 2010). As expected, fertility is considerably higher in rural areas than in urban areas. Rural women have on average about one child more than urban women (6.0 compared with 4.9 births per woman). As the ASFRs show, the pattern of high rural fertility is prevalent in all age groups (Figure 4.1). The urban-rural difference in fertility is most pronounced for women age 20-24 (187 births per 1,000 women in urban areas versus 236 births per 1,000 women in rural areas).
Figure 4.1 Age-specific Fertility Rates by Urban-Rural Residence
Timor-Leste 2009-10
&&
&
&
&
&
&
$ $
$
$
$
$
$
15-19 20-24 25-29 30-34 35-39 40-44 45-49
Age group
0
50
100
150
200
250
300Births per 1,000 women
Urban Rural Total$ &
The overall age pattern of fertility as reflected in the ASFRs indicates that childbearing begins early. Fertility is low among adolescents and increases to a peak of 276 births per 1,000 among women age 25-29 and declines thereafter.
4.2 FERTILITY DIFFERENTIALS
Table 4.2 presents the differentials in the total fertility rates, the percentage of women who are currently pregnant and the mean number of children ever born (CEB) to women age 40-49, by urban-rural residence, district, education, and wealth quintile.
There are considerable differentials in fertility among districts, with fertility ranging from a low of 4.4 births per woman in Covalima to a high of 7.2 births per woman in Ainaro. The level of fertility is inversely related to women’s educational attainment, decreasing rapidly from 6.1 births among women with no education to 2.9 births among women with more than secondary education. Fertility is also inversely associated with wealth quintile. Women in the lowest wealth quintile have an average of 7.3 births, about three children more than women in the highest quintile (4.2 births).

Fertility | 51
Table 4.2 Fertility by background characteristics
Total fertility rate for the three years preceding the survey, percentage of women age 15-49 currently pregnant, and mean number of children ever born to women age 40-49 years, by background characteristics, Timor-Leste 2009-10
Background characteristic
Total fertility rate
Percentage women age
15-49 currently pregnant
Mean number of children ever born to women
age 40-49
Residence Urban 4.9 7.1 5.5 Rural 6.0 6.7 5.9
District Aileu 5.6 5.4 6.3 Ainaro 7.2 8.4 6.7 Baucau 5.5 6.1 5.0 Bobonaro 6.0 5.4 6.0 Covalima 4.4 5.8 5.5 Dili 4.6 6.9 5.4 Ermera 6.6 6.8 6.9 Lautem 6.7 8.6 6.5 Liquiçá 5.5 7.0 6.5 Manatuto 5.5 6.6 5.8 Manufahi 5.9 8.8 5.5 Oecussi 6.6 7.0 5.4 Viqueque 5.6 7.7 5.3
Education No education 6.1 6.7 6.0 Primary 6.5 7.7 6.2 Secondary 5.2 6.4 5.2 More than secondary 2.9 8.3 3.1
Wealth quintile Lowest 7.3 6.9 5.9 Second 6.0 7.8 6.0 Middle 6.1 7.0 5.9 Fourth 5.3 6.4 6.0 Highest 4.2 6.3 5.3
Total 5.7 6.8 5.8
Note: Total fertility rates are for the period 1-36 months prior to interview.
Table 4.2 also presents a crude assessment of trends in the various subgroups by comparing
current fertility with a measure of completed fertility: the mean number of children ever born to women age 40-49. The mean number of children ever born to older women who are nearing the end of their reproductive period is an indicator of average completed fertility of women who began childbearing three decades before the survey. If fertility remained constant over time, and the reported data on both children ever born and births during the three years preceding the survey are reasonably accurate, the TFR and the mean number of children ever born for women 40-49 are expected to be similar. When fertility levels have been falling, the TFR will be substantially lower than the mean number of children ever born among women age 40-49.
The comparison between the two measures suggests that overall fertility has remained constant in the past few decades, because the TFR in the three years preceding the survey and the mean number of children ever born to women 40-49 are similar (5.7 and 5.8, respectively). However, it is interesting to note that there are marked differences between the two measures by background characteristics. While there has been little difference in rural fertility, urban fertility has fallen by 0.6 births over the last few decades. This decline is not reflected in the overall fertility because the urban population is much smaller than the rural population, and overall fertility is therefore more likely to reflect fertility in rural areas. There has been a notable decline in fertility in the last few decades in Aileu, Covalima, Dili, and Liquiçá and smaller declines in Ermera and Manatuto. On the other hand, fertility has increased markedly in Ainaro, Baucau, and Oecussi, with smaller increases in Lautem, Manufahi, and Viqueque. No changes were seen in Bobonaro. Increases in fertility were also observed among women with little to no education and women in the lowest wealth quintile.
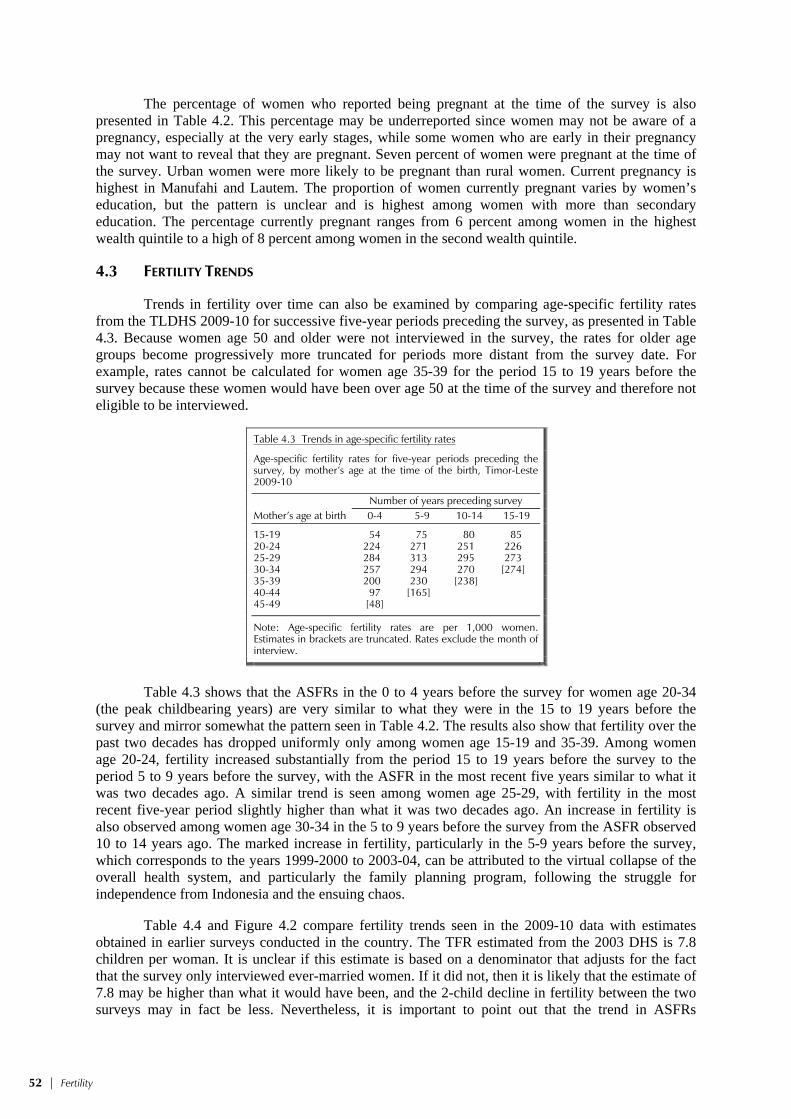
52 | Fertility
The percentage of women who reported being pregnant at the time of the survey is also presented in Table 4.2. This percentage may be underreported since women may not be aware of a pregnancy, especially at the very early stages, while some women who are early in their pregnancy may not want to reveal that they are pregnant. Seven percent of women were pregnant at the time of the survey. Urban women were more likely to be pregnant than rural women. Current pregnancy is highest in Manufahi and Lautem. The proportion of women currently pregnant varies by women’s education, but the pattern is unclear and is highest among women with more than secondary education. The percentage currently pregnant ranges from 6 percent among women in the highest wealth quintile to a high of 8 percent among women in the second wealth quintile.
4.3 FERTILITY TRENDS
Trends in fertility over time can also be examined by comparing age-specific fertility rates from the TLDHS 2009-10 for successive five-year periods preceding the survey, as presented in Table 4.3. Because women age 50 and older were not interviewed in the survey, the rates for older age groups become progressively more truncated for periods more distant from the survey date. For example, rates cannot be calculated for women age 35-39 for the period 15 to 19 years before the survey because these women would have been over age 50 at the time of the survey and therefore not eligible to be interviewed.
Table 4.3 Trends in age-specific fertility rates
Age-specific fertility rates for five-year periods preceding the survey, by mother’s age at the time of the birth, Timor-Leste 2009-10
Mother’s age at birth
Number of years preceding survey 0-4 5-9 10-14 15-19
15-19 54 75 80 85 20-24 224 271 251 226 25-29 284 313 295 273 30-34 257 294 270 [274] 35-39 200 230 [238] 40-44 97 [165] 45-49 [48]
Note: Age-specific fertility rates are per 1,000 women. Estimates in brackets are truncated. Rates exclude the month of interview.
Table 4.3 shows that the ASFRs in the 0 to 4 years before the survey for women age 20-34
(the peak childbearing years) are very similar to what they were in the 15 to 19 years before the survey and mirror somewhat the pattern seen in Table 4.2. The results also show that fertility over the past two decades has dropped uniformly only among women age 15-19 and 35-39. Among women age 20-24, fertility increased substantially from the period 15 to 19 years before the survey to the period 5 to 9 years before the survey, with the ASFR in the most recent five years similar to what it was two decades ago. A similar trend is seen among women age 25-29, with fertility in the most recent five-year period slightly higher than what it was two decades ago. An increase in fertility is also observed among women age 30-34 in the 5 to 9 years before the survey from the ASFR observed 10 to 14 years ago. The marked increase in fertility, particularly in the 5-9 years before the survey, which corresponds to the years 1999-2000 to 2003-04, can be attributed to the virtual collapse of the overall health system, and particularly the family planning program, following the struggle for independence from Indonesia and the ensuing chaos.
Table 4.4 and Figure 4.2 compare fertility trends seen in the 2009-10 data with estimates obtained in earlier surveys conducted in the country. The TFR estimated from the 2003 DHS is 7.8 children per woman. It is unclear if this estimate is based on a denominator that adjusts for the fact that the survey only interviewed ever-married women. If it did not, then it is likely that the estimate of 7.8 may be higher than what it would have been, and the 2-child decline in fertility between the two surveys may in fact be less. Nevertheless, it is important to point out that the trend in ASFRs

Fertility | 53
calculated in the 2003 DHS follows closely the trend in the ASFRs found in the TLDHS and corroborates the findings of the spike in TFR in the period immediately following the withdrawal of Indonesia. The 2002 MICS survey provides an indirect measure of TFR at 7.4 children per woman in the 12 months preceding the survey. This is high compared with the 1997 IDHS, in which the TFR was estimated at 4.4 children per woman among all women.
Table 4.4 Trends in fertility
Age-specific fertility rates (per 1,000 women) and total fertility rates (TFR), Timor-Leste 2009-10
Age group
2009-10 TLDHS
(2007-2009) 2003 DHSa (2001-2003)
2002 MICSb
(2001-2002) 1997 IDHSc
(1995-1997)
15-19 51 78 80 u 20-24 221 322 319 u 25-29 276 362 355 u 30-34 254 329 290 u 35-39 197 260 245 u 40.44 89 138 118 u 45-49 47 66 68 u
TFR 5.7 7.8 7.4 4.4
u = unavailable a MOH et al., 2004 p. 70 b UNICEF, 2003 p. 72. Based on indirect estimates for the 12 months preceding the survey. c CBS, NFPCB, MOH, and Macro International, 1998 p. 39. ASFRs for Timor-Leste are not published in this report.
Figure 4.2 Trends in Total Fertility Rates 1995-2010
4.4
7.47.8
5.7
1995-1997(1997 IDHS)
2001-2002(2002 MICS)
2001-2003(2003 DHS)
2007-2009(2009-10 TLDHS)
Survey
0
2
4
6
8
10Children per woman
Timor-Leste 2009-10
Many factors may have contributed to the decline in fertility in the most recent five-year period. The relative political stability following the 1999 and 2006 crises and the return of people from remote rural areas to semi-urban or urban areas may have exposed them to social and economic influences encouraging smaller families. Furthermore, exposure to family planning messages through the mass media, and wider and easier access to modern family planning methods not previously available in Timor-Leste may also have had an impact.
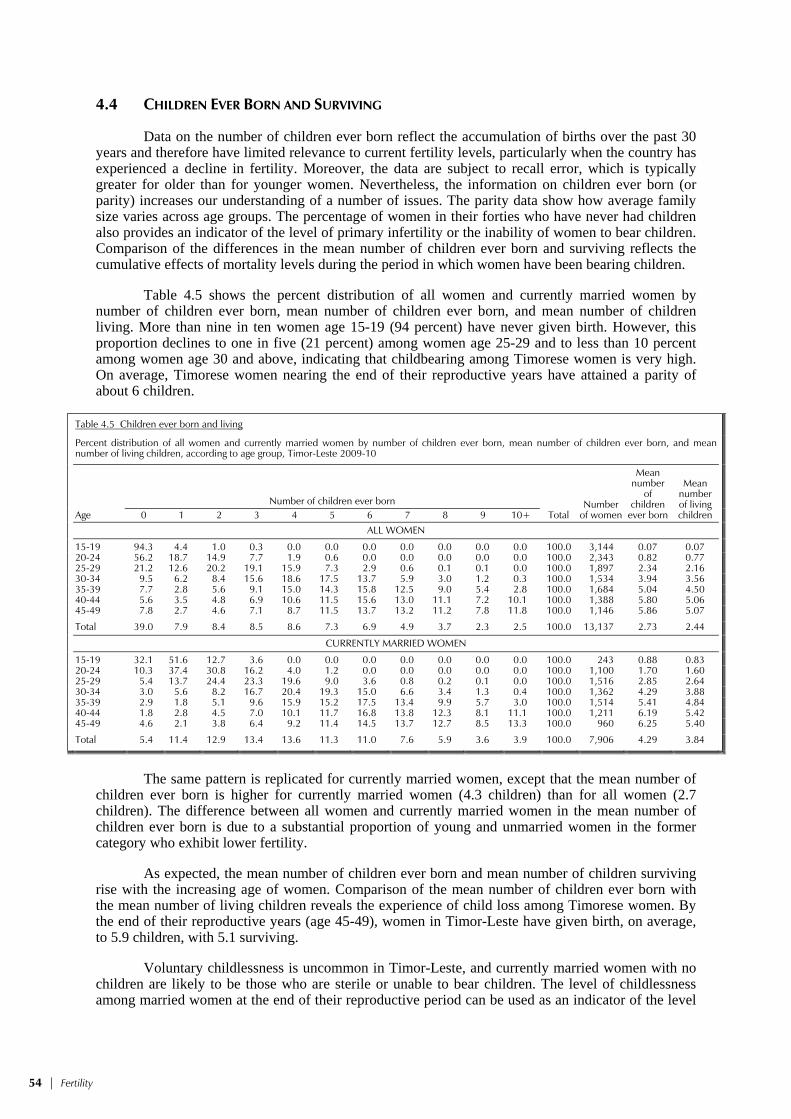
54 | Fertility
4.4 CHILDREN EVER BORN AND SURVIVING
Data on the number of children ever born reflect the accumulation of births over the past 30 years and therefore have limited relevance to current fertility levels, particularly when the country has experienced a decline in fertility. Moreover, the data are subject to recall error, which is typically greater for older than for younger women. Nevertheless, the information on children ever born (or parity) increases our understanding of a number of issues. The parity data show how average family size varies across age groups. The percentage of women in their forties who have never had children also provides an indicator of the level of primary infertility or the inability of women to bear children. Comparison of the differences in the mean number of children ever born and surviving reflects the cumulative effects of mortality levels during the period in which women have been bearing children.
Table 4.5 shows the percent distribution of all women and currently married women by number of children ever born, mean number of children ever born, and mean number of children living. More than nine in ten women age 15-19 (94 percent) have never given birth. However, this proportion declines to one in five (21 percent) among women age 25-29 and to less than 10 percent among women age 30 and above, indicating that childbearing among Timorese women is very high. On average, Timorese women nearing the end of their reproductive years have attained a parity of about 6 children.
Table 4.5 Children ever born and living
Percent distribution of all women and currently married women by number of children ever born, mean number of children ever born, and mean number of living children, according to age group, Timor-Leste 2009-10
Age
Number of children ever born Total
Number of women
Mean number
of children
ever born
Mean number of living children 0 1 2 3 4 5 6 7 8 9 10+
ALL WOMEN
15-19 94.3 4.4 1.0 0.3 0.0 0.0 0.0 0.0 0.0 0.0 0.0 100.0 3,144 0.07 0.07 20-24 56.2 18.7 14.9 7.7 1.9 0.6 0.0 0.0 0.0 0.0 0.0 100.0 2,343 0.82 0.77 25-29 21.2 12.6 20.2 19.1 15.9 7.3 2.9 0.6 0.1 0.1 0.0 100.0 1,897 2.34 2.16 30-34 9.5 6.2 8.4 15.6 18.6 17.5 13.7 5.9 3.0 1.2 0.3 100.0 1,534 3.94 3.56 35-39 7.7 2.8 5.6 9.1 15.0 14.3 15.8 12.5 9.0 5.4 2.8 100.0 1,684 5.04 4.50 40-44 5.6 3.5 4.8 6.9 10.6 11.5 15.6 13.0 11.1 7.2 10.1 100.0 1,388 5.80 5.06 45-49 7.8 2.7 4.6 7.1 8.7 11.5 13.7 13.2 11.2 7.8 11.8 100.0 1,146 5.86 5.07
Total 39.0 7.9 8.4 8.5 8.6 7.3 6.9 4.9 3.7 2.3 2.5 100.0 13,137 2.73 2.44
CURRENTLY MARRIED WOMEN
15-19 32.1 51.6 12.7 3.6 0.0 0.0 0.0 0.0 0.0 0.0 0.0 100.0 243 0.88 0.83 20-24 10.3 37.4 30.8 16.2 4.0 1.2 0.0 0.0 0.0 0.0 0.0 100.0 1,100 1.70 1.60 25-29 5.4 13.7 24.4 23.3 19.6 9.0 3.6 0.8 0.2 0.1 0.0 100.0 1,516 2.85 2.64 30-34 3.0 5.6 8.2 16.7 20.4 19.3 15.0 6.6 3.4 1.3 0.4 100.0 1,362 4.29 3.88 35-39 2.9 1.8 5.1 9.6 15.9 15.2 17.5 13.4 9.9 5.7 3.0 100.0 1,514 5.41 4.84 40-44 1.8 2.8 4.5 7.0 10.1 11.7 16.8 13.8 12.3 8.1 11.1 100.0 1,211 6.19 5.42 45-49 4.6 2.1 3.8 6.4 9.2 11.4 14.5 13.7 12.7 8.5 13.3 100.0 960 6.25 5.40
Total 5.4 11.4 12.9 13.4 13.6 11.3 11.0 7.6 5.9 3.6 3.9 100.0 7,906 4.29 3.84
The same pattern is replicated for currently married women, except that the mean number of
children ever born is higher for currently married women (4.3 children) than for all women (2.7 children). The difference between all women and currently married women in the mean number of children ever born is due to a substantial proportion of young and unmarried women in the former category who exhibit lower fertility.
As expected, the mean number of children ever born and mean number of children surviving rise with the increasing age of women. Comparison of the mean number of children ever born with the mean number of living children reveals the experience of child loss among Timorese women. By the end of their reproductive years (age 45-49), women in Timor-Leste have given birth, on average, to 5.9 children, with 5.1 surviving.
Voluntary childlessness is uncommon in Timor-Leste, and currently married women with no children are likely to be those who are sterile or unable to bear children. The level of childlessness among married women at the end of their reproductive period can be used as an indicator of the level

Fertility | 55
of primary sterility. In Timor-Leste, primary sterility among older currently married women (45-49) is around 5 percent.
4.5 BIRTH INTERVALS
A birth interval is the length of time between two successive live births. Information on birth intervals provides insight into birth spacing patterns, which affect fertility as well as maternal, infant, and childhood mortality. Studies have shown that short birth intervals are associated with an increased risk of death for the mother and baby, particularly when the birth interval is less than 24 months.
Table 4.6 shows the percent distribution of non-first births in the five years preceding the survey by number of months since the preceding birth, according to background characteristics. The median birth interval in Timor-Leste is 29 months. The median number of months since a preceding birth increases markedly with age, from a low of 25.5 months among mothers age 15-19 to a high of 33.9 months among mothers age 40-49. There is no notable difference in the length of the median birth interval by birth order or sex of the preceding birth.
Table 4.6 Birth intervals
Percent distribution of non-first births in the five years preceding the survey by number of months since preceding birth, and median number of months since preceding birth, according to background characteristics, Timor-Leste 2009-10
Background characteristic
Months since preceding birth Total
Number of non-first
births
Median number of
months since
preceding birth 7-17 18-23 24-35 36-47 48-59 60+
Age 15-19 (17.0) (26.8) (46.0) (7.2) (1.1) (1.9) 100.0 48 25.5 20-29 12.1 25.5 42.6 13.1 4.5 2.3 100.0 2,829 26.3 30-39 7.7 17.9 38.6 18.3 8.3 9.2 100.0 3,847 30.4 40-49 5.7 16.4 33.0 20.6 9.6 14.7 100.0 1,414 33.9
Birth order 2-3 9.7 23.6 39.5 14.5 5.6 7.1 100.0 2,954 27.8 4-6 8.7 18.2 37.6 18.0 8.2 9.3 100.0 3,389 30.1 7+ 8.0 19.0 41.0 18.4 7.8 5.8 100.0 1,796 29.3
Sex of preceding birth Male 8.9 19.4 39.4 16.9 7.0 8.4 100.0 4,134 29.3 Female 9.0 21.4 38.6 16.7 7.4 7.0 100.0 4,005 28.6
Survival of preceding birth Living 7.9 20.1 39.6 17.3 7.4 7.7 100.0 7,529 29.3 Dead 21.5 23.3 32.4 11.0 4.4 7.5 100.0 609 25.1
Residence Urban 11.4 20.6 32.8 17.8 7.4 10.0 100.0 1,912 29.2 Rural 8.2 20.3 40.9 16.5 7.1 7.0 100.0 6,226 28.9
District Aileu 7.0 22.9 40.3 17.4 6.9 5.6 100.0 296 28.9 Ainaro 10.4 25.2 41.7 13.2 4.6 5.0 100.0 495 27.2 Baucau 6.4 22.3 39.5 16.7 7.2 7.8 100.0 810 28.7 Bobonaro 9.1 20.4 39.0 14.2 8.6 8.8 100.0 755 29.4 Covalima 6.4 14.1 34.1 22.8 10.7 12.0 100.0 361 34.2 Dili 12.9 21.3 29.9 17.9 7.6 10.4 100.0 1,334 28.8 Ermera 10.3 19.8 42.2 15.0 6.3 6.3 100.0 1,060 27.8 Lautem 5.8 18.1 49.8 15.6 5.8 4.8 100.0 644 28.8 Liquiçá 10.3 18.8 41.6 16.3 6.8 6.2 100.0 472 29.4 Manatuto 8.6 21.0 44.3 13.3 6.0 6.8 100.0 351 28.3 Manufahi 9.2 20.7 44.2 15.4 5.3 5.1 100.0 310 27.6 Oecussi 5.4 16.5 36.1 21.4 9.7 11.0 100.0 679 32.5 Viqueque 8.2 22.2 37.1 19.9 6.9 5.7 100.0 572 28.7
Education No education 7.6 20.0 39.5 17.0 7.3 8.6 100.0 2,938 29.5 Primary 8.9 19.2 41.2 17.0 6.6 7.2 100.0 2,368 28.8 Secondary 10.5 21.8 36.8 16.4 7.5 6.9 100.0 2,687 28.4 More than secondary 5.8 18.6 35.6 19.1 6.8 14.2 100.0 145 31.9
Wealth quintile Lowest 7.6 20.3 39.5 18.8 6.7 7.1 100.0 1,812 29.6 Second 7.7 21.8 41.3 16.1 6.5 6.6 100.0 1,634 28.6 Middle 9.2 19.1 42.1 15.6 6.7 7.3 100.0 1,613 28.6 Fourth 10.0 20.5 40.5 14.3 7.4 7.4 100.0 1,538 28.1 Highest 10.5 20.0 31.3 19.0 8.7 10.4 100.0 1,542 30.7
Total 8.9 20.3 39.0 16.8 7.2 7.7 100.0 8,139 29.0
Note: First-order births are excluded. The interval for multiple births is the number of months since the preceding pregnancy that ended in a live birth. Figures in parentheses are based on 25-49 unweighted cases.

56 | Fertility
Studies have shown that the death of a preceding child leads to a shorter birth interval than when the preceding child survived. The median birth interval is four months shorter among births for which the previous sibling is dead than among births in which the previous sibling is alive (25.1 months and 29.3 months, respectively). This difference in the birth intervals may be due to the desire of parents to replace a dead child as well as the loss of the fertility-delaying effects of breastfeeding.
There are no marked differences in the median birth intervals by urban-rural residence, education of mother or wealth status of households. However, the median birth interval is noticeably higher in Covalima and Oecussi than in the other districts.
4.6 AGE AT FIRST BIRTH
The onset of childbearing at an early age has a major effect on the health of both mother and child. It also lengthens the reproductive period, thereby increasing the level of fertility. Table 4.7 shows the median age at first birth and the percentage of women who gave birth by exact ages, by five-year age cohorts.
Table 4.7 Age at first birth
Percentage of women age 15-49 who gave birth by exact ages, percentage who have never given birth, and median age at first birth, according to current age, Timor-Leste 2009-10
Current age
Percentage who gave birth by exact age
Percentage who have
never given birth
Number of women
Median age at first birth
15 18 20 22 25
15-19 0.4 na na na na 94.3 3,144 a 20-24 0.7 8.8 24.4 na na 56.2 2,343 a 25-29 1.5 12.9 30.2 49.4 69.5 21.2 1,897 22.1 30-34 2.4 14.6 31.1 51.0 74.8 9.5 1,534 21.9 35-39 2.4 13.3 28.6 47.0 69.1 7.7 1,684 22.4 40-44 2.5 16.0 30.6 46.1 67.6 5.6 1,388 22.5 45-49 2.0 10.9 23.3 38.2 58.5 7.8 1,146 23.6
25-49 2.1 13.6 29.1 46.9 68.5 11.0 7,650 22.4
na = Not applicablea = Omitted because less than 50 percent of women had a birth before reaching the beginning of the age group
Childbearing begins early in Timor-Leste. The median age at first birth is 22.1 years for the
youngest cohort (age 25-29) of women for whom a median age can be computed, and the median age varies between 21.9 among women age 30-34 and 23.6 years among women 45-49. Fourteen percent of Timorese women have given birth before reaching age 18, while nearly half have had a birth by age 22. More than two-thirds of Timorese women have become mothers by age 25.
Table 4.8 shows the median age at first birth by background characteristics. The median age at first birth is slightly higher in urban areas than in rural areas. The urban-rural difference is widest among women age 45-49. The median age at first birth is lowest among women in Covalima (21.3 years) and highest among women in Baucau (24.0 years). It is higher among women with secondary education than among women with no education.

Fertility | 57
Table 4.8 Median age at first birth
Median age at first birth among women age 25-49 years, according to background characteristics, Timor-Leste 2009-10
Background characteristic
Current age Women
age 25-49
25-29 30-34 35-39 40-44 45-49
Residence Urban 22.4 22.8 23.5 22.3 22.7 22.7 Rural 22.0 21.5 22.1 22.6 24.0 22.3
District Aileu 21.8 20.9 21.8 23.0 22.7 22.0 Ainaro 21.7 21.0 23.2 22.7 24.7 22.4 Baucau 23.4 21.8 23.7 24.5 27.6 24.0 Bobonaro 22.9 21.1 22.2 22.2 23.6 22.4 Covalima 20.5 20.5 21.3 21.9 23.5 21.3 Dili 22.6 23.1 24.1 22.4 22.7 23.0 Ermera 22.5 21.7 21.4 21.6 23.5 21.9 Lautem 21.7 21.9 21.7 21.7 22.9 21.9 Liquiçá 23.2 20.9 21.6 21.6 22.9 21.9 Manatuto 22.0 22.8 23.3 22.5 22.9 22.7 Manufahi 21.9 21.5 21.9 22.8 24.1 22.1 Oecussi 20.5 20.8 22.0 22.5 21.3 21.5 Viqueque 21.0 21.9 22.9 24.0 25.2 22.7
Education No education 21.7 21.1 21.9 22.3 23.5 22.2 Primary 20.7 20.9 21.5 21.5 22.9 21.3 Secondary 22.6 22.5 23.5 23.8 26.4 23.0 More than secondary a 26.2 27.4 29.9 23.2 a
Wealth quintile Lowest 21.1 21.1 22.4 23.5 26.1 22.5 Second 22.2 21.3 22.1 22.5 24.1 22.2 Middle 22.5 21.6 21.8 22.2 23.2 22.2 Fourth 22.2 22.1 21.7 21.9 22.5 22.1 Highest 22.4 22.8 23.8 22.4 23.0 22.9
Total 22.1 21.9 22.4 22.5 23.6 22.4
a = Omitted because less than 50 percent of the women had a birth before reaching the beginning of the age group
4.7 ADOLESCENT PREGNANCY AND MOTHERHOOD
Early teenage pregnancy can cause severe health problems for both the mother and child. Moreover, an early start to childbearing greatly reduces the educational and employment opportunities of women and is associated with higher levels of fertility. Table 4.9 shows the percentage of women age 15-19 who have had a live birth, the percentage who are pregnant with their first child and the combined percentage of those who have begun childbearing, by background characteristics.
Seven percent of women age 15-19 have already had a birth or are pregnant with their first child. The percentage of women who have begun childbearing increases rapidly with age, from 1 percent among women age 15 to 20 percent among women age 19. Rural women are more than twice as likely as urban women to have begun childbearing early. Adolescent childbearing is lowest in Dili (2 percent) and highest in Oecussi (16 percent). Teenage pregnancy is also markedly higher among women with little or no education (13 to 16 percent) than among mothers with secondary or higher levels of education. The percentage of teenagers who have begun childbearing is also relatively higher among those in the lowest three wealth quintiles compared with those in the highest two wealth quintiles.

58 | Fertility
Table 4.9 Teenage pregnancy and motherhood
Percentage of women age 15-19 who have had a live birth or who are pregnant with their first child and percentage who have begun childbearing, by background characteristics, Timor-Leste 2009-10
Background characteristic
Percentage who: Percentage who have
begun childbearing
Number of women
Have had a
live birth
Are pregnant with first
child
Age 15 0.2 0.8 1.0 718 16 1.4 0.8 2.3 636 17 2.3 1.4 3.7 626 18 8.6 2.9 11.5 607 19 18.0 2.3 20.3 557
Residence Urban 2.9 0.8 3.7 771 Rural 6.6 1.8 8.4 2,373
District Aileu 3.9 0.7 4.6 161 Ainaro 5.3 2.8 8.1 154 Baucau 4.5 1.9 6.4 341 Bobonaro 9.9 1.0 10.9 329 Covalima 8.3 1.2 9.5 222 Dili 1.6 0.4 2.0 506 Ermera 4.6 0.8 5.3 398 Lautem 5.4 2.0 7.4 211 Liquiçá 4.4 1.6 6.0 190 Manatuto 7.5 1.7 9.2 161 Manufahi 6.1 2.4 8.4 96 Oecussi 13.3 2.5 15.8 179 Viqueque 4.8 5.2 10.0 197
Education No education 11.1 2.1 13.2 370 Primary 12.4 3.1 15.5 626 Secondary 2.8 1.1 3.8 2,138 More than secondary * * * 11
Wealth quintile Lowest 7.1 2.0 9.1 551 Second 7.3 2.0 9.3 589 Middle 7.3 1.8 9.1 645 Fourth 4.8 1.7 6.5 664 Highest 2.5 0.5 3.0 695
Total 5.7 1.6 7.2 3,144
Note: An asterisk indicates that a figure is based on fewer than 25 unweighted cases and has been suppressed.

Family Planning | 59
FAMILY PLANNING 5
In 2002, the Council of Ministers for Timor-Leste developed and approved the first family planning policy for the country (MOH, 2004a). Despite the presence of this policy, reproductive choice remains a relatively new concept for families in Timor-Leste. Findings from the 2009-10 TLDHS suggest that the total fertility ratio (TFR) of 5.7 children per women in Timor-Leste is the highest in South East Asia and also in Asia, where the rank is shared with Afghanistan (PRB, 2010). This high total fertility rate has immediate and serious implications for childbearing women and the health care system. The ability to provide quality reproductive health services will be severely compromised because existing resources are scarce, and high fertility will only increase these demands on the system.
According to the International Conference on Population and Development (ICPD) Program of Action, family planning programs must enable couples and individuals to decide freely and responsibly the number and spacing of their children; to provide individuals and couples with the information and means to make these decisions; to ensure informed choices; and to make available a full range of safe and effective family planning methods (MOH, 2004a).
Family planning continues to be a priority of the National Reproductive Health Strategy 2004–2015. The objectives of the National Family Planning Program are (1) to reduce the population growth rate gradually by promoting the concept of a small family norm to the population in general and to the rural population in particular; (2) to increase the availability of and the demand for family planning services; (3) to provide quality services; and (4) to reduce unmet need for services (MOH, 2004b).
The National Family Planning Program also aims to expand and sustain adequate family planning services at the community level utilizing all health facilities. To achieve this, family planning services are being offered at integrated community health service (SISCa) posts. These are mobile outreach services that provide integrated care, including health promotion, on a monthly basis, in almost every suco in the country. Health facilities have been encouraged to play a more effective role in the national family planning program. The Ministry of Health (MOH) plans to train health care providers in not only the technical and managerial aspects of contraception but also in appropriate interpersonal communication and counseling skills. Contraceptive services will be provided as part of primary health care. Advice on natural methods (standard days method and lactational amenorrhea method) as well as the provision of condoms, pills, and injectables will be provided at the health post level; implants and IUDs will be available at level two community health centers with beds (CHC-2); and sterilization will be available at referral hospitals and higher level health centers that have appropriate equipment and trained staff. Specific strategies will be developed to cover areas of unmet demand for family planning, particularly for older mothers still of childbearing age.
This chapter evaluates the level of knowledge of various contraceptive methods and discusses past and current prevalence of use. For users of periodic abstinence (rhythm method), knowledge of the ovulatory cycle is examined, and for those relying on sterilization, the timing of the method of adoption is reviewed. Special attention is focused on the source of contraception, informed choice, non-use, and intention to use contraceptive methods in the future. The chapter also contains information on exposure to family planning messages through the media, contact with family planning providers, and a husband’s knowledge of his wife’s use of contraception. These topics are of practical use to policy and program administrators to formulate effective family planning strategies. Although the chapter focus is on women, results from the survey of men are also presented because men play an important role in the realization of reproductive goals. Wherever possible, comparisons are made with findings from previous surveys in order to evaluate progress in family planning in Timor-Leste over time.

60 | Family Planning
5.1 KNOWLEDGE OF CONTRACEPTIVE METHODS
Knowledge of contraceptive methods is an important precursor to use. The ability to spontaneously name or recognize a family planning method when described is a simple test of a respondent’s familiarity with a method but is not necessarily an indication of the comprehensiveness of their knowledge. Information on knowledge of contraception was collected by first asking a respondent to name ways or methods by which a couple could delay or avoid pregnancy. If the respondent failed to mention a particular method spontaneously, the interviewer described the method and asked whether the respondent recognized it. The survey collected information on eleven modern family planning methods—female and male sterilization, the pill, the IUD, injectables, implants, female and male condoms, lactational amenorrhea method (LAM), emergency contraception, the standard days method, and two traditional methods—rhythm method and withdrawal. Folk methods, such as use of plants and herbs, could be mentioned spontaneously by respondents.
In Table 5.1, information about knowledge of specific contraceptive methods is presented for all women and men as well as for currently married women and men and for sexually active unmarried men. Findings from the 2009-10 TLDHS show that 78 percent of currently married women and 66 percent of currently married men in Timor-Leste know of at least one modern method of family planning. The most widely known modern contraceptive methods among currently married women are injectables (70 percent) and the pill (58 percent). Currently married men are most likely to know of the male condom (54 percent) and injectables (46 percent). Twenty-seven percent of currently married men mentioned knowledge of a traditional method compared with 22 percent of currently married women. Sexually active unmarried men are most knowledgeable about the male condom (90 percent) followed by injectables (55 percent). The pattern of knowledge for all women and men is similar to that described for currently married women and men. The mean number of methods known is slightly higher among married women (3.3) than among married men (3.0).
Table 5.1 Knowledge of contraceptive methods
Percentage of all respondents, currently married respondents, and sexually active unmarried respondents age 15-49 who know any contraceptive method, by specific method, Timor-Leste 2009-10
Method
Women Men
All women Currently
married women All men Currently
married men
Sexually active unmarried
men1
Any method 71.4 78.1 66.4 66.6 92.8
Any modern method 71.1 77.7 66.1 66.4 92.1
Female sterilization 20.0 23.9 21.2 26.8 31.7 Male sterilization 4.0 4.8 8.7 11.3 13.6 Pill 50.1 57.6 33.1 40.3 47.7 IUD 28.1 35.9 15.7 20.6 21.3 Injectables 61.2 70.3 36.0 45.5 55.3 Implants 31.5 40.0 19.3 25.3 35.4 Male condom 27.7 26.2 58.0 53.7 90.4 Female condom 10.4 10.1 10.4 11.1 15.3 Lactational amenorrhea (LAM) 7.0 9.5 4.8 7.1 0.4 Emergency contraception 3.2 4.0 3.7 5.2 2.2 Standard days method 13.2 16.8 9.8 14.6 6.8
Any traditional method 16.9 21.7 23.1 27.4 54.9
Rhythm 13.2 17.0 8.3 12.5 6.1 Withdrawal 7.7 10.2 19.4 21.7 54.6 Folk method 2.7 3.8 3.3 5.1 0.0
Mean number of methods
known by respondents 15-49 2.8 3.3 2.5 3.0 3.8 Number of respondents 13,137 7,906 4,076 2,158 215
Note: There are too few sexually active unmarried women to analyze their knowledge separately. 1 Had last sexual intercourse within 30 days preceding the survey

Family Planning | 61
According to the 2003 DHS, knowledge of contraception for ever-married women and men was 38 percent and 30 percent, respectively. These percentages are not exactly comparable to the 2009-10 TLDHS; they also include knowledge among women and men who are widowed and divorced, and as such may be slightly inflated. Nevertheless, it is important to note that over the past seven years there has been a considerable increase in the overall knowledge of contraceptive methods in the country. This increase in knowledge may be attributed to the successful dissemination of family planning messages through the mass media and, to a lesser degree, through service providers in family planning and reproductive health.
5.2 KNOWLEDGE OF CONTRACEPTIVE METHODS BY BACKGROUND CHARACTERISTICS
The study of differentials in knowledge of contraceptive methods by background characteristics is important because it helps to identify subgroups of the population to target for family planning services. Table 5.2 presents, by background characteristics, the percentages of currently married women and men who have heard of any method and any modern method of family planning.
Table 5.2 Knowledge of contraceptive methods by background characteristics
Percentage of currently married women and currently married men age 15-49 who have heard of at least one contraceptive method and who have heard of at least one modern method by background characteristics, Timor-Leste 2009-10
Background characteristic
Women Men
Heard of any
method
Heard of any modern method1
Number of women
Heard of any method
Heard of any modern method1
Number of men
Age 15-19 70.4 70.4 243 * * 4 20-24 77.3 77.2 1,100 66.4 66.4 125 25-29 82.3 82.1 1,516 69.0 69.0 359 30-34 83.3 82.8 1,362 73.8 73.0 368 35-39 78.3 78.2 1,514 70.1 70.1 492 40-44 77.1 76.5 1,211 61.2 61.1 433 45-49 68.2 67.2 960 58.9 58.7 378
Residence Urban 88.7 88.3 2,025 84.0 83.6 567 Rural 74.5 74.1 5,881 60.4 60.2 1,592
District Aileu 68.8 68.7 299 59.6 59.6 92 Ainaro 57.8 57.4 382 51.4 50.7 101 Baucau 56.2 55.8 852 31.2 31.0 237 Bobonaro 78.8 78.3 739 87.6 87.6 170 Covalima 95.5 95.5 458 92.8 92.8 123 Dili 92.9 92.6 1,459 87.5 87.0 416 Ermera 72.1 71.3 881 17.5 17.5 233 Lautem 88.0 87.6 541 87.1 87.1 163 Liquiçá 76.2 75.6 460 75.0 75.0 124 Manatuto 74.8 74.6 353 100.0 100.0 96 Manufahi 78.6 77.8 319 38.9 37.4 77 Oecussi 95.1 94.9 603 91.2 91.2 165 Viqueque 61.8 61.8 559 47.2 47.2 159
Education No education 66.0 65.5 2,909 40.5 40.3 523 Primary 80.3 79.8 2,027 62.4 62.4 650 Secondary 87.9 87.6 2,739 81.4 81.0 853 More than secondary 96.5 96.5 231 94.3 94.3 132
Wealth quintile Lowest 65.5 65.0 1,467 57.2 56.9 413 Second 67.9 67.1 1,487 48.5 48.5 408 Middle 76.7 76.6 1,559 62.3 62.3 411 Fourth 84.3 83.9 1,571 72.1 71.5 447 Highest 92.5 92.4 1,821 88.4 88.3 479
Total 15-49 78.1 77.7 7,906 66.6 66.4 2,158
Note: An asterisk indicates that a figure is based on fewer than 25 unweighted cases and has been suppressed. 1 Female sterilization, male sterilization, pill, IUD, injectables, implants, male condom, female condom, diaphragm, foam or jelly, lactational amenorrhea method (LAM), standard days method, and emergency contraception

62 | Family Planning
Knowledge of a modern method rises from 70 percent among currently married women age 15-19 to a peak at 83 percent among those age 30-34 and then declines to 67 percent among the oldest cohort of women. Currently married women in urban areas (88 percent) are more likely to have heard about a modern method of family planning than rural women (74 percent), perhaps reflecting the wider availability and easier access to methods in urban than in rural areas as well as better penetration of mass media and higher literacy in urban areas. Knowledge of a modern method varies widely by district and ranges from a low of 56 percent of currently married women in Baucau to a high of 96 percent in Covalima. Knowledge rises with level of education, from 66 percent among women with no education to 97 percent among women with more than secondary education. Similarly, there is a direct relationship between knowledge and wealth quintile, with knowledge rising from 65 percent of currently married women in the poorest households to 92 percent of women in the richest households. Currently married men exhibit a similar pattern in knowledge by background characteristics, with the exception of knowledge by district, where men in Ermera are least likely to know of a modern method (18 percent) in contrast with men in Manatuto who have universal knowledge of contraceptives.
5.3 EVER USE OF CONTRACEPTION
Data on ever use of contraception has special significance because it reveals the cumulative success of programs promoting the use of family planning among couples. Ever use refers to use of a method at any time, with no distinction between past and present use. In the 2009-10 TLDHS, respondents who had heard of a method of family planning were asked if they had ever used a method.
Table 5.3.1 shows the percentage of all women and currently married women who have ever used family planning by specific method and age. Thirty-two percent of currently married women have ever used a method of contraception, and 30 percent have ever used a modern method. Among currently married women, nearly one in four has ever used injectables, making it the most commonly used modern method. Four percent of currently married women have used the pill, and 2 percent each have used the IUD or implants. About 3 percent of currently married women report having used traditional methods.
Ever use of contraception varies with women’s age. The pattern of ever use is curvilinear, with use being lowest among women in the youngest age group (15-19), increasing with age, and reaching a plateau among women in their thirties before declining thereafter. The level of ever-use of any modern method among currently married women rises to a high of 35 percent among those age 30-39 and then declines to 24 percent among women age 45-49. Ever-use among all women follows a similar pattern.
The 2009-10 TLDHS collected information on ever use of contraception for men but with respect to five male methods only: male sterilization, condoms, standard days method, rhythm method, and withdrawal. As evident in Table 5.3.2, fewer than one in ten currently married men age 15-49 (9 percent) has ever used a method, with most having used a modern method (6 percent). Ever-use is highest among sexually active unmarried men, with nearly one in two men having ever used a method. Among currently married men, the condom is the most commonly used method (3 percent), and they are much more likely to report ever-use of condoms than women. Two percent of currently married men reported having used the standard days method. There is no clear pattern between ever-use and age among men. Ever-use of a modern method declines from 7 percent among currently married men age 20-24 to a plateau around 6 percent among those age 25-44, and then decreases to 3 percent among the oldest cohort. Five percent of currently married men report having used a traditional method, with withdrawal twice as likely to have been used as the rhythm method.

Fam
ily P
lann
ing
| 6
3
Tab
le 5
.3.1
Eve
r use
of c
ontra
cept
ion:
Wom
en
Per
cent
age
of a
ll w
omen
and
of c
urre
ntly
mar
ried
wom
en a
ge 1
5-49
who
hav
e ev
er u
sed
any
cont
race
ptiv
e m
etho
d by
met
hod,
acc
ordi
ng to
age
, Tim
or-L
este
200
9-10
Age
Any
met
hod
Any
mod
ern
met
hod
Mod
ern
met
hod
Any
tradi
-tio
nal
met
hod
Trad
ition
al m
etho
d
Num
ber
of
wom
en
Fem
ale
ster
ili-
zatio
n
Mal
e st
erili
-za
tion
Pill
IUD
In
ject
-ab
les
Impl
ants
Mal
e co
ndom
Fem
ale
cond
om
LAM
Emer
-ge
ncy
cont
ra-
cept
ion
Stan
dard
da
ys
met
hod
Rhyt
hm
With
-dr
awal
Fo
lk
met
hod
ALL
WO
MEN
15
-19
0.8
0.8
0.0
0.0
0.1
0.0
0.5
0.0
0.1
0.0
0.0
0.1
0.0
0.1
0.0
0.1
0.0
3,14
4
20-2
4 9.
89.
1 0.
0 0.
01.
30.
17.
50.
40.
00.
0 0.
20.
00.
20.
80.
40.
30.
12,
343
25
-29
26.7
25.9
0.
1 0.
03.
11.
022
.20.
90.
70.
0 0.
20.
00.
51.
40.
60.
50.
41,
897
30
-34
33.2
31.5
0.
8 0.
13.
92.
524
.81.
31.
20.
0 0.
50.
00.
62.
61.
31.
00.
41,
534
35
-39
33.8
32.4
1.
0 0.
04.
31.
926
.41.
50.
20.
0 0.
40.
00.
82.
31.
50.
50.
51,
684
40
-44
32.8
30.5
0.
8 0.
14.
82.
323
.02.
10.
40.
0 0.
50.
01.
13.
71.
91.
01.
31,
388
45
-49
23.3
22.0
2.
0 0.
02.
51.
016
.12.
10.
00.
0 0.
40.
00.
52.
00.
90.
50.
81,
146
To
tal
19.5
18.5
0.
5 0.
02.
41.
014
.80.
90.
30.
0 0.
20.
00.
41.
50.
80.
50.
413
,137
C
URR
ENTL
Y M
ARR
IED
WO
MEN
15
-19
8.9
7.9
0.0
0.0
1.4
0.0
6.3
0.0
0.2
0.0
0.0
0.0
0.0
1.0
0.0
1.0
0.0
243
20
-24
20.5
19.0
0.
0 0.
02.
90.
315
.70.
80.
10.
0 0.
30.
00.
41.
70.
80.
70.
21,
100
25
-29
32.8
31.8
0.
1 0.
03.
71.
227
.21.
10.
80.
0 0.
30.
00.
71.
80.
70.
60.
41,
516
30
-34
37.1
35.3
0.
9 0.
14.
42.
927
.71.
51.
30.
0 0.
50.
00.
73.
01.
51.
20.
51,
362
35
-39
36.9
35.4
1.
1 0.
04.
82.
028
.71.
60.
20.
0 0.
40.
00.
92.
61.
70.
60.
61,
514
40
-44
35.8
33.6
0.
9 0.
15.
32.
525
.12.
30.
50.
0 0.
60.
01.
33.
71.
81.
01.
51,
211
45
-49
25.6
24.3
2.
2 0.
02.
81.
217
.82.
30.
00.
0 0.
50.
00.
62.
20.
90.
61.
096
0
To
tal
31.5
29.9
0.
8 0.
04.
01.
723
.91.
50.
50.
0 0.
40.
00.
72.
51.
20.
80.
77,
906
LA
M =
Lac
tatio
nal a
men
orrh
ea m
etho
d
| 63Family Planning

64 | Family Planning
Table 5.3.2 Ever use of contraception: Men
Percentage of all men, currently married men, and sexually active unmarried men age 15-49 who have ever used any contraceptive method by method, according to age, Timor-Leste 2009-10
Age Any
method
Any modern method
Modern methodAny tradi-
tional method
Traditional method
Number of men
Male sterili-zation
Male condom
Standard days
method Rhythm With-drawal
ALL MEN
15-19 4.4 1.7 0.1 1.5 0.2 3.1 0.1 3.1 994 20-24 13.9 8.7 0.2 8.1 0.5 6.9 0.3 6.6 643 25-29 13.9 10.1 0.6 9.4 0.4 6.0 0.7 5.4 586 30-34 10.5 8.0 0.9 5.5 1.6 4.6 1.6 3.5 439 35-39 9.3 6.0 0.4 3.8 2.1 5.2 1.4 4.3 553 40-44 10.1 5.9 0.2 3.5 2.9 5.8 2.2 3.9 462 45-49 5.8 2.8 0.1 1.5 1.2 3.7 1.4 2.9 400
Total 15-49 9.4 5.8 0.3 4.6 1.1 4.9 0.9 4.3 4,076
CURRENTLY MARRIED MEN
15-19 * * * * * * * * 4 20-24 8.8 7.0 0.0 5.5 1.5 5.3 1.5 3.7 125 25-29 10.0 6.2 1.0 5.0 0.4 5.4 0.7 4.7 359 30-34 8.3 5.6 1.1 2.7 1.9 4.9 1.9 3.5 368 35-39 9.8 6.3 0.5 3.8 2.3 5.6 1.6 4.6 492 40-44 9.8 5.5 0.3 2.9 3.1 6.1 2.4 4.0 433 45-49 6.2 3.0 0.1 1.5 1.3 3.9 1.5 3.1 378
Total 15-49 8.9 5.5 0.5 3.3 1.9 5.2 1.6 4.0 2,158
SEXUALLY ACTIVE UNMARRIED MEN1
15-19 57.2 7.8 0.0 7.8 0.0 50.5 0.0 50.5 45 20-24 48.8 22.5 0.0 21.7 0.7 28.6 0.0 28.6 81 25-29 48.8 38.3 0.0 38.3 1.6 17.4 1.0 16.4 58 30-49 35.5 30.4 0.0 30.4 0.0 6.7 0.0 6.7 31
Total 15-49 48.6 24.8 0.0 24.5 0.7 27.0 0.3 26.8 215
Note: An asterisk indicates that a figure is based on fewer than 25 unweighted cases and has been suppressed. 1 Men who had sexual intercourse within 30 days preceding the survey
5.4 CURRENT USE OF CONTRACEPTION
Current use of contraception is defined as the proportion of women who reported the use of a family planning method at the time of the interview. The level of current use—usually calculated among currently married women—is the most widely used and valuable measure of the success of a family planning program. Table 5.4 shows the percent distribution by age of all women and currently married women who are using specific family planning methods. Similar information on current use was not collected for men.
Table 5.4 shows that more than one in five currently married women (22 percent) is using a method of family planning, with 21 percent using a modern contraceptive method. This indicates that modern contraceptive methods are highly favored over either natural family planning methods or other traditional methods.
Contraceptive use varies by age. Use is lower among younger women (because they are in the early stage of family building) and among older women (some of whom are no longer fecund) than among those at intermediate ages. For example, current use of a modern contraceptive method is 7 percent among currently married women age 15-19, rises to 26-27 percent among women age 30-39, and then drops sharply to 12 percent at age 45-49. The low use among older women may be due to a combination of decreased fertility and lower awareness of contraception in this age cohort.
Injectables are by far the most popular modern method, and they are used by 16 percent of currently married women. Two percent of women use the pill, and about 1 percent of women each use the IUD or implants, or they are sterilized. Most women who are sterilized are over age 30. Injectables are popular among women age 20-44.
One percent of women report currently using a traditional method. The rhythm method is slightly more popular than withdrawal.
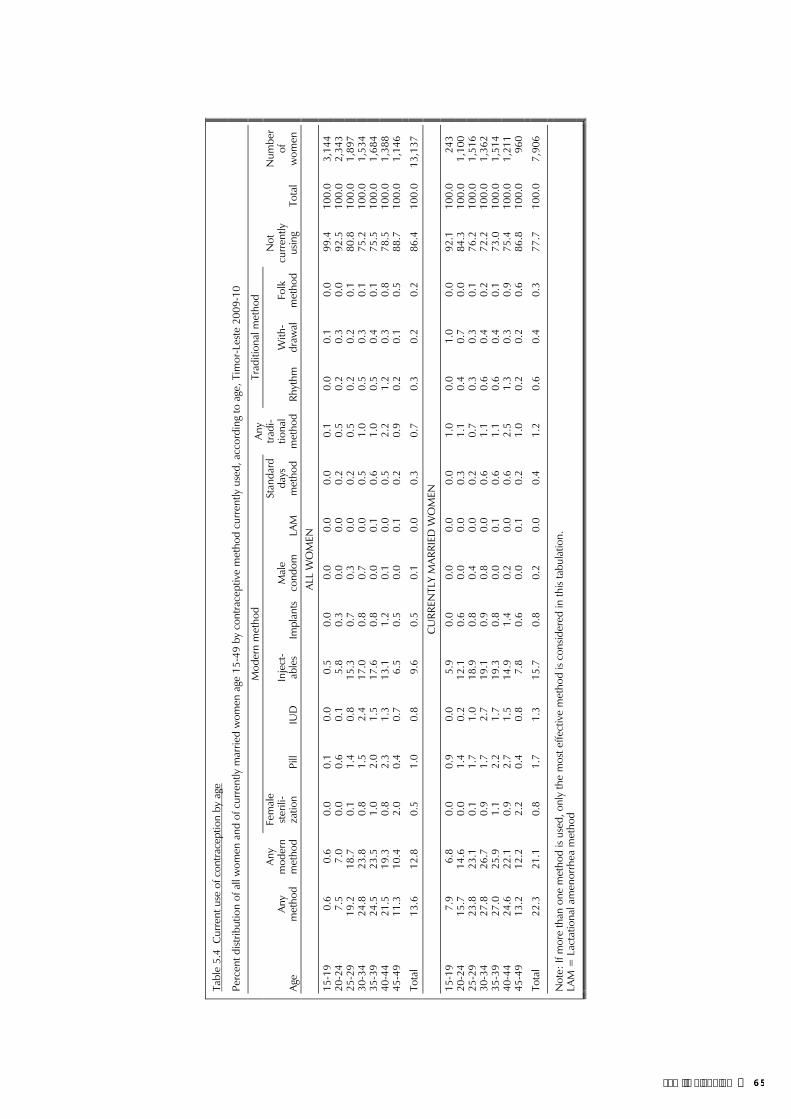
Fam
ily P
lann
ing
| 6
5
Tab
le 5
.4 C
urre
nt u
se o
f con
trace
ptio
n by
age
Per
cent
dist
ribut
ion
of a
ll w
omen
and
of c
urre
ntly
mar
ried
wom
en a
ge 1
5-49
by
cont
race
ptiv
e m
etho
d cu
rren
tly u
sed,
acc
ordi
ng to
age
, Tim
or-L
este
200
9-10
Age
Any
met
hod
Any
mod
ern
met
hod
Mod
ern
met
hod
Any
tradi
-tio
nal
met
hod
Trad
ition
al m
etho
d N
ot
curr
ently
us
ing
Tota
l
Num
ber
of
wom
en
Fem
ale
ster
ili-
zatio
n Pi
ll IU
D
Inje
ct-
able
s Im
plan
tsM
ale
cond
omLA
M
Stan
dard
da
ys
met
hod
Rhyt
hm
With
-dr
awal
Fo
lk
met
hod
ALL
WO
MEN
15-
19
0.6
0.6
0.0
0.1
0.0
0.5
0.0
0.0
0.0
0.0
0.1
0.0
0.1
0.0
99.4
100.
03,
144
20-
24
7.5
7.0
0.0
0.6
0.1
5.8
0.3
0.0
0.0
0.2
0.5
0.2
0.3
0.0
92.5
100.
02,
343
25-
29
19.2
18.7
0.
1 1.
40.
815
.30.
70.
30.
00.
2 0.
50.
20.
20.
180
.810
0.0
1,89
7 3
0-34
24
.823
.8
0.8
1.5
2.4
17.0
0.8
0.7
0.0
0.5
1.0
0.5
0.3
0.1
75.2
100.
01,
534
35-
39
24.5
23.5
1.
0 2.
01.
517
.60.
80.
00.
10.
6 1.
00.
50.
40.
175
.510
0.0
1,68
4 4
0-44
21
.519
.3
0.8
2.3
1.3
13.1
1.2
0.1
0.0
0.5
2.2
1.2
0.3
0.8
78.5
100.
01,
388
45-
49
11.3
10.4
2.
0 0.
40.
76.
50.
50.
00.
10.
2 0.
90.
20.
10.
588
.710
0.0
1,14
6
Tot
al
13.6
12.8
0.
5 1.
00.
89.
60.
50.
10.
00.
3 0.
70.
30.
20.
286
.410
0.0
13,1
37
C
URR
ENTL
Y M
ARR
IED
WO
MEN
15-
19
7.9
6.8
0.0
0.9
0.0
5.9
0.0
0.0
0.0
0.0
1.0
0.0
1.0
0.0
92.1
100.
024
3 2
0-24
15
.714
.6
0.0
1.4
0.2
12.1
0.6
0.0
0.0
0.3
1.1
0.4
0.7
0.0
84.3
100.
01,
100
25-
29
23.8
23.1
0.
1 1.
71.
018
.90.
80.
40.
00.
2 0.
70.
30.
30.
176
.210
0.0
1,51
6 3
0-34
27
.826
.7
0.9
1.7
2.7
19.1
0.9
0.8
0.0
0.6
1.1
0.6
0.4
0.2
72.2
100.
01,
362
35-
39
27.0
25.9
1.
1 2.
21.
719
.30.
80.
00.
10.
6 1.
10.
60.
40.
173
.010
0.0
1,51
4 4
0-44
24
.622
.1
0.9
2.7
1.5
14.9
1.4
0.2
0.0
0.6
2.5
1.3
0.3
0.9
75.4
100.
01,
211
45-
49
13.2
12.2
2.
2 0.
40.
87.
80.
60.
00.
10.
2 1.
00.
20.
20.
686
.810
0.0
960
Tot
al
22.3
21.1
0.
8 1.
71.
315
.70.
80.
20.
00.
4 1.
20.
60.
40.
377
.710
0.0
7,90
6
Not
e: If
mor
e th
an o
ne m
etho
d is
used
, onl
y th
e m
ost e
ffect
ive
met
hod
is co
nsid
ered
in th
is ta
bula
tion.
LAM
= L
acta
tiona
l am
enor
rhea
met
hod
| 65Family Planning

66 | Family Planning
5.5 TREND IN CURRENT USE OF CONTRACEPTION
There has been a marked increase in the use of contraception by currently married women since 2002. Use of modern methods doubled in the five years between 2002 and 2007 and rose by nearly 50 percent in the three years between the 2007 TLSLS and the 2009-10 TLDHS. The increase in use of modern methods contributed to a three-fold increase in overall contraceptive use, from 7 percent to 21 percent, in a matter of 7 to 8 years. It is interesting to note that use of a modern method was 25 percent in 1997 (CBS et al., 1998) but fell sharply to 7 percent following the struggle for national independence when there was a total disruption of services previously provided through the Indonesian National Family Planning Program (BKKBN), which had extensive service networks extending down to volunteers at the village level.
Figure 5.1 Trends in Use of Contraception amongCurrently Married Women, 1997-2010
25
7
7
14
21
27
7
10
20
22
1997 IDHS
2002 MICS
2003 DHS
2007 TLSLS
2009-10 TLDHS
0 5 10 15 20 25 30
Percent
Modern method
Any method
Timor-Leste 2009-10Note: Lactational amenorrhea method (LAM) is included as a traditional method in the 2002 MICS and the 2003 DHS, but as a modern method in the 2009-10 TLDHS.
5.6 CURRENT USE OF CONTRACEPTION BY BACKGROUND CHARACTERISTICS
The study of differentials in current use of contraception is important because it helps to identify subgroups of the population to target for family planning services. Table 5.5 presents the percent distribution of currently married women by their current use of family planning methods, according to background characteristics. This table allows comparison of levels of current contraceptive use among major population groups. It also permits an examination of differences in the method mix among current users within the various subgroups.
Substantial differences in the use of contraceptive methods among subgroups of currently married women can be seen in Table 5.5. Women in urban areas are more likely to use a family planning method than rural women, reflecting wider availability and easier access to methods in urban than in rural areas. The contraceptive prevalence rate for modern methods is 28 percent in urban areas, compared with 19 percent in rural areas.
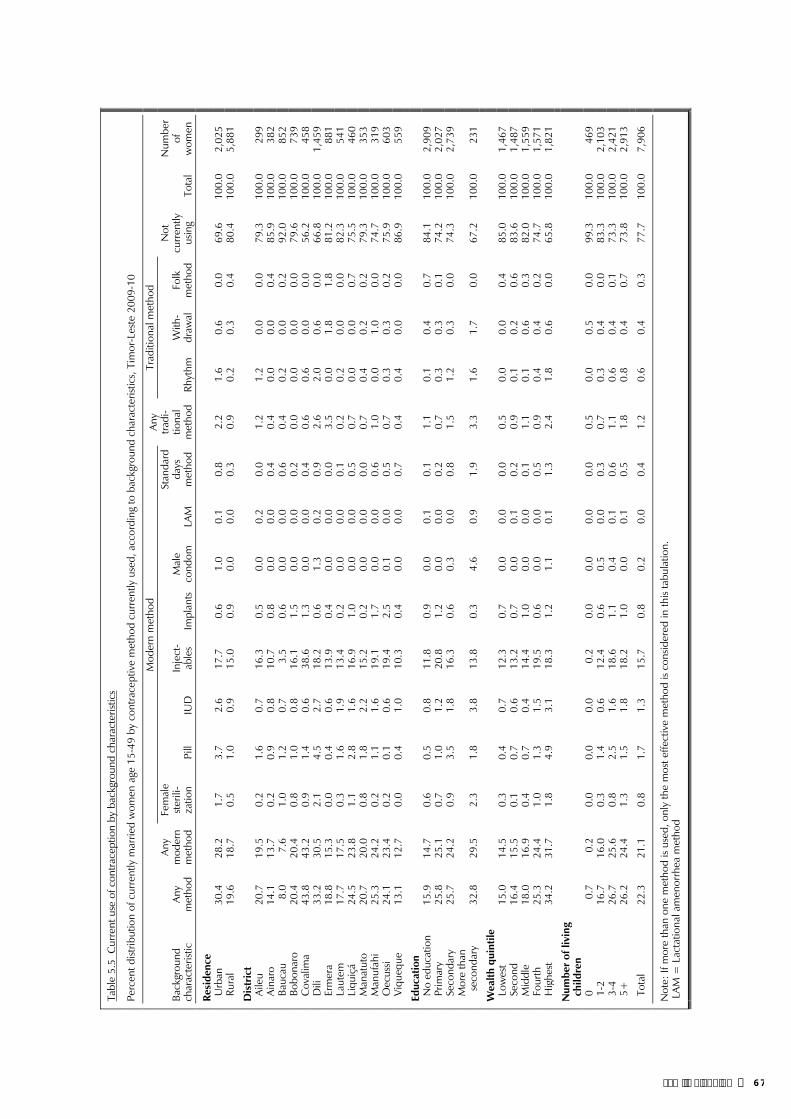
Fam
ily P
lann
ing
| 6
7
Tab
le 5
.5 C
urre
nt u
se o
f con
trace
ptio
n by
bac
kgro
und
char
acte
ristic
s
Per
cent
dist
ribut
ion
of c
urre
ntly
mar
ried
wom
en a
ge 1
5-49
by
cont
race
ptiv
e m
etho
d cu
rren
tly u
sed,
acc
ordi
ng to
bac
kgro
und
char
acte
ristic
s, T
imor
-Les
te 2
009-
10
Back
grou
nd
char
acte
ristic
An
y m
etho
d
Any
mod
ern
met
hod
Mod
ern
met
hod
Any
tradi
-tio
nal
met
hod
Trad
ition
al m
etho
d N
ot
curr
ently
us
ing
Tota
l
Num
ber
of
wom
en
Fem
ale
ster
ili-
zatio
n Pi
ll IU
D
Inje
ct-
able
s Im
plan
tsM
ale
cond
omLA
M
Stan
dard
da
ys
met
hod
Rhyt
hm
With
-dr
awal
Fo
lk
met
hod
Res
iden
ce
Urb
an
30.4
28
.2
1.7
3.7
2.6
17.7
0.6
1.0
0.1
0.8
2.2
1.6
0.6
0.0
69.6
100.
02,
025
Ru
ral
19.6
18
.7
0.5
1.0
0.9
15.0
0.9
0.0
0.0
0.3
0.9
0.2
0.3
0.4
80.4
100.
05,
881
Dis
tric
t
Ai
leu
20.7
19
.5
0.2
1.6
0.7
16.3
0.5
0.0
0.2
0.0
1.2
1.2
0.0
0.0
79.3
100.
029
9
Aina
ro
14.1
13
.7
0.2
0.9
0.8
10.7
0.8
0.0
0.0
0.4
0.4
0.0
0.0
0.4
85.9
100.
038
2
Bauc
au
8.0
7.6
1.0
1.2
0.7
3.5
0.6
0.0
0.0
0.6
0.4
0.2
0.0
0.2
92.0
100.
085
2
Bobo
naro
20.4
20
.4
0.8
1.0
0.8
16.1
1.5
0.0
0.0
0.2
0.0
0.0
0.0
0.0
79.6
100.
073
9
Cov
alim
a43
.8
43.2
0.
9 1.
40.
638
.61.
30.
00.
00.
40.
60.
60.
00.
056
.210
0.0
458
D
ili
33.2
30
.5
2.1
4.5
2.7
18.2
0.6
1.3
0.2
0.9
2.6
2.0
0.6
0.0
66.8
100.
01,
459
Er
mer
a 18
.8
15.3
0.
0 0.
40.
613
.90.
40.
00.
00.
03.
50.
01.
81.
881
.210
0.0
881
La
utem
17
.7
17.5
0.
3 1.
61.
913
.40.
20.
00.
00.
10.
20.
20.
00.
082
.310
0.0
541
Li
quiç
á 24
.5
23.8
1.
1 2.
81.
616
.91.
00.
00.
00.
50.
70.
00.
00.
775
.510
0.0
460
M
anat
uto
20.7
20
.0
0.8
1.8
2.2
15.2
0.2
0.0
0.0
0.0
0.7
0.4
0.2
0.2
79.3
100.
035
3
Man
ufah
i25
.3
24.2
0.
2 1.
11.
619
.11.
70.
00.
00.
61.
00.
01.
00.
074
.710
0.0
319
O
ecus
si 24
.1
23.4
0.
2 0.
10.
619
.42.
50.
10.
00.
50.
70.
30.
30.
275
.910
0.0
603
Vi
queq
ue13
.1
12.7
0.
0 0.
41.
010
.30.
40.
00.
00.
70.
40.
40.
00.
086
.910
0.0
559
Edu
catio
n
N
o ed
ucat
ion
15.9
14
.7
0.6
0.5
0.8
11.8
0.9
0.0
0.1
0.1
1.1
0.1
0.4
0.7
84.1
100.
02,
909
Pr
imar
y 25
.8
25.1
0.
7 1.
01.
220
.81.
20.
00.
00.
20.
70.
30.
30.
174
.210
0.0
2,02
7
Seco
ndar
y25
.7
24.2
0.
9 3.
51.
816
.30.
60.
30.
00.
81.
51.
20.
30.
074
.310
0.0
2,73
9
M
ore
than
se
cond
ary
32.8
29
.5
2.3
1.8
3.8
13.8
0.3
4.6
0.9
1.9
3.3
1.6
1.7
0.0
67.2
100.
023
1
Wea
lth q
uint
ile
Lo
wes
t 15
.0
14.5
0.
3 0.
40.
712
.30.
70.
00.
00.
00.
50.
00.
00.
485
.010
0.0
1,46
7
Seco
nd
16.4
15
.5
0.1
0.7
0.6
13.2
0.7
0.0
0.1
0.2
0.9
0.1
0.2
0.6
83.6
100.
01,
487
M
iddl
e 18
.0
16.9
0.
4 0.
70.
414
.41.
00.
00.
00.
11.
10.
10.
60.
382
.010
0.0
1,55
9
Four
th
25.3
24
.4
1.0
1.3
1.5
19.5
0.6
0.0
0.0
0.5
0.9
0.4
0.4
0.2
74.7
100.
01,
571
H
ighe
st
34.2
31
.7
1.8
4.9
3.1
18.3
1.2
1.1
0.1
1.3
2.4
1.8
0.6
0.0
65.8
100.
01,
821
Num
ber
of li
ving
ch
ildre
n
0
0.7
0.2
0.0
0.0
0.0
0.2
0.0
0.0
0.0
0.0
0.5
0.0
0.5
0.0
99.3
100.
046
9
1-2
16.7
16
.0
0.3
1.4
0.6
12.4
0.6
0.5
0.0
0.3
0.7
0.3
0.4
0.0
83.3
100.
02,
103
3-
4 26
.7
25.6
0.
8 2.
51.
618
.61.
10.
40.
10.
61.
10.
60.
40.
173
.310
0.0
2,42
1
5+
26.2
24
.4
1.3
1.5
1.8
18.2
1.0
0.0
0.1
0.5
1.8
0.8
0.4
0.7
73.8
100.
02,
913
To
tal
22.3
21
.1
0.8
1.7
1.3
15.7
0.8
0.2
0.0
0.4
1.2
0.6
0.4
0.3
77.7
100.
07,
906
Not
e: If
mor
e th
an o
ne m
etho
d is
used
, onl
y th
e m
ost e
ffect
ive
met
hod
is co
nsid
ered
in th
is ta
bula
tion.
LA
M =
Lac
tatio
nal a
men
orrh
ea m
etho
d
| 67Family Planning

68 | Family Planning
Contraceptive use varies by district with much of the difference due to the use of injectables. Use of a modern method among currently married women is highest in Covalima (43 percent) and lowest in Baucau (8 percent). The most popular method in Covalima is injectables where 39 percent of currently married women use them. Three in ten currently married women in Dili, the most urbanized district in the country, use a modern method of family planning, with 18 percent currently using injectables, 5 percent using the pill, 3 percent using IUDs, and 2 percent using sterilization. About 1 percent use implants, the male condom, and the standard days method. The scale-up in the provision of implants in Timor-Leste has been relatively recent, but at the current rate, they may soon overtake the IUD as the method of choice (Marie Stopes International, 2010). Sterilization services have in recent years been very limited, with most sterilizations provided by visiting surgical providers during a short window of time. Data for 2010 show that there is a full-time provider of both male and female sterilization services currently as well as a plan for training others in these surgical techniques, so use of sterilization could be expected to increase significantly over the coming years (Marie Stopes International, 2010).
Although current use varies markedly between women who have some education and those who have none, there is little variation among educated women by specific level of education. Women with more than secondary education (30 percent) are twice as likely to use a modern method of contraception as women with no education (15 percent). Women with more than secondary education are more likely than other women to use male condoms (5 percent) and IUDs (4 percent), and they are more likely to be sterilized and to use the standard days method (2 percent each). On the other hand, injectables are most common among women with primary education (21 percent).
Wealth has a positive effect on women’s contraceptive use, with modern contraceptive use increasing markedly as household wealth increases, from 15 percent among currently married women in the lowest wealth quintile to 32 percent among those in the highest wealth quintile.
There is a direct association between the use of modern family planning methods and the number of children that women have, except among women with five or more children. Not surprisingly, use is lowest among women with no children (less than 1 percent), rises to 16 percent among women with 1 to 2 children, is 26 percent among women with three to four children, and then decreases slightly to 24 percent among women with five or more children. As expected, female sterilization is popular among high-parity women (5+ children).
Current use of traditional methods is more common in urban than in rural areas and is highest in Ermera district, among women with more than secondary education, among women in the highest wealth quintile, and among women with five or more children. Effective use of a traditional method requires knowledge of a woman’s fertile period, and educated women, who are also more likely to be urban and belong to wealthier households, are most likely to effectively understand and use a traditional method; hence there is this uncommon pattern of use by educated, urban, wealthy women. Ermera appears to be an exception to this demographic pattern, but a detailed examination reveals that Ermera has a different pattern of use of traditional methods when compared with the pattern in Dili. Folk methods and withdrawal are the predominant methods in Ermera (at 2 percent each), with less than 0.1 percent using the rhythm method. Dili, on the other hand, has 2 percent of currently married women using the rhythm method. Similarly, the use of folk methods shifts to use of the rhythm method as education increases.
5.7 NUMBER OF CHILDREN AT FIRST USE OF CONTRACEPTION
To examine the timing of initial family planning use during the family building process, the 2009-10 TLDHS asked all women about the number of living children they had at first use. Table 5.6 shows this information by age group and allows analysis of cohort changes in parity at first use of contraception.

Family Planning | 69
Use increases with parity but with little difference among women with 1, 2, or 3 children (about 3 percent each). Nine percent of all women first used a method of family planning when they had four or more children. Younger women report first use of contraception at lower parities than older women, suggesting a shift toward the early use of contraception and the desire to delay childbearing among younger Timorese women. For example, 9 percent of women age 25-29 first used contraception when they had 2 children compared with 2 percent of women age 45-49.
Table 5.6 Number of children at first use of contraception
Percent distribution of women age 15-49 by number of living children at the time of first use of contraception, according to current age, Timor-Leste 2009-10
Current age Never used
Number of living children at time of first use of contraceptionTotal
Number of women 0 1 2 3 4+ Missing
15-19 99.2 0.2 0.4 0.1 0.1 0.0 0.0 100.0 3,144 20-24 90.2 0.1 4.1 3.5 1.6 0.4 0.0 100.0 2,343 25-29 73.3 0.1 4.5 8.7 6.8 6.5 0.1 100.0 1,897 30-34 66.8 0.3 5.6 4.3 6.1 16.6 0.3 100.0 1,534 35-39 66.2 0.2 3.5 2.4 5.8 21.8 0.1 100.0 1,684 40-44 67.2 0.4 3.7 3.1 5.2 20.4 0.0 100.0 1,388 45-49 76.7 0.2 1.8 2.0 2.7 16.5 0.0 100.0 1,146
Total 80.5 0.2 3.1 3.2 3.5 9.4 0.1 100.0 13,137
5.8 KNOWLEDGE OF FERTILE PERIOD
An elementary knowledge of reproductive physiology provides a useful background for the successful practice of the rhythm method. As shown in Tables 5.1, 5.3.1 and 5.4, respectively, 13 percent of all women and 17 percent of currently married women have heard of the rhythm method, but only 1 percent of currently married women have ever used the rhythm method, and less than half a percent are currently using the method. Table 5.7 shows respondents’ knowledge about the time during the menstrual cycle when a woman is most likely to get pregnant.
Overall, only one in ten women correctly reported the most fertile time as being halfway between two menstrual periods. Nearly one in two women (46 percent) incorrectly reported that a woman’s most fertile period is right after menstruation has ended; one in five women each mentioned that there was no specific time when a woman is most fertile or that she did not know when a woman is most fertile. The small number of users of the rhythm method makes it difficult for any meaningful analysis of knowledge among rhythm users. The limited knowledge of when a woman is most fertile indicates that there is much scope for educating women and men on female physiology. Current teaching on reproductive physiology and anatomy is limited in Timor-Leste, although this is undergoing curriculum development and review. The very high levels of misconception regarding the occurrence of the woman’s most fertile period also represent a real challenge to those not using a modern method of contraception and not wishing to become pregnant. This also has implications for Timor-Leste’s high teenage pregnancy rates.
Table 5.7 Knowledge of fertile period
Percent distribution of women age 15-49 by knowledge of the fertile period during the ovulatory cycle, according to current use of the rhythm method, Timor-Leste 2009-10
Perceived fertile period
Users of rhythm method
Nonusers of rhythm method All women
Just before her menstrual period begins (25.2) 4.7 4.8
During her menstrual period (0.0) 3.3 3.3Right after her menstrual period has ended (38.5) 46.2 46.2
Halfway between two menstrual periods (19.7) 9.5 9.6
Other (0.0) 0.0 0.0No specific time (15.3) 17.5 17.5Don’t know (1.2) 18.7 18.6
Total 100.0 100.0 100.0Number of women 44 13,093 13,137
Note: Figures in parentheses are based on 25-49 unweighted cases.

70 | Family Planning
5.9 TIMING OF FEMALE STERILIZATION
In countries where female sterilization is prevalent, there is interest in trends in the adoption of the method and age at the time of sterilization. There were only 54 women in the 2009-10 TLDHS sample who were sterilized at the time of the survey. Due to these small numbers, a separate table is not shown in this report. The median age at sterilization was 34.1 years, with the majority sterilized before age 40 (79 percent), and 20 percent were sterilized between 40 and 44 years.
5.10 SOURCE OF MODERN CONTRACEPTION METHODS
Table 5.8 on source of contraception is intended simply to document the main sources of contraception for users of different modern methods of contraception. Information on where women obtain the contraceptive method that they use is important for program managers and implementers in designing family planning policies and programs. All current users of modern contraceptive methods were asked the most recent source of their methods. The government sector remains the major source of contraceptive methods in Timor-Leste, providing methods to almost nine in ten current users. Eighty-eight percent of users get their methods from the government sector, 9 percent from the private medical sector, and 2 percent from other sources. The share of the government sector has increased slightly over the past five years. Data from the 2003 DHS show that the government sector supplied methods to 80 percent of users.
Forty-five percent of all users are served by community health centers, 20 percent by health posts, 17 percent by government and referral hospitals, 3 percent by integrated community health services (SISCa), and 2 percent by mobile clinics. In the private medical sector, most users are served by private hospitals/clinics (8 percent of all users). Most contraceptives sold in private hospitals/ clinics are provided through the Timor-Leste Contraceptive Retail Sales Company.
Table 5.8 Source of modern contraception methods
Percent distribution of users of modern contraceptive methods age 15-49 by most recent source of method, according to method, Timor-Leste 2009-10
Source Female
sterilization Pill IUD Injectables Implants Total1
Public sector 91.7 77.2 96.9 89.3 97.9 88.4 National hospital 55.4 2.3 28.4 1.4 0.0 5.5 Referral hospital 29.1 15.4 15.6 10.2 16.2 11.8 Community health center 4.1 42.9 39.5 48.3 59.3 45.4 Health post 0.0 13.3 10.7 23.6 13.1 20.3 SISCa post 0.0 1.8 0.0 4.1 2.0 3.4 Mobile clinic 0.0 1.5 2.0 1.7 7.3 1.8 Other public 3.1 0.0 0.6 0.0 0.0 0.2
Private medical sector 2.1 13.9 2.4 9.7 2.1 9.3 Private hospital/clinic 0.0 9.5 2.4 8.2 2.1 7.5 Pharmacy 0.0 2.4 0.0 0.5 0.0 0.9 Private doctor’s office 0.0 1.5 0.0 0.2 0.0 0.3 Mobile clinic 0.0 0.0 0.0 0.1 0.0 0.0 Field worker 0.0 0.0 0.0 0.1 0.0 0.1 Other private medical 2.1 0.6 0.0 0.5 0.0 0.5
Other source 0.0 8.9 0.0 0.8 0.0 1.8 Shop 0.0 0.6 0.0 0.0 0.0 0.4 Friend/relative 0.0 5.3 0.0 0.2 0.0 0.6 Marie Stopes (NGO) 0.0 1.5 0.0 0.3 0.0 0.4 Other NGO 0.0 1.5 0.0 0.3 0.0 0.4
Other 6.2 0.0 0.0 0.2 0.0 0.4 Missing 0.0 0.0 0.7 0.0 0.0 0.0
Total 100.0 100.0 100.0 100.0 100.0 100.0 Number of women 65 135 105 1,255 68 1,647
1 Total includes other modern methods but excludes lactational amenorrhea method (LAM) and standard days method.

Family Planning | 71
Female and male sterilizations are performed mostly in government hospitals (55 and 29 percent, respectively). Forty-eight percent of women using injectables obtain their supply from community health centers, and 24 percent obtain them from health posts. Pills are primarily obtained from community health centers (43 percent) and referral hospitals (15 percent). Fifty-nine percent of implants are provided through community health centers. IUDs are mostly inserted at community health centers (40 percent) and national hospitals (28 percent). These findings point to the continued reliance on government facilities as a major source of contraceptives. There is clearly scope for greater utilization of SISCa posts for provision of some family planning methods since there are a greater number of SISCa posts than all fixed facilities combined. Although SISCa offers services on a monthly basis, many family planning methods do not necessarily require more frequent visits. Injectables are the most preferred method, which can certainly be offered during a monthly service.
5.11 PAYMENT OF FEES FOR MODERN CONTRACEPTIVE METHODS
The majority of users (98 percent) in Timor-Leste do not pay for contraception (data not shown). In most cases the only cost borne by public sector users is a registration fee, whereas the small number of private sector users who pay must bear the cost of the consultancy and payment for the method as well as the registration fee.
5.12 INFORMED CHOICE
Informed choice is an important tool for monitoring the quality of family planning services. All providers of sterilization must inform potential users that the operation is a permanent, irreversible procedure; potential users also must be informed of alternate methods that could be used. Users of temporary methods also should be informed about choices they have and other methods available. Family planning providers also should inform all method users of potential side effects and what to do if they experience a problem. This information assists users in coping with side effects and decreases unnecessary discontinuation of temporary methods.
Table 5.9 presents information on informed choice by type and source of method. The data show that 61 percent of current users were informed about possible side effects or problems associated with use, 55 percent of users were informed about what to do if they experienced side effects, and 53 percent were told of other methods that could be used. The private sector is more likely than the public sector to inform users about side effects or problems associated with using a method. In contrast, the public sector is more likely than the private sector to inform clients of what to do if they experience side effects and to tell them about other methods that can be used. Information on whether women who had been sterilized were told if the method was permanent is not shown by the method source due to the very small number of cases.

72 | Family Planning
Table 5.9 Informed choice
Among current users of modern methods age 15-49 who started the last episode of use within the five years preceding the survey, the percentage who were informed about possible side effects or problems of that method, the percentage who were informed about what to do if they experienced side effects, and the percentage who were informed about other methods that they could use, by method and source, Timor-Leste 2009-10
Method/source
Among women who started last episode of modern contraceptive method within five years preceding the survey:
Percentage who were informed about side
effects or problems of method used
Percentage who were informed about what to do if experienced side
effects
Percentage who were informed by a health or family planning worker of other methods that
could be used Number of
women
Method Female sterilization (78.0) (78.0) (48.8) 42 Pill 67.2 66.7 64.1 113 IUD 76.5 66.4 64.8 97 Injectables 59.2 52.5 50.7 1,123 Implants 53.2 53.8 60.7 64
Initial source of method1 PUBLIC 59.2 55.6 53.7 1,287 National hospital 81.0 62.7 54.0 69 Referral hospital 46.7 42.2 35.9 181 Community health center 61.7 59.4 55.8 663 Health post 57.7 53.1 58.1 301 SISCa post (58.5) (61.9) (68.7) 46 Other public * * * 1 Mobile clinic * * * 27 PRIVATE MEDICAL 79.1 45.3 39.6 118 Private hospital/clinic 84.0 45.1 33.2 95 Pharmacy * * * 7 Private doctor’s office * * * 6 Mobile clinic * * * 3 Field worker * * * 1 Other private medical * * * 7 OTHER PRIVATE * * * 31 Shop * * * 1 Friend/relative * * * 7 Marie Stopes (NGO) * * * 5 Other NGO * * * 18 OTHER * * * 3
Total 61.3 55.3 53.1 1,440
Note: Table includes users of only the methods listed individually. Figures in parentheses are based on 25-49 unweighted cases. As asterisk indicates that a figure is based on fewer than 25 unweighted cases and has been suppressed. na = Not applicable 1 Source at start of current episode of use
5.13 FUTURE USE OF CONTRACEPTION
An important indicator of the changing demand for family planning is the extent to which non-users of contraception plan to use family planning in the future. Currently married women who were not using contraception at the time of the survey were asked about their intention to use family planning in the future. The results appear in Table 5.10. Among currently married women who are not using contraception, 20 percent report that they intend to use a family planning method in the future, 54 percent say that they do not intend to use a method in the future, and 27 percent are unsure of their future intention. Depending on the number of living children, there are differences in the percentage of women who intend to use family planning. The proportion of women intending to use family planning peaks at 26 percent among non-users with one child, declines to 22 percent among women with three children, and further declines sharply to 17 percent among women who have four or more children. This is despite the fact that women with four or more children have a strong demand to delay their next child or have no more children (see Table 7.1).

Family Planning | 73
Table 5.10 Future use of contraception
Percent distribution of currently married women age 15-49 who are not using a contraceptive method by intention to use in the future, according to number of living children, Timor-Leste 2009-10
Intention
Number of living children1
Total
0 1 2 3 4+
Intends to use 10.4 26.0 23.2 21.8 17.0 19.5 Unsure 17.8 31.1 31.6 28.6 24.3 26.6 Does not intend to use 71.7 43.0 45.3 49.6 58.7 53.8 Missing 0.2 0.0 0.0 0.0 0.0 0.0
Total 100.0 100.0 100.0 100.0 100.0 100.0 Number of women 300 831 918 932 3,160 6,141
1 Includes current pregnancy
5.14 REASONS FOR NON-USE OF
CONTRACEPTION IN THE FUTURE
An understanding of the reasons women give for not using family planning methods is critical to designing programs that could improve the quality of services and widen the method mix. Table 5.11 shows the percent distribution of currently married women who are not using a contraceptive method and who do not intend to use one in the future by the main reasons for not intending to use.
Fifty-five percent of women do not intend to use contraception in the future because of opposition to its use, with the majority stating that they them-selves are opposed to its use (46 percent). Nine per-cent mention that their husband/partner is opposed to the use of contraception. Twenty-one percent of women cited method-related reasons for non-use, the most common of these being fear of side effects (10 percent) and health concerns (8 percent). Sixteen percent of women cited fertility-related reasons for non-use in the future, with 7 percent of these women reporting themselves as subfecund or infecund. Six percent of women mention that they don’t know of a method or a source for a method.
5.15 PREFERRED METHOD OF CONTRACEPTION FOR FUTURE USE
Future demand for specific methods of family planning can be assessed by asking nonusers who intend to use in the future which methods they prefer to use. Table 5.12 provides some indication of currently married women’s preferences for the method they might use in the future. However, the information should be interpreted with caution because two conditions are implied here: intention to use and method preferred if intention is followed. Most currently married women would prefer to use injectables (71 percent) and pills (11 percent) in the future. About 4 percent of women each mentioned the IUD or implants as a preferred method for future use. These percentages should also be interpreted in the context of overall limited awareness of methods other than injectables. It is highly likely that increasing awareness of other methods and their advantages and disadvantages will lead to a greater variety of methods being preferred by women according to individual need.
Table 5.11 Reason for not intending to use contraception in the future
Percent distribution of currently married women age 15-49 who are not using contraception and who do not intend to use in the future by main reason for not intending to use, Timor-Leste 2009-10
ReasonPercent
distribution
Fertility-related reasons Infrequent sex/no sex 1.5Menopausal/had hysterectomy 4.3Subfecund/infecund 6.7Wants as many children as possible 3.2
Opposition to use Respondent opposed 46.0Husband/partner opposed 8.5Others opposed 0.2Religious prohibition 0.3
Lack of knowledge Knows no method 5.4Knows no source 0.3
Method-related reasons Health concerns 8.3Fear of side effects 10.1Lack of access/too far 0.5Inconvenient to use 0.1Interfere with body’s normal process 2.0
Other 1.4Don’t know 1.4
Total 100.0Number of women 3,306

74 | Family Planning
Table 5.12 Preferred method of contraception for future use
Percent distribution of currently married women age 15-49 who are not using a contraceptive method but who intend to use in the future by preferred method, Timor-Leste 2009-10
Method Percent
distribution
Female sterilization 0.5 Pill 11.1 IUD 4.1 Injectables 71.1 Implants 3.7 Condom 0.4 Periodic abstinence 1.0 Withdrawal 0.1 Other 1.8 Unsure 3.7 Missing 2.5
Total 100.0 Number of women 1,199
5.16 EXPOSURE TO FAMILY PLANNING MESSAGES
The electronic media such as radio and television are important for communicating messages about family planning. Information on the level of exposure to such media is important for program managers and planners to effectively target population subgroups for information, education, and communication (IEC) campaigns. In Timor-Leste, the most common media source is the radio. Television is mostly found in urban areas, while the print media are accessed mostly by the educated. To assess the extent to which media serve as a source of family planning messages, respondents were asked if they had heard or seen a message about family planning on the radio, on television, in the print media (newspaper, magazine, poster, or billboard), or at a street drama in the months preceding the survey. The results are shown in Table 5.13.
One in five women (21 percent) and one in three men (32 percent) age 15-49 have heard a family planning message recently on the radio, and 21 percent of women and 23 percent of men have heard family planning messages on television. Ten percent of women and 15 percent of men have read about family planning in a newspaper or magazine. Sixty-eight percent of women and 59 percent of men have not been exposed to family planning messages in the past few months through any of the specified media sources.
With the exception of the youngest age group, exposure is generally higher among younger respondents (20-29 years) than among older respondents (45-49 years). Not surprisingly, women and men residing in urban areas are much more likely to have been exposed to family planning messages in any media than their rural counterparts. This is especially true for messages on television and in the print media. By district, exposure to family planning messages among women is highest in Dili and lowest in Oecussi (with 27 percent and 94 percent exposed to no media messages, respectively). Exposure among men is highest in Manatuto and lowest in Ermera (with 14 percent and 80 percent exposed to no media messages, respectively), Not surprisingly, exposure to media messages on family planning increases with education and wealth quintile.
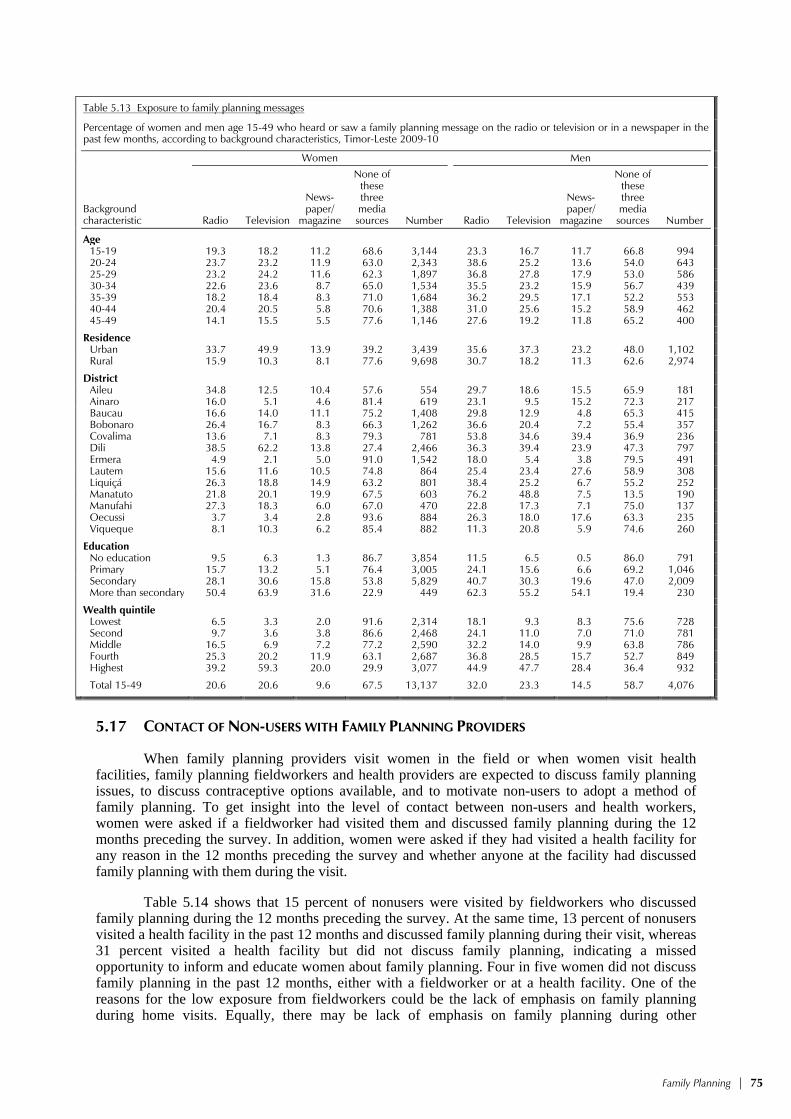
Family Planning | 75
Table 5.13 Exposure to family planning messages
Percentage of women and men age 15-49 who heard or saw a family planning message on the radio or television or in a newspaper in the past few months, according to background characteristics, Timor-Leste 2009-10
Background characteristic
Women Men
Radio Television
News-paper/
magazine
None of these three media sources Number Radio Television
News-paper/
magazine
None of these three media sources Number
Age 15-19 19.3 18.2 11.2 68.6 3,144 23.3 16.7 11.7 66.8 994 20-24 23.7 23.2 11.9 63.0 2,343 38.6 25.2 13.6 54.0 643 25-29 23.2 24.2 11.6 62.3 1,897 36.8 27.8 17.9 53.0 586 30-34 22.6 23.6 8.7 65.0 1,534 35.5 23.2 15.9 56.7 439 35-39 18.2 18.4 8.3 71.0 1,684 36.2 29.5 17.1 52.2 553 40-44 20.4 20.5 5.8 70.6 1,388 31.0 25.6 15.2 58.9 462 45-49 14.1 15.5 5.5 77.6 1,146 27.6 19.2 11.8 65.2 400
Residence Urban 33.7 49.9 13.9 39.2 3,439 35.6 37.3 23.2 48.0 1,102 Rural 15.9 10.3 8.1 77.6 9,698 30.7 18.2 11.3 62.6 2,974
District Aileu 34.8 12.5 10.4 57.6 554 29.7 18.6 15.5 65.9 181 Ainaro 16.0 5.1 4.6 81.4 619 23.1 9.5 15.2 72.3 217 Baucau 16.6 14.0 11.1 75.2 1,408 29.8 12.9 4.8 65.3 415 Bobonaro 26.4 16.7 8.3 66.3 1,262 36.6 20.4 7.2 55.4 357 Covalima 13.6 7.1 8.3 79.3 781 53.8 34.6 39.4 36.9 236 Dili 38.5 62.2 13.8 27.4 2,466 36.3 39.4 23.9 47.3 797 Ermera 4.9 2.1 5.0 91.0 1,542 18.0 5.4 3.8 79.5 491 Lautem 15.6 11.6 10.5 74.8 864 25.4 23.4 27.6 58.9 308 Liquiçá 26.3 18.8 14.9 63.2 801 38.4 25.2 6.7 55.2 252 Manatuto 21.8 20.1 19.9 67.5 603 76.2 48.8 7.5 13.5 190 Manufahi 27.3 18.3 6.0 67.0 470 22.8 17.3 7.1 75.0 137 Oecussi 3.7 3.4 2.8 93.6 884 26.3 18.0 17.6 63.3 235 Viqueque 8.1 10.3 6.2 85.4 882 11.3 20.8 5.9 74.6 260
Education No education 9.5 6.3 1.3 86.7 3,854 11.5 6.5 0.5 86.0 791 Primary 15.7 13.2 5.1 76.4 3,005 24.1 15.6 6.6 69.2 1,046 Secondary 28.1 30.6 15.8 53.8 5,829 40.7 30.3 19.6 47.0 2,009 More than secondary 50.4 63.9 31.6 22.9 449 62.3 55.2 54.1 19.4 230
Wealth quintile Lowest 6.5 3.3 2.0 91.6 2,314 18.1 9.3 8.3 75.6 728 Second 9.7 3.6 3.8 86.6 2,468 24.1 11.0 7.0 71.0 781 Middle 16.5 6.9 7.2 77.2 2,590 32.2 14.0 9.9 63.8 786 Fourth 25.3 20.2 11.9 63.1 2,687 36.8 28.5 15.7 52.7 849 Highest 39.2 59.3 20.0 29.9 3,077 44.9 47.7 28.4 36.4 932
Total 15-49 20.6 20.6 9.6 67.5 13,137 32.0 23.3 14.5 58.7 4,076
5.17 CONTACT OF NON-USERS WITH FAMILY PLANNING PROVIDERS
When family planning providers visit women in the field or when women visit health facilities, family planning fieldworkers and health providers are expected to discuss family planning issues, to discuss contraceptive options available, and to motivate non-users to adopt a method of family planning. To get insight into the level of contact between non-users and health workers, women were asked if a fieldworker had visited them and discussed family planning during the 12 months preceding the survey. In addition, women were asked if they had visited a health facility for any reason in the 12 months preceding the survey and whether anyone at the facility had discussed family planning with them during the visit.
Table 5.14 shows that 15 percent of nonusers were visited by fieldworkers who discussed family planning during the 12 months preceding the survey. At the same time, 13 percent of nonusers visited a health facility in the past 12 months and discussed family planning during their visit, whereas 31 percent visited a health facility but did not discuss family planning, indicating a missed opportunity to inform and educate women about family planning. Four in five women did not discuss family planning in the past 12 months, either with a fieldworker or at a health facility. One of the reasons for the low exposure from fieldworkers could be the lack of emphasis on family planning during home visits. Equally, there may be lack of emphasis on family planning during other

76 | Family Planning
consultations at a health facility. Given the relatively high coverage of ANC services in Timor-Leste, this represents at least one under-utilized opportunity for education and promotion in family planning. This low level of contact of nonusers with family planning providers varies little by urban-rural residence, education, and wealth. Exposure is lowest among very young women (15-19 years) and among women residing in Ermera, Baucau, and Ainaro.
Table 5.14 Contact of nonusers with family planning providers
Among women age 15-49 who are not using contraception, the percentage who during the last 12 months were visited by a fieldworker who discussed family planning, the percentage who visited a health facility and discussed family planning, the percentage who visited a health facility but did not discuss family planning, and the percentage who neither discussed family planning with a fieldworker nor at a health facility, by background characteristics, Timor-Leste 2009-10
Background characteristic
Percentage of women who were
visited by fieldworker who discussed family
planning
Percentage of women who visited a health facility in the past 12 months
and who:
Percentage of women who
neither discussed family planning with fieldworker nor at a health
facility Number of
women Discussed family
planning Did not discuss family planning
Age 15-19 10.2 4.4 27.0 87.9 3,124 20-24 15.0 11.9 30.3 79.4 2,167 25-29 17.4 17.4 36.6 73.2 1,532 30-34 19.4 17.9 36.9 70.8 1,154 35-39 18.6 19.4 33.0 73.0 1,272 40-44 18.8 17.3 31.2 73.2 1,089 45-49 16.2 12.4 30.6 78.3 1,016
Residence Urban 15.8 8.3 30.3 79.8 2,815 Rural 15.2 14.0 31.7 78.2 8,540
District Aileu 32.4 18.1 39.8 64.4 491 Ainaro 5.1 7.5 29.0 91.1 565 Baucau 2.7 5.2 36.0 93.0 1,340 Bobonaro 39.5 25.1 32.2 55.0 1,111 Covalima 14.4 11.4 50.8 79.3 573 Dili 20.8 6.3 26.6 76.0 1,976 Ermera 3.3 5.0 47.6 93.2 1,376 Lautem 11.2 14.1 16.1 80.4 768 Liquiçá 17.7 12.8 29.2 76.9 689 Manatuto 18.9 16.3 20.9 77.8 530 Manufahi 12.6 16.5 27.7 79.8 390 Oecussi 16.0 34.1 30.7 61.5 739 Viqueque 8.0 11.6 14.4 83.5 808
Education No education 15.3 14.1 31.6 78.0 3,390 Primary 17.0 15.2 32.9 75.3 2,471 Secondary 14.4 10.5 30.5 80.7 5,123 More than secondary 18.5 10.7 30.8 77.4 371
Wealth quintile Lowest 12.8 15.6 26.8 78.8 2,092 Second 12.0 10.8 33.1 82.6 2,220 Middle 15.7 13.9 35.2 77.6 2,308 Fourth 19.4 14.0 31.7 74.9 2,283 Highest 16.4 9.1 29.6 79.2 2,453
Total 15.3 12.6 31.3 78.6 11,355
5.18 HUSBAND’S KNOWLEDGE OF WIFE’S USE OF CONTRACEPTION
Concealment of contraceptive use is an indication of absence of communication or disagreement on use of family planning. To shed light on the extent of communication regarding use of contraception among married couples, currently married women who were using contraception at the time of the survey were asked whether their husband knew of their use. Almost all users (97 percent) reported that their husbands know about their use of contraception (Table 5.15), an indication, perhaps, that Timorese husbands in general are supportive of contraceptive use among their wives.
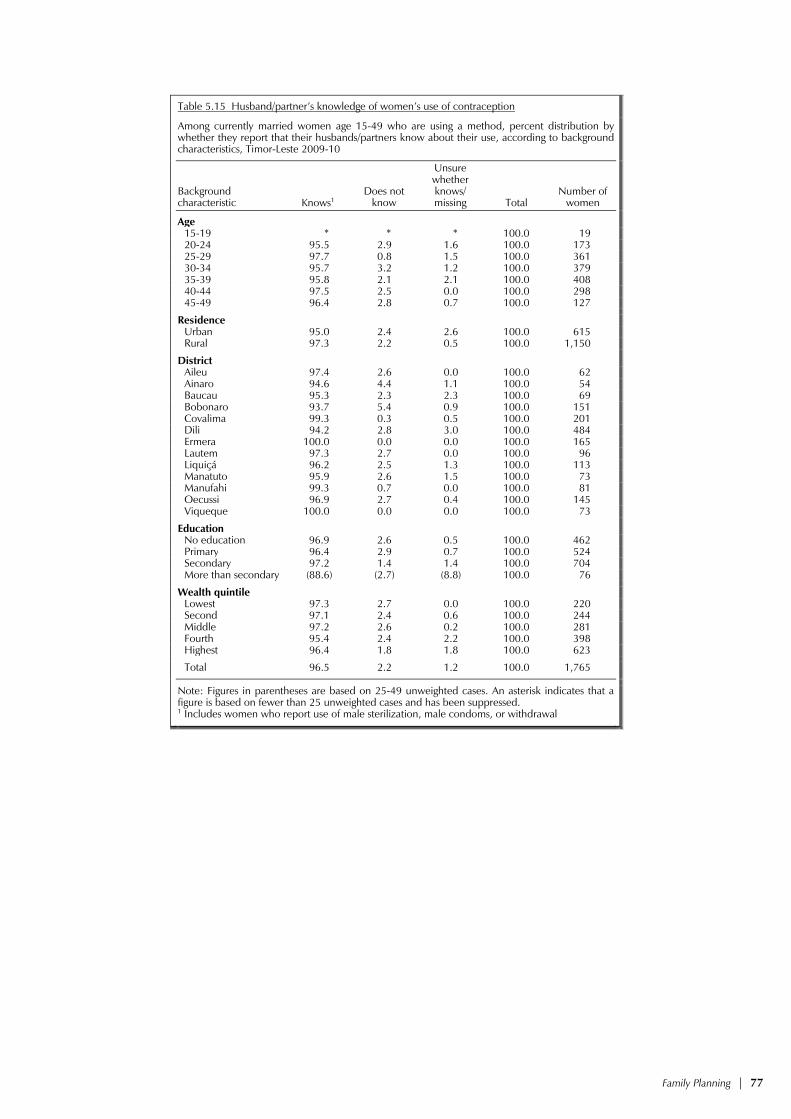
Family Planning | 77
Table 5.15 Husband/partner’s knowledge of women’s use of contraception
Among currently married women age 15-49 who are using a method, percent distribution by whether they report that their husbands/partners know about their use, according to background characteristics, Timor-Leste 2009-10
Background characteristic Knows1
Does not know
Unsure whether knows/ missing Total
Number of women
Age 15-19 * * * 100.0 19 20-24 95.5 2.9 1.6 100.0 173 25-29 97.7 0.8 1.5 100.0 361 30-34 95.7 3.2 1.2 100.0 379 35-39 95.8 2.1 2.1 100.0 408 40-44 97.5 2.5 0.0 100.0 298 45-49 96.4 2.8 0.7 100.0 127
Residence Urban 95.0 2.4 2.6 100.0 615 Rural 97.3 2.2 0.5 100.0 1,150
District Aileu 97.4 2.6 0.0 100.0 62 Ainaro 94.6 4.4 1.1 100.0 54 Baucau 95.3 2.3 2.3 100.0 69 Bobonaro 93.7 5.4 0.9 100.0 151 Covalima 99.3 0.3 0.5 100.0 201 Dili 94.2 2.8 3.0 100.0 484 Ermera 100.0 0.0 0.0 100.0 165 Lautem 97.3 2.7 0.0 100.0 96 Liquiçá 96.2 2.5 1.3 100.0 113 Manatuto 95.9 2.6 1.5 100.0 73 Manufahi 99.3 0.7 0.0 100.0 81 Oecussi 96.9 2.7 0.4 100.0 145 Viqueque 100.0 0.0 0.0 100.0 73
Education No education 96.9 2.6 0.5 100.0 462 Primary 96.4 2.9 0.7 100.0 524 Secondary 97.2 1.4 1.4 100.0 704 More than secondary (88.6) (2.7) (8.8) 100.0 76
Wealth quintile Lowest 97.3 2.7 0.0 100.0 220 Second 97.1 2.4 0.6 100.0 244 Middle 97.2 2.6 0.2 100.0 281 Fourth 95.4 2.4 2.2 100.0 398 Highest 96.4 1.8 1.8 100.0 623
Total 96.5 2.2 1.2 100.0 1,765
Note: Figures in parentheses are based on 25-49 unweighted cases. An asterisk indicates that a figure is based on fewer than 25 unweighted cases and has been suppressed. 1 Includes women who report use of male sterilization, male condoms, or withdrawal


Other Proximate Determinants of Fertility | 79
OTHER PROXIMATE DETERMINANTS OF FERTILITY 6
This chapter addresses the principal factors other than contraception that affect a woman’s risk of becoming pregnant. The principal factors are nuptiality (including age at first marriage and age at first sexual intercourse), postpartum amenorrhea and sexual abstinence, and menopause. In societies where sexual activity usually takes place within marriage, marriage signals the onset of a woman’s exposure to the risk of childbearing. Postpartum amenorrhea and sexual abstinence affect the duration of a woman’s insusceptibility to pregnancy, which in turn affects birth spacing. The onset of menopause marks the end of a woman’s reproductive life. These variables taken together determine the length and pace of a woman’s reproductive life and are, therefore, important for understanding fertility.
6.1 CURRENT MARITAL STATUS
Table 6.1 shows the marital status by age and sex. Three-fifths of women (60 percent) and just over one in two men (53 percent) age 15-49 are currently in a union. Thirty-six percent of women age 15-49 have never been married, whereas the proportion of men age 15-49 who have never been married is considerably higher (46 percent). The proportion that have never married decreases sharply with age for both women and men: among women, from 92 percent in the age group 15-19 to 3 percent in the age group 45-49; and among men, from nearly 100 percent in the age group 15-19 to less than 2 percent in the age group 45-49.
Table 6.1 Current marital status
Percent distribution of women and men age 15-49 by current marital status, according to age, Timor-Leste 2009-10
Age
Marital status
Total
Percentage of respondents currently in
union Number of respondents
Never married Married
Living together Divorced Separated Widowed
WOMEN
15-19 91.8 6.0 1.7 0.1 0.3 0.0 100.0 7.7 3,144 20-24 51.0 42.2 4.7 0.9 0.9 0.3 100.0 47.0 2,343 25-29 16.6 75.8 4.1 0.6 1.6 1.3 100.0 79.9 1,897 30-34 6.7 86.5 2.3 1.0 1.7 1.9 100.0 88.8 1,534 35-39 5.1 88.6 1.3 0.8 1.2 3.0 100.0 89.9 1,684 40-44 4.0 86.2 1.0 0.9 1.8 6.2 100.0 87.2 1,388 45-49 3.2 83.3 0.5 0.8 1.2 11.0 100.0 83.8 1,146
Total 15-49 35.6 57.8 2.4 0.6 1.1 2.5 100.0 60.2 13,137
MEN
15-19 99.6 0.3 0.1 0.0 0.0 0.0 100.0 0.4 994 20-24 80.1 14.6 4.8 0.0 0.6 0.0 100.0 19.4 643 25-29 37.8 54.1 7.2 0.3 0.1 0.5 100.0 61.3 586 30-34 15.2 77.1 6.6 0.1 0.3 0.7 100.0 83.7 439 35-39 8.8 84.7 4.3 0.1 0.6 1.5 100.0 88.9 553 40-44 3.5 89.7 4.2 0.2 0.3 2.1 100.0 93.8 462 45-49 1.8 88.6 6.1 0.0 0.9 2.6 100.0 94.6 400
Total 15-49 45.8 48.8 4.2 0.1 0.3 0.8 100.0 53.0 4,076
About 3 percent of women age 15-49 are widowed compared with less than one percent of
men in the same age group. The proportion of women who are widowed increases with age, and at age 45-49 more than one in ten women is widowed. At age 45-49, only about 3 percent of men are widowed. About 2 percent of women and less than half a percent of men age 15-49 are divorced or separated1.
1 Data from 2003 DHS on marital status was derived from the household-level questionnaire administered to ever-married women only, so no comparison on marital status can be made.

80 | Other Proximate Determinants of Fertility
6.2 POLYGYNY
Polygyny (the practice of having more than one wife) has implications for the frequency of exposure to sexual activity and, therefore, fertility. The extent of polygyny is ascertained from responses of currently married women to questions on whether their husband or partner has other wives and, if so, how many. Similarly, currently married men were asked for the number of wives they have.
Table 6.2 presents, by background characteristics, the proportion of currently married women age 15-49 who are in a polygynous union. Data from the 2009-10 TLDHS show that about 2 percent of currently married women are in a polygynous union; that is, they have co-wives. The data further indicate that women in the youngest age group (15-19) and older women (40-49) are more likely to be in polygynous unions than women age 20-39. For example, about 3 percent of women age 45-49 are in a polygynous union compared with 1 percent of women age 20-24.
Table 6.2 Number of co-wives and wives
Percentage of currently married women age 15-49 with co-wives and percentage of currently married men age 15-49 with two or more wives, according to background characteristics, Timor-Leste 2009-10
Background characteristic
Women Men
Percentage with
co-wives Number of
women
Percentage with 2+
wives Number of
men
Age 15-19 2.4 243 * 4 20-24 1.2 1,100 0.0 125 25-29 1.5 1,516 0.0 359 30-34 2.1 1,362 0.6 368 35-39 1.9 1,514 1.3 492 40-44 2.6 1,211 0.9 433 45-49 2.9 960 2.0 378
Residence Urban 1.4 2,025 0.8 567 Rural 2.2 5,881 1.0 1,592
District Aileu 0.5 299 0.0 92 Ainaro 1.1 382 0.0 101 Baucau 1.6 852 1.3 237 Bobonaro 2.0 739 0.8 170 Covalima 3.9 458 0.0 123 Dili 0.7 1,459 0.9 416 Ermera 3.2 881 1.3 233 Lautem 6.6 541 2.8 163 Liquiçá 1.5 460 0.0 124 Manatuto 0.5 353 0.0 96 Manufahi 1.5 319 0.0 77 Oecussi 0.7 603 0.0 165 Viqueque 2.7 559 2.8 159
Education No education 2.9 2,909 2.1 523 Primary 1.7 2,027 0.8 650 Secondary 1.4 2,739 0.4 853 More than secondary 0.0 231 0.8 132
Wealth quintile Lowest 2.7 1,467 0.8 413 Second 1.8 1,487 0.0 408 Middle 2.6 1,559 2.1 411 Fourth 2.0 1,571 1.9 447 Highest 1.1 1,821 0.0 479
Total 2.0 7,906 0.9 2,158
Note: An asterisk indicates that a figure is based on fewer than 25 unweighted cases and has been suppressed.

Other Proximate Determinants of Fertility | 81
Data by place of residence show only small differences. Polygyny ranges from a low of less than 1 percent among women living in Manatuto and Aileu to a high of 7 percent among women who live in Lautem.
There is an inverse relationship between education and polygyny, with the proportion of women in a polygynous union decreasing from 3 percent among women with no education to zero among women with more than secondary education. Differences in the prevalence of polygyny among women in different wealth quintiles are not large.
Table 6.2 also shows the percentage of currently married men 15-49 with two or more wives, according to background characteristics. The data indicate that less than 1 percent of men report having two or more wives, with polygyny higher among older men, among men living in Viqueque and Lautem, and among men with no education.
6.3 AGE AT FIRST MARRIAGE
Marriage marks the point in a woman’s life when childbearing becomes socially acceptable. Age at first marriage has a major effect on childbearing because women who marry early have, on average, a longer period of exposure to the risk of becoming pregnant and a greater number of lifetime births. Information on age at first marriage was obtained by asking respondents the month and year, or age, at which they started living with their first husband or wife.
Table 6.3 shows the percentage of women and men who have married by specific ages, according to current age. Marriage occurs relatively early in Timor-Leste: among women age 25-49, 24 percent are married by age 18, 42 percent are married by age 20, 59 percent are married by age 22, and 77 percent are married by age 25. The median age at (first) marriage among women age 25-49 is
Table 6.3 Age at first marriage
Percentage of women and men age 15-49 who were first married by specific exact ages and median age at first marriage, according to current age, Timor-Leste 2009-10
Current age
Percentage first married by exact age: Percentage
never married Number
Median age at first marriage
15 18 20 22 25 WOMEN
15-19 1.4 na na na na 91.8 3,144 a 20-24 3.0 18.9 35.3 na na 51.0 2,343 a 25-29 3.6 24.2 44.2 60.7 78.1 16.6 1,897 20.6 30-34 6.3 25.8 46.6 64.4 81.3 6.7 1,534 20.4 35-39 5.0 23.7 41.4 59.3 77.1 5.1 1,684 20.9 40-44 7.2 26.8 42.4 57.8 76.2 4.0 1,388 21.0 45-49 4.8 20.1 34.6 50.3 69.3 3.2 1,146 22.0
20-49 4.8 23.0 40.6 na na 17.9 9,993 a
25-49 5.3 24.3 42.3 59.0 76.8 7.8 7,650 20.9
MEN
15-19 0.0 na na na na 99.6 994 a 20-24 0.0 3.2 9.7 na na 80.1 643 a 25-29 0.0 3.8 12.8 25.5 50.1 37.8 586 25.0 30-34 0.0 5.3 13.5 27.5 50.7 15.2 439 24.9 35-39 0.0 6.2 14.4 25.7 50.7 8.8 553 24.9 40-44 0.0 4.0 12.3 23.9 46.2 3.5 462 25.4 45-49 0.0 4.3 12.8 23.1 43.1 1.8 400 26.2
20-49 0.0 4.4 12.5 na na 28.4 3,082 a
25-49 0.0 4.7 13.2 25.2 48.5 14.8 2,440 a
30-49 0.0 5.0 13.3 25.1 47.9 7.5 1,854 25.3
Note: The age at first marriage is defined as the age at which the respondent began living with her/his first spouse/partner na = Not applicable due to censoring a = Omitted because less than 50 percent of the women married for the first time before reaching the beginning of the age group

82 | Other Proximate Determinants of Fertility
20.9 years. Although the proportion of women married by age 15 has declined from 7 percent among women age 40-44 to 1 percent among women age 15-19, there is a noticeable decrease in the median age at marriage over the last few decades from 22.0 years among women age 45-49 to 20.6 years among women age 25-29. This trend is in contrast to what is usually seen in countries undergoing social change and increased access to schooling, which typically bring about a delay in the age at marriage. This trend is also confirmed when comparing similarly collected information from the 2003 DHS where the median age at first marriage among women age 25-49 was found to be 21.4 years. The system of dowry accepted in some communities in Timor-Leste, in which a man pays dowry to the prospective bride’s family, could exert some pressure for early marriage among women, because a man who marries a woman who is already pregnant is not obliged to give a dowry to her family prior to marriage.
Men on the other hand marry much later than women. Table 6.3 shows that among men age 30-49, 5 percent were married by age 18, 13 percent by age 20, 25 percent by age 22, and 48 percent by age 25. The median age at marriage among men age 30-49 is 25.3 years.
Table 6.4.1 shows the median age at first marriage among women age 25-49 by five-year age groups, according to background characteristics. Urban women marry only slightly later than rural women. The median age at marriage by district shows some notable variation. Women in Covalima marry two years earlier than women in Baucau.
Table 6.4.1 Median age at first marriage: Women
Median age at first marriage among women by five-year age groups and age 25-49, according to background characteristics, Timor-Leste 2009-10
Background characteristic
Current age Women
age 25-49
25-29 30-34 35-39 40-44 45-49
Residence Urban 20.7 21.2 21.9 20.5 21.0 21.1 Rural 20.6 20.1 20.7 21.2 22.2 20.8
District Aileu 20.6 19.8 20.6 21.0 20.8 20.6 Ainaro 20.0 20.1 21.6 21.0 22.9 20.8 Baucau 22.3 20.1 21.6 22.6 26.1 22.2 Bobonaro 21.1 19.7 20.7 21.5 22.0 21.0 Covalima 18.9 19.1 19.5 20.1 20.9 19.7 Dili 20.9 21.5 22.5 20.6 21.5 21.4 Ermera 21.1 20.7 20.1 20.4 22.0 20.8 Lautem 20.5 20.0 20.9 20.4 20.3 20.4 Liquiçá 21.7 20.1 20.2 20.6 21.1 20.7 Manatuto 20.6 21.4 21.8 21.2 22.2 21.3 Manufahi 20.3 20.2 20.9 21.6 22.7 20.7 Oecussi 18.8 19.4 20.3 20.7 19.6 19.8 Viqueque 19.9 20.6 20.7 22.3 22.9 21.0
Education No education 20.3 19.8 20.4 20.8 21.8 20.7 Primary 19.3 19.3 20.0 20.0 21.0 19.7 Secondary 21.0 21.0 21.8 22.3 25.0 21.5 More than secondary 24.9 24.9 (25.7) * * a
Wealth quintile Lowest 19.8 19.9 20.8 22.0 23.8 20.9 Second 20.6 19.8 20.7 21.1 22.3 20.8 Middle 21.0 20.0 20.4 20.8 21.6 20.7 Fourth 20.6 20.4 20.4 20.3 20.8 20.5 Highest 20.8 21.3 22.0 20.9 21.8 21.3
Total 20.6 20.4 20.9 21.0 22.0 20.9
Note: The age at first marriage is defined as the age at which the respondent began living with her/his first spouse/partner. Figures in parentheses are based on 25-49 unweighted cases. An asterisk indicates that a figure is based on fewer than 25 unweighted cases and has been suppressed. a = Omitted because less than 50 percent of the women married for the first time before reaching the beginning of the age group

Other Proximate Determinants of Fertility | 83
There is no clear relationship between age at marriage and education. Women with primary education marry one year earlier (19.7) than women with no education (20.7) and two years earlier than women with secondary education (21.5). Similarly, the median age by wealth quintiles declines from 20.9 among women in the lowest wealth quintile to 20.5 among women in the fourth wealth quintile, then rises to 21.3 among women in the highest wealth quintile.
Table 6.4.2 shows the median age at first marriage for men age 30-49 by five-year age groups, according to background characteristics. Median age among men varies substantially by place of residence. Urban men marry one and a half years later than rural men. Similarly, men in Dili marry nearly four years later than men in Oecussi.
Table 6.4.2 Median age at first marriage: Men
Median age at first marriage among men by five-year age groups and age 30-49, according to background characteristics, Timor-Leste 2009-10
Background characteristic
Current age Men age 30-49
25-29 30-34 35-39 40-44 45-49
Residence Urban a 24.8 26.5 28.3 27.5 26.4 Rural 25.0 24.9 24.3 25.0 26.1 25.0
District Aileu (a) * (24.7) (25.2) (29.7) 25.7 Ainaro a (24.2) (25.0) (24.6) * 25.4 Baucau (24.0) (25.5) (23.9) (25.2) (29.2) 25.6 Bobonaro (a) (24.7) (25.4) (24.8) (26.4) 25.4 Covalima (a) (26.4) (23.8) (23.9) (26.2) 25.0 Dili 24.5 (24.6) 26.9 (29.4) (29.0) 26.9 Ermera (24.9) (25.6) (23.2) (24.7) (24.7) 24.8 Lautem (24.2) (24.5) 22.9 (25.1) (25.1) 24.1 Liquiçá a * (27.8) (25.9) (26.1) 26.3 Manatuto a (23.7) (25.6) (26.3) (28.1) 25.6 Manufahi (24.0) (26.7) (24.7) (25.6) * 25.2 Oecussi (23.7) (22.6) (23.2) (24.2) (23.9) 23.3 Viqueque (24.0) (24.5) 24.2 (24.8) (26.2) 24.7
Education No education a 25.7 25.0 24.3 25.4 25.0 Primary 23.3 23.4 24.3 24.6 24.8 24.3 Secondary a 24.8 24.6 26.2 29.4 25.6 More than secondary (a) (26.9) (27.5) * * 28.0
Wealth quintile Lowest 24.2 23.8 23.8 24.7 26.8 24.7 Second 24.8 25.7 25.3 25.4 27.6 25.9 Middle a 26.0 23.7 25.7 24.7 24.8 Fourth a 24.0 24.8 24.7 25.0 24.6 Highest a 24.8 26.8 28.1 28.0 26.7
Total 25.0 24.9 24.9 25.4 26.2 25.3
Note: The age at first marriage is defined as the age at which the respondent began living with her/his first spouse/partner. Figures in parentheses are based on 25-49 unweighted cases. An asterisk indicates that a figure is based on fewer than 25 unweighted cases and has been suppressed. a = Omitted because less than 50 percent of the men married for the first time before reaching the beginning of the age group
Education also influences age at marriage among men substantially, ranging from a low of
24.3 among men with primary education to a high of 28.0 years among men with more than secondary education. Similarly, men from the highest wealth quintile marry about one year later than men in the second wealth quintile and two years later than those from the other quintiles.
6.4 AGE AT FIRST SEXUAL INTERCOURSE
Age at first marriage is often used as a proxy for first exposure to intercourse and risk of pregnancy. But the two events may not occur at the same time because some people may engage in sexual activity before marriage. In the 2009-10 TLDHS, all women and men, irrespective of their marital status, were asked how old they were when they first had sexual intercourse. Table 6.5 shows by specific ages the proportions of women and men who had first sexual intercourse.

84 | Other Proximate Determinants of Fertility
Table 6.5 Age at first sexual intercourse
Percentage of women and men age 15-49 who had first sexual intercourse by specific exact ages, percentage who never had intercourse, and median age at first intercourse, according to current age, Timor-Leste 2009-10
Current age
Percentage who had first sexual intercourse by exact age:
Percentage who never
had intercourse Number
Median age at first
intercourse
15 18 20 22 25 WOMEN
15-19 1.1 na na na na 91.4 3,144 a 20-24 2.7 16.8 33.1 na na 50.6 2,343 a 25-29 2.9 22.4 43.8 59.6 76.3 16.6 1,897 20.7 30-34 5.5 25.2 44.7 62.7 79.2 6.2 1,534 20.5 35-39 4.2 22.4 39.6 57.7 74.8 4.8 1,684 20.9 40-44 5.6 25.2 41.5 57.2 73.9 3.9 1,388 21.0 45-49 3.8 20.6 35.4 51.1 69.2 2.8 1,146 21.8
20-49 4.0 21.7 39.4 na na 17.6 9,993 a
25-49 4.3 23.2 41.4 58.1 75.1 7.5 7,650 20.9
MEN
15-19 0.8 na na na na 89.9 994 a 20-24 0.1 9.2 32.6 na na 44.0 643 a 25-29 0.4 6.8 25.6 48.6 71.5 14.8 586 22.2 30-34 0.1 9.0 23.5 46.7 66.2 5.9 439 22.6 35-39 0.2 9.7 21.5 39.2 64.8 3.9 553 23.2 40-44 0.6 5.6 20.7 40.2 61.6 2.3 462 23.5 45-49 0.5 8.0 19.7 38.9 56.8 1.1 400 23.9
20-49 0.3 8.1 24.5 na na 14.0 3,082 a
25-49 0.4 7.8 22.4 42.9 64.8 6.1 2,440 23.0
30-49 0.3 8.1 21.4 41.2 62.6 3.4 1,854 23.3
na = Not applicable due to censoring a = Omitted because less than 50 percent of the respondents had intercourse for the first time before reaching the beginning of the age group
The median age at first sexual intercourse among women age 25-49 is 20.9 years and is
identical to the median age at first marriage, suggesting that Timorese women generally begin sexual intercourse at the time of their first marriage. Table 6.5 also shows that the median age at first sexual intercourse has decreased over the last two decades, from 21.8 years for women age 45-49 to 20.7 years for women age 25-29.
The median age at first sexual intercourse among men age 25-49 (23.0 years) is two years later than among women in the same age group, primarily because men tend to marry later than women and, presumably, even among men, sexual intercourse tends to be initiated upon marriage. Nevertheless, the median age at first sexual intercourse among men age 30-49 is 23.3 years which is earlier than the median age at first marriage, indicating that some Timorese men do initiate sexual intercourse prior to marriage. Furthermore, the data show that about 28 percent of men age 20-49 are not married (Table 6.3), but only 14 percent in the same age group report never having had sexual intercourse (Table 6.5).
The variation in the median age at first sexual intercourse among women by background characteristics is nearly identical to the median age at first marriage and is, therefore, not shown or discussed separately here.
Table 6.6 shows the median age at first sexual intercourse for men, according to background characteristics. Differences by background characteristics are contrary to those discussed for median age at first marriage (Table 6.4.2). For example, the median age at first sexual intercourse is higher among rural than urban men in contrast with the median age at first marriage, which is higher among urban than rural men. Differences in the median age at first sexual intercourse by district are substantial. Men age 25-49 in Covalima initiate sex about five years earlier than men in Viqueque, Manufahi, Manatuto, and Ainaro; four years earlier than men in Liquiçá and Aileu; three years earlier

Other Proximate Determinants of Fertility | 85
than men in Ermera; and two years earlier than men in Dili, with much smaller differences among men in Oecussi and Lautem. This is probably related to the well-known presence of commercial sex workers in Covalima. Men with primary education initiate sexual intercourse one year earlier than men at all the other education levels. Men in the second wealth quintile initiate sexual intercourse one year later than men in the lowest, fourth, and highest wealth quintiles.
Table 6.6 Median age at first intercourse: Men
Median age at first sexual intercourse among men by five-year age groups, age 25-49, and age 30-49, according to background characteristics, Timor-Leste 2009-10
Background characteristic
Age Men age 25-49
Men age 30-49
25-29 30-34 35-39 40-44 45-49
Residence Urban 20.9 21.4 23.0 23.0 21.8 22.0 22.5 Rural 23.0 23.1 23.3 23.7 24.5 23.4 23.7
District Aileu (22.4) * (23.3) (23.6) (27.9) 23.8 25.1 Ainaro 24.0 (23.6) (24.8) (23.9) * 24.4 24.7 Baucau (a) (26.6) (24.6) (27.2) (30.0) a 26.5 Bobonaro (a) (24.7) (25.4) (24.4) (26.8) a 25.4 Covalima (18.8) (19.7) (20.0) (20.0) (20.2) 19.7 20.0 Dili 20.9 (21.3) 23.2 (23.7) (22.3) 22.2 22.9 Ermera (23.1) (24.3) (22.7) (21.6) (23.9) 23.0 22.9 Lautem (20.4) (20.3) 20.5 (20.7) (20.4) 20.5 20.5 Liquiçá 22.9 * (23.4) (24.2) (25.5) 23.9 24.8 Manatuto 22.8 (24.0) (25.3) (25.7) (28.1) 24.4 25.3 Manufahi (23.7) (27.2) (24.9) (25.5) * 24.9 25.2 Oecussi (19.5) (20.1) (19.7) (19.7) (20.6) 20.0 20.1 Viqueque (24.3) (24.7) 24.5 (25.4) (25.2) 24.8 24.9
Education No education 23.2 23.5 23.3 22.6 24.0 23.3 23.3 Primary 21.1 22.5 23.2 21.3 23.0 22.2 22.7 Secondary 22.6 22.3 22.8 24.7 25.2 23.3 23.7 More than secondary (21.6) (23.2) (23.9) * * 23.2 23.8
Wealth quintile Lowest 21.9 21.5 22.2 23.4 24.3 22.7 22.8 Second 22.5 22.8 24.4 23.3 25.8 23.8 24.3 Middle 23.0 24.5 22.7 24.8 22.8 23.2 23.3 Fourth 22.5 23.3 23.3 22.5 22.3 22.8 22.9 Highest 21.4 21.2 23.3 23.6 24.0 22.6 23.1
Total 22.2 22.6 23.2 23.5 23.9 23.0 23.3
Note: Figures in parentheses are based on 25-49 unweighted cases. An asterisk indicates that a figure is based on fewer than 25 unweighted cases and has been suppressed. a = Omitted because less than 50 percent of the men had intercourse for the first time before reaching the beginning of the age group
6.5 RECENT SEXUAL ACTIVITY
In the absence of contraception, the probability of pregnancy is related to the frequency of intercourse. Therefore, information on sexual activity can be used to refine measures of exposure to the risk of pregnancy. All women and men were asked how long ago their last sexual activity occurred, and Tables 6.7.1 and 6.7.2 show the percent distribution of women and men by recent sexual activity. About half of women age 15-49 were sexually active in the four weeks before the survey, 12 percent had been sexually active in the year before the survey but not in the month prior to the interview, and 7 percent had not been sexually active for one or more years. Thirty-five percent of women had never had sexual intercourse.

86 | Other Proximate Determinants of Fertility
Table 6.7.1 Recent sexual activity: Women
Percent distribution of women age 15-49 by timing of last sexual intercourse, according to background characteristics, Timor-Leste 2009-10
Background characteristic
Timing of last sexual intercourse Never had
sexual intercourse Total
Number of women
Within the last 4 weeks
Within 1 year1
One or more years Missing
Age 15-19 5.1 2.7 0.7 0.1 91.4 100.0 3,144 20-24 32.7 12.0 4.5 0.2 50.6 100.0 2,343 25-29 58.4 17.6 7.1 0.3 16.6 100.0 1,897 30-34 69.3 16.0 8.0 0.5 6.2 100.0 1,534 35-39 70.0 17.4 7.7 0.0 4.8 100.0 1,684 40-44 70.2 14.5 11.3 0.2 3.9 100.0 1,388 45-49 64.5 15.5 17.0 0.3 2.8 100.0 1,146
Marital status Never married 0.1 0.2 0.4 0.1 99.1 100.0 4,675 Married or living together 75.5 19.5 4.8 0.3 0.0 100.0 7,906
Divorced/separated/ widowed 3.4 11.4 84.9 0.2 0.0 100.0 556
Marital duration2 0-4 years 67.3 26.5 5.8 0.4 0.0 100.0 1,426 5-9 years 74.2 20.5 5.1 0.1 0.0 100.0 1,605 10-14 years 78.2 17.2 4.1 0.5 0.0 100.0 1,550 15-19 years 80.4 15.6 3.9 0.1 0.0 100.0 1,391 20-24 years 77.0 18.1 4.8 0.1 0.0 100.0 1,043 25+ years 76.4 18.6 4.6 0.4 0.0 100.0 768 Married more than once 77.9 14.6 7.5 0.0 0.0 100.0 123
Residence Urban 47.2 9.6 6.0 0.5 36.6 100.0 3,439 Rural 45.0 13.2 6.8 0.1 34.8 100.0 9,698
District Aileu 45.3 7.7 5.2 0.3 41.5 100.0 554 Ainaro 52.8 8.1 4.2 0.3 34.5 100.0 619 Baucau 53.9 5.4 4.1 0.0 36.6 100.0 1,408 Bobonaro 44.7 13.6 5.2 0.0 36.5 100.0 1,262 Covalima 48.6 10.0 6.8 0.0 34.6 100.0 781 Dili 50.3 7.8 5.0 0.6 36.4 100.0 2,466 Ermera 22.6 27.9 11.3 0.0 38.2 100.0 1,542 Lautem 52.3 9.8 5.9 0.7 31.3 100.0 864 Liquiçá 43.3 11.0 7.7 0.1 37.9 100.0 801 Manatuto 37.6 15.6 8.5 0.1 38.3 100.0 603 Manufahi 54.9 9.9 5.3 0.3 29.6 100.0 470 Oecussi 55.3 11.3 6.5 0.1 26.8 100.0 884 Viqueque 39.8 18.1 10.5 0.2 31.4 100.0 882
Education No education 54.9 17.0 10.5 0.1 17.5 100.0 3,854 Primary 52.5 12.4 8.0 0.4 26.7 100.0 3,005 Secondary 36.3 9.2 3.4 0.2 50.9 100.0 5,829 More than secondary 41.3 10.6 5.2 0.0 43.0 100.0 449
Wealth quintile Lowest 48.4 12.5 8.2 0.1 30.8 100.0 2,314 Second 42.6 14.8 7.7 0.2 34.6 100.0 2,468 Middle 44.4 13.3 6.3 0.2 35.9 100.0 2,590 Fourth 43.8 12.8 5.7 0.1 37.7 100.0 2,687 Highest 48.5 8.9 5.5 0.5 36.6 100.0 3,077
Total 45.6 12.3 6.6 0.2 35.3 100.0 13,137
1 Excludes women who had sexual intercourse within the last 4 weeks2 Excludes women who are not currently married
The proportion of women who were sexually active during the four weeks before the survey
increases with age, from 5 percent at age 15-19 to about 70 percent by age 30-44, and decreases to 65 percent at age 45-49. Women who are currently in a union are much more likely to be sexually active in the four weeks preceding the survey than women who were formerly married or who have never been married. Women married for fewer than five years are less likely to be sexually active in the recent past than women married for longer durations. There is little difference in recent sexual activity among women who have been married more than once and women who have been married just once.
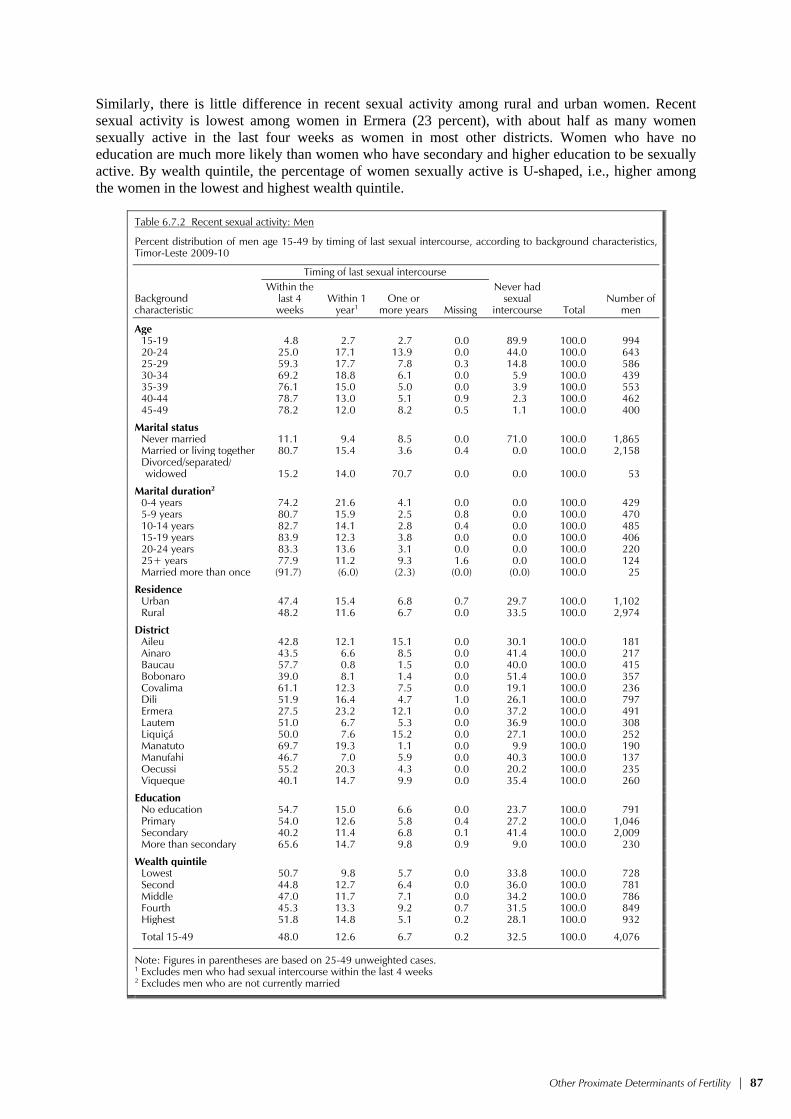
Other Proximate Determinants of Fertility | 87
Similarly, there is little difference in recent sexual activity among rural and urban women. Recent sexual activity is lowest among women in Ermera (23 percent), with about half as many women sexually active in the last four weeks as women in most other districts. Women who have no education are much more likely than women who have secondary and higher education to be sexually active. By wealth quintile, the percentage of women sexually active is U-shaped, i.e., higher among the women in the lowest and highest wealth quintile.
Table 6.7.2 Recent sexual activity: Men
Percent distribution of men age 15-49 by timing of last sexual intercourse, according to background characteristics, Timor-Leste 2009-10
Background characteristic
Timing of last sexual intercourse Never had
sexual intercourse Total
Number of men
Within the last 4 weeks
Within 1 year1
One or more years Missing
Age 15-19 4.8 2.7 2.7 0.0 89.9 100.0 994 20-24 25.0 17.1 13.9 0.0 44.0 100.0 643 25-29 59.3 17.7 7.8 0.3 14.8 100.0 586 30-34 69.2 18.8 6.1 0.0 5.9 100.0 439 35-39 76.1 15.0 5.0 0.0 3.9 100.0 553 40-44 78.7 13.0 5.1 0.9 2.3 100.0 462 45-49 78.2 12.0 8.2 0.5 1.1 100.0 400
Marital status Never married 11.1 9.4 8.5 0.0 71.0 100.0 1,865 Married or living together 80.7 15.4 3.6 0.4 0.0 100.0 2,158
Divorced/separated/ widowed 15.2 14.0 70.7 0.0 0.0 100.0 53
Marital duration2 0-4 years 74.2 21.6 4.1 0.0 0.0 100.0 429 5-9 years 80.7 15.9 2.5 0.8 0.0 100.0 470 10-14 years 82.7 14.1 2.8 0.4 0.0 100.0 485 15-19 years 83.9 12.3 3.8 0.0 0.0 100.0 406 20-24 years 83.3 13.6 3.1 0.0 0.0 100.0 220 25+ years 77.9 11.2 9.3 1.6 0.0 100.0 124 Married more than once (91.7) (6.0) (2.3) (0.0) (0.0) 100.0 25
Residence Urban 47.4 15.4 6.8 0.7 29.7 100.0 1,102 Rural 48.2 11.6 6.7 0.0 33.5 100.0 2,974
District Aileu 42.8 12.1 15.1 0.0 30.1 100.0 181 Ainaro 43.5 6.6 8.5 0.0 41.4 100.0 217 Baucau 57.7 0.8 1.5 0.0 40.0 100.0 415 Bobonaro 39.0 8.1 1.4 0.0 51.4 100.0 357 Covalima 61.1 12.3 7.5 0.0 19.1 100.0 236 Dili 51.9 16.4 4.7 1.0 26.1 100.0 797 Ermera 27.5 23.2 12.1 0.0 37.2 100.0 491 Lautem 51.0 6.7 5.3 0.0 36.9 100.0 308 Liquiçá 50.0 7.6 15.2 0.0 27.1 100.0 252 Manatuto 69.7 19.3 1.1 0.0 9.9 100.0 190 Manufahi 46.7 7.0 5.9 0.0 40.3 100.0 137 Oecussi 55.2 20.3 4.3 0.0 20.2 100.0 235 Viqueque 40.1 14.7 9.9 0.0 35.4 100.0 260
Education No education 54.7 15.0 6.6 0.0 23.7 100.0 791 Primary 54.0 12.6 5.8 0.4 27.2 100.0 1,046 Secondary 40.2 11.4 6.8 0.1 41.4 100.0 2,009 More than secondary 65.6 14.7 9.8 0.9 9.0 100.0 230
Wealth quintile Lowest 50.7 9.8 5.7 0.0 33.8 100.0 728 Second 44.8 12.7 6.4 0.0 36.0 100.0 781 Middle 47.0 11.7 7.1 0.0 34.2 100.0 786 Fourth 45.3 13.3 9.2 0.7 31.5 100.0 849 Highest 51.8 14.8 5.1 0.2 28.1 100.0 932
Total 15-49 48.0 12.6 6.7 0.2 32.5 100.0 4,076
Note: Figures in parentheses are based on 25-49 unweighted cases.1 Excludes men who had sexual intercourse within the last 4 weeks 2 Excludes men who are not currently married

88 | Other Proximate Determinants of Fertility
There is little difference in the proportion of men and women age 15-49 who have been sexually active in the past four weeks (48 percent compared with 46 percent). Thirteen percent of men had sexual intercourse in the year before the survey but not in the month prior to the survey, while 7 percent had not been sexually active for one year or more. One in three men said that they have never had sex. As with women, sexual activity among men increases with age and peaks between age 40-44. Men currently in a union are much more likely to be sexually active than those not currently in a union. There is little variation in current sexual activity by marital duration or urban-rural residence.
Regional variation for men shows similar patterns as for women. Recent sexual activity is lowest among men living in Ermera (28 percent) and highest among men living in Manatuto (70 percent).
In contrast to the pattern found for women, the proportion of men sexually active in the past four weeks is highest among those with more than secondary education. As with women, the relationship between recent sexual activity and wealth quintile is U-shaped.
6.6 POSTPARTUM AMENORRHEA, ABSTINENCE, AND INSUSCEPTIBILITY
Postpartum amenorrhea is the interval between the birth of a child and the resumption of menstruation, during which the risk of pregnancy is reduced. Postpartum protection from conception depends upon the intensity and duration of breastfeeding. Postpartum abstinence refers to the period of voluntary sexual inactivity after childbirth. A woman is considered insusceptible if she is not ex-posed to the risk of pregnancy, either be-cause she is amenorrheic or because she is abstaining from sexual intercourse following a birth. In the TLDHS, infor-mation was obtained about the duration of amenorrhea and the duration of sexual abstinence following childbirth for births in the three years preceding the survey.
Table 6.8 shows the percentage of births in the three years preceding the survey for which mothers were postpar-tum amenorrheic, abstaining, and insus-ceptible, by number of months since birth. The results show that Timorese women are amenorrheic for a median of 8.2 months, abstain for a median of 3.2 months, and are insusceptible to pregnancy for a median of 9.1 months. In general, the proportion of women who are amenorrheic or abstaining decreases with increasing months after delivery. The proportion who are amenorrheic drops from 97 percent in the first two months after birth to 25 percent at 12 to 13 months and 7 percent at 24 to 25 months after birth. The majority of Timorese women (93 percent) are still abstaining from sex in the first two months following birth. A comparison of data from the 2003 DHS indicates that the median duration of postpartum amenorrhea has increased from 7.3 months to 8.2 months, which may be partly explained by the increase in exclusive breastfeeding, which contributes to anovulation and amenorrhea.
Table 6.8 Postpartum amenorrhea, abstinence and insusceptibility
Percentage of births in the three years preceding the survey for which mothers are postpartum amenorrheic, abstaining, and insusceptible, by number of months since birth, and median and mean durations, Timor-Leste 2009-10
Months since birth
Percentage of births for which the mother is: Number of
births Amenorrheic Abstaining Insusceptible1
<2 96.7 92.7 97.7 2702-3 84.5 56.6 89.2 3334-5 73.5 31.7 76.7 3946-7 56.9 24.0 63.0 3108-9 48.9 18.4 54.9 33910-11 38.7 11.1 42.7 31312-13 24.9 7.7 27.4 32214-15 17.8 8.4 23.2 36116-17 13.5 6.4 17.1 30818-19 12.5 4.9 16.0 31120-21 7.0 4.6 11.2 29322-23 5.2 4.1 7.5 23924-25 6.5 2.7 7.5 33726-27 5.6 4.1 8.5 40728-29 5.1 4.2 7.4 38830-31 4.0 2.4 6.1 33832-33 1.9 2.7 4.4 30834-35 2.7 2.1 4.8 265
Total 28.2 15.6 31.5 5,836Median 8.2 3.2 9.1 naMean 10.4 6.1 11.6 na
Note: Estimates are based on status at the time of the survey. na = Not applicable 1 Includes births for which mothers are either still amenorrheic or still abstaining (or both) following birth

Other Proximate Determinants of Fertility | 89
Table 6.9 shows the median duration of postpartum amenorrhea, abstinence, and insusceptibility by background characteristics. The duration of postpartum insusceptibility is one month longer among women age 30-49 than among women age 15-29, is substantially longer among rural than urban women, and longer among women residing in Covalima than in the other districts. The duration of postpartum insusceptibility is also longer among women with no education than among those with some primary or secondary education, and twice as long among women from the lowest and second wealth quintiles as among women from the highest wealth quintile.
Table 6.9 Median duration of amenorrhea, postpartum abstinence, and postpartum insusceptibility
Median number of months of postpartum amenorrhea, postpartum abstinence, and postpartum insusceptibility following births in the three years preceding the survey, by background characteristics, Timor-Leste 2009-10
Background characteristic
Postpartumamenorrhea
Postpartumabstinence
Postpartuminsusceptibility1
Mother’s age 15-29 7.7 3.2 8.6 30-49 8.8 3.2 9.9
Residence Urban 5.0 2.3 5.7 Rural 9.1 3.6 9.8
District Aileu 7.7 (2.3) 8.0 Ainaro 9.3 (2.3) 9.4 Baucau 8.8 (2.4) 9.5 Bobonaro 7.0 2.6 7.8 Covalima 8.3 3.8 12.1 Dili 4.2 2.1 4.6 Ermera 11.2 7.0 11.7 Lautem 6.5 (2.2) 7.0 Liquiçá 10.8 2.9 11.6 Manatuto 8.3 5.4 9.5 Manufahi 10.0 3.4 10.2 Oecussi 10.5 4.4 10.7 Viqueque 9.0 (5.8) 9.6
Education No education 10.0 3.5 10.7 Primary 8.4 3.3 9.5 Secondary 7.2 3.1 8.3 More than secondary * * *
Wealth quintile Lowest 9.6 3.4 10.3 Second 9.9 3.5 10.2 Middle 8.1 3.3 9.0 Fourth 8.8 3.2 9.9 Highest 4.6 2.4 5.5
Total 8.2 3.2 9.1
Note: Medians are based on the status at the time of the survey (current status). Figures in parentheses are based on 25-49 unweighted cases. An asterisk indicates that a figure is based on fewer than 25 unweighted cases and has been suppressed. 1 Includes births for which mothers are either still amenorrheic or still abstaining (or both) following birth
6.7 MENOPAUSE
The risk of becoming pregnant declines with age. The term infecundity denotes a process rather than a well-defined event, and although the onset of infecundity is difficult to determine for an individual woman, there are ways of estimating it for a group of women. Table 6.10 presents data on menopause, an indicator of decreasing exposure to the risk of pregnancy (infecundity) for women age 30 and over.
In the context of the available survey data, women are considered menopausal if they are neither pregnant nor postpartum amenorrheic and have not had a menstrual period for at least six months preceding the survey. The proportion of women who are menopausal increases with age from

90 | Other Proximate Determinants of Fertility
2 percent among women age 30-34 to 37 percent among women age 48-49. Overall, 8 percent of women age 30-49 are menopausal, indicating a relatively low level of infecundity among Timorese women. The proportion of currently married women age 30-49, who are menopausal as reported in the 2003 DHS is 17 percent, more than double the proportion reported in the 2009-10 TLDHS.
Table 6.10 Menopause
Percentage of women age 30-49 who are menopausal, by age, Timor-Leste 2009-10
Age Percentage
menopausal1 Number of
women
30-34 1.9 1,534 35-39 2.5 1,684 40-41 8.0 641 42-43 9.7 518 44-45 11.4 487 46-47 18.4 448 48-49 36.5 439
Total 8.2 5,753
1 Percentage of all women who are not pregnant and not postpartum amenorrheic whose last menstrual period occurred six or more months preceding the survey

Fertility Preferences | 91
FERTILITY PREFERENCES 7
Information on fertility preferences can be useful in understanding future fertility patterns and demand for contraception. The data are also used to construct measures of unmet need for contraception and assessments of unwanted or mistimed births. Fertility preferences also help to evaluate the overall attitudes of women toward childbearing and the general course of fertility.
In the 2009-10 TLDHS, currently married women and men were asked about their fertility preferences, including their desire to have another child, the length of time they would like to wait before having another child, and what they consider to be their ideal number of children. These data make it possible to quantify fertility preferences and, in combination with the data on contraceptive use, permit estimation of the unmet need for family planning, for both spacing and limiting births. However, the interpretation of data on fertility preferences is controversial because respondents’ reported preferences are, in most cases, hypothetical, and do not take into consideration the influence of social pressure. Thus, preferences are subject to change and rationalization. Nevertheless, information on future reproductive intentions is of fundamental importance in the development of population policies and in refining and modifying existing family planning programs.
7.1 DESIRE FOR MORE CHILDREN
In the 2009-10 TLDHS, currently married women and men were asked whether they want to have another child, and if so, how soon. The same question was phrased differently in the case of pregnant women or men whose wife or wives were pregnant at the time of the interview to ensure that they were asked not about the current pregnancy but rather about the desire for subsequent children.
Table 7.1 shows future reproductive intentions of currently married women and men by the number of living children. Nine percent of women want to have another child soon (within two years), and 35 percent want another child two or more years later. This compares with 11 percent in the 2003 DHS. Another 35 percent want no more children, and about 1 percent have been sterilized. The total of women who either want to delay their next child or have no more children is therefore 70 percent, which contrasts greatly with the 22 percent who are currently taking contraceptives. This indicates an enormous opportunity to reach these women with contraceptive methods that match their needs and desires.
The desire to stop childbearing—including those already sterilized—increases with the number of living children—from 2 percent among women with no children to 67 percent among women with six or more children. The proportion of currently married women who want no more children more than doubled in the last seven years, from 17 percent as reported in the 2003 DHS to 36 percent in the 2009-10 TLDHS. Presumably women who want no more children would benefit from increased awareness of long-term contraceptive methods and sterilization options. The great majority of these women are either taking no contraceptives or are still choosing injectables, which require administration every three months or more frequently. Asking these women to regularly access services appears to impose an unnecessary burden on them when longer-term and more permanent methods are available.
Men’s reproductive intentions differ somewhat from those of women in the same age group. Men are more likely than women (15 percent compared with 9 percent) to want another child soon. On the other hand, there is only a small difference in their desire to want another child later (39 percent compared with 35 percent). Women are much more likely to want to limit childbearing than men, however. More than one in three women want no more children or are sterilized (36 percent) compared with about one in four men (23 percent), and this difference is consistent at all parities.

92 | Fertility Preferences
Table 7.1 Fertility preferences by number of living children
Percent distribution of currently married women and currently married men age 15-49 by desire for children, according to number of living children, Timor-Leste 2009-10
Desire for children
Number of living children Total 15-49 0 1 2 3 4 5 6+
WOMEN1
Have another soon2 27.7 15.7 10.9 11.5 6.9 4.7 2.0 8.6 Have another later3 4.3 60.0 54.8 47.1 35.9 26.6 12.7 35.1
Have another,
undecided when 2.1 2.2 1.7 1.1 0.6 1.1 0.7 1.2 Undecided 21.9 14.7 17.7 17.4 15.8 17.3 16.8 16.9 Want no more 2.2 5.4 13.2 21.0 38.9 48.4 65.4 34.8 Sterilized4 0.0 0.2 0.3 0.7 0.9 0.9 1.4 0.8 Declared infecund 41.7 1.8 1.4 1.3 0.9 1.1 0.9 2.8 Missing 0.2 0.0 0.0 0.0 0.0 0.0 0.0 0.0
Total 100.0 100.0 100.0 100.0 100.0 100.0 100.0 100.0 Number 303 942 1,159 1,277 1,227 977 2,022 7,906
MEN5
Have another soon2 44.9 19.6 16.9 14.9 14.5 8.3 8.1 14.7 Have another later3 6.5 53.6 50.1 47.3 39.9 33.8 22.6 38.7
Have another,
undecided when 2.8 2.8 3.9 2.5 1.0 0.4 1.4 2.0 Undecided 17.4 15.8 16.5 17.3 21.9 24.0 25.6 20.3 Want no more 0.7 7.3 11.5 16.5 20.6 31.9 40.7 21.8 Sterilized4 0.0 0.9 1.1 1.0 1.2 0.4 1.7 1.1 Declared infecund 27.7 0.0 0.0 0.5 0.9 1.1 0.0 1.5 Missing 0.0 0.0 0.0 0.0 0.0 0.0 0.0 0.0
Total 100.0 100.0 100.0 100.0 100.0 100.0 100.0 100.0 Number 87 270 343 381 346 253 479 2,158
1 The number of living children includes current pregnancy for women.2 Wants next birth within 2 years 3 Wants to delay next birth for 2 or more years 4 Includes both female and male sterilization 5 The number of living children includes one additional child if respondent's wife is pregnant (or if any wife is pregnant for men with more than one current wife).
7.2 DESIRE TO LIMIT CHILDBEARING BY BACKGROUND CHARACTERISTICS
Tables 7.2.1 and 7.2.2 show the desire to limit childbearing among currently married women and men by background characteristics. Urban women are more likely to want to limit childbearing than rural women. Differences by district in the desire to limit childbearing range from a low of 20 percent in Ainaro to a high of 48 percent in Oecussi. Overall, the desire to limit childbearing is higher among women with no education than among those with any level of education. This is true even taking into account the difference in fertility among women with different levels of education. For example, among women with one child, 16 percent of women with no education want no more children compared with 4 percent or less of women with some education. Among women with four or more children, the difference in desire to limit childbearing by education is small. Women living in the wealthiest households are more likely to want to limit childbearing than women in other households.
A similar pattern is seen among men in the desire to limit childbearing by urban-rural residence, education, and wealth quintile, although the differences are smaller. The pattern by district differs somewhat, with men in Lautem and Ainaro least likely to want to limit the number of children and men in Covalima and Manatuto most likely. Given that men in Covalima and Manatuto had the greatest exposure to family planning messages, there appears to be an association between exposure to family planning messages and men’s desire to limit the number of children.

Fertility Preferences | 93
Table 7.2.1 Desire to limit childbearing: Women
Percentage of currently married women age 15-49 who want no more children, by number of living children, according to background characteristics, Timor-Leste 2009-10
Background characteristic
Number of living children1
Total 0 1 2 3 4 5 6+
Residence Urban 3.3 5.2 19.0 23.0 56.2 61.6 78.8 40.6 Rural 1.9 5.8 11.5 21.0 33.8 45.7 63.6 33.8
District Aileu * 9.2 10.1 22.9 25.9 43.6 65.9 36.0 Ainaro * 2.0 6.7 1.6 22.4 23.6 39.6 19.7 Baucau (4.3) 4.0 24.3 21.8 45.9 59.5 74.2 43.4 Bobonaro * 5.3 10.4 18.9 28.0 34.6 54.6 26.9 Covalima * 8.3 18.2 26.4 46.7 55.4 80.9 38.4 Dili (4.1) 5.6 20.9 25.8 65.8 67.2 80.2 42.7 Ermera (0.0) 8.1 4.1 17.7 22.5 41.9 57.6 31.4 Lautem * 3.3 0.0 3.8 27.3 34.5 68.5 29.9 Liquiçá (0.0) 6.1 6.9 24.7 19.7 31.6 60.8 30.2 Manatuto (3.5) 8.6 9.2 28.1 45.8 69.5 91.1 45.4 Manufahi * 7.6 9.2 20.9 29.6 60.6 56.0 29.4 Oecussi * 4.5 23.7 30.9 54.0 64.6 84.4 47.7 Viqueque (3.9) 1.9 7.6 20.6 15.6 37.7 54.6 25.6
Education No education 3.9 15.9 19.1 30.9 38.8 50.7 68.0 44.9 Primary 0.0 3.9 11.5 16.9 39.0 46.9 67.9 36.7 Secondary 1.9 2.2 10.8 17.0 40.4 47.5 61.6 25.6 More than secondary * (3.1) (17.9) (37.7) * * * 27.3
Wealth quintile Lowest 1.9 7.2 9.2 18.3 30.2 41.0 63.3 34.5 Second 1.7 3.7 12.2 18.1 35.5 46.9 60.3 33.1 Middle 3.7 7.7 9.1 22.8 31.1 43.1 64.8 32.9 Fourth 0.0 3.3 14.8 19.3 36.6 49.5 68.7 34.0 Highest 2.9 6.6 20.5 26.5 57.5 66.6 79.3 42.1
Total 2.2 5.6 13.5 21.6 39.8 49.2 66.8 35.6
Note: Women who have been sterilized are considered to want no more children. Figures in parentheses are based on 25-49 unweighted cases. An asterisk indicates that a figure is based on fewer than 25 cases and has been suppressed. 1 The number of living children includes the current pregnancy.
Table 7.2.2 Desire to limit childbearing: Men
Percentage of currently married men age 15-49 who want no more children, by number of living children, according to background characteristics, Timor-Leste 2009-10
Background characteristic
Number of living children1
Total 0 1 2 3 4 5 6+
Residence Urban * 4.3 23.2 18.9 29.3 36.9 53.6 25.9 Rural 0.8 10.1 8.1 16.8 19.1 31.2 39.7 21.8
District Aileu * * (14.0) * * (43.1) (57.0) 30.5 Ainaro * * * * (10.7) * * 8.6 Baucau * * (8.1) (10.9) (21.4) * (37.9) 20.5 Bobonaro * * * (19.0) * * (42.6) 23.4 Covalima * * * (44.0) * * (64.4) 44.8 Dili * (3.1) (25.2) (19.1) (33.6) * (64.2) 28.1 Ermera * * * * * * (16.4) 10.0 Lautem * * * * (15.9) (6.4) (14.1) 7.3 Liquiçá * (11.1) (6.7) (7.1) * * 51.8 23.1 Manatuto * * (6.8) (42.3) * (72.2) 83.8 44.4 Manufahi * * * * * * * 15.3 Oecussi * * * (22.1) (11.5) (33.8) (79.6) 29.3 Viqueque * * * * (18.0) * (38.1) 18.2
Education No education * 9.9 17.3 21.2 22.7 22.9 37.4 23.7 Primary * 12.7 6.8 21.6 16.2 32.2 46.0 25.1 Secondary (0.0) 4.0 13.2 13.6 25.2 35.8 42.2 21.0 More than secondary * * * (15.5) * * * 20.4
Wealth quintile Lowest * (3.6) 6.2 15.6 11.0 23.1 43.9 21.0 Second * 10.7 4.8 10.3 21.8 12.6 31.8 16.6 Middle * 9.1 12.3 14.0 24.4 34.9 31.2 20.5 Fourth * 9.1 9.3 27.6 15.8 43.1 46.1 25.2 Highest * (7.1) 23.6 18.3 36.8 (47.6) 67.5 29.5
Total 15-49 0.7 8.2 12.6 17.5 21.8 32.3 42.4 22.8
Note: Men who have been sterilized or who state in response to the question about desire for children that their wife has been sterilized are considered to want no more children. Figures in parentheses are based on 25-49 unweighted cases. An asterisk indicates that a figure is based on fewer than 25 cases and has been suppressed. 1 The number of living children includes one additional child if respondent's wife is pregnant (or if any wife is pregnant for men with more than one current wife).

94 | Fertility Preferences
7.3 NEED FOR FAMILY PLANNING SERVICES
Data in this section provide information on the extent of need and the potential demand for family planning services in Timor-Leste. Currently married fecund women who want to postpone their next birth for two or more years or who want to stop childbearing altogether but are not using a contraceptive method are considered to have an unmet need for family planning. Pregnant women are considered to have an unmet need for spacing or limiting if their pregnancy was mistimed or unwanted. Similarly, amenorrheic women who are not using family planning and whose last birth was mistimed are considered to have an unmet need for spacing. Those whose last child was unwanted have an unmet need for limiting. Women who are currently using a family planning method are said to have a met need for family planning. The total demand for family planning services comprises those who fall in the met need and unmet need categories.
Table 7.3 shows the need for family planning among currently married women by background characteristics. About one in three currently married women has an unmet need for family planning, with 21 percent having an unmet need for spacing and 10 percent having an unmet need for limiting. Twenty-two percent of women have a met need for family planning. If all currently married women who say they want to space or limit their children were to use a family planning method, the contraceptive prevalence rate would increase to 53 percent from the current 22 percent. Currently, only 42 percent of the family planning needs of currently married women are being met.
There has been a seven-fold increase in unmet need for family planning over the past seven years, with unmet need rising from 4 percent in 2003 to 31 percent in 2009-10. Correspondingly, there has been an increase in met need over the same period, from 9 percent in 2003 to 22 percent in 2009-10, resulting in a four-fold increase in total demand for family planning (13 percent to 53 percent). However, the percentage of demand satisfied declined by 44 percent over the same period, from 75 percent to 42 percent. This indicates that despite the very significant scaling up of family planning services, growth in demand for services has been even stronger. An acceleration of the scaling up of contraceptive service provision is called for. However, it should be noted that the calculation of unmet need differed slightly between the 2003 and 2009-10 surveys, and, therefore, the numbers are not strictly comparable.
With the exception of women in the youngest and oldest age groups, overall unmet need varies little with age. However, the need for spacing does decrease with age, from 34 percent among women age 20-24 to 5 percent among women age 45-49. On the other hand, the unmet need for limiting increases with age, from 1 percent among women age 20-24 to 19 percent among women age 40-44, and then falls to 16 percent among women in the oldest age group. Overall, unmet need varies little by urban-rural residence; however, while the unmet need for spacing is greater among rural than urban women (22 percent compared with 18 percent), the unmet need for limiting is lower among rural than urban women (10 percent compared with 12 percent). The proportion of urban women’s total demand that is satisfied is higher than that of rural women (51 percent compared with 38 percent). Women in Covalima are least likely to have an unmet need for family planning (17 percent), and women in Ainaro are most likely (43 percent).
With the exception of women with more than secondary education, who are least likely to have an unmet need for family planning (25 percent), there is little difference in unmet need among the other educational groups. In general, there is an inverse relationship between unmet need and wealth, with unmet need declining from 35 percent among women in the poorest households to 28 percent among women in the richest households.

Fertility Preferences | 95
Table 7.3 Need and demand for family planning among currently married women
Percentage of currently married women age 15-49 with unmet need for family planning, percentage with met need for family planning, the total demand for family planning, and the percentage of the demand for contraception that is satisfied, by background characteristics, Timor-Leste 2009-10
Background characteristic
Unmet need for family planning1
Met need for family planning (currently using)2
Total demand for family planning Percentage
of demand satisfied
Number of
women For
spacing For
limiting Total For
spacing For
limiting Total For
spacing For
limiting Total
Age 15-19 26.6 0.2 26.9 7.6 0.2 7.9 34.2 0.5 34.7 22.6 243 20-24 33.5 1.1 34.6 14.3 1.5 15.7 47.7 2.6 50.3 31.2 1,100 25-29 27.5 4.4 32.0 20.7 3.1 23.8 48.2 7.5 55.8 42.7 1,516 30-34 22.0 9.0 31.0 16.6 11.3 27.8 38.6 20.3 58.9 47.3 1,362 35-39 18.9 14.6 33.5 12.2 14.7 27.0 31.2 29.3 60.4 44.6 1,514 40-44 11.5 19.2 30.7 5.6 19.0 24.6 17.1 38.1 55.3 44.5 1,211 45-49 4.9 16.1 21.0 1.3 12.0 13.2 6.1 28.1 34.2 38.7 960
Residence Urban 17.6 11.6 29.2 16.5 13.9 30.4 34.1 25.4 59.5 51.0 2,025 Rural 21.5 9.8 31.3 11.0 8.6 19.6 32.5 18.3 50.9 38.4 5,881
District Aileu 21.6 8.5 30.1 11.0 9.7 20.7 32.6 18.2 50.8 40.8 299 Ainaro 37.5 5.9 43.4 8.9 5.2 14.1 46.4 11.1 57.4 24.5 382 Baucau 19.1 15.7 34.8 3.6 4.5 8.0 22.7 20.1 42.8 18.8 852 Bobonaro 32.7 9.0 41.6 13.3 7.1 20.4 46.0 16.1 62.1 32.9 739 Covalima 11.4 5.9 17.3 24.9 18.9 43.8 36.2 24.9 61.1 71.7 458 Dili 16.0 13.0 29.0 17.9 15.2 33.2 34.0 28.2 62.2 53.3 1,459 Ermera 16.1 6.7 22.9 12.4 6.4 18.8 28.5 13.1 41.6 45.1 881 Lautem 19.5 8.8 28.3 8.0 9.6 17.7 27.6 18.4 46.0 38.5 541 Liquiçá 21.4 7.6 29.0 14.0 10.5 24.5 35.4 18.1 53.5 45.8 460 Manatuto 13.8 13.4 27.1 11.1 9.7 20.7 24.8 23.0 47.9 43.3 353 Manufahi 15.9 6.6 22.4 16.3 9.0 25.3 32.1 15.6 47.7 53.0 319 Oecussi 23.9 16.0 39.8 9.9 14.2 24.1 33.8 30.1 63.9 37.7 603 Viqueque 24.2 7.0 31.2 7.5 5.6 13.1 31.6 12.6 44.2 29.6 559
Education No education 18.6 12.3 31.0 7.1 8.8 15.9 25.7 21.1 46.8 33.9 2,909 Primary 20.0 10.4 30.4 13.0 12.8 25.8 33.0 23.2 56.2 46.0 2,027 Secondary 23.0 8.3 31.3 16.8 8.9 25.7 39.8 17.2 57.0 45.1 2,739 More than secondary 19.9 5.5 25.4 21.6 11.2 32.8 41.5 16.7 58.2 56.3 231
Wealth quintile Lowest 23.0 12.0 35.0 8.3 6.7 15.0 31.3 18.8 50.0 30.0 1,467 Second 21.0 9.2 30.1 8.8 7.6 16.4 29.7 16.8 46.5 35.2 1,487 Middle 23.8 9.8 33.5 10.5 7.5 18.0 34.3 17.3 51.5 34.9 1,559 Fourth 20.4 7.6 28.0 14.5 10.9 25.3 34.8 18.5 53.3 47.5 1,571 Highest 15.6 12.3 27.9 18.5 15.7 34.2 34.1 28.0 62.1 55.1 1,821
Total 20.5 10.2 30.8 12.4 9.9 22.3 32.9 20.2 53.1 42.1 7,906
1 Unmet need for spacing: Includes women who are fecund and not using family planning and who say they want to wait two or more years for their next birth, or who say they are unsure whether they want another child, or who want another child but are unsure when to have the child. In addition, unmet need for spacing includes pregnant women whose current pregnancy was mistimed, or whose last pregnancy was unwanted but who now say they want more children. Unmet need for spacing also includes amenorrheic women whose last birth wasmistimed, or whose last birth was unwanted but who now say they want more children. Unmet need for limiting: Includes women who are fecund and not using family planning and who say they do not want another child. In addition, unmet need for limiting includes pregnant women whose current pregnancy was unwanted but who now say they do not want more children or who are undecided whether they want another child. Unmet need for limiting also includes amenorrheic women whose last birth was unwanted but who now say they do not want more children or who are undecided whether they want another child. 2 Using for spacing is defined as women who are using some method of family planning and who say they want to have another child or are undecided whether to have another. Using for limiting is defined as women who are using some method of family planning and who say they want no more children. Note that the specific methods used are not taken into account here.
7.4 IDEAL FAMILY SIZE
In the TLDHS, ideal family size was measured in two ways. Respondents who did not have any children were asked the number of children they would like to have if they could choose the exact number to have, and respondents who had living children were asked how many children they would like to have if they could go back to the time when they did not have any children and choose exactly the number of children to have. Even though these questions are based on hypothetical situations, they provide two measures. First, for men and women who have not yet started a family, the data provide

96 | Fertility Preferences
an idea of future fertility. Second, for older, high-parity women, the excess of past fertility over the ideal family size provides a measure of unwanted fertility.
Responses to these questions for both women and men are presented in Table 7.4. Almost all women and men were able to provide a numeric response to these questions, with only 4 percent of women and 3 percent of men providing a non-numeric response. In contrast, the 2003 DHS reported that 20 percent of women gave a non-numeric response.
Table 7.4 Ideal number of children
Percent distribution of women and men age 15-49 by ideal number of children, and mean ideal number of children for all respondents and for currently married respondents, according to number of living children, Timor-Leste 2009-10
Ideal number of children
Number of living children Total 0 1 2 3 4 5 6+
WOMEN1
0 3.7 0.3 0.1 0.1 0.1 0.4 0.6 1.6 1 0.2 1.9 0.0 0.0 0.0 0.3 0.1 0.3 2 19.5 10.3 9.4 3.4 3.1 1.6 0.8 10.1 3 8.0 7.3 5.5 9.5 2.2 1.6 1.4 5.7 4 36.7 41.8 38.6 29.3 29.4 9.5 6.9 28.9 5 8.7 10.8 13.2 14.2 13.7 21.2 5.2 10.8 6+ 18.3 24.3 30.6 41.5 49.0 61.4 80.4 38.7 Non-numeric responses 4.9 3.3 2.6 2.0 2.5 4.1 4.6 3.9
Total 100.0 100.0 100.0 100.0 100.0 100.0 100.0 100.0 Number 5,008 1,090 1,262 1,346 1,290 1,028 2,113 13,137
Mean ideal number
children for:2 All 3.9 4.4 4.7 5.1 5.4 6.2 7.2 5.0 Number 4,760 1,055 1,229 1,319 1,258 985 2,015 12,622
Currently married 4.6 4.5 4.8 5.1 5.4 6.2 7.2 5.7 Number 288 919 1,132 1,251 1,197 940 1,926 7,654
MEN3
0 6.2 0.9 0.0 0.0 0.0 0.0 0.0 3.0 1 0.2 0.2 0.0 0.5 0.0 0.0 0.0 0.1 2 12.5 7.0 7.1 1.1 0.7 0.8 0.5 7.4 3 9.8 7.6 2.8 5.5 0.2 1.3 0.1 6.1 4 34.5 41.4 42.6 24.2 21.1 11.8 7.3 28.9 5 13.5 9.1 15.2 24.8 15.2 20.7 4.5 13.9 6+ 19.6 31.6 30.8 42.6 60.8 62.4 84.6 37.6 Non-numeric responses 3.9 2.2 1.5 1.2 2.0 3.0 3.0 3.0
Total 100.0 100.0 100.0 100.0 100.0 100.0 100.0 100.0 Number 1,961 282 348 394 349 255 486 4,076
Mean ideal number
children for:2 All 4.1 4.7 4.8 5.4 5.9 6.1 7.4 5.0 Number 1,885 276 343 389 342 247 472 3,954
Currently married 4.1 4.8 4.9 5.4 5.9 6.1 7.4 5.8 Number 87 264 338 378 339 246 464 2,115
1 The number of living children includes current pregnancy for women.2 Means are calculated by excluding respondents who gave non-numeric responses. 3 The number of living children includes one additional child if respondent's wife is pregnant (or if any wife is pregnant for men with more than one current wife).
There is little difference between women and men in the overall mean ideal number of
children they prefer. All women and men express a desire for five children. Currently married women and men prefer about six children, however. Data from the 2003 DHS show that the ideal number of children preferred by currently married women has changed little over the last seven years. Two in five women and men prefer an ideal family size of six children or more, while three in ten prefer 4 children. One-tenth of women express a preference for either two children or five children, with fewer men favoring two children over five children. There has been little change in the mean ideal number of children preferred over the last seven years.

Fertility Preferences | 97
Table 7.4 shows that the mean ideal family size increases with the number of living children among both women and men, rising from 4 children among respondents with no children to just over 7 children among respondents with six or more children, indicating the positive association between actual and ideal number of children. This positive association between actual and ideal number of children could be due to two factors. First, to the extent that women are able to implement their fertility desires, women who want larger families will tend to achieve larger families. Second, some women may have difficulty admitting their desire for fewer children if they could begin childbearing again and may in fact report their actual number as their preferred number.
Table 7.5 shows the mean ideal number of children for all women age 15-49 by background characteristics. The mean ideal number of children increases with age, ranging from a low of 3.9 children among women age 15-19 to a high of 6.1 children among women age 45-49. In the 2003 DHS the corresponding figures were 4.8 children for women age 15-19 and 5.8 for women age 45-49. This preference for fewer children in the youngest cohort may foretell an emerging shift in ideal family size preferences.
The mean ideal number of children is higher in rural than in urban areas. The mean ideal number of children is lowest among women in Dili (4.3) and highest among women Ainaro (6.5).
The mean ideal number of children varies inversely with education, with a nearly two-child difference between women with no education (5.8) and women with more than secondary education (3.9). The mean ideal number of children varies inversely with wealth, from 5.4 among women in the lowest quintile to 4.3 among women in the highest wealth quintile.
7.5 FERTILITY PLANNING
Information collected from the TLDHS can also be used to estimate the level of unwanted fertility. Moreover, this information provides some insight into the degree to which couples are able to control fertility. Women age 15-49 were asked a series of questions about each child born to them in the preceding five years, as well as any current pregnancy, to determine whether the birth or pregnancy was wanted then, wanted later (mistimed), or not wanted at all (unwanted) at the time of conception. In assessing these results, it is important to recognize that women may declare a previously unwanted birth or current pregnancy as wanted, and this rationalization may in fact result in an underestimate of the true extent of unwanted births.
Table 7.6 shows the percent distribution of births (including current pregnancy) in the five years preceding the survey by planning status of the birth, and according to birth order and age of mother at birth. According to the data, 86 percent of births in the five years preceding the survey were wanted then, 12 percent were mistimed, and 2 percent were unwanted. In general, the proportion of unwanted births increases with birth order. Four percent of births of order four and higher and one percent of births of order three are unwanted. Mistimed births are most common at parity level two. Data from the 2003 DHS show that there has been little change in the planning status of children, with 86 percent of births in the five years preceding the survey planned and 11 percent mistimed. Unwanted births declined from 4 percent in 2003 to 2 percent in 2009-10.
Table 7.5 Mean ideal number of children
Mean ideal number of children for all women age 15-49 by background characteristics, Timor-Leste 2009-10
Background characteristic Mean
Number of
women1
Age 15-19 3.9 2,98820-24 4.4 2,27125-29 5.0 1,84630-34 5.5 1,48635-39 5.9 1,61640-44 6.0 1,33445-49 6.1 1,080
Residence Urban 4.4 3,204Rural 5.2 9,417
District Aileu 5.3 543Ainaro 6.5 552Baucau 4.8 1,391Bobonaro 5.2 1,247Covalima 4.6 739Dili 4.3 2,322Ermera 5.8 1,534Lautem 5.6 806Liquiçá 4.8 755Manatuto 4.5 586Manufahi 4.9 450Oecussi 4.5 855Viqueque 5.4 843
Education No education 5.8 3,726Primary 5.2 2,891Secondary 4.4 5,575More than secondary 3.9 429
Wealth quintile Lowest 5.4 2,232Second 5.3 2,397Middle 5.2 2,504Fourth 5.0 2,578Highest 4.3 2,910
Total 5.0 12,622
1 Number of women who gave a numeric response

98 | Fertility Preferences
The percentage of unwanted births also increases with the mother’s age at birth, rising from a low of less than 1 percent among mothers below 30 years of age at birth to a high of 12 percent among mothers age 45-49 at birth. Mistimed births are generally more common among younger mothers (<34 years) than among older mothers (35-49 years).
Table 7.6 Fertility planning status
Percent distribution of births to women 15-49 in the five years preceding the survey (including current pregnancies), by planning status of the birth, according to birth order and mother’s age at birth, Timor-Leste 2009-10
Birth order and mother’s age at birth
Planning status of birth
Total Number of
births
Wanted
then Wanted
later Wanted no
more Missing
Birth order 1 92.7 6.8 0.3 0.1 100.0 1,836 2 83.1 16.4 0.3 0.2 100.0 1,695 3 84.9 14.3 0.8 0.1 100.0 1,594 4+ 85.0 11.2 3.7 0.1 100.0 5,602
Mother’s age at birth <20 88.2 11.1 0.4 0.3 100.0 810 20-24 85.7 13.7 0.4 0.2 100.0 2,621 25-29 86.7 12.6 0.7 0.1 100.0 2,533 30-34 85.5 11.5 2.8 0.2 100.0 2,266 35-39 86.5 9.3 4.2 0.0 100.0 1,692 40-44 82.5 9.7 7.7 0.0 100.0 655 45-49 82.8 5.7 11.5 0.0 100.0 149
Total 86.0 11.7 2.2 0.1 100.0 10,727
The extent of unwanted births can also be
estimated using information on ideal family size to calculate what the total fertility rate would be if all unwanted births were avoided. This measure also may be an underestimate to the extent that women may not report an ideal family size lower than their actual family size. Table 7.7 shows total wanted fertility rates and actual fertility rates, by background characteristics. Total wanted fertility rates are calculated in the same way as the total fertility rate but exclude unwanted births from the numerator. In this case, unwanted births are those that exceed the number mentioned as ideal by the respondent. This rate represents the level of fertility that would have prevailed in the three years preceding the survey if all unwanted births had been avoided.
Table 7.7 shows that women on average have about half a child more than the wanted number of 5.1 children. The observed total fertility rate is 17 percent higher than the wanted total fertility rate in urban areas, and is 11 percent higher in rural areas. There is a one-child difference between wanted and actual fertility in the district of Oecussi, and there is a slightly less than one-child difference in Liquiçá and Manufahi, with smaller differences in the other districts. The gap between wanted and observed fertility is widest among women with primary education and among women in the lowest wealth quintile.
Table 7.7 Wanted fertility rates
Total wanted fertility rates and total fertility rates for the three years preceding the survey, by background characteristics, Timor-Leste 2009-10
Background characteristic
Total wanted fertility rates
Total fertility rate
Residence Urban 4.2 4.9Rural 5.4 6.0
District Aileu 5.0 5.6Ainaro 6.9 7.2Baucau 5.3 5.5Bobonaro 5.6 6.0Covalima 4.1 4.4Dili 3.8 4.6Ermera 5.9 6.6Lautem 5.9 6.7Liquiçá 4.6 5.5Manatuto 5.3 5.5Manufahi 5.0 5.9Oecussi 5.6 6.6Viqueque 5.4 5.6
Education No education 5.6 6.1Primary 5.8 6.5Secondary 4.7 5.2More than secondary 2.7 2.9
Wealth quintile Lowest 6.6 7.3Second 5.4 6.0Middle 5.7 6.1Fourth 4.8 5.3Highest 3.6 4.2
Total 5.1 5.7
Note: Rates are calculated based on births to women age 15-49 in the period 1 to 36 months preceding the survey. The total fertility rates are the same as those presented in Table 4.2.

Infant and Child Mortality | 99
INFANT AND CHILD MORTALITY 8
Infant and child mortality rates are the basic indicators of a country’s socioeconomic development and quality of life as well as the specific measures of its health status. Measures of childhood mortality have value in population projections and show the progress of health programs and policies. Variations in mortality by demographic characteristics, such as sex and age, and by socioeconomic characteristics, such as urban-rural residence, district, mother’s education, and household wealth, serve to highlight those factors that most influence child survival. Analysis of mortality measures helps identify promising directions for health and nutrition programs and improves the overall odds of children surviving to adulthood.
This chapter presents estimates of levels, trends, and differentials in neonatal, postneonatal, infant, child, and under-5 mortality in Timor-Leste. The data for mortality estimates were collected through the birth history section of the Woman’s Questionnaire. Women of reproductive age (15-49) were asked a series of questions on the number of biological sons and daughters living with them, the number living elsewhere, and the number who have died. In addition, for each live birth, women were asked to provide information on sex, date of birth, whether the birth was single or multiple, and survival status of the child. Current age was collected for living children, and age at death was collected for children who died.
8.1 DEFINITION, DATA QUALITY, AND METHODOLOGY
Childhood mortality estimates in DHS surveys measure the risk of dying from birth through age 5. The rates of childhood mortality presented in this chapter are defined as follows:
Neonatal mortality (NN): the probability of dying between birth and the first month of life
Postneonatal mortality (PNN): the difference between infant and neonatal mortality
Infant mortality (1q0): the probability of dying between birth and exact age 1
Child mortality (4q1): the probability of dying between exact age 1 and exact age 5
Under-5 mortality (5q0): the probability of dying between birth and exact age 5.
All rates are expressed per 1,000 live births, except child mortality, which is expressed per 1,000 children surviving to age 12 months.
Information on stillbirths and deaths that occurred within seven days of birth is used to estimate perinatal mortality, which is the number of stillbirths and early neonatal deaths per 1,000 stillbirths and live births.
8.2 ASSESSMENT OF DATA QUALITY
The accuracy of mortality estimates depends on the sampling variability of the estimates and on nonsampling errors. Sampling variability and sampling errors are discussed in detail in Appendix C. Nonsampling errors depend on the extent to which the date of birth and age at death are accurately reported and recorded and the completeness with which child deaths are reported. Omission of births and deaths affects mortality estimates, displacement of birth and death dates influences mortality trends, and misreporting of age at death may distort the age pattern of mortality. Typically, the most serious source of nonsampling errors in a survey that collects retrospective information on births and deaths is the underreporting of births and deaths of children who were dead at the time of the survey. It may be that mothers are reluctant to talk about their dead children because of the sorrow associated

100 | Infant and Child Mortality
with their death, or they may live in a culture that discourages discussion of the dead. The possible occurrence of these data problems in the 2009-10 TLDHS is discussed with reference to the data quality tables in Appendix C. Underreporting of births and deaths is generally more common the further back in time an event has occurred.
An unusual pattern in the distribution of births by calendar years is an indication of omission of children or age displacement. In the TLDHS, the cutoff date for asking health questions was January 2004. Table C.4 shows that the overall percentage of births for which a month and year of birth was reported is almost 100 percent for both children who have died and children who are alive. Table C.4 shows some age displacement across this boundary for both living and dead children. The distribution of living children and the total number of children shows a deficit in 2004 and an excess in 2003, as denoted by the calendar year ratios. The deficit in 2004 can be attributed to the transference of births by interviewers out of the period for which health data were collected. Transference is proportionately higher for dead children than for living children, and this displacement may affect mortality rates. The transference of children, especially deceased children, out of the five-year period preceding the survey is likely to result in an underestimate of the true level of childhood mortality for that period.
Underreporting of deaths is usually assumed to be more common for deaths that occur very early in infancy. Omission of deaths or misclassification of deaths as stillbirths may also be more common among women who have had several children or in cases where death took place a long time ago. To assess the impact of omission on measures of child mortality, two indicators are used: (1) the percentage of deaths that occurred within seven days of birth to the number that occurred within one month of birth and (2) the percentage of neonatal to infant deaths. It is hypothesized that omission will be more prevalent for those who died immediately after birth than for those who lived longer, and that it will be more common for events that took place in the distant past compared with those that took place in the more recent past. Table C.5 shows data on age at death for early infant deaths. Selective underreporting of early neonatal deaths would result in an abnormally low ratio of deaths within the first seven days of life to all neonatal deaths. Early infant deaths have not been greatly underreported in the TLDHS survey, as suggested by the high ratio of deaths in the first seven days of life to all neonatal deaths (76 percent in the five years preceding the survey).
Heaping of the age at death on certain digits is another problem that is inherent in most retrospective surveys. Misreporting of age at death biases age pattern estimates of mortality if the net result is the transference of deaths between age segments for which the rates are calculated. For example, child mortality may be overestimated relative to infant mortality if children who died in the first year of life are reported as having died at age 1 or older. In an effort to minimize misreporting of age at death, interviewers were instructed to record deaths at under 1 month in days and deaths at under 2 years in months. In addition, they were trained to probe deaths reported at exactly 1 year or 12 months to ensure that they had actually occurred at 12 months. The distribution of deaths under 2 years during the 20 years prior to the survey by month of death shows that there is some heaping at 6, 9, and 12 months of age, with corresponding deficits in adjacent months (Table C.6). However, heaping is less pronounced for deaths in the five years preceding the survey, for which the most recent mortality rates are calculated.
8.3 LEVELS AND TRENDS IN INFANT AND CHILD MORTALITY
Neonatal, postneonatal, infant, child, and under-5 mortality rates are shown in Table 8.1 for cohorts of children born in three consecutive five-year periods before the survey. Under-5 mortality for the most recent period (0-4 years before the survey or, roughly, during the calendar years 2005-2009) is 64 deaths per 1,000 live births. This means that 1 in 16 children born in Timor-Leste dies before the fifth birthday. Seventy percent of deaths among children under age 5 occur during the first year of life: infant mortality is 45 deaths per 1,000 live births. During infancy, the risk of neonatal deaths and postneonatal deaths is 22 and 23 per 1,000 live births, respectvely. The proportion of child deaths that occurs in the neonatal period (34 percent) in Timor-Leste is lower than the global estimation of 38 percent (Lawn et al., 2005).

Infant and Child Mortality | 101
Table 8.1 Early childhood mortality rates
Neonatal, postneonatal, infant, child, and under-5 mortality rates for five-year periods preceding the survey, Timor-Leste 2009-10
Years preceding the survey
Neonatal mortality
(NN)
Postneonatal mortality1
(PNN)
Infant mortality
(1q0)
Child mortality
(4q1)
Under-5 mortality
(5q0)
0-4 22 23 45 20 64 5-9 30 37 68 32 98 10-14 36 47 83 36 115
1 Computed as the difference between the infant and neonatal mortality rates
Mortality trends can be examined in two ways: by comparing mortality rates for three five-
year periods preceding a single survey and by comparing mortality estimates obtained from various surveys. However, comparisons between surveys should be interpreted with caution because quality of data, time references, and sample coverage vary. In particular, sampling errors associated with mortality estimates are large and should be taken into account when examining trends between surveys.
Data from the TLDHS for the three five-year periods preceding the survey indicate a decline in childhood mortality. For example, infant mortality estimates show a decline from 83 in the 10 to 14 years preceding the survey to 68 in the five- to nine-year period preceding the survey and to 45 during the most recent five-year period. A similar trend is seen for the other under-5 mortality indicators.
Comparison of the TLDHS 2009-10 mortality data with the 2003 DHS survey results shows a substantial (23 percent) improvement in child survival (Figure 8.1). For example, under-5 mortality declined from 83 per 1,000 live births during the period 1999-2003 to 64 per 1,000 live births during the period 2005-2009. This is caused principally by a decrease in the infant mortality rate, from 60 per 1,000 for the zero to four years preceding the 2003 DHS to 45 per 1,000 during the same period prior to the 2009-10 TLDHS.
The decline in neonatal, infant and under-5 mortality in the five years preceding the TLDHS 2009-10 indicates that Timor-Leste is on track to reduce infant and under-5 mortality to reach the target for Millennium Development Goal (MDG) 4, that is, to reduce under-5 mortality by two-thirds by 2015. It is notable that the proportion of neonatal deaths to under-5 deaths (34 percent) is relatively lower in Timor-Leste than in the other neighboring countries of Indonesia, Philippines, Bangladesh, India, and Nepal as measured in the latest DHS surveys in these countries. Neonatal mortality is generally higher than postneonatal mortality, but the pattern observed in the 2009-10 TLDHS is unusual. The common indicators of data quality, including the proportion of neonatal deaths that occur in the first seven days, the ratio of neonatal deaths to perinatal deaths, and the heaping of deaths around one month do not show obvious problems with data quality; however, it is possible that some neonatal deaths have been omitted.
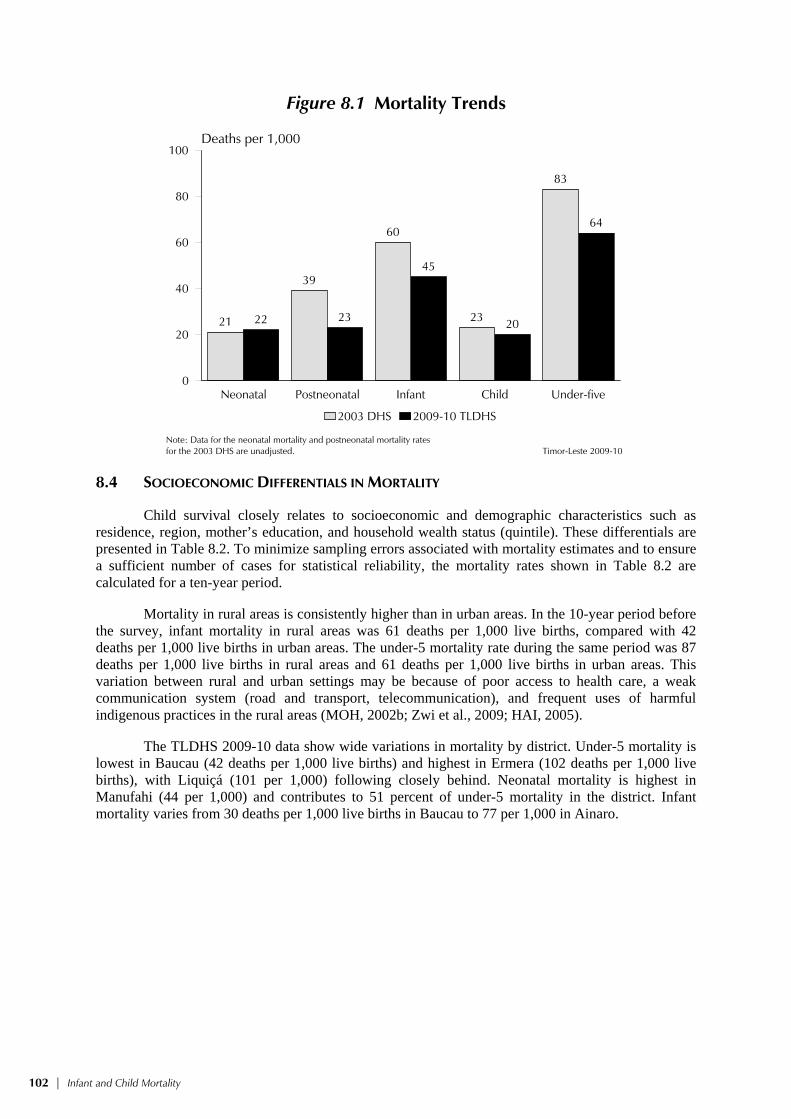
102 | Infant and Child Mortality
Figure 8.1 Mortality Trends
21
39
60
23
83
22 23
45
20
64
Neonatal Postneonatal Infant Child Under-five0
20
40
60
80
100Deaths per 1,000
2003 DHS 2009-10 TLDHS
Timor-Leste 2009-10Note: Data for the neonatal mortality and postneonatal mortality ratesfor the 2003 DHS are unadjusted.
8.4 SOCIOECONOMIC DIFFERENTIALS IN MORTALITY
Child survival closely relates to socioeconomic and demographic characteristics such as residence, region, mother’s education, and household wealth status (quintile). These differentials are presented in Table 8.2. To minimize sampling errors associated with mortality estimates and to ensure a sufficient number of cases for statistical reliability, the mortality rates shown in Table 8.2 are calculated for a ten-year period.
Mortality in rural areas is consistently higher than in urban areas. In the 10-year period before the survey, infant mortality in rural areas was 61 deaths per 1,000 live births, compared with 42 deaths per 1,000 live births in urban areas. The under-5 mortality rate during the same period was 87 deaths per 1,000 live births in rural areas and 61 deaths per 1,000 live births in urban areas. This variation between rural and urban settings may be because of poor access to health care, a weak communication system (road and transport, telecommunication), and frequent uses of harmful indigenous practices in the rural areas (MOH, 2002b; Zwi et al., 2009; HAI, 2005).
The TLDHS 2009-10 data show wide variations in mortality by district. Under-5 mortality is lowest in Baucau (42 deaths per 1,000 live births) and highest in Ermera (102 deaths per 1,000 live births), with Liquiçá (101 per 1,000) following closely behind. Neonatal mortality is highest in Manufahi (44 per 1,000) and contributes to 51 percent of under-5 mortality in the district. Infant mortality varies from 30 deaths per 1,000 live births in Baucau to 77 per 1,000 in Ainaro.

Infant and Child Mortality | 103
Table 8.2 Early childhood mortality rates by socioeconomic characteristics
Neonatal, postneonatal, infant, child, and under-5 mortality rates for the 10-year period preceding the survey, by background characteristic, Timor-Leste 2009-10
Background characteristic
Neonatal mortality
(NN)
Postneonatal mortality1
(PNN)
Infant mortality
(1q0)
Child mortality
(4q1)
Under-5 mortality
(5q0)
Residence Urban 21 21 42 20 61 Rural 28 33 61 28 87
District Aileu 27 29 56 21 76 Ainaro 31 46 77 22 97 Baucau 11 18 30 12 42 Bobonaro 27 23 50 36 85 Covalima 37 38 76 21 95 Dili 21 18 39 22 60 Ermera 23 47 70 34 102 Lautem 36 33 69 31 98 Liquiçá 31 37 68 35 101 Manatuto 31 19 50 20 69 Manufahi 44 19 62 25 86 Oecussi 25 41 66 27 92 Viqueque 24 31 54 24 77
Mother’s education No education 27 34 61 31 90 Primary 27 32 59 27 84 Secondary 26 25 51 19 69 More than secondary (9) (12) (21) * *
Wealth quintile Lowest 24 37 62 27 87 Second 30 38 68 28 94 Middle 29 30 59 32 89 Fourth 25 30 56 27 81 Highest 22 16 38 15 52
Note: Numbers in parentheses are based on 250-499 unweighted exposed persons; an asterisk indicates that a rate is based on fewer than 250 unweighted exposed persons and has been suppressed. 1 Computed as the difference between the infant and neonatal mortality rates
As expected, a mother’s education is inversely related to a child’s risk of dying. Under-5
mortality among children of mothers with no education (90 deaths per 1,000 live births) is substantially higher than under-5 mortality among children of women with secondary level education (69 deaths per 1,000 live births). The direct association between level of education and under-5 mortality is also seen for infant mortality. Children of women with no education (61 deaths per 1,000 live births) are much more likely to die in the first year than children of women with secondary education (51 deaths per 1,000 live births).The relationship between household wealth and under-5 mortality is not always consistent, although children born to mothers in the highest wealth quintile clearly are at much lower risk of dying than children born to mothers in the other quintiles.
8.5 DEMOGRAPHIC CHARACTERISTICS AND CHILD MORTALITY
Studies have shown that a number of demographic factors are strongly associated with the survival chances of young children. These factors include sex of child, age of mother at birth, birth order, length of preceding birth interval, and size of child at birth. Table 8.3 shows the relationship between childhood mortality and these demographic variables. Again, for all variables except birth size, mortality estimates are calculated for the 10-year period preceding the survey to reduce sampling variability. Mortality rates by birth size are for the five-year period preceding the survey because information on birth size was collected only for children born in the past five years.
Childhood mortality is higher for males than females (Table 8.3) for all mortality rates. Under-5 mortality rates for male and female children are 85 and 76 deaths per 1,000 live births, respectively. The excess mortality among male children is mostly due to their higher biological risk during the first month of life.

104 | Infant and Child Mortality
Table 8.3 Early childhood mortality rates by demographic characteristics
Neonatal, postneonatal, infant, child, and under-5 mortality rates for the 10-year period preceding the survey, by demographic characteristics, Timor-Leste 2009-10
Demographic characteristic
Neonatal mortality
(NN)
Postneonatal mortality1
(PNN)
Infant mortality
(1q0)
Child mortality
(4q1)
Under-5 mortality
(5q0)
Child’s sex Male 28 31 59 27 85 Female 24 29 53 24 76
Mother’s age at birth <20 35 39 74 31 103 20-29 26 32 58 26 83 30-39 25 27 53 24 75 40-49 22 19 41 25 65
Birth order 1 34 29 63 22 83 2-3 26 28 53 24 76 4-6 22 31 53 25 77 7+ 27 35 62 34 94
Previous birth interval2 <2 years 35 44 79 38 114 2 years 21 26 48 24 71 3 years 19 22 41 18 58 4+ years 13 17 31 16 46
Birth size3 Small/very small 34 26 61 na na Average or larger 18 21 40 na na
na = Not applicable 1 Computed as the difference between the infant and neonatal mortality rates 2 Excludes first-order births 3 Rates for the five-year period before the survey
Results from the TLDHS 2009-10 confirm the expected relationship between mothers who
give birth at a very young age and childhood mortality. For example, under-5 mortality is 103 deaths per 1,000 livebirths to mothers age less than 20 years at birth compared with 83 and 75 deaths per 1,000 livebirths to mothers age 20-29 and 30-39, respectively. However, a similar pattern is not visible for older mothers age 40-49 who, similar to very young mothers, are also in a high-risk group. Under-five mortality to mothers age 40-49 is 65 deaths per 1,000 livebirths. This anomalous distribution may be due to large sampling errors associated with the much smaller number of births to women in this age group.
In general, first births and births of order 7 and higher also suffer significantly higher rates of mortality than births of orders 2-3 and 4-6. For example, 1 in 16 first births did not survive to the first year, compared with 1 in 19 second- and third-order births. In contrast, child mortality and postneonatal mortality tend to increase linearly with birth order. The increase in the child mortality rate with birth order may reflect a more intense competition faced by higher birth order children for the caregiver’s time, for utilization of health care, and for nutritious food once children are weaned.
Short birth intervals are associated with an increased risk of dying. Different studies have revealed an association between short birth intervals (less than 2 years) and increased mortality, even after controlling for other demographic and socioeconomic variables. In Table 8.3, all childhood mortality rates show a sharp decrease as the length of the birth interval increases. Neonatal, infant, child, and under-5 mortality rates are more than two and a half times higher for children born after an interval of less than 2 years, compared with children who are born after an interval of 4 years or longer.
A child’s size at birth has often been found to be an important indicator of the chances of survival during infancy. The majority of births in Timor-Leste take place at home, and these babies are seldom weighed at birth. The mother’s assessment of the size of the baby at birth is therefore used as a proxy for birth weight. The TLDHS results indicate that among babies assessed by their mother to be small or very small, infant mortality is one and a half times the level observed for babies assessed as average or larger at birth.
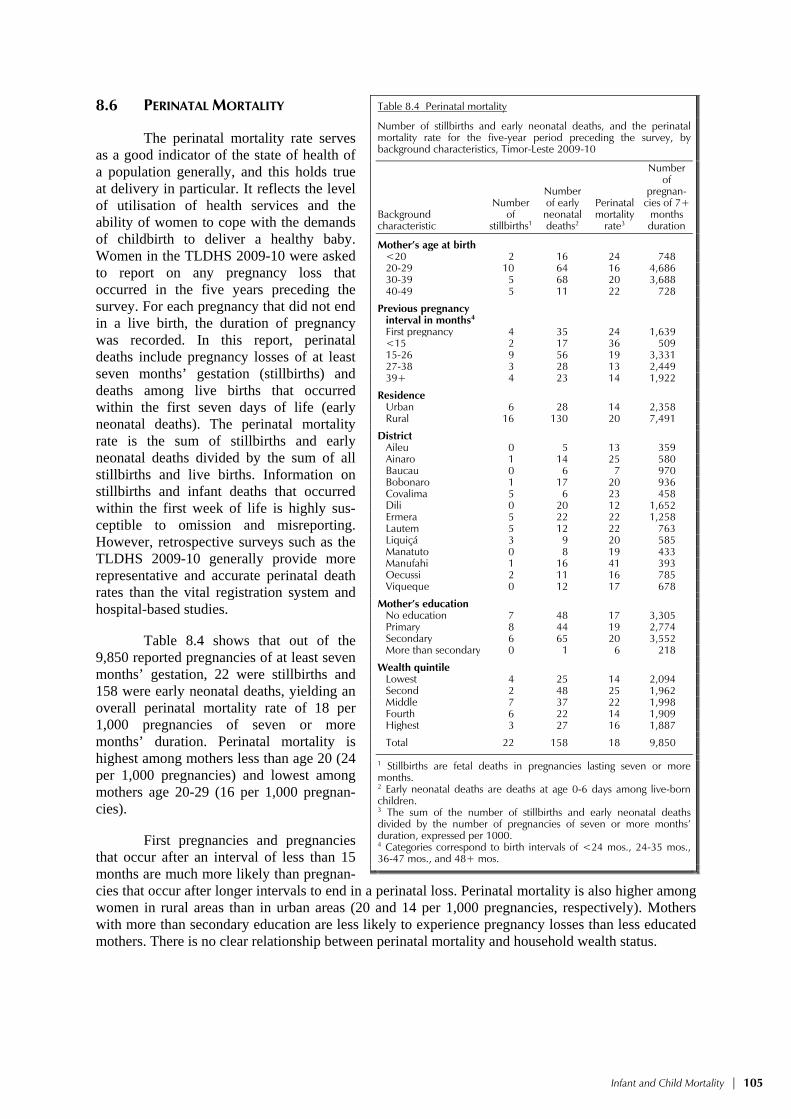
Infant and Child Mortality | 105
8.6 PERINATAL MORTALITY
The perinatal mortality rate serves as a good indicator of the state of health of a population generally, and this holds true at delivery in particular. It reflects the level of utilisation of health services and the ability of women to cope with the demands of childbirth to deliver a healthy baby. Women in the TLDHS 2009-10 were asked to report on any pregnancy loss that occurred in the five years preceding the survey. For each pregnancy that did not end in a live birth, the duration of pregnancy was recorded. In this report, perinatal deaths include pregnancy losses of at least seven months’ gestation (stillbirths) and deaths among live births that occurred within the first seven days of life (early neonatal deaths). The perinatal mortality rate is the sum of stillbirths and early neonatal deaths divided by the sum of all stillbirths and live births. Information on stillbirths and infant deaths that occurred within the first week of life is highly sus-ceptible to omission and misreporting. However, retrospective surveys such as the TLDHS 2009-10 generally provide more representative and accurate perinatal death rates than the vital registration system and hospital-based studies.
Table 8.4 shows that out of the 9,850 reported pregnancies of at least seven months’ gestation, 22 were stillbirths and 158 were early neonatal deaths, yielding an overall perinatal mortality rate of 18 per 1,000 pregnancies of seven or more months’ duration. Perinatal mortality is highest among mothers less than age 20 (24 per 1,000 pregnancies) and lowest among mothers age 20-29 (16 per 1,000 pregnan-cies).
First pregnancies and pregnancies that occur after an interval of less than 15 months are much more likely than pregnan-cies that occur after longer intervals to end in a perinatal loss. Perinatal mortality is also higher among women in rural areas than in urban areas (20 and 14 per 1,000 pregnancies, respectively). Mothers with more than secondary education are less likely to experience pregnancy losses than less educated mothers. There is no clear relationship between perinatal mortality and household wealth status.
Table 8.4 Perinatal mortality
Number of stillbirths and early neonatal deaths, and the perinatal mortality rate for the five-year period preceding the survey, by background characteristics, Timor-Leste 2009-10
Background characteristic
Number of
stillbirths1
Number of early neonatal deaths2
Perinatal mortality
rate3
Number of
pregnan-cies of 7+
months duration
Mother’s age at birth <20 2 16 24 74820-29 10 64 16 4,68630-39 5 68 20 3,68840-49 5 11 22 728
Previous pregnancy interval in months4 First pregnancy 4 35 24 1,639<15 2 17 36 50915-26 9 56 19 3,33127-38 3 28 13 2,44939+ 4 23 14 1,922
Residence Urban 6 28 14 2,358Rural 16 130 20 7,491
District Aileu 0 5 13 359Ainaro 1 14 25 580Baucau 0 6 7 970Bobonaro 1 17 20 936Covalima 5 6 23 458Dili 0 20 12 1,652Ermera 5 22 22 1,258Lautem 5 12 22 763Liquiçá 3 9 20 585Manatuto 0 8 19 433Manufahi 1 16 41 393Oecussi 2 11 16 785Viqueque 0 12 17 678
Mother’s education No education 7 48 17 3,305Primary 8 44 19 2,774Secondary 6 65 20 3,552More than secondary 0 1 6 218
Wealth quintile Lowest 4 25 14 2,094Second 2 48 25 1,962Middle 7 37 22 1,998Fourth 6 22 14 1,909Highest 3 27 16 1,887
Total 22 158 18 9,850
1 Stillbirths are fetal deaths in pregnancies lasting seven or more months. 2 Early neonatal deaths are deaths at age 0-6 days among live-born children. 3 The sum of the number of stillbirths and early neonatal deaths divided by the number of pregnancies of seven or more months’duration, expressed per 1000. 4 Categories correspond to birth intervals of <24 mos., 24-35 mos., 36-47 mos., and 48+ mos.

106 | Infant and Child Mortality
8.7 HIGH-RISK FERTILITY BEHAVIOR
The survival of infants and children depends in part on the demographic and biological characteristics of their mothers. These characteristics are of particular importance because many health problems are easily avoidable at a relatively low cost. Infants and children have an elevated risk of dying if their mothers are too young (under 18 years of age) or too old (over 35 years old), if they are born after too short a birth interval (less than 24 months), and if they are of high birth order (mother has three or more children). Although first births are commonly associated with higher mortality risk, they are not included in the high-risk category because the risks associated with first births are unavoidable.
Table 8.5 shows the percent distribution of children born in the five years preceding the survey and the percent distribution of currently married women, by risk factors. The table also shows the risk ratio (of dying) for children, by comparing the proportion of dead children in each risk category with the proportion of dead children not in any high-risk category.
Table 8.5 High-risk fertility behavior
Percent distribution of children born in the five years preceding the survey by category of elevated risk of mortality and the risk ratio, and percent distribution of currently married women by category of risk if they were to conceive a child at the time of the survey, Timor-Leste 2009-10
Risk category
Births in the 5 years preceding the survey
Percentage of currently married women1
Percentage
of births Risk ratio
Not in any high risk category 18.7 1.00 12.2a
Unavoidable risk category First order births between ages 18 and 34 years 15.1 1.33 3.6
Single high-risk category Mother’s age <18 1.9 1.52 0.3 Mother’s age >34 1.5 1.73 4.7 Birth interval <24 months 9.6 1.36 9.1 Birth order >3 21.8 1.26 13.8
Subtotal 34.9 1.32 27.9
Multiple high-risk category Age <18 & birth interval <24 months2 0.2 * 0.2 Age >34 & birth interval <24 months 0.3 * 0.3 Age >34 & birth order >3 16.7 1.30 35.5
Age >34 & birth interval <24 months &birth order >3 4.9 2.75 8.8
Birth interval <24 months & birth order >3 9.3 1.90 11.5
Subtotal 31.3 1.70 56.3
In any avoidable high-risk category 66.2 1.50 84.2
Total 100.0 na 100.0 Number of births/women 9,828 na 7,906
Notes: Risk ratio is the ratio of the proportion dead among births in a specific high-risk category to the proportion dead among births not in any high-risk category. An asterisk indicates that a figure is based on fewer than 25 unweighted cases and has been suppressed. na = Not applicable 1 Women are assigned to risk categories according to the status they would have at the birth of a child if they were to conceive at the time of the survey: current age less than 17 years and 3 months or older than 34 years and 2 months, latest birth less than 15 months ago, or latest birth being of order 3 or higher. 2 Includes the category age <18 and birth order >3 a Includes sterilized women
Two-thirds (66 percent) of births in Timor-Leste have elevated mortality risks that are
avoidable, and about one in five (19 percent) are not in any high-risk category. Among those who are at risk, 35 percent of births are in a single high-risk category, while 31 percent of births are in multiple high-risk categories. In general, risk ratios are higher for children in multiple high-risk categories than for those in a single high-risk category.

Infant and Child Mortality | 107
The most vulnerable births are those to women who are age 35 or older, with a birth interval less than 24 months, and birth order of three or higher. These children are about three times more likely to die than children not in any high-risk category. However, only five percent of births are in this category.
Twenty-two percent of births occur to mothers who have three or more births, and another 17 percent of births occur to mothers who are 35 years or older and have had three or more children. These children whose mothers are 35 years or older and have had three or more children however, are only slightly more likely to die than children in the no high-risk category.
The final column of Table 8.5 shows the distribution of currently married women who have the potential for having a high-risk birth, by category of risk. Thirty-six percent of women are over age 35 and have three or more children. The potential for having a birth in a multiple high-risk category is much higher (56 percent) than the potential for having a birth in a single high-risk category (28 percent). Eighty-four percent of women are in any high-risk category.


Adult and Maternal Mortality | 109
ADULT AND MATERNAL MORTALITY 9
The Safe Motherhood Initiative, launched in 1987, drew increased worldwide attention to reproductive health, as did the need for reliable countrywide estimates of maternal deaths. In response to this increased interest, DHS surveys began collecting maternal mortality data through a series of questions designed to obtain a direct measure of maternal mortality. More recently, in an effort to improve global health, the United Nations Development Program initiated the Millennium Development Goals (MDG), with Goal 5 focused on the reduction of maternal mortality by three-quarters between 1990 and 2015. The government of Timor-Leste hopes that its strong commitment to a reproductive health strategy, a national family planning policy, training for health providers on safe, clean deliveries and emergency obstetric care, and the equipping of established health facilities will result in a reduction in the maternal mortality ratio (MMR) to 252 deaths per 100,000 by the year 2015 from a baseline estimate of 660 in 2000 (UNDP and the Government of Timor-Leste, 2009).
Estimates of maternal mortality in Timor-Leste have ranged from a low of 380 deaths per 100,000 live births to a high of 880 deaths per 100,000 live births (HAI, 2010). Data from WHO, UNICEF, UNFPA, and the World Bank for 2005 indicate that the MMR is 380 deaths per 100,000 live births (WHO et al., 2004). In 2008, WHO, UNICEF, UNFPA, and the World Bank estimated, from reports by national authorities, an adjusted maternal mortality ratio of 370 per 100,000 women and a lifetime risk of 1 in 44 deaths to women from maternal causes (WHO et al., 2010). These various model-based estimates of MMR are extrapolated from indirect estimates of other published health-related information.
Estimating maternal mortality requires a comprehensive and accurate reporting of maternal deaths. Data from the 2009-10 TLDHS provides for the first time a direct estimate of maternal mortality from a population-based survey. The data presented in this chapter will play a vital role in filling the need for a reliable national estimate of maternal mortality. Nevertheless, it is important for users of this information to understand the inherent problems associated with measuring maternal mortality in general if they are to avoid misinterpretation of the survey results. This holds particularly true when comparing results obtained from other indirect and model-based estimates.
Direct estimates of maternal mortality use data on the age of surviving sisters of survey respondents, the age at death of sisters who have died, and the number of years that have passed since the deaths of sisters.
9.1 DATA QUALITY ANALYSIS
To obtain the sibling history, each respondent was first asked to give the total number of her mother’s live births. The respondent was then asked to provide a list of all of the children born to her mother, starting with the first-born and the first-born’s survival status at the time of the interview. For living siblings, the current age was collected. For deceased siblings, the age at death and years since death were collected. Interviewers were carefully instructed to obtain precise information wherever possible, and when respondents were unable to provide exact age at death or years since death, particularly in the case of events that occurred decades ago, approximate but quantitative answers were accepted. For sisters who died at age 12 and above, three additional questions were asked: whether the sister was pregnant at the time of death, whether she died during childbirth, and whether she died within two months of the end of a pregnancy or childbirth. Listing all siblings in chronological order of their birth is believed to result in better reporting of events than would be the case if the interviewer obtained only information on sisters. Moreover, the information collected also allows direct estimates of adult male and female mortality.

110 | Adult and Maternal Mortality
The estimation of adult and maternal mortality requires reasonably accurate reporting of the number of brothers and sisters a respondent has ever had, the number who have died, and for maternal mortality, the number of sisters who have died of maternity-related causes. One measure of the quality of the data collected is the completeness of information on siblings. Table 9.1 shows data from the 2009-10 TLDHS on the number of siblings reported by the respondents and the completeness of the data reported on current age, age at death, and years since death. Of the 63,481 siblings reported in the sibling history, survival status was not reported for 16 siblings (<0.01 percent). Among surviving siblings, current age (used for estimating exposure to death) was missing for 90 siblings (0.2 percent). For 99 percent of deceased siblings, both age at death and years since death were reported (with missing age at death, or years since death, or both, missing for <1 percent of dead siblings). Therefore the overall level of completeness of information on siblings appears to be good.
Table 9.1 Completeness of information on siblings
Number of sisters and brothers reported by interviewed women and completeness of age data for living siblings and age at death (AD) and years since death (YSD) data for dead siblings, Timor-Leste 2009-10
Sisters Brothers Total Number Percent Number Percent Number Percent
All siblings 30,861 100.0 32,621 100.0 63,481 100.0 Living 26,061 84.4 27,258 83.6 53,318 84.0 Dead 4,790 15.5 5,357 16.4 10,147 16.0 Status Unknown 10 0.0 7 0.0 16 0.0
Living siblings 26,061 100.0 27,258 100.0 53,318 100.0 Age reported 26,013 99.8 27,215 99.8 53,228 99.8 Age missing 48 0.2 42 0.2 90 0.2
Dead siblings 4,790 100.0 5,357 100.0 10,147 100.0 AD and YSD reported 4,766 99.5 5,319 99.3 10,085 99.4 Missing only AD 4 0.1 9 0.2 13 0.1 Missing only YSD 2 0.0 4 0.1 7 0.1 Missing both 18 0.4 24 0.5 42 0.4
The distribution of respondents’ year of birth in
relation to their siblings is another crude measure of the quality of maternal mortality data. If there is no bias in reporting, the year of birth of siblings should be roughly equivalent to the year of birth of respondents overall. The median year of birth of respondents is the same as that of their siblings, indicating that there is no serious underreporting of siblings (Table 9.2).
Yet another crude measure of data quality is the mean number of siblings, or the mean sibship size (Table 9.3). Sibship size is expected to decline as fertility declines over time. The absence of a monotonic decline in sibship size, even though fertility has declined in Timor-Leste, is an indication that there may be some omission in the reporting of older siblings. However, since adult mortality rates are reported here for the seven years preceding the survey, this omission is unlikely to affect the calculation of mortality rates. Moreover, if the omission occurred mostly among sisters who did not survive to adulthood (which is most likely the case), such errors may not bias the estimation of maternal mortality. The possible omission of sisters is also suggested by the sex ratios that are larger than the internationally accepted sex ratio of 103-105, indicating that the sisters are underreported or the brothers are overreported. Nevertheless, it should be borne in mind that any information that relies on recall of events will suffer from some degree of misreporting, especially if it pertains to deceased persons and to events that occurred a long time before the survey.
Table 9.2 Year of birth of respondents and siblings
Percent distribution of respondents and siblings by year of birth, Timor-Leste 2009-10
Year of birth Respondents Siblings
Before 1950 0.0 0.71950-54 0.0 1.31955-59 0.1 3.11960-64 8.7 5.41965-69 10.6 7.71970-74 12.9 9.81975-79 11.6 10.51980-84 14.6 13.61985 or later 41.5 48.0Total 100.0 100.0
Lower range 1959 1923Upper range 1995 2009Median 1971 1971Number of cases 13,137 63,458
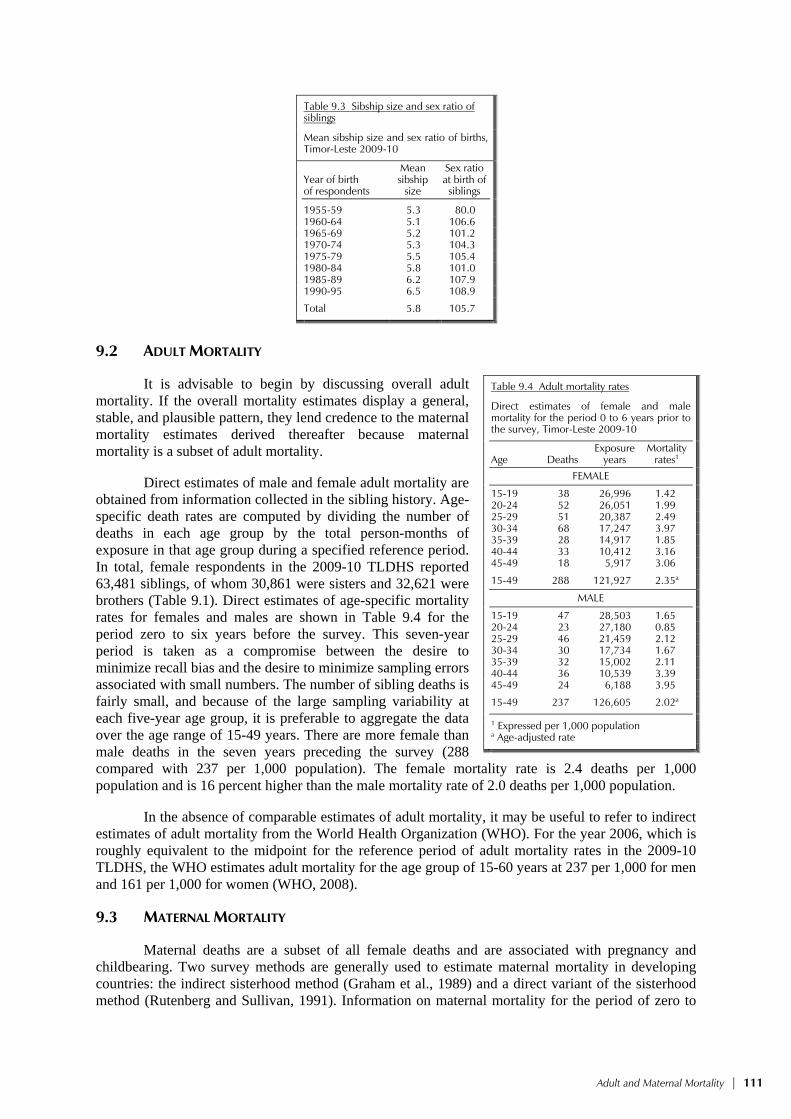
Adult and Maternal Mortality | 111
Table 9.3 Sibship size and sex ratio of siblings
Mean sibship size and sex ratio of births, Timor-Leste 2009-10
Year of birth of respondents
Mean sibship
size
Sex ratio at birth of
siblings
1955-59 5.3 80.0 1960-64 5.1 106.6 1965-69 5.2 101.2 1970-74 5.3 104.3 1975-79 5.5 105.4 1980-84 5.8 101.0 1985-89 6.2 107.9 1990-95 6.5 108.9
Total 5.8 105.7
9.2 ADULT MORTALITY
It is advisable to begin by discussing overall adult mortality. If the overall mortality estimates display a general, stable, and plausible pattern, they lend credence to the maternal mortality estimates derived thereafter because maternal mortality is a subset of adult mortality.
Direct estimates of male and female adult mortality are obtained from information collected in the sibling history. Age-specific death rates are computed by dividing the number of deaths in each age group by the total person-months of exposure in that age group during a specified reference period. In total, female respondents in the 2009-10 TLDHS reported 63,481 siblings, of whom 30,861 were sisters and 32,621 were brothers (Table 9.1). Direct estimates of age-specific mortality rates for females and males are shown in Table 9.4 for the period zero to six years before the survey. This seven-year period is taken as a compromise between the desire to minimize recall bias and the desire to minimize sampling errors associated with small numbers. The number of sibling deaths is fairly small, and because of the large sampling variability at each five-year age group, it is preferable to aggregate the data over the age range of 15-49 years. There are more female than male deaths in the seven years preceding the survey (288 compared with 237 per 1,000 population). The female mortality rate is 2.4 deaths per 1,000 population and is 16 percent higher than the male mortality rate of 2.0 deaths per 1,000 population.
In the absence of comparable estimates of adult mortality, it may be useful to refer to indirect estimates of adult mortality from the World Health Organization (WHO). For the year 2006, which is roughly equivalent to the midpoint for the reference period of adult mortality rates in the 2009-10 TLDHS, the WHO estimates adult mortality for the age group of 15-60 years at 237 per 1,000 for men and 161 per 1,000 for women (WHO, 2008).
9.3 MATERNAL MORTALITY
Maternal deaths are a subset of all female deaths and are associated with pregnancy and childbearing. Two survey methods are generally used to estimate maternal mortality in developing countries: the indirect sisterhood method (Graham et al., 1989) and a direct variant of the sisterhood method (Rutenberg and Sullivan, 1991). Information on maternal mortality for the period of zero to
Table 9.4 Adult mortality rates
Direct estimates of female and male mortality for the period 0 to 6 years prior to the survey, Timor-Leste 2009-10
Age Deaths Exposure
years Mortality
rates1 FEMALE
15-19 38 26,996 1.4220-24 52 26,051 1.9925-29 51 20,387 2.4930-34 68 17,247 3.9735-39 28 14,917 1.8540-44 33 10,412 3.1645-49 18 5,917 3.06
15-49 288 121,927 2.35a
MALE
15-19 47 28,503 1.6520-24 23 27,180 0.8525-29 46 21,459 2.1230-34 30 17,734 1.6735-39 32 15,002 2.1140-44 36 10,539 3.3945-49 24 6,188 3.95
15-49 237 126,605 2.02a
1 Expressed per 1,000 population a Age-adjusted rate

112 | Adult and Maternal Mortality
six years before the survey is shown in Table 9.5. Age-specific mortality rates are calculated by dividing the number of maternal deaths by years of exposure. To remove the effect of truncation bias (the upper boundary for eligibility in the TLDHS survey is 49 years), the overall rate for women age 15-49 is standardized by the age distribution of the survey respondents. Maternal deaths are defined as any death that occurred during pregnancy, childbirth, or within two months of the birth or termination of a pregnancy.
Table 9.5 Direct estimates of maternal mortality
Direct estimates of maternal mortality for the period 0-6 years prior to the survey, Timor-Leste 2009-10
Age Maternal deaths
Exposure years
Mortality rates1
Proportion of maternal deaths to
female deaths
15-19 8 26,996 0.286 20.2 20-24 22 26,051 0.862 43.3 25-29 24 20,387 1.198 48.2 30-34 32 17,247 1.842 46.4 35-39 12 14,917 0.836 45.2 40-44 15 10,412 1.439 45.5 45-49 6 5,917 1.026 33.5
Total 120 121,927 0.960a 41.7
General fertility rate (GFR) 0.172a
Maternal mortality ratio (MMR)2 557
1 Expressed per 1,000 woman-years of exposure 2 Expressed per 100,000 live births; calculated as the maternal mortality rate divided by the general fertility rate a Age-adjusted rate na = Not available
Maternal mortality in Timor-Leste is high relative to many developed countries. However, for
each age group, maternal deaths are a relatively rare occurrence. As such, the age-specific pattern should be interpreted with caution. Respondents reported 120 maternal deaths in the seven years preceding the survey. The maternal mortality rate, which is the annual number of maternal deaths per 1,000 women age 15-49, for the period zero to six years preceding the survey, is 0.96. Maternal deaths accounted for 42 percent of all deaths to women age 15-49; in other words, more than two in five Timorese women who died in the seven years preceding the survey died from pregnancy or pregnancy-related causes. The MMR, which is obtained by dividing the age-standardized maternal mortality rate by the age-standardized general fertility rate, is often considered a more useful measure of maternal mortality because it measures the obstetric risk associated with each live birth. Table 9.5 shows that the MMR for Timor-Leste for the seven years preceding the survey is 557 deaths per 100,000 live births (or alternatively, about 6 deaths per 1,000 live births). The 95 percent confidence interval places the true MMR for 2009-10 anywhere between 408 and 706.
As pointed out at the beginning of the chapter, the MMR estimate from the 2009-10 TLDHS is the first direct measure of maternal mortality because it is based on survey data and is therefore not comparable to other model-based estimates of MMR that have been used in Timor-Leste in earlier years. Nevertheless, it is important to point out that the MMR for Timor-Leste remains one of the highest in the world, and government programs must address this problem. Necessary interventions include increasing women’s access to reproductive health care, (through more and better health facilities that offer family planning and maternity care), increasing skilled birth attendance, and educating women about birth spacing. These issues are discussed in detail in the following chapters of this report.

Maternal Health | 113
MATERNAL HEALTH 10
Making Pregnancy Safer, a program launched by WHO, is a significant component of the Safe Motherhood Initiative of 1987. The program’s framework is designed to ensure that all pregnancies are wanted, that women can progress safely through pregnancy and childbirth, and that infants are born alive and healthy (WHO, 2010). The government of Timor-Leste recognizes the importance of the availability of good basic and comprehensive essential services for all women during pregnancy and childbirth. The intent of the government is to reduce levels of maternal and neonatal mortality and morbidity in the country. The National Reproductive Health Strategy (NRHS) for Timor-Leste incorporates four basic strategic approaches to make pregnancy safer (MOH, 2004a):
• To substantially increase the level of knowledge in the general population on issues related to pregnancy and childbirth
• To improve the quality and the coverage of prenatal, delivery, postnatal, and perinatal health care
• To improve emergency obstetric care through recognition, early detection, and management or referral of complications of pregnancy and delivery
• To integrate effective detection and management of STI cases, including HIV, in maternal and perinatal care
Traditional beliefs and practices around childbearing and child rearing are very strong in Timor-Leste. A high number of maternal deaths have been documented (see Chapter 9). The absence of a basic health service infrastructure, which was destroyed during the Indonesian withdrawal in 1999, has compromised health services for women and children. Since then, Timor-Leste has set health as its national priority, yet gaps persist in the availability of strong and sustained community-wide health promotion strategies (WHO Timor-Leste, 2004). Efforts from agencies such as the Health Alliance International (HAI), United Nations Children’s Fund (UNICEF), and United Nations Population Fund (UNFPA) have addressed the issues of maternal and newborn care in support of the Ministry of Health (HAI, 2008). This chapter presents findings on several aspects of maternal health in Timor-Leste: antenatal, delivery, postnatal, and newborn care practices as well as problems in accessing health care for women.
10.1 ANTENATAL CARE
The quality of antenatal care (ANC) can be measured by the qualifications of the provider and the number and frequency of ANC visits. Antenatal care quality can also be monitored through the content of services received and the kinds of information given to mothers during their visits.
Information about ANC was obtained from women who gave birth in the five years preceding the survey. Table 10.1 shows the percent distribution of mothers in the five years preceding the survey by source of care received during pregnancy, according to selected background characteristics. Women were asked to report on whom they saw for care for their last birth, and if they saw more than one provider, only the provider with the highest qualification is included in the table.
Antenatal care from a skilled birth attendant, that is, from a doctor, nurse, midwife, or assistant nurse, is very common in Timor-Leste, with 86 percent of women reporting receipt of such care. The majority of women receive care from a nurse or midwife (80 percent). Four percent of women receive care from a doctor, and less than 2 percent receive care from an assistant nurse. One

114 | Maternal Health
Table 10.1 Antenatal care
Percent distribution of women age 15-49 who had a live birth in the five years preceding the survey by antenatal care (ANC) provider during pregnancy for the most recent birth and the percentage receiving antenatal care from a skilled provider for the most recent birth, according to background characteristics, Timor-Leste 2009-10
Background characteristic Doctor
Nurse/ midwife
Assistant nurse
Community health worker
Traditional birth
attendant Other No one Total
Percentage receiving antenatal
care from a skilled
provider1 Number of
women
Mother’s age at birth <20 3.6 81.2 1.6 0.8 1.1 0.0 11.8 100.0 86.3 358 20-34 4.2 82.6 1.5 0.4 0.7 0.2 10.4 100.0 88.2 3,966 35-49 4.0 74.9 1.8 0.3 1.4 0.2 17.5 100.0 80.6 1,691
Birth order 1 5.6 81.0 2.0 0.6 0.8 0.1 9.9 100.0 88.6 849 2-3 4.2 83.7 1.5 0.2 0.7 0.2 9.6 100.0 89.4 1,748 4-5 3.8 82.4 1.2 0.2 1.0 0.1 11.2 100.0 87.4 1,516 6+ 3.5 75.3 1.7 0.5 1.3 0.4 17.3 100.0 80.6 1,902
Residence Urban 8.7 83.7 0.7 0.5 0.8 0.6 4.9 100.0 93.2 1,484 Rural 2.6 79.2 1.9 0.3 1.0 0.1 15.0 100.0 83.6 4,531
District Aileu 6.3 86.2 0.2 0.5 0.7 0.6 5.5 100.0 92.8 220 Ainaro 3.1 71.3 0.0 0.2 0.0 0.9 24.5 100.0 74.4 318 Baucau 2.0 84.9 0.5 0.5 0.5 0.0 11.5 100.0 87.4 598 Bobonaro 2.5 84.6 0.7 0.7 0.3 0.0 11.2 100.0 87.8 587 Covalima 4.3 87.5 0.6 0.3 0.8 0.0 6.5 100.0 92.3 322 Dili 9.2 86.2 0.7 0.6 0.6 0.6 2.2 100.0 96.1 1,043 Ermera 2.4 66.9 1.3 0.2 0.4 0.1 28.7 100.0 70.5 719 Lautem 3.0 81.8 0.8 0.2 0.6 0.0 13.6 100.0 85.6 444 Liquiçá 3.2 86.8 6.5 0.0 0.0 0.0 3.6 100.0 96.4 358 Manatuto 1.4 92.1 0.4 0.2 1.1 0.0 4.7 100.0 93.9 264 Manufahi 3.3 71.0 1.4 0.3 0.2 0.3 23.5 100.0 75.7 238 Oecussi 5.4 77.6 0.9 0.0 6.3 0.0 9.8 100.0 83.9 492 Viqueque 1.5 68.4 8.0 0.7 0.4 0.3 20.8 100.0 77.8 412
Mother’s education No education 2.2 72.0 2.2 0.2 1.6 0.2 21.6 100.0 76.3 1,980 Primary 3.4 81.3 1.7 0.8 1.1 0.2 11.5 100.0 86.4 1,656 Secondary 5.7 86.5 1.1 0.3 0.3 0.2 5.9 100.0 93.3 2,226 More than secondary 12.9 87.1 0.0 0.0 0.0 0.0 0.0 100.0 100.0 154
Wealth quintile Lowest 2.2 69.3 2.7 0.2 2.4 0.3 22.9 100.0 74.2 1,226 Second 1.7 75.7 1.6 0.2 1.0 0.1 19.7 100.0 79.0 1,171 Middle 3.0 83.1 1.4 0.6 0.3 0.0 11.5 100.0 87.5 1,203 Fourth 5.6 85.2 1.7 0.2 0.8 0.1 6.4 100.0 92.6 1,170 Highest 7.7 88.4 0.5 0.6 0.2 0.5 2.1 100.0 96.6 1,244
Total 4.1 80.3 1.6 0.4 1.0 0.2 12.5 100.0 86.0 6,015
Note: If more than one source of ANC was mentioned, only the provider with the highest qualifications is considered in this tabulation. 1 Skilled provider includes doctor, nurse, midwife, and assistant nurse
percent of women receive care from a traditional birth attendant. Thirteen percent of women did not receive care from a health provider for their last birth in the five years preceding the survey. These findings reveal that there has been a significant improvement in the proportion of women receiving ANC from a skilled provider—an increase of 41 percent, from 61 percent in the 2003 DHS to 86 percent in the 2009-10 TLDHS. These findings are also consistent with the results of the 2008 Knowledge, Practices, and Coverage (KPC) survey conducted by HAI in selected districts. The KPC survey found that 84 percent of women surveyed reported receiving ANC from health professionals (HAI, 2008).
Mothers age 35 years and older are less likely than younger mothers to receive ANC from a skilled provider. Care from a skilled provider is also less likely for mothers of babies of order 6 and higher. There is a marked difference by urban-rural residence in the percentages of mothers who receive ANC from a skilled provider, with 93 percent getting care in urban settings and 84 percent receiving care in rural settings. Antenatal care from a skilled provider is lowest in Ermera (71 percent) and highest in Dili (96 percent) and Liquiçá (97 percent).
There is a direct relationship between ANC received from a skilled provider and both education and wealth quintiles. Care from a skilled provider increases with education, rising from 76 percent of mothers with no education to 100 percent of mothers with more than secondary education. Similarly, by wealth quintile, receipt of antenatal care from a skilled provider rises from 74 percent
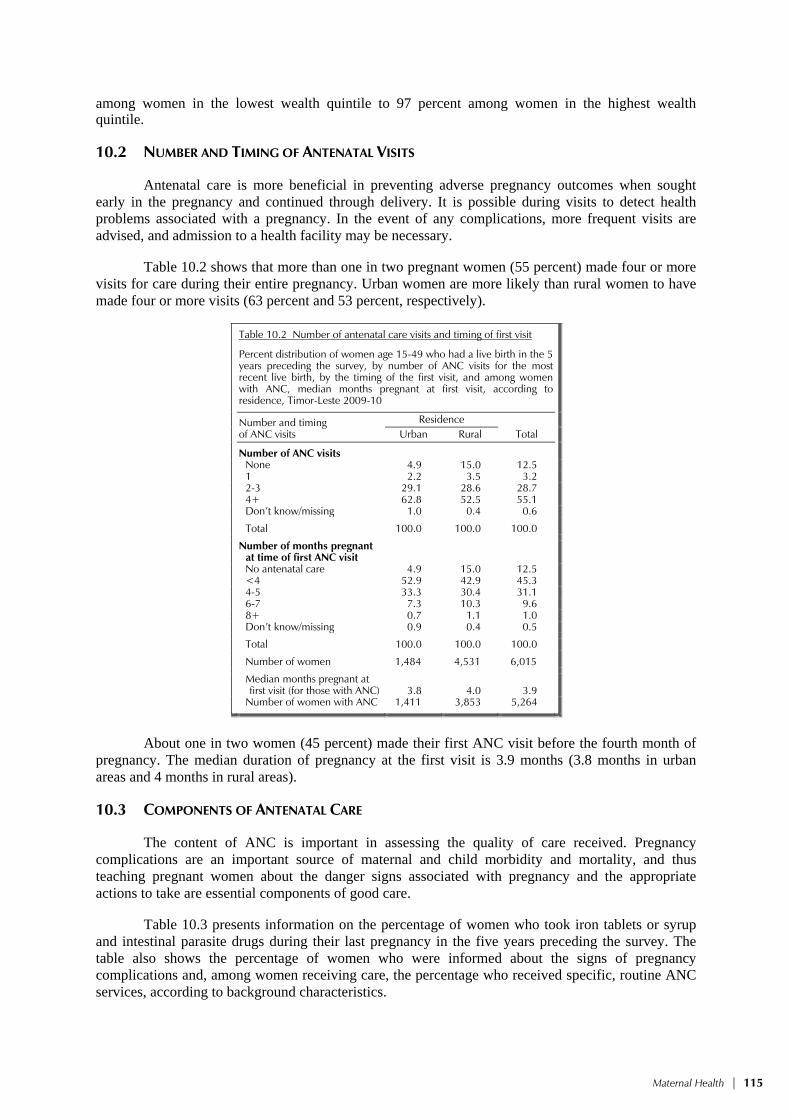
Maternal Health | 115
among women in the lowest wealth quintile to 97 percent among women in the highest wealth quintile.
10.2 NUMBER AND TIMING OF ANTENATAL VISITS
Antenatal care is more beneficial in preventing adverse pregnancy outcomes when sought early in the pregnancy and continued through delivery. It is possible during visits to detect health problems associated with a pregnancy. In the event of any complications, more frequent visits are advised, and admission to a health facility may be necessary.
Table 10.2 shows that more than one in two pregnant women (55 percent) made four or more visits for care during their entire pregnancy. Urban women are more likely than rural women to have made four or more visits (63 percent and 53 percent, respectively).
Table 10.2 Number of antenatal care visits and timing of first visit
Percent distribution of women age 15-49 who had a live birth in the 5 years preceding the survey, by number of ANC visits for the most recent live birth, by the timing of the first visit, and among women with ANC, median months pregnant at first visit, according toresidence, Timor-Leste 2009-10
Number and timing of ANC visits
Residence Total Urban Rural
Number of ANC visitsNone 4.9 15.0 12.51 2.2 3.5 3.22-3 29.1 28.6 28.74+ 62.8 52.5 55.1Don’t know/missing 1.0 0.4 0.6
Total 100.0 100.0 100.0
Number of months pregnant at time of first ANC visitNo antenatal care 4.9 15.0 12.5<4 52.9 42.9 45.34-5 33.3 30.4 31.16-7 7.3 10.3 9.68+ 0.7 1.1 1.0Don’t know/missing 0.9 0.4 0.5
Total 100.0 100.0 100.0
Number of women 1,484 4,531 6,015
Median months pregnant at first visit (for those with ANC) 3.8 4.0 3.9
Number of women with ANC 1,411 3,853 5,264
About one in two women (45 percent) made their first ANC visit before the fourth month of
pregnancy. The median duration of pregnancy at the first visit is 3.9 months (3.8 months in urban areas and 4 months in rural areas).
10.3 COMPONENTS OF ANTENATAL CARE
The content of ANC is important in assessing the quality of care received. Pregnancy complications are an important source of maternal and child morbidity and mortality, and thus teaching pregnant women about the danger signs associated with pregnancy and the appropriate actions to take are essential components of good care.
Table 10.3 presents information on the percentage of women who took iron tablets or syrup and intestinal parasite drugs during their last pregnancy in the five years preceding the survey. The table also shows the percentage of women who were informed about the signs of pregnancy complications and, among women receiving care, the percentage who received specific, routine ANC services, according to background characteristics.
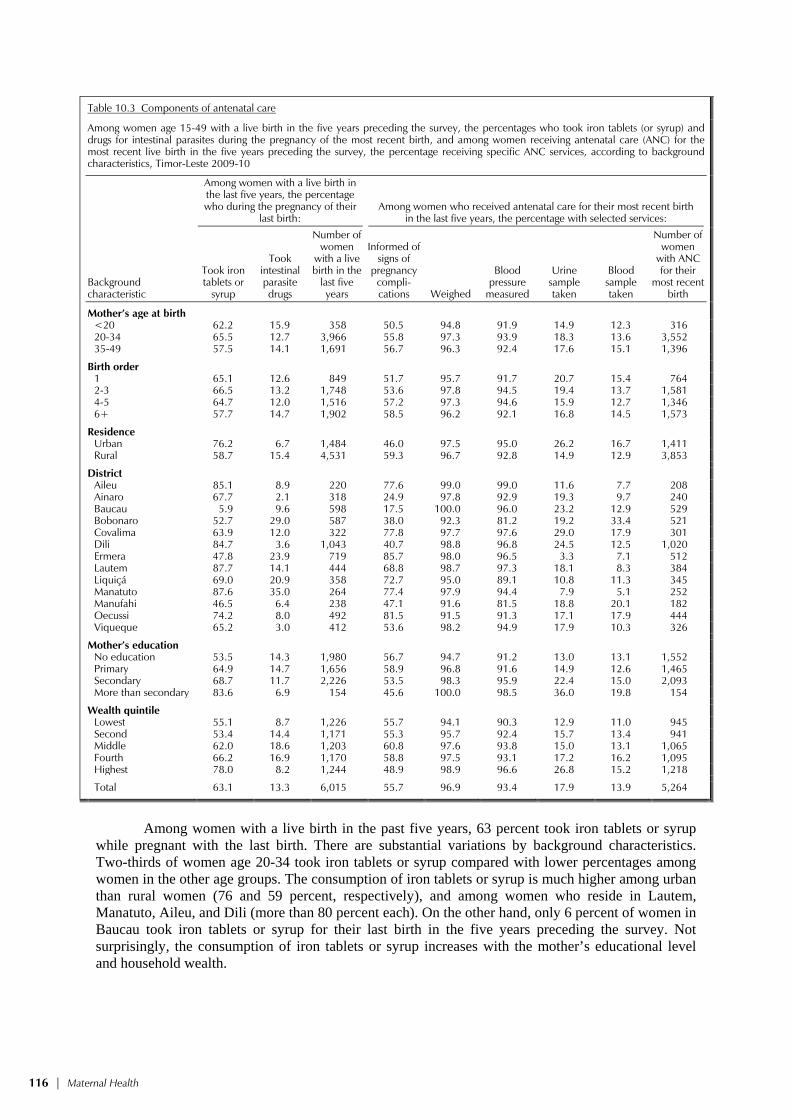
116 | Maternal Health
Table 10.3 Components of antenatal care
Among women age 15-49 with a live birth in the five years preceding the survey, the percentages who took iron tablets (or syrup) and drugs for intestinal parasites during the pregnancy of the most recent birth, and among women receiving antenatal care (ANC) for the most recent live birth in the five years preceding the survey, the percentage receiving specific ANC services, according to background characteristics, Timor-Leste 2009-10
Background characteristic
Among women with a live birth in the last five years, the percentage who during the pregnancy of their
last birth: Among women who received antenatal care for their most recent birth
in the last five years, the percentage with selected services:
Took iron tablets or
syrup
Took intestinal parasite drugs
Number of women
with a live birth in the
last five years
Informed of signs of
pregnancy compli-cations Weighed
Blood pressure
measured
Urine sample taken
Blood sample taken
Number of women
with ANC for their
most recent birth
Mother’s age at birth <20 62.2 15.9 358 50.5 94.8 91.9 14.9 12.3 316 20-34 65.5 12.7 3,966 55.8 97.3 93.9 18.3 13.6 3,552 35-49 57.5 14.1 1,691 56.7 96.3 92.4 17.6 15.1 1,396
Birth order 1 65.1 12.6 849 51.7 95.7 91.7 20.7 15.4 764 2-3 66.5 13.2 1,748 53.6 97.8 94.5 19.4 13.7 1,581 4-5 64.7 12.0 1,516 57.2 97.3 94.6 15.9 12.7 1,346 6+ 57.7 14.7 1,902 58.5 96.2 92.1 16.8 14.5 1,573
Residence Urban 76.2 6.7 1,484 46.0 97.5 95.0 26.2 16.7 1,411 Rural 58.7 15.4 4,531 59.3 96.7 92.8 14.9 12.9 3,853
District Aileu 85.1 8.9 220 77.6 99.0 99.0 11.6 7.7 208 Ainaro 67.7 2.1 318 24.9 97.8 92.9 19.3 9.7 240 Baucau 5.9 9.6 598 17.5 100.0 96.0 23.2 12.9 529 Bobonaro 52.7 29.0 587 38.0 92.3 81.2 19.2 33.4 521 Covalima 63.9 12.0 322 77.8 97.7 97.6 29.0 17.9 301 Dili 84.7 3.6 1,043 40.7 98.8 96.8 24.5 12.5 1,020 Ermera 47.8 23.9 719 85.7 98.0 96.5 3.3 7.1 512 Lautem 87.7 14.1 444 68.8 98.7 97.3 18.1 8.3 384 Liquiçá 69.0 20.9 358 72.7 95.0 89.1 10.8 11.3 345 Manatuto 87.6 35.0 264 77.4 97.9 94.4 7.9 5.1 252 Manufahi 46.5 6.4 238 47.1 91.6 81.5 18.8 20.1 182 Oecussi 74.2 8.0 492 81.5 91.5 91.3 17.1 17.9 444 Viqueque 65.2 3.0 412 53.6 98.2 94.9 17.9 10.3 326
Mother’s education No education 53.5 14.3 1,980 56.7 94.7 91.2 13.0 13.1 1,552 Primary 64.9 14.7 1,656 58.9 96.8 91.6 14.9 12.6 1,465 Secondary 68.7 11.7 2,226 53.5 98.3 95.9 22.4 15.0 2,093 More than secondary 83.6 6.9 154 45.6 100.0 98.5 36.0 19.8 154
Wealth quintile Lowest 55.1 8.7 1,226 55.7 94.1 90.3 12.9 11.0 945 Second 53.4 14.4 1,171 55.3 95.7 92.4 15.7 13.4 941 Middle 62.0 18.6 1,203 60.8 97.6 93.8 15.0 13.1 1,065 Fourth 66.2 16.9 1,170 58.8 97.5 93.1 17.2 16.2 1,095 Highest 78.0 8.2 1,244 48.9 98.9 96.6 26.8 15.2 1,218
Total 63.1 13.3 6,015 55.7 96.9 93.4 17.9 13.9 5,264
Among women with a live birth in the past five years, 63 percent took iron tablets or syrup
while pregnant with the last birth. There are substantial variations by background characteristics. Two-thirds of women age 20-34 took iron tablets or syrup compared with lower percentages among women in the other age groups. The consumption of iron tablets or syrup is much higher among urban than rural women (76 and 59 percent, respectively), and among women who reside in Lautem, Manatuto, Aileu, and Dili (more than 80 percent each). On the other hand, only 6 percent of women in Baucau took iron tablets or syrup for their last birth in the five years preceding the survey. Not surprisingly, the consumption of iron tablets or syrup increases with the mother’s educational level and household wealth.

Maternal Health | 117
A much lower percentage of Timorese mothers took intestinal parasite drugs (13 percent) while pregnant with their last birth in the five years before the survey. Consumption of drugs for control of intestinal parasites is most common among very young mothers (< 20 years), mothers with children of birth order 6 and higher, rural women, those residing in Manatuto, mothers with no education, and mothers living in households in the middle wealth quintile.
More than half (56 percent) of moth-ers who received ANC reported that they were informed of pregnancy complications during their visit. Surprisingly, urban mothers, those with more than secondary education, and those in the highest wealth quintile are less likely than other mothers to be informed about pregnancy complications. Across districts, mothers living in Baucau are least likely to be informed about signs of pregnancy complications, in contrast with mothers living in Ermera, who are most likely to be informed of the danger signs as-sociated with a pregnancy.
The vast majority of mothers who re-ceived ANC were weighed (97 percent) and had their blood pressure taken (93 percent). A much smaller percentage of women who went for care had a urine or blood sample taken (18 and 14 percent, respectively). Older mothers age 35-49, mothers having their first birth, urban residents, those living in Covalima, highly educated mothers, and those in the highest wealth quintile were more likely than their counterparts to have had their urine sample taken. A similar pattern was seen for blood pressure measurement.
10.4 TETANUS TOXOID VACCINATION
Tetanus toxoid injections are given during pregnancy for the prevention of neo-natal tetanus, a major cause of death among infants. For full protection, a pregnant woman should receive at least two doses during each pregnancy. If a woman has been vaccinated during a previous pregnancy or during maternal and neonatal tetanus vacci-nation campaigns, however, she may only require one dose for the current pregnancy. Five doses provide lifetime protection.
Table 10.4 shows the percentage of women who had a live birth in the five years preceding the survey and whose last birth was protected against neonatal tetanus, according to background characteristics. Three-quarters of mothers with a live birth in the five years preceding the survey received two or more tetanus toxoid injections during their last pregnancy, and four-fifths were protected for their last birth.
Table 10.4 Tetanus toxoid injections
Among mothers age 15-49 with a live birth in the five years preceding the survey, the percentage receiving two or more tetanus toxoid injections (TTI) during the pregnancy for the last live birth and the percentage whose last live birth was protected against neonatal tetanus, according to background characteristics, Timor-Leste 2009-10
Background characteristic
Percentage receiving two
or more injections during last pregnancy
Percentage whose last birth was protected
against neonatal tetanus1
Number of mothers
Mother’s age at birth <20 78.8 80.0 35820-34 78.2 81.9 3,96635-49 69.6 74.7 1,691
Birth order 1 80.9 82.2 8492-3 79.4 83.4 1,7484-5 75.2 80.5 1,5166+ 70.7 74.8 1,902
Residence Urban 76.9 84.3 1,484Rural 75.4 78.3 4,531
District Aileu 88.3 90.8 220Ainaro 63.0 66.7 318Baucau 81.9 82.4 598Bobonaro 75.6 78.1 587Covalima 87.0 89.4 322Dili 76.5 86.8 1,043Ermera 62.7 65.5 719Lautem 75.2 80.5 444Liquiçá 81.0 84.3 358Manatuto 91.6 94.8 264Manufahi 68.6 71.2 238Oecussi 73.8 75.8 492Viqueque 75.4 77.4 412
Mother’s education No education 67.6 70.0 1,980Primary 77.5 81.2 1,656Secondary 81.1 86.3 2,226More than secondary 87.7 94.8 154
Wealth quintile Lowest 67.9 70.2 1,226Second 69.9 72.8 1,171Middle 77.4 81.0 1,203Fourth 80.0 84.5 1,170Highest 83.6 90.1 1,244
Total 75.8 79.8 6,015
1 Includes mothers with two injections during the pregnancy of her last birth, or two or more injections (the last within 3 years of the last live birth), or three or more injections (the last within 5 years of the last birth), or four or more injections (the last within ten years of the last live birth), or five or more injections prior to the last birth.

118 | Maternal Health
Mothers less than 20 years of age and mothers of first-order births are more likely (79 percent and 81 percent, respectively) to have received two or more tetanus injections during their last pregnancy than older mothers age 35-49 (70 percent) and mothers of higher order births (71 percent and above). Mothers in Manatuto are most likely to have received two or more tetanus toxoid injections (92 percent) and to have had their last birth protected against neonatal tetanus (95 percent) compared with mothers in all other districts; tetanus toxoid coverage is lowest among mothers in Ermera and Ainaro. Education and wealth have a positive effect on whether women receive tetanus toxoid injections. For example, 88 percent of mothers with more than secondary education received at least two injections during their last pregnancy, compared with 68 percent of mothers with no education. Similarly, 84 percent of mothers in the highest wealth quintile received at least two doses of tetanus toxoid injection, compared with 68 percent of mothers in the lowest quintile.
10.5 KNOWLEDGE OF DANGER SIGNS DURING PREGNANCY
The 2009-10 TLDHS also included women’s knowledge of danger signs associated with pregnancy. It is important for mothers and their families to recognize danger signs during pregnancy so that they can seek timely medical care. Women who responded that they had been told about danger signs associated with pregnancy during one of their ANC visits were asked to describe the symptoms they associated with the need to seek immediate care.
Table 10.5 shows the percentage of women with a birth in the five years preceding the survey who could name various symptoms that indicate the need to seek immediate care. Fifty-six percent of women mentioned severe abdominal pain as a danger sign, 47 percent mentioned severe headache, 36 percent mentioned vaginal bleeding, 26 percent mentioned blurred vision and swelling of the hands and face, and 11 percent mentioned convulsions.
Severe abdominal pain is most commonly reported as a danger sign by mothers more than age 20, mothers with births of order 2 and higher, Baucau residents, and those mothers with secondary education. Note that a higher percentage of rural mothers are able to cite the various danger signs than urban mothers, with the pattern by other background characteristics being less consistent.

Maternal Health | 119
Table 10.5 Knowledge of danger signs during pregnancy
Percentage with a live birth in the five years preceding the survey who can name various symptoms during pregnancy that indicate the need to seek immediate care, according to background characteristics, Timor-Leste 2009-10
Background characteristic
Vaginal bleeding
Severe abdominal
pain Severe
headache Convulsions
Blurred vision and swelling of hands and
face Other/
don’t know Number of
women
Mother’s age at birth <20 36.8 47.5 47.9 9.8 25.6 13.2 358 20-34 37.0 56.9 45.4 11.1 25.9 12.4 3,966 35-49 34.5 56.9 48.7 9.8 27.8 11.8 1,691
Birth order 1 36.0 53.3 43.0 8.9 26.7 13.0 849 2-3 35.2 56.2 45.8 10.1 25.4 12.9 1,748 4-5 36.1 57.6 48.2 11.2 27.2 11.0 1,516 6+ 37.6 56.7 47.3 11.4 26.6 12.4 1,902
Residence Urban 32.8 55.8 35.7 6.4 21.0 12.2 1,484 Rural 37.5 56.5 50.0 12.0 28.2 12.3 4,531
District Aileu 48.5 71.6 45.5 13.6 17.5 8.2 220 Ainaro 32.2 47.4 40.4 15.1 40.3 4.3 318 Baucau 25.5 80.9 35.5 3.8 43.3 2.0 598 Bobonaro 34.2 26.1 41.5 2.7 30.8 14.9 587 Covalima 27.3 52.9 37.2 13.8 9.8 13.8 322 Dili 32.6 55.9 35.9 3.6 19.8 11.1 1,043 Ermera 53.8 53.6 70.8 16.2 19.1 2.0 719 Lautem 29.6 60.9 21.5 26.3 15.7 21.0 444 Liquiçá 31.6 57.0 32.9 12.1 29.5 16.5 358 Manatuto 37.5 69.1 71.2 8.9 29.1 23.2 264 Manufahi 58.6 61.9 37.8 10.9 17.9 10.1 238 Oecussi 30.1 52.3 85.8 6.1 57.4 14.3 492 Viqueque 43.1 58.6 47.7 20.6 7.6 30.4 412
Education No education 34.1 54.2 50.6 11.6 28.5 13.1 1,980 Primary 36.9 54.4 48.8 10.8 27.7 12.6 1,656 Secondary 37.3 59.8 41.7 9.9 24.1 11.3 2,226 More than secondary 44.9 53.9 38.9 7.5 19.2 11.8 154
Wealth quintile Lowest 31.7 55.6 48.9 10.9 28.7 18.0 1,226 Second 36.7 56.8 48.2 12.2 29.4 10.6 1,171 Middle 39.8 54.3 48.8 13.5 26.6 10.7 1,203 Fourth 38.2 56.9 46.9 11.6 25.0 10.8 1,170 Highest 35.4 57.9 40.0 5.3 22.6 11.0 1,244
Total 36.3 56.3 46.5 10.6 26.4 12.3 6,015
10.6 DELIVERY CARE
Proper medical attention and hygienic conditions during delivery can reduce the risk of complications and infections that may cause the death or serious illness of the mother, the baby, or both. Hence, an important component in the effort to reduce the health risks to mothers and children is to increase the proportion of babies delivered in a safe, clean environment and under the supervision of health professionals.
10.6.1 Place of Delivery
Table 10.6 presents the percent distribution of live births in the five years preceding the survey, by place of delivery and by percentage delivered in a health facility, according to background characteristics. Just over one in five births are delivered in a health facility, with the vast majority delivered in a public (21 percent) rather than in a private (1 percent) facility. The majority of births (78 percent) are delivered at home. Delivery in a health facility is more common among younger mothers (25 percent), mothers of first-order births (31 percent), and mothers who have had at least four antenatal visits (31 percent). More than half (53 percent) of the children in urban areas are born

120 | Maternal Health
Table 10.6 Place of delivery
Percent distribution of live births in the five years preceding the survey by place of delivery and percentage delivered in a health facility, according to background characteristics, Timor-Leste 2009-10
Background characteristic
Health facility
Home Missing Total
Percentage delivered in a health
facility Number of
births
Public sector
Private sector
Mother’s age at birth <20 23.4 1.1 75.2 0.3 100.0 24.5 745 20-34 22.8 0.7 76.3 0.1 100.0 23.5 6,789 35-49 16.8 0.3 82.8 0.0 100.0 17.0 2,294
Birth order 1 29.8 1.0 69.1 0.2 100.0 30.8 1,679 2-3 26.0 1.0 72.8 0.1 100.0 27.0 2,964 4-5 19.5 0.5 79.7 0.1 100.0 20.1 2,415 6+ 13.1 0.2 86.5 0.0 100.0 13.3 2,770
Residence Urban 50.5 2.3 46.7 0.3 100.0 52.8 2,353 Rural 12.3 0.1 87.5 0.1 100.0 12.4 7,475
District Aileu 11.7 0.0 87.8 0.3 100.0 11.7 359 Ainaro 7.2 0.0 92.7 0.1 100.0 7.2 579 Baucau 21.1 0.0 78.8 0.0 100.0 21.1 970 Bobonaro 16.1 0.0 83.7 0.1 100.0 16.1 934 Covalima 28.0 0.2 71.4 0.4 100.0 28.2 453 Dili 60.1 3.2 36.2 0.4 100.0 63.3 1,652 Ermera 3.0 0.2 96.8 0.0 100.0 3.2 1,252 Lautem 20.5 0.1 79.3 0.0 100.0 20.7 758 Liquiçá 12.5 0.6 86.9 0.0 100.0 13.1 582 Manatuto 25.4 0.0 74.6 0.0 100.0 25.4 433 Manufahi 11.0 0.2 88.9 0.0 100.0 11.1 393 Oecussi 4.4 0.3 95.4 0.0 100.0 4.6 783 Viqueque 13.9 0.1 85.7 0.0 100.0 14.1 678
Mother’s education No education 7.1 0.1 92.8 0.0 100.0 7.2 3,298 Primary 15.1 0.5 84.2 0.2 100.0 15.5 2,765 Secondary 36.5 1.3 62.0 0.1 100.0 37.8 3,546 More than secondary 73.7 1.7 24.7 0.0 100.0 75.3 218
Antenatal care visits1 None 1.6 0.0 98.3 0.0 100.0 1.6 751 1-3 23.2 0.9 75.9 0.0 100.0 24.1 1,919 4+ 30.7 0.6 68.7 0.0 100.0 31.3 3,312
Wealth quintile Lowest 5.2 0.0 94.7 0.0 100.0 5.2 2,090 Second 7.0 0.1 92.9 0.0 100.0 7.1 1,960 Middle 12.8 0.2 86.9 0.1 100.0 13.0 1,992 Fourth 27.1 0.8 71.7 0.3 100.0 27.9 1,903 Highest 57.8 2.2 39.6 0.1 100.0 60.1 1,884
Total 21.4 0.7 77.8 0.1 100.0 22.1 9,828
Note: Total includes 33 cases with information missing on number of ANC visits.1 Includes only the most recent birth in the five years preceding the survey
in a health facility, compared with only 12 percent in rural areas. Delivery in a health facility also varies by district, with facility delivery in Dili being much more likely than in any other district (63 percent). Less than 10 percent of births in Ermera, Oecussi, and Ainaro are delivered in a health facility. There is a strong association between health facility delivery, mother’s education, and wealth quintile. The proportion of deliveries in a health facility is 7 percent among births to mothers with no education; this compares with 75 percent among births to mothers with more than secondary education. A similar pattern is seen in terms of wealth quintiles: delivery at a health facility is significantly less likely among births to mothers in the lowest two wealth quintiles (5 percent and 7 percent, respectively), compared with 60 percent of births in the highest wealth quintile.

Maternal Health | 121
10.6.2 Assistance during Delivery
Obstetric care from a trained provider during delivery is critical for the reduction of maternal and neonatal mortality. Home deliveries are usually less likely to be assisted by a health professional, whereas health facility deliveries are more likely to be assisted by a trained health professional.
Table 10.7 shows the distribution of live births in the five years preceding the survey by the person assisting during delivery. Thirty percent of births are delivered by a skilled provider (doctor, nurse, assistant nurse, or midwife), with a nurse or midwife being the most common skilled provider. Three percent of deliveries are performed by a doctor, and less than 1 percent are performed by an assistant nurse. Nearly one-fifth of deliveries are carried out by traditional birth attendants (18 percent). Women receive assistance from a relative or some other person for nearly one in two births (49 percent), while 3 percent of births take place without any type of assistance at all.
Table 10.7 Assistance during delivery
Percent distribution of live births in the five years preceding the survey by person providing assistance during delivery, percentage of births assisted by a skilled birth attendant, and percentage delivered by caesarean-section, according to background characteristics, Timor-Leste 2009-10
Background characteristic
Person providing assistance during delivery Percentage delivered
by a skilled birth
attendant1
Percentage delivered
by C-section
Number of births Doctor
Nurse/ midwife
Assistant nurse
Traditional birth
attendant Relative/
other No one
Don’t know/ missing Total
Mother’s age at birth <20 1.1 31.4 0.5 20.1 44.7 1.8 0.3 100.0 33.0 0.9 745 20-34 3.1 27.8 0.6 17.7 48.2 2.6 0.0 100.0 31.5 1.9 6,789 35-49 2.9 20.8 0.6 17.8 52.5 5.5 0.0 100.0 24.3 1.6 2,294
Birth order 1 4.1 34.5 0.6 17.4 41.9 1.3 0.2 100.0 39.2 3.6 1,679 2-3 3.3 30.9 0.5 17.9 45.3 2.0 0.0 100.0 34.8 1.6 2,964 4-5 2.1 24.9 0.7 18.7 50.4 3.2 0.1 100.0 27.7 1.2 2,415 6+ 2.3 18.2 0.5 17.6 55.8 5.6 0.0 100.0 21.0 1.1 2,770
Place of delivery Health facility 12.3 85.9 1.0 0.3 0.4 0.0 0.0 100.0 99.3 7.8 2,171 Elsewhere 0.2 9.6 0.5 23.0 62.7 4.1 0.0 100.0 10.3 0.0 7,646
Residence Urban 7.6 50.9 0.6 16.5 22.8 1.5 0.1 100.0 59.1 4.0 2,353 Rural 1.4 18.8 0.6 18.4 57.1 3.7 0.0 100.0 20.7 1.0 7,475
District Aileu 3.4 19.6 0.7 10.1 61.5 4.3 0.3 100.0 23.8 0.9 359 Ainaro 0.6 9.9 0.0 2.0 85.9 1.6 0.0 100.0 10.5 0.3 579 Baucau 1.6 25.3 0.7 5.6 65.6 1.3 0.0 100.0 27.5 0.7 970 Bobonaro 0.9 24.4 0.2 3.9 61.1 9.3 0.1 100.0 25.6 1.8 934 Covalima 3.1 37.5 0.0 11.9 45.8 1.6 0.0 100.0 40.6 1.9 453 Dili 9.3 59.1 0.5 17.9 12.7 0.4 0.1 100.0 68.9 4.8 1,652 Ermera 1.1 10.9 0.1 23.5 62.2 2.2 0.0 100.0 12.1 0.1 1,252 Lautem 1.9 23.5 0.6 26.3 44.9 2.8 0.0 100.0 25.9 2.0 758 Liquiçá 2.1 19.8 1.5 4.7 64.7 7.2 0.0 100.0 23.4 1.4 582 Manatuto 1.6 35.3 0.0 23.7 31.5 7.8 0.0 100.0 36.9 1.6 433 Manufahi 2.0 16.0 0.9 36.5 37.8 6.8 0.0 100.0 19.0 1.3 393 Oecussi 1.6 8.0 0.2 62.6 26.3 1.4 0.0 100.0 9.8 0.6 783 Viqueque 1.4 21.2 2.7 2.7 70.3 1.8 0.0 100.0 25.2 1.7 678
Mother’s education No education 0.9 12.3 0.3 20.5 60.8 5.2 0.0 100.0 13.5 0.5 3,298 Primary 1.8 20.3 0.7 20.7 53.2 3.2 0.2 100.0 22.7 1.3 2,765 Secondary 5.0 41.5 0.8 14.1 37.1 1.6 0.0 100.0 47.2 2.6 3,546 More than secondary 13.7 73.7 0.0 5.7 6.8 0.0 0.0 100.0 87.5 11.1 218
Wealth quintile Lowest 0.6 9.4 0.6 24.0 60.5 4.8 0.0 100.0 10.6 0.6 2,090 Second 1.1 12.4 0.6 18.8 63.4 3.6 0.0 100.0 14.2 0.5 1,960 Middle 1.8 19.0 0.8 16.7 57.9 3.8 0.0 100.0 21.5 0.8 1,992 Fourth 3.6 33.4 0.4 15.9 43.7 2.7 0.2 100.0 37.5 2.3 1,903 Highest 7.7 60.9 0.5 13.6 16.6 0.8 0.0 100.0 69.0 4.7 1,884
Total 2.9 26.4 0.6 17.9 48.9 3.2 0.0 100.0 29.9 1.7 9,828
Note: If the respondent mentioned more than one person attending during delivery, only the most qualified person is considered in this tabulation. Total includes 11 births with information missing on place of delivery. 1 Skilled birth attendant includes doctor, nurse, midwife, and assistant nurse.

122 | Maternal Health
Skilled providers are most likely to attend births to young mothers less than age 20 and first- order births (33 percent and 39 percent, respectively). Not surprisingly, an overwhelming majority of births delivered in a health facility are attended by a skilled provider as opposed to births delivered elsewhere.
Three-fifths of urban births (59 percent) are assisted by skilled providers, compared with 21 percent of births in rural areas. Births in Dili are most likely to be attended by skilled providers (69 percent). Less than 10 percent of births in Oecussi are attended by skilled providers.
Highly educated mothers are most likely to have their births delivered by skilled attendants (88 percent) as are mothers in the wealthiest households (69 percent).
Less than 2 percent of births are delivered by caesarean section. Not surprisingly all C-section deliveries take place in health facilities, primarily in urban areas, to highly educated mothers who are also from wealthy households. Of the districts, C-section deliveries are most common in Dili (5 percent).
10.7 NEWBORN CARE
Women who did not deliver their last-born child in a health facility were asked about the practice of taking care of newborns, including cord cutting practices, application of materials on the umbilical cord after cutting, and drying and bathing of newborn children. Women were also asked about their knowledge of danger signs for a newborn that would prompt mothers to seek immediate attention.
10.7.1 Knowledge of Danger Signs for Newborns
Skilled care for mothers and their newborns is critical in the first month following delivery. Timorese mothers were asked to name symptoms indicating the need to seek immediate health care for an infant within one month of delivery. Table 10.8 shows the percentage of women with a live birth in the five years preceding the survey who can name various symptoms in a newborn that indicate the need to seek immediate care.
About three-quarters of mothers mentioned fever as a symptom needing immediate care. Lesser percentages mentioned poor suckling (35 percent), fast breathing (23 percent), pustules on the skin (12 percent), infection or discharge around the umbilical cord (11 percent), and severe chest indrawing (9 percent) as danger signs needing immediate medical attention. As noted with knowledge of pregnancy danger signs, rural mothers are more likely than urban mothers to mention each of these danger signs.

Maternal Health | 123
Table 10.8 Knowledge of danger signs for newborns
Percentage with a live birth in the five years preceding the survey who can name various symptoms in an infant within one month after birth that indicate the need to seek immediate care, according to background characteristics, Timor-Leste 2009-10
Background characteristic
Poor suckling
Fast breathing
Severe chest
indrawing Fever Pustules
on the skin
Infection/ discharge
around the umbilical
cord Hypo-
thermia
Difficult to wake/
lethargic Other Don’t know
Number of women
Mother’s age at birth <20 37.3 21.9 7.5 71.0 9.1 9.0 3.0 4.3 16.5 7.1 358 20-34 35.3 22.7 8.9 72.3 12.7 11.2 3.6 4.8 15.7 5.3 3,966 35-49 35.0 23.1 9.1 74.4 10.7 11.9 2.3 3.6 15.8 5.2 1,691
Birth order 1 35.0 21.5 7.0 69.9 10.5 11.3 3.2 5.1 16.2 6.4 849 2-3 35.0 22.9 9.1 71.7 12.6 11.2 3.5 4.6 15.5 4.8 1,747 4-5 34.7 22.6 9.1 74.8 13.7 10.9 3.0 4.8 17.6 5.6 1,516 6+ 36.4 23.3 9.3 73.5 10.4 11.7 3.1 3.6 14.3 5.3 1,902
Residence Urban 31.5 20.1 4.5 72.2 11.6 9.6 1.6 4.1 15.2 4.0 1,484 Rural 36.6 23.6 10.3 73.0 12.0 11.8 3.7 4.5 15.9 5.9 4,531
District Aileu 44.3 25.0 17.3 72.2 11.1 14.6 6.0 8.7 14.5 2.9 220 Ainaro 34.9 28.7 18.8 57.1 8.6 4.0 13.0 11.0 12.2 1.6 318 Baucau 49.1 25.0 12.3 69.1 4.7 32.6 2.0 1.6 1.7 0.5 598 Bobonaro 37.3 10.4 1.3 55.3 2.8 16.0 1.4 0.7 6.4 11.7 587 Covalima 32.7 21.2 11.0 66.3 5.3 1.1 4.0 9.2 12.2 1.4 322 Dili 31.7 17.6 2.9 76.5 14.0 9.9 1.5 2.7 13.9 3.2 1,043 Ermera 38.6 7.6 7.6 91.1 12.3 1.6 0.7 4.6 17.9 0.6 719 Lautem 16.6 28.1 3.9 90.8 2.2 3.4 2.2 0.7 8.0 4.3 444 Liquiçá 19.3 12.9 13.0 70.1 15.8 5.9 2.6 3.2 25.3 3.9 358 Manatuto 63.0 21.2 10.2 78.4 25.6 24.0 5.4 12.3 26.0 4.4 264 Manufahi 36.3 43.8 13.6 43.4 12.9 20.8 3.4 5.6 9.0 6.1 238 Oecussi 31.0 55.6 9.4 92.5 33.8 12.0 1.0 4.3 57.4 0.6 492 Viqueque 34.5 24.6 15.3 52.4 9.1 4.4 8.8 6.1 4.1 33.4 412
Education No education 35.3 20.4 9.7 71.7 12.4 10.8 3.1 4.5 16.1 6.5 1,980 Primary 33.2 25.2 8.4 74.7 12.6 10.2 3.4 4.2 17.5 5.4 1,656 Secondary 36.6 22.7 8.8 72.2 11.1 12.8 3.0 4.4 13.6 4.6 2,226 More than secondary 41.3 27.7 3.8 75.2 9.5 8.0 3.8 6.9 22.3 1.7 154
Wealth quintile Lowest 34.6 28.9 9.9 71.9 12.7 9.8 3.4 4.2 19.0 9.2 1,226 Second 35.9 24.0 10.7 71.8 12.3 12.3 3.5 3.7 13.9 5.3 1,171 Middle 35.8 21.2 9.9 74.3 9.5 10.8 3.4 5.2 14.6 5.0 1,203 Fourth 35.5 20.3 8.2 71.8 12.1 11.4 3.0 5.1 15.9 4.2 1,170 Highest 34.9 19.4 5.6 74.2 12.8 12.1 2.6 3.9 15.2 3.1 1,244
Total 35.3 22.8 8.9 72.8 11.9 11.3 3.2 4.4 15.7 5.4 6,015
10.7.2 Care for Umbilical Cord
The primary care of newborns includes the proper practice of cutting the umbilical cord. Traditionally, the cord is usually cut with a razor blade, knife, scissors, or even a piece of bamboo, none of which is generally sterile. In some cultures, the cord is not cut until the placenta is delivered, and it is cut only after cord pulsation stops upon the delivery of the placenta. Table 10.9 shows that a new or boiled blade was used in only one in five of the most recent noninstitutional births. The most common instrument used in noninstitutional births was a pair of scissors (56 percent), with a knife or bamboo used in 12 percent and 10 percent of births, respectively. A used blade cut the umbilical cord in a very small percentage of births (2 percent). Scissors were used in a high number (82 percent) of recent noninstitutional births in Liquiçá.
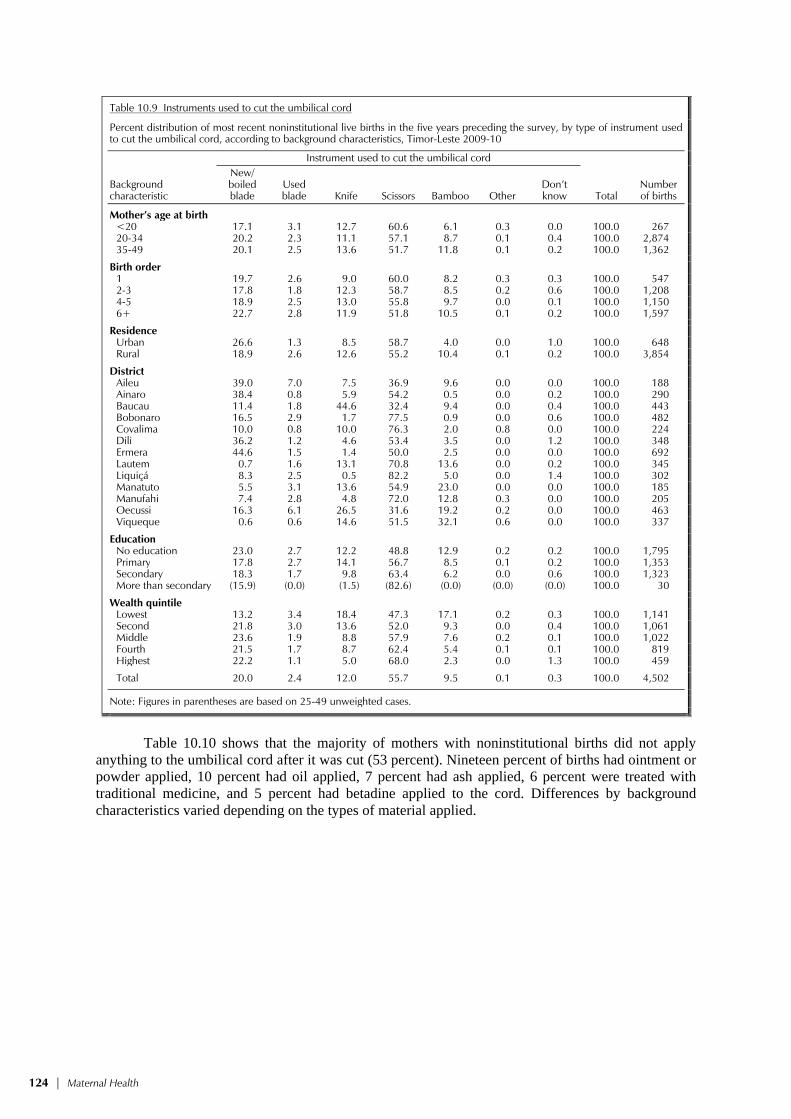
124 | Maternal Health
Table 10.9 Instruments used to cut the umbilical cord
Percent distribution of most recent noninstitutional live births in the five years preceding the survey, by type of instrument used to cut the umbilical cord, according to background characteristics, Timor-Leste 2009-10
Background characteristic
Instrument used to cut the umbilical cord
Total Number of births
New/ boiled blade
Used blade Knife Scissors Bamboo Other
Don’t know
Mother’s age at birth <20 17.1 3.1 12.7 60.6 6.1 0.3 0.0 100.0 267 20-34 20.2 2.3 11.1 57.1 8.7 0.1 0.4 100.0 2,874 35-49 20.1 2.5 13.6 51.7 11.8 0.1 0.2 100.0 1,362
Birth order 1 19.7 2.6 9.0 60.0 8.2 0.3 0.3 100.0 547 2-3 17.8 1.8 12.3 58.7 8.5 0.2 0.6 100.0 1,208 4-5 18.9 2.5 13.0 55.8 9.7 0.0 0.1 100.0 1,150 6+ 22.7 2.8 11.9 51.8 10.5 0.1 0.2 100.0 1,597
Residence Urban 26.6 1.3 8.5 58.7 4.0 0.0 1.0 100.0 648 Rural 18.9 2.6 12.6 55.2 10.4 0.1 0.2 100.0 3,854
District Aileu 39.0 7.0 7.5 36.9 9.6 0.0 0.0 100.0 188 Ainaro 38.4 0.8 5.9 54.2 0.5 0.0 0.2 100.0 290 Baucau 11.4 1.8 44.6 32.4 9.4 0.0 0.4 100.0 443 Bobonaro 16.5 2.9 1.7 77.5 0.9 0.0 0.6 100.0 482 Covalima 10.0 0.8 10.0 76.3 2.0 0.8 0.0 100.0 224 Dili 36.2 1.2 4.6 53.4 3.5 0.0 1.2 100.0 348 Ermera 44.6 1.5 1.4 50.0 2.5 0.0 0.0 100.0 692 Lautem 0.7 1.6 13.1 70.8 13.6 0.0 0.2 100.0 345 Liquiçá 8.3 2.5 0.5 82.2 5.0 0.0 1.4 100.0 302 Manatuto 5.5 3.1 13.6 54.9 23.0 0.0 0.0 100.0 185 Manufahi 7.4 2.8 4.8 72.0 12.8 0.3 0.0 100.0 205 Oecussi 16.3 6.1 26.5 31.6 19.2 0.2 0.0 100.0 463 Viqueque 0.6 0.6 14.6 51.5 32.1 0.6 0.0 100.0 337
Education No education 23.0 2.7 12.2 48.8 12.9 0.2 0.2 100.0 1,795 Primary 17.8 2.7 14.1 56.7 8.5 0.1 0.2 100.0 1,353 Secondary 18.3 1.7 9.8 63.4 6.2 0.0 0.6 100.0 1,323 More than secondary (15.9) (0.0) (1.5) (82.6) (0.0) (0.0) (0.0) 100.0 30
Wealth quintile Lowest 13.2 3.4 18.4 47.3 17.1 0.2 0.3 100.0 1,141 Second 21.8 3.0 13.6 52.0 9.3 0.0 0.4 100.0 1,061 Middle 23.6 1.9 8.8 57.9 7.6 0.2 0.1 100.0 1,022 Fourth 21.5 1.7 8.7 62.4 5.4 0.1 0.1 100.0 819 Highest 22.2 1.1 5.0 68.0 2.3 0.0 1.3 100.0 459
Total 20.0 2.4 12.0 55.7 9.5 0.1 0.3 100.0 4,502
Note: Figures in parentheses are based on 25-49 unweighted cases.
Table 10.10 shows that the majority of mothers with noninstitutional births did not apply
anything to the umbilical cord after it was cut (53 percent). Nineteen percent of births had ointment or powder applied, 10 percent had oil applied, 7 percent had ash applied, 6 percent were treated with traditional medicine, and 5 percent had betadine applied to the cord. Differences by background characteristics varied depending on the types of material applied.

Maternal Health | 125
Table 10.10 Application of material after the umbilical cord was cut
Percentage of most recent noninstitutional live births in the five years preceding the survey, by material applied to the cord immediately after cutting and tying it, according to background characteristics, Timor-Leste 2009-10
Background characteristic
Material applied to the cord
Number of births Oil Ash
Ointment/ powder
Traditional medicine Betadine
Other/ don’t know
Nothing applied to
cord
Mother’s age at birth <20 10.5 5.4 23.7 5.3 3.4 3.7 53.5 267 20-34 9.1 7.2 19.3 5.9 5.7 4.8 52.6 2,874 35-49 10.2 7.0 18.0 5.0 5.0 4.8 54.6 1,362
Birth order 1 9.9 7.3 21.5 6.1 3.6 6.4 50.3 547 2-3 9.7 7.3 19.7 5.7 6.1 4.5 51.4 1,208 4-5 9.5 8.0 18.9 5.9 6.0 5.0 52.8 1,150 6+ 9.3 6.0 18.1 5.1 5.0 4.3 56.1 1,597
Residence Urban 6.5 8.8 26.9 3.5 6.8 4.9 47.9 648 Rural 10.0 6.7 17.9 5.9 5.1 4.7 54.2 3,854
District Aileu 9.7 19.7 13.3 4.5 8.7 2.0 51.3 188 Ainaro 6.5 3.5 35.3 3.2 2.1 2.3 48.1 290 Baucau 8.4 18.6 23.8 1.3 4.7 2.3 46.5 443 Bobonaro 46.3 3.6 10.4 8.1 3.1 2.3 35.5 482 Covalima 19.6 0.9 16.9 2.5 15.4 6.8 47.1 224 Dili 4.1 14.5 30.1 1.7 3.5 5.0 47.4 348 Ermera 0.3 0.2 19.3 7.9 2.6 0.0 75.9 692 Lautem 4.9 4.9 23.5 4.1 4.1 1.0 59.6 345 Liquiçá 12.3 2.2 8.3 2.3 13.3 4.9 59.0 302 Manatuto 3.2 5.3 25.2 10.0 8.6 19.3 32.2 185 Manufahi 2.7 12.7 34.9 2.7 6.0 11.1 33.4 205 Oecussi 0.4 8.4 12.6 7.9 3.4 4.2 64.4 463 Viqueque 1.2 5.1 6.3 12.1 5.9 15.8 53.9 337
Education No education 10.0 8.7 15.6 6.1 2.6 4.1 56.5 1,795 Primary 9.0 5.7 21.0 6.5 5.7 4.9 53.4 1,353 Secondary 9.1 6.3 21.7 3.9 8.4 5.5 49.2 1,323 More than secondary (21.8) (0.0) (33.3) (6.6) (18.7) (0.0) (32.9) 30
Wealth quintile Lowest 6.7 8.8 15.3 6.5 2.6 5.1 58.2 1,141 Second 10.1 8.4 17.2 6.7 3.6 4.0 55.0 1,061 Middle 12.1 5.4 19.4 5.3 5.6 4.7 52.9 1,022 Fourth 9.5 5.3 23.2 5.0 6.9 5.2 50.4 819 Highest 9.7 6.3 25.6 2.3 13.2 4.9 43.3 459
Total 9.5 7.0 19.2 5.6 5.4 4.8 53.3 4,502
Note: Figures in parentheses are based on 25-49 unweighted cases.
10.7.3 Drying and Bathing of Newborns
Health professionals recommend not bathing a newborn for at least 24 hours after birth to prevent hypothermia. However, although two-thirds of last-born noninstitutional babies are dried and placed on the mother’s chest before the placenta is delivered, the majority of newborns born in a non-facility are also bathed one to five hours after delivery (Table 10.11). In fact, 27 percent of the noninstitutional newborns are bathed within the first hour of birth.

126 | Maternal Health
Table 10.11 Drying and bathing of newborns
Percentage of most recent noninstitutional live births in the five years preceding the survey who were dried before the delivery of the placenta, and percent distribution of most recent noninstitutional live births in the five years preceding the survey by timing of first bath, according to background characteristics, Timor-Leste 2009-10
Background characteristic
Baby dried before
placenta delivered
Timing of first bath
Number of births
Within the first
hour 1-5
hours 6-23 hours
24 hours later
Don’t know Total
Mother’s age at birth <20 69.5 24.1 71.5 1.6 2.9 0.0 100.0 267 20-34 65.1 28.4 63.5 2.3 5.1 0.8 100.0 2,874 35-49 63.7 23.8 68.7 1.8 5.2 0.5 100.0 1,362
Birth order 1 65.6 24.2 68.5 3.2 3.3 0.8 100.0 547 2-3 65.6 27.8 63.7 2.1 5.7 0.7 100.0 1,208 4-5 64.5 28.4 64.2 1.9 4.8 0.7 100.0 1,150 6+ 64.6 25.7 66.8 1.8 5.2 0.5 100.0 1,597
Residence Urban 69.7 25.5 56.2 4.3 12.8 1.3 100.0 648 Rural 64.2 27.0 67.1 1.7 3.7 0.5 100.0 3,854
District Aileu 79.0 4.3 82.4 5.6 6.8 0.8 100.0 188 Ainaro 93.9 48.3 46.3 3.5 1.1 0.9 100.0 290 Baucau 46.3 10.1 86.8 0.0 2.0 1.1 100.0 443 Bobonaro 95.7 17.0 81.2 0.9 1.0 0.0 100.0 482 Covalima 73.9 21.4 63.6 5.9 9.1 0.0 100.0 224 Dili 79.0 25.9 49.0 5.0 18.5 1.6 100.0 348 Ermera 53.8 26.0 73.5 0.0 0.4 0.0 100.0 692 Lautem 50.8 42.1 43.7 2.2 11.5 0.5 100.0 345 Liquiçá 57.0 36.1 49.9 1.5 12.1 0.5 100.0 302 Manatuto 61.1 36.3 58.0 1.8 3.4 0.6 100.0 185 Manufahi 23.5 11.2 75.5 5.2 6.0 2.0 100.0 205 Oecussi 61.0 31.2 66.4 0.5 0.7 1.2 100.0 463 Viqueque 69.7 36.7 57.6 2.9 2.6 0.3 100.0 337
Education No education 64.9 26.6 68.2 1.4 3.1 0.6 100.0 1,795 Primary 64.5 25.7 67.1 1.7 5.0 0.5 100.0 1,353 Secondary 65.2 28.3 60.6 3.1 7.3 0.8 100.0 1,323 More than secondary (79.5) (14.3) (55.8) (13.3) (16.6) (0.0) 100.0 30
Wealth quintile Lowest 61.2 28.8 65.9 1.5 3.1 0.6 100.0 1,141 Second 62.6 26.0 68.5 1.8 3.1 0.6 100.0 1,061 Middle 67.6 24.9 69.1 1.7 3.9 0.3 100.0 1,022 Fourth 66.7 27.5 62.8 2.4 6.4 0.9 100.0 819 Highest 70.7 26.3 54.7 4.2 13.8 1.0 100.0 459
Total 65.0 26.8 65.5 2.1 5.0 0.6 100.0 4,502
Note: Figures in parentheses are based on 25-49 unweighted cases.
10.8 TIMING OF FIRST POSTNATAL CHECKUP
A large proportion of maternal and neonatal deaths occur during the 24 hours following delivery. In addition, the first two days following delivery are critical for monitoring complications arising from the delivery. A postnatal care visit is also an ideal time to educate a new mother on how to care for herself and her newborn. Safe motherhood programs emphasize the importance of postnatal care, recommending that all women receive at least two postnatal checkups and iron supplementation for 45 days following a delivery.
Table 10.12 shows the percentage of mothers who received postnatal care for their last live birth in the five years preceding the survey. The majority of women (68 percent) did not receive a postnatal check. Among those who received postnatal care, 16 percent received it in less than four hours after delivery, 5 percent received care within 4 to 23 hours, and 3 percent received care within the first two days. Seven percent received postnatal care 3 to 41 days following delivery. Differences by background characteristics are pronounced. Younger mothers (less than 35 years), mothers of first

Maternal Health | 127
Table 10.12 Timing of first postnatal checkup
Among women age 15-49 giving birth in the five years preceding the survey, the percent distribution of the mother’s first postnatal check-up for the last live birth by time after delivery, according to background characteristics, Timor-Leste 2009-10
Background characteristic
Time after delivery of mother’s first postnatal checkup No
postnatal checkup1 Total
Number of women
Less than 4 hours
4-23 hours
2 days
3-41 days
Don’t know/ missing
Mother’s age at birth <20 16.1 4.2 5.1 5.4 0.6 68.6 100.0 358 20-34 17.5 5.8 3.5 7.7 0.2 65.4 100.0 3,966 35-49 14.0 3.6 2.6 6.2 0.3 73.3 100.0 1,691
Birth order 1 21.1 5.9 4.0 7.9 0.2 60.8 100.0 849 2-3 19.9 6.4 3.9 7.7 0.4 61.6 100.0 1,748 4-5 15.5 5.3 2.9 7.0 0.1 69.2 100.0 1,516 6+ 11.8 3.3 3.0 6.3 0.2 75.4 100.0 1,902
Residence Urban 33.5 11.6 5.7 6.2 0.5 42.4 100.0 1,484 Rural 10.8 2.9 2.6 7.4 0.1 76.1 100.0 4,531
District Aileu 14.4 3.1 3.6 4.2 0.8 73.9 100.0 220 Ainaro 7.7 1.2 1.8 8.2 0.2 80.9 100.0 318 Baucau 12.3 9.8 3.1 2.5 0.3 72.0 100.0 598 Bobonaro 8.3 0.8 0.8 15.9 0.4 73.8 100.0 587 Covalima 29.6 4.6 2.1 9.2 0.0 54.4 100.0 322 Dili 40.1 14.5 5.0 5.2 0.6 34.6 100.0 1,043 Ermera 2.5 0.5 0.9 12.3 0.0 83.8 100.0 719 Lautem 13.3 4.0 6.3 3.2 0.0 73.3 100.0 444 Liquiçá 15.6 2.3 3.7 10.3 0.2 67.9 100.0 358 Manatuto 20.0 5.5 8.4 9.4 0.0 56.8 100.0 264 Manufahi 11.7 3.4 2.2 3.2 0.0 79.4 100.0 238 Oecussi 7.0 1.2 3.7 2.6 0.0 85.5 100.0 492 Viqueque 11.7 1.6 2.9 3.8 0.3 79.7 100.0 412
Education No education 6.5 1.5 1.4 7.5 0.1 83.0 100.0 1,980 Primary 13.0 4.2 2.3 6.1 0.2 74.2 100.0 1,656 Secondary 25.7 7.9 5.6 7.5 0.4 53.0 100.0 2,226 More than secondary 46.1 19.8 7.9 8.4 0.0 17.8 100.0 154
Wealth quintile Lowest 6.6 1.2 1.1 4.6 0.0 86.4 100.0 1,226 Second 6.6 1.5 2.2 5.9 0.0 83.8 100.0 1,171 Middle 10.7 2.7 3.1 9.1 0.1 74.3 100.0 1,203 Fourth 19.7 5.6 4.4 8.8 0.4 61.0 100.0 1,170 Highest 37.9 14.1 5.8 7.1 0.6 34.5 100.0 1,244
Total 16.4 5.1 3.4 7.1 0.2 67.8 100.0 6,015
1 Includes women who received a checkup after 41 days
births, urban residents, women in Dili, highly educated women, and wealthy women were more likely than their counterparts to receive care in less than four hours following delivery. Older mothers, those having births of order six and higher, rural mothers, uneducated mothers, and those in the poorest households are most likely not to receive postnatal care at all. Mothers residing in Oecussi, Ermera, and Ainaro are least likely to receive postnatal care.
10.9 TYPE OF PROVIDER OF FIRST POSTNATAL CHECKUP
Table 10.13 presents information on the provider of postnatal care, according to the mothers’ background characteristics. In Timor-Leste, 31 percent of mothers obtain postnatal care from a health professional, and women do not get postnatal care from traditional birth attendants. More than two in three (68 percent) do not receive any postnatal care within 41 days, which almost marks the end of the postnatal period.

128 | Maternal Health
Table 10.13 Type of provider of first postnatal checkup
Among women age 15-49 giving birth in the five years preceding the survey, the percent distribution by type of provider of the mother’s first postnatal health check for the last live birth, according to background characteristics, Timor-Leste 2009-10
Background characteristic
Type of health provider of mother’s first postnatal checkup No
postnatal checkup1 Total
Number of women
Doctor/ nurse/
midwife
Auxiliary nurse/
midwife
Community health worker
Traditional birth
attendant Other
Don’t know/ missing
Mother’s age at birth <20 30.9 0.2 0.2 0.1 0.0 0.0 68.6 100.0 358 20-34 33.8 0.6 0.1 0.0 0.0 0.1 65.4 100.0 3,966 35-49 26.0 0.7 0.0 0.0 0.0 0.0 73.3 100.0 1,691
Birth order 1 38.4 0.8 0.1 0.0 0.0 0.0 60.8 100.0 849 2-3 37.6 0.5 0.1 0.0 0.0 0.0 61.6 100.0 1,748 4-5 29.7 0.8 0.2 0.0 0.0 0.0 69.2 100.0 1,516 6+ 23.9 0.5 0.0 0.0 0.0 0.1 75.4 100.0 1,902
Residence Urban 56.9 0.4 0.1 0.0 0.0 0.1 42.4 100.0 1,484 Rural 23.1 0.7 0.1 0.0 0.0 0.0 76.1 100.0 4,531
District Aileu 25.4 0.3 0.2 0.2 0.0 0.0 73.9 100.0 220 Ainaro 18.8 0.0 0.0 0.0 0.2 0.0 80.9 100.0 318 Baucau 28.0 0.0 0.0 0.0 0.0 0.0 72.0 100.0 598 Bobonaro 25.2 0.7 0.3 0.0 0.0 0.0 73.8 100.0 587 Covalima 44.4 1.1 0.0 0.0 0.0 0.0 54.4 100.0 322 Dili 64.9 0.2 0.1 0.0 0.0 0.2 34.6 100.0 1,043 Ermera 16.2 0.0 0.0 0.0 0.0 0.0 83.8 100.0 719 Lautem 25.5 1.2 0.1 0.0 0.0 0.0 73.3 100.0 444 Liquiçá 28.6 3.3 0.2 0.0 0.0 0.0 67.9 100.0 358 Manatuto 43.0 0.0 0.2 0.0 0.0 0.0 56.8 100.0 264 Manufahi 20.3 0.2 0.0 0.0 0.0 0.0 79.4 100.0 238 Oecussi 13.4 0.9 0.2 0.0 0.0 0.0 85.5 100.0 492 Viqueque 19.1 1.0 0.0 0.0 0.2 0.0 79.7 100.0 412
Education No education 16.3 0.6 0.1 0.0 0.0 0.0 83.0 100.0 1,980 Primary 24.9 0.7 0.1 0.0 0.0 0.0 74.2 100.0 1,656 Secondary 46.2 0.6 0.2 0.0 0.0 0.1 53.0 100.0 2,226 More than secondary 82.2 0.0 0.0 0.0 0.0 0.0 17.8 100.0 154
Wealth quintile Lowest 12.5 1.0 0.0 0.0 0.0 0.0 86.4 100.0 1,226 Second 15.9 0.2 0.1 0.0 0.0 0.0 83.8 100.0 1,171 Middle 25.1 0.6 0.0 0.0 0.1 0.0 74.3 100.0 1,203 Fourth 37.8 0.9 0.3 0.0 0.0 0.0 61.0 100.0 1,170 Highest 64.8 0.4 0.1 0.0 0.1 0.2 34.5 100.0 1,244
Total 31.4 0.6 0.1 0.0 0.0 0.0 67.8 100.0 6,015
1 Includes women who received a checkup after 41 days
Differentials in type of postnatal care provider are similar to those for postnatal care coverage
in general. The likelihood of women receiving postnatal care from health professionals decreases with increasing parity. Women in the highest wealth quintile are more than five times as likely to receive postnatal care from a health professional as those in the lowest wealth quintile. Similarly, mothers with more than secondary education are five times as likely to receive postnatal care from a health professional as those with no education. Women in urban areas are more likely to receive postnatal care from a health professional than those in rural areas (57 percent and 24 percent, respectively). Finally, women in Oecussi (14 percent) have least access to a postnatal checkup from a health professional because of the low level of facility-based delivery care in this district.
10.10 PROBLEMS IN ACCESSING HEALTH CARE
Many factors can prevent women from getting medical advice or treatment for themselves when they are sick. Information on such factors is particularly important in understanding and addressing the barriers women may face in seeking care during pregnancy and at the time of delivery.

Maternal Health | 129
Where health services are present, there are many factors—social, cultural, and economic—that cause women not to use the services, particularly when the health concern is related to sexual or reproductive matters. Information on such factors is particularly important in understanding and addressing the barriers women face in seeking care during pregnancy and at the time of delivery. In the 2009-10 TLDHS, women were asked whether each of the following factors would be a big problem or not a big problem in seeking health care for themselves: getting permission to go for treatment, getting money for treatment, distance to a health facility, having to take transportation, not wanting to go alone to the health facility, concern that there may not be a female provider, concern that there may be no health provider, and concern that there may be no drugs available. The results are shown in Table 10.14.
Table 10.14 Problems in accessing health care
Percentage of women age 15-49 who reported that they have serious problems in accessing health care for themselves when they are sick, by type of problem, according to background characteristics, Timor-Leste 2009-10
Background characteristic
Problems in accessing health care
Number of women
Getting permission to go for treatment
Getting money for treatment
Distance to health facility
Having to take
transport
Not wanting to go alone
Concern no female
provider available
Concern no provider
available
Concern no drugs
available
At least one problem accessing
health care
Age 15-19 24.9 37.8 53.2 59.6 48.4 64.9 81.9 86.5 96.0 3,144 20-34 22.7 33.6 52.5 58.0 42.6 61.7 81.4 85.8 95.7 5,774 35-49 22.3 36.6 54.4 61.0 40.1 63.7 84.1 87.9 96.2 4,219
Number of living
children 0 24.3 36.4 51.6 57.9 45.6 63.3 80.9 85.7 95.6 5,178 1-2 21.4 32.5 52.6 57.4 42.1 61.5 83.1 87.4 96.0 2,350 3-4 22.4 34.7 53.3 58.7 41.2 60.3 83.2 86.9 95.8 2,554 5+ 22.9 37.4 56.7 63.9 41.7 66.2 83.7 87.5 96.6 3,055
Marital status Never married 24.6 36.9 51.5 57.9 45.9 63.1 80.5 85.6 95.6 4,675
Married or living together 22.3 34.7 54.3 60.3 41.7 63.1 83.4 87.3 96.1 7,906
Divorced/separated/ widowed 21.9 37.5 53.7 58.2 41.8 63.2 83.1 86.1 95.8 556
Employed last 12 months Not employed 26.8 38.8 55.6 60.0 42.3 63.0 84.0 87.8 96.1 7,951 Employed for cash 16.7 20.7 38.1 42.3 33.2 41.6 81.7 85.3 93.7 1,054 Employed not for cash 17.5 33.3 52.6 62.5 47.5 68.6 79.5 84.9 96.1 4,130
Residence Urban 21.5 28.1 32.3 35.3 32.5 41.3 78.6 83.7 94.2 3,439 Rural 23.7 38.3 60.7 67.9 47.0 70.8 83.7 87.7 96.6 9,698
District Aileu 46.1 64.2 71.2 74.8 69.9 74.3 90.1 92.6 95.4 554 Ainaro 28.4 56.3 59.3 48.9 46.8 71.4 86.6 89.2 91.8 619 Baucau 46.8 54.5 62.5 87.0 13.9 70.4 97.2 97.5 98.9 1,408 Bobonaro 2.3 12.3 40.8 42.6 48.7 60.1 64.5 91.4 96.1 1,262 Covalima 40.5 61.1 77.4 62.3 50.6 43.6 83.6 83.8 95.4 781 Dili 19.7 23.9 26.1 30.6 34.1 32.8 75.8 82.4 94.7 2,466 Ermera 5.5 10.3 42.8 77.9 53.2 91.9 68.3 66.3 99.8 1,542 Lautem 47.8 57.8 74.3 75.7 69.7 84.5 99.2 99.2 99.6 864 Liquiçá 26.8 43.3 53.6 50.6 35.9 64.3 68.7 70.5 83.9 801 Manatuto 19.1 42.3 58.4 44.6 34.7 68.2 84.1 83.5 90.6 603 Manufahi 4.4 16.4 41.3 54.9 53.4 28.9 89.5 92.4 96.1 470 Oecussi 11.7 33.8 70.0 61.4 15.2 74.7 94.5 97.4 98.3 884 Viqueque 18.0 39.6 79.2 84.5 73.2 75.3 97.5 97.6 100.0 882
Education No education 20.8 38.1 60.0 68.3 45.4 71.8 82.3 86.2 97.0 3,854 Primary 23.7 39.0 59.1 63.8 43.9 66.0 83.4 88.1 95.9 3,005 Secondary 24.1 32.8 47.9 53.8 42.4 57.5 82.3 86.2 95.4 5,829 More than secondary 26.6 27.7 27.5 24.6 29.3 41.4 77.7 86.1 93.9 449
Wealth quintile Lowest 24.6 48.8 72.1 75.8 48.1 72.9 90.6 93.2 97.8 2,314 Second 24.6 39.1 62.7 73.2 49.9 74.1 83.7 86.8 96.9 2,468 Middle 22.0 36.6 57.9 66.5 46.8 69.7 80.5 84.8 96.2 2,590 Fourth 22.7 32.2 50.7 55.5 41.2 62.9 80.2 85.6 95.4 2,687 Highest 22.1 25.1 29.9 33.3 32.7 41.5 78.7 84.0 93.9 3,077
Total 23.1 35.6 53.3 59.4 43.2 63.1 82.4 86.6 95.9 13,137
Note: Total includes 2 women with information missing on employment status.

130 | Maternal Health
More than ninety-six percent of Timorese women reported that they have at least one problem when they access health care for themselves. The two major concerns were no availability of drugs (87 percent) and no availability of a health care provider (82 percent). Concern about not having a female provider is also sizeable (63 percent). Women had about equal concern regarding the distance to the health facility and having to take transport (more than one in two women). Getting permission to go for treatment was the least of women’s worries (23 percent). Two in five considered not wanting to go alone to be a problem. In general, women with more than secondary education and women in the highest wealth quintile were least likely to report having a serious problem in accessing health facilities.

Child Health | 131
CHILD HEALTH 11
This chapter presents the findings on child health from the 2009-10 TLDHS. Its focus is on vaccination status and treatment practices that are commonly used for children experiencing three major childhood illnesses: acute respiratory infection (ARI), fever, and diarrhea. Information on children’s birth weight and size, treatment practices, and contact with health facilities when children are sick paves the way for strategic planning and implementation of programs to reduce neonatal and infant mortality. Combined with data on childhood mortality, this information can be used to identify subgroups of women and children at increased risk because of non-use of maternal and child health (MCH) services and to assist with planning effective improvements for these services.
Information was obtained for all live births that occurred in the five years preceding the survey. Wherever possible, data from the 2009-10 TLDHS are compared with data from the earlier DHS survey in Timor-Leste, conducted in 2003. However, caution should be used in interpreting the trend data due to differences in the definitions and methodology used in these surveys.
11.1 CHILD’S SIZE AT BIRTH
A child’s birth weight or size at birth is an important indicator of the child’s vulnerability to the risk of childhood illnesses and the child’s chances of survival. Children whose birth weight is less than 2.5 kilograms, or children reported to be “very small” or “smaller than average” are considered to have a higher-than-average risk of early childhood death. Birth weight was recorded in the questionnaire, if available from written records or mother’s recall, for all births in the five years preceding the survey. Because birth weight may not be known for many babies, and particularly for babies delivered at home and who are not weighed at birth, the mother’s estimate of the baby’s size at birth was also obtained. Even though it is subjective, it can be a useful proxy for the weight of the child. Table 11.1 presents information on children’s weight and size at birth.
Birth weight was reported for only 26 percent of births in the five years preceding the survey. It is unlikely that these births are representative of all births because births in urban areas and births to mothers in higher wealth quintiles are over-represented, and the pattern of birth weights by background characteristics is likely to be biased. Nevertheless it is important to note that 10 percent of babies weighed at birth were less than 2.5 kilograms. Low birth-weight babies are twice as likely to be born to mothers less than age 20 at birth, and they are more likely to be first-order births, births born to mothers who smoked cigarettes/tobacco, and births to uneducated mothers. One in four children in Ainaro, one in five children in Aileu, and one in six children in Ermera and Manufahi who were weighed at birth are of low weight. Differences by urban-rural residence and wealth quintile are minimal.
Most children were reported by their mothers as average or larger at birth (82 percent), while 10 percent of children were reported as smaller than average, and 5 percent were reported as very small at birth. The characteristics of mothers with very small children at birth are similar to the characteristics of children whose weight at birth was less than 2.5 kilograms, consistent with the notion that a mother’s description of the size of the baby at birth is a good proxy in the absence of a recorded weight. Children born to very young mothers (<20 years), first-order births, children born to mothers who smoke, and children of mothers with no education, are more often reported to be very small at birth than children of other mothers. In addition, rural children are twice as likely as urban children to be reported as very small. Nearly one in five children born in Manufahi and one in six children born in Oecussi are reported as very small at birth. Children born in the poorest households are also more likely to be reported as very small at birth.

132 | Child Health
Table 11.1 Child’s weight and size at birth
Percent distribution of live births in the five years preceding the survey with a reported birth weight by birth weight; percent distribution of all live births in the five years preceding the survey by mother’s estimate of baby’s size at birth and percentage of all births with a reported birth weight, according to background characteristics, Timor-Leste 2009-10
Background characteristic
Percent distribution of births with a reported
birth weight1
Total Number of
births
Percentage of all births
with a reported
birth weight
Percent distribution of all live births by size of child at birth
Total Number of
births Less than
2.5 kg 2.5 kg or
more Very small
Smaller than
average Average or
larger
Don’t know/ missing
Mother’s age at birth <20 18.0 82.0 100.0 209 28.1 6.3 12.0 80.1 1.7 100.0 745 20-34 9.6 90.4 100.0 1,874 27.6 4.9 10.5 82.3 2.3 100.0 6,789 35-49 8.5 91.5 100.0 503 21.9 5.5 9.7 82.6 2.2 100.0 2,294
Birth order 1 12.3 87.7 100.0 592 35.3 6.1 11.5 80.8 1.6 100.0 1,679 2-3 9.0 91.0 100.0 911 30.7 5.0 10.7 82.2 2.1 100.0 2,964 4-5 9.0 91.0 100.0 592 24.5 5.2 10.5 82.2 2.2 100.0 2,415 6+ 10.8 89.2 100.0 491 17.7 4.8 9.4 83.2 2.6 100.0 2,770
Mother’s smoking status
Smokes cigarettes/ tobacco 13.6 86.4 100.0 87 18.3 6.9 17.3 74.3 1.4 100.0 478
Does not smoke 9.9 90.1 100.0 2,498 26.7 5.1 10.1 82.6 2.2 100.0 9,350
Residence Urban 10.1 89.9 100.0 1,310 55.7 2.9 12.3 81.9 2.9 100.0 2,353 Rural 10.1 89.9 100.0 1,275 17.1 5.9 9.8 82.3 2.0 100.0 7,475
District Aileu 20.0 80.0 100.0 74 20.7 2.1 5.5 90.9 1.5 100.0 359 Ainaro 24.0 76.0 100.0 44 7.7 1.4 3.2 94.8 0.7 100.0 579 Baucau 12.0 88.0 100.0 218 22.4 1.0 8.2 90.8 0.0 100.0 970 Bobonaro 7.7 92.3 100.0 287 30.7 13.1 13.1 73.2 0.6 100.0 934 Covalima 8.6 91.4 100.0 168 37.1 1.4 2.4 95.8 0.4 100.0 453 Dili 9.1 90.9 100.0 1,063 64.3 2.0 12.5 81.9 3.6 100.0 1,652 Ermera 17.8 82.2 100.0 47 3.7 1.2 1.5 97.3 0.0 100.0 1,252 Lautem 3.7 96.3 100.0 196 25.8 8.0 25.5 49.2 17.4 100.0 758 Liquiçá 16.0 84.0 100.0 109 18.7 4.4 18.8 76.5 0.4 100.0 582 Manatuto 12.9 87.1 100.0 121 27.8 0.9 1.5 97.4 0.1 100.0 433 Manufahi 17.9 82.1 100.0 58 14.7 18.5 17.7 63.3 0.5 100.0 393 Oecussi 8.5 91.5 100.0 55 7.1 17.7 17.8 64.5 0.0 100.0 783 Viqueque 8.2 91.8 100.0 146 21.5 0.5 4.5 94.4 0.6 100.0 678
Mother’s education No education 13.7 86.3 100.0 349 10.6 6.4 9.6 82.1 1.9 100.0 3,298 Primary 11.1 88.9 100.0 560 20.3 6.0 11.6 79.8 2.6 100.0 2,765 Secondary 8.8 91.2 100.0 1,506 42.5 3.6 10.0 84.2 2.2 100.0 3,546 More than secondary 10.6 89.4 100.0 171 78.4 1.4 13.7 84.0 0.9 100.0 218
Wealth quintile Lowest 10.6 89.4 100.0 172 8.2 8.3 11.0 77.5 3.1 100.0 2,090 Second 16.5 83.5 100.0 218 11.1 5.5 9.4 83.1 2.0 100.0 1,960 Middle 11.7 88.3 100.0 365 18.3 4.8 9.3 84.4 1.6 100.0 1,992 Fourth 10.5 89.5 100.0 635 33.4 4.3 10.9 83.0 1.7 100.0 1,903 Highest 8.1 91.9 100.0 1,195 63.4 2.5 11.5 83.5 2.5 100.0 1,884
Total 10.1 89.9 100.0 2,586 26.3 5.2 10.4 82.2 2.2 100.0 9,828
1 Based on either a written record or the mother’s recall
11.2 VACCINATION COVERAGE
The 2009-10 TLDHS collected information on immunization coverage for all children born in the five years before the survey. The government of Timor-Leste has adopted the World Health Organization (WHO) and UNICEF guidelines for vaccinating children. According to these guidelines, to be considered fully vaccinated, a child should receive the following vaccinations: one dose each of BCG and measles, three doses of polio vaccine (after polio 0, given at birth), and three doses of DPT. Currently, the tetravalent vaccine DPT-HepB introduced in 2007 has replaced the previous DPT vaccine, so in effect, children fully vaccinated in more recent years are also protected against Hepatitis B. BCG, which protects against tuberculosis, is recommended at birth or at first clinical contact. DPT-HepB protects against diphtheria, pertussis (whooping cough), tetanus, and Hepatitis B. A dose of polio vaccine is recommended at birth (Polio 0) or within 2 weeks/14 days of birth. The DPT-HepB and polio vaccine schedule recommends three vaccinations at approximately 6, 10, and 14 weeks of age. The measles vaccine is recommended at age 9 months. It is recommended that children receive the complete schedule of vaccinations before age 12 months.

Child Health | 133
In the TLDHS, information on vaccination coverage was obtained in two ways—from health cards (LISIO) and from mother’s verbal reports. All mothers were asked to show the interviewer the health cards on which the child’s immunizations are recorded. If the card was available, the interviewer copied the dates of each vaccination received. If a vaccination was not recorded on the card, the mother was asked to recall whether that particular vaccination had been given. If the mother was not able to present a card for a child, she was asked to recall whether the child had received BCG, polio, DPT-HepB, and measles vaccinations. If she recalled that the child had received the polio or DPT-HepB vaccines, she was asked about the number of doses that the child received.
The data presented here are for children age 12-23 months, the youngest cohort of children who have reached the age by which they should be fully vaccinated, and are restricted to children who were alive at the time of the survey. Table 11.2 shows the percentage of children age 12-23 months who received specific vaccines at any time before the survey by source of information. Fifty-three percent of Timorese children age 12-23 months are fully immunized, and 23 percent received no vaccinations (Figure 11.1). Forty-seven percent of children age 12-23 months are fully vaccinated by 12 months of age.
Table 11.2 Vaccinations by source of information
Percentage of children age 12-23 months who received specific vaccines at any time before the survey, by source of information (vaccination card or mother’s report), and percentage vaccinated by 12 months of age, Timor-Leste 2009-10
Source of information BCG
DPT Polio1 Hepatitis B
Measles
All basic vaccina-
tions2
No vaccina-
tions
Number of
children 1 2 3 0 1 2 3 1 2 3
Vaccinated at any
time before survey Vaccination card 49.4 49.0 47.8 47.0 47.7 49.1 47.9 47.0 49.0 47.6 46.8 44.6 44.4 0.0 870 Mother’s report 27.3 26.1 23.5 19.4 17.6 25.7 21.4 9.1 25.7 22.6 18.9 23.2 8.2 22.6 882 Either source 76.7 75.1 71.3 66.4 65.3 74.9 69.3 56.2 74.6 70.3 65.7 67.8 52.6 22.7 1,752
Vaccinated by 12 months of age3 76.6 74.2 69.9 64.2 65.2 74.0 68.1 54.4 73.7 69.0 62.9 60.0 47.2 23.1 1,752
1 Polio 0 is the polio vaccination given at birth.2 BCG, measles and three doses each of DPT and polio vaccine (excluding polio vaccine given at birth) 3 For children whose information was based on the mother’s report, the proportion of vaccinations given during the first year of life was assumed to be the same as for children with a written record of vaccination.
Figure 11.1 Immunization Coverage of Children
12-23 Months
62
51 4840
18 18
77
66
56
68
53
23
BCG DPT3 Polio3 Measles Allvaccinations
Novaccinations
0
20
40
60
80
100Percent of children 12-23 months
DHS 2003 TLDHS 2009-10
Timor-Leste 2009-10

134 | Child Health
Looking at coverage for specific vaccines, 77 percent of children received the BCG vaccination, 75 percent received the first DPT dose, and 75 percent received the first polio dose. Coverage for all three vaccinations declines with subsequent doses; 66 percent of children received the recommended three doses of DPT, and 56 percent received three doses of polio. These figures reflect dropout rates (which represent the proportion of children who received the first dose of a vaccine but who did not get the third dose) of 12 percent for DPT and 25 percent for polio, respectively. This is a huge improvement from 2003 when the dropout rates for DPT and polio were 45 and 62 percent, respectively. It is interesting to note that dropout rates for polio are higher than for DPT despite the fact that these vaccines should be given together. This may be related to polio vaccination being deliberately withheld when a child has diarrhea or to parental concern for a child receiving it during an episode of diarrhea and refusing it. Sixty-eight percent of children received the measles vaccine (Figure 11.1). Hepatitis B coverage varies slightly from DPT coverage, although they have been given together in a tetravalent vaccine since 2007. This difference is likely due to the inclusion of a small number of children who received the DPT vaccine before the tetravalent vaccine was introduced.
Table 11.3 shows the percentages of children age 12-23 months who received specific vaccines at any time before the survey (according to a vaccination card or the mother’s report) and the percentages with a vaccination card.
Table 11.3 Vaccinations by background characteristics
Percentage of children age 12-23 months who received specific vaccines at any time before the survey (according to a vaccination card or the mother’s report), and percentage with a vaccination card, by background characteristics, Timor-Leste 2009-10
Background characteristic BCG
DPT Polio1 Hepatitis B
Measles
All basic vaccina-
tions2
No vaccina-
tions
Percentage with a
vaccina-tion card
seen
Number of
children 1 2 3 0 1 2 3 1 2 3
Sex Male 77.8 76.3 72.4 68.6 66.6 76.3 70.8 58.4 75.5 71.5 68.2 69.0 54.3 21.6 51.8 894 Female 75.7 73.8 70.1 64.1 64.1 73.3 67.8 53.8 73.7 69.0 63.2 66.5 50.8 23.8 47.4 859
Birth order 1 80.7 78.8 75.4 71.4 67.5 78.3 75.5 60.9 78.4 74.6 70.8 70.6 57.9 19.3 54.9 323 2-3 77.7 75.3 71.3 67.4 66.1 75.5 70.0 54.1 75.0 70.5 66.1 70.3 51.1 21.4 45.7 505 4-5 77.7 76.6 72.9 67.0 67.6 76.0 70.2 55.6 76.2 71.9 66.8 68.6 51.1 21.4 50.0 418 6+ 72.5 71.3 67.3 61.8 61.3 71.0 64.0 55.6 70.6 66.0 61.3 62.9 51.9 27.1 49.9 507
Residence Urban 85.3 81.1 77.3 70.9 74.3 80.7 73.3 49.2 80.2 75.7 69.5 74.3 47.7 14.5 43.7 424 Rural 74.0 73.2 69.3 65.0 62.5 73.0 68.1 58.4 72.8 68.5 64.5 65.7 54.1 25.3 51.5 1,328
District Aileu 88.0 87.2 87.2 86.4 77.7 88.0 88.0 83.2 87.2 87.2 85.6 83.3 79.2 12.0 73.6 66 Ainaro 59.3 56.7 54.6 52.0 57.9 57.2 54.1 51.7 56.0 53.9 52.0 50.4 46.1 40.7 32.3 113 Baucau 58.2 58.2 53.0 51.8 49.4 59.1 52.7 50.7 58.2 53.0 51.8 52.0 47.1 40.9 48.0 180 Bobonaro 82.4 82.4 82.4 81.5 74.7 82.4 82.4 56.1 82.8 81.9 81.5 79.8 55.2 17.6 49.7 157 Covalima 91.2 88.5 84.5 81.2 57.0 87.2 85.9 71.4 88.5 80.6 77.3 79.7 61.9 8.8 41.2 69 Dili 86.6 81.7 77.6 70.7 76.3 81.0 72.9 44.1 80.3 75.5 68.6 73.3 43.4 13.4 40.5 281 Ermera 64.6 62.0 56.3 51.5 52.0 63.6 52.9 50.3 62.3 55.8 51.0 54.2 44.6 35.4 45.2 200 Lautem 86.8 87.5 86.0 80.9 80.1 86.4 84.6 75.4 86.8 83.5 79.4 80.1 74.6 12.1 73.8 140 Liquiçá 85.6 80.6 70.6 59.4 66.9 80.6 67.1 50.2 79.9 70.0 59.4 66.3 43.7 14.4 52.2 106 Manatuto 71.8 71.8 71.2 69.3 66.8 71.2 69.3 59.9 71.8 71.2 69.3 64.9 53.6 28.2 48.9 87 Manufahi 69.2 69.1 60.2 53.2 58.9 69.7 60.5 46.4 69.8 59.4 53.3 68.4 42.8 28.6 39.1 80 Oecussi 85.9 86.8 83.4 74.1 65.4 86.8 80.7 63.8 86.8 83.4 74.1 74.8 60.0 10.3 64.2 143 Viqueque 74.4 73.1 69.9 64.4 63.3 69.0 67.5 60.2 70.7 69.1 64.5 66.8 57.1 25.6 48.8 130
Mother’s
education No education 67.9 66.8 61.4 56.6 56.0 66.8 58.5 50.4 66.7 60.8 56.3 58.6 46.6 31.0 45.1 571 Primary 77.3 76.1 72.2 66.2 63.2 74.4 70.1 57.4 75.7 70.9 65.2 67.1 54.0 22.3 50.1 478 Secondary 82.5 80.4 77.9 73.8 73.3 80.6 77.0 61.3 79.7 76.7 72.9 74.8 57.7 17.2 54.3 661
More than secondary (100.0) (90.5) (90.5) (86.8) (90.5) (100.0) (86.8) (39.0) (90.5) (90.5) (86.8) (90.5) (39.0) (0.0) (34.2) 43
Wealth quintile Lowest 64.5 64.4 60.9 54.8 52.5 64.1 59.6 49.1 63.5 59.8 54.2 53.7 43.2 33.9 43.1 381 Second 70.9 68.6 66.2 62.5 60.6 69.0 64.1 56.8 68.5 65.7 62.3 63.7 53.5 28.9 50.6 359 Middle 78.8 77.9 71.9 68.3 64.1 77.8 71.3 58.5 78.2 71.4 68.0 71.0 55.8 20.7 52.3 349 Fourth 84.8 83.3 79.0 75.8 71.1 81.3 77.1 69.0 82.9 78.6 74.0 78.0 65.5 15.0 57.4 346 Highest 87.0 83.3 80.3 72.5 81.3 84.2 76.3 47.2 82.0 77.9 72.0 74.7 45.2 12.5 45.1 317
Total 76.7 75.1 71.3 66.4 65.3 74.9 69.3 56.2 74.6 70.3 65.7 67.8 52.6 22.7 49.6 1,752
Note: Figures in parentheses are based on 25-49 unweighted cases. 1 Polio 0 is the polio vaccination given at birth. 2 BCG, measles, and three doses each of DPT and polio vaccine (excluding polio vaccine given at birth)

Child Health | 135
Boys (54 percent) are somewhat more likely to be fully vaccinated than girls (51 percent). Surprisingly, children in rural areas (54 percent) are more likely to be fully vaccinated than children in urban areas (48 percent). Vaccination coverage varies significantly by district, with Manufahi and Dili having the lowest coverage of fully immunized children at 43 percent each. Aileu and Lautem have the highest coverage of fully immunized children at 79 and 75 percent, respectively. Many of the districts with lower coverage of fully vaccinated children have the highest dropout rates, especially for polio. Dili has a very high dropout rate between polio 1 and polio 3 at 46 percent, compared with less than 5 percent for Aileu. The single biggest reason that full vaccination coverage in rural areas is higher than in urban areas is the very low polio 3 coverage in urban areas (49 percent). In fact all other vaccines have higher coverage in urban than rural areas. Even though oral polio vaccine has minimum side effects and can be given to persons with diarrhea, it can lead to gastrointestinal upset like diarrhea and vomiting, prompting physicians (who operate predominantly in urban areas) to withhold the vaccine from children with diarrhea. Additionally, mothers may not return for follow-up visits upon the physician’s advice to bring their children back once the diarrhea has ceased. The considerably lower coverage in urban areas and particularly in Dili could also be attributed to the 2006 civil unrest in the country, which disrupted all basic health services, severely damaged infrastructure, and displaced thousands of residents from their homes.
Vaccination coverage is highest for first-born children (58 percent), with little difference in coverage for children of birth order two and above (about 51 percent). Children whose mothers attend only primary or secondary school are more likely to be fully vaccinated than children whose mothers have no education. The proportion of children fully vaccinated generally increases with wealth quintile, from 43 percent in the lowest wealth quintile to 66 percent in the fourth quintile, and decreases for children in the highest wealth quintile (45 percent).
11.3 TRENDS IN VACCINATION COVERAGE
Table 11.4 shows by age cohorts the percentage of children age 12-59 months (at the time of the survey) who received specific vaccines by 12 months of age and the percentage with a vaccination card. Thirty-six percent of children received all their vaccinations by 12 months of age. Children in the oldest cohort (48-59 months) were less likely to have received all their vaccinations (28 percent) than children age 12-23 months (47 percent). This pattern is seen with each vaccine but is most marked when all the vaccines are considered together. Vaccination cards were shown to interviewers for 50 percent of children age 12-23 months, compared with 16 percent of children age 48-59 months. The difference may partly be a result of the cards for older children being lost or misplaced over the longer period of time and may partly be due to a better card uptake in more recent years.
Table 11.4 Vaccinations in first year of life
Percentage of children age 12-59 months at the time of the survey who received specific vaccines by 12 months of age, and percentage with a vaccination card, by current age of child, Timor-Leste 2009-10
Age in months BCG
DPT Polio1 Hep B
Measles
All basic vaccina-
tions2
No vaccina-
tions
Percent-age with a vaccina-tion card
seen
Number of
children 1 2 3 0 1 2 3 1 2 3
12-23 76.6 74.2 69.9 64.2 65.2 74.0 68.1 54.4 73.7 69.0 62.9 60.0 47.2 23.1 49.6 1,752 24-35 73.0 70.5 66.6 60.2 58.1 70.3 63.0 45.8 69.6 65.8 58.9 56.5 38.2 26.9 34.7 1,959 36-47 70.7 67.0 64.0 54.7 53.6 67.2 60.2 38.7 66.4 63.4 53.5 51.1 31.4 30.0 26.3 1,947 48-59 64.3 61.7 56.8 49.9 46.7 60.9 52.9 31.8 61.2 56.0 49.2 52.8 27.9 36.3 16.2 1,745
Total 71.6 69.0 64.9 57.6 56.2 68.7 61.5 42.9 68.3 64.1 56.4 55.6 36.3 28.3 31.7 7,403
Note: Information was obtained from the vaccination card or if there was no written record, from the mother. For children whose information was based on the mother’s report, the proportion of vaccinations given during the first year of life was assumed to be the same as for children with a written record of vaccinations. 1 Polio 0 is the polio vaccination given at birth. 2 BCG, measles, and three doses each of DPT and polio vaccine (excluding polio vaccine given at birth)

136 | Child Health
The difference in vaccination coverage by 12-month cohorts from the 2009-10 TLDHS supports a trend towards increased vaccination coverage in 2009-10 compared with previous surveys. An analysis of long-term trends in coverage is shown in Figure 11.2. The percentage of children 12-23 months who are fully vaccinated dropped substantially between the 1997 IDHS and the 2002 MICS, primarily because of the total disruption of all health services following the struggle for independence from Indonesian rule. Coverage has since risen to a high of 53 percent in the most recent DHS. Compared with coverage in the 2003 DHS, coverage against all vaccine antigens increased significantly in the 2009-10 TLDHS. The percentage of children fully vaccinated nearly tripled, increasing from 18 percent in 2003 to 53 percent in 2009-10. However, it is important to note that while the 2003 DHS considered full immunization to include four polio doses, including polio 0 given at birth, the 2009-10 survey does not require children to have received polio 0 in order to have received all basic vaccinations. Recalculating the 2009-10 TLDHS data to include polio 0 in the estimate of children fully immunized confirms that coverage has increased two and a half times, from 18 percent in 2003 to 46 percent in 2009-10. The percentage who received no vaccination is reported at 18 percent in 2003, which is less than the current 2009-10 TLDHS estimate of 23 percent. Although the percentage of children fully immunized increased between the 2003 DHS and the 2007 TLSLS, the relatively lower coverage in the latter survey conducted two years before the 2009-10 TLDHS could be attributed to the disruption of health services following the 2006 civil unrest.
Figure 11.2 Trends in Children 12-23 Months Fully Immunized
56
5
18
27
46
17
59
18
0
23
IDHS 1997 MICS 2002 DHS 2003* TLSLS 2007* TLDHS 2009-10*0
10
20
30
40
50
60
70Percent of children 12-23 months
Fully immunized No vaccinations
Timor-Leste 2009-10* Includes 4 doses of poliou = unavailable
u
11.4 ACUTE RESPIRATORY INFECTION
Acute respiratory infection (ARI) is one of the leading causes of death among young children in Timor-Leste. In the case of pneumonia, early diagnosis and treatment with antibiotics can prevent a large proportion of deaths due to acute respiratory infection (ARI). The prevalence of ARI in the 2009-10 TLDHS was estimated by asking mothers whether their children under age 5 had been ill with a cough accompanied by short, rapid breathing in the two weeks preceding the survey. These symptoms, though compatible with pneumonia, are subjective (i.e., mother’s perception of illness) and were not validated by a medical examination. Table 11.5 shows the percentage of children under 5 years who had a cough accompanied by short, rapid breathing (symptoms of ARI).

Child Health | 137
The data indicate that two percent of children had symptoms of ARI in the two weeks preceding the survey. Differentials in the prevalence of ARI by background characteristics are minimal; however, it is worth noting that the prevalence of ARI symptoms is slightly higher among children age 12-23 months, among children living in urban areas, among children living in Lautem, and among children of mothers who have more than secondary education.
Seven in ten children with symptoms of ARI (71 percent) were taken to a health facility or provider, and 45 percent were prescribed antibiotics (data not shown).
11.5 FEVER
Fever is a symptom of malaria and other acute infections in children. Malaria and other illnesses that cause fever contribute to high levels of malnutrition and mortality. Although fever can occur year-round, malaria is more prevalent after the end of the rainy season. For this reason, temporal factors must be taken into account when interpreting fever as an indicator of malaria prevalence. Because malaria is one of the major causes of death in infancy and childhood in many developing countries, the so-called presumptive treatment of fever with anti-malarial medication is advocated in many countries where malaria is endemic. The survey was fielded over six months, from August 2009 to February 2010. Malaria transmission is at its peak at the end of the wet season, which occurs from November to May (Cooper et al., 2010). Malaria in Timor-Leste is discussed in greater detail in Chapter 13.
Table 11.6 shows the percentage of children under age 5 with fever during the two weeks preceding the survey and the percentage receiving various treatments, by selected background characteristics. One-fifth of children (19 percent) under 5 years of age were reported to have had fever in the past two weeks. Fever is most common among children age 6-11 months (28 percent) and then decreases with age. The prevalence of fever is higher among children who live in urban areas (24 percent) compared with those who live in rural areas (18 percent). District differentials show that the proportion of children with fever is highest in Liquiçá (34 percent) and lowest in Ainaro (5 percent). Fever prevalence increases slightly as wealth quintile increases but shows no clear relationship by education of the mother.
Table 11.5 Prevalence and treatment of symptoms of ARI
Percentage of children under age 5 who had symptoms of acute respiratory infection (ARI) in the two weeks preceding the survey, according to background characteristics, Timor-Leste 2009-10
Background characteristic
Children under age 5 Percentage
with symptoms of ARI1
Number of children
Age in months <6 1.9 9836-11 2.3 94212-23 2.8 1,75224-35 2.1 1,95936-47 2.0 1,94748-59 1.3 1,745
Sex Male 2.0 4,742Female 2.2 4,586
Mother’s smoking status Smokes cigarettes/tobacco 2.4 453Does not smoke 2.0 8,875
Cooking fuel Electricity or gas 2.1 196Kerosene 0.2 216Coal/lignite * 1Charcoal (0.0) 31Wood/straw2 2.1 8,885
Residence Urban 2.8 2,269Rural 1.8 7,059
District Aileu 2.6 340Ainaro 1.1 536Baucau 0.0 941Bobonaro 3.6 884Covalima 3.0 426Dili 2.3 1,597Ermera 1.2 1,172Lautem 5.6 719Liquiçá 3.0 550Manatuto 0.9 416Manufahi 0.8 369Oecussi 2.5 734Viqueque 0.3 644
Mother’s education No education 1.7 3,122Primary 2.0 2,611Secondary 2.3 3,381More than secondary 3.9 214
Wealth quintile Lowest 1.5 1,973Second 2.0 1,834Middle 2.3 1,875Fourth 2.3 1,819Highest 2.3 1,827
Total 2.1 9,328
Note: Figures in parentheses are based on 25-49 unweighted cases. An asterisk indicates that a figure is based on fewer than 25 unweighted cases and has been suppressed. 1 Symptoms of ARI (cough accompanied by short, rapid breathing which was chest-related) is considered a proxy for pneumonia. 2 Includes grass, shrubs, crop residues

138 | Child Health
Seventy-three percent of children with a fever were taken to a health facility or provider for treatment. Six percent of children under age 5 with fever in the two weeks preceding the survey were given antimalarial drugs, and 36 percent received antibiotics. According to the Integrated Management of Childhood Illness (IMCI) and the national malaria treatment guidelines, all children with fever should be tested for malaria parasites using either a microscope or rapid diagnostic test (RDT) for final diagnosis or classification. Thus, not all children with fever are treated with antimalarial drugs. Treatment of malaria is also dependent on the availability of appropriate antimalarial drugs, RDTs, and microscopy tests in health facilities or at SISCa. However, in the absence of the primary use of RDTs, the use of microscopy testing is promoted in health facilities, and patients with fever are immediately prescribed paracetamol or antibiotics even before the malaria test results are returned (see detailed discussion in Chapter 13). Differentials in the percentage of children for whom advice or treatment is sought by background characteristics such as mother’s education and wealth status are minimal.
Table 11.6 Prevalence and treatment of fever
Among children under age 5, the percentage who had a fever in the two weeks preceding the survey; and among children with fever, the percentage of children for whom treatment was sought from a health facility or provider, the percentage who took antimalarial drugs, and the percentage who took antibiotic drugs, by background characteristics, Timor-Leste 2009-10
Background characteristic
Among children underage 5: Children under age 5 with fever
Percentage with fever
Number of children
Percentage for whom advice or treatment was sought
from a health facility or provider1
Percentage who took
antimalarial drugs
Percentage who took antibiotic
drugs Number of
children
Age in months <6 14.7 983 63.4 3.9 33.7 145 6-11 27.8 942 74.2 4.0 35.6 262 12-23 23.4 1,752 72.1 6.9 40.6 410 24-35 21.3 1,959 75.3 6.4 38.0 417 36-47 17.6 1,947 71.3 5.8 32.5 342 48-59 12.3 1,745 76.0 5.3 33.3 214
Sex Male 18.7 4,742 73.4 6.4 35.5 887 Female 19.7 4,586 72.2 5.1 37.1 903
Residence Urban 24.1 2,269 77.5 5.2 35.1 546 Rural 17.6 7,059 70.7 5.9 36.8 1,243
District Aileu 14.9 340 80.8 24.2 49.9 51 Ainaro 4.9 536 (38.8) (5.9) (30.8) 26 Baucau 14.9 941 80.5 1.1 62.8 140 Bobonaro 26.4 884 78.7 1.4 34.5 234 Covalima 20.0 426 79.8 8.5 19.9 85 Dili 24.6 1,597 79.3 5.1 30.6 392 Ermera 12.7 1,172 69.4 15.2 20.3 149 Lautem 29.6 719 66.9 1.7 31.7 213 Liquiçá 33.8 550 66.7 7.7 37.8 186 Manatuto 19.3 416 81.3 1.4 59.2 80 Manufahi 11.3 369 55.7 5.8 35.7 42 Oecussi 20.6 734 56.1 1.9 35.0 151 Viqueque 6.3 644 (80.2) (21.9) (66.7) 41
Mother’s education No education 17.7 3,122 68.3 7.7 32.5 552 Primary 20.6 2,611 70.3 3.7 32.2 539 Secondary 19.2 3,381 77.6 5.2 42.9 648 More than secondary 23.7 214 (86.6) (10.9) (35.7) 51
Wealth quintile Lowest 16.1 1,973 58.6 5.1 33.8 317 Second 16.9 1,834 68.9 4.7 33.4 310 Middle 18.6 1,875 77.1 5.6 41.0 348 Fourth 22.6 1,819 73.2 6.9 32.0 410 Highest 22.1 1,827 82.7 5.9 40.8 404
Total 19.2 9,328 72.8 5.7 36.3 1,790
Note: Figures in parentheses are based on 25-49 unweighted cases.1 Excludes pharmacy, shop, and traditional practitioner

Child Health | 139
11.6 DIARRHEAL DISEASE
Dehydration caused by severe diarrhea is a major cause of morbidity and mortality among young children in Timor-Leste, although the condition can be easily treated with oral rehydration therapy (ORT) and zinc. Exposure to diarrhea-causing agents is frequently related to the use of contaminated water and to unhygienic practices in food preparation and disposal of excreta. In the 2009-10 TLDHS, mothers were asked whether any of their children under 5 years of age had diarrhea during the two weeks preceding the survey. If a child had diarrhea, the mother was asked about feeding practices during the diarrheal episode and about what actions were taken to treat the diarrhea. However, the validity of this indicator is affected by the mother’s perception of diarrhea as an illness and her capacity to recall the events. Moreover, because the prevalence of diarrhea varies seasonally, the results of the 2009-10 TLDHS—which pertain to the fieldwork period from August to February—should be interpreted with caution.
11.6.1 Incidence and Treatment of Diarrhea
Table 11.7 shows the percentage of children under age 5 with diarrhea in the two weeks preceding the survey, by selected background characteristics. Overall, 16 percent of all children under the age of 5 had diarrhea in the two weeks before the survey, and 1 percent had diarrhea with blood.
Not surprisingly, very young children are least likely to have had diarrhea, presumably because most of them are exclusively breastfed and hence less exposed to contaminated food. Diarrhea is relatively more common among young children age 6–11 months (22 percent) and age 12–23 months (25 percent), with prevalence declining at older ages. Age 12-23 months is when children start walking and are at increased risk of contamination from the environment. The introduction of other liquids and foods at the time of weaning can also facilitate the spread of disease-causing microbes. Prevalence of diarrhea among children is highest in Liquiçá (25 percent) and lowest in Ainaro (4 percent). Additionally, prevalence of diarrhea is highest among female children; children who live in urban areas, children whose mothers have more than secondary education, and children with mothers in the higher wealth quintiles. This anomaly in the prevalence of diarrhea may be due to the fact that urban, educated, and wealthy mothers are more likely than other mothers to recognize diarrhea as a serious childhood illness and report it. In the same vein, it is not surprising that diarrhea prevalence is
Table 11.7 Prevalence of diarrhea
Percentage of children under age 5 who had diarrhea in the two weeks preceding the survey, by background characteristics, Timor-Leste 2009-10
Background characteristics
Diarrhea in the two weeks preceding the survey
All diarrhea Diarrhea with
blood Number of
children
Age in months <6 7.9 0.4 9836-11 22.2 1.5 94212-23 25.1 2.3 1,75224-35 17.2 1.4 1,95936-47 12.5 0.7 1,94748-59 8.5 0.4 1,745
Sex Male 14.6 1.2 4,742Female 16.6 1.1 4,586
Source of drinking water1 Improved 16.5 1.2 6,079Not improved 13.8 1.1 3,249
Toilet facility2 Improved, not shared 17.2 1.2 3,728Non-improved or shared 14.5 1.1 5,600
Residence Urban 18.9 1.1 2,269Rural 14.5 1.1 7,059
District Aileu 12.7 1.4 340Ainaro 3.9 0.4 536Baucau 15.1 0.4 941Bobonaro 20.1 0.8 884Covalima 18.1 2.4 426Dili 19.7 1.1 1,597Ermera 12.8 0.4 1,172Lautem 21.7 2.0 719Liquiçá 25.3 1.1 550Manatuto 11.9 1.2 416Manufahi 8.4 0.5 369Oecussi 16.7 2.9 734Viqueque 4.6 1.1 644
Mother’s education No education 13.7 1.0 3,122Primary 15.9 1.5 2,611Secondary 16.8 1.1 3,381More than secondary 18.8 0.9 214
Wealth quintile Lowest 13.1 1.1 1,973Second 13.6 1.2 1,834Middle 15.4 0.5 1,875Fourth 18.8 1.8 1,819Highest 17.2 1.0 1,827
Total 15.6 1.1 9,328
1 See Table 2.7 for definition of categories. 2 See Table 2.8 for definition of categories.

140 | Child Health
higher among children who live in households with improved drinking water and in households that do not share toilet facilities.
Mothers of children with diarrhea in the two weeks preceding the survey were asked what was done to manage or treat the illness. Table 11.8 shows the percentage of children with diarrhea who were taken to a health facility or provider for treatment, the percentage who received ORT, and the percentage who were given other treatments, by background characteristics.
Overall, 72 percent of children with diarrhea were taken to a health provider for treatment of diarrhea. Children age 48-59 months are more likely than children in other age groups to be taken to a health facility or provider for treatment (79 percent). Differences in treatment-seeking behavior by gender of the child, urban-rural residence, and mother’s education are small. Children in the highest wealth quintile are more likely than other children to be taken to a health facility or provider for treatment when they have diarrhea.
During diarrhea, oral rehydration therapy (ORT), which involves giving children a solution prepared by mixing water with a commercially prepared packet of oral rehydration salts (ORS) or recommended home fluids (RHF)—usually a home-made sugar-salt-water solution—is a simple and effective remedy for dehydration. In the 2009-10 TLDHS, 78 percent of children with diarrhea were treated either with ORS (71 percent) or RHF (40 percent). Ten percent of children were given increased fluids. Overall, 79 percent of children under age 5 with diarrhea were treated with ORT or increased fluids.
Use of ORS varies by age from 50 percent among children less than age 6 months to 72 percent among children age 48-59 months. ORS use is higher among female than male children and among children without bloody diarrhea. There is little difference in the use of ORS by mother’s education, but ORS use varies by districts, ranging from 59 percent in Manufahi to 92 percent in Baucau. There is no clear pattern in regard to ORS use and wealth quintiles.
Antibiotics are generally not recommended for treating nonbloody diarrhea in young children. In the 2009-10 TLDHS, 6 percent of children with diarrhea were treated with antibiotics, with no notable difference between bloody and nonbloody diarrhea (7 percent and 6 percent, respectively). Giving antibiotics to treat diarrhea is most likely in children age 6-11 months and in children in urban areas. Home remedies were given to 18 percent of children with diarrhea, and 13 percent of children with diarrhea were given no treatment at all.
Zinc is offered along with ORT to children with diarrhea as per IMCI protocol. Zinc is not a substitute for ORT but when taken in addition to ORT, it reduces the severity and duration of diarrhea. Table 11.8 shows that 6 percent of children with diarrhea received zinc only. Children living in urban areas and in Dili are most likely to have received zinc. Children whose mothers completed secondary or higher education and those in the highest wealth quintile were also more likely to receive zinc than children of mothers with no education and children in the lowest wealth quintile.

Child Health | 141
Table 11.8 Diarrhea treatment
Among children under age 5 who had diarrhea in the two weeks preceding the survey, the percentage for whom advice or treatment was sought from a health facility or provider, the percentage given oral rehydration therapy (ORT), the percentage given increased fluids, the percentage given ORT or increased fluids, and the percentage who were given other treatments, by background characteristics, Timor-Leste 2009-10
Background characteristic
Percentage of children
with diarrhea for whom advice or treatment was sought
from a health facility or provider1
Oral rehydration therapy (ORT) Other treatments
No treat-ment
Number of children
ORS packets
Recom-mended home fluids (RHF)
Either ORS or
RHF Increased
fluids
ORT or increased
fluids
Anti- biotic drugs
Anti-motility drugs
Zinc supple-ments
Intra-venous solution
Home remedy/
other
Age in months <6 58.7 49.9 26.9 60.6 7.0 62.4 4.6 0.0 4.9 0.0 18.8 29.7 77 6-11 73.3 74.1 36.1 80.8 8.0 80.8 7.3 0.0 7.1 0.0 17.8 12.8 209 12-23 73.9 74.6 37.1 79.6 11.2 80.3 6.6 0.0 5.0 0.2 21.0 11.3 439 24-35 70.7 71.5 43.7 78.3 10.5 79.0 5.6 0.0 5.6 0.3 15.2 12.6 336 36-47 70.4 67.2 46.9 76.7 9.6 78.2 6.0 0.2 7.2 0.0 16.2 11.1 244 48-59 79.3 71.8 42.3 82.1 12.1 82.8 4.8 0.0 5.0 0.0 17.2 10.2 148
Sex Male 72.7 67.8 40.3 75.4 9.1 76.2 6.4 0.0 6.6 0.1 18.3 13.3 692 Female 71.8 73.8 40.0 80.8 11.1 81.6 5.8 0.1 5.2 0.1 17.5 12.1 762
Type of diarrhea Non bloody 72.2 71.1 40.1 78.4 9.9 79.2 6.0 0.0 5.6 0.2 17.3 12.8 1,349 Bloody 72.1 69.0 40.6 76.8 13.0 77.3 6.7 0.0 8.3 0.0 24.8 11.3 106
Residence Urban 69.3 65.0 40.1 73.0 4.7 73.7 9.7 0.1 13.6 0.0 14.6 13.2 429 Rural 73.5 73.5 40.1 80.4 12.4 81.3 4.6 0.0 2.6 0.2 19.3 12.4 1,025
District Aileu 81.1 79.9 72.5 86.0 2.4 86.0 11.0 0.0 3.7 0.0 25.0 6.2 43 Ainaro (56.4) (58.4) (57.4) (70.3) (2.7) (70.3) (13.0) (0.0) (0.0) (0.0) (16.7) (19.5) 21 Baucau 85.0 92.1 19.8 95.5 0.0 95.5 0.0 0.0 0.0 0.0 3.4 4.5 142 Bobonaro 83.6 78.3 31.3 85.3 45.8 86.8 2.2 0.3 0.0 0.0 27.0 7.5 178 Covalima 63.7 68.9 49.9 75.9 17.8 78.3 7.2 0.0 0.0 0.0 14.2 14.5 77 Dili 67.3 62.4 39.2 71.0 2.6 71.6 12.1 0.0 18.3 0.0 13.8 12.6 315 Ermera 77.5 72.2 66.2 79.2 0.0 79.2 14.1 0.0 0.0 0.0 23.5 15.9 150 Lautem 61.0 61.5 12.5 65.5 14.5 67.1 2.6 0.0 7.9 0.7 25.3 23.3 156 Liquiçá 68.9 63.6 31.7 69.6 4.9 70.1 1.0 0.0 6.0 0.0 28.4 17.9 139 Manatuto 81.9 84.6 53.3 90.7 7.7 90.7 5.5 0.0 8.8 0.0 13.2 5.5 50 Manufahi 49.4 59.0 50.0 74.2 0.0 74.2 0.0 0.0 1.9 0.0 19.6 10.2 31 Oecussi 68.8 73.0 68.1 85.6 7.0 86.1 2.4 0.0 0.0 0.0 5.4 12.6 123 Viqueque (86.0) (76.7) (19.9) (86.9) (3.8) (90.7) (3.4) (0.0) (0.0) (3.4) (16.9) (0.0) 30
Mother’s
education No education 68.3 71.8 41.1 79.6 9.1 80.0 5.8 0.0 3.4 0.0 16.7 12.8 429 Primary 71.9 71.0 40.3 77.7 13.3 79.0 7.8 0.0 3.4 0.2 21.3 11.7 415 Secondary 74.7 69.3 40.2 77.1 8.6 77.8 5.1 0.1 8.1 0.2 16.1 13.8 569
More than secondary (83.0) (85.3) (26.7) (85.3) (10.7) (87.5) (5.0) (0.0) (25.0) (0.0) (20.8) (3.9) 40
Wealth quintile Lowest 66.0 69.6 38.5 80.7 6.2 81.1 2.6 0.0 2.2 0.0 13.0 12.7 259 Second 70.3 69.0 31.2 76.0 13.5 77.0 4.9 0.0 2.0 0.4 21.7 13.7 250 Middle 77.6 79.5 44.8 84.3 13.3 84.3 9.5 0.0 3.3 0.4 21.6 8.2 289 Fourth 68.2 66.5 43.7 74.9 13.1 77.0 3.9 0.0 5.4 0.0 19.5 16.0 343 Highest 78.4 70.6 40.4 76.0 4.6 76.3 9.2 0.2 14.7 0.0 13.8 12.1 314
Total 72.2 71.0 40.1 78.2 10.2 79.0 6.1 0.0 5.8 0.1 17.9 12.7 1,454
Note: ORT includes solution prepared from oral rehydration salt (ORS), pre-packaged ORS packet, and recommended home fluids (RHF). Figures in parentheses are based on 25-49 unweighted cases. 1 Excludes pharmacy, shop, and traditional practitioner
11.6.2 Feeding Practices
Mothers or caregivers are encouraged to continue normal feeding of children with diarrhea and to increase the amount of fluids being given, in addition to continuing to breastfeed as much as possible if the children are breastfed. These practices help to reduce dehydration and minimize the adverse consequences of diarrhea on the child’s nutritional status. Mothers interviewed in the 2009-10 TLDHS were asked whether they gave the child less, the same amount, or more fluids and food than usual when their child had diarrhea. Table 11.9 shows, by feeding practices, the percent distribution of children under age 5 who had diarrhea in the two weeks preceding the survey.

142
| C
hild
Hea
lth
Tab
le 1
1.9
Fee
ding
pra
ctic
es d
urin
g di
arrh
ea
Perc
ent d
istrib
utio
n of
chi
ldre
n un
der
age
5 w
ho h
ad d
iarr
hea
in th
e tw
o w
eeks
pre
cedi
ng th
e su
rvey
by
amou
nt o
f liq
uids
and
food
offe
red
com
pare
d w
ith n
orm
al p
ract
ice,
the
perc
enta
ge o
f chi
ldre
n gi
ven
incr
ease
d flu
ids
and
cont
inue
d fe
edin
g du
ring
the
diar
rhea
epi
sode
, and
the
perc
enta
ge o
f chi
ldre
n w
ho c
ontin
ued
feed
ing
and
wer
e gi
ven
ORT
and
/or i
ncre
ased
flui
ds d
urin
g th
e ep
isode
of d
iarr
hea,
by
back
grou
nd c
hara
cter
istic
s, T
imor
-Les
te 2
009-
10
Back
grou
nd
char
acte
ristic
Amou
nt o
f liq
uids
offe
red
Tota
l
Amou
nt o
f foo
d of
fere
d
Tota
l
Perc
enta
ge g
iven
in
crea
sed
fluid
s an
d co
ntin
ued
feed
ing1,
2
Perc
enta
ge w
ho
cont
inue
d fe
edin
g an
d w
ere
give
n O
RT a
nd/o
r in
crea
sed
fluid
s3
Num
ber o
f ch
ildre
n w
ith
diar
rhea
M
ore
Sam
e as
us
ual
Som
e-w
hat l
ess
Muc
h le
ss
Non
e
Don
’t kn
ow/
miss
ing
Mor
e Sa
me
as
usua
l So
me-
wha
t les
sM
uch
less
N
one
Nev
er
gave
food
Don
’t kn
ow/
miss
ing
Age
in m
onth
s
<
6 7.
043
.0
40.1
6.
3 3.
60.
010
0.0
2.1
31.7
28.4
10.5
12
.211
.83.
310
0.0
2.5
41.5
77
6-
11
8.0
44.4
37
.2
9.3
0.6
0.5
100.
02.
632
.137
.719
.3
6.7
1.1
0.5
100.
04.
358
.420
9
12-2
3 11
.241
.4
34.6
12
.8
0.0
0.0
100.
03.
228
.546
.918
.3
2.4
0.7
0.0
100.
07.
963
.743
9
24-3
5 10
.543
.1
33.1
13
.0
0.3
0.0
100.
03.
235
.542
.917
.5
0.8
0.0
0.0
100.
07.
663
.433
6
36-4
7 9.
643
.7
35.1
11
.7
0.0
0.0
100.
04.
236
.842
.914
.4
1.7
0.0
0.0
100.
07.
164
.824
4
48-5
9 12
.139
.2
40.2
8.
0 0.
50.
010
0.0
9.4
26.4
50.8
12.8
0.
50.
00.
010
0.0
12.1
71.0
148
Sex
M
ale
9.1
43.6
34
.8
11.9
0.
40.
110
0.0
4.1
33.3
41.8
17.2
2.
90.
50.
210
0.0
6.9
60.1
692
Fe
mal
e 11
.141
.4
36.3
10
.8
0.4
0.0
100.
03.
630
.844
.916
.2
2.8
1.4
0.3
100.
07.
764
.976
2
Typ
e of
dia
rrhe
a
N
on b
lood
y 9.
942
.7
36.0
10
.9
0.4
0.1
100.
03.
632
.544
.115
.7
3.0
0.9
0.3
100.
07.
263
.41,
349
Bl
oody
13
.039
.9
30.2
16
.3
0.5
0.0
100.
07.
126
.334
.528
.4
1.3
2.5
0.0
100.
09.
353
.710
6
Res
iden
ce
Urb
an
4.7
46.0
35
.8
13.1
0.
40.
010
0.0
0.7
42.8
37.9
17.3
0.
10.
70.
510
0.0
3.8
58.8
429
Ru
ral
12.4
41.0
35
.5
10.6
0.
40.
110
0.0
5.2
27.5
45.7
16.4
4.
01.
10.
110
0.0
8.8
64.3
1,02
5
Dis
tric
t
Ai
leu
2.4
29.5
25
.0
43.0
0.
00.
010
0.0
1.2
28.3
36.8
32.4
0.
01.
20.
010
0.0
2.4
56.5
43
Ai
naro
(2
.7)
(48.
1)
(23.
2)
(23.
2)
(2.7
)(0
.0)
100.
0(0
.0)
(25.
9)(4
1.6)
(29.
7)
(0.0
)(2
.7)
(0.0
)10
0.0
(2.7
)(4
1.6)
21
Ba
ucau
0.
017
.9
74.2
7.
9 0.
00.
010
0.0
2.3
14.2
75.7
7.9
0.0
0.0
0.0
100.
00.
087
.614
2
Bobo
naro
45
.821
.7
14.9
17
.7
0.0
0.0
100.
010
.315
.133
.824
.4
15.4
1.1
0.0
100.
027
.552
.417
8
Cov
alim
a 17
.841
.6
37.0
1.
8 1.
80.
010
0.0
3.5
26.1
50.1
15.6
3.
51.
20.
010
0.0
10.6
58.7
77
D
ili
2.6
48.9
35
.7
12.9
0.
00.
010
0.0
0.6
46.1
36.5
15.4
0.
00.
60.
610
0.0
2.6
58.1
315
Er
mer
a 0.
024
.6
64.4
11
.1
0.0
0.0
100.
00.
020
.066
.58.
4 3.
12.
10.
010
0.0
0.0
69.1
150
La
utem
14
.572
.3
8.2
4.3
0.7
0.0
100.
014
.132
.816
.235
.6
0.0
1.3
0.0
100.
014
.144
.415
6
Liqu
içá
4.9
54.7
27
.8
10.9
1.
60.
010
0.0
2.2
51.0
29.9
12.6
2.
71.
60.
010
0.0
3.8
57.5
139
M
anat
uto
7.7
33.5
47
.8
11.0
0.
00.
010
0.0
5.5
31.3
48.9
9.9
3.3
0.0
1.1
100.
07.
779
.750
Man
ufah
i 0.
027
.9
60.0
12
.1
0.0
0.0
100.
01.
924
.259
.714
.3
0.0
0.0
0.0
100.
00.
064
.031
Oec
ussi
7.0
62.7
25
.6
3.4
0.5
0.8
100.
00.
836
.455
.15.
6 0.
50.
80.
810
0.0
6.1
80.5
123
Vi
queq
ue
(3.8
)(5
5.9)
(2
3.8)
(1
6.5)
(0
.0)
(0.0
)10
0.0
(0.0
)(5
2.9)
(27.
2)(1
6.5)
(3
.4)
(0.0
)(0
.0)
100.
0(3
.8)
(70.
8)30
Mot
her’
s ed
ucat
ion
No
educ
atio
n 9.
142
.6
34.9
12
.8
0.4
0.2
100.
02.
630
.042
.918
.5
4.1
1.6
0.2
100.
05.
460
.942
9
Prim
ary
13.3
37.4
37
.7
11.0
0.
50.
010
0.0
4.4
30.8
43.9
15.7
4.
31.
00.
010
0.0
10.2
63.3
415
Se
cond
ary
8.6
46.2
35
.0
9.8
0.4
0.0
100.
04.
733
.544
.415
.6
1.2
0.6
0.1
100.
06.
463
.656
9
Mor
e th
an s
econ
dary
(1
0.7)
(39.
7)
(29.
6)
(20.
0)
(0.0
)(0
.0)
100.
0(0
.0)
(44.
7)(2
8.6)
(21.
7)
(0.0
)(0
.0)
(5.0
)10
0.0
(10.
7)(6
0.8)
40
Wea
lth q
uint
ile
Low
est
6.2
53.0
32
.6
7.8
0.0
0.4
100.
03.
434
.641
.018
.3
0.9
1.5
0.4
100.
05.
765
.825
9
Seco
nd
13.5
40.2
34
.4
11.0
0.
80.
010
0.0
5.8
25.9
47.0
14.7
5.
21.
50.
010
0.0
10.1
60.1
250
M
iddl
e 13
.339
.6
37.3
9.
5 0.
30.
010
0.0
4.9
30.5
43.3
15.2
5.
50.
50.
010
0.0
7.7
66.9
289
Fo
urth
13
.134
.6
35.9
15
.6
0.7
0.0
100.
03.
327
.247
.318
.6
2.7
0.9
0.0
100.
09.
459
.134
3
Hig
hest
4.
646
.8
37.0
11
.4
0.2
0.0
100.
02.
441
.438
.316
.1
0.4
0.6
0.8
100.
03.
862
.031
4
To
tal
10.2
42.5
35
.6
11.3
0.
40.
110
0.0
3.9
32.0
43.4
16.7
2.
91.
00.
210
0.0
7.3
62.7
1,45
4
Not
e: F
igur
es in
par
enth
eses
are
bas
ed o
n 25
-49
unw
eigh
ted
case
s.1 E
quiv
alen
t to
the
UN
ICEF
/WH
O in
dica
tor “
Hom
e m
anag
emen
t of d
iarr
hea.
” M
ICS
Indi
cato
r 34
2 Con
tinue
feed
ing
prac
tices
incl
udes
chi
ldre
n w
ho w
ere
give
n m
ore,
sam
e as
usu
al, o
r som
ewha
t les
s fo
od d
urin
g th
e di
arrh
ea e
piso
de
3 Equ
ival
ent t
o U
NIC
EF M
ICS
Indi
cato
r 35.
142 | Child Health

Child Health | 143
Ten percent of children with diarrhea were given more to drink than usual, 43 percent were given the same as usual, and 36 percent were given somewhat less to drink than usual. It is particularly unfortunate that 12 percent of children with diarrhea were given much less or nothing to drink.
Food intake is curtailed even more than fluid intake during episodes of diarrhea. Only 4 percent of children with diarrhea were given more to eat than usual, 32 percent were given the same amount of food as usual, and 63 percent were given less food to eat than usual or none at all. These patterns reflect a gap in practical knowledge among some mothers regarding the nutritional requirements of children during diarrheal episodes. A study on health-care-seeking behavior found diverse and varied local beliefs and practices related to childhood diarrhea (Zwi et al., 2009). For example, certain communities expressed a belief that diarrhea was caused by breastfeeding, contamination, food consumption patterns, and the season. The initial response to diarrhea was usually homemade rehydration, boiled leaves, or both. The 2009-10 TLDHS findings and other studies indicate a need for further health education efforts to reduce the number of children that become dehydrated or malnourished because of improper feeding practices during diarrhea.
Overall, 7 percent of children with diarrhea were given increased fluids and continued feeding, and 63 percent received continued feeding and were given ORT, increased fluids, or both. Children age 48-59 months were more likely than other children to receive continued feeding, ORT, and/or increased fluids during the last episode of diarrhea. Differen-tials in these indicators by other background charac-teristics are very minimal.
11.7 KNOWLEDGE OF ORS PACKETS
As mentioned earlier, a simple and effective response to dehydration caused by diarrhea is a prompt increase in the child’s fluid intake through some form of ORT, which may include the use of a solution prepared from packets of oral rehydration salts (ORS). To ascertain how widespread knowledge of ORS is in Timor-Leste, mothers were asked whether they knew about ORS packets.
Table 11.10 shows the percentage of mothers with a birth in the five years preceding the survey who knew about ORS packets for treatment of diarr-hea. Knowledge of ORS is widespread in Timor-Leste, with 89 percent of mothers having heard of it. Mothers age 15-19 are slightly less likely to know about ORS than older mothers. Knowledge of ORS is high among urban mothers and increases with level of education and wealth of mothers. Mothers in Ermera district are less likely than mothers in other districts to have heard of ORS.
Table 11.10 Knowledge of ORS packets
Percentage of mothers age 15-49 who gave birth in the five years preceding the survey who know about ORS packets for treatment of diarrhea by background characteristics, Timor-Leste 2009-10
Background characteristic
Percentage of women who know about ORS packets
Number of women
Age 15-19 85.4 17820-24 89.9 1,01225-34 88.4 2,61535-49 89.1 2,210
Residence Urban 91.2 1,484Rural 88.1 4,531
District Aileu 93.8 220Ainaro 95.8 318Baucau 89.2 598Bobonaro 94.5 587Covalima 93.1 322Dili 91.3 1,043Ermera 74.0 719Lautem 91.3 444Liquiçá 80.6 358Manatuto 90.2 264Manufahi 93.3 238Oecussi 97.3 492Viqueque 79.5 412
Education No education 83.7 1,980Primary 88.8 1,656Secondary 93.2 2,226More than secondary 93.4 154
Wealth quintile Lowest 85.2 1,226Second 85.6 1,171Middle 88.6 1,203Fourth 90.5 1,170Highest 94.2 1,244
Total 88.8 6,015
ORS = Oral rehydration salts

144 | Child Health
11.8 STOOL DISPOSAL
Contact with human feces directly, or indirectly by animal contact with the feces, can lead to diarrheal diseases. Hence, the safe disposal of children’s stools is important in preventing the spread of disease. Table 11.11 shows the percent distribution of mothers who have their youngest child under age 5 living with them, by the way in which the child’s stools are disposed of, according to background characteristics and type of toilet facilities in the household.
Twenty-eight percent of mothers of children under age 5 dispose of their youngest child’s stools safely (that is, children use a toilet or latrine, the stools are rinsed in the toilet or latrine, or the stools are buried). Thirteen percent of mothers put or rinse their children’s stools into a drain or ditch, 4 percent throw them into the garbage, and 45 percent of mothers leave them in the open.
Table 11.11 Disposal of children’s stools
Percent distribution of youngest children under age five living with the mother by the manner of disposal of the child’s last fecal matter, and percentage of children whose stools are disposed of safely, according to background characteristics, Timor-Leste 2009-10
Background characteristic
Manner of disposal of children’s stools
Total
Percentage of children
whose stools are
disposed of safely
Number of
children
Child used
toilet or latrine
Put/ rinsed
into toilet or latrine Buried
Put/ rinsed
into drain or ditch
Thrown into
garbage Left in
the open Other Missing
Age in months <6 2.9 12.1 5.0 28.4 4.5 27.4 19.4 0.2 100.0 20.0 973 6-11 4.2 12.3 6.9 20.9 5.3 35.6 14.9 0.0 100.0 23.3 927 12-23 5.4 11.8 9.0 9.7 2.7 53.0 8.1 0.2 100.0 26.3 1,616 24-35 10.5 12.7 7.7 6.6 3.7 51.2 7.6 0.0 100.0 30.9 1,176 36-47 13.6 14.7 6.0 6.9 3.3 50.2 5.4 0.0 100.0 34.3 735 48-59 19.2 19.0 4.7 6.7 1.9 43.6 4.9 0.0 100.0 42.9 454
Toilet facility Improved, not shared1 12.8 20.2 5.4 11.7 4.0 36.7 9.1 0.2 100.0 38.4 2,419 Non-improved or shared 4.5 8.0 8.2 14.5 3.4 50.1 11.3 0.0 100.0 20.7 3,461
Residence Urban 13.0 23.9 9.5 7.6 5.4 28.0 12.3 0.3 100.0 46.4 1,447 Rural 6.3 9.5 6.2 15.2 3.0 50.0 9.7 0.0 100.0 22.0 4,432
District Aileu 2.5 11.2 3.4 8.0 5.5 48.6 20.8 0.0 100.0 17.2 214 Ainaro 0.4 6.0 1.6 18.9 1.0 68.4 3.8 0.0 100.0 7.9 310 Baucau 5.1 10.4 5.9 1.6 9.3 44.0 23.7 0.0 100.0 21.4 595 Bobonaro 23.1 7.2 8.8 17.3 1.1 35.3 7.3 0.0 100.0 39.1 569 Covalima 3.2 9.5 2.6 18.9 3.2 59.4 2.9 0.3 100.0 15.3 311 Dili 13.8 24.2 9.9 5.6 6.3 24.1 15.7 0.4 100.0 47.8 1,017 Ermera 4.6 22.0 0.3 27.9 1.2 43.8 0.2 0.0 100.0 26.9 708 Lautem 2.3 18.0 0.5 4.0 2.3 60.1 12.8 0.0 100.0 20.7 438 Liquiçá 7.7 7.6 0.9 10.6 2.8 70.3 0.0 0.0 100.0 16.2 347 Manatuto 21.1 6.0 0.8 23.1 1.1 47.7 0.2 0.0 100.0 27.9 259 Manufahi 1.4 6.0 0.6 23.1 4.9 62.7 1.4 0.0 100.0 8.0 229 Oecussi 1.2 2.5 40.8 6.8 3.6 18.5 26.6 0.0 100.0 44.5 479 Viqueque 3.6 10.9 0.3 22.1 0.5 59.3 3.4 0.0 100.0 14.8 402
Education No education 5.4 8.2 7.4 15.5 2.0 51.2 10.3 0.0 100.0 21.0 1,938 Primary 6.7 10.1 8.1 13.0 4.3 46.8 11.0 0.0 100.0 24.9 1,617 Secondary 10.5 19.4 5.9 12.3 4.3 38.1 9.3 0.1 100.0 35.8 2,176 More than secondary 15.2 15.7 7.7 5.3 7.0 28.5 19.4 1.4 100.0 38.6 148
Wealth quintile Lowest 2.0 1.9 9.9 15.6 2.1 55.6 12.8 0.1 100.0 13.8 1,199 Second 3.5 6.9 6.1 14.2 3.0 55.2 11.1 0.0 100.0 16.5 1,149 Middle 6.2 9.5 6.3 14.6 3.6 51.2 8.7 0.0 100.0 22.0 1,170 Fourth 11.7 20.4 4.6 13.7 3.2 36.2 9.7 0.4 100.0 36.8 1,148 Highest 16.1 26.2 8.1 8.8 6.0 25.2 9.5 0.0 100.0 50.5 1,213
Total 7.9 13.0 7.0 13.4 3.6 44.6 10.4 0.1 100.0 28.0 5,879
1 Non-shared facilities that are of the types: flush or pour flush into a piped sewer system/septic tank/pit latrine; ventilated, improved pit (VIP) latrine; pit latrine with a slab; and a composting toilet.

Child Health | 145
There are marked differences in the way children’s stools are disposed of, according to background characteristics. For example, older children are more likely than younger children to have their stools disposed of safely. As expected, children in urban areas and children living in households with an improved toilet facility are more likely to have safe disposal of their stools than children in rural areas and in households without such facilities. By region, the proportion of children whose stools are disposed of safely ranges from 8 percent in Ainaro and Manufahi to 48 percent in Dili. Surprisingly, although a high percentage of children’s stools are not disposed of safely in Ainaro, it had the lowest prevalence of diarrhea among children under age 5 in the two weeks preceding the survey (4 percent). Safe disposal of children’s stools increases with mother’s level of education and household wealth quintile.


Nutrition of Children and Women | 147
NUTRITION OF CHILDREN AND WOMEN 12
This chapter reviews the nutritional status of children and women in Timor-Leste. The specific topics discussed are (1) infant and young child feeding practices, including breastfeeding and feeding with solid/semi-solid foods; (2) quantity and quality of foods, including their diversity and frequency; (3) micronutrient intake and food supplementation among children and women; (4) night blindness among children, and (5) anemia among women and children. The section also covers anthropometric assessment of the nutritional status of children under 5 years of age and the nutritional status of women 15-49 years of age.
The poor nutritional status of children and women has been a serious problem in Timor-Leste for many years. The most common forms of malnutrition in the country are protein energy malnutrition (PEM) and micronutrient deficiencies. The National Nutrition Strategy, developed in 2004, provides comprehensive documentation of the country’s goals (MOH, 2004c). In addition, the country has drafted a breastfeeding policy, a National Salt Law, and Infant and Young Child Feeding (IYCF) strategies . Several programs with an explicit nutrition component have been launched in the country under the initiative of the Directorate of Community Health and through the Nutrition Department of the Ministry of Health. The major partners in initiating programs to address the problem of malnutrition are the World Health Organization, UNICEF, the World Food Program (WFP), USAID, CARE International, Oxfam, World Vision, Concern, Alola Foundation, Medico do Mundo (MDM), TAIS (Timor-Leste Asistensia Integradu Saude), and other international and national nongovernmental organizations. The findings in the following section are highlighted with respect to these initiatives.
12.1 NUTRITIONAL STATUS OF CHILDREN
Anthropometric data on height and weight collected in the 2009-10 TLDHS permit the analysis and evaluation of the nutritional status of young children in Timor-Leste. This analysis allows identification of subgroups in the population that are at increased risk of faltered growth, disease, impaired mental and physical development, and death. The nutritional status of young children and women of reproductive age reflects household, community, and national development. Children and women in developing countries are most vulnerable to malnutrition because of inadequate dietary intake, infectious diseases, inadequate access to appropriate health care, and inequitable distribution of food within the household.
12.1.1 Nutritional Status of Children
The 2009-10 TLDHS included information on the nutritional status of children less than age 5 for three indices: weight-for-age, height-for-age, and weight-for-height. Weight measurements were taken using a lightweight electronic SECA scale with a digital screen, designed and manufactured under the guidance of UNICEF, and height measurements were carried out using a measuring board from Shorr Productions. Children younger than 24 months were measured lying down (recumbent length) on the board, while standing height was measured for older children. The scale allowed for the weighing of very young children through an automatic mother-child adjustment that eliminated the mother’s weight while she was standing on the scale with her baby.
The nutritional status of children in the survey population is compared with the WHO Child Growth Standards, which are based on an international sample (from Brazil, Ghana, India, Norway, Oman, and the United States) of ethnically, culturally, and genetically diverse healthy children living under optimum conditions conducive to achieving a child’s full genetic growth potential (WHO, 2006). The WHO Child Growth Standards are used here instead of the former NCHS/CDC/WHO

148 | Nutrition of Children and Women
international reference population because of the prescriptive, rather than descriptive, nature of the WHO Child Growth Standards versus the NCHS/CDC/WHO international reference population. The WHO Child Growth Standards identify the breastfed child as the normative model for growth and development, and they document how children should grow under optimum conditions and infant feeding and child health practices.
The use of the WHO Child Growth Standards is based on the finding that well-nourished children of all population groups for which data exist follow very similar growth patterns before puberty. The internationally based standard population serves as a point of comparison, facilitating the examination of differences in the anthropometric status of subgroups in a population and of changes in nutritional status over time.
For the purposes of comparison with previous surveys, indices are expressed in standard deviation units (SD) from the median of the NCHS/CDC/WHO international reference population, which was in use prior to the new WHO Child Growth Standards.
Each of the three nutritional status indicators is expressed in standard deviation units (z-scores) from the median of the reference population. In any large population, there is variation in height and weight; this variation approximates a normal distribution. The three indices—height-for-age, weight-for-height, and weight-for-age—provide different information about growth and body composition, which can be used to assess nutritional status. The height-for-age index indicates linear growth retardation and cumulative growth deficits. Children whose height-for-age z-score is below minus two standard deviations (-2 SD) from the median of the reference population are considered short for their age (stunted) and chronically malnourished. Children who are below minus three standard deviations (-3 SD) from the median of the reference population are considered severely stunted. Stunting reflects failure to receive adequate nutrition over a long period of time and is worsened by recurrent and chronic illness. Height-for-age, therefore, represents the long-term effects of malnutrition in a population and does not vary according to recent dietary intake.
The weight-for-height index measures body mass in relation to body length and describes current nutritional status. Children whose z-scores are below minus two standard deviations (-2 SD) from the median of the reference population are considered to be thin for their height (wasted) and acutely malnourished. Wasting represents failure to receive adequate nutrition in the period immediately preceding the survey and may be the result of inadequate food intake during a recent episode of illness, causing loss of weight and the onset of malnutrition. Children whose weight-for-height is below minus three standard deviations (-3 SD) from the median of the reference population are considered severely wasted. Children whose weight-for-height is above two standard deviations (+2 SD) from the median reference population are considered to be overweight.
Weight-for-age is a composite index of height-for-age and weight-for-height. It takes into account both acute and chronic malnutrition. Children whose weight-for-age is below minus two standard deviations (-2 SD) from the median of the reference population are classified as underweight. Children whose weight-for-age is below minus three standard deviations (-3 SD) from the median of the reference population are considered severely underweight.
Height and weight data were collected from the sampled household population in Timor-Leste. A total of 9,989 children under age 5 were identified in the households. Information on height or weight was missing for 3 percent of children who were not present and for 8 percent who refused to be measured. The final analysis of nutritional status is based on the remaining 8,1711 children (88 percent). The results are shown in Table 12.1.
1 These are unweighted numbers.

Nutrition of Children and Women | 149
Table 12.1 Nutritional status of children
Percentage of children under 5 years classified as malnourished according to three anthropometric indices of nutritional status: height-for-age, weight-for-height, and weight-for-age, by background characteristics, Timor-Leste 2009-10
Background characteristic
Height-for-age Weight-for-height Weight-for-age
Number of children
Percentage below -3 SD
Percentage below -2 SD1
Mean Z-score
(SD)
Percentage below -3 SD
Percentage below -2 SD1
Percentage above +2 SD
MeanZ-score
(SD)
Percentage below -3 SD
Percentage below -2 SD1
Percentage above +2 SD
MeanZ-score
(SD)
Age in months <6 15.3 26.0 -0.6 8.8 19.8 16.6 -0.1 4.8 14.9 3.7 -0.7 563 6-8 17.5 34.6 -1.3 7.2 18.6 9.4 -0.5 7.9 25.1 0.0 -1.3 351 9-11 19.0 37.8 -1.6 6.7 16.2 7.8 -0.6 11.1 28.7 1.0 -1.4 392 12-17 33.5 60.4 -2.0 7.8 21.8 4.2 -0.8 14.5 40.7 0.9 -1.6 828 18-23 45.1 69.0 -2.5 6.1 15.2 4.7 -0.8 17.5 46.9 1.5 -1.8 692 24-35 39.6 63.8 -2.4 7.3 17.5 2.8 -0.8 16.3 49.3 0.5 -1.9 1,752 36-47 36.9 66.5 -2.5 5.9 17.1 3.9 -0.8 17.7 48.7 0.1 -2.0 1,864 48-59 28.6 57.8 -2.3 7.3 21.5 2.3 -1.0 17.7 53.9 0.0 -2.1 1,729
Sex Male 34.5 60.3 -2.2 7.8 20.3 4.5 -0.8 16.3 45.5 0.7 -1.8 4,106 Female 31.2 56.0 -2.1 6.2 17.0 4.9 -0.7 14.5 43.8 0.6 -1.8 4,065
Birth interval in months2 First birth3 31.9 56.0 -2.1 7.8 20.8 3.8 -0.9 15.4 44.9 0.5 -1.8 1,304 <24 34.6 60.9 -2.3 7.4 18.4 4.9 -0.7 15.9 44.5 0.5 -1.8 1,790 24-47 33.3 58.5 -2.2 6.3 17.3 4.6 -0.8 15.0 45.3 0.7 -1.8 3,539 48+ 26.9 53.0 -1.9 7.4 21.2 5.8 -0.8 15.5 40.9 0.9 -1.7 953
Size at birth2 Very small 36.6 64.7 -2.3 10.1 21.0 3.6 -1.0 20.7 54.1 0.4 -2.1 406 Small 32.8 58.7 -2.1 5.7 18.3 5.1 -0.8 16.6 46.3 0.5 -1.8 800 Average or larger 32.6 57.7 -2.2 7.0 18.7 4.8 -0.8 15.0 43.8 0.7 -1.8 6,212
Mother’s interview status Interviewed 32.5 57.9 -2.2 7.0 18.6 4.7 -0.8 15.4 44.5 0.7 -1.8 7,587
Not interviewed but in household 32.3 55.9 -2.2 6.7 18.1 6.9 -0.6 12.2 40.5 1.1 -1.7 218
Not interviewed, and not in the household4 40.6 63.4 -2.4 8.2 19.2 4.5 -0.8 18.4 51.3 0.0 -2.0 367
Mother’s nutritional
status5 Thin (BMI<18.5) 38.1 64.5 -2.4 7.1 22.3 3.4 -1.0 21.7 54.3 0.4 -2.1 1,852 Normal (BMI 18.5-24.9) 31.6 56.3 -2.1 7.2 17.9 5.0 -0.7 13.6 42.0 0.8 -1.7 5,265
Overweight/obese (BMI ≥25) 21.3 50.2 -2.0 4.0 11.2 6.5 -0.5 9.8 31.9 0.7 -1.5 448
Residence Urban 21.5 49.2 -1.9 4.5 14.9 4.3 -0.7 9.7 34.9 0.9 -1.5 1,794 Rural 36.1 60.6 -2.2 7.7 19.7 4.8 -0.8 17.0 47.4 0.6 -1.9 6,377
District Aileu 16.7 31.4 -0.6 29.8 49.4 1.4 -1.9 12.0 41.2 1.7 -1.6 271 Ainaro 43.8 69.1 -2.7 6.7 18.2 10.2 -0.4 17.0 47.7 1.2 -1.8 482 Baucau 39.6 58.1 -2.4 5.5 21.6 11.2 -0.4 17.5 43.0 1.0 -1.7 687 Bobonaro 45.0 72.6 -2.7 6.8 15.3 9.7 -0.5 18.8 52.5 0.5 -2.0 792 Covalima 36.8 64.7 -2.4 4.4 13.8 3.6 -0.7 13.2 47.4 0.3 -1.8 373 Dili 16.1 43.9 -1.7 4.1 14.5 4.5 -0.6 7.9 30.1 1.0 -1.4 1,289 Ermera 48.9 68.5 -2.6 6.8 20.7 2.7 -0.9 23.6 58.0 0.3 -2.2 1,077 Lautem 18.7 51.0 -1.9 2.9 9.6 1.8 -0.7 6.7 32.1 0.0 -1.5 714 Liquiçá 34.7 56.9 -2.2 5.1 15.1 4.4 -0.7 14.6 41.4 1.0 -1.7 456 Manatuto 21.2 46.7 -1.5 10.8 19.7 2.6 -0.9 8.7 34.4 0.1 -1.5 429 Manufahi 37.1 64.7 -2.3 5.6 14.9 3.2 -0.7 13.5 43.7 0.6 -1.8 296 Oecussi 40.6 69.1 -2.5 9.0 26.9 1.0 -1.3 28.5 62.8 0.1 -2.3 708 Viqueque 25.0 51.5 -1.8 9.3 19.4 3.0 -1.0 12.7 44.8 1.3 -1.7 597
Mother’s education6 No education 38.6 62.6 -2.3 8.0 20.9 5.0 -0.8 18.8 48.8 0.8 -1.9 2,734 Primary 33.9 59.7 -2.2 6.8 18.7 4.4 -0.8 15.9 46.5 0.6 -1.8 2,175 Secondary 26.3 52.7 -2.0 6.1 16.7 4.7 -0.7 11.8 38.9 0.7 -1.6 2,736 More than secondary 15.9 41.6 -1.7 4.7 10.5 5.2 -0.6 6.5 32.0 0.0 -1.4 160
Wealth quintile Lowest 37.3 63.0 -2.3 8.8 20.8 4.8 -0.8 18.9 49.4 0.5 -1.9 1,762 Second 40.8 63.5 -2.4 6.7 18.7 6.7 -0.7 17.3 48.0 0.9 -1.9 1,629 Middle 36.1 60.5 -2.3 7.6 19.6 4.0 -0.8 17.3 48.1 0.6 -1.9 1,663 Fourth 28.6 55.4 -2.0 6.5 17.6 3.3 -0.8 13.1 41.4 0.3 -1.7 1,599 Highest 20.2 47.1 -1.8 5.1 16.2 4.8 -0.7 9.6 35.3 1.1 -1.5 1,518
Total 32.9 58.1 -2.2 7.0 18.6 4.7 -0.8 15.4 44.7 0.7 -1.8 8,171
Note: Table is based on children who slept in the household the night before the interview. Each of the indices is expressed in standard deviation units (SD) from the median of the WHO Child Growth Standards adopted in 2006. The indices in this table are NOT comparable to those based on the previously used NCHS/CDC/WHO reference. Table is based on children with valid dates of birth (month and year) and valid measurement of both height and weight. Total includes 164 children with information missing on size at birth and 119 children with information missing on mother’s nutritional status. 1 Includes children who are below -3 standard deviations (SD) from the WHO Child Growth standards population median 2 Excludes children whose mothers were not interviewed 3 First-born twins (triplets, etc.) are counted as first births because they do not have a previous birth interval 4 Includes children whose mothers are deceased 5 Excludes children whose mothers were not weighed and measured. Mother’s nutritional status in terms of BMI (Body Mass Index) is presented in Table 12.9. 6 For women who are not interviewed, information is taken from the Household Questionnaire. Excludes children whose mothers are not listed in the Household Questionnaire.

150 | Nutrition of Children and Women
Figure 12.1 Nutritional Status of Children by Age
Timor-Leste 2009-10
#
#
# #
#
#
#
# # #
#
###
##
##
# ### #
### #
# ###
## #
##
#
## #
# #
#
# # ## #
## # # #
# # ##
# #
#
$
$
$
$$$$ $
$ $ $$ $ $ $
$
$ $ $$$
$$ $ $
$$$ $ $
$
$ $$ $ $
$ $
$ $$ $ $
$ $ $$
$ $$ $ $
$ $$ $ $ $ $
$
&
&
&&
&&
&& &
&
&
&
&
&
&
&
&
&
&& & &
&&
&
& &&& &
&& & &
&& &
& &&
&&&
&&
& &
&
&
&&&& &
& && &
& &
0 3 6 9 12 15 18 21 24 27 30 33 36 39 42 45 48 51 54 57
Age in months
0
10
20
30
40
50
60
70
80Percent
Stunted
Wasted
Underweight
&
$
#
Fifty-eight percent of children under age 5 are stunted, and 33 percent are severely stunted. Nineteen percent of children under age 5 are wasted, and 7 percent are severely wasted. The weight-for-age indicator shows that 45 percent of children under age 5 are underweight and 15 percent are severely underweight. Table 12.1 highlights another problem among young children in Timor-Leste: 5 percent are overweight [Z-scores are above two standard deviations (+2 SD)].
Table 12.1 and Figure 12.1 indicate that stunting is apparent even among children less than 6 months of age (26 percent). Stunting increases with the age of the child; this is evidenced by the increase in stunting from 35 percent among children age 6-8 months to 69 percent among children age 18-23 months and gradually decreases to 58 percent by age 48-59 months. More male children (60 percent) than female children (56 percent) are stunted. Size at birth is an important indicator of the nutritional status of children: stunting is higher among children who were reported to have been very small at birth (65 percent) than among children who were average or larger in size at birth (58 percent). More rural children (61 percent) than urban children (49 percent) are stunted. District variation in nutritional status of children is substantial. Stunting among children is highest in Bobonaro district (73 percent) and lowest in Aileu district (31 percent). The percentage of children stunted decreases as mother’s BMI and education level increase. Stunting is more prevalent in children with thin (BMI <18.5) mothers compared with those with overweight/obese (BMI ≥25) mothers (65 percent vs. 50 percent).
Wasting is high among children less than 6 months of age (20 percent). The highest percentage of wasting is seen among children age 12-17 months and age 48-59 months (22 percent each). Wasting decreases with size at birth; wasting is higher among children who were reported to be very small at birth (21 percent) than among children who were average or larger in size at birth (19 percent). The proportion of children who are wasted is higher in rural areas (20 percent) than in urban areas (15 percent). Wasting is higher in children whose mother has a low body mass index (BMI) (22 percent) compared with children whose mother has a high BMI (11 percent). Wasting is especially pronounced in Aileu (49 percent) compared with Lautem, the district with the lowest prevalence of wasting (10 percent). A report submitted by an Emergency Needs Assessment Mission conducted by the World Food Program and the Food and Agriculture Organization in August 2003 indicated that the nutritional status in districts with a bad harvest had deteriorated, and Aileu was identified as one of these districts (WFP and FAO, 2003). Wasting is higher among children from the lowest wealth quintile (21 percent) as compared with children from the highest wealth quintile (16 percent).

Nutrition of Children and Women | 151
It is further observed that the highest proportion of overweight children (+2 SD) is in the age group less than age 6 months, with 17 percent of children in that age group being overweight. There is hardly any difference between urban and rural areas in the proportions of children overweight. Looking at district patterns, the prevalence of overweight children ranges from 1 percent in Oecussi and Aileu to 11 percent in Baucau. Although variations by mother’s level of education and wealth quintile are not large, the highest proportions of overweight children are seen among the most educated mothers and mothers who live in households in the second quintile.
Table 12.1 and Figure 12.1 show that the percentage of children who are underweight increases sharply, from 15 percent among children under age 6 months to 25 percent among children age 6-8 months, to 29 percent among children age 9-11 months, and to above 40 percent among children age 12 months and older. This may be due to inappropriate and/or inadequate feeding practices because the increasing levels of children who are underweight for their age coincides with the age at which normal complementary feeding starts. Children who are reported to be very small in size at birth are more likely to be underweight (54 percent) compared with those children who are reported to be average or larger in size at birth (44 percent). Children living in rural areas are more likely to be underweight (47 percent) compared with those children living in urban areas (35 percent). Children of mothers with low BMI, those with no education, and those belonging to households in the lowest wealth quintile are most likely to be underweight.
12.1.2 Trends in Children’s Nutritional Status
The results of the 2009-10 TLDHS show children’s nutritional status compared with the status from earlier surveys conducted in Timor-Leste. However, several factors make direct comparisons difficult. Because the data in the previous surveys were analyzed based on the NCHS/CDC/WHO international reference population, it was necessary to re-calculate the current data accordingly to make it comparable. Therefore, comparison of data on nutritional status of children should be made with caution.
The data from the 2009-10 TLDHS and Figure 12.2, indicate that there has been a slight rise in the level of stunting, wasting, and underweight over the past 6 years. Stunting increased from 49 percent to 53 percent, wasting increased from 12 percent to 17 percent, and underweight increased from 46 percent to 52 percent2. The results indicate that achieving the Millennium Development Goal of a 50 percent reduction in the prevalence of underweight children under 5 years of age by the year 2015 continues to be a challenge.
It can be further noted that, with use of the new WHO Child Growth Standards, the nutritional status of children can be compared using data from the 2007 Living Standard Survey and the current 2009-10 TLDHS. Figure 12.3 shows that malnutrition has remained high in general, and the proportion of children who have chronic malnutrition has increased from 54 percent to 58 percent. However, the proportion of children who are wasted has decreased from 25 percent to 19 percent, while the proportion of children who are severely wasted has remained the same over the time period. Similarly, the percentage of underweight children has declined, with an 8 percent decline occurring in the past two years. However, the percentage of severely underweight children has remained the same. These findings indicate that the effort to reduce malnutrition among children is showing some positive results but still has a long way to go.
2 Comparison should be carried with caution as there are overlaps in the confidence interval of these estimates.

152 | Nutrition of Children and Women
Figure 12.2 Trends in Nutritional Status of Children, 2002-2010, NCHS/CDC/WHO Standards
47
12
5349
12
46
53
17
52
Height-for-age Weight-for-height Weight-for-age0
10
20
30
40
50
60Percent below -2 SD
MICS 2002 DHS 2003 TLDHS 2009-10
Timor-Leste 2009-10Note: Data for the 2009-10 TLDHS are recalculated using the NCHS/CDC/WHOreference population to be comparable to the estimates from the earlier surveys.
Figure 12.3 Trends in Nutritional Status of Children, 2007-2010, WHO Child Growth Standards
24
815
54
25
49
33
7
15
58
19
45
Height-for-age
Weight-for-
height
Weight-for-age
Height-for-age
Weight-for-
height
Weight-for-age
0
10
20
30
40
50
60
70Percent
TLSLS 2007 TLDHS 2009-10
Timor-Leste 2009-10
Severe1 Any Malnutrition2
1 Percentage below -3 SD2 Percentage below -2 SD

Nutrition of Children and Women | 153
12.2 INITIATION OF BREASTFEEDING
Early initiation of breastfeeding is encouraged for a number of reasons. Mothers benefit from early suckling because it stimulates breast milk production and facilitates the release of oxytocin, which helps the uterus to contract and reduces postpartum blood loss. The first breast milk contains colostrum, which is highly nutritious and has antibodies that protect the newborn from diseases. Early initiation of breastfeeding also fosters bonding between mother and child.
Table 12.2 Initial breastfeeding
Percentage of children born in the five years preceding the survey who were ever breastfed, and for the last children born in the five years preceding the survey ever breastfed, the percentage who started breastfeeding within one hour and within one day of birth and the percentage who received a prelacteal feed, by background characteristics, Timor-Leste 2009-10
Background characteristic
Breastfeeding among children born in last five years Among last-born children ever breastfed:
Percentage ever
breastfed
Number of children born in
last five years
Percentage who started
breastfeeding within 1 hour
of birth
Percentage who started
breastfeeding within 1 day
of birth1
Percentage who received a prelacteal feed2
Number of last-born
children ever breastfed
Sex Male 96.6 5,021 81.3 96.2 12.8 3,048 Female 96.6 4,807 82.1 96.5 12.6 2,835
Residence Urban 95.8 2,353 83.5 95.5 17.0 1,435 Rural 96.8 7,475 81.1 96.6 11.3 4,448
District Aileu 97.6 359 81.1 99.8 6.9 218 Ainaro 96.8 579 82.7 97.1 6.9 310 Baucau 99.3 970 78.0 99.2 12.8 597 Bobonaro 85.6 934 84.3 97.8 19.9 548 Covalima 98.2 453 87.2 92.3 13.3 317 Dili 95.7 1,652 87.5 96.4 17.0 1,007 Ermera 99.1 1,252 87.3 98.7 5.8 715 Lautem 98.7 758 67.1 95.7 9.2 441 Liquiçá 96.4 582 69.0 88.2 29.9 350 Manatuto 97.9 433 90.1 99.1 9.2 259 Manufahi 97.2 393 72.0 93.1 13.8 231 Oecussi 98.1 783 84.7 94.1 10.4 487 Viqueque 98.4 678 77.6 97.2 4.6 404
Mother’s education No education 96.9 3,298 80.0 96.7 11.2 1,948 Primary 96.5 2,765 80.7 95.9 12.3 1,625 Secondary 96.2 3,546 83.4 96.3 13.7 2,160 More than secondary 98.6 218 89.0 97.3 21.0 151
Assistance at delivery Health professional3 95.7 2,941 84.4 96.6 15.2 1,945 Traditional birth attendant 97.7 1,762 79.5 95.2 9.9 1,007 Other 96.9 4,808 81.2 96.7 11.5 2,744 No one 92.7 313 71.8 94.5 19.0 188
Place of delivery Health facility 95.9 2,171 84.8 96.4 16.0 1,468 At home 96.8 7,641 80.6 96.3 11.6 4,413 Other * 5 * * * 2
Wealth quintile Lowest 98.3 2,090 79.2 96.1 8.5 1,211 Second 96.6 1,960 80.4 97.0 11.1 1,155 Middle 95.9 1,992 80.7 95.3 11.6 1,175 Fourth 95.9 1,903 82.1 96.1 15.2 1,138 Highest 96.2 1,884 85.9 97.3 17.0 1,204
Total 96.6 9,828 81.7 96.3 12.7 5,883
Note: Table is based on births in the last five years whether the children are living or dead at the time of interview. Total for number of children born in the five years before the survey includes four children with information missing on assistance at delivery and 11 children with information missing on place of delivery. An asterisk indicates that a figure is based on fewer than 25 unweighted cases and has been suppressed. 1 Includes children who started breastfeeding within one hour of birth 2 Children given something other than breast milk during the first three days of life 3 Doctor, nurse/midwife, or assistant nurse

154 | Nutrition of Children and Women
Table 12.2 shows the percentages of children born in the five years preceding the survey who were ever breastfed, who started breastfeeding within one hour and within one day of birth, and among last-born children ever breastfed in the five years before the survey, the percentage who received a prelacteal feed. Breastfeeding is nearly universal in Timor-Leste, with 97 percent of children born in the five years preceding the survey having been breastfed at some time. The percentage of children ever breastfed does not vary much by background characteristics.
On average four in five children are breastfed within the first hour of birth (82 percent) and 96 percent are breastfed within one day of birth. Thirteen percent of children are given a prelacteal feed, that is, something other than breast milk, during the first three days of life. The percentage of children who are breastfed early has increased in the past six years, the increase being more pronounced for children breastfed within one hour of birth. There has been a rise in the percentage of children breastfed within one hour of birth by about 74 percent, from 47 percent in the 2003 DHS to 82 percent in 2009-10 TLDHS.
There is no difference in the timing of initial breastfeeding by sex of the child or by rural or urban areas. Children from Manatuto are most likely to be breastfed immediately after birth (90 percent), and nearly all children in this region (99 percent) are breastfed within one day of birth. Children in Liquiçá are least likely to be breastfed, with 69 percent breastfed within one hour and 88 percent fed within one day of birth. As expected, the proportion of children given a prelacteal feed is also high in Liquiçá at 30 percent.
Women who have completed more than secondary school or a higher level of education are more likely to breastfeed within one hour of birth (89 percent) compared with women who have no education (80 percent). Women who have received more than secondary school education are more likely to give a prelacteal feed (21 percent) compared with women with no education (11 percent). Moreover, other characteristics of the infant and mother, such as type of assistance at delivery and place of delivery, have important influences on early breastfeeding practices. There is a difference in initiation of breastfeeding within one hour between children delivered by a health professional (84 percent) and children delivered with no assistance (72 percent). Eighty-five percent of children delivered in a health facility have initiated breastfeeding within one hour of birth. Initiation of breastfeeding within an hour of birth for children delivered at home has improved by 71 percent over the past years, rising from 48 percent in the 2003 DHS to 82 percent in the 2009-10 TLDHS. Differences in early breastfeeding by wealth are small, although larger proportions of children in the highest wealth quintile are likely to be breastfed within an hour of birth.
12.3 BREASTFEEDING STATUS BY AGE
UNICEF and WHO recommend that children be exclusively breastfed during the first six months of life and that children be given solid or semisolid complementary food in addition to continued breastfeeding after six months. The nutrition program under the National Nutrition Strategy 2004 promotes exclusive breastfeeding through the age of 6 months and thereafter promotes introducing complementary foods along with continued breast milk until the child is at least two years of age (MOH, 2004c). Exclusive breastfeeding is recommended in the first 6 months of life because breast milk is uncontaminated and contains all the nutrients necessary for children.
Information on breastfeeding was obtained in the 2009-10 TLDHS by asking mothers about the current breastfeeding status of all children under age 3 and, for the youngest child born in the three years before the survey and living with the mother, food (liquids or solids) given to the child the day before the survey.
Table 12.3 shows the percent distribution of youngest children under age 3 years by breastfeeding status and the percentage of children under age 3 using a bottle with a nipple. Contrary to WHO’s recommendations, only about half (52 percent) of children under age 6 months are exclusively breastfed in Timor-Leste. There are high proportions of children 0-5 months receiving food other than breast milk with complementary food (26 percent), plain water only (7 percent), and other milk (14 percent).

Nutrition of Children and Women | 155
Table 12.3 Breastfeeding status by age
Percent distribution of youngest children under age 3 who are living with their mother by breastfeeding status and the percentage currently breastfeeding; and the percentage of all children under age 3 using a bottle with a nipple, according to age in months, Timor-Leste 2009-10
Age in months
Percent distribution of youngest children under three living with their mother by breastfeeding status
Total
Percentage currently breast-feeding
Number of youngest children under 3
years
Percentage using a
bottle with a nipple1
Number of all children
under 3 years
Not
breast-feeding
Exclusively breastfed
Breastfeeding and consuming:
Plain
water only Other milk
Comple-mentary
foods
0-1 1.8 71.1 6.2 14.8 6.2 100.0 98.2 264 3.1 269 2-3 2.6 54.6 6.9 16.6 19.4 100.0 97.4 321 8.4 324 4-5 1.7 35.4 7.2 11.9 43.8 100.0 98.3 387 9.4 389 6-8 4.5 9.3 1.1 6.9 78.2 100.0 95.5 464 15.3 472 9-11 7.9 2.8 0.9 1.4 86.9 100.0 92.1 463 13.4 470 12-17 32.4 0.5 0.0 0.4 66.7 100.0 67.6 910 19.2 946 18-23 59.0 0.1 0.1 0.0 40.8 100.0 41.0 706 16.9 806 24-35 85.0 0.0 0.0 0.0 15.0 100.0 15.0 1,176 12.9 1,959
0-3 2.2 62.0 6.6 15.8 13.4 100.0 97.8 586 6.0 593
0-5 2.0 51.5 6.8 14.3 25.5 100.0 98.0 973 7.3 983 6-9 5.1 7.8 1.1 5.9 80.1 100.0 94.9 626 14.1 636 12-15 29.4 0.4 0.0 0.1 70.2 100.0 70.6 622 19.9 650
12-23 44.0 0.3 0.1 0.2 55.4 100.0 56.0 1,616 18.1 1,752
20-23 66.6 0.0 0.2 0.0 33.2 100.0 33.4 429 16.8 506
Note: Breastfeeding status refers to a “24-hour” period (yesterday and last night). Children who are classified as breastfeeding and consuming plain water only consumed no liquid or solid supplements. The categories of not breastfeeding, exclusively breastfed, breastfeeding and consuming plain water, other milk, and complementary foods (solids and semi-solids) are hierarchical and mutually exclusive, and their percentages add to 100 percent. Any children who get complementary food are classified in that category as long as they are breastfeeding as well. 1 Based on all children under three years
It can be noted that the data reported here cannot be directly compared with data from the
previous surveys as the methodology and data collection were different from the current survey. However, it can still be highlighted here: the 2003 DHS indicated 31 percent of children less that 6 months are being exclusively breastfed, a lower percentage than that indicated by the 2002 MICS survey (44 percent). The current finding does indicate a rise in the proportion of children fewer than 6 months of age who are exclusively breastfed (52 percent).
Table 12.3 and Figure 12.4 also show that seven in ten children (71 percent) under 2 months of age are exclusively breastfed, 6 percent consumed breast milk and plain water, and 15 percent consumed other milk in addition to breast milk. The proportion of children exclusively breastfed declines at age 6-8 months by 74 percent from the preceding cohort as complementary foods are introduced.

156 | Nutrition of Children and Women
Figure 12.4 Infant Feeding Practices by Age
<2 2-3 4-5 6-7 8-9 10-11 12-13 14-15 16-17 18-19 20-21 22-23
Age group in months
0
10
20
30
40
50
60
70
80
90
100Percent
Exclusivelybreastfed
Plain wateronly
Other milk
Comple-mentary foods
Not breast-feeding
Timor-Leste 2009-10
The 2009-10 TLDHS results also indicate that the proportion of children receiving complementary foods in a timely fashion is encouraging, with 78 percent of children age 6-8 months receiving complementary foods. This is an important Infant and Young Child Feeding (IYCF) indicator.
Bottle-feeding is usually associated with increased risk of illness, and especially diarrheal diseases, because of the difficulty in sterilizing the nipples properly. Bottle-feeding also shortens the period of postpartum amenorrhea and increases the risk of pregnancy. The practice of bottle-feeding with a nipple is not widespread in Timor-Leste. However, the percentage of children who are bottle-fed rises from 3 percent among children under age 2 months to 19 percent among children age 12-17 months and generally drops to 13 percent among children 24-35 months. It is noteworthy that 7 percent of children less than 6 months old are bottle-fed, and a considerable proportion of children 12-23 months are being bottle-fed (18 percent).
12.4 DURATION AND FREQUENCY OF BREASTFEEDING
Table 12.4 shows the median duration and frequency of breastfeeding by selected background characteristics. The estimates of median and mean durations of breastfeeding are based on current status data, that is, the proportion of last-born children in the 3 years preceding the survey who were being breastfed at the time of the survey.
Both duration and frequency of breastfeeding can affect the length of postpartum amenorrhea. The median duration of any type of breastfeeding in Timor-Leste is 17.5 months, while the mean duration is about 18.2 months. The median duration of exclusive breastfeeding is 2.5 months, while the mean duration is 4 months.
The median duration of exclusive breastfeeding is longest in Aileu (5.5 months) and shortest in Dili (1.6 months). The data also show that the median duration of breastfeeding among children is longer in the lowest two wealth quintiles (3.1 months or longer) compared with children in the highest wealth quintile (1.4 months).

Nutrition of Children and Women | 157
Table 12.4 also shows that the overwhelming majority of children under age 6 months were breastfed six or more times in the 24 hours preceding the survey (98 percent). In line with expectations, breastfeeding is slightly more frequent in the daytime than at night (mean number of daytime feeds is 7 compared with 6 at night). The mean number of daytime feeds is highest among children residing in Bobonaro district (8.5) and lowest among children in Dili (6.1).
Table 12.4 Median duration and frequency of breastfeeding
Median duration of any breastfeeding, exclusive breastfeeding, and predominant breastfeeding among children born in the 3 years preceding the survey, percentage of breastfeeding children under 6 months living with the mother who were breastfed six or more times in the 24 hours preceding the survey, and mean number of feeds (day/night), by background characteristics, Timor-Leste 2009-10
Background characteristic
Median duration (months) of breastfeeding among children born in the last 3 years1
Frequency of breastfeeding among children under 6 months2
Any
breastfeeding Exclusive
breastfeeding Predominant breastfeeding3
Percentage breastfed 6+ times in last
24 hours Mean number of day feeds
Mean number of night feeds
Number of children
Sex Male 17.3 2.3 3.0 97.6 6.9 6.0 502 Female 17.8 2.8 3.4 98.2 7.2 6.1 453
Residence Urban 16.9 2.0 2.1 96.3 6.3 5.5 221 Rural 17.7 2.7 3.6 98.3 7.2 6.2 734
District Aileu 19.6 5.5 6.3 96.3 6.2 5.2 44 Ainaro 19.2 4.5 4.8 97.2 6.2 5.0 49 Baucau 15.2 2.7 2.9 96.5 6.6 5.7 91 Bobonaro 16.5 * 3.8 98.7 8.5 6.4 103 Covalima 17.8 1.9 2.0 100.0 7.7 6.6 46 Dili 15.3 1.6 1.7 97.6 6.1 5.4 165 Ermera 18.5 2.6 4.3 100.0 7.8 8.0 141 Lautem 17.5 2.1 3.0 95.1 6.7 5.6 63 Liquiçá 18.5 4.2 4.8 98.7 7.8 6.7 60 Manatuto 17.1 * * 98.7 7.0 6.9 42 Manufahi 20.0 4.3 4.7 96.5 7.8 4.8 36 Oecussi 20.0 3.2 3.4 97.1 6.2 5.2 75 Viqueque 14.3 (2.9) (3.1) 97.5 6.5 4.8 40
Mother’s education No education 18.7 2.7 3.7 99.0 7.4 6.4 330 Primary 17.6 2.7 3.3 96.7 6.7 5.8 244 Secondary 16.7 2.2 2.8 98.2 7.0 5.9 358 More than secondary * * * 88.8 4.8 5.2 24
Wealth quintile Lowest 17.3 3.1 3.6 97.7 7.1 5.9 211 Second 18.5 3.3 3.9 99.2 7.4 6.6 203 Middle 17.3 2.2 3.6 97.2 7.2 5.9 198 Fourth 18.6 2.5 3.2 97.3 6.9 5.8 167 Highest 14.0 1.4 1.6 97.8 6.3 5.9 176
Total 17.5 2.5 3.2 97.9 7.0 6.0 955
Mean for all children 18.2 4.0 4.4 na na na na
Note: Median and mean durations are based on current status. Includes children living and deceased at the time of the survey. Figures in parentheses are based on 25-49 unweighted cases. An asterisk indicates that a figure is based on fewer than 25 unweighted cases and has been suppressed. na = Not applicable 1 It is assumed that non-last-born children and last-born children not currently living with the mother are not currently breastfeeding 2 Excludes children without a valid answer on the number of times breastfed 3 Either exclusively breastfed or received breast milk and plain water, and/or non-milk liquids only
12.5 TYPES OF COMPLEMENTARY FOODS
WHO recommends the introduction of solid food to infants around the age of 6 months because by that age breast milk by itself is no longer sufficient to maintain a child’s optimal growth. Table 12.5 shows information on the types of food given to the youngest child under 3 years of age living with the mother on the day or night preceding the survey, according to their breastfeeding status.
The percentage of children receiving solid or semisolid food increases gradually by age. It is encouraging to note that at 6-8 months of age, about four in five breastfed children are consuming solid or semisolid food (82 percent).

158 | Nutrition of Children and Women
Table 12.5 Foods and liquids consumed by children in the day or night preceding the interview
Percentage of youngest children under 3 years of age who are living with the mother by type of foods consumed in the day or night preceding the interview, according to breastfeeding status and age, Timor-Leste 2009-10
Age in months
Liquids Solid or semi-solid foods
Any solid or semi-
solid food
Food made
with oil, fat and butter
Sugary foods
Number of
children Infant
formula Other milk1
Other liquids2
Fortified baby foods
Food made from
grains3
Fruits and vege-tables rich in vitamin
A4
Other fruits and
vege-tables
Food made from
roots and tubers
Food made from
legumes and nuts
Meat, fish,
poultry, and eggs
Cheese, yogurt, other milk
product
BREASTFEEDING CHILDREN
0-1 14.4 11.4 1.0 0.6 5.3 2.9 1.0 1.6 0.0 2.6 0.6 6.3 1.7 2.1 260 2-3 22.0 13.7 1.5 7.3 15.1 2.3 1.9 1.3 0.6 2.8 0.2 19.6 0.5 0.4 313 4-5 24.0 17.0 2.3 14.3 41.6 9.4 0.8 2.1 1.0 11.3 0.6 44.5 4.8 5.6 381 6-8 23.1 18.6 5.7 12.3 80.7 25.6 8.5 8.2 2.2 29.3 2.1 81.9 10.8 9.9 443 9-11 19.4 13.2 21.9 5.8 93.2 45.7 12.4 17.8 4.5 43.9 1.9 94.3 25.0 26.5 426 12-17 18.9 17.1 41.0 5.6 97.5 71.8 28.2 30.7 15.1 52.4 3.1 98.5 41.6 37.0 615 18-23 19.6 15.7 51.7 4.4 99.4 72.7 32.5 31.6 12.1 51.2 0.8 99.4 37.1 39.9 290 24-35 16.9 11.1 68.1 5.6 99.1 82.1 27.3 48.0 18.1 56.9 3.9 100.0 46.9 54.3 177
6-23 20.2 16.3 29.3 7.1 92.6 54.1 20.2 22.1 8.8 44.4 2.2 93.5 29.2 28.2 1,773
Total 20.1 15.3 22.6 7.4 70.1 39.8 14.4 17.0 6.7 32.6 1.7 71.7 21.5 21.5 2,903
NONBREASTFEEDING CHILDREN
12-17 23.0 24.1 46.1 6.6 99.0 79.5 29.9 35.7 14.0 58.8 5.5 99.8 44.9 45.1 295 18-23 13.8 13.5 58.0 6.1 99.1 86.7 33.1 40.5 9.9 56.8 7.0 99.3 44.8 47.0 416 24-35 11.0 13.8 65.8 4.0 99.0 83.9 38.7 42.4 15.9 61.1 3.7 99.8 48.4 47.7 999
6-23 19.6 20.1 51.3 7.9 98.8 82.4 31.0 38.5 11.1 57.1 6.0 99.3 44.3 45.5 769
Total 15.5 17.2 58.9 5.7 98.2 82.4 35.0 40.3 13.6 58.8 4.7 98.9 46.1 46.2 1,788
Note: Breastfeeding status and food consumed refer to a 24-hour” period (yesterday and last night). Nonbreastfeeding children under the age of 12 months are included in the total but are not shown separately. 1 Other milk includes fresh, tinned and powdered cow or other animal milk 2 Doesn’t include plain water 3 Includes fortified baby food 4 Includes pumpkin, squash, carrots, sweet potatoes, dark green leafy vegetables, mangoes, and papayas
However, the introduction of other liquids such as water, juice, and formula takes place
earlier than the recommended age of 6 months. Even among the youngest group of breastfeeding children (<2 months), 14 percent drink infant formula in addition to breast milk, and 11 percent drink other milk in addition to breast milk. Forty-five percent of breastfed children age 4-5 months have started consuming solid or semisolid food. The early introduction of water and foods increases the risk of infections, and thus contributes to malnutrition.
Consumption of liquids other than milk increases gradually with age, and by age 12-17 months, 41 percent of breastfed children receive liquid supplements other than milk. Consumption of milk other than breast milk peaks at 6-8 months (19 percent) and declines thereafter. Supplementing with infant formula starts at 14 percent among breastfed children age 0-1 months and increases to 24 percent among breastfed children age 4-5 months.
In all age groups, children are more likely to consume foods made from grains than other types of solid or semisolid foods. Twenty-six percent of breastfed children 6-8 months consumed vitamin A-rich fruits and vegetables in the day and night preceding the survey. Meat, fish, poultry, and eggs have bodybuilding substances essential to good health, and they are important for balanced physical and mental development. These foods are introduced later into the diet of children in Timor-Leste, and few children consume them. For instance, at age 6-8 months, only 29 percent of breastfed children consume meat, fish, shellfish, poultry, or eggs. As expected, more nonbreastfeeding children at age 6-23 months consume solid or semi-solid foods than breastfeeding children.
12.6 INFANT AND YOUNG CHILD FEEDING (IYCF) PRACTICES
Infant and young child feeding (IYCF) practices include timely initiation of feeding solid/semi-solid foods from age 6 months, feeding small amounts, and increasing the amount of foods and frequency of feeding as the child gets older, while maintaining frequent breastfeeding. For the average, healthy breastfed child, solid/semi-solid foods should be provided two to three times per day at 6-8 months and three to four times per day between ages 9 and 24 months, with an additional snack being offered 1 to 2 times per day, as desired. The minimum infant and young child feeding (IYCF)

Nutrition of Children and Women | 159
practices for children age 6-23 months are defined as continued breastfeeding, feeding at least the minimum number of times per day (according to age), and feeding from the minimum number of food groups per day. However, not all infants and young children are breastfed. Therefore, for nonbreastfed children, the criteria reflected under “feeding practices” are receiving replacement feeding (that is, commercially produced infant formula, tinned, powdered, or fresh animal milk, cheese, yogurt, and other milk products), being fed at least the minimum number of times, and eating from the minimum number of food groups for nonbreastfed infants and young children.
As an integral part of the national nutrition strategy, various approaches have been developed by the Nutrition Department of the Ministry of Health, including the creation of awareness of growth monitoring and the timely introduction of complementary food and feeding practices. The National Strategy for Infant and Young Child Feeding was developed in 2003 and includes training of health workers on IYCF counseling and conducting a workshop on IYCF for all the nutrition and health education staff in all thirteen districts (MOH, 2004c). Moreover, the Nutrition Department of the MOH is working closely with Alola Foundation and UNICEF to organize mother’s support groups to enhance knowledge of timely initiation of proper feeding practices. In 2010, doctors and midwives were trained on IYCF practices and counseling in order to provide appropriate services and support to communities.
Figure 12.5 and Table 12.6 highlight infant and young child feeding practices among children age 6-23 months living with the mother. About 30 percent of children age 6-23 months are fed according to all three IYCF practices; that is, they are given milk or milk products and foods from recommended food groups and are fed at least the recommended minimum number of times. Seventy-eight percent are given breast milk or milk products, 54 percent are given the recommended number of foods (food from three or more groups for breastfed children), and 55 percent are fed at least as often as recommended.
These feeding practices are better among children age 12-17 months. For example, 25 percent of children age 6-8 months are fed according to IYCF recommendations, compared with 37 percent of children age 12-17 months. The findings indicate that there is no significant difference in feeding practices by sex of the child, residence, or mother’s education. However, children who are born to mothers in the higher wealth quintiles are more likely than other children to be fed according to recommendations.
Figure 12.5 Infant and Young Child Feeding (IYCF) Practices
41
5
30
59
95
70
Breastfed Nonbreastfed All 6-23 months
Breastfeeding status
0
20
40
60
80
100Percent
Fed with all 3IYCF practices
Not fed with all 3IYCF practices
Timor-Leste 2009-10

160 | Nutrition of Children and Women
Table 12.6 Infant and young child feeding (IYCF) practices
Percentage of youngest children age 6-23 months living with their mother who are fed according to three IYCF feeding practices based upon number of food groups andtimes they are fed during the day or night preceding the survey by breastfeeding status and background characteristics, Timor-Leste 2009-10
Background characteristic
Among breastfed children 6-23 months, percentage fed:
Among non-breastfed children 6-23 months, percentage fed:
Among all children 6-23 months, percentage fed:
3+ food groups1
Minimum times or more2
Both 3+ food
groups and
minimum times or more
Number of
breastfed children
6-23 months
Milk or milk
products34+ food groups
4+ times or more
With 3 IYCF
practices4
Number of non-
breastfed children
6-23 months
Breast- milk or
milk products3
3+ or 4+ food groups5
Minimum times or more6
With all 3 IYCF
practices
Number of all
children 6-23
months
Age in months 6-8 28.0 75.2 26.5 443 * * * * 21 98.6 28.9 72.2 25.3 464 9-11 47.1 64.7 32.9 426 (39.3) (56.4) (20.1) (0.0) 37 95.2 47.8 61.1 30.3 463 12-17 69.9 70.5 51.4 615 29.7 52.8 22.0 7.3 295 77.2 64.4 54.8 37.1 910 18-23 69.1 75.7 54.0 290 20.3 55.1 17.6 4.1 416 53.0 60.9 41.4 24.6 706
Sex Male 52.8 71.2 41.3 912 29.8 51.3 19.7 7.0 398 78.7 52.4 55.5 30.8 1,310 Female 54.8 71.1 41.0 862 22.1 57.1 18.4 2.9 371 76.6 55.5 55.2 29.6 1,232
Residence Urban 65.1 65.7 43.4 367 48.4 75.0 15.6 7.8 226 80.3 68.9 46.6 29.8 593 Rural 50.9 72.5 40.6 1,407 16.8 45.4 20.6 3.9 542 76.8 49.3 58.1 30.4 1,949
District Aileu 49.2 44.1 32.6 68 (26.0) (45.3) (6.6) (3.4) 16 85.6 48.4 36.8 26.9 85 Ainaro 16.1 49.7 9.1 111 18.0 17.0 4.6 0.0 42 77.5 16.4 37.3 6.6 153 Baucau 58.6 77.2 43.0 191 13.5 47.5 12.4 1.8 90 72.3 55.0 56.5 29.8 282 Bobonaro 56.5 91.4 54.7 156 27.4 48.3 26.2 5.7 72 77.1 53.9 70.9 39.3 228 Covalima 40.9 70.9 29.6 76 (21.6) (23.6) (9.9) (0.0) 33 76.5 35.7 52.6 20.7 109 Dili 75.5 66.9 49.2 232 52.8 82.9 14.0 9.5 163 80.5 78.6 45.1 32.8 395 Ermera 49.7 67.4 48.3 236 (23.1) (38.4) (64.7) (11.3) 62 84.1 47.4 66.8 40.6 298 Lautem 42.7 68.1 22.0 157 23.0 34.6 10.2 0.8 66 77.2 40.3 50.9 15.7 223 Liquiçá 73.5 78.4 61.7 108 23.7 85.4 27.7 7.3 41 79.2 76.7 64.6 46.9 149 Manatuto 60.9 86.2 56.1 79 14.5 74.3 17.1 2.6 41 70.5 65.5 62.4 37.6 120 Manufahi 75.6 50.0 41.8 81 (30.7) (65.8) (5.6) (3.0) 22 85.1 73.5 40.5 33.5 103 Oecussi 43.8 71.7 32.8 164 8.0 45.6 21.8 3.4 47 79.5 44.2 60.6 26.3 211 Viqueque 45.1 87.5 40.6 114 10.9 44.6 15.4 4.3 74 65.0 44.9 59.1 26.3 187
Mother’s education No education 48.1 72.9 39.3 583 16.3 47.9 22.1 2.9 210 77.9 48.0 59.5 29.7 792 Primary 52.8 71.9 40.6 527 16.7 44.9 20.3 4.6 202 76.9 50.6 57.6 30.6 729 Secondary 59.9 68.4 43.1 634 35.4 61.9 16.3 5.0 321 78.3 60.6 50.9 30.3 956
More than secondary * * * 29 * * * * 36 (73.8) (64.3) (47.7) (31.7) 65
Wealth quintile Lowest 43.6 73.2 32.6 401 9.1 34.4 15.9 1.5 155 74.7 41.0 57.2 24.0 556 Second 46.8 70.9 37.6 370 11.2 41.3 21.9 1.8 150 74.4 45.2 56.8 27.3 520 Middle 54.6 70.1 43.4 376 17.9 48.0 15.1 3.2 136 78.2 52.8 55.5 32.7 512 Fourth 59.8 70.7 45.5 372 38.1 59.9 22.5 4.4 138 83.3 59.8 57.7 34.4 510 Highest 70.2 70.2 50.1 254 48.7 80.3 19.9 12.2 191 78.0 74.6 48.6 33.8 444
Total 53.8 71.1 41.2 1,773 26.1 54.1 19.1 5.0 769 77.6 53.9 55.4 30.2 2,542
Note: Figures in parentheses are based on 25-49 unweighted cases. An asterisk indicates that a figure is based on fewer than 25 unweighted cases and has been suppressed.1 Food groups: a. infant formula, milk other than breastmilk, cheese or yogurt or other milk products; b. foods made from grains, roots, and tubers, including porridge, fortified baby food from grains; c. vitamin A-rich fruits and vegetables; d. other fruits and vegetables; e. eggs; f. meat, poultry, fish, and shellfish (and organ meats); g. legumes and nuts; h. foods made with oil, fat, butter. 2 At least twice a day for breastfed infants 6-8 months and at least three times a day for breastfed children 9-23 months 3 Includes commercial infant formula, fresh, tinned and powdered animal milk, and cheese, yogurt and other milk products 4 Nonbreastfed children age 6-23 months are considered to be fed with a minimum standard of three Infant and Young Child Feeding practices if they receive other milk or milk products and are fed at least the minimum number of times per day with at least the minimum number of food groups. 5 3+ food groups for breastfed children and 4+ food groups for non-breastfed children 6 Fed solid or semi-solid food at least twice a day for infants 6-8 months, 3+ times for other breastfed children, and 4+ times for non-breastfed children
12.7 ANEMIA IN CHILDREN
Anemia is a condition characterized by a reduction in the red blood cell volume and a decrease in the concentration of hemoglobin in the blood. Hemoglobin is necessary for transporting oxygen to tissues and organs in the body. About half of the global burden of anemia is due to iron deficiency. Iron deficiency, in turn, is largely due to an inadequate dietary intake of bioavailable iron, increased iron requirements during rapid growth periods (such as pregnancy and infancy), and increased blood loss due to hookworm infestation. Nutritional anemia includes the anemia burden due to deficiency in iron plus deficiencies in folate, vitamins B and B12, and certain trace elements involved with red blood cell production. Anemia in children is associated with impaired mental and

Nutrition of Children and Women | 161
physical development and with increased morbidity and mortality. Anemia can be a particularly serious problem for pregnant women, leading to premature delivery and low birth weight3.
The 2009-10 TLDHS included anemia testing of children age 6-59 months and women age 15-49 in every third household selected for the 2009-10 TLDHS sample. Anemia levels were determined by measuring the level of hemoglobin in the blood, with a decreased concentration characterizing anemia. For hemoglobin measurements, a drop of capillary blood was taken with a finger prick (using sterile, disposable instruments). Hemoglobin concentration was measured using the HemoCue photometer system.
Table 12.7 Prevalence of anemia in children
Percentage of children age 6-59 months classified as having anemia, by background characteristics, Timor-Leste 2009-10
Background characteristic
Anemia status by hemoglobin level Number of
children Mild
(10.0-10.9 g/dl)Moderate
(7.0-9.9 g/dl) Severe
(<7.0 g/dl) Any anemia (<11.0 g/dl)
Age in months 6-8 34.5 24.3 0.8 59.6 106 9-11 36.5 29.6 0.8 66.9 129 12-17 27.1 23.6 0.8 51.5 296 18-23 27.4 18.6 0.4 46.3 258 24-35 30.2 11.6 0.2 42.0 589 36-47 18.1 8.2 0.4 26.8 615 48-59 19.7 5.7 0.1 25.5 574
Sex Male 24.1 13.6 0.2 38.0 1,286 Female 25.5 12.4 0.6 38.4 1,281
Mother’s interview status Interviewed 24.5 13.5 0.4 38.4 2,362 Not interviewed but in household 28.5 8.5 1.1 38.1 73 Not interviewed, and not in the household1 27.7 7.0 0.0 34.7 132
Residence Urban 20.9 12.1 0.1 33.1 511 Rural 25.8 13.2 0.5 39.4 2,056
District Aileu 20.9 16.6 2.1 39.6 103 Ainaro 19.8 10.7 0.5 31.0 161 Baucau 38.6 12.5 0.0 51.1 253 Bobonaro 30.7 13.4 0.0 44.1 255 Covalima 19.8 15.6 0.8 36.2 108 Dili 17.6 7.7 0.0 25.3 365 Ermera 11.0 4.3 0.0 15.4 324 Lautem 29.6 16.2 0.4 46.3 247 Liquiçá 25.9 14.0 0.5 40.5 142 Manatuto 31.4 36.0 0.4 67.9 130 Manufahi 30.8 6.9 0.0 37.7 77 Oecussi 31.7 12.4 0.5 44.5 217 Viqueque 23.0 19.2 1.5 43.7 185
Mother’s education2 No education 24.7 11.0 0.4 36.1 881 Primary 26.6 14.9 0.5 42.0 672 Secondary 22.8 14.7 0.4 37.9 844 More than secondary 28.4 8.4 0.0 36.8 37
Wealth quintile Lowest 24.0 16.7 0.5 41.2 570 Second 26.1 9.7 0.2 36.0 544 Middle 27.5 12.2 0.5 40.2 498 Fourth 23.5 14.9 0.4 38.8 494 Highest 22.8 11.1 0.3 34.1 461
Total 24.8 13.0 0.4 38.2 2,566
Note: Table is based on children who slept in the household the night before the interview. Prevalence of anemia, based on hemoglobin levels, is adjusted for altitude using CDC formulas (CDC, 1998). Hemoglobin in grams per deciliter (g/dl). Figures in parentheses are based on 25-49 unweighted cases. 1 Includes children whose mothers are deceased 2 For women who are not interviewed, information is taken from the Household Questionnaire. Excludes children whose mothers are not listed in the Household Questionnaire.
3 WHO considers anemia prevalence over 40 percent in a population to be a major public health problem, from 20-40 percent is considered a medium-level public health problem, and from 5-19.9 percent is a mild public health problem (WHO, 2001a).

162 | Nutrition of Children and Women
Table 12.7 shows the percentage of children age 6-59 months classified as having anemia, by background characteristics. Nearly two in five (38 percent) Timorese children age 6-59 months old are anemic, with 25 percent mildly anemic, 13 percent moderately anemic, and less than 1 percent severely anemic.
It is noteworthy that children 36 months and older are less likely to be anemic than younger children. Rural children (39 percent) are slightly more likely to have anemia than urban children (33 percent). Children in Manatuto district have the highest prevalence of anemia (68 percent), and children in Ermera district have the lowest prevalence (15 percent). There is no consistent pattern between prevalence of anemia and mother’s education or sex of the child. Children in the highest wealth quintile are less likely to have anemia (34 percent) compared with children in the lowest wealth quintile (41 percent).
The levels of childhood anemia as reported in DHS 2003 show 32 percent of children are anemic, indicating minimal improvement over the years.
12.8 MICRONUTRIENT INTAKE AMONG CHILDREN
Micronutrient deficiency has serious consequences for childhood morbidity and mortality. Children can receive micronutrients from foods, fortified foods, and direct supplementation. Vitamin A is an essential micronutrient for the immune system. Severe vitamin A deficiency (VAD) can cause eye damage. VAD can also increase the severity of infections, such as measles and diarrheal diseases in children, and can slow recovery from illness. Vitamin A is found in breast milk, other milks, liver, eggs, fish, butter, red palm oil, mangoes, papayas, carrots, pumpkins, and dark green leafy vegetables. The liver can store enough vitamin A for four to six months.
The 2009-10 TLDHS collected information on the consumption of vitamin A-rich foods and supplements. Table 12.8 shows the intake of several key micronutrients among children. Nearly four-fifths (79 percent) of last-born children age 6-35 months consumed vitamin A-rich foods in the 24-hour period before the survey. Consumption of vitamin A-rich foods increases from 38 percent among children age 6-8 months to 93 percent among children age 24-35 months. There is no difference by sex in the consumption of vitamin A-rich foods. Breastfeeding children are much less likely to consume foods rich in vitamin A than nonbreastfeeding children. Urban children (87 percent) are more likely than rural children (77 percent) to consume vitamin A-rich foods. Children born to mothers with more than a secondary level of education are more likely to have received foods rich in vitamin A than children born to mothers with a primary education. Children of older mothers are somewhat more likely than their counterparts to receive vitamin A-rich foods. Children living in the wealthiest households are much more likely to consume vitamin A-rich foods than children living in other households.
Fifty-two percent of young children consumed foods rich in iron during the 24 hours before the survey. Noticeable differences by background characteristics are also seen in the consumption of iron-rich foods by young children. Consumption of iron-rich foods peaks at 60 percent among children age 24-35 months and is slightly higher among nonbreastfeeding children, urban children, and children of mothers age 20 and older. Children living in the wealthiest households (76 percent) are much more likely to consume foods rich in iron than children living in households in the lowest two wealth quintiles (less than 40 percent).
An important strategy for preventing vitamin A deficiency in Timor-Leste has been the distribution of vitamin A capsules through the Timor-Leste national immunization campaign, which has been in place since 2000. In addition to the campaigns, vitamin A supplements are also readily available and distributed at health facilities and integrated community health service (SISCa) posts. The campaigns cover all the districts in the country. During the distribution periods, children age 6-11 months receive 100,000 international units (IU), and children 12-59 months receive 200,000 IU of vitamin A. Children under 6 months are not covered because most children in this age group are breastfed and receive vitamin A through breast milk. Information on vitamin A and supplements is based on the mother’s recall.

Nutrition of Children and Women | 163
Table 12.8 Micronutrient intake and food supplementation among children
Among youngest children age 6-35 months who are living with their mother, the percentages who consumed vitamin A-rich and iron-rich foods in the day or night preceding the survey, and among all children age 6-59 months, the percentages who were given vitamin A supplements in the 6 months preceding the survey, who were given iron supplements in the last seven days, who were given deworming medication in the 6 months preceding the survey, and who have ever received supplementary food, by background characteristics, Timor-Leste 2009-10
Background characteristic
Among youngest children age 6-35 months living with the mother: Among all children age 6-59 months:
Percentage who consumed
foods rich in vitamin A in last
24 hours1
Percentage who consumed
foods rich in iron in last 24
hours2 Number of
children
Percentage given vitamin A supplements in last 6 months
Percentage given iron
supplements in last 7 days
Percentage given
deworming medication in last 6 months3
Percentage ever given
supplementary food
Number of children
Age in months 6-8 37.7 30.1 464 36.5 20.3 12.4 33.9 472 9-11 62.5 44.4 463 51.6 17.8 17.9 38.3 470 12-17 84.5 54.5 910 52.7 24.8 28.7 39.6 946 18-23 88.3 54.5 706 55.2 21.5 36.2 37.7 806 24-35 92.6 60.4 1,176 51.7 21.7 39.0 35.4 1,959 36-47 na na na 52.4 18.8 41.4 33.6 1,947 48-59 na na na 48.2 16.2 38.9 30.4 1,745
Sex Male 78.5 50.7 1,889 50.6 20.0 35.7 34.0 4,224 Female 79.8 53.6 1,829 50.8 19.8 35.1 35.4 4,121
Breastfeeding status Breastfeeding 68.6 45.5 1,950 51.2 22.0 22.8 40.7 2,025 Not breastfeeding 91.0 59.4 1,760 50.7 19.2 39.7 33.1 6,239
Residence Urban 86.8 69.5 906 50.5 26.9 40.3 15.4 2,037 Rural 76.7 46.5 2,812 50.8 17.7 33.8 40.9 6,308
District Aileu 81.3 42.4 124 70.4 20.7 46.8 36.6 296 Ainaro 53.7 20.1 216 19.8 9.2 7.3 26.2 485 Baucau 82.7 60.7 375 45.4 2.2 28.2 24.2 850 Bobonaro 81.4 53.9 354 55.7 37.2 43.4 61.8 779 Covalima 67.7 38.4 172 72.3 8.1 48.0 48.0 379 Dili 91.2 78.9 614 48.2 31.4 43.4 7.6 1,424 Ermera 70.7 31.6 443 37.7 16.0 22.8 38.1 1,031 Lautem 79.8 54.4 306 58.5 8.0 45.3 20.8 653 Liquiçá 87.7 54.4 210 61.6 35.0 38.0 54.0 488 Manatuto 81.1 63.6 167 76.9 41.4 64.4 49.6 371 Manufahi 91.7 73.3 150 40.0 12.9 37.7 55.0 332 Oecussi 69.5 37.9 314 65.6 9.4 35.5 76.4 657 Viqueque 80.7 42.5 273 38.0 20.3 15.1 3.8 599
Mother’s education No education 76.6 40.6 1,173 42.9 15.7 29.2 37.2 2,788 Primary 76.9 49.7 1,049 53.4 18.7 35.3 39.1 2,361 Secondary 82.6 61.9 1,405 55.6 23.1 40.3 30.2 3,009 More than secondary 85.7 76.7 92 54.1 47.3 51.4 15.5 188
Mother’s age at birth 15-19 58.0 35.8 104 50.3 15.9 31.0 46.2 147 20-29 78.7 53.1 1,645 51.2 20.8 36.2 34.4 3,504 30-39 80.4 53.4 1,462 50.7 19.6 35.3 34.1 3,444 40-49 81.4 48.5 508 49.2 18.6 33.9 35.8 1,250
Wealth quintile Lowest 74.0 39.8 788 43.8 10.7 27.5 38.3 1,759 Second 73.5 38.5 723 44.4 13.5 29.4 36.6 1,629 Middle 78.1 49.1 750 50.7 21.3 35.1 41.8 1,671 Fourth 82.4 57.7 730 56.6 25.0 39.0 36.7 1,646 Highest 88.4 76.3 727 58.5 29.7 46.6 19.7 1,641
Total 79.2 52.1 3,718 50.7 19.9 35.4 34.7 8,345
Note: Information on vitamin A and iron supplements and deworming medication is based on the mother’s recall and immunization card (where available). Total for youngest children age 6-35 months living with the mother includes 8 children with information missing on breastfeeding status. Total for all children 6-59 months includes 79 children with information missing on breastfeeding status. na = Not applicable 1 Includes meat (and organ meat), fish, poultry, eggs, pumpkin, squash, carrots, sweet potatoes, dark green leafy vegetables, mango, and papaya 2 Includes meat (including organ meat) 3 Deworming for intestinal parasites is commonly done for helminthes.
One in two children (51 percent) age 6-59 months received a vitamin A supplement in the six
months before the survey (Table 12.8). This is an improvement over the last five years; the 2003 DHS reported that 34 percent of children age 6-59 months had received vitamin A supplementation during

164 | Nutrition of Children and Women
the most recent distribution preceding the survey. Differences in the consumption of vitamin A supplements by sex, residence, breastfeeding status, and mother’s age at birth are small. Differences in vitamin A supplementation by wealth quintiles is marked, with children in the highest wealth quintile much more likely to receive vitamin A supplements than children in the lowest wealth quintile (59 percent versus 44 percent). Children residing in Ainaro are least likely (20 percent) to receive vitamin A supplements compared with children in Manatuto (77 percent).
Along with vitamin A deficiency, the prevalence of worm infestation has been high in Timor-Leste (MOH, 2004c). The Ministry of Health therefore integrated the deworming of children age 2-5 into the national biannual vitamin A supplementation program. By 2003, the entire country was covered. Deworming medication is given to children from age 6-59 months. Information on deworming of children was collected in the 2009-10 TLDHS survey.
Table 12.8 indicates that 35 percent of children age 6-59 months received deworming tablets in the six months preceding the survey. Children over 24 months are more likely to receive deworming tablets. Children in urban areas are more likely to receive deworming tablets than rural children. District-level varia-tion among children who receive deworming tablets is high, ranging from 7 percent in Ainaro to 64 percent in Manatuto. Mother’s education has a positive influence on children receiving deworming tablets.
Age in the 2009-10 TLDHS does not refer to the age of the child during the vitamin A or deworming distribution but rather refers to age on the day of the interview (current status). The inclusion of these “ineligible” children in the denominator may account for some underestimation in the coverage of vitamin A and deworming in these specific age groups at the time of the survey.
The 2009-10 TLDHS also assessed reported cases of night blindness among children age 12-59 months. As it would be difficult for mothers to report correctly whether her child had night blindness, two proxy questions were administered: a question on whether the child showed any restriction of movement during the evenings compared with the daytime; and whether the child showed any signs of tripping or bumping into things in the evenings. These types of proxy reports have been used in other population-based surveys in which the parent/guardian was asked if the child has difficulty seeing in the evenings and, to be more specific, was prompted to probe for whether the child bumps into objects or trips over objects in the evenings (Wedner et al., 2004).
Table 12.9 Signs of night blindness among children
Among children 12-59 months, the percentage who in the past 6 months have exhibited less movement in the evenings and who have tipped over or bumped into things in the evening, bybackground characteristics, Timor-Leste 2009-10
Background characteristic
Percentage who in the past 6 months have:
Number of children
Exhibited less movement in the evenings
Tripped over or bumped
into things in the evenings
Age in months 12-17 6.9 10.3 94618-23 8.4 14.9 80624-35 6.7 14.3 1,95936-47 6.8 12.0 1,94748-59 5.1 10.7 1,745
Sex Male 6.5 12.0 3,736Female 6.6 12.9 3,667
Breastfeeding status Breastfeeding 7.0 11.4 1,144Not breastfeeding 6.5 12.5 6,181
Residence Urban 5.3 13.2 1,828Rural 7.0 12.1 5,575
District Aileu 6.0 11.4 268Ainaro 23.3 38.4 435Baucau 5.7 10.0 736Bobonaro 4.8 13.1 690Covalima 1.4 1.1 335Dili 4.7 15.1 1,277Ermera 0.4 0.3 915Lautem 4.1 9.8 559Liquiçá 36.5 41.7 438Manatuto 2.6 1.9 330Manufahi 7.3 28.8 302Oecussi 0.5 4.2 584Viqueque 1.9 0.4 533
Mother’s education No education 7.4 12.3 2,520Primary 6.4 12.6 2,059Secondary 6.1 12.5 2,661More than secondary 2.5 10.8 163
Mother’s age at birth 15-19 4.2 15.4 9820-29 6.7 12.6 3,05430-39 6.8 12.7 3,09940-49 5.6 10.9 1,152
Wealth quintile Lowest 7.0 12.0 1,553Second 7.0 13.0 1,441Middle 6.0 11.8 1,473Fourth 7.0 11.6 1,445Highest 5.8 13.7 1,491
Total 6.6 12.4 7,403
Note: Total includes 77 children with information missing on breastfeeding status.

Nutrition of Children and Women | 165
Table 12.9 indicates that about 7 percent of the children showed restricted movements in the evenings and 12 percent were reported to trip or bump into objects. Children age 18-23 months are most likely to show these signs. Children in Ainaro and Liquiçá most often showed these symptoms. It can be noted here that the proportion of children receiving vitamin A supplementation in the 6 months before the survey was lowest in Ainaro (20 percent in Table 12.8).
12.9 NUTRITIONAL STATUS OF WOMEN
A woman’s nutritional status has important implications for her health as well as for the health of her children. Malnutrition in women results in reduced productivity, an increased susceptibility to infections, delayed recovery from illness, and heightened risk of adverse pregnancy outcomes. A woman with poor nutritional status, as indicated by a low body mass index (BMI), short stature, anemia, or other micronutrient deficiency, has a greater risk of obstructed labor, having a baby with a low birth weight, producing lower quality breast milk, dying from postpartum hemorrhage, and experiencing illness for herself and her baby.
The 2009-10 TLDHS collected information on the height and weight of women in the reproductive age group. In this report, two indicators of nutritional status are presented—height and BMI.
The height of a woman is associated with past socioeconomic status and nutrition during childhood and adolescence. A woman’s height is used to predict the risk of difficulty in delivery because small stature is often associated with small pelvic size and the potential for obstructed labor. The risk of giving birth to a low birthweight baby is influenced by the mother’s nutritional status. The cut-off point for the height at which mothers can be considered at risk varies between populations but normally falls between 140 and 150 centimeters. As in other DHS surveys, a cut-off point of 145 cm is used for the 2009-10 TLDHS.
The index used to measure thinness or obesity is known as the BMI, defined as weight in kilograms divided by height squared in meters (kg/m2). A cut-off point of 18.5 is used to define thinness or acute undernutrition, and a BMI of 25 or above usually indicates overweight or obesity. According to WHO, a prevalence of more than 20 percent of women with a BMI less than 18.5 indicates a serious public health problem (WHO, 1995).
Table 12.10 presents the values of the two indicators of nutritional status and the proportion of women falling into high-risk categories, according to background characteristics. Women for whom there was no information on height and/or weight and for whom a BMI could not be estimated (pregnant women and women with a birth in the preceding two months) are excluded from this analysis. The data analysis on BMI is based on 11,698 women, while the height analysis is based on 12,845 women age 15-49 years. Overall, 15 percent of women are shorter than 145 cm. Women in rural areas are much shorter on average than women in urban areas, with 17 percent falling below the 145 cm cutoff compared with only 9 percent of women in urban areas. Women living in Dili are least likely to be below 145 cm (7 percent), while women in Ermera are most likely (31 percent). Women with a secondary and higher level of education are less likely to be short than women who have no education. Women in the highest wealth quintile are less likely to be below 145 cm than women in the lowest wealth quintile (8 percent and 17 percent, respectively).
Table 12.10 shows that there are large differentials across background characteristics in the percentage of women assessed as malnourished or “thin” (BMI less than 18.5) and overweight (BMI 25 or higher). Twenty-seven percent of women were found to be malnourished with BMI <18.5 indicating that malnutrition among women is a serious public health concern in Timor-Leste. About 5 percent of Timorese women are overweight or obese. Women age 15-19 are more likely to be thin or undernourished than women in other age cohorts (33 percent). Women are more likely to have a BMI less than 18.5 in rural areas (28 percent) than in urban areas (24 percent). However, the

166 | Nutrition of Children and Women
Table 12.10 Nutritional status of women
Among women age 15-49, the percentage with height under 145 cm, mean body mass index (BMI), and the percentage with specific BMI levels, by background characteristics, Timor-Leste 2009-10
Background characteristic
Height Body Mass Index1
Percentage below
145 cm Number of
women
Mean Body Mass Index
(BMI)
Normal Thin Overweight/obese
Number of women
18.5-24.9 (Total
normal)<18.5
(Total thin)17.0-18.4
(Mildly thin)
<17 (Mod-erately and
severely thin)
≥25.0 (Total over-weight or
obese)
25.0-29.9 (Over-weight)
≥30.0 (Obese)
Age 15-19 22.0 3,045 19.5 65.1 33.4 22.3 11.1 1.5 1.2 0.4 2,952 20-29 12.8 4,139 20.1 68.6 27.9 18.8 9.1 3.5 2.9 0.6 3,539 30-39 12.6 3,175 20.7 69.1 22.8 15.6 7.2 8.0 6.8 1.2 2,804 40-49 12.3 2,487 20.6 67.7 23.9 15.9 7.9 8.5 7.5 1.0 2,403
Residence Urban 8.8 3,276 20.8 66.5 24.4 16.4 8.0 9.1 7.5 1.6 2,973 Rural 16.9 9,570 20.0 68.0 28.2 19.0 9.2 3.7 3.3 0.5 8,725
District Aileu 15.6 539 20.3 76.6 20.8 15.9 4.8 2.6 2.3 0.3 501 Ainaro 23.0 605 20.5 74.1 21.0 14.7 6.3 5.0 4.3 0.7 544 Baucau 16.7 1,388 20.5 79.7 16.9 11.8 5.0 3.4 3.2 0.3 1,282 Bobonaro 11.8 1,249 19.5 57.1 39.4 24.0 15.4 3.4 3.1 0.4 1,149 Covalima 13.9 772 20.4 58.7 31.4 21.1 10.4 9.9 9.0 0.9 719 Dili 7.1 2,350 21.1 68.5 21.6 15.6 6.0 9.9 8.0 1.8 2,134 Ermera 31.3 1,518 19.6 66.8 31.3 21.3 10.1 1.9 1.6 0.2 1,384 Lautem 8.8 839 20.3 67.5 27.8 18.6 9.2 4.7 3.5 1.2 746 Liquiçá 16.5 788 19.8 64.1 32.8 23.1 9.7 3.1 2.6 0.5 715 Manatuto 7.8 596 20.3 75.0 21.1 13.6 7.5 3.9 3.3 0.6 544 Manufahi 14.1 462 20.0 65.1 29.8 18.9 10.9 5.1 4.3 0.7 409 Oecussi 10.3 878 19.5 60.9 36.3 22.3 14.0 2.8 2.4 0.5 794 Viqueque 17.3 861 20.2 66.9 27.2 18.9 8.3 5.8 5.1 0.7 777
Education No education 17.3 3,791 20.0 68.0 28.0 18.7 9.3 3.9 3.5 0.5 3,446 Primary 15.2 2,956 20.3 66.3 27.3 18.2 9.1 6.4 5.5 0.9 2,666 Secondary 13.5 5,677 20.2 67.7 27.4 18.5 8.9 4.9 4.0 0.9 5,204 More than secondary 8.2 422 21.1 72.4 18.3 14.0 4.3 9.3 9.3 0.0 382
Wealth quintile Lowest 17.2 2,277 19.7 67.9 29.9 19.4 10.6 2.2 1.8 0.4 2,053 Second 19.7 2,440 19.9 68.5 28.8 19.0 9.8 2.8 2.3 0.5 2,203 Middle 17.1 2,550 19.9 67.8 28.9 20.0 8.9 3.3 3.0 0.4 2,312 Fourth 13.8 2,628 20.2 65.7 28.4 18.8 9.6 6.0 5.1 0.8 2,411 Highest 7.9 2,950 21.1 68.4 21.6 15.2 6.4 10.0 8.4 1.6 2,720
Total 14.8 12,845 20.2 67.6 27.2 18.3 8.9 5.1 4.3 0.8 11,698
Note: The Body Mass Index (BMI) is expressed as the ratio of weight in kilograms to the square of height in meters (kg/m2).1 Excludes pregnant women and women with a birth in the preceding 2 months
percentage of overweight or obese women is higher in urban areas (9 percent) than in rural areas (4 percent). Bobonaro district (39 percent) has the highest percentage of undernourished women compared with Baucau district, which has the lowest percentage (17 percent). The percentage of women who are thin declines as level of education and household wealth increases. However, the proportion of overweight or obese women increases with increasing educational level and is highest among those in the highest wealth quintile.
Women’s nutritional status has improved over the years. The proportion of malnourished women (BMI <18.5) has decreased by 29 percent in the past decade, from 38 percent in the 2003 DHS to 27 percent in the 2009-10 TLDHS. However, the level of chronic energy deficiency among nonpregnant women is still high, with more than one-quarter of women having a BMI less than 18.5. The mean BMI has increased only slightly over the years from 19.5 in the 2003 DHS to 20.2 in the 2009-10 TLDHS.
12.10 FOODS CONSUMED BY MOTHERS
The quality and quantity of food that mothers eat influences their health and their children’s health, especially breastfeeding children. The 2009-10 TLDHS included questions on the types of foods that mothers of children under age 3 ate during the day and night preceding the interview. Table 12.11 shows that most mothers of young children eat foods made from grains (92 percent), nearly one in two (50 percent) eats foods made from roots or tubers, one in five (20 percent) eats foods

Nutrition of Children and Women | 167
Table 12.11 Foods consumed by mothers in the day or night preceding the interview
Among mothers age 15-49 with a child under age 3 living with them, the percentage who consumed specific types of foods in the day or night preceding the interview, by background characteristics, Timor-Leste 2009-10
Background characteristic
Liquids Solid or semi-solid foods
Foods made
with oil/ fat/butter
Sugary foods
Number of
mothers Milk Tea/
coffee Other liquids
Foods made from grains
Foods made from roots/ tubers
Foods made from
legumes
Meat/ fish/
shellfish/ poultry/
eggs Cheese/ yogurt
Vitamin A-rich fruits/ vege-tables1
Other fruits/ vege-tables
Other solid or semi-
solid food
Age 15-19 5.1 77.2 11.3 95.7 41.3 18.3 42.0 2.9 81.9 39.3 52.1 37.6 19.8 164 20-29 4.9 81.0 16.9 92.0 49.6 19.9 55.5 6.6 88.9 36.9 49.8 51.5 23.9 2,131 30-39 5.4 84.0 15.3 93.3 50.0 21.1 53.2 7.4 88.3 35.2 50.3 49.6 23.3 1,811 40-49 4.8 84.4 15.5 89.4 51.8 19.4 44.8 3.9 84.0 35.0 52.1 51.1 20.6 585
Residence Urban 9.4 84.7 24.9 92.4 48.3 31.0 73.7 15.4 94.0 41.6 47.5 56.3 33.1 1,134 Rural 3.7 81.7 13.1 92.3 50.2 16.8 46.1 3.6 85.9 34.3 51.3 48.3 19.9 3,557
District Aileu 5.4 92.7 23.0 81.6 54.6 21.5 37.7 9.3 93.1 31.2 31.6 45.5 13.2 168 Ainaro 4.4 90.9 6.3 84.8 57.9 23.1 26.3 4.8 96.5 34.4 65.2 46.0 7.7 266 Baucau 5.5 79.7 7.4 95.1 68.2 6.7 59.8 1.5 89.0 27.7 37.6 55.0 7.5 466 Bobonaro 3.2 64.7 24.7 92.4 35.4 23.7 49.8 4.8 86.5 31.7 60.6 18.3 23.4 458 Covalima 2.2 79.4 4.0 96.6 20.0 6.7 42.2 0.9 74.2 9.6 35.7 29.1 9.4 218 Dili 8.9 86.3 30.5 91.5 45.5 33.5 83.3 21.4 96.0 40.4 49.3 65.3 44.6 785 Ermera 1.6 88.2 16.0 92.1 60.6 13.2 35.1 3.0 78.6 28.5 29.7 66.0 32.6 585 Lautem 6.9 78.2 10.6 90.4 34.0 15.6 51.2 2.0 80.7 29.2 60.4 27.8 5.9 370 Liquiçá 4.1 85.8 17.9 96.6 76.3 41.9 56.0 7.9 96.6 46.3 80.3 80.7 51.5 271 Manatuto 7.1 89.4 10.1 92.2 64.9 25.1 67.2 8.0 95.1 69.5 83.7 67.1 50.3 211 Manufahi 14.8 89.9 11.5 97.5 83.6 10.2 80.0 2.0 98.5 44.9 39.1 0.6 6.4 186 Oecussi 2.6 84.7 9.1 93.6 14.5 22.5 38.3 0.9 72.8 31.3 84.7 64.5 7.8 391 Viqueque 2.1 71.3 11.3 93.1 54.0 8.2 33.1 1.3 92.6 58.0 7.7 44.0 9.0 318
Education No education 2.9 83.6 14.0 90.4 53.3 18.9 42.0 4.1 85.4 32.9 52.1 48.3 19.7 1,505 Primary 3.7 82.2 13.7 93.0 44.6 21.0 48.6 4.5 86.7 35.0 51.4 48.1 20.2 1,298 Secondary 7.3 82.5 18.1 93.3 49.6 21.0 62.6 8.2 90.2 39.5 48.5 53.0 27.0 1,769 More than secondary 16.8 69.8 32.5 93.2 62.6 17.8 89.1 30.5 96.7 37.6 43.8 57.7 40.1 118
Wealth quintile Lowest 1.9 81.7 11.8 90.8 49.0 16.2 37.5 1.9 82.0 31.5 56.1 43.8 13.3 1,001 Second 2.4 80.9 11.3 91.3 50.7 14.8 38.4 2.8 85.8 33.7 46.2 47.3 17.6 928 Middle 4.0 84.3 12.5 93.0 52.8 20.8 49.3 3.3 88.2 35.0 49.5 47.4 20.7 950 Fourth 6.7 81.6 16.2 92.4 46.5 21.7 60.3 8.0 89.9 37.8 52.4 49.7 27.0 900 Highest 11.1 83.7 28.5 94.2 49.6 28.1 80.5 16.7 93.9 43.0 47.3 63.8 38.1 912
Total 5.1 82.4 15.9 92.3 49.7 20.2 52.8 6.4 87.8 36.1 50.4 50.2 23.1 4,691
Note: Foods consumed in the last “24-hour” period (yesterday and last night).1 Includes pumpkin, squash, carrots, sweet potatoes, green leafy vegetables, mangoes, and papayas
made from legumes, and 88 percent of mothers eat vitamin A-rich fruits and vegetables. More than one in two (53 percent) mothers eat meat, fish, shellfish, poultry, and eggs, and 36 percent eat other fruits and vegetables. Smaller proportions of mothers consume cheese/yogurt or milk (6 percent and 5 percent, respectively), and 50 percent eat foods made with oil, fat, or butter. Eighty-two percent of mothers drink tea or coffee, and 23 percent eat sugary foods.
12.11 MICRONUTRIENT INTAKE AMONG MOTHERS
Micronutrient deficiencies are a result of inadequate intake of micronutrient-rich foods and the inadequate utilization of available micronutrients in the diet as a result of infections, parasitic infestations, and other factors. Measures of micronutrient fortification, micronutrient supplementation with iron and vitamin A, consumption of vitamin A-rich and iron-rich foods, and micronutrient status in terms of anemia and night blindness are discussed in this section.
A mother’s nutritional status during pregnancy is important both for the child’s intrauterine development and for protection against maternal morbidity and mortality. Night blindness is an indicator of severe vitamin A deficiency, and pregnant women are especially prone to experience it. This section discusses women’s micronutrient intake, both in terms of food and supplementation.
168 | Nutrition of Children and Women
Table 12.12 shows data on micronutrient intake among mothers of young children by background characteristics. More than nine in ten mothers (94 percent) consumed vitamin A-rich foods, and more than one-half (53 percent) consumed iron-rich foods in the 24 hours preceding the survey. Consumption of vitamin A-rich foods is higher among mothers residing in urban areas, more educated mothers, and those in the highest wealth quintile. Similarly, urban residence, education, and wealth are positively associated with consumption of iron-rich foods. Mothers living in urban areas are much more likely to consume iron-rich foods (74 percent) than mothers living in rural areas (46 per cent).
Women living in Manufahi and Dili are most likely to receive vitamin A-rich foods (99 percent each) compared with women living in Oecussi, who are least likely (84 percent). In addition, women in Dili are most likely to receive iron-rich foods (83 percent), and women in Ainaro are the least likely (26 percent).
Supplementation with vitamin A capsules (200,000 IU) for postpartum mothers through health care facilities and community volunteers is a strategy to reduce night blindness caused by vitamin A deficiency. Table 12.12 shows that 55 percent of women received vitamin A postpartum, an improvement from the 23 percent of women who received vitamin A postpartum reported in the 2003 DHS. Women 20-39 years of age are more likely to receive vitamin A postpartum. There is a marked urban-rural difference, with 61 percent of urban women receiving vitamin A, compared with 53 percent of women residing in the rural areas. Women with a higher level of education and those in the highest wealth quintile are also more likely to receive vitamin A postpartum. Vitamin A supplementation is highest in Covalima district (71 percent) and is lowest in Viqueque (37 percent).
Thirteen percent of mothers reported having difficulty seeing at night but, when this figure is adjusted to include only those mothers who had no difficulty seeing in the daytime, only 2 percent of mothers suffered from night blindness during their most recent pregnancy in the last five years. This is a decrease from the 13 percent of mothers reported with night blindness in the DHS 2003 survey. Night blindness during pregnancy is more prevalent among mothers in urban areas, mothers with higher education, and mothers in the poorest households. The prevalence of night blindness during pregnancy among districts in Timor-Leste is variable, with the highest prevalence in Lautem (7 percent) and lowest prevalence in Bobanaro (0.1 percent).
Besides improving food intake, supplementation is an important strategy for addressing the problem of micronutrient deficiency. Iron supplementation during pregnancy has been a key health initiative in Timor-Leste since 2003. According to the nutrition strategy, all pregnant women are supplied with iron-folic acid tablets free of charge. The iron-folic acid tablets are provided to all pregnant women from the beginning of the second trimester of pregnancy. Health staff are trained and equipped to provide iron tablets to pregnant and postnatal women at the facility and community levels (MOH, 2004c).
Presumably as a result of these existing program interventions, the proportion of women who took iron supplements during pregnancy has risen from 43 percent in 2003 to 61 percent in 2009-10. However, 37 percent of women did not take any iron supplements during their most recent pregnancy. Further, only 16 percent of women took the recommended dose of iron supplements for 90 days or more during their pregnancy.
Table 12.12 also shows that 13 percent of women received deworming medication during pregnancy, 31 percent received supplementary food while pregnant with their last birth, and 29 percent received supplementary food while breastfeeding their last-born child. Variations by background characteristics are similar to those discussed earlier.

Nut
ritio
n of
Chi
ldre
n an
d W
omen
| 1
69
Tab
le 1
2.12
Mic
ronu
trien
t int
ake
amon
g m
othe
rs
Amon
g w
omen
age
15-
49 w
ith a
chi
ld u
nder
age
3 li
ving
with
her
, the
per
cent
ages
who
con
sum
ed v
itam
in A
-ric
h an
d iro
n-ric
h fo
ods
in th
e 24
hou
rs p
rece
ding
the
surv
ey;
amon
g w
omen
age
15-
49 w
ith a
chi
ld b
orn
in th
e la
st 5
yea
rs, t
he
perc
enta
ge w
ho r
ecei
ved
a vi
tam
in A
dos
e in
the
firs
t tw
o m
onth
s af
ter
the
birth
of
the
last
chi
ld;
and
amon
g m
othe
rs a
ge 1
5-49
who
dur
ing
the
preg
nanc
y of
the
last
chi
ld b
orn
in t
he f
ive
year
s pr
ior
to t
he s
urve
y, t
he p
erce
nta g
e w
ho
suffe
red
from
nig
ht b
lindn
ess,
the
perc
enta
ge w
ho to
ok ir
on ta
blet
s or
syr
up fo
r spe
cific
num
bers
of d
ays,
the
perc
enta
ge w
ho to
ok d
ewor
min
g m
edic
atio
n, a
nd th
e pe
rcen
tage
of w
omen
who
rece
ived
sup
plem
enta
l foo
d du
ring
preg
nanc
y or
w
hile
bre
astfe
edin
g, b
y ba
ckgr
ound
cha
ract
erist
ics,
Tim
or-L
este
200
9-10
Back
grou
nd
char
acte
ristic
Amon
g w
omen
with
a c
hild
und
er
thre
e ye
ars
livin
g w
ith h
er
Amon
g w
omen
with
a c
hild
bor
n in
the
last
five
yea
rs
Perc
enta
ge
cons
umed
Vi
tam
in A
ric
h fo
ods1
Perc
enta
ge
cons
umed
iro
n-ric
h fo
ods2
Num
ber o
f w
omen
Perc
enta
ge
who
re
ceiv
ed
vita
min
A
dose
pos
t-pa
rtum
3
Perc
enta
ge w
ho
suffe
red
nigh
t blin
dnes
s du
ring
preg
nanc
y of
last
bi
rth
Num
ber o
f day
s w
omen
took
iron
tabl
ets
or s
yrup
du
ring
preg
nanc
y of
last
birt
h Pe
rcen
tage
of
wom
en w
ho to
ok
dew
orm
ing
med
icat
ion
durin
g pr
egna
ncy
of la
st b
irth5
Perc
enta
ge o
f w
omen
who
re
ceiv
ed
supp
lem
enta
ry
food
dur
ing
preg
nanc
y of
last
bi
rth
Perc
enta
ge o
f w
omen
who
re
ceiv
ed
supp
lem
enta
ry
food
whi
le b
reas
t-fe
edin
g af
ter l
ast
birth
N
umbe
r of
wom
en
Re
porte
d Ad
just
ed4
Non
e <
60
60-8
9 90
+
Don
’t kn
ow/
miss
ing
Age
15
-19
90.4
42.0
16
4 51
.715
.32.
339
.943
.24.
2 10
.81.
816
.634
.129
.917
8
20-2
9 94
.555
.5
2,13
1 56
.011
.81.
634
.241
.85.
2 17
.01.
712
.432
.429
.82,
438
30
-39
93.8
53.2
1,
811
55.5
14.5
2.2
36.1
39.4
5.0
17.5
2.0
14.0
30.2
28.3
2,40
1
40-4
9 91
.944
.8
585
50.4
13.4
2.4
44.5
35.2
5.9
12.0
2.3
13.1
29.4
28.8
998
Res
iden
ce
Urb
an
96.5
73.7
1,
134
60.6
12.2
2.5
23.6
50.6
8.0
15.5
2.3
6.7
12.2
11.6
1,48
4
Rura
l 92
.946
.1
3,55
7 52
.813
.61.
841
.236
.34.
3 16
.41.
815
.437
.234
.74,
531
Dis
tric
t
Ai
leu
94.6
37.7
16
8 66
.020
.81.
214
.960
.68.
0 14
.42.
28.
919
.821
.922
0
Aina
ro
97.7
26.3
26
6 52
.78.
20.
932
.058
.21.
5 7.
40.
92.
144
.137
.531
8
Bauc
au
94.6
59.8
46
6 64
.88.
61.
494
.13.
32.
1 0.
50.
09.
640
.024
.359
8
Bobo
naro
95
.249
.8
458
56.6
7.7
0.1
47.3
48.3
1.6
1.4
1.4
29.0
44.9
46.1
587
C
oval
ima
84.7
42.2
21
8 70
.57.
40.
736
.162
.20.
0 0.
61.
112
.037
.839
.632
2
Dili
98
.583
.3
785
61.9
10.0
2.2
15.1
52.3
10.5
19
.62.
53.
66.
34.
61,
043
Er
mer
a 90
.135
.1
585
40.4
8.2
0.3
52.2
4.9
3.5
39.4
0.1
23.9
39.9
38.6
719
La
utem
91
.551
.2
370
41.4
28.0
6.7
12.3
55.0
10.4
20
.91.
414
.111
.511
.744
4
Liqu
içá
98.3
56.0
27
1 65
.434
.73.
230
.448
.72.
6 11
.96.
420
.952
.036
.035
8
Man
atut
o 96
.967
.2
211
59.3
7.7
1.8
12.4
26.3
5.4
53.4
2.6
35.0
28.2
29.5
264
M
anuf
ahi
99.1
80.0
18
6 52
.513
.03.
553
.545
.50.
5 0.
20.
26.
442
.949
.023
8
Oec
ussi
83.5
38.3
39
1 49
.722
.92.
725
.759
.85.
1 3.
55.
98.
058
.466
.549
2
Viqu
eque
94
.633
.1
318
36.7
7.4
2.3
34.8
24.4
9.6
30.1
1.0
3.0
1.3
1.9
412
Edu
catio
n
N
o ed
ucat
ion
92.6
42.0
1,
505
45.8
14.1
1.7
46.4
33.7
3.9
13.8
2.2
14.3
34.1
32.2
1,98
0
Prim
ary
92.4
48.6
1,
298
54.6
14.9
2.0
35.0
41.7
5.9
15.6
1.9
14.7
33.5
31.3
1,65
6
Seco
ndar
y 95
.362
.6
1,76
9 61
.911
.62.
131
.242
.75.
9 18
.31.
811
.728
.026
.12,
226
M
ore
than
sec
onda
ry10
0.0
89.1
11
8 67
.19.
93.
716
.455
.15.
2 23
.30.
06.
98.
56.
315
4
Wea
lth q
uint
ile
Low
est
89.9
37.5
1,
001
41.8
14.9
2.5
44.8
38.4
5.3
8.9
2.6
8.7
34.5
32.8
1,22
6
Seco
nd
91.7
38.4
92
8 49
.913
.72.
146
.433
.43.
7 14
.51.
914
.435
.831
.81,
171
M
iddl
e 94
.749
.3
950
53.6
12.8
1.7
38.0
37.7
4.2
19.4
0.7
18.6
37.1
35.5
1,20
3
Four
th
96.2
60.3
90
0 61
.815
.61.
933
.840
.14.
2 19
.42.
616
.932
.729
.61,
170
H
ighe
st
96.9
80.5
91
2 66
.49.
61.
821
.849
.08.
5 18
.81.
88.
215
.915
.91,
244
To
tal
93.8
52.8
4,
691
54.7
13.3
2.0
36.9
39.8
5.2
16.2
1.9
13.3
31.0
29.0
6,01
5
1 Incl
udes
mea
t (an
d or
gan
mea
t), fi
sh, p
oultr
y, e
ggs,
pum
pkin
, squ
ash,
car
rots
, sw
eet p
otat
oes,
man
go, a
nd p
apay
a,
2 Incl
udes
mea
t (an
d or
gan
mea
t), fi
sh, p
oultr
y, e
ggs
3 In th
e fir
st tw
o m
onth
s af
ter d
eliv
ery
4 Wom
en w
ho re
porte
d ni
ght b
lindn
ess
but d
id n
ot re
port
diffi
culty
with
visi
on d
urin
g th
e da
y 5 D
ewor
min
g fo
r int
estin
al p
aras
ites
is co
mm
only
don
e fo
r hel
min
thes
and
for s
chist
osom
iasis
| 169Nutrition of Children and Women

170 | Nutrition of Children and Women
12.12 PREVALENCE OF ANEMIA IN WOMEN
The most common cause of anemia in developing countries is inadequate intake of iron, folate, vitamin B12, or other nutrients. Anemia can also result from sickle cell disease, malaria, and intestinal worm infestation. Anemia may be the underlying cause of maternal mortality, spontaneous abortion, premature birth, and low birth weight. Iron and folic acid supplementation and deworming among pregnant women are important measures for reducing anemia prevalence among vulnerable groups of women. Anemia is characterized by a low level of hemoglobin in the blood. The 2009-10 TLDHS measured hemoglobin levels to identify anemia in women.
Table 12.13 Prevalence of anemia in women
Percentage of women age 15-49 with anemia, by background characteristics, Timor-Leste 2009-10
Background characteristic
Anemia status by hemoglobin level
Number of women
Mild anemia Moderate anemia Severe anemia Any anemia Not pregnant 10.0-11.9 g/dl 7.0-9.9 g/dl <7.0 g/dl <12.0 g/dl Pregnant 10.0-10.9 g/dl 7.0-9.9 g/dl <7.0 g/dl <11.0 g/dl
Age 15-19 19.0 2.4 0.1 21.5 975 20-29 15.8 4.2 0.2 20.2 1,297 30-39 14.1 4.1 0.7 18.9 1,022 40-49 22.8 3.3 0.2 26.3 765
Number of children ever born 0 16.5 2.3 0.2 19.0 1,550 1 20.8 6.7 0.0 27.5 331 2-3 17.8 3.7 0.5 21.9 673 4-5 15.3 4.3 0.5 20.1 635 6+ 19.3 4.0 0.2 23.5 870
Maternity status Pregnant 17.7 9.8 0.3 27.8 307 Breastfeeding 20.0 4.7 0.4 25.1 935 Neither 16.6 2.5 0.2 19.4 2,817
Using IUD Yes 19.7 7.1 0.0 26.8 28 No 17.4 3.6 0.3 21.3 4,031
Smoking status Smokes cigarettes/tobacco 18.2 7.6 0.9 26.8 194 Does not smoke 17.4 3.4 0.3 21.0 3,865
Residence Urban 14.7 4.4 0.1 19.1 1,004 Rural 18.4 3.3 0.3 22.0 3,055
District Aileu 24.1 3.5 0.0 27.5 183 Ainaro 9.1 1.0 0.0 10.1 207 Baucau 16.3 1.0 0.0 17.3 424 Bobonaro 18.8 6.8 0.0 25.6 376 Covalima 19.1 5.7 0.6 25.4 241 Dili 12.5 4.2 0.0 16.7 706 Ermera 19.4 1.7 0.3 21.4 494 Lautem 21.9 3.0 0.5 25.5 289 Liquiçá 15.8 4.6 0.3 20.7 247 Manatuto 29.2 3.5 0.0 32.6 196 Manufahi 9.5 2.5 0.8 12.8 137 Oecussi 16.6 5.2 0.7 22.5 288 Viqueque 20.4 3.7 1.2 25.2 271
Education No education 19.8 3.9 0.5 24.1 1,210 Primary 15.5 4.2 0.2 19.9 953 Secondary 17.3 3.1 0.2 20.6 1,768 More than secondary 12.5 3.1 0.0 15.6 128
Wealth quintile Lowest 18.3 3.5 0.5 22.3 755 Second 18.4 3.3 0.3 22.0 776 Middle 18.4 2.9 0.2 21.5 801 Fourth 17.4 3.2 0.3 21.0 831 Highest 15.1 4.8 0.1 20.0 896
Total 17.5 3.6 0.3 21.3 4,059
Note: Prevalence is adjusted for altitude and for smoking status if known using CDC formulas (CDC, 1998).

Nutrition of Children and Women | 171
Iron deficiency anemia is one of the most common nutritional problems in Timor-Leste. Table 12.13 indicates that three in ten pregnant women (28 percent) are anemic. To address the problem of anemia in women, iron-folic acid supplementation was introduced as part of the Ministry of Health programming, covering all 13 districts. The program involved distributing iron-folic acid supplements to pregnant women through health facilities and SISCa.
Table 12.13 shows that overall 21 percent of Timorese women age 15-49 are anemic, with 18 percent mildly anemic, 4 percent moderately anemic, and less than 1 percent severely anemic4. However, pregnant women are more likely to be anemic than women who are neither pregnant nor breastfeeding (28 percent and 19 percent, respectively).
Anemia is higher among rural than urban women (22 percent versus 19 percent). Anemia ranges from 10 percent in Ainaro to 33 percent in Manatuto. There is a higher prevalence of anemia in women with no education and in those in the lowest wealth quintile. Women using IUDs are more likely to be anemic (27 percent) than women who do not use IUDs.
4 The level of anemia in women reported in the 2003 DHS cannot be compared with the 2009-10 TLDHS data as no adjustment for smoking was made in the 2003 DHS.


Malaria | 173
MALARIA 13
Malaria remains a leading public health problem in Timor-Leste. Most of the estimated one million population in the country is at high risk of malaria, with about 80 percent of the cases reported from just 4 of the 13 districts—Dili, Viqueque, Covalima and Lautem (WHO SEAR, 2010). The number of confirmed cases has risen from 15,212 in 2000 to 45,973 in 2008. Slide positivity increased from 44 percent to 50 percent between 2002 and 2008, and the percentage attributed to Plasmodium falciparum increased from 53 percent to 73 percent over the same period (WHO SEAR, 2010). This increase may be due to an actual increase in malaria or to the strengthening of diagnostic facilities and improved monitoring and evaluation. The Ministry of Health (MOH) estimates between 100,000 and 200,000 cases of suspected malaria are reported each year in public health facilities, representing 12 percent of outpatient attendance. Of this figure, about 40,000 are children under age 5. Malaria also accounts for about four percent of hospital admissions (MOH, 2003).
The existing climatic conditions in Timor-Leste are conducive to the spread of mosquitoes and the perennial transmission of malaria. The number of reported cases peak during the post-wet season of November to May (Cooper, et al., 2010). Still, a relatively large number of cases are recorded throughout the rest of the year. However, because there is relative variation in the topography of the country, the intensity of transmission varies with altitude, and endemicity is reduced in the higher altitudes (WHO SEAR, 2010).
Timor-Leste’s efforts to control malaria date back to the pre-independence era when various strategies were employed at different times. In 1999, the country adopted the Roll Back Malaria initiative and has since been implementing a combination of curative and preventive interventions. The National Malaria Control Strategy focuses on early case management and delivery of effective antimalarial therapies, universal access to long-lasting insecticidal nets (LLINs), selective use of indoor residual spraying (IRS), and promotion of behavioral change and communication (BCC).
Since 2003, the Global Fund to fight AIDS, Tuberculosis and Malaria (GFATM) has substantially funded malaria control programs in Timor-Leste (Martins et al., 2009). The NMS supports the recommendation of WHO’s Roll Back Malaria (RBM) strategy, and in aiming to achieve the Millennium Development Goals (MDGs), has modified its LLIN distribution program accordingly, to ensure that there is one LLIN for every two persons considered to be at risk of malaria (95 percent of the population), thereby providing universal access to LLIN coverage. This is a shift from the earlier strategy of approximately two nets per household targeted for distribution to households with children under age 5 and pregnant women, the two most vulnerable groups, and therefore of primary focus (MOH, 2003). LLINs are distributed to pregnant women through antenatal clinics in public health facilities. It is reported that approximately 60 percent of the population is covered under the country’s bed net program (WHO SEAR, 2010).
Case management of malaria is done at hospitals, community health centers (CHCs), and health posts (HPs) and also during visits to mobile clinics. Since 2007, the antimalaria drug policy has shifted its focus and adopted artemether-lumefantrine, an artemisinin-based combination therapy (ACT), as the drug of choice for the treatment of uncomplicated P. falciparum malaria across the country. This is because of the emergence of chloroquine and sulfadoxine-pyramethamine-resistant strains of the parasite. Health care providers in both the public and private sectors were trained in the new protocol for the treatment of malaria, which stipulated that the provision of ACT must be based on the results of a laboratory examination (microscopy), or a Rapid Diagnostic Test (RDT), where microscopy was not available. Chloroquine continues to be the drug of choice for the treatment of P. vivax, the second, but less common, malaria parasite in Timor-Leste.

174 | Malaria
13.1 MOSQUITO NETS
13.1.1 Ownership of Mosquito Nets
A simple and relatively inexpensive way to control malaria is through the use of bed nets, which effectively breaks the host-vector link by creating a physical barrier between humans and the female Anopheles mosquito, which feeds primarily at night. Treating bed nets with an insecticide that leaves a residual effect has the added advantage of repelling and/or killing the mosquitoes. This leads to a reduction in the vector population and, eventually, to the termination of their ability to transmit malaria. The Timor-Leste health service therefore promotes the ownership and use of insecticide-treated mosquito nets, particularly factory-treated LLINs, as one of the primary interventions for reducing malaria transmission and morbidity in the country. The two types of LLINs promoted by the MOH are Olyset and Permanet, which require re-treatment after about four years or 20 washes, in contrast with the standard insecticide-treated nets (ITNs) that need to be re-treated every six months, or after three washes.
Table 13.1 shows the percentage of households with at least one and more than one mosquito net (treated or untreated), ever-treated net, and ITN, by background characteristics. The data show that 45 percent of households in Timor-Leste own at least one mosquito net, whether treated or untreated, 44 percent own at least one ever-treated net, and 41 percent of households own at least one ITN. More than one in three households own more than one of any type of net. Urban households are more likely to own at least one ITN than rural households. Households belonging to the fourth and fifth wealth quintiles are more likely to have at least one ITN compared with those in the lower wealth quintiles. Households in Covalima (62 percent) are most likely to have at least one ITN compared with all other districts. Ownership of ITNs is particularly low in Ainaro, Baucau, Ermera, and Manufahi, probably due to their higher altitude and reduced risk of mosquito exposure.
Table 13.1 Ownership of mosquito nets
Percentage of households with at least one and more than one mosquito net (treated or untreated), ever treated mosquito net, and insecticide-treated net (ITN), and the average number of nets per household, by background characteristics, Timor-Leste 2009-10
Background characteristic
Any type of mosquito net Ever-treated mosquito net1 Insecticide-treated mosquito net
(ITNs)2
Number of households
Percentage with at least
one
Percentage with more than one
Average number of nets per
household
Percentage with at least
one
Percentage with more than one
Average number of
ever treated nets per
household
Percentage with at least
one
Percentage with more than one
Average number of ITNs per
household
Residence Urban 60.6 43.5 1.3 55.8 37.9 1.1 51.0 34.0 1.0 2,695 Rural 40.8 26.7 0.8 39.9 26.0 0.8 37.7 24.1 0.7 8,768
District Aileu 52.5 37.4 1.1 51.9 36.7 1.1 51.8 36.6 1.0 445 Ainaro 20.8 10.3 0.3 16.1 8.1 0.3 15.5 7.9 0.3 674 Baucau 24.9 16.6 0.5 24.8 16.6 0.5 22.5 15.0 0.4 1,338 Bobonaro 48.8 33.9 1.0 45.3 29.9 0.9 41.6 26.6 0.8 1,097 Covalima 66.5 52.4 1.4 65.5 51.2 1.4 62.4 47.7 1.3 684 Dili 61.2 43.9 1.3 55.8 37.6 1.1 51.4 34.1 1.0 1,911 Ermera 26.8 14.9 0.5 26.7 14.9 0.5 26.7 14.9 0.5 1,253 Lautem 54.3 32.8 1.0 54.3 32.8 1.0 53.4 31.8 1.0 751 Liquiçá 41.2 23.3 0.8 40.2 22.6 0.7 38.0 20.9 0.7 640 Manatutu 61.9 48.5 1.4 61.8 48.4 1.4 54.7 40.7 1.2 490 Manufahi 27.9 18.3 0.5 27.3 17.5 0.5 23.3 15.0 0.4 495 Oecussi 58.6 34.4 1.1 57.0 33.1 1.0 54.3 30.5 0.9 817 Viqueque 47.9 33.4 1.0 47.9 33.4 1.0 43.3 29.9 0.9 869
Wealth quintile Lowest 25.1 12.4 0.4 24.6 12.2 0.4 23.6 11.6 0.4 2,432 Second 33.7 19.2 0.6 32.8 18.6 0.6 31.2 17.3 0.5 2,354 Middle 44.6 28.8 0.8 43.5 27.6 0.8 41.2 26.1 0.8 2,254 Fourth 60.9 43.4 1.3 58.9 41.2 1.2 55.5 38.1 1.1 2,187 Highest 65.7 52.0 1.5 60.9 46.7 1.4 55.2 41.0 1.2 2,235
Total 45.4 30.6 0.9 43.6 28.8 0.9 40.9 26.4 0.8 11,463
1 An ever-treated net is (1) a factory net that does not require any further treatment or (2) any pretreated net.2 An insecticide treated net (ITN) is (1) a factory treated net that does not require any further treatment or (2) a pretreated net obtained within the past 12 months.

Malaria | 175
13.1.2 Use of Mosquito Nets by Children
Age is an important factor in determining levels of acquired immunity against malaria. For the first six months of life, antibodies acquired from the mother during pregnancy protect children from malaria. Upon weaning, this immunity is gradually lost, and children start developing their own immunity over a period of time. Unlike immunity for some other infectious diseases, immunity against malaria is not permanent, and protection from infection requires the regular use of protective interventions. ITNs confer some protection if used regularly.
In the 2009-10 TLDHS, respondents to the Household Questionnaire were asked about the use of mosquito nets by all members of the household the night before the interview. Table 13.2 presents information on the use of mosquito nets by children under age 5 in all households, and in households with an ITN, by background characteristics. The results show that 45 percent of children under age 5 in all households slept under a treated or untreated mosquito net the night before the survey, and 41 percent slept under an ITN. In households that own at least one ITN, more than four in five children (83 percent) slept under an ITN.
Table 13.2 Use of mosquito nets by children
Among children under five years of age in all households, the percentages of children under five years of age who slept the night before the survey under a mosquito net (treated or untreated), under an ever-treated mosquito net, and under an insecticide-treated net (ITN), and among children under five years of age in households with at least one ITN, the percentage who slept the night before the survey under an ITN, by background characteristics, Timor-Leste 2009-10
Background characteristic
Children under age 5 in all households Children under age 5
in households with an ITN2
Percentage who slept under any
net last night
Percentage who slept under an
ever- treated net last night1
Percentage who slept under an ITN last night2
Number of children
Percentage who slept under an ITN last night2
Number of children
Age (in years) <1 47.3 45.6 43.5 2,037 86.8 1,021 1 47.3 45.4 43.5 1,871 85.4 952 2 44.3 42.5 39.4 2,135 82.0 1,028 3 43.8 42.4 41.0 2,140 82.4 1,065 4 42.0 40.0 37.9 1,913 78.5 925
Sex Male 44.4 42.7 40.7 5,112 82.4 2,526 Female 45.4 43.6 41.4 4,985 83.7 2,465
Residence Urban 60.0 54.9 50.6 2,329 83.6 1,410 Rural 40.4 39.6 38.2 7,768 82.8 3,581
District Aileu 56.3 56.0 56.0 367 86.7 237 Ainaro 22.6 18.2 18.1 596 81.9 132 Baucau 29.9 29.9 28.8 1,055 90.9 334 Bobonaro 48.1 44.8 42.9 972 87.1 478 Covalima 65.3 63.8 61.4 474 89.0 327 Dili 62.4 56.5 52.3 1,606 84.0 999 Ermera 28.3 28.2 28.2 1,287 81.7 444 Lautem 49.0 49.0 47.5 792 75.0 501 Liquiçá 43.5 43.2 40.8 584 86.2 276 Manatutu 59.6 59.5 56.0 462 89.5 289 Manufahi 28.3 28.0 24.6 389 86.9 110 Oecussi 49.1 47.5 44.9 791 74.3 479 Viqueque 44.3 44.3 40.5 721 76.1 384
Wealth quintile Lowest 25.0 24.7 23.6 2,170 72.6 706 Second 34.3 33.4 32.6 2,020 84.0 784 Middle 44.0 43.1 41.8 2,049 85.2 1,005 Fourth 59.3 57.4 54.7 1,965 84.6 1,272 Highest 65.2 59.9 54.9 1,892 85.0 1,224
Total 44.9 43.1 41.0 10,096 83.0 4,991
1 An ever-treated net is (1) a factory net that does not require any further treatment or (2) any pretreated net. 2 An insecticide-treated net (ITN) is (1) a factory-treated net that does not require any further treatment or (2) a pretreated net obtained within the past 12 months.

176 | Malaria
Among children under age 5, those less than 1 year of age are most likely to have slept under any net (47 percent), an ever-treated net (46 percent), or an ITN (44 percent) the night before the survey. Children in rural areas are less likely than those in urban areas to have slept under any net, an ever-treated net, or an ITN. The proportion of children who slept under any type of mosquito net is highest in Covalima (65 percent) and lowest in Ainaro (23 percent). The proportion of children who slept under a mosquito net generally increases with increasing wealth quintile; thus while 25 percent of children in the lowest wealth quintile slept under a net the night before the survey, about two and a half times more children in the highest wealth quintile (65 percent) slept under a net. Similar variations were observed among households with an ITN.
13.1.3 Use of Mosquito Nets by Women
Pregnant women are one of the groups most vulnerable to malaria. The disease adversely affects birth outcomes and can lead to spontaneous abortions, pre-term labor, low birthweight babies, and stillbirths. This has prompted many advocacy campaigns to educate not only pregnant women, but also the general public on the importance of preventing malaria during pregnancy. In Timor-Leste, the key malaria preventive method employed during pregnancy is the use of ITNs. As with children under age 5, pregnant women in Timor-Leste have been targeted for bed net distribution over the past five years, and those who slept under an ITN the night before the survey are considered regular users of an ITN.
Table 13.3 Use of mosquito nets by women
Among all women age 15-49 in all households, the percentages who slept the night before the survey under a mosquito net (treated or untreated), under an ever-treated mosquito net, and under an insecticide-treated net (ITN), and among all women age 15-49 in households with at least one ITN, the percentage who slept the night before the survey under an ITN, by background characteristics, Timor-Leste 2009-10
Background characteristic
Women age 15-49 in all households Women age 15-49 in households with ITN2
Percentage who:
Number of women
Slept under any net last
night
Slept under an ever-treated
net last night1Slept under an ITN last night2
Percentage who slept
under an ITN last night2
Number of women
Residence Urban 51.1 45.7 41.4 3,628 78.3 1,917 Rural 34.5 33.7 31.7 10,228 77.0 4,214
District Aileu 45.2 44.8 44.8 584 79.1 331 Ainaro 19.4 14.8 14.5 653 78.0 121 Baucau 21.8 21.8 20.7 1,485 75.7 406 Bobonaro 44.5 40.4 37.0 1,331 82.9 595 Covalima 58.2 56.7 53.2 824 82.9 529 Dili 51.0 45.3 41.5 2,601 79.5 1,357 Ermera 21.4 21.3 21.3 1,626 71.9 482 Lautem 39.9 39.9 38.1 912 69.6 499 Liquiçá 33.6 32.9 30.4 844 75.0 342 Manatutu 55.7 55.4 48.2 636 85.6 358 Manufahi 25.3 24.8 21.9 496 77.4 141 Oecussi 45.9 43.8 41.0 932 71.1 537 Viqueque 39.4 39.4 34.6 930 74.6 432
Education No education 27.9 26.7 25.3 4,106 75.1 1,383 Primary 41.3 40.2 37.8 3,163 80.3 1,489 Secondary 44.1 41.5 38.1 6,130 76.9 3,042 More than secondary 49.4 43.0 37.7 455 79.0 217
Wealth quintile Lowest 20.5 20.1 19.0 2,438 71.5 649 Second 27.7 26.9 25.8 2,589 75.8 881 Middle 35.1 34.1 32.6 2,754 76.5 1,172 Fourth 49.5 47.7 44.5 2,864 79.2 1,611 Highest 55.6 50.2 44.9 3,210 79.2 1,818
Total 38.9 36.8 34.2 13,856 77.4 6,131
Note: Total for women in all households includes 2 women with information missing on education. 1 An ever-treated net is (1) a factory net that does not require any further treatment or (2) any pretreated net. 2 An insecticide treated net (ITN) is (1) a factory treated net that does not require any further treatment or (2) a pretreated net obtained within the past 12 months.
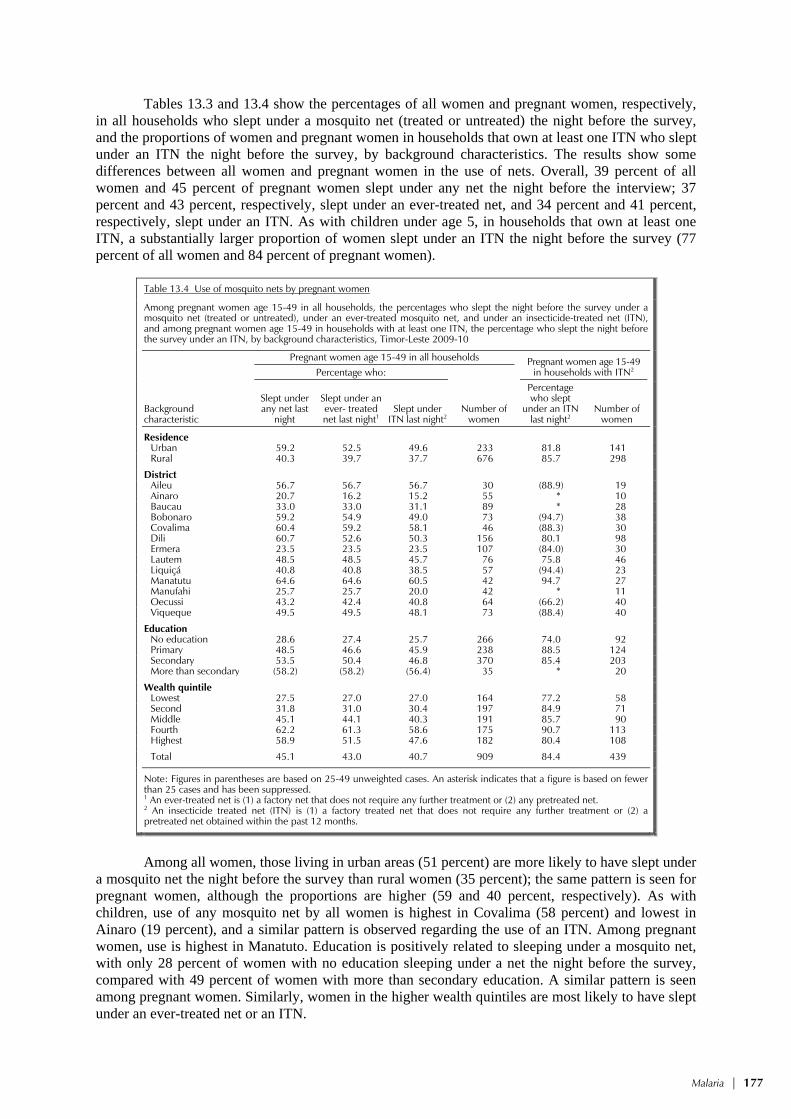
Malaria | 177
Tables 13.3 and 13.4 show the percentages of all women and pregnant women, respectively, in all households who slept under a mosquito net (treated or untreated) the night before the survey, and the proportions of women and pregnant women in households that own at least one ITN who slept under an ITN the night before the survey, by background characteristics. The results show some differences between all women and pregnant women in the use of nets. Overall, 39 percent of all women and 45 percent of pregnant women slept under any net the night before the interview; 37 percent and 43 percent, respectively, slept under an ever-treated net, and 34 percent and 41 percent, respectively, slept under an ITN. As with children under age 5, in households that own at least one ITN, a substantially larger proportion of women slept under an ITN the night before the survey (77 percent of all women and 84 percent of pregnant women).
Table 13.4 Use of mosquito nets by pregnant women
Among pregnant women age 15-49 in all households, the percentages who slept the night before the survey under a mosquito net (treated or untreated), under an ever-treated mosquito net, and under an insecticide-treated net (ITN), and among pregnant women age 15-49 in households with at least one ITN, the percentage who slept the night before the survey under an ITN, by background characteristics, Timor-Leste 2009-10
Background characteristic
Pregnant women age 15-49 in all households Pregnant women age 15-49 in households with ITN2 Percentage who:
Number of women
Slept under any net last
night
Slept under an ever- treated net last night1
Slept under ITN last night2
Percentage who slept
under an ITN last night2
Number of women
Residence Urban 59.2 52.5 49.6 233 81.8 141 Rural 40.3 39.7 37.7 676 85.7 298
District Aileu 56.7 56.7 56.7 30 (88.9) 19 Ainaro 20.7 16.2 15.2 55 * 10 Baucau 33.0 33.0 31.1 89 * 28 Bobonaro 59.2 54.9 49.0 73 (94.7) 38 Covalima 60.4 59.2 58.1 46 (88.3) 30 Dili 60.7 52.6 50.3 156 80.1 98 Ermera 23.5 23.5 23.5 107 (84.0) 30 Lautem 48.5 48.5 45.7 76 75.8 46 Liquiçá 40.8 40.8 38.5 57 (94.4) 23 Manatutu 64.6 64.6 60.5 42 94.7 27 Manufahi 25.7 25.7 20.0 42 * 11 Oecussi 43.2 42.4 40.8 64 (66.2) 40 Viqueque 49.5 49.5 48.1 73 (88.4) 40
Education No education 28.6 27.4 25.7 266 74.0 92 Primary 48.5 46.6 45.9 238 88.5 124 Secondary 53.5 50.4 46.8 370 85.4 203 More than secondary (58.2) (58.2) (56.4) 35 * 20
Wealth quintile Lowest 27.5 27.0 27.0 164 77.2 58 Second 31.8 31.0 30.4 197 84.9 71 Middle 45.1 44.1 40.3 191 85.7 90 Fourth 62.2 61.3 58.6 175 90.7 113 Highest 58.9 51.5 47.6 182 80.4 108
Total 45.1 43.0 40.7 909 84.4 439
Note: Figures in parentheses are based on 25-49 unweighted cases. An asterisk indicates that a figure is based on fewer than 25 cases and has been suppressed. 1 An ever-treated net is (1) a factory net that does not require any further treatment or (2) any pretreated net. 2 An insecticide treated net (ITN) is (1) a factory treated net that does not require any further treatment or (2) a pretreated net obtained within the past 12 months.
Among all women, those living in urban areas (51 percent) are more likely to have slept under
a mosquito net the night before the survey than rural women (35 percent); the same pattern is seen for pregnant women, although the proportions are higher (59 and 40 percent, respectively). As with children, use of any mosquito net by all women is highest in Covalima (58 percent) and lowest in Ainaro (19 percent), and a similar pattern is observed regarding the use of an ITN. Among pregnant women, use is highest in Manatuto. Education is positively related to sleeping under a mosquito net, with only 28 percent of women with no education sleeping under a net the night before the survey, compared with 49 percent of women with more than secondary education. A similar pattern is seen among pregnant women. Similarly, women in the higher wealth quintiles are most likely to have slept under an ever-treated net or an ITN.

178 | Malaria
13.1.4 Prevalence and Management of Childhood Malaria
A common manifestation of malaria is fever, and the presence of fever is used as an entry point to assess and classify a sick child’s condition. In the 2009-10 TLDHS, mothers were asked whether their children under age 5 had a fever in the two weeks preceding the survey. Although fever can occur year-round, malaria is more prevalent during the end of the rainy season. The fieldwork for the TLDHS spanned the six months from mid-August 2009 to early February 2010 and did not fully encompass the peak season for malaria transmission of November to May. Such temporal factors should be taken into account when interpreting the occurrence of fever as an indicator of malaria prevalence. If a fever was reported, the mother was asked whether treatment was sought at a health facility and whether the child was given any medication and, if so, how soon the medication was taken after the onset of fever.
Table 13.5 shows the percentage of children under age 5 with fever in the two weeks preceding the survey, and among children with fever, the percentage who received antimalarial drugs and the percentage who took antimalarial drugs the same day or the next, by background characteristics. One in five children under age 5 (19 percent) had a fever in the two weeks preceding the survey. Of these, 6 percent received an antimalarial drug. Only 2 percent of children received anti-malarial drugs the same day or the next day after the onset of fever.
Table 13.5 Prevalence and prompt treatment of fever
Percentage of children under age 5 with fever in the two weeks preceding the survey, and among children with fever, the percentage who took antimalarial drugs and the percentage who took the drugs the same or next day following the onset of fever, by background characteristics, Timor-Leste 2009-10
Background characteristic
Among children under age 5: Among children under age 5 with fever:
Percentage with fever in the two weeks preceding
the survey Number of
children
Percentage who took antimalarial
drugs
Percentage who took antimalarial
drugs same or next day
Number of children
Age (in months) <12 21.1 1,925 4.0 1.1 407 12-23 23.4 1,752 6.9 2.4 410 24-35 21.3 1,959 6.4 3.3 417 36-47 17.6 1,947 5.8 3.5 342 48-59 12.3 1,745 5.3 1.0 214
Residence Urban 24.1 2,269 5.2 1.9 546 Rural 17.6 7,059 5.9 2.6 1,243
District Aileu 14.9 340 24.2 9.5 51 Ainaro 4.9 536 (5.9) (5.9) 26 Baucau 14.9 941 1.1 0.0 140 Bobonaro 26.4 884 1.4 1.4 234 Covalima 20.0 426 8.5 5.3 85 Dili 24.6 1,597 5.1 1.5 392 Ermera 12.7 1,172 15.2 6.5 149 Lautem 29.6 719 1.7 0.0 213 Liquiçá 33.8 550 7.7 4.5 186 Manatutu 19.3 416 1.4 0.7 80 Manufahi 11.3 369 5.8 0.0 42 Oecussi 20.6 734 1.9 0.6 151 Viqueque 6.3 644 (21.9) (6.1) 41
Mother’s education No education 17.7 3,122 7.7 3.5 552 Primary 20.6 2,611 3.7 1.6 539 Secondary 19.2 3,381 5.2 1.7 648 More than secondary 23.7 214 (10.9) (6.9) 51
Wealth quintile Lowest 16.1 1,973 5.1 1.7 317 Second 16.9 1,834 4.7 1.3 310 Middle 18.6 1,875 5.6 2.8 348 Fourth 22.6 1,819 6.9 2.1 410 Highest 22.1 1,827 5.9 3.6 404
Total 19.2 9,328 5.7 2.4 1,790
Note: Figures in parentheses are based on 25-49 unweighted cases.

Malaria | 179
The highest prevalence of fever is reported among children age 12-23 months (23 percent). Fever is least common among children age 48-59 months (12 percent).The proportion of children with fever differs by urban-rural residence, with 24 percent of urban children having fever in the two weeks before the survey as opposed to 18 percent in the rural areas. Liquiçá reported the highest proportions of children with fever (34 percent), while Ainaro had the lowest proportion (5 percent).
Children older than 12 months are most likely to be given antimalarial drugs for the treatment of fever and to receive the drugs the same or the next day. There is hardly any urban-rural variation in getting antimalarial drugs. Children of mothers with no education are more likely to receive anti-malarial drugs (8 percent) than children of mothers with primary and secondary education.
Table 13.6 presents information on the type and timing of antimalarial drugs given to children under age 5 who had fever in the two weeks preceding the survey, by background characteristics. Fansidar is the most common antimalarial drug given to children with fever (3 percent), followed by chloroquine (2 percent), and quinine (1 percent). The very low percentage of children with fever treated with antimalarial drugs can be attributed to the revised protocol put in place since 2007 that advocates treatment for malaria upon confirmation by microscopy testing or Rapid Diagnostic Tests (RDTs). As discussed in Chapter 11, the majority of children with fever are prescribed paracetemol or antibiotics in the absence of the availability of RDTs or while waiting for the laboratory results
Table 13.6 Type and timing of antimalarial drugs
Among children under age 5 with fever in the two weeks preceding the survey, percentage who took specific antimalarial drugs and percentage who took each type of drug the same or next day after developing the fever, by background characteristics, Timor-Leste 2009-10
Background characteristic
Percentage of children who took drug: Percentage of children who took drug the same or
next day: Number of
children with fever
SP/ Fansidar
Chloro-quine Quinine ACT
Other anti-
malarial SP/
Fansidar Chloro-quine Quinine ACT
Other anti-
malarial
Age (in months) <12 2.3 1.4 0.9 0.6 0.8 0.9 0.4 0.2 0.0 0.4 407 12-23 3.7 1.5 1.1 0.1 0.5 2.2 0.0 0.2 0.0 0.0 410 24-35 3.1 1.2 2.2 0.2 0.7 1.1 0.9 0.5 0.2 0.7 417 36-47 2.0 2.7 1.1 0.2 0.2 1.7 1.2 0.9 0.0 0.2 342 48-59 2.2 1.8 1.3 0.7 0.0 0.2 0.8 0.0 0.0 0.0 214
Residence Urban 2.8 1.5 0.2 0.1 0.7 1.3 0.4 0.0 0.0 0.4 546 Rural 2.7 1.7 1.8 0.5 0.4 1.3 0.7 0.6 0.1 0.2 1,243
District Aileu 21.0 0.0 2.1 2.1 1.0 9.5 0.0 0.0 0.0 0.0 51 Ainaro (0.0) (3.0) (0.0) (0.0) (3.0) (0.0) (3.0) (0.0) (0.0) (3.0) 26 Baucau 1.1 0.0 0.0 0.0 0.0 0.0 0.0 0.0 0.0 0.0 140 Bobonaro 0.8 0.8 0.0 0.0 0.0 0.8 0.8 0.0 0.0 0.0 234 Covalima 0.0 8.5 0.0 0.0 0.0 0.0 5.3 0.0 0.0 0.0 85 Dili 2.6 1.5 0.0 0.0 1.0 1.0 0.0 0.0 0.0 0.5 392 Ermera 11.4 1.0 8.4 1.0 1.0 6.5 1.0 1.0 0.0 1.0 149 Lautem 0.3 1.4 0.0 0.0 0.0 0.0 0.0 0.0 0.0 0.0 213 Liquiçá 1.6 0.4 4.9 0.8 0.0 1.2 0.4 2.9 0.0 0.0 186 Manatutu 0.0 0.7 0.0 0.0 0.7 0.0 0.0 0.0 0.0 0.7 80 Manufahi 3.0 0.0 2.8 0.0 0.0 0.0 0.0 0.0 0.0 0.0 42 Oecussi 1.3 0.6 0.0 0.0 0.0 0.6 0.0 0.0 0.0 0.0 151 Viqueque (2.5) (17.0) (0.0) (5.0) (2.5) (0.0) (3.6) (0.0) (2.5) (0.0) 41
Mother’s education No education 3.8 0.8 3.3 0.6 0.8 2.2 0.5 1.0 0.0 0.3 552 Primary 1.8 1.1 0.3 0.4 0.3 0.7 0.6 0.0 0.0 0.2 539 Secondary 2.5 2.7 0.6 0.2 0.0 1.2 0.5 0.2 0.2 0.0 648 More than secondary (4.0) (2.9) (0.0) (0.0) (4.0) (0.0) (2.9) (0.0) (0.0) (4.0) 51
Wealth quintile Lowest 1.3 2.2 1.4 0.3 0.5 0.3 0.2 1.0 0.0 0.2 317 Second 1.9 0.7 1.7 0.3 0.0 0.2 0.7 0.0 0.3 0.0 310 Middle 3.5 1.3 1.0 0.8 0.4 2.3 0.4 0.0 0.0 0.2 348 Fourth 3.0 1.8 1.8 0.4 0.9 1.1 0.4 0.6 0.0 0.4 410 Highest 3.6 2.2 0.8 0.0 0.5 2.3 1.2 0.4 0.0 0.5 404
Total 2.7 1.7 1.3 0.3 0.5 1.3 0.6 0.4 0.1 0.3 1,790
Note: Figures in parentheses are based on 25-49 unweighted cases.
180 | Malaria
to arrive. The revised protocol for the treatment of malaria can also explain the large difference between results obtained in the 2003 DHS on treatment of fever among children under age 5 with antimalarials and the 2009-10 TLDHS.
Because of the need to treat malaria quickly, it can be useful for parents to have antimalarial drugs at home. The 2009-10 TLDHS findings show that antimalarial drugs were at home when the child became ill in about 46 percent of cases (data not shown).

HIV/AIDS-Related Knowledge, Attitudes, and Behavior | 181
HIV/AIDS-RELATED KNOWLEDGE, ATTITUDES, AND BEHAVIOR 14
Acquired Immune Deficiency Syndrome (AIDS) was first recognized internationally in 1981. According to the Joint United Nations Program on AIDS (UNAIDS), the number of people living with the human immunodeficiency virus (HIV) continued to grow, and it is estimated that in 2008 33.4 million people worldwide were living with HIV, with a threefold increase in prevalence since 1990 (UNAIDS and WHO, 2009). Timor-Leste was free of HIV during most of the time when the developed countries were compiling measures to fight the epidemic. However, as contact with the outside world increases, cases of HIV have been on the rise, although no information to date is available on the prevalence for the country as a whole. According to the Ministry of Health the first reported case of HIV in Timor-Leste was in 2003. Between then and December 2009, there have been 151 cases of HIV reported in the country (DRTL, 2010). Forty-eight percent of HIV-positive cases in the past 12 months were reported among men and 52 percent among women (DRTL, 2010). In addition, 8 percent of HIV-positive cases were among children under age 5.
Epidemiological studies have identified sexual intercourse, intravenous injections, blood transfusions, and fetal transmission from infected mothers as the main routes of transmission of HIV. Integrated bio-behavioral surveys (IBBS) conducted on a regular basis since 2009 among the most at-risk populations, such as female sex workers (FSWs), injecting drug users (IDUs), men having sex with men (MSM), the Policia Nacional de Timor-Leste (PNTL), Falintil-Forças de Defesa de Timor-Leste (F-FDTL) and clients of FSWs, in selected geographical areas of Timor-Leste, indicate a low-level epidemic concentrated in high-risk groups (DRTL, 2010).
To address the challenges posed by HIV, the government of Timor-Leste has identified clear strategic directions under its National HIV/AIDS/STI Strategic Plan for 2006-2010 (MOH, 2006). The National HIV/AIDS/STI Strategic Plan outlines the following principles:
• A strategy based on respect for human rights
• A strategy that is participatory and multi-sectoral
• A strategy that is built on partnership and that draws upon the strengths of government, nongovernment, private-sector, and faith-based organizations and that includes the involvement of HIV-positive people
• A strategy that is evidence-driven but encourages creativity
• A strategy that is consistent with the principles underlying the development of Timor-Leste
• A strategy that is multifaceted, drawing on the underlying tenets of health promotion
The health service delivery is outlined in the Basic Package of Services Policy, which is particularly relevant to HIV/AIDS and STI strategies as it provides a context for planning capacity development actions to address service delivery needs and to identify linkages in service delivery across different policy areas (MOH, 2004d).
Currently, the National HIV/AIDS Program is in the process of revising the strategic plan for the 2011-2016 five-year period. The activities of the National HIV/AIDS Program include screening blood samples; producing strategic information; implementing a comprehensive monitoring and evaluation system, which includes a surveillance plan; generating information, education, and communication (IEC) materials; promoting condoms; offering voluntary counseling and testing (VCT) for screening and treatment of sexually transmitted infections (STIs); providing antiretroviral

182 | HIV/AIDS-Related Knowledge, Attitudes, and Behavior
(ARV) treatment; providing care and support for people living with HIV and AIDS (PLHA); and training health workers in the clinical management of AIDS patients (MOH, 2006; DRTL, 2010).
The 2009-10 TLDHS included a series of questions on knowledge of HIV/AIDS and attitudes toward people with AIDS. All women and men age 15-49 were first asked if they had ever heard of AIDS. Those who had heard of AIDS were questioned further about their knowledge of HIV transmission and prevention. Respondents were also asked about their perception of the precautions a person can take to avoid getting infected with HIV. Additional questions dealt with common local misconceptions regarding the mode of transmission of HIV.
This chapter presents current levels of HIV/AIDS knowledge, attitudes, and related behaviors in the general adult population. A specific focus is HIV/AIDS knowledge and patterns of sexual activity among youth, who are the main target of many HIV prevention efforts.
14.1 KNOWLEDGE OF HIV/AIDS AND OF TRANSMISSION AND PREVENTION METHODS
14.1.1 Knowledge of AIDS
Respondents in the 2009-10 TLDHS were asked whether they have heard of AIDS. Table 14.1 shows the percentages of women and men age 15-49 who have heard of AIDS. Forty-four
Table 14.1 Knowledge of AIDS
Percentage of women and men age 15-49 who have heard of AIDS, by background characteristics, Timor-Leste 2009-10
Background characteristic
Women Men
Has heard of
AIDS Number of
women Has heard of
AIDS Number of
men
Age 15-24 53.4 5,487 62.6 1,636 15-19 51.8 3,144 56.8 994 20-24 55.5 2,343 71.6 643 25-29 47.4 1,897 70.6 586 30-39 38.2 3,219 61.6 992 40-49 27.2 2,534 49.4 861
Marital status Never married 56.3 4,675 64.2 1,865 Ever had sex (59.3) 40 83.9 540 Never had sex 56.3 4,635 56.2 1,325 Married/living together 37.3 7,906 58.1 2,158
Divorced/separated/ widowed 29.2 556 41.8 53
Residence Urban 70.1 3,439 85.1 1,102 Rural 34.4 9,698 51.7 2,974
District Aileu 36.2 554 53.2 181 Ainaro 28.8 619 46.4 217 Baucau 54.3 1,408 64.3 415 Bobonaro 39.5 1,262 61.8 357 Covalima 48.5 781 77.3 236 Dili 79.7 2,466 92.9 797 Ermera 13.8 1,542 20.8 491 Lautem 36.3 864 58.0 308 Liquiçá 33.9 801 52.9 252 Manatuto 52.1 603 98.9 190 Manufahi 36.3 470 46.0 137 Oecussi 27.6 884 51.0 235 Viqueque 26.8 882 31.7 260
Education No education 12.8 3,854 22.1 791 Primary 26.8 3,005 43.8 1,046 Secondary 68.8 5,829 80.2 2,009 More than secondary 97.1 449 100.0 230
Wealth quintile Lowest 20.1 2,314 35.3 728 Second 26.2 2,468 44.3 781 Middle 34.6 2,590 54.7 786 Fourth 48.9 2,687 68.7 849 Highest 78.8 3,077 92.1 932
Total 15-49 43.8 13,137 60.7 4,076
Note: Figures in parentheses are based on 25-49 unweighted cases

HIV/AIDS-Related Knowledge, Attitudes, and Behavior | 183
percent of women and 61 percent of men have heard of AIDS. Knowledge is inversely related to age, rising from 27 percent among women age 40-49 to 53 percent among those age 15-24. This pattern is true for men with the exception of those age15-24. Knowledge rises from 49 percent among men age 40-49 to 71 percent among men age 25-29 and then falls to 63 percent among the youngest cohort. Knowledge is higher among never-married than ever-married respondents. Knowledge is twice as high among urban compared with rural women, with the urban-rural difference among men being somewhat less substantial. Women in Dili and men in Manatuto are most likely to have heard of AIDS, and women and men in Ermera are least likely. Knowledge of AIDS increases with level of education and household wealth for both women and men.
14.1.2 Knowledge of HIV Prevention Methods
The promotion of sexual and reproductive health is necessary for the prevention of HIV infection. This includes educating the public to adopt specific prevention behaviors, including:
• Abstinence from sexual activity that can transmit infection
• Being faithful to one partner who is also faithful and uninfected
• Consistent condom use
Table 14.2 presents levels of knowledge about the various HIV prevention methods by background characteristics. Of the prevention methods discussed in the survey, women are most aware that their risk of getting HIV can be reduced by limiting sex to one uninfected partner who has no other partners (36 percent). In addition, 26 percent of women mention that abstaining from sexual intercourse will prevent the transmission of HIV. Among men, the most commonly cited prevention method also is limiting sex to one uninfected partner who has no other partners (49 percent). Knowledge of condoms and the role that they can play in preventing the transmission of AIDS is much more common among men than among women (45 percent versus 30 percent). Fewer men and women (42 percent and 27 percent, respectively) are also aware that both using condoms and limiting sex to one uninfected partner can reduce the risk of getting the AIDS virus.
Young women age 15-24 are relatively more knowledgeable of the various modes of prevention than older women. For instance, 32 percent of women age 15-24 said that using condoms and limiting sex to one uninfected partner can reduce the risk of HIV infection, compared with only 17 percent of women age 40-49. The relationship between age and knowledge of transmission of HIV among men is less clear. Knowledge of HIV prevention methods among both women and men is highest among never-married respondents and lowest among those divorced, separated, or widowed.
Knowledge of HIV prevention methods is consistently higher in urban than in rural areas among women and men. Education has a positive impact on a respondent’s knowledge of AIDS. For example, 62 percent of women with more than secondary education know that using condoms and limiting sexual intercourse to one uninfected partner can reduce a person’s chances of getting HIV, compared with 8 percent of women with no education. A similar pattern is seen for men, although the gap in knowledge by education is not as large as that observed for women. Similarly, women and men living in households in the higher wealth quintiles are more likely than those in the lower wealth quintiles to be aware of ways to prevent HIV transmission.
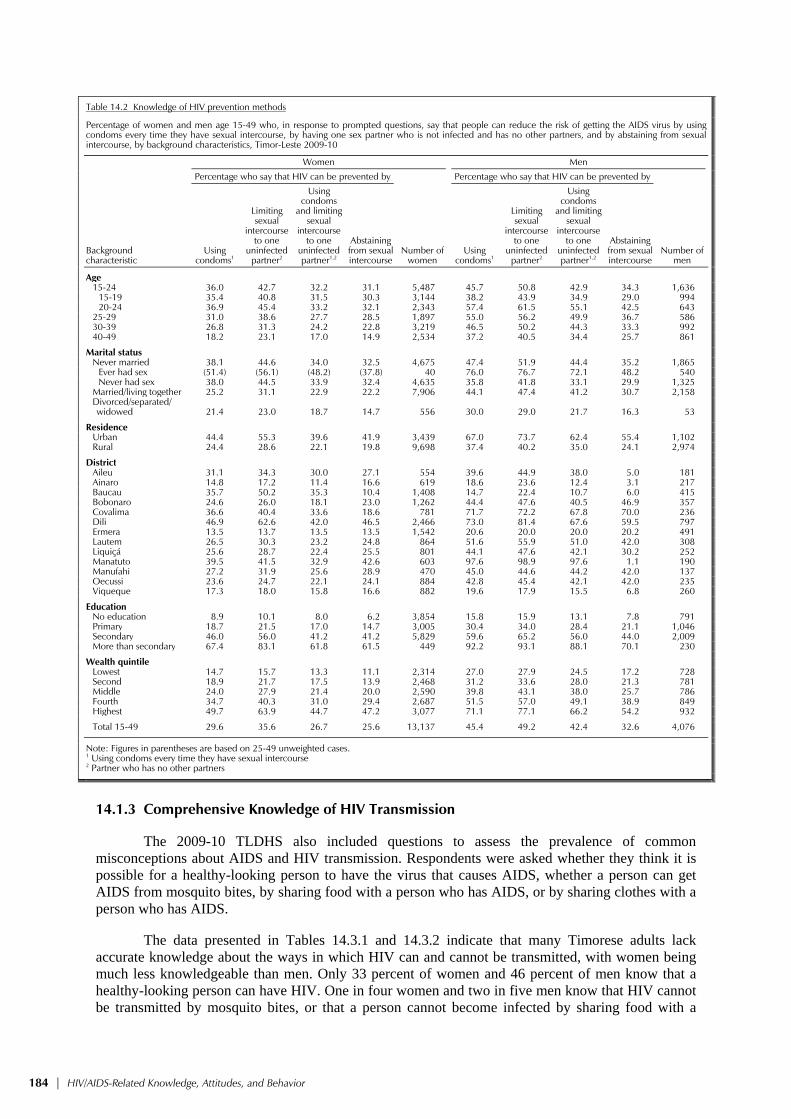
184 | HIV/AIDS-Related Knowledge, Attitudes, and Behavior
Table 14.2 Knowledge of HIV prevention methods
Percentage of women and men age 15-49 who, in response to prompted questions, say that people can reduce the risk of getting the AIDS virus by using condoms every time they have sexual intercourse, by having one sex partner who is not infected and has no other partners, and by abstaining from sexualintercourse, by background characteristics, Timor-Leste 2009-10
Background characteristic
Women Men
Percentage who say that HIV can be prevented by
Number of women
Percentage who say that HIV can be prevented by
Number of men
Using condoms1
Limiting sexual
intercourse to one
uninfected partner2
Using condoms
and limiting sexual
intercourse to one
uninfected partner1,2
Abstaining from sexual intercourse
Using condoms1
Limiting sexual
intercourse to one
uninfected partner2
Using condoms
and limiting sexual
intercourse to one
uninfected partner1,2
Abstaining from sexual intercourse
Age 15-24 36.0 42.7 32.2 31.1 5,487 45.7 50.8 42.9 34.3 1,636 15-19 35.4 40.8 31.5 30.3 3,144 38.2 43.9 34.9 29.0 994 20-24 36.9 45.4 33.2 32.1 2,343 57.4 61.5 55.1 42.5 643 25-29 31.0 38.6 27.7 28.5 1,897 55.0 56.2 49.9 36.7 586 30-39 26.8 31.3 24.2 22.8 3,219 46.5 50.2 44.3 33.3 992 40-49 18.2 23.1 17.0 14.9 2,534 37.2 40.5 34.4 25.7 861
Marital status Never married 38.1 44.6 34.0 32.5 4,675 47.4 51.9 44.4 35.2 1,865 Ever had sex (51.4) (56.1) (48.2) (37.8) 40 76.0 76.7 72.1 48.2 540 Never had sex 38.0 44.5 33.9 32.4 4,635 35.8 41.8 33.1 29.9 1,325 Married/living together 25.2 31.1 22.9 22.2 7,906 44.1 47.4 41.2 30.7 2,158
Divorced/separated/ widowed 21.4 23.0 18.7 14.7 556 30.0 29.0 21.7 16.3 53
Residence Urban 44.4 55.3 39.6 41.9 3,439 67.0 73.7 62.4 55.4 1,102 Rural 24.4 28.6 22.1 19.8 9,698 37.4 40.2 35.0 24.1 2,974
District Aileu 31.1 34.3 30.0 27.1 554 39.6 44.9 38.0 5.0 181 Ainaro 14.8 17.2 11.4 16.6 619 18.6 23.6 12.4 3.1 217 Baucau 35.7 50.2 35.3 10.4 1,408 14.7 22.4 10.7 6.0 415 Bobonaro 24.6 26.0 18.1 23.0 1,262 44.4 47.6 40.5 46.9 357 Covalima 36.6 40.4 33.6 18.6 781 71.7 72.2 67.8 70.0 236 Dili 46.9 62.6 42.0 46.5 2,466 73.0 81.4 67.6 59.5 797 Ermera 13.5 13.7 13.5 13.5 1,542 20.6 20.0 20.0 20.2 491 Lautem 26.5 30.3 23.2 24.8 864 51.6 55.9 51.0 42.0 308 Liquiçá 25.6 28.7 22.4 25.5 801 44.1 47.6 42.1 30.2 252 Manatuto 39.5 41.5 32.9 42.6 603 97.6 98.9 97.6 1.1 190 Manufahi 27.2 31.9 25.6 28.9 470 45.0 44.6 44.2 42.0 137 Oecussi 23.6 24.7 22.1 24.1 884 42.8 45.4 42.1 42.0 235 Viqueque 17.3 18.0 15.8 16.6 882 19.6 17.9 15.5 6.8 260
Education No education 8.9 10.1 8.0 6.2 3,854 15.8 15.9 13.1 7.8 791 Primary 18.7 21.5 17.0 14.7 3,005 30.4 34.0 28.4 21.1 1,046 Secondary 46.0 56.0 41.2 41.2 5,829 59.6 65.2 56.0 44.0 2,009 More than secondary 67.4 83.1 61.8 61.5 449 92.2 93.1 88.1 70.1 230
Wealth quintile Lowest 14.7 15.7 13.3 11.1 2,314 27.0 27.9 24.5 17.2 728 Second 18.9 21.7 17.5 13.9 2,468 31.2 33.6 28.0 21.3 781 Middle 24.0 27.9 21.4 20.0 2,590 39.8 43.1 38.0 25.7 786 Fourth 34.7 40.3 31.0 29.4 2,687 51.5 57.0 49.1 38.9 849 Highest 49.7 63.9 44.7 47.2 3,077 71.1 77.1 66.2 54.2 932
Total 15-49 29.6 35.6 26.7 25.6 13,137 45.4 49.2 42.4 32.6 4,076
Note: Figures in parentheses are based on 25-49 unweighted cases.1 Using condoms every time they have sexual intercourse 2 Partner who has no other partners
14.1.3 Comprehensive Knowledge of HIV Transmission
The 2009-10 TLDHS also included questions to assess the prevalence of common misconceptions about AIDS and HIV transmission. Respondents were asked whether they think it is possible for a healthy-looking person to have the virus that causes AIDS, whether a person can get AIDS from mosquito bites, by sharing food with a person who has AIDS, or by sharing clothes with a person who has AIDS.
The data presented in Tables 14.3.1 and 14.3.2 indicate that many Timorese adults lack accurate knowledge about the ways in which HIV can and cannot be transmitted, with women being much less knowledgeable than men. Only 33 percent of women and 46 percent of men know that a healthy-looking person can have HIV. One in four women and two in five men know that HIV cannot be transmitted by mosquito bites, or that a person cannot become infected by sharing food with a

HIV/AIDS-Related Knowledge, Attitudes, and Behavior | 185
person who has AIDS or by sharing clothes with a person who has HIV. About twice as many men as women (28 percent and 15 percent, respectively) say that a healthy looking person can have AIDS and reject the two most common local misconceptions (that HIV can be transmitted by mosquito bites and by sharing food with a person who has AIDS).
Table 14.3.1 Comprehensive knowledge about AIDS: Women
Percentage of women age 15-49 who say that a healthy-looking person can have the AIDS virus and who, in response to prompted questions, correctly reject local misconceptions about AIDS transmission or prevention, and the percentage with a comprehensive knowledge about AIDS by background characteristics, Timor-Leste 2009-10
Background characteristic
Percentage of respondents who say that: Percentage who say that a healthy looking person can have the AIDS virus and who reject the two
most common local misconceptions1
Percentage with a comprehensive
knowledge about AIDS2
Number of women
A healthy-looking person can have the AIDS virus
AIDS cannot be transmitted by mosquito bites
A person cannot become infected by sharing food with a person who has AIDS
AIDS cannot be transmitted by sharing clothes with a person who has AIDS
Age 15-24 39.4 31.3 30.0 30.2 17.9 12.2 5,487 15-19 38.5 29.7 29.1 29.3 16.9 11.2 3,144 20-24 40.5 33.4 31.3 31.3 19.3 13.5 2,343 25-29 36.5 25.0 24.9 25.5 14.3 11.5 1,897 30-39 30.6 21.0 22.6 21.5 13.8 10.8 3,219 40-49 20.7 13.8 14.6 14.1 8.1 6.2 2,534
Marital status Never married 42.1 33.0 31.7 31.8 18.9 13.0 4,675 Ever had sex (41.9) (27.1) (40.5) (25.7) (9.0) (5.0) 40 Never had sex 42.1 33.0 31.6 31.8 18.9 13.1 4,635 Married/living together 28.9 20.3 20.9 20.5 12.4 9.5 7,906
Divorced/separated/ widowed 20.2 12.1 15.1 15.1 7.5 6.0 556
Residence Urban 52.0 35.4 36.8 34.7 18.0 14.0 3,439 Rural 26.5 20.6 20.1 20.5 13.2 9.4 9,698
District Aileu 23.9 21.4 22.5 23.9 10.2 8.4 554 Ainaro 20.4 11.4 10.9 11.1 5.2 3.2 619 Baucau 51.0 45.8 42.4 43.6 35.7 23.5 1,408 Bobonaro 26.4 20.6 21.9 21.2 10.4 5.3 1,262 Covalima 31.3 25.0 26.1 24.6 13.2 11.1 781 Dili 59.9 36.3 39.7 35.0 17.3 13.8 2,466 Ermera 12.7 7.3 6.2 6.3 5.2 5.2 1,542 Lautem 24.0 23.0 23.7 26.1 13.2 11.1 864 Liquiçá 24.9 16.9 18.3 19.8 11.3 8.1 801 Manatuto 39.7 30.2 25.0 27.0 15.2 8.9 603 Manufahi 26.9 26.5 28.6 31.2 19.7 16.5 470 Oecussi 19.1 9.6 6.7 8.8 2.8 2.7 884 Viqueque 21.9 21.6 20.4 20.5 17.7 11.5 882
Education No education 9.2 6.9 7.4 6.9 4.4 3.5 3,854 Primary 19.7 13.1 13.8 13.6 7.8 5.9 3,005 Secondary 52.4 39.3 38.4 38.3 22.5 15.9 5,829 More than secondary 81.2 58.7 63.4 61.8 41.8 33.9 449
Wealth quintile Lowest 15.0 11.4 11.6 11.4 7.7 5.6 2,314 Second 19.9 16.5 16.0 17.1 11.1 8.7 2,468 Middle 25.3 20.3 19.7 19.8 12.0 8.3 2,590 Fourth 37.2 27.6 27.2 27.2 16.3 11.8 2,687 Highest 60.7 41.4 42.8 40.8 22.9 16.7 3,077
Total 15-49 33.2 24.5 24.5 24.3 14.5 10.6 13,137
Note: Figures in parentheses are based on 25-49 unweighted cases.1 Two most common local misconceptions: AIDS can be transmitted by mosquito bites and by sharing food with a person with HIV 2 Comprehensive knowledge means knowing that consistent use of condom during sexual intercourse and having just one uninfected faithful partner can reduce the chance of getting the AIDS virus, knowing that a healthy-looking person can have the AIDS virus, and rejecting the two most common local misconceptions about AIDS transmission or prevention.
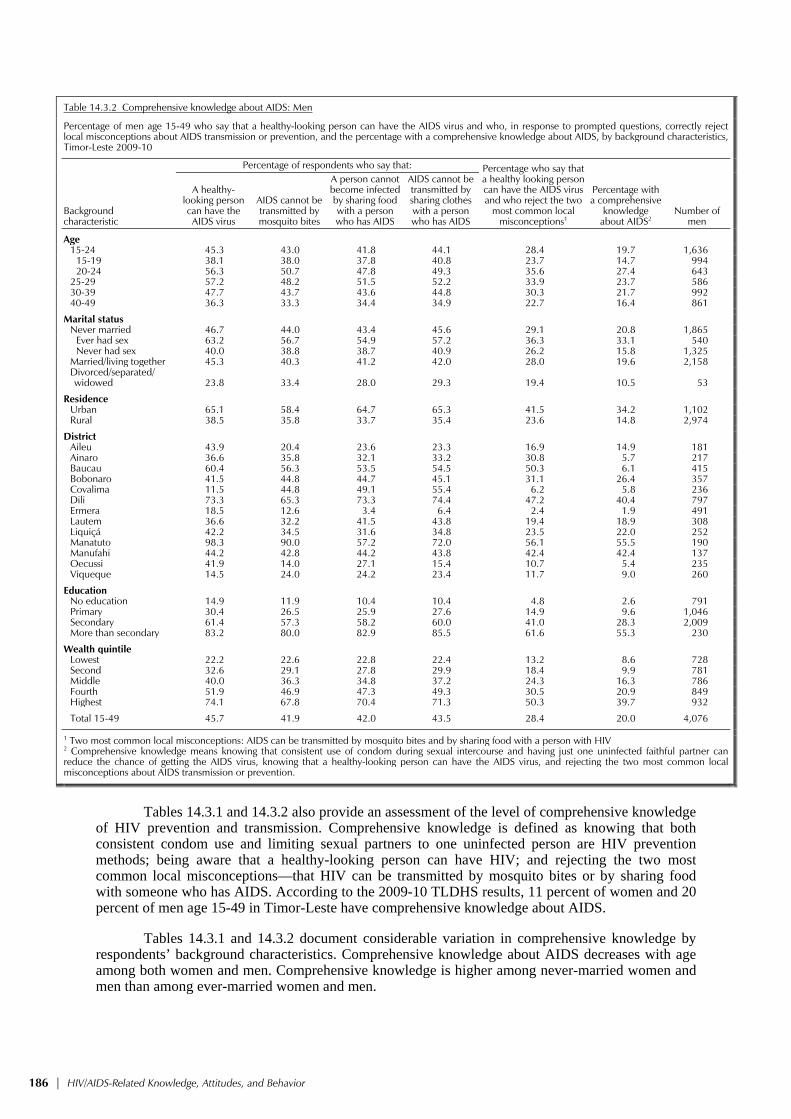
186 | HIV/AIDS-Related Knowledge, Attitudes, and Behavior
Table 14.3.2 Comprehensive knowledge about AIDS: Men
Percentage of men age 15-49 who say that a healthy-looking person can have the AIDS virus and who, in response to prompted questions, correctly reject local misconceptions about AIDS transmission or prevention, and the percentage with a comprehensive knowledge about AIDS, by background characteristics, Timor-Leste 2009-10
Background characteristic
Percentage of respondents who say that: Percentage who say that a healthy looking person can have the AIDS virus and who reject the two
most common local misconceptions1
Percentage with a comprehensive
knowledge about AIDS2
Number of men
A healthy-looking person can have the AIDS virus
AIDS cannot be transmitted by mosquito bites
A person cannot become infected by sharing food with a person who has AIDS
AIDS cannot be transmitted by sharing clothes with a person who has AIDS
Age 15-24 45.3 43.0 41.8 44.1 28.4 19.7 1,636 15-19 38.1 38.0 37.8 40.8 23.7 14.7 994 20-24 56.3 50.7 47.8 49.3 35.6 27.4 643 25-29 57.2 48.2 51.5 52.2 33.9 23.7 586 30-39 47.7 43.7 43.6 44.8 30.3 21.7 992 40-49 36.3 33.3 34.4 34.9 22.7 16.4 861
Marital status Never married 46.7 44.0 43.4 45.6 29.1 20.8 1,865 Ever had sex 63.2 56.7 54.9 57.2 36.3 33.1 540 Never had sex 40.0 38.8 38.7 40.9 26.2 15.8 1,325 Married/living together 45.3 40.3 41.2 42.0 28.0 19.6 2,158
Divorced/separated/ widowed 23.8 33.4 28.0 29.3 19.4 10.5 53
Residence Urban 65.1 58.4 64.7 65.3 41.5 34.2 1,102 Rural 38.5 35.8 33.7 35.4 23.6 14.8 2,974
District Aileu 43.9 20.4 23.6 23.3 16.9 14.9 181 Ainaro 36.6 35.8 32.1 33.2 30.8 5.7 217 Baucau 60.4 56.3 53.5 54.5 50.3 6.1 415 Bobonaro 41.5 44.8 44.7 45.1 31.1 26.4 357 Covalima 11.5 44.8 49.1 55.4 6.2 5.8 236 Dili 73.3 65.3 73.3 74.4 47.2 40.4 797 Ermera 18.5 12.6 3.4 6.4 2.4 1.9 491 Lautem 36.6 32.2 41.5 43.8 19.4 18.9 308 Liquiçá 42.2 34.5 31.6 34.8 23.5 22.0 252 Manatuto 98.3 90.0 57.2 72.0 56.1 55.5 190 Manufahi 44.2 42.8 44.2 43.8 42.4 42.4 137 Oecussi 41.9 14.0 27.1 15.4 10.7 5.4 235 Viqueque 14.5 24.0 24.2 23.4 11.7 9.0 260
Education No education 14.9 11.9 10.4 10.4 4.8 2.6 791 Primary 30.4 26.5 25.9 27.6 14.9 9.6 1,046 Secondary 61.4 57.3 58.2 60.0 41.0 28.3 2,009 More than secondary 83.2 80.0 82.9 85.5 61.6 55.3 230
Wealth quintile Lowest 22.2 22.6 22.8 22.4 13.2 8.6 728 Second 32.6 29.1 27.8 29.9 18.4 9.9 781 Middle 40.0 36.3 34.8 37.2 24.3 16.3 786 Fourth 51.9 46.9 47.3 49.3 30.5 20.9 849 Highest 74.1 67.8 70.4 71.3 50.3 39.7 932
Total 15-49 45.7 41.9 42.0 43.5 28.4 20.0 4,076
1 Two most common local misconceptions: AIDS can be transmitted by mosquito bites and by sharing food with a person with HIV 2 Comprehensive knowledge means knowing that consistent use of condom during sexual intercourse and having just one uninfected faithful partner can reduce the chance of getting the AIDS virus, knowing that a healthy-looking person can have the AIDS virus, and rejecting the two most common local misconceptions about AIDS transmission or prevention.
Tables 14.3.1 and 14.3.2 also provide an assessment of the level of comprehensive knowledge
of HIV prevention and transmission. Comprehensive knowledge is defined as knowing that both consistent condom use and limiting sexual partners to one uninfected person are HIV prevention methods; being aware that a healthy-looking person can have HIV; and rejecting the two most common local misconceptions—that HIV can be transmitted by mosquito bites or by sharing food with someone who has AIDS. According to the 2009-10 TLDHS results, 11 percent of women and 20 percent of men age 15-49 in Timor-Leste have comprehensive knowledge about AIDS.
Tables 14.3.1 and 14.3.2 document considerable variation in comprehensive knowledge by respondents’ background characteristics. Comprehensive knowledge about AIDS decreases with age among both women and men. Comprehensive knowledge is higher among never-married women and men than among ever-married women and men.

HIV/AIDS-Related Knowledge, Attitudes, and Behavior | 187
Comprehensive knowledge about AIDS is also higher among urban than rural residents, presumably because of better access to information through the mass media in urban than in rural areas. Comprehensive knowledge is positively related to education and wealth, increasing from 4 percent and 3 percent among women and men with no education, to 34 percent and 55 percent among women and men with more than secondary education. A similar pattern is observed with regard to comprehensive knowledge and wealth for both women and men.
14.2 ATTITUDES TOWARD PEOPLE LIVING WITH HIV/AIDS
Knowledge and beliefs about HIV infection affect how people treat those they know to be living with HIV or AIDS. In the 2009-10 TLDHS, a number of questions were posed to respondents to measure their attitudes towards people living with HIV or AIDS (PLHA), including questions about their willingness to buy vegetables from an infected shopkeeper, to let others know the HIV status of family members, and to take care of relatives who have HIV in their own household. They were also asked whether an HIV-positive female teacher who is not sick should be allowed to continue teaching. Tables 14.4.1 and 14.4.2 show the percentages who express positive attitudes towards people living with HIV among women and men who have heard about the virus, by background characteristics.
Table 14.4.1 Accepting attitudes toward those living with HIV/AIDS: Women
Among women age 15-49 who have heard of AIDS, percentage expressing specific accepting attitudes toward people with AIDS, by background characteristics, Timor-Leste 2009-10
Background characteristic
Percentage of women who:
Percentage expressing acceptance
attitudes on all four indicators
Number of women who have heard of
AIDS
Are willing to care for a family
member with the AIDS virus in the
respondent’s home
Would buy fresh vegetables from shopkeeper who
has the AIDS virus
Say that a female teacher with the AIDS virus and is not sick should be
allowed to continue teaching
Would not want to keep secret that a family member got infected with the
AIDS virus
Age 15-24 54.7 35.1 45.9 82.5 10.8 2,929 15-19 53.2 34.5 44.9 81.0 9.8 1,629 20-24 56.5 35.8 47.2 84.3 12.0 1,299 25-29 56.4 35.0 45.3 84.7 10.3 900 30-39 56.0 33.1 42.7 85.7 12.2 1,229 40-49 53.0 31.7 38.3 87.6 11.4 690
Marital status Never married 54.3 35.2 45.1 82.5 10.6 2,634 Ever had sex * * * * * 24 Never had sex 54.4 35.4 45.3 82.5 10.7 2,610 Married/living together 55.4 33.0 43.6 85.8 11.4 2,952
Divorced/separated/ widowed 59.2 40.6 41.5 79.7 12.4 162
Residence Urban 60.1 36.4 45.3 83.9 13.7 2,410 Rural 51.4 32.6 43.4 84.3 9.2 3,338
District Aileu 56.7 38.9 56.0 94.7 16.6 201 Ainaro 68.8 21.6 45.8 76.1 4.0 178 Baucau 25.1 27.2 17.0 94.1 0.2 765 Bobonaro 45.1 48.7 42.7 68.6 9.0 499 Covalima 80.5 41.9 53.7 91.7 15.1 379 Dili 59.9 36.4 41.9 82.7 13.6 1,965 Ermera 48.4 17.0 14.6 89.5 0.5 212 Lautem 53.8 19.4 65.3 67.3 8.5 313 Liquiçá 59.1 40.0 55.6 79.1 15.3 272 Manatuto 61.9 18.9 69.6 89.1 6.9 314 Manufahi 28.7 39.6 49.8 84.5 7.2 171 Oecussi 71.0 36.6 44.2 89.6 19.6 244 Viqueque 75.7 44.4 76.5 92.1 31.1 236
Education No education 42.5 29.0 33.5 84.6 9.8 493 Primary 54.2 32.1 39.3 83.0 10.7 806 Secondary 55.8 34.6 46.2 83.7 10.7 4,013 More than secondary 63.7 40.5 47.1 89.3 16.6 436
Wealth quintile Lowest 51.0 27.2 41.3 86.0 8.4 465 Second 42.1 26.5 38.7 86.8 7.7 648 Middle 55.5 36.8 44.6 80.9 9.8 897 Fourth 55.2 35.3 46.2 83.2 11.4 1,314 Highest 58.9 36.1 45.1 84.7 12.8 2,425
Total 15-49 55.0 34.2 44.2 84.1 11.1 5,748
Note: An asterisk indicates that a figure is based on fewer than 25 unweighted cases and has been suppressed.

188 | HIV/AIDS-Related Knowledge, Attitudes, and Behavior
Table 14.4.2 Accepting attitudes toward those living with HIV/AIDS: Men
Among men age 15-49 who have heard of HIV/AIDS, percentage expressing specific accepting attitudes toward people with HIV/AIDS, by background characteristics, Timor-Leste 2009-10
Background characteristic
Percentage of men who:
Percentage expressing acceptance
attitudes on all four indicators
Number of men who have heard of AIDS
Are willing to care for a family
member sick with AIDS in the
respondent’s home
Would buy fresh vegetables from shopkeeper who
has the AIDS virus
Say that a female teacher with the AIDS virus and is not sick should be
allowed to continue teaching
Would not want to keep secret that a family member got infected with the
AIDS virus
Age 15-24 25.4 22.6 28.6 85.9 2.7 1,024 15-19 24.9 21.5 26.8 83.8 2.2 564 20-24 26.1 24.0 30.7 88.5 3.2 460 25-29 27.7 27.0 31.1 87.2 4.1 414 30-39 25.2 18.3 26.9 88.3 3.8 611 40-49 29.0 20.0 24.3 89.1 3.7 425
Marital status Never married 25.4 22.3 29.0 86.9 2.8 1,198 Ever had sex 33.8 19.0 35.2 92.4 5.3 453 Never had sex 20.3 24.3 25.2 83.5 1.3 745 Married/living together 27.3 21.2 26.4 87.6 3.9 1,254
Divorced/separated/ widowed * * * * * 22
Residence Urban 20.1 14.8 25.3 83.3 2.4 938 Rural 30.2 26.2 29.4 89.7 3.9 1,536
District Aileu 60.0 49.0 44.7 84.5 30.1 96 Ainaro 15.5 54.5 58.2 98.6 4.8 101 Baucau 2.6 17.4 3.8 97.4 0.0 267 Bobonaro 23.5 37.8 18.3 69.3 1.4 220 Covalima 0.3 5.4 3.9 99.5 0.0 183 Dili 14.6 11.5 22.0 83.6 2.1 740 Ermera 3.5 60.7 6.4 92.9 0.0 102 Lautem 12.9 17.4 36.7 95.6 1.5 179 Liquiçá 37.5 33.1 42.9 92.5 2.3 133 Manatuto 96.3 4.0 60.1 99.7 3.7 187 Manufahi 86.5 49.4 73.9 11.7 0.0 63 Oecussi 77.3 29.1 36.5 94.6 15.0 120 Viqueque 8.5 3.9 41.5 84.4 0.0 83
Education No education 36.9 15.6 25.2 78.7 1.5 175 Primary 33.5 19.1 24.6 87.7 2.5 458 Secondary 23.6 23.3 27.8 87.9 3.5 1,611 More than secondary 23.2 21.8 36.4 88.7 5.4 230
Wealth quintile Lowest 35.1 17.6 26.2 89.8 2.6 257 Second 26.2 30.6 29.7 86.8 4.6 346 Middle 29.4 25.5 29.2 91.6 3.3 430 Fourth 28.0 25.2 28.5 84.9 2.6 583 Highest 21.2 15.4 26.4 86.2 3.6 858
Total 15-49 26.4 21.8 27.8 87.3 3.4 2,474
Note: An asterisk indicates that a figure is based on fewer than 25 unweighted cases and has been suppressed.
Among those who have heard of AIDS, twice as many women as men (55 percent and 26
percent, respectively) state that they would be willing to care for a family member with AIDS in their home. Eighty-four percent of women and 87 percent of men say that they would not want to keep secret that a family member was infected with HIV, while 44 percent of women and 28 percent of men say that an HIV-positive female teacher should be allowed to continue teaching. A relatively lower proportion of women and men (34 percent and 22 percent, respectively) say they would buy fresh vegetables from a shopkeeper with AIDS. The percentage expressing accepting attitudes on all four measures is low: 11 percent among women and 3 percent among men.
Stigma and attitudes associated with HIV and AIDS differ by respondents’ background characteristics. There are small differentials in the percentage expressing accepting attitudes toward those living with HIV/AIDS by age and marital status with one notable exception. Never-married men who have ever had sex are relatively more likely to express accepting attitudes towards people living with HIV or AIDS. Accepting attitudes are higher among women in urban areas than women in rural areas, but this trend is reversed among men. Exhibiting accepting attitudes towards people living with

HIV/AIDS-Related Knowledge, Attitudes, and Behavior | 189
HIV or AIDS on all four indicators ranges among women from a low of less than one percent in Baucau to a high of 31 percent in Viqueque, and among men from a low of 0 percent in Baucau, Covalima, Ermera, Manufahi, and Viqueque to a high of 30 percent among men in Aileu. Furthermore, women and men with more than secondary education and women living in the wealthiest households are also most likely to accept people living with HIV or AIDS. The relationship between wealth and acceptance among men is less clear.
14.3 RISKY BEHAVIORS
The 2009-10 TLDHS included questions on respondents’ sexual partners during the 12 months preceding the survey. For male respondents, an additional question was asked about whether they paid for sex during the 12 months preceding the interview. Information on the use of condoms at the last sexual encounter with each partner in the last 12 months was collected from both women and men. Finally, sexually active women and men were asked about the total number of partners they had had during their lifetime. These questions are, of course, sensitive, and in interpreting the results in this section it is important to remember that respondents’ answers may be subject to some reporting bias. The discussion below focuses primarily on men because less than 1 percent of women reported having multiple sexual partners, and a separate analysis is not statistically meaningful.
14.3.1 Multiple Sexual Partners and Higher-risk Sexual Intercourse
Table 14.5 presents information collected from men who had ever had intercourse about the number of sexual partners they had had during the 12-month period before the survey and the mean number of sexual partners that a man has had during his lifetime.
Just over 1 percent of men age 15-49 reported having had two or more sexual partners during the 12 months prior to the survey, with men reporting a mean number of just under two partners in their lifetimes. Among men with two or more partners in the 12 months preceding the survey, 19 percent used a condom at last sex (data not presented). The differentials presented in Table 14.5 show that the percentage of men with two or more partners in the 12 months before the survey is higher among men age 25-29 than among younger and older men; higher among divorced, separated, or widowed men than among currently married or never married men; higher among urban than rural men; higher among highly educated men than among those with little or no education; and higher among men in the fourth and highest wealth quintiles. Due to the low number of men in the survey reporting multiple partners in the past 12 months, it is not possible to examine differentials in use of a condom at last sex among men with multiple partners.

190 | HIV/AIDS-Related Knowledge, Attitudes, and Behavior
Table 14.5 Multiple sexual partners in the past 12 months: Men
Percentage of men age 15-49 who had sexual intercourse with more than one sexual partner in the past 12 months; and the mean number of sexual partners during his lifetime for men who ever had sexual intercourse, by background characteristics, Timor-Leste 2009-10
Background characteristic
Among all men Among men who ever had
sexual intercourse
Percentage who had 2+ partners
in the past 12 months
Number of men
Mean number of sexual partners in
lifetime Number of
men
Age 15-24 0.9 1,636 1.8 442 15-19 0.3 994 1.8 98 20-24 1.9 643 1.8 344 25-29 2.5 586 2.0 453 30-39 1.4 992 1.8 866 40-49 1.6 861 1.8 752
Marital status Never married 1.8 1,865 2.4 515 Married/living together 1.0 2,158 1.7 1,950
Divorced/separated/ widowed 4.9 53 1.6 47
Residence Urban 2.2 1,102 2.4 712 Rural 1.1 2,974 1.6 1,801
District Aileu 6.2 181 1.4 125 Ainaro 0.3 217 1.3 108 Baucau 0.4 415 1.0 244 Bobonaro 0.4 357 1.0 173 Covalima 0.0 236 3.3 187 Dili 3.0 797 2.6 542 Ermera 0.4 491 1.6 158 Lautem 2.5 308 1.7 191 Liquiçá 0.0 252 1.6 179 Manatuto 0.4 190 1.3 170 Manufahi 0.4 137 1.2 81 Oecussi 1.1 235 2.5 187 Viqueque 1.9 260 1.1 168
Education No education 0.5 791 1.6 518 Primary 1.1 1,046 1.8 686 Secondary 1.6 2,009 1.9 1,111 More than secondary 3.8 230 2.6 197
Wealth quintile Lowest 1.4 728 1.7 452 Second 0.8 781 1.6 440 Middle 0.8 786 1.5 458 Fourth 1.5 849 1.9 532 Highest 2.4 932 2.4 631
Total 15-49 1.4 4,076 1.8 2,513
14.3.2 Paid Sex
Paid sex is considered a high-risk sexual behavior. Male respondents in the 2009-10 TLDHS were asked whether they had paid money in exchange for sex in the past 12 months. Five percent of men reported that they had engaged in paid sex in the year before the survey (Table 14.6).
Paid sex occurs most often among men age 20-24, divorced/separated/widowed men, urban men, men residing in Covalima, Manatuto and Dili, highly educated men, and men living in the wealthiest households.
Among those who paid for sex, only 26 percent reported using a condom during their most recent encounter (data not shown). Only small numbers of men reported paying for sex, so an analysis of condom use among men who paid for sex by background characteristics is not statistically meaningful and is not shown in the report.

HIV/AIDS-Related Knowledge, Attitudes, and Behavior | 191
Table 14.6 Payment for sexual intercourse: Men
Percentage of men age 15-49 reporting payment for sexual intercourse in the past 12 months, by background characteristics, Timor-Leste 2009-10
Background characteristic
Payment for sexual intercourse in the past 12 months
Percentage who paid for
sexual intercourse
Number of men
Age 15-24 6.1 1,636 15-19 3.0 994 20-24 10.7 643 25-29 8.5 586 30-39 5.2 992 40-49 2.0 861
Marital status Never married 9.3 1,865 Married/living together 1.8 2,158
Divorced/separated/ widowed 10.8 53
Residence Urban 10.3 1,102 Rural 3.5 2,974
District Aileu 1.0 181 Ainaro 1.6 217 Baucau 0.0 415 Bobonaro 0.0 357 Covalima 20.0 236 Dili 12.2 797 Ermera 3.4 491 Lautem 0.7 308 Liquiçá 4.9 252 Manatuto 15.0 190 Manufahi 0.0 137 Oecussi 1.7 235 Viqueque 1.4 260
Education No education 3.0 791 Primary 4.5 1,046 Secondary 5.8 2,009 More than secondary 13.5 230
Wealth quintile Lowest 2.6 728 Second 2.6 781 Middle 5.2 786 Fourth 4.7 849 Highest 10.4 932
Total 15-49 5.3 4,076
14.4 KNOWLEDGE OF HIV TESTING
Knowledge of one’s HIV status helps HIV-negative individuals make specific decisions to reduce their risk and to increase safe sex practices so that they can remain disease-free. For those who are HIV infected, knowledge of their status allows them to take action to protect their sexual partners, to access treatment, and to plan for the future. Testing of pregnant women is especially important to prevent mother-to-child transmission of HIV. Where migration is common, knowing one’s HIV status is especially important for curbing the spread of the infection and empowering women to seek preventive and curative measures to protect themselves and their children.
The diagnosis of HIV infection benefits both the individual and the public in general. Advances in medical science have meant that having HIV need not necessarily be fatal, and with appropriate treatment, people with HIV can lead relatively normal lives. The capacity to ensure that all people diagnosed with HIV in Timor–Leste receive such treatment is now being established. Maximizing the diagnosis of HIV infection means that patterns of infection can be better monitored and interventions better targeted. The government of Timor-Leste is prioritizing the provision of

192 | HIV/AIDS-Related Knowledge, Attitudes, and Behavior
comprehensive voluntary counseling and testing (VCT) services at all levels of the health system. Because fear of discrimination and stigma is a major barrier to VCT access, confidentiality is of utmost importance (MOH, 2006).
In the 2009-10 TLDHS, both male and female respondents were asked whether they know of a place where people can go to get tested for HIV. Table 14.7 shows that, among the adult population age 15-49, men (35 percent) are twice as likely as women (17 percent) to know where to go to be tested for HIV. Knowledge of a place to get an HIV test differs by respondents’ background characteristics. For instance, women and men in the oldest cohort are less likely to know of a place where they can get tested for HIV than their younger counterparts. Knowledge of HIV testing facilities is highest among urban women and men, among women who reside in Dili and men who reside in Manatuto (nearly all of whom are aware of a place to go to get tested), among men and women who have more than secondary education, and among respondents in the highest wealth quintile.
Table 14.7 Knowledge of a place to get an HIV test
Percentage of women and men age 15-49 who know where to get an HIV test, according to background characteristics, Timor-Leste 2009-10
Background characteristic
Women Men
Percentage who know where to get an HIV test
Number of women
Percentage who know where to get an HIV test
Number of men
Age 15-24 19.9 5,487 33.2 1,636 15-19 18.0 3,144 27.3 994 20-24 22.3 2,343 42.4 643 25-29 19.7 1,897 43.0 586 30-39 16.4 3,219 36.0 992 40-49 10.1 2,534 30.2 861
Marital status Never married 21.4 4,675 34.5 1,865 Ever had sex (23.2) 40 52.3 540 Never had sex 21.4 4,635 27.3 1,325 Married/living together 14.9 7,906 35.2 2,158
Divorced/separated/ widowed 12.1 556 17.1 53
Residence Urban 29.5 3,439 38.3 1,102 Rural 12.7 9,698 33.3 2,974
District Aileu 22.9 554 18.4 181 Ainaro 13.2 619 29.6 217 Baucau 17.2 1,408 58.6 415 Bobonaro 10.5 1,262 28.8 357 Covalima 14.9 781 38.3 236 Dili 33.0 2,466 34.9 797 Ermera 6.3 1,542 18.0 491 Lautem 15.9 864 17.6 308 Liquiçá 9.3 801 37.5 252 Manatuto 21.9 603 98.0 190 Manufahi 19.4 470 22.4 137 Oecussi 7.7 884 48.7 235 Viqueque 15.2 882 12.6 260
Education No education 2.8 3,854 9.4 791 Primary 7.7 3,005 21.6 1,046 Secondary 28.5 5,829 47.0 2,009 More than secondary 56.1 449 72.3 230
Wealth quintile Lowest 6.5 2,314 21.5 728 Second 7.9 2,468 25.9 781 Middle 12.3 2,590 32.3 786 Fourth 19.7 2,687 41.5 849 Highest 34.2 3,077 48.0 932
Total 15-49 17.1 13,137 34.7 4,076
Note: Figures in parentheses are based on 25-49 unweighted cases.

HIV/AIDS-Related Knowledge, Attitudes, and Behavior | 193
14.5 MALE CIRCUMCISION
Male circumcision has been shown to be asso-ciated with lower transmission of STIs, including HIV (WHO and UNAIDS, 2007). To know the practice of male circumcision in Timor-Leste, men age 15-49 interviewed in the 2009-10 TLDHS were asked if they were circumcised.
As seen in Table 14.8 male circumcision is not widespread in Timor-Leste, and only 6 percent of men have been circumcised. The practice is slightly more common among men age 25 and older, among men with little or no education, and among men in the lowest wealth quintile. The vast majority of circumcised men live in Oecussi.
14.6 REPORTS OF RECENT SEXUALLY TRANSMITTED
INFECTIONS
Information about the prevalence of sexually transmitted infections (STIs) is useful not only as a marker of unprotected sexual intercourse but also as a cofactor for HIV transmission. The 2009-10 TLDHS asked respondents who had ever had sex whether they had had an STI in the past 12 months. They were also asked whether, in the past year, they had experienced a genital sore or ulcer, and whether they had any genital discharge. These symptoms are useful in identifying STIs in men. They are less easily interpreted in women because women are likely to experience more non-STI conditions of the reproductive tract that produce a genital discharge.
In general, STIs are acquired through unprotected sexual intercourse and through the introduction of infected blood and blood products. STIs may also be transmitted from mother to fetus and from mother to neonate/infant during pregnancy and during the postpartum and breastfeeding periods (MOH, 2007).
Table 14.9 shows that self-reported prevalence of STIs and STI symptoms is relatively low, with prevalence among women higher than among men. About 1 percent of women and men reported STI prevalence in the 12 months prior to the survey. It is likely that these figures, which are quite low, underestimate the actual prevalence of STIs among the sexually active population in Timor-Leste. Many STI symptoms are not easily recognized, and often STIs do not have any visible symptoms.
Eight percent of women and 2 percent of men age 15-49 report having had a bad-smelling or abnormal genital discharge, 4 percent of women and 3 percent of men report a genital sore or ulcer, and twice as many women as men (8 percent and 4 percent, respectively) report having had an STI, genital discharge, or sore or ulcer in the past 12 months.
Table 14.8 Male circumcision
Percentage of men age 15-49 who report having been circumcised, by background characteristics, Timor-Leste 2009-10
Backgroundcharacteristic
Percentage circumcised
Number of men
Age 15-24 4.2 1,636
15-19 4.4 99420-24 3.8 643
25-29 7.4 58630-39 8.5 99240-49 7.5 861
Residence Urban 6.6 1,102Rural 6.3 2,974
District Aileu 2.5 181Ainaro 1.3 217Baucau 0.8 415Bobonaro 2.6 357Covalima 0.8 236Dili 4.4 797Ermera 0.6 491Lautem 0.2 308Liquiçá 0.8 252Manatuto 0.7 190Manufahi 0.0 137Oecussi 83.0 235Viqueque 0.9 260
Education No education 8.0 791Primary 9.0 1,046Secondary 4.5 2,009More than secondary 5.2 230
Wealth quintile Lowest 13.0 728Second 5.7 781Middle 4.6 786Fourth 4.7 849Highest 4.8 932
Total 15-49 6.4 4,076
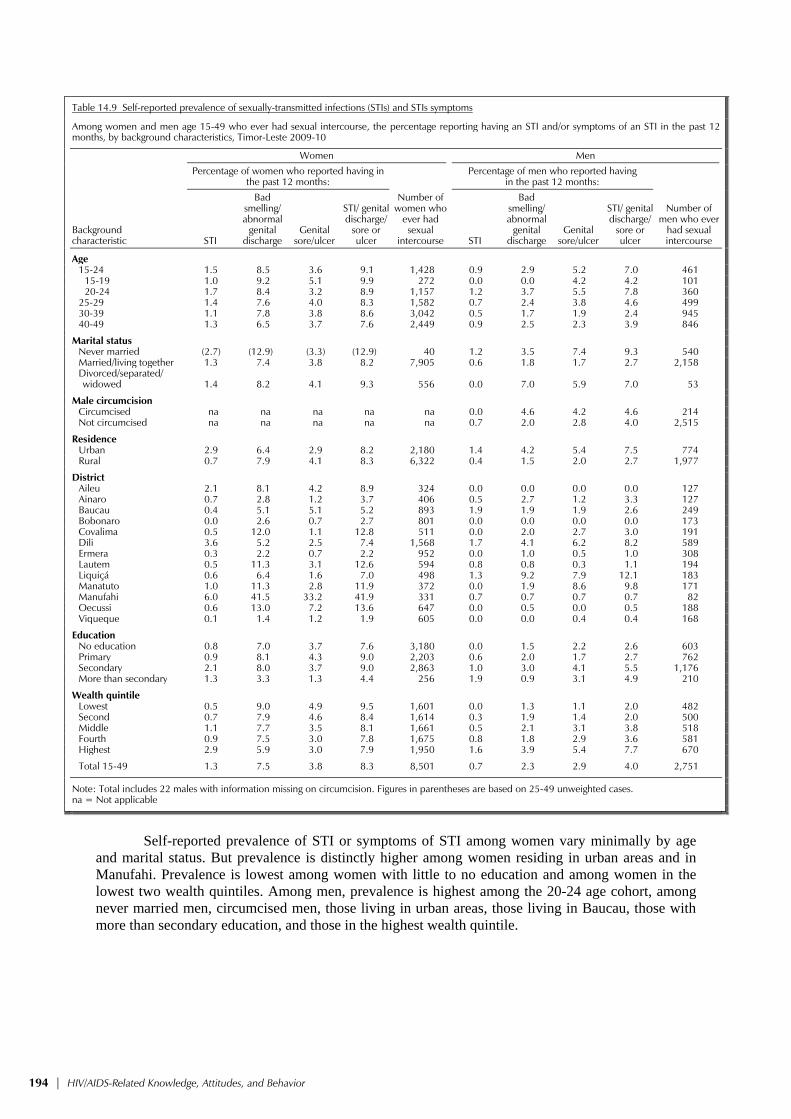
194 | HIV/AIDS-Related Knowledge, Attitudes, and Behavior
Table 14.9 Self-reported prevalence of sexually-transmitted infections (STIs) and STIs symptoms
Among women and men age 15-49 who ever had sexual intercourse, the percentage reporting having an STI and/or symptoms of an STI in the past 12 months, by background characteristics, Timor-Leste 2009-10
Background characteristic
Women Men
Percentage of women who reported having in
the past 12 months:
Number of women who
ever had sexual
intercourse
Percentage of men who reported having in the past 12 months:
Number of men who ever
had sexual intercourse STI
Bad smelling/ abnormal
genital discharge
Genital sore/ulcer
STI/ genital discharge/
sore or ulcer STI
Bad smelling/ abnormal
genital discharge
Genital sore/ulcer
STI/ genital discharge/
sore or ulcer
Age 15-24 1.5 8.5 3.6 9.1 1,428 0.9 2.9 5.2 7.0 461 15-19 1.0 9.2 5.1 9.9 272 0.0 0.0 4.2 4.2 101 20-24 1.7 8.4 3.2 8.9 1,157 1.2 3.7 5.5 7.8 360 25-29 1.4 7.6 4.0 8.3 1,582 0.7 2.4 3.8 4.6 499 30-39 1.1 7.8 3.8 8.6 3,042 0.5 1.7 1.9 2.4 945 40-49 1.3 6.5 3.7 7.6 2,449 0.9 2.5 2.3 3.9 846
Marital status Never married (2.7) (12.9) (3.3) (12.9) 40 1.2 3.5 7.4 9.3 540 Married/living together 1.3 7.4 3.8 8.2 7,905 0.6 1.8 1.7 2.7 2,158
Divorced/separated/ widowed 1.4 8.2 4.1 9.3 556 0.0 7.0 5.9 7.0 53
Male circumcision Circumcised na na na na na 0.0 4.6 4.2 4.6 214 Not circumcised na na na na na 0.7 2.0 2.8 4.0 2,515
Residence Urban 2.9 6.4 2.9 8.2 2,180 1.4 4.2 5.4 7.5 774 Rural 0.7 7.9 4.1 8.3 6,322 0.4 1.5 2.0 2.7 1,977
District Aileu 2.1 8.1 4.2 8.9 324 0.0 0.0 0.0 0.0 127 Ainaro 0.7 2.8 1.2 3.7 406 0.5 2.7 1.2 3.3 127 Baucau 0.4 5.1 5.1 5.2 893 1.9 1.9 1.9 2.6 249 Bobonaro 0.0 2.6 0.7 2.7 801 0.0 0.0 0.0 0.0 173 Covalima 0.5 12.0 1.1 12.8 511 0.0 2.0 2.7 3.0 191 Dili 3.6 5.2 2.5 7.4 1,568 1.7 4.1 6.2 8.2 589 Ermera 0.3 2.2 0.7 2.2 952 0.0 1.0 0.5 1.0 308 Lautem 0.5 11.3 3.1 12.6 594 0.8 0.8 0.3 1.1 194 Liquiçá 0.6 6.4 1.6 7.0 498 1.3 9.2 7.9 12.1 183 Manatuto 1.0 11.3 2.8 11.9 372 0.0 1.9 8.6 9.8 171 Manufahi 6.0 41.5 33.2 41.9 331 0.7 0.7 0.7 0.7 82 Oecussi 0.6 13.0 7.2 13.6 647 0.0 0.5 0.0 0.5 188 Viqueque 0.1 1.4 1.2 1.9 605 0.0 0.0 0.4 0.4 168
Education No education 0.8 7.0 3.7 7.6 3,180 0.0 1.5 2.2 2.6 603 Primary 0.9 8.1 4.3 9.0 2,203 0.6 2.0 1.7 2.7 762 Secondary 2.1 8.0 3.7 9.0 2,863 1.0 3.0 4.1 5.5 1,176 More than secondary 1.3 3.3 1.3 4.4 256 1.9 0.9 3.1 4.9 210
Wealth quintile Lowest 0.5 9.0 4.9 9.5 1,601 0.0 1.3 1.1 2.0 482 Second 0.7 7.9 4.6 8.4 1,614 0.3 1.9 1.4 2.0 500 Middle 1.1 7.7 3.5 8.1 1,661 0.5 2.1 3.1 3.8 518 Fourth 0.9 7.5 3.0 7.8 1,675 0.8 1.8 2.9 3.6 581 Highest 2.9 5.9 3.0 7.9 1,950 1.6 3.9 5.4 7.7 670
Total 15-49 1.3 7.5 3.8 8.3 8,501 0.7 2.3 2.9 4.0 2,751
Note: Total includes 22 males with information missing on circumcision. Figures in parentheses are based on 25-49 unweighted cases. na = Not applicable
Self-reported prevalence of STI or symptoms of STI among women vary minimally by age
and marital status. But prevalence is distinctly higher among women residing in urban areas and in Manufahi. Prevalence is lowest among women with little to no education and among women in the lowest two wealth quintiles. Among men, prevalence is highest among the 20-24 age cohort, among never married men, circumcised men, those living in urban areas, those living in Baucau, those with more than secondary education, and those in the highest wealth quintile.
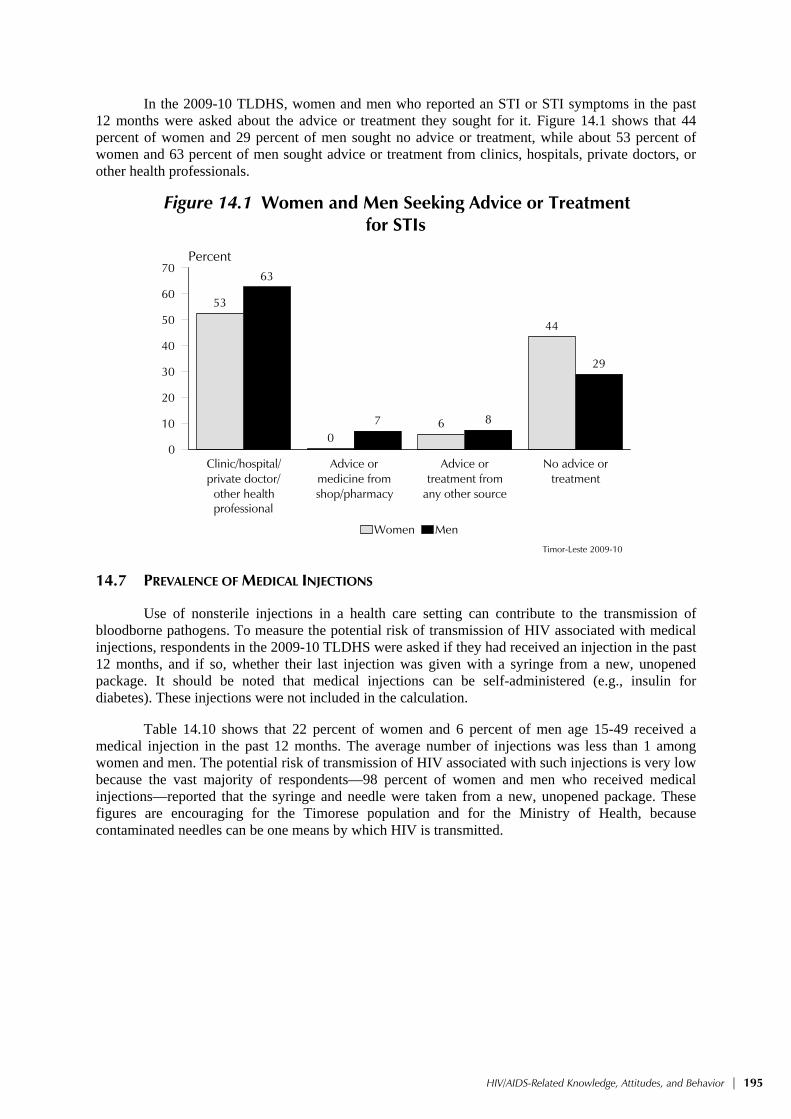
HIV/AIDS-Related Knowledge, Attitudes, and Behavior | 195
In the 2009-10 TLDHS, women and men who reported an STI or STI symptoms in the past 12 months were asked about the advice or treatment they sought for it. Figure 14.1 shows that 44 percent of women and 29 percent of men sought no advice or treatment, while about 53 percent of women and 63 percent of men sought advice or treatment from clinics, hospitals, private doctors, or other health professionals.
Figure 14.1 Women and Men Seeking Advice or Treatment for STIs
53
06
44
63
7 8
29
Clinic/hospital/private doctor/
other healthprof
Advice ormedicine fromshop/pharmacy
Advice ortreatment from
any other source
No advice ortreatment
0
10
20
30
40
50
60
70Percent
Women Men
Timor-Leste 2009-10
professional
14.7 PREVALENCE OF MEDICAL INJECTIONS
Use of nonsterile injections in a health care setting can contribute to the transmission of bloodborne pathogens. To measure the potential risk of transmission of HIV associated with medical injections, respondents in the 2009-10 TLDHS were asked if they had received an injection in the past 12 months, and if so, whether their last injection was given with a syringe from a new, unopened package. It should be noted that medical injections can be self-administered (e.g., insulin for diabetes). These injections were not included in the calculation.
Table 14.10 shows that 22 percent of women and 6 percent of men age 15-49 received a medical injection in the past 12 months. The average number of injections was less than 1 among women and men. The potential risk of transmission of HIV associated with such injections is very low because the vast majority of respondents—98 percent of women and men who received medical injections—reported that the syringe and needle were taken from a new, unopened package. These figures are encouraging for the Timorese population and for the Ministry of Health, because contaminated needles can be one means by which HIV is transmitted.

196 | HIV/AIDS-Related Knowledge, Attitudes, and Behavior
Table 14.10 Prevalence of medical injections
Percentage of women and men age 15-49 who received at least one medical injection in the last 12 months, the average number of medical injections per person in the last 12 months, and among those who received a medical injection, the percentage of last medical injections for which the syringe and needle were taken from a new, unopened package, by background characteristics, Timor-Leste 2009-10
Background characteristic
Women Men
Percentage who received
a medical injection in
the last 12 months
Average number of medical
injections per person in the last
12 months Number of
women
For last injection,
syringe and needle taken from a new, unopened package
Number of respondents
receiving medical
injections in the last
12 months
Percentage who
received a medical
injection in the last
12 months
Average number of medical
injections per person inthe last
12 months Number of
men
For last injection,
syringe and needle taken from a new, unopened package
Number of respondents
receiving medical
injections in the last
12 months
Age 15-24 22.5 0.5 5,487 98.5 1,233 5.1 0.1 1,636 100.0 83 15-19 22.6 0.5 3,144 98.7 712 4.0 0.1 994 (100.0) 40 20-24 22.3 0.5 2,343 98.2 522 6.7 0.2 643 100.0 43 25-29 20.9 0.8 1,897 99.1 396 6.8 0.2 586 (100.0) 40 30-39 22.7 1.0 3,219 97.5 729 7.5 0.2 992 95.3 74 40-49 19.7 1.0 2,534 97.6 499 6.6 0.2 861 96.6 57
Residence Urban 18.4 0.4 3,439 98.6 633 9.5 0.3 1,102 98.1 104 Rural 22.9 0.9 9,698 98.1 2,225 5.0 0.1 2,974 97.7 150
District Aileu 53.6 1.0 554 98.9 297 8.2 0.1 181 * 15 Ainaro 14.8 0.3 619 99.4 92 1.5 0.0 217 * 3 Baucau 16.9 0.3 1,408 93.8 239 0.8 0.0 415 * 3 Bobonaro 5.5 2.9 1,262 96.1 69 0.0 0.0 357 * 0 Covalima 18.7 0.5 781 98.8 146 11.4 0.3 236 (100.0) 27 Dili 12.8 0.3 2,466 97.8 315 11.2 0.3 797 (96.2) 89 Ermera 3.0 0.1 1,542 (95.3) 45 1.2 0.0 491 * 6 Lautem 15.6 0.3 864 98.1 135 4.9 0.4 308 * 15 Liquiçá 60.3 1.6 801 99.1 483 4.6 0.1 252 * 12 Manatuto 35.0 1.0 603 98.8 211 30.9 0.9 190 99.1 59 Manufahi 30.1 0.7 470 100.0 142 3.7 0.0 137 * 5 Oecussi 68.0 1.7 884 98.5 601 8.6 0.2 235 * 20 Viqueque 9.3 0.2 882 97.5 82 0.0 0.0 260 * 0
Education No education 20.2 0.8 3,854 97.4 780 3.1 0.1 791 (93.8) 25 Primary 24.1 1.0 3,005 98.4 725 5.4 0.1 1,046 100.0 56 Secondary 22.0 0.6 5,829 98.4 1,284 7.2 0.2 2,009 98.7 145 More than secondary 15.3 0.4 449 100.0 69 11.9 0.3 230 * 27
Wealth quintile Lowest 27.4 0.7 2,314 98.3 635 3.6 0.1 728 (96.4) 26 Second 21.8 1.1 2,468 98.9 538 3.6 0.1 781 (100.0) 28 Middle 20.6 0.7 2,590 98.0 534 4.9 0.1 786 100.0 39 Fourth 21.7 0.9 2,687 97.6 584 6.2 0.2 849 98.9 53 Highest 18.4 0.6 3,077 98.0 567 11.6 0.4 932 96.4 108
Total 15-49 21.8 0.8 13,137 98.2 2,858 6.2 0.2 4,076 97.9 254
Note: Medical injections are those given by a doctor, nurse, pharmacist, dentist or other health worker. Figures in parentheses are based on 25-49 unweighted cases. An asterisk indicates that a figure is based on fewer than 25 unweighted cases and has been suppressed.
There are small variations by age in the likelihood of receiving an injection in the past 12
months among women, but among men it is highest among those age 30-39 (8 percent) and lowest among those age 15-19 (4 percent). The likelihood of receiving an injection in the past 12 months is higher among rural than urban women, but the reverse is true for men. It is highest among women with primary education and among women in the lowest wealth quintile, but highest among men with more than secondary education and men in the highest wealth quintile. Use of injections is highest among women residing in Oecussi and men in Manatuto.
Respondents who had received an injection in the past 12 months were asked where they obtained their last injection. About two in three women (64 percent) and four in five men (83 percent) age 15-49 received their last medical injection from a public sector facility; 5 percent of women and 9 percent of men received their last injection from a private medical facility (Figure 14.2). Within the public sector, women are most likely to obtain their last medical injection at community health centers, while men are most likely to receive theirs from government hospitals.

HIV/AIDS-Related Knowledge, Attitudes, and Behavior | 197
Figure 14.2 Source of Last Medical Injection
64
1726
19
3 5 4 111 14
7
83
3830
16
09 7
17
0 1
Total
public
med
ical
Govern
ment h
ospit
al
Commun
ity he
alth c
enter
Health
post
Other p
ublic
Total
priva
te med
ical
Priva
te ho
spita
l/clin
ic/do
ctor
Other p
rivate
med
ical
Home
Scho
ol
Other
0
20
40
60
80
100Percent
Women Men
Timor-Leste 2009-10
14.8 HIV/AIDS-RELATED KNOWLEDGE AND BEHAVIOR AMONG YOUTH
Knowledge of HIV/AIDS issues and related sexual behavior among youth age 15-24 is of particular interest because the period between sexual initiation and marriage is for many young people a time of sexual experimentation that may involve high-risk behaviors. This section considers a number of issues that relate to both transmission and prevention of HIV/AIDS among youth, including the extent to which youth have comprehensive knowledge of HIV/AIDS transmission and prevention modes and knowledge of a source where they can obtain condoms. Issues such as abstinence, age at sexual debut, and condom use are also covered in this section.
HIV programming for young people is complex. Social norms place value on sexual abstinence in Timor-Leste. To reinforce these norms, HIV programs targeted at youth must include a strong emphasis on the development of life skills. Youths, especially young women, need skills in assertiveness and negotiation if they are to take actions based on informed decision-making. It is important to educate young people regarding condom use to prevent the risk of HIV and other STI transmission (MOH, 2006).
14.8.1 Comprehensive Knowledge about HIV/AIDS and Source for Condoms
Knowledge of how HIV is transmitted is crucial for enabling young people to avoid HIV infection. Table 14.11 shows that only 12 percent of women and 20 percent of men age 15-24 have comprehensive knowledge about HIV/AIDS. The level of comprehensive knowledge about HIV/ AIDS does not vary greatly by marital status within the male population. Among young women, comprehensive knowledge is higher among those who have never been married than among those ever-married. Comprehensive knowledge increases with age, as both men and women age 20-24 have a higher level of comprehensive knowledge of HIV compared to those age 15-19.
Not surprisingly, comprehensive knowledge is higher among urban women (14 percent) than rural women (12 percent) and is twice as high among urban men as among rural men (34 percent and 15 percent, respectively). One in four young women in Baucau has comprehensive knowledge compared with less than 3 percent of young women in Ainaro. Comprehensive knowledge is relatively higher among young men in Manatuto (62 percent). Comprehensive knowledge generally rises with education and wealth quintile among both women and men.

198 | HIV/AIDS-Related Knowledge, Attitudes, and Behavior
Because of the important role that condoms play in preventing the transmission of HIV, respondents were asked whether they know of a source of condoms. Only responses about “formal” sources were counted, that is, sources other than friends, family members, and home.
Table 14.11 Comprehensive knowledge about AIDS and of a source of condoms among youth
Percentage of young women and young men age 15-24 with comprehensive knowledge about AIDS and percentage with knowledge of a source of condoms, by background characteristics, Timor-Leste 2009-10
Background characteristic
Women age 15-24 Men age 15-24
Percentage with comprehensive knowledge of
AIDS1
Percentage who know a condom
source2 Number of
women
Percentage with comprehensive knowledge of
AIDS1
Percentage who know a condom
source2 Number of
men
Age 15-19 11.2 10.6 3,144 14.7 26.0 994 15-17 9.8 9.1 1,980 13.1 20.9 626 18-19 13.7 13.2 1,164 17.3 34.8 367 20-24 13.5 15.4 2,343 27.4 41.8 643 20-22 14.2 14.5 1,476 28.3 41.6 411 23-24 12.4 16.9 867 25.8 42.0 232
Marital status Never married 13.4 13.1 4,081 19.7 32.1 1,504 Ever had sex (8.8) (16.6) 23 33.6 68.8 329 Never had sex 13.4 13.1 4,058 15.8 21.9 1,175 Ever married 8.7 11.3 1,406 19.4 33.2 132
Residence Urban 14.0 18.2 1,456 33.5 37.3 431 Rural 11.6 10.7 4,031 14.7 30.4 1,205
District Aileu 10.1 9.6 270 13.8 22.4 76 Ainaro 2.5 9.0 250 3.1 33.1 92 Baucau 24.8 6.9 584 2.1 4.8 151 Bobonaro 6.6 10.6 567 24.1 31.3 161 Covalima 13.8 26.5 341 4.9 73.5 96 Dili 12.6 15.5 1,018 40.0 34.3 296 Ermera 9.3 1.6 673 2.6 22.1 244 Lautem 13.5 28.4 343 19.0 29.4 134 Liquiçá 10.5 10.5 351 24.9 29.0 103 Manatuto 12.0 25.3 267 61.8 98.0 80 Manufahi 20.9 20.6 195 46.4 16.2 53 Oecussi 4.2 10.9 300 5.8 38.3 63 Viqueque 14.5 3.7 328 9.3 17.6 86
Education No education 3.6 2.7 736 2.7 11.0 192 Primary 4.4 4.5 1,112 6.8 17.0 336 Secondary 15.6 16.3 3,475 25.6 39.6 1,073 More than secondary 31.0 36.2 164 (55.6) (67.8) 34
Wealth quintile Lowest 8.9 8.1 879 11.4 24.2 289 Second 10.8 6.9 1,031 11.1 25.8 317 Middle 9.7 10.0 1,134 17.8 30.0 327 Fourth 14.5 16.4 1,204 20.8 40.9 351 Highest 15.8 19.5 1,239 34.6 38.0 352
Total 12.2 12.7 5,487 19.7 32.2 1,636
Note: Figures in parentheses are based on 25-49 unweighted cases.1 Comprehensive knowledge means knowing that consistent use of condom during sexual intercourse and having just one uninfected faithful partner can reduce the chance of getting the AIDS virus, knowing that a healthy-looking person can have the AIDS virus, and rejecting the two most common local misconceptions about AIDS transmission or prevention. The components of comprehensive knowledge are presented in Tables 14.2, 14.3.1, and 14.3.2. 2 For this table, the following responses are not considered sources for condoms: friends, family members, and home.
As shown in Table 14.11, young men are more than twice as likely as young women to know
where to obtain a condom (32 percent compared with 13 percent). Knowledge of a condom source among youth rises with age, is higher in urban than in rural areas, and varies positively with education and wealth. Young women in Lautem and young men in Manatuto are more likely than their counterparts to know of a source of condoms.

HIV/AIDS-Related Knowledge, Attitudes, and Behavior | 199
14.8.2 Age at First Sex and Condom Use at First Sexual Intercourse
Information from the 2009-10 TLDHS can be used to examine several important issues relating to the initiation of sexual activity among youth, including age at first sex and condom use at first sexual intercourse.
Table 14.12 shows the proportions of women and men in the 15-24 age cohort who had sex before age 15 and before age 18. Two percent of young women and less than one percent of young men had sex by age 15, while 15 percent of young women and 10 percent of young men had sex by age 18. The female-male difference in the age at first sexual debut is primarily due to the earlier age at marriage of women.
Table 14.12 Age at first sexual intercourse among youth
Percentage of young women and of young men age 15-24 who had sexual intercourse before age 15 and percentage of young women and of young men age 18-24 who had sexual intercourse before age 18, by background characteristics, Timor-Leste 2009-10
Background characteristic
Women age 15-24 Women age 18-24 Men age 15-24 Men age 18-24
Percentage who had sexual
intercourse before age 15
Number of women
Percentage who had sexual
intercourse before age 18
Number of women
Percentage who had
sexual intercourse
before age 15Number of
men
Percentage who had
sexual intercourse
before age 18 Number of
men
Age 15-19 1.1 3,144 na na 0.8 994 na na 15-17 0.9 1,980 na na 1.0 626 na na 18-19 1.5 1,164 12.4 1,164 0.6 367 12.4 367 20-24 2.7 2,343 16.8 2,343 0.1 643 9.2 643 20-22 1.9 1,476 15.9 1,476 0.1 411 10.5 411 23-24 4.2 867 18.4 867 0.0 232 6.9 232
Marital status Never married 0.0 4,081 0.4 2,161 0.6 1,504 9.5 878 Ever married 6.9 1,406 39.4 1,347 0.0 132 16.3 132
Knows condom source1 Yes 1.5 694 11.3 515 1.0 527 19.6 396 No 1.8 4,793 16.0 2,992 0.3 1,109 4.4 614
Residence Urban 1.9 1,456 11.7 1,015 0.7 431 11.0 286 Rural 1.7 4,031 16.9 2,492 0.5 1,205 10.1 724
District Aileu 1.6 270 13.9 158 0.8 76 7.1 54 Ainaro 1.0 250 17.0 157 0.0 92 4.2 46 Baucau 1.1 584 15.2 356 0.0 151 1.8 90 Bobonaro 3.2 567 16.9 368 0.0 161 1.4 95 Covalima 2.4 341 16.0 198 4.9 96 42.8 58 Dili 2.3 1,018 10.8 737 0.0 296 8.8 210 Ermera 0.3 673 13.8 415 0.2 244 4.9 156 Lautem 2.0 343 21.5 200 0.0 134 11.2 65 Liquiçá 1.2 351 13.7 231 2.2 103 21.3 65 Manatuto 1.2 267 15.2 166 0.7 80 24.8 48 Manufahi 1.5 195 14.4 135 0.0 53 3.5 33 Oecussi 3.1 300 26.6 192 0.0 63 (22.6) 37 Viqueque 2.2 328 17.7 195 0.0 86 5.0 53
Education No education 3.2 736 21.1 519 0.0 192 7.9 122 Primary 4.1 1,112 30.9 697 0.5 336 10.9 181 Secondary 0.9 3,475 10.0 2,130 0.6 1,073 10.7 674 More than secondary 0.0 164 0.6 162 0.0 34 (9.2) 33
Wealth quintile Lowest 2.6 879 21.8 520 0.9 289 9.2 161 Second 1.7 1,031 16.1 649 0.3 317 8.7 190 Middle 1.6 1,134 18.6 716 0.4 327 9.3 205 Fourth 2.3 1,204 13.4 807 0.3 351 12.5 236 Highest 1.0 1,239 9.8 815 0.9 352 11.5 218
Total 1.8 5,487 15.3 3,507 0.5 1,636 10.4 1,010
Note: Figures in parentheses are based on 25-49 unweighted cases.na = Not applicable 1 For this table, the following responses are not considered a source for condoms: friends, family members, and home.

200 | HIV/AIDS-Related Knowledge, Attitudes, and Behavior
Looking at the age patterns for young women, the proportion of women reporting that they had sex before age 15 and 18 are lower among those under age 20 than among those above age 20. Lower percentages of women age 18-19 had initiated sex before age 18 than women age 20-24. This likely reflects the effect of rising age at marriage, because a negligible proportion of never-married young women report that they had sex by age 15 or by age 18.
There are obvious differences in age at first sexual intercourse among youth by district, education, and wealth quintile. For example, 4 percent of young women with primary education had first sexual intercourse before the age of 15, and about 31 percent had initiated sexual intercourse before the age of 18. On the other hand, less than 1 percent of young men with primary and secondary education had sexual intercourse before the age of 15, and 11 percent before age 18.
Table 14.13 Condom use at first sexual intercourse among youth
Among young women and young men age 15-24 who have ever had sexual intercourse, percentage who used a condom the first time they had sexual intercourse, by background characteristics, Timor-Leste 2009-10
Background characteristic
Women age 15-24 Men age 15-24
Percentage who used a condom at first sexual intercourse
Number of women who
have ever had sexual
intercourse
Percentage who used a condom at first sexual intercourse
Number of men who have ever
had sexual intercourse
Age 15-19 3.1 272 6.8 101 15-17 4.9 63 5.1 38 18-19 2.6 209 7.8 62 20-24 1.7 1,157 10.4 360 20-22 1.4 613 9.4 204 23-24 2.0 544 11.6 156
Marital status Never married (4.9) 23 11.2 329 Ever married 1.9 1,406 5.4 132
Knows condom source1 Yes 3.2 162 14.8 270 No 1.8 1,266 2.2 191
Residence Urban 1.6 342 12.2 128 Rural 2.1 1,087 8.5 333
District Aileu 2.7 60 (17.8) 25 Ainaro 1.1 71 * 15 Baucau 3.7 142 * 22 Bobonaro 3.3 167 * 13 Covalima 0.0 86 8.3 51 Dili 1.7 232 14.3 98 Ermera 1.0 151 (15.1) 67 Lautem 1.7 91 (2.3) 23 Liquiçá 0.8 92 3.4 45 Manatuto 2.3 71 4.8 62 Manufahi 4.8 72 * 9 Oecussi 0.0 97 * 20 Viqueque 2.1 96 * 12
Education No education 1.8 264 3.4 44 Primary 3.2 419 2.8 87 Secondary 1.4 717 10.2 303 More than secondary 0.0 29 * 27
Wealth quintile Lowest 2.8 243 7.0 64 Second 2.5 295 5.1 75 Middle 1.1 324 11.1 94 Fourth 1.7 319 12.6 114 Highest 2.1 247 9.6 114
Total 2.0 1,428 9.6 461
Note: Figures in parentheses are based on 25-49 unweighted cases. An asterisk indicated that a figure is based on fewer than 25 cases and has been suppressed. 1 For this table, the following responses are not considered a source for condoms: friends, family members, and home.

HIV/AIDS-Related Knowledge, Attitudes, and Behavior | 201
To assess the extent of condom use at first sexual exposure, respondents age 15-24 who had ever had sex were asked whether they had used condoms the first time they had sex. Table 14.13 shows that only 2 percent of young women and 10 percent of young men had used condoms during their first sexual encounter. Never-married male youth were much more likely than ever-married male youth to have used a condom. Among male youth, higher educational attainment, greater wealth, and urban residence are related to the higher use of condoms during the first sexual intercourse. Differences among young women by background characteristics are small.
14.8.3 Recent Sexual Activity among Never-married Youth
The period between age at first sex and age at first marriage is often a time of sexual experimentation, which can increase the risk of contracting HIV. Table 14.14 presents data on the percentage of never-mar-ried young men age 15-24 who had not yet engaged in sex and the percentage who had had sex in the 12 months preceding the sur-vey. Data for young women is not shown separately because almost all never-married women report not having had sex.
The table shows that about 78 per-cent of never-married young men have never had sexual intercourse. As a consequence, among male youth, the proportions reporting sexual activity within the 12-month period before the survey are relatively low (about 15 percent). About 12 percent of never-married young men reporting recent sexual activity in the past 12 months said that they used a condom the last time they had sex (data not shown). Prema-rital sexual intercourse among young men is higher at older ages, in urban areas, in Manatuto, among highly educated youth, and among those in the wealthiest quintiles.
14.8.4 Drunkenness during Sex among Young Adults
Engaging in sexual intercourse while under the influence of alcohol can impair judgment, compromise power relations, and increase risky sexual behavior. Respondents who had sex in the 12 months preceding the survey were asked (for each partner) if they or their partner drank alcohol the last time they had sexual intercourse with that partner, and whether they or their partner was drunk. As shown in Table 14.15, very few young people (less than 1 percent of women and men) reported being drunk during their last sexual intercourse and less than 1 percent each of young women and men said that either they or their partners were drunk. There is little variation by background characteristics of respondents.
Table 14.14 Premarital sexual intercourse during premarital sexual intercourse among youth
Among never-married men age 15-24, the percentage who have never had sexual intercourse and the percentage who had sexual intercourse in the past 12 months, by background characteristics, Timor-Leste 2009-10
Background characteristic
Percentage who have never had
sexual intercourse
Men Percentage who had sexual
intercourse in the past 12
months
Number of never- married
men
Age 15-19 90.2 7.1 990
15-17 93.9 4.2 62618-19 83.8 12.1 364
20-24 54.9 29.5 51520-22 58.8 27.0 35223-24 46.6 34.8 162
Knows condom source1 Yes 53.2 35.6 484No 90.0 4.9 1,021
Residence Urban 75.3 17.4 402Rural 79.2 13.8 1,102
District Aileu 71.1 10.0 71Ainaro 89.3 4.9 87Baucau 97.6 1.2 132Bobonaro 100.0 0.0 148Covalima 49.7 40.0 91Dili 72.9 20.6 272Ermera 78.2 10.9 228Lautem 85.7 9.2 130Liquiçá 61.9 16.6 95Manatuto 25.4 73.9 74Manufahi 95.4 0.0 46Oecussi 76.0 17.2 57Viqueque 97.8 0.0 76
Education No education 86.4 11.2 171Primary 84.3 10.8 296Secondary 76.8 15.2 1,004More than secondary (22.9) (53.5) 34
Wealth quintile Lowest 83.9 10.9 268Second 84.6 9.6 286Middle 78.8 15.1 296Fourth 73.2 15.0 323Highest 72.1 21.8 331
Total 78.1 14.8 1,504
1 For this table, the following responses are not considered a source for condoms: friends, family members and home.

202 | HIV/AIDS-Related Knowledge, Attitudes, and Behavior
Table 14.15 Drunkenness during sexual intercourse among youth
Among all young women and young men age 15-24, the percentage who had sexual intercourse in the past 12 months while being drunk and the percentage who had sexual intercourse in the past 12 months when drunk or with a partner who was drunk, by background characteristics, Timor-Leste 2009-10
Background characteristic
Women age 15-24 Men age 15-24
Percentage who had sexual
intercourse in the past 12 months
when drunk
Percentage who had sexual
intercourse in the past 12 months when drunk or with a partner who was drunk
Number of women
Percentage who had sexual
intercourse in the past 12 months
when drunk
Percentage who had sexual
intercourse in the past 12 months when drunk or with a partner who was drunk
Number of men
Age 15-19 0.0 0.5 3,144 0.2 0.2 994 15-17 0.0 0.3 1,980 0.3 0.3 626 18-19 0.1 0.7 1,164 0.2 0.2 367 20-24 0.1 1.1 2,343 1.5 1.8 643 20-22 0.0 0.9 1,476 1.7 1.7 411 23-24 0.2 1.4 867 1.1 1.9 232
Marital status Never married 0.0 0.0 4,081 0.7 0.7 1,504 Ever married 0.2 2.8 1,406 0.6 2.1 132
Knows condom source1 Yes 0.0 0.8 694 1.6 1.6 527 No 0.1 0.7 4,793 0.3 0.5 1,109
Residence Urban 0.0 0.4 1,456 1.5 2.0 431 Rural 0.1 0.8 4,031 0.4 0.4 1,205
District Aileu 0.0 0.0 270 0.0 0.0 76 Ainaro 0.3 0.5 250 0.6 0.6 92 Baucau 0.3 0.6 584 0.0 0.0 151 Bobonaro 0.0 0.0 567 0.0 0.0 161 Covalima 0.0 0.3 341 0.0 0.0 96 Dili 0.0 0.2 1,018 1.3 2.0 296 Ermera 0.0 0.0 673 0.8 0.8 244 Lautem 0.0 0.3 343 0.0 0.0 134 Liquiçá 0.0 0.7 351 2.6 2.6 103 Manatuto 0.0 0.2 267 3.0 3.0 80 Manufahi 0.0 5.3 195 0.0 0.0 53 Oecussi 0.2 5.4 300 0.0 0.0 63 Viqueque 0.0 0.3 328 0.0 0.0 86
Education No education 0.1 1.3 736 0.8 0.8 192 Primary 0.2 1.4 1,112 0.4 0.4 336 Secondary 0.0 0.4 3,475 0.6 0.8 1,073 More than secondary 0.0 0.0 164 (5.7) (5.7) 34
Wealth quintile Lowest 0.1 1.8 879 0.2 0.2 289 Second 0.1 0.7 1,031 0.2 0.2 317 Middle 0.0 0.4 1,134 0.6 0.6 327 Fourth 0.1 0.6 1,204 0.2 0.2 351 Highest 0.0 0.3 1,239 2.1 2.7 352
Total 15-24 0.1 0.7 5,487 0.7 0.8 1,636
Note: Figures in parentheses are based on 25-49 unweighted cases.1 For this table, the following responses are not considered a source for condoms: friends, family members, and home.

Women’s Empowerment and Demographic and Health Outcomes | 203
WOMEN’S EMPOWERMENT AND DEMOGRAPHIC AND HEALTH OUTCOMES 15
This chapter highlights information on additional indicators of women’s empowerment, other than education and employment, and relates those indices to demographic and health outcomes. Timorese society assigns strict gender roles for men and women that lead to discriminatory practices against women. In daily life, cultural norms in Timor-Leste assign the dominant role to men (patriarchal system) in planning or making decisions where tradition and customary law favors men over women. As a consequence, women lag behind men in educational attainment, literacy, and exposure to mass media, which are critical to women’s empowerment and can exert considerable influence on their development and their ability to strengthen their position within the household and in society in general. In addition, the existing patriarchal system, which is prevalent in Southeast Asia, undermines women vis-à-vis men and subsumes their contribution to society even when they are educated or come from wealthy households (Kandiyoti, 1988). As women’s involvement in the nondomestic sphere lessens, they become more dependent on men economically, which exacerbates their inability to participate in the decisionmaking process in the household. On the other hand, women in economically poor households are driven outside the domestic sphere in search of employment to fulfill their economic needs, which could in turn give them some degree of independence and role in the decisionmaking process (Kandiyoti, 1988).
As discussed in Chapter 3, data from the 2009-10 TLDHS show that men have higher
educational attainment at all levels than women, that greater proportions of men than women are literate, and that men are more likely to be currently employed than women. In addition, the data show that women who belong to households in the highest wealth quintile are less likely to be employed. In this chapter, we examine other factors that empower women, such as women’s control over their own cash earnings and that of their husband’s, their participation in decisionmaking, their acceptance of wife beating, and their attitude toward the right of women to refuse sexual intercourse with their husband. These data are used in the estimation of empowerment indicators and the extent to which women’s empowerment influences health outcomes (such as their reproductive health care practices, contraceptive use, and unmet need).
15.1 EMPLOYMENT AND FORM OF EARNINGS
Table 15.1 shows the percentage of currently married women and men age 15-49 who were employed in the 12 months before the survey and the percent distribution of the employed respondents by type of earnings they received (cash, in-kind, both, or neither). Forty-four percent of currently married women reported being employed in the past 12 months. The percentage of currently married women who were employed increases with age up to 56 percent for women age 45-49.
Although employment is assumed to go hand in hand with payment for work, not all women receive earnings for the work they do, and even among women who do receive earnings, not all are paid in cash. Only about one in five employed women (19 percent) receives payment in cash, and less than 1 percent receive both cash and payment in-kind. One percent receive payment in-kind only. Four in five employed women do not receive any form of payment for their work. As discussed in Chapter 3, these women are mostly involved in agricultural work and are predominantly working for a family member or are self-employed.

204 | Women’s Empowerment and Demographic and Health Outcomes
Table 15.1 Employment and cash earnings of currently married women and men
Percentage of currently married women and men age 15-49 who were employed at any time in the past 12 months and the percent distribution of currently married women and men employed in the past 12 months by type of earnings, according to age, Timor-Leste 2009-10
Among currently married respondents:
Percent distribution of currently married respondents employed in the past 12 months, by type of earnings
Age Percentage employed
Number of respondents
Cash only
Cash and in-kind
In-kind only
Not paid Missing Total
Number of respondents
WOMEN
15-19 30.1 243 5.6 1.3 2.1 90.9 0.0 100.0 73 20-24 31.1 1,100 16.9 1.3 0.4 81.5 0.0 100.0 342 25-29 36.5 1,516 21.4 1.2 1.6 75.4 0.4 100.0 553 30-34 42.4 1,362 22.9 0.5 0.8 75.8 0.0 100.0 578 35-39 47.4 1,514 19.7 0.7 1.2 78.4 0.0 100.0 718 40-44 54.4 1,211 16.7 0.7 1.2 81.5 0.0 100.0 659 45-49 55.7 960 14.8 0.8 0.7 83.7 0.0 100.0 535
Total 15-49 43.7 7,906 18.6 0.8 1.1 79.5 0.1 100.0 3,458
MEN
15-19 * 4 * * * * * * 4 20-24 98.5 125 24.5 0.4 0.8 74.3 0.0 100.0 123 25-29 97.8 359 38.9 0.2 0.8 60.2 0.0 100.0 351 30-34 97.5 368 38.6 0.5 0.8 60.1 0.0 100.0 358 35-39 96.7 492 34.7 0.8 1.1 63.3 0.2 100.0 476 40-44 97.7 433 33.4 0.5 1.2 64.8 0.0 100.0 424 45-49 96.8 378 24.9 0.9 0.5 73.6 0.0 100.0 366
Total 15-49 97.3 2,158 33.4 0.6 0.9 65.0 0.0 100.0 2,101
Note: Total includes 4 men age 15-19 not shown separately.
Table 15.1 also shows that nearly all men age 15-49 were involved in some type of work in
the 12 months preceding the survey. Men are more likely to receive cash for their work than women. About one in three men (33 percent) receive cash only for their work, less than 1 percent receive cash and payment in-kind, less than 1 percent are paid in-kind only, and 65 percent do not receive any payment for their work. This is again because a large proportion of men are involved in agricultural work and self-employed. Payment in-kind is not common in Timor-Leste.
15.2 CONTROL OVER AND RELATIVE MAGNITUDE OF WOMEN’S EARNINGS
In addition to having access to income, women need to be able to have control over their earnings in order to be empowered. As a means to assess this, currently married women who earned cash for their work in the 12 months preceding the survey were asked who the main decisionmaker is with regard to the use of their earnings. Women’s perception on the magnitude of their earnings relative to those of their husband is also explored as another measure of their empowerment.
Those data are presented in Table 15.2.1. More than one-third (36 percent) of currently married women who receive cash earnings report that they alone decide how their earnings are used, while more than half (58 percent) say that they decide jointly with their husband. Only 6 percent of women report that their husband alone decides how their earnings will be used. The proportion of currently married women who say that they decide by themselves how their earnings are used tripled from 12 percent in 2003 to the current level of 36 percent. On the other hand, the percentage of currently married women who say that they jointly decide with their husband decreased from 79 percent in the 2003 DHS to 58 percent in 2009-10, and those reporting that only husbands decide also decreased (8 percent and 6 percent, respectively).

Women’s Empowerment and Demographic and Health Outcomes | 205
Table 15.2.1 Control over women’s cash earnings and relative magnitude of women’s earnings: Women
Percent distribution of currently married women age 15-49 who received cash earnings for employment in the 12 months preceding the survey by person who decides how wife’s cash earnings are used and by whether she earned more or less than her husband, according to background characteristics, Timor-Leste 2009-10
Person who decides how wife’s cash earnings are
used:
Wife’s cash earnings compared with
husband's cash earnings:
Background characteristic
Mainly wife
Wife and
husband jointly
Mainly husband Total More Less
About the
same
Husband/ partner has no
earnings
Don’t know/ Missing Total
Number of
women
Age 20-24 24.8 62.7 12.5 100.0 41.6 28.1 15.5 10.1 4.7 100.0 62 25-29 40.5 55.0 4.4 100.0 26.7 36.5 21.0 14.5 1.3 100.0 125 30-34 33.3 62.0 4.7 100.0 24.6 34.4 31.7 8.7 0.6 100.0 135 35-39 38.9 56.6 4.4 100.0 18.9 41.2 26.2 12.9 0.8 100.0 147 40-44 35.7 58.2 6.1 100.0 22.4 35.1 33.7 8.8 0.0 100.0 115 45-49 39.2 56.3 4.5 100.0 33.2 26.5 27.4 7.6 5.2 100.0 83
Number of living children
0 35.8 58.1 6.1 100.0 26.4 34.5 24.4 13.0 1.8 100.0 55 1-2 33.3 58.6 8.0 100.0 32.7 29.5 23.3 12.1 2.4 100.0 186 3-4 42.8 54.4 2.9 100.0 24.0 38.7 28.4 8.2 0.7 100.0 232 5+ 31.8 62.1 6.0 100.0 21.8 36.2 28.1 12.0 1.9 100.0 199
Residence Urban 41.6 54.3 4.1 100.0 26.8 37.7 26.9 7.7 0.9 100.0 344 Rural 30.9 62.2 6.9 100.0 25.0 32.3 26.2 14.1 2.3 100.0 328
Education No education 41.8 44.7 13.5 100.0 18.1 27.6 34.5 15.5 4.3 100.0 92 Primary 36.7 58.8 4.4 100.0 28.9 40.3 20.6 8.0 2.3 100.0 83 Secondary 36.2 59.5 4.3 100.0 26.7 37.2 25.2 9.6 1.3 100.0 376 More than secondary 32.5 63.7 3.8 100.0 27.4 30.6 28.9 13.1 0.0 100.0 121
Wealth quintile Lowest (40.4) (56.3) (3.4) 100.0 (11.2) (29.1) (34.8) (18.7) 6.2 100.0 47 Second (37.5) (52.5) (10.0) 100.0 (33.8) (34.3) (15.0) (11.9) 5.0 100.0 52 Middle 31.3 60.3 8.5 100.0 25.1 40.0 18.1 14.5 2.3 100.0 66 Fourth 26.5 65.7 7.7 100.0 25.9 36.1 19.8 17.1 1.0 100.0 117 Highest 39.5 56.5 4.0 100.0 26.8 34.7 30.6 7.2 0.7 100.0 391 Total 36.4 58.2 5.5 100.0 25.9 35.1 26.6 10.8 1.6 100.0 672
Note: Figures in parentheses are based on 25-49 unweighted cases. Total includes 5 women age 15-19 not shown separately.
Younger Timorese women are less likely to be involved in how their cash earnings are spent,
and this may be attributed to their young age at marriage (20-24). It is also interesting to note that older women (age 45-49) are more likely to decide how their cash earnings are spent relative to younger women, although women in the age group 25-29 seem to be more empowered perhaps due to the fact that they are more highly educated and employed in the lucrative sales and services sector (see Chapter 3). Women with five or more children are less likely to decide on their own how their earnings will be used than women with three to four children and those with no children. On the other hand, 62 percent of currently married women with five or more children make joint decisions with their husbands.
Urban women are much more independent in making decisions than rural women (42 percent
and 31 percent, respectively). Alternatively, rural women are more likely than urban women to report that they make this decision jointly with their husband (62 percent versus 54 percent).
However, as education increases, women are less likely to make sole decisions and more likely to make joint decisions about how their cash earnings are spent. This finding reaffirms that education by itself does not guarantee empowerment for women who live in a patriarchal society (Acharya, 2010). It will be interesting to see if this pattern surfaces in the discussion of the relationship between education and domestic violence in the next chapter.

206 | Women’s Empowerment and Demographic and Health Outcomes
Women’s perception of how much they earn vis-à-vis their husband could also impact how empowered they feel. Thirty-five percent of women believe that they earn less than their husband, 27 percent believe that they earn as much as their husband, and 26 percent believe that they earn more.
Women age 20-24, women with any education, women with fewer children, women in the
highest wealth quintile, and urban women are more likely than their counterparts to report that they believe that they earn more than their husbands.
15.3 CONTROL OVER MEN’S CASH EARNINGS
Currently married men age 15-49 who receive cash earnings and currently married women age 15-49 whose husbands receive cash earnings were asked who decides how the husband’s cash earnings are spent. Table 15.2.2 shows that 22 percent of men and 26 percent of women say that the wife mainly decides how the husband’s earnings are used. Three in four men (75 percent) and more than two in three women (68 percent) say that the husband and wife decide jointly how the husband’s cash earnings are used. Younger couples are less likely to share control over the husband’s earnings as reported by men. Rural men and women are more likely to say that decisions about how the husband’s cash earnings are spent are made jointly by the husband and wife.
In general, men who have higher education and those in the middle wealth quintile are more
likely to make decisions jointly about the use of the husband’s cash earnings, while more men in the highest wealth quintile said that their wife solely makes the decision (26 percent). This holds true for women also, as 37 percent of women in the highest wealth quintile said that they are responsible for deciding on the use of their husbands’ income, compared with 21 percent in the lowest wealth quintile.

Women’s Empowerment and Demographic and Health Outcomes | 207
Table 15.2.2 Control over men's cash earnings
Percent distributions of currently married men age 15-49 who receive cash earnings and of currently married women age 15-49 whose husbands receive cash earnings, by person who decides how men's cash earnings are used, according to background characteristics, Timor-Leste 2009-10
Men Women
Person who decides how husband’s cash earnings
are used: Person who decides how husband’s cash
earnings are used:
Background characteristic
Mainly wife
Husband and wife jointly
Mainly husband Total Number
Mainly wife
Husband and wife jointly
Mainly husband Other Missing Total Number
Age 15-19 na na na na 0 21.8 73.6 4.6 0.0 0.0 100.0 212 20-24 27.1 63.9 8.9 100.0 31 24.6 69.5 5.4 0.1 0.4 100.0 987 25-29 31.4 67.1 1.4 100.0 137 29.4 65.3 5.2 0.0 0.1 100.0 1,358 30-34 13.5 82.3 4.2 100.0 140 27.3 67.1 5.4 0.0 0.2 100.0 1,220 35-39 22.0 75.6 2.3 100.0 169 24.5 69.7 5.9 0.0 0.0 100.0 1,329 40-44 19.1 77.5 3.3 100.0 144 24.8 69.0 6.0 0.0 0.2 100.0 1,065 45-49 21.9 76.8 1.3 100.0 95 24.9 67.6 7.1 0.1 0.4 100.0 822
Number of living children
0 (21.7) (68.5) (9.8) 100.0 48 25.0 69.7 5.1 0.0 0.2 100.0 406 1-2 25.7 72.3 2.0 100.0 220 25.5 69.2 5.0 0.1 0.3 100.0 1,897 3-4 19.7 78.5 1.8 100.0 265 25.9 68.2 5.6 0.0 0.2 100.0 2,147 5+ 20.1 76.3 3.7 100.0 182 26.4 66.9 6.5 0.0 0.1 100.0 2,541
Residence Urban 27.2 70.3 2.6 100.0 372 40.2 53.3 5.9 0.1 0.6 100.0 1,933 Rural 15.9 80.9 3.2 100.0 343 20.5 73.8 5.7 0.0 0.0 100.0 5,059
Education No education (29.3) (70.7) (0.0) 100.0 61 21.4 72.0 6.5 0.0 0.1 100.0 2,511 Primary 23.2 70.4 6.4 100.0 151 24.0 70.1 5.8 0.1 0.0 100.0 1,756 Secondary 21.1 76.5 2.5 100.0 395 30.8 63.7 4.9 0.0 0.4 100.0 2,512 More than secondary 18.3 80.7 1.0 100.0 108 38.1 57.4 4.5 0.0 0.0 100.0 213
Wealth quintile Lowest (11.1) (88.9) (0.0) 100.0 29 21.3 72.4 6.2 0.0 0.1 100.0 1,209 Second 20.3 69.0 10.7 100.0 49 20.5 72.1 7.2 0.1 0.1 100.0 1,273 Middle 8.9 86.9 4.2 100.0 82 22.2 71.3 6.5 0.0 0.0 100.0 1,350 Fourth 22.3 76.2 1.5 100.0 194 25.0 70.1 4.6 0.0 0.3 100.0 1,409 Highest 25.5 72.0 2.5 100.0 361 36.8 58.1 4.7 0.0 0.3 100.0 1,750 Total 15-49 21.8 75.3 2.9 100.0 715 26.0 68.1 5.7 0.0 0.2 100.0 6,992
Note: Figures in parentheses are based on 25-49 unweighted cases.na = Not applicable

208 | Women’s Empowerment and Demographic and Health Outcomes
Table 15.3 shows the percent distribution of currently married women age 15-49 who received cash earnings in the past 12 months by the person who decides how their cash earnings are used, and the percent distribution of currently married women age 15-49 whose husbands received cash earnings in the past 12 months by the person who decides how the husband’s cash earnings are used, according to the relative magnitude of the earnings of the women and her husband.
Table 15.3 Women’s control over her own earnings and over those of her husband
Percent distributions of currently married women age 15-49 with cash earnings in the past 12 months by person who decides how the woman's cash earnings are used and of currently married women age 15-49 whose husbands have cash earnings by person who decides how the husband's cash earnings are used, according to the relation between woman's and husband's cash earnings, Timor-Leste 2009-10
Person who decides how the wife's cash earnings
are used:
Person who decides how husband's cash
earnings are used:
Women’s earnings relative to husband’s earnings
Mainly wife
Wife and
husband jointly
Mainly husband Total
Number of
womenMainly wife
Wife and
husband jointly
Mainly husband Other Missing Total
Number of
women
More than husband/partner 43.0 52.4 4.6 100.0 174 31.4 63.2 5.0 0.3 0.0 100.0 174 Less than husband/partner 32.9 60.4 6.7 100.0 236 31.7 65.6 2.8 0.0 0.0 100.0 234 Same as husband partner 29.9 63.9 6.1 100.0 179 19.3 72.7 8.0 0.0 0.0 100.0 177
Husband/ partner has no cash earnings/did not work 43.4 54.9 1.7 100.0 73 na na na na na na 0
Woman has no cash earnings na na na na 0 18.6 76.0 5.3 0.0 0.1 100.0 2,390
Woman did not work in past 12 months na na na na 0 30.0 63.6 6.1 0.0 0.3 100.0 4,007
Total1 36.4 58.2 5.5 100.0 672 26.0 68.1 5.7 0.0 0.2 100.0 6,992
Note: Totals include 11 women with information missing on earnings relative to husband. na = Not applicable 1 Excludes cases where a woman or her husband/partner has no earnings and includes cases where a woman does not know whether she earned more or less than her husband/partner
Women who believe that they earn more than their husband are more likely to also say that
they solely decide how their cash earnings are used (43 percent) than women who believe that their cash earnings are the same as their husband’s (30 percent) or that their cash earnings are less than their husband’s (33 percent). On the other hand, women who believe that they earn about the same amount as their husband are more likely to also say that they make joint decisions with their husband about how their cash earnings and those of their husband are used (64 percent and 73 percent, respectively).
In Timorese culture married women are responsible for managing solely or jointly all cash earnings of their husband, irrespective of their own cash earning status. This is clearly indicated by the finding that 95 percent of women with no cash earnings participate alone or jointly with their husband in deciding how to use their husband’s cash earnings.
15.4 WOMEN’S PARTICIPATION IN DECISIONMAKING
Women’s participation in the decisionmaking process is an important indicator of their empowerment. In order to assess women’s decisionmaking autonomy, the 2009-10 TLDHS sought information on women’s participation in four types of household decisions: her own health care, making large household purchases, making household purchases for daily needs, and visits to family or relatives. Table 15.4.1 shows the percent distribution of currently married women according to the person in the household who usually makes decisions concerning these matters. Women are considered to participate in decisionmaking if they make decisions alone or jointly with their husband.

Women’s Empowerment and Demographic and Health Outcomes | 209
Table 15.4.1 Women’s participation in decisionmaking
Percent distribution of currently married women by person who usually makes decisions about four kinds of issues, Timor-Leste 2009-10
Decision Mainly wife
Wife and husband jointly
Mainly husband
Someone else Other Missing Total
Number of women
Own health care 22.8 63.8 13.2 0.0 0.0 0.1 100.0 7,906 Major household purchases 20.9 64.9 13.9 0.0 0.1 0.1 100.0 7,906 Purchases of daily household needs 62.9 32.0 4.8 0.0 0.2 0.1 100.0 7,906 Visits to her family or relatives 12.8 78.3 8.7 0.0 0.0 0.1 100.0 7,906
The strength of women’s role in decisionmaking varies with the type of decision. Timorese
women are usually involved in all four specific decisions, although the extent of their involvement depends on the issue being decided. Sixty-three percent of currently married women reported that they alone made the final decision about daily household purchases, a significant increase from the 2003 DHS where only 44 percent said this. Regarding decisionmaking in other issues like one’s own health care, making major household purchases, and visiting family or relatives, women are more likely to decide jointly with their husbands.
In the 2009-10 TLDHS, men were asked who (wife, husband, or both) should have the greater
say in five specific decisions—making major household purchases, making daily household purchases, deciding when to visit the wife’s family or relatives, deciding what to do with the money the wife earns, and deciding how many children to have. Table 15.4.2 shows the percent distribution of currently married men age 15-49 by the person they think should have the greater say in making decisions about five types of issues.
Table 15.4.2 Women’s participation in decisionmaking according to men
Percent distribution of currently married men 15-49 by person who they think should have a greater say in making decisions about five kinds of issues, Timor-Leste 2009-10
Decision Wife
Wife and husband equally Husband
Don't know/
depends Total Number of
men
Major household purchases 4.3 88.4 6.8 0.5 100.0 2,158 Purchases of daily household needs 55.4 42.0 1.8 0.7 100.0 2,158 Visits to wife's family or relatives 9.9 84.3 4.2 1.5 100.0 2,158 What to do with the money wife earns 14.7 76.5 2.6 6.2 100.0 2,158 How many children to have 2.2 94.4 2.3 1.2 100.0 2,158
Table 15.4.2 shows that for most decisions, the majority of currently married men age 15-49
think that the husband and wife should have equal say in making decisions. This is especially true for decisions about the number of children to have (94 percent), decisions on major household purchases (88 percent), and visits to the wife’s family or relatives (84 percent). More than half (55 percent) of married men say that the wife should have the greater say in making decisions about small household purchases, while 42 percent think that the husband and wife should have equal say. On the other hand, 7 percent of married men say that the husband should have a greater say in making decisions about major household purchases, although most generally agree that it should not be the wife alone making such decision, with only 4 percent mentioning that the wife should have a greater say.
Table 15.5.1 shows the percentage of married women who participate in the four decisions
specified for female respondents, according to background characteristics. As noted above, a woman is considered to participate in a decision if she says she usually makes the decision alone or jointly with her husband.

210 | Women’s Empowerment and Demographic and Health Outcomes
Eighty-seven percent of currently married women age 15-49 say that they make decisions about their own health care either by themselves or jointly with their husbands, and 86 percent say that they participate in decisions about major household purchases. Most currently married women say that they participate in decisions about daily household needs (95 percent) and in decisions about visits to their own family or relatives (91 percent). Overall, 74 percent of currently married women participate in all four decisions, and 1 percent do not participate in any of the four decisions. There is little difference in participation in decisionmaking among women by age and by the number of children they have. It is interesting to note that women who are employed for cash, those in urban areas, those with higher education, and those belonging to wealthier households are less likely to participate in all four decisions. It will be interesting to see if these women are also vulnerable to domestic violence, which is discussed in greater detail in the next chapter.
The number of decisions in which a woman participates by herself or jointly with her husband is positively related to women’s empowerment and reflects the degree of decisionmaking control that women are able to exercise in areas that affect their lives and environments. Figure 15.1 shows the distribution of currently married women according to the number of decisions in which they participate.
Figure 15.1 Number of Household Decisions in Which Women Participate
1 28
15
74
0 1 2 3 4
Number of decisions
0
20
40
60
80Percent
Timor-Leste 2009-10
Men were also asked about their attitude toward their wives’ participation in the decisionmaking process. Table 15.5.2 shows the percentage of currently married men age 15-49 who think that the wife should have a greater or equal say with her husband on five specific kinds of decisions. More than three-quarters (78 percent) of currently married men age 15-49 believe that a wife should independently or jointly with her husband have a say in all five specified decisions. More than 90 percent of men agree on women’s participation in each of the decisions specified. This is an indication that Timorese men think that women’s participation in household decisionmaking is essential, although the previous table indicated that in reality this was not the case.

Women’s Empowerment and Demographic and Health Outcomes | 211
Table 15.5.1 Women’s participation in decisionmaking by background characteristics
Percentage of currently married women age 15-49 who usually make specific decisions either by themselves or jointly with their husband, by background characteristics, Timor-Leste 2009-10
Background characteristic
Specific decisions
Percentage who
participate in all four
decisions
Percentage who
participate in none of the four decisions
Number of women
Own health care
Making major household purchases
Making purchases for daily
household needs
Visits to her family or relatives
Age 15-19 91.0 84.6 96.1 92.2 73.9 0.2 243 20-24 86.1 87.2 96.2 92.3 74.1 0.8 1,100 25-29 85.6 86.3 94.4 90.0 73.9 1.4 1,516 30-34 88.6 86.8 95.0 92.1 75.7 1.2 1,362 35-39 86.9 85.7 95.5 91.7 73.9 1.0 1,514 40-44 85.8 85.1 94.3 91.0 73.2 1.0 1,211 45-49 85.3 84.0 93.4 89.3 72.2 2.1 960
Employment (past 12 months) Not employed 85.8 84.2 94.9 90.1 70.9 1.1 4,439 Employed for cash 79.3 83.6 90.3 90.5 66.0 0.5 672 Employed not for cash 90.0 89.4 96.3 93.3 81.0 1.2 2,784
Number of living children 0 86.1 86.4 94.4 92.2 73.0 1.1 469 1-2 87.2 86.2 94.7 91.8 74.7 1.3 2,103 3-4 85.3 87.1 95.1 90.3 73.8 1.1 2,421 5+ 87.3 84.5 94.8 91.2 73.6 1.3 2,913
Residence Urban 84.2 86.2 90.2 86.5 68.1 1.3 2,025 Rural 87.4 85.7 96.5 92.7 75.9 1.2 5,881
District Aileu 78.6 82.2 84.3 81.9 70.8 9.7 299 Ainaro 93.2 96.5 96.9 88.2 81.5 1.2 382 Baucau 68.6 74.5 97.3 91.3 58.3 1.7 852 Bobonaro 100.0 99.6 99.7 99.9 99.3 0.0 739 Covalima 57.0 77.6 98.8 95.5 49.7 0.4 458 Dili 82.9 87.7 87.1 83.2 67.7 1.5 1,459 Ermera 92.2 90.8 94.9 89.0 82.1 0.7 881 Lautem 87.7 55.7 97.2 95.8 47.1 0.2 541 Liquiçá 90.1 94.6 97.5 95.4 84.9 0.8 460 Manatuto 95.2 97.9 98.8 98.8 93.7 0.7 353 Manufahi 94.3 65.7 91.4 91.1 61.5 0.6 319 Oecussi 97.1 94.2 100.0 96.6 89.5 0.0 603 Viqueque 96.2 90.9 95.4 88.0 78.9 1.3 559
Education No education 87.3 87.3 95.4 91.2 76.9 1.4 2,909 Primary 88.1 85.0 95.5 91.7 74.0 1.3 2,027 Secondary 85.2 85.1 94.5 91.1 71.5 1.0 2,739 More than secondary 82.3 84.9 87.0 86.5 64.3 0.9 231
Wealth quintile Lowest 88.2 85.3 96.7 92.6 76.6 1.3 1,467 Second 87.3 84.9 95.0 92.2 74.8 1.4 1,487 Middle 86.7 85.5 96.1 92.0 75.5 1.4 1,559 Fourth 87.5 85.9 96.5 92.4 74.1 1.1 1,571 Highest 83.9 87.4 90.8 87.3 69.6 0.9 1,821 Total 86.6 85.9 94.9 91.1 73.9 1.2 7,906
Note: Total includes 11 women with information missing on employment status.

212 | Women’s Empowerment and Demographic and Health Outcomes
Table 15.5.2 Men's attitude toward wives' participation in decisionmaking
Percentage of currently married men age 15-49 who think that a wife should have the greater say alone or equal say with her husband on five specific kinds of decisions, by background characteristics, Timor-Leste 2009-10
Background characteristic
Specific decision
All five decisions
None of the five
decisions Number of
men
Making major
household purchases
Making purchases for daily
household needs
Visits to her family or relatives
What to do with the
money the wife earns
How many children to
have
Age 20-24 91.7 97.4 94.1 90.7 99.1 78.6 0.5 125 25-29 92.0 97.9 94.9 91.5 97.0 76.7 0.0 359 30-34 93.5 97.9 95.2 93.6 97.5 81.7 0.0 368 35-39 92.9 98.0 94.5 89.7 96.2 76.3 0.1 492 40-44 92.1 97.4 94.4 92.7 96.4 79.9 0.1 433 45-49 93.2 96.2 92.1 89.2 94.8 76.0 0.9 378 Employment (past 12 months) Not employed 86.2 98.7 93.2 80.1 99.0 67.6 0.0 57 Employed for cash 92.4 98.0 96.1 90.1 98.3 77.9 0.1 715 Employed not for cash 93.1 97.1 93.3 92.2 95.5 78.6 0.3 1,385 Number of living children 0 94.5 97.6 95.6 91.9 98.8 81.1 0.0 135 1-2 91.7 97.6 95.0 92.1 96.3 76.7 0.1 620 3-4 92.9 97.9 94.0 90.6 96.1 77.0 0.2 704 5+ 93.0 96.9 93.6 90.9 96.7 79.8 0.4 700 Residence Urban 90.9 97.0 96.4 84.2 97.5 72.5 0.3 567 Rural 93.3 97.6 93.5 93.7 96.2 80.1 0.2 1,592 District Aileu 69.0 94.2 59.4 93.9 96.1 45.2 1.3 92 Ainaro 97.3 97.9 99.2 97.9 95.8 93.1 0.0 101 Baucau 98.7 99.3 94.0 91.1 85.9 75.0 0.0 237 Bobonaro 99.2 94.6 91.2 89.1 96.1 75.1 0.0 170 Covalima 99.6 99.2 100.0 97.0 97.7 94.3 0.0 123 Dili 91.0 96.8 96.0 77.0 98.6 65.6 0.5 416 Ermera 100.0 100.0 100.0 100.0 100.0 100.0 0.0 233 Lautem 96.5 92.7 97.1 91.2 98.8 82.6 0.0 163 Liquiçá 96.9 97.8 92.6 85.5 95.1 77.8 0.0 124 Manatuto 100.0 97.2 99.4 100.0 100.0 96.7 0.0 96 Manufahi 12.7 98.5 97.8 97.8 90.3 9.9 1.5 77 Oecussi 95.4 98.3 87.8 95.4 98.8 81.4 0.6 165 Viqueque 100.0 99.4 97.4 99.4 99.4 96.7 0.0 159 Education No education 93.0 96.1 91.9 91.0 95.2 74.5 0.5 523 Primary 93.8 96.9 93.5 91.1 96.8 79.6 0.3 650 Secondary 92.1 98.4 96.0 91.0 96.8 78.9 0.1 853 More than secondary 89.6 99.2 95.6 94.3 98.8 79.1 0.0 132 Wealth quintile Lowest 92.8 97.9 91.5 94.6 96.6 79.6 0.2 413 Second 91.8 97.5 93.8 92.2 95.5 76.9 0.1 408 Middle 92.6 96.4 93.3 93.7 96.3 80.0 0.1 411 Fourth 94.6 97.6 95.4 89.6 96.8 78.8 0.3 447 Highest 91.5 97.8 96.7 86.9 97.3 75.4 0.4 479 Total 15-49 92.7 97.5 94.2 91.2 96.5 78.1 0.2 2,158
Note: Total includes 4 men age 15-19 not shown separately and 1 man with information missing on employment status.

Women’s Empowerment and Demographic and Health Outcomes | 213
15.5 ATTITUDES TOWARD WIFE BEATING
Another measure of women’s empowerment derives from the idea that gender equity is essential to empowerment. Women who believe that wife beating is justified seemingly have a lower status than women who think otherwise because they are more accepting of norms that give men the right to use force against women, which is a violation of women’s basic human rights. Violence against women has serious consequences for their mental and physical well-being, including their reproductive and sexual health (Heise et al., 1999). The attitude of women and men toward wife beating may be considered a proxy indicator for their attitude toward domestic violence.
Women and men were asked whether a husband is justified in hitting or beating his wife in
each of the following five situations: if she burns the food, if she argues with him, if she goes out without telling him, if she neglects the children, and if she refuses to have sexual intercourse with him. The fewer situations, or reasons, that a woman agrees with indicates a greater sense of entitlement, self-esteem, and status, and reflects positively on her sense of empowerment.
A woman who believes that a husband is justified in hitting or beating his wife, for any of the five specified reasons, may consider herself to be of low status both absolutely and relative to men. Such a perception could act as a barrier to accessing health care for herself and for her children, affect her attitude toward contraceptive use, and impact her general well-being.
Table 15.6.1 shows that 86 percent of women believe that a husband is justified in beating his wife for at least one of the specified reasons. The most widely accepted reason for wife beating among women is neglecting the children (76 percent). About 64 percent of women believe that a husband is justified in beating his wife if she argues with him, and 72 percent believe that it is acceptable if she goes out without telling him. A smaller percentage of women believe that the husband is justified in hitting or beating his wife if she burns the food (43 percent) or denies him sexual intercourse (30 percent). Differentials by women’s background characteristics are small, except among women in Viqueque, who are least likely to sanction wife beating. Only 59 percent of women in Viqueque believe that a husband is justified in beating his wife for at least one specified reason. Among the Timorese, it is the man and/or his family who pays dowry at marriage to his wife’s family (Belis, Barlaque). However, once the payment is completed, the wife is often considered the property of the husband, thus losing her independence and status as an individual. In Viqueque, the payment of dowry is less prevalent and as such women in Viqueque may tend to exhibit greater self-esteem.
Men age 15-49 are almost as likely as women to report that they find physical violence against women justifiable (Table 15.6.2). Overall, four in five Timorese men agree with at least one of the reasons for why a man is justified in beating his wife. Men are most likely to justify beating a wife if she neglects the children (71 percent). Like women, men are least likely to say that burning food (38 percent) or refusing to have sex (27 percent) are grounds for wife beating. About 44 percent of men feel that arguing with one’s husband is a justifiable reason for wife beating.

214 | Women’s Empowerment and Demographic and Health Outcomes
Table 15.6.1 Attitude toward wife beating: Women
Percentage of all women age 15-49 who agree that a husband is justified in hitting or beating his wife for specific reasons, by background characteristics, Timor-Leste 2009-10
Husband is justified in hitting or beating his wife if she: Percentage
who agree with at least
one specified reason
Background characteristic
Burns the food
Argues with him
Goes out without
telling himNeglects
the children
Refuses to have sexual intercourse with him
Number of women
Age 15-19 43.5 57.9 69.8 73.2 25.2 81.1 3,144 20-24 44.9 65.5 73.4 77.1 28.7 87.3 2,343 25-29 43.4 67.7 73.2 77.4 30.4 89.2 1,897 30-34 41.5 65.5 72.4 77.3 28.4 87.7 1,534 35-39 43.0 65.7 72.7 78.5 33.7 87.5 1,684 40-44 42.3 66.4 73.1 76.3 33.1 87.7 1,388 45-49 42.9 63.6 72.3 78.1 32.1 86.9 1,146
Employment (past 12 months) Not employed 44.2 60.0 70.0 74.2 26.3 85.0 7,943 Employed for cash 38.9 60.7 69.5 68.5 26.8 84.6 1,054 Employed not for cash 42.6 72.4 77.0 82.6 36.3 88.9 4,130
Marital status Never married 44.2 59.6 70.0 73.4 24.8 82.1 4,675 Married or living together 42.9 66.3 73.4 78.2 32.0 88.7 7,906 Divorced/separated/widowed 40.2 66.9 72.5 76.4 32.9 84.8 556
Number of living children 0 44.2 59.9 70.3 73.4 25.1 82.4 5,178 1-2 43.1 66.9 74.1 78.2 30.9 89.2 2,350 3-4 42.4 65.9 72.6 77.7 32.4 88.6 2,554 5+ 42.4 66.9 73.5 79.0 33.3 88.2 3,055
Residence Urban 48.0 63.1 69.5 72.3 21.5 89.3 3,439 Rural 41.6 64.3 73.1 77.9 32.3 85.1 9,698
District Aileu 50.6 65.8 78.2 77.4 42.5 86.5 554 Ainaro 36.8 27.6 58.7 59.5 13.9 64.5 619 Baucau 40.1 31.1 68.5 72.9 18.6 83.2 1,408 Bobonaro 19.3 60.2 76.2 85.7 10.2 88.7 1,262 Covalima 58.6 72.0 72.0 77.8 34.4 87.6 781 Dili 53.1 60.9 67.2 67.2 17.3 89.8 2,466 Ermera 51.4 90.9 91.3 92.1 51.1 96.2 1,542 Lautem 19.7 77.4 60.1 80.2 13.1 92.0 864 Liquiçá 70.4 80.9 83.0 82.9 67.8 88.7 801 Manatuto 48.9 78.9 72.9 70.0 44.0 83.0 603 Manufahi 22.4 66.7 62.5 83.2 12.7 91.0 470 Oecussi 60.9 74.3 88.0 90.3 68.5 92.3 884 Viqueque 14.9 49.7 49.5 54.4 10.4 59.1 882
Education No education 42.4 65.3 74.0 79.1 35.1 86.4 3,854 Primary 43.3 65.6 72.6 78.7 33.5 86.3 3,005 Secondary 43.8 62.5 71.1 74.0 24.5 85.9 5,829 More than secondary 43.3 59.4 67.4 70.1 19.2 88.1 449
Wealth quintile Lowest 38.9 59.1 68.0 74.2 31.8 81.1 2,314 Second 40.7 61.6 74.1 78.6 31.4 84.5 2,468 Middle 42.4 69.5 76.7 80.7 32.8 87.9 2,590 Fourth 44.1 67.1 72.7 78.3 30.6 87.7 2,687 Highest 48.5 62.1 69.5 71.0 22.4 88.5 3,077 Total 43.2 63.9 72.2 76.4 29.5 86.2 13,137
Note: Total includes 11 women with information missing on employment status.

Women’s Empowerment and Demographic and Health Outcomes | 215
Table 15.6.2 Attitude toward wife beating: Men
Percentage of all men age 15-49 who agree that a husband is justified in hitting or beating his wife for specific reasons, by background characteristics, Timor-Leste 2009-10
Husband is justified in hitting or beating his wife if she: Percentage
who agree with at least
one specified reason
Background characteristic
Burns the food
Argues with him
Goes out without
telling himNeglects
the children
Refuses to have sexual intercourse with him
Number of men
Age 15-19 36.6 39.5 58.5 61.9 23.9 72.3 994 20-24 37.9 42.9 63.1 70.1 27.6 79.7 643 25-29 38.1 44.2 65.4 72.7 23.2 83.3 586 30-34 39.0 46.9 68.2 77.6 28.0 85.1 439 35-39 36.1 47.5 68.6 78.6 28.5 87.2 553 40-44 37.6 49.4 67.7 73.2 28.9 84.8 462 45-49 38.8 43.8 69.8 72.7 28.5 81.2 400
Employment (past 12 months) Not employed 39.3 42.6 64.3 73.8 14.0 80.5 538 Employed for cash 29.3 37.6 61.0 70.8 17.8 78.3 973 Employed not for cash 40.3 46.9 66.3 70.6 32.4 81.7 2,564
Marital status Never married 36.6 41.4 60.8 65.8 24.1 76.0 1,865 Married or living together 38.2 46.3 68.1 75.5 28.5 84.7 2,158 Divorced/separated/widowed 45.0 53.9 68.2 78.1 25.6 87.9 53
Number of living children 0 36.9 42.1 61.2 66.2 24.6 76.7 2,009 1-2 37.9 44.8 67.7 75.8 26.3 84.4 638 3-4 34.5 44.4 67.7 75.9 26.4 85.0 720 5+ 41.9 49.1 69.4 75.5 32.0 84.6 709
Residence Urban 39.5 48.1 69.4 78.8 16.4 86.1 1,102 Rural 36.8 42.7 63.1 68.2 30.2 78.8 2,974
District Aileu 8.1 26.5 43.5 28.9 6.8 47.8 181 Ainaro 68.1 58.8 48.1 77.7 6.8 87.8 217 Baucau 11.0 18.3 58.3 63.6 71.4 93.9 415 Bobonaro 65.9 29.7 95.8 93.8 6.8 99.6 357 Covalima 27.1 64.0 69.3 74.3 33.3 94.7 236 Dili 34.6 45.9 70.7 82.4 8.8 86.0 797 Ermera 53.4 58.8 69.9 67.7 52.5 76.6 491 Lautem 76.1 75.5 90.7 88.5 45.7 94.6 308 Liquiçá 18.9 36.1 45.3 45.7 8.1 53.7 252 Manatuto 0.8 1.1 0.8 1.4 0.8 1.7 190 Manufahi 88.6 85.8 86.6 89.5 18.8 91.4 137 Oecussi 31.8 65.6 79.1 81.8 51.4 91.3 235 Viqueque 1.7 14.5 39.7 79.3 6.2 82.5 260
Education No education 37.1 46.5 64.8 72.2 28.7 81.4 791 Primary 35.0 41.3 63.4 68.3 29.0 78.7 1,046 Secondary 39.3 43.9 65.2 71.3 25.7 80.8 2,009 More than secondary 35.2 51.0 67.0 77.2 14.3 87.3 230
Wealth quintile Lowest 35.4 45.8 63.8 70.5 28.5 81.3 728 Second 41.1 45.9 63.9 68.6 30.0 80.2 781 Middle 37.4 41.9 62.3 67.3 29.3 79.4 786 Fourth 38.0 43.6 66.7 72.9 28.6 79.5 849 Highest 35.8 43.8 66.7 75.0 17.7 83.0 932 Total 15-49 37.5 44.1 64.8 71.1 26.5 80.7 4,076
Note: Total includes one man missing information on employment status

216 | Women’s Empowerment and Demographic and Health Outcomes
15.6 ATTITUDES TOWARD REFUSING SEX WITH HUSBAND
Women’s sexual empowerment has important implications for demographic and health outcomes such as their exposure to HIV and other sexually transmitted infections. It is also an indicator of women’s empowerment in general, as it measures women’s level of acceptance of societal norms that socialize them to believe that women do not have the right to refuse sexual intercourse with their husband for any reason. The number of reasons that a wife finds acceptable for refusing sexual intercourse with her husband reflects perceptions of sexual roles and women’s rights over their bodies, and relates positively to women’s sense of self-esteem.
To measure beliefs about women’s sexual empowerment, the 2009-10 TLDHS included questions on whether the respondent thinks that a wife is justified in refusing to have sexual intercourse with her husband under three circumstances: she knows her husband has a sexually transmitted disease, she knows her husband has sexual intercourse with other women, or she is tired or not in the mood. These three circumstances were chosen because they are effective in combining the issues of women’s rights and consequences for women’s health. Tables 15.7.1 and 15.7.2 show the responses of women and men, respectively.
Table 15.7.1 shows that about two in three women agree with each of the specified circumstances under which a wife is justified in refusing to have sexual intercourse with her husband, and 51 percent agree with all three of the reasons. Women are most likely to agree that a woman can refuse to have sexual intercourse with her husband if she knows her husband has a sexually transmitted infection or if she is tired or not in the mood (67 percent each). Sixty-five percent think that a woman is justified in refusing sexual intercourse if she knows that her husband has intercourse with other women. Twenty percent of women agree with none of the specified reasons, meaning that they think that a woman should not refuse sexual intercourse with her husband under any circumstances.
Women living in urban areas, those with higher education, and those in the highest wealth
quintile are least likely to think all of the reasons for refusing sex are acceptable. Interestingly, these women are also less empowered with regard to other indicators, reinforcing the finding that within a patriarchal society educated, wealthy, and urban women are not automatically accorded equality.
Table 15.7.2 shows the percentage of men who think that a wife is justified in refusing to have sexual intercourse with her husband under the same three specified circumstances: she knows her husband has a sexually transmitted disease, she knows her husband has sexual intercourse with other women, or she is tired or not in the mood. The results indicate that the proportion of men who think that a woman is justified in refusing sexual intercourse with her husband for all three specified reasons is almost the same as the proportion of women (53 and 51 percent, respectively). Seventy-two percent of men, compared with 67 percent of women, think that a wife is justified in refusing sexual intercourse with her husband if she knows he has a sexually transmitted infection; 71 percent of men, compared with 65 percent of women, think that a wife is justified in refusing sexual intercourse if she knows that her husband has intercourse with other women; and 75 percent of men, compared with 67 percent of women, think that a woman is justified in refusing sexual intercourse with her husband if she is tired or not in the mood. Men age 15-19, those who have primary education, those who are not employed, those who have never married, and those who have no children are least likely to accept all of the reasons for refusing sex.
Notable differences are seen by education, with highly educated men more likely to agree with all of the specified reasons for women to refuse sexual intercourse. Conversely, these men are also least likely to agree with none of the specified reasons, indicating that urban, educated, and wealthy men are more accepting of women’s entitlement to control their sexuality. There are also substantial variations by district, with men in Viqueque less likely to accept all reasons for refusing sex (9 percent), while nearly all men in Manatuto agreed with all the specified reasons for refusing sex (99 percent). In the case of women, it was highest in Ermera (90 percent).

Women’s Empowerment and Demographic and Health Outcomes | 217
Table 15.7.1 Attitude toward refusing sexual intercourse with husband: Women
Percentage of all women age 15-49 who believe that a wife is justified in refusing to have sexual intercourse with her husband in specific circumstances, by background characteristics, Timor-Leste 2009-10
Wife is justified in refusing intercourse with her husband if she:
Background characteristic
Knows husband has
a sexually transmitted
disease
Knows husband has intercourse with other
women
Is tired or not in the
mood
Percentage who agree
with all of the specified reasons
Percentage who agree
with none of the specified
reasons Number of
women
Age 15-19 54.5 50.9 48.6 37.9 35.5 3,144 20-24 64.9 62.8 65.3 47.9 20.5 2,343 25-29 71.2 70.2 74.4 53.1 11.7 1,897 30-34 73.9 71.1 75.9 57.4 12.8 1,534 35-39 76.7 72.5 76.0 59.5 11.3 1,684 40-44 73.3 71.7 72.9 56.5 13.4 1,388 45-49 72.1 70.2 71.6 57.1 15.4 1,146
Employment (past 12 months) Not employed 65.6 62.4 64.8 48.2 21.0 7,943 Employed for cash 60.7 62.4 68.6 44.4 17.9 1,054 Employed not for cash 72.7 70.1 69.5 56.8 17.2 4,130
Marital status Never married 55.1 51.4 49.7 38.0 34.3 4,675 Married or living together 74.3 72.5 76.2 57.5 11.1 7,906 Divorced/separated/widowed 72.4 68.3 71.7 56.9 15.4 556
Number of living children 0 56.8 53.7 52.2 39.9 32.1 5,178 1-2 72.0 70.1 75.6 54.2 11.1 2,350 3-4 73.6 71.4 74.8 55.6 11.4 2,554 5+ 76.7 74.2 77.2 61.6 11.5 3,055
Residence Urban 48.7 46.2 56.6 26.6 25.8 3,439 Rural 74.0 71.4 70.1 59.0 17.3 9,698
District Aileu 68.7 59.8 74.6 53.6 21.4 554 Ainaro 61.0 59.5 51.5 42.8 30.2 619 Baucau 89.5 89.4 88.8 86.7 8.9 1,408 Bobonaro 63.3 59.7 37.8 25.9 25.7 1,262 Covalima 75.9 60.3 68.4 40.0 8.1 781 Dili 38.6 34.2 51.6 14.2 29.7 2,466 Ermera 90.6 91.7 91.3 89.8 7.3 1,542 Lautem 80.8 66.0 71.1 54.0 11.4 864 Liquiçá 76.8 72.8 73.9 56.3 11.9 801 Manatuto 79.1 78.7 73.7 68.2 15.0 603 Manufahi 23.4 64.1 59.2 20.0 25.5 470 Oecussi 82.6 80.9 79.9 77.4 14.8 884 Viqueque 52.7 48.7 49.5 42.8 41.6 882
Education No education 74.3 71.8 70.6 59.1 16.6 3,854 Primary 69.4 67.1 69.7 54.2 18.5 3,005 Secondary 63.2 60.4 62.7 44.6 21.5 5,829 More than secondary 48.9 46.9 61.9 30.3 26.0 449
Wealth quintile Lowest 70.4 68.0 67.0 56.9 21.5 2,314 Second 73.5 71.1 69.5 58.7 18.1 2,468 Middle 74.0 71.2 70.1 58.0 17.0 2,590 Fourth 70.1 67.3 67.6 51.5 17.0 2,687 Highest 52.4 49.9 60.1 32.1 23.5 3,077 Total 67.4 64.8 66.6 50.5 19.5 13,137
Note: Total includes 11 women with information missing on employment status.
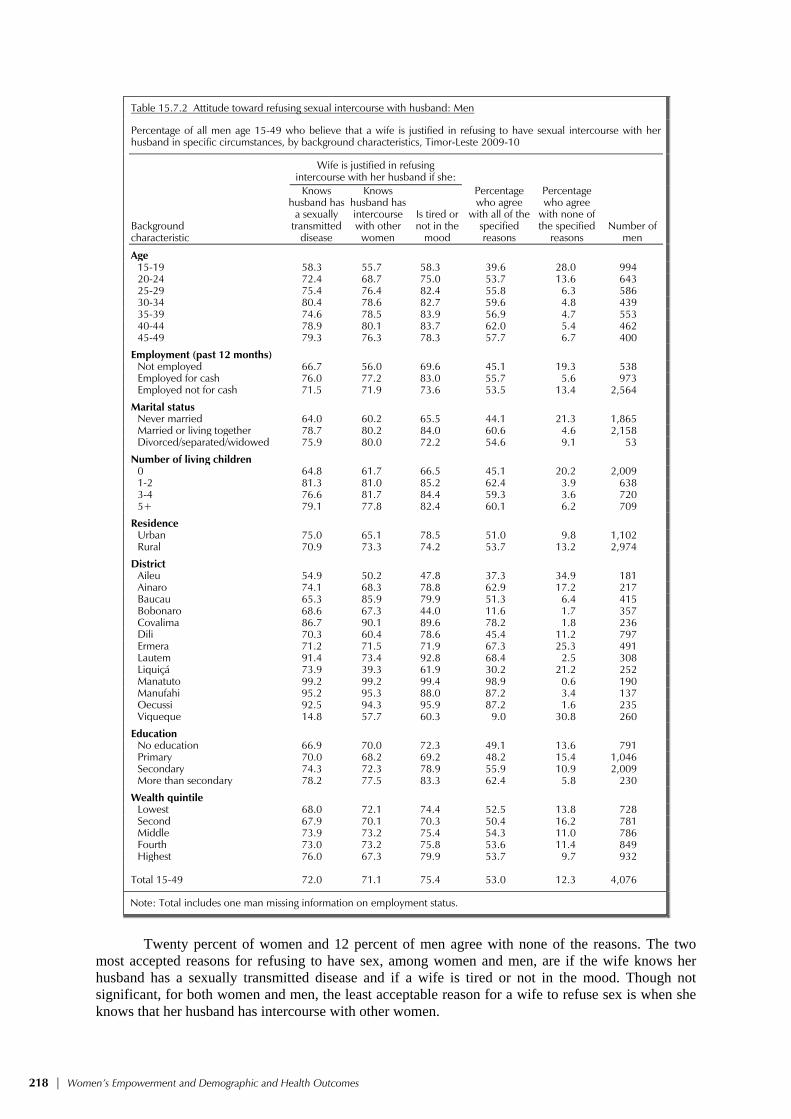
218 | Women’s Empowerment and Demographic and Health Outcomes
Table 15.7.2 Attitude toward refusing sexual intercourse with husband: Men
Percentage of all men age 15-49 who believe that a wife is justified in refusing to have sexual intercourse with her husband in specific circumstances, by background characteristics, Timor-Leste 2009-10
Wife is justified in refusing intercourse with her husband if she:
Background characteristic
Knows husband has
a sexually transmitted
disease
Knows husband has intercourse with other
women
Is tired or not in the
mood
Percentage who agree
with all of the specified reasons
Percentage who agree
with none of the specified
reasons Number of
men
Age 15-19 58.3 55.7 58.3 39.6 28.0 994 20-24 72.4 68.7 75.0 53.7 13.6 643 25-29 75.4 76.4 82.4 55.8 6.3 586 30-34 80.4 78.6 82.7 59.6 4.8 439 35-39 74.6 78.5 83.9 56.9 4.7 553 40-44 78.9 80.1 83.7 62.0 5.4 462 45-49 79.3 76.3 78.3 57.7 6.7 400
Employment (past 12 months) Not employed 66.7 56.0 69.6 45.1 19.3 538 Employed for cash 76.0 77.2 83.0 55.7 5.6 973 Employed not for cash 71.5 71.9 73.6 53.5 13.4 2,564
Marital status Never married 64.0 60.2 65.5 44.1 21.3 1,865 Married or living together 78.7 80.2 84.0 60.6 4.6 2,158 Divorced/separated/widowed 75.9 80.0 72.2 54.6 9.1 53
Number of living children 0 64.8 61.7 66.5 45.1 20.2 2,009 1-2 81.3 81.0 85.2 62.4 3.9 638 3-4 76.6 81.7 84.4 59.3 3.6 720 5+ 79.1 77.8 82.4 60.1 6.2 709
Residence Urban 75.0 65.1 78.5 51.0 9.8 1,102 Rural 70.9 73.3 74.2 53.7 13.2 2,974
District Aileu 54.9 50.2 47.8 37.3 34.9 181 Ainaro 74.1 68.3 78.8 62.9 17.2 217 Baucau 65.3 85.9 79.9 51.3 6.4 415 Bobonaro 68.6 67.3 44.0 11.6 1.7 357 Covalima 86.7 90.1 89.6 78.2 1.8 236 Dili 70.3 60.4 78.6 45.4 11.2 797 Ermera 71.2 71.5 71.9 67.3 25.3 491 Lautem 91.4 73.4 92.8 68.4 2.5 308 Liquiçá 73.9 39.3 61.9 30.2 21.2 252 Manatuto 99.2 99.2 99.4 98.9 0.6 190 Manufahi 95.2 95.3 88.0 87.2 3.4 137 Oecussi 92.5 94.3 95.9 87.2 1.6 235 Viqueque 14.8 57.7 60.3 9.0 30.8 260
Education No education 66.9 70.0 72.3 49.1 13.6 791 Primary 70.0 68.2 69.2 48.2 15.4 1,046 Secondary 74.3 72.3 78.9 55.9 10.9 2,009 More than secondary 78.2 77.5 83.3 62.4 5.8 230
Wealth quintile Lowest 68.0 72.1 74.4 52.5 13.8 728 Second 67.9 70.1 70.3 50.4 16.2 781 Middle 73.9 73.2 75.4 54.3 11.0 786 Fourth 73.0 73.2 75.8 53.6 11.4 849 Highest 76.0 67.3 79.9 53.7 9.7 932 Total 15-49 72.0 71.1 75.4 53.0 12.3 4,076
Note: Total includes one man missing information on employment status.
Twenty percent of women and 12 percent of men agree with none of the reasons. The two
most accepted reasons for refusing to have sex, among women and men, are if the wife knows her husband has a sexually transmitted disease and if a wife is tired or not in the mood. Though not significant, for both women and men, the least acceptable reason for a wife to refuse sex is when she knows that her husband has intercourse with other women.

Women’s Empowerment and Demographic and Health Outcomes | 219
Women’s empowerment is closely associated with the support she receives from her husband and family members. The 2009-10 TLDHS explored men’s attitude toward a husband’s rights when his wife refuses to have sexual intercourse. Men were asked whether, when a wife refuses to have sexual intercourse with him, a husband has the right to get angry and reprimand her, refuse her financial support, use force to have sex, or have sex with another woman. Table 15.7.3 indicates that the majority of men (55 percent) agree with none of the reasons to justify negative behavior on the part of a man if his wife refuses to have sexual intercourse with him. On the other hand, 6 percent of men agree with all of the specified rights for men to exhibit the specified negative behavior, with men in Ermera reporting this most often (28 percent), followed by men in Oecussi (17 percent).
Table 15.7.3 Men’s attitude toward a husband’s rights when his wife refuses to have sexual intercourse
Percentage of men age 15-49 who consider that a husband has the right to certain behaviors when a woman refuses to have sex with him when he wants her to, by background characteristics, Timor-Leste 2009-10
When a woman refuses to have sex with her
husband, he has the right to: Percentage who agree
with all of the specified reasons
Percentage who agree
with none of the specified
reasons
Background characteristic
Get angry and
reprimand her
Refuse her financial support
Use force to have
sex
Have sex with
another woman
Number of men
Age 15-19 31.4 16.0 13.4 15.2 2.7 57.2 994 20-24 29.8 20.3 15.5 19.0 6.1 59.8 643 25-29 31.0 22.3 15.7 23.3 6.9 54.6 586 30-34 34.0 21.7 17.6 24.8 8.4 54.5 439 35-39 35.2 22.6 16.7 25.4 8.2 54.1 553 40-44 35.7 26.1 18.7 28.2 8.9 50.5 462 45-49 35.9 24.7 17.6 24.9 7.2 48.0 400 Employment (past 12 months) Not employed 18.9 8.9 5.2 10.1 1.2 72.8 538 Employed for cash 26.6 15.5 11.6 17.4 4.0 63.4 973 Employed not for cash 38.1 25.7 19.9 26.0 8.3 47.9 2,564 Marital status Never married 29.6 17.0 13.4 15.7 3.4 59.5 1,865 Married or living together 35.6 24.5 17.8 26.8 8.6 50.8 2,158 Divorced/separated/widowed 33.2 25.5 31.6 32.3 17.2 57.8 53 Number of living children 0 29.6 17.3 13.6 16.7 3.7 59.1 2,009 1-2 35.5 24.7 18.1 26.4 10.1 52.6 638 3-4 35.3 22.5 17.0 26.5 7.3 52.2 720 5+ 37.0 27.3 19.8 27.6 9.5 47.5 709 Residence Urban 23.6 12.8 6.2 11.2 2.3 67.6 1,102 Rural 36.2 24.1 19.6 25.7 7.8 50.1 2,974 District Aileu 13.0 3.3 1.1 2.7 0.7 85.9 181 Ainaro 8.7 7.4 0.4 7.3 0.0 82.6 217 Baucau 65.7 36.5 56.9 67.5 12.2 9.8 415 Bobonaro 16.6 14.8 34.7 24.2 0.7 35.0 357 Covalima 81.6 66.5 6.6 5.8 2.7 6.8 236 Dili 11.6 4.8 1.2 5.9 0.2 81.0 797 Ermera 41.7 35.1 33.5 44.2 27.7 48.5 491 Lautem 76.4 27.4 7.7 7.0 4.0 22.1 308 Liquiçá 3.8 2.4 2.1 2.3 0.0 92.1 252 Manatuto 1.1 0.3 0.3 0.6 0.3 98.6 190 Manufahi 33.7 5.8 6.2 6.2 5.4 64.6 137 Oecussi 65.5 64.4 23.5 72.9 16.7 17.7 235 Viqueque 10.0 5.6 2.0 6.2 0.0 84.3 260 Education No education 29.7 24.6 21.6 27.5 9.5 52.8 791 Primary 32.9 23.0 17.6 25.8 6.3 51.8 1,046 Secondary 35.0 19.7 14.2 19.1 5.6 55.5 2,009 More than secondary 24.6 12.4 5.2 8.2 2.1 69.6 230 Wealth quintile Lowest 38.6 24.3 14.1 25.4 5.0 48.7 728 Second 32.7 23.3 19.5 24.1 8.8 52.7 781 Middle 35.3 21.4 21.6 25.5 8.1 50.6 786 Fourth 37.2 24.3 16.5 22.5 7.7 52.0 849 Highest 22.3 13.5 9.3 13.2 2.5 67.6 932
Total 15-49 32.8 21.1 16.0 21.8 6.3 54.9 4,076
Note: Total includes one man missing information on employment status.
220 | Women’s Empowerment and Demographic and Health Outcomes
Of all the specified reasons, men are most likely to agree that a husband has the right to get angry and reprimand his wife if she refuses to have sex with him (33 percent) and least likely to agree with having forced sex with his wife (16 percent). As men’s level of education increases, they are less likely to agree that a husband has the right to exhibit any of the specified behaviors. For example, 10 percent of men with no education condone negative behaviors, compared with 2 percent of men with more than secondary education. A similar relationship is seen with respect to wealth quintile, with the exception of men in the lowest wealth quintile. As household wealth rises from the second quintile to the highest quintile, the percentage of men who support all the specified reasons decreases from 9 percent to 3 percent, respectively. Men therefore exhibit the expected pattern; that is, urban, educated, and wealthy men are more tolerant of women’s sexual rights.
Table 15.8 provides a brief overview on how the three basic empowerment indicators—number of decisions in which women participate, number of reasons for which wife beating is justified, and number of reasons for refusing to have sexual intercourse with husband—relate to each other.
The first index shows the number of decisions in which women participate alone or jointly with their husband. This index ranges in value from 0 to 4 and is positively related to women’s empowerment. It reflects the degree of decisionmaking control that women are able to exercise in areas that affect their lives and environments. The second index is the number of reasons for which the respondent thinks that a husband is justified in beating his wife. This index ranges in value from 0 to 5. A lower score on this indicator is interpreted as reflecting a greater sense of entitlement and self-esteem, and higher status for women. The final index is the number of circumstances in which the respondent feels that a woman is justified in refusing sexual intercourse with her husband or partner. This index ranges in value from 0 to 3 and is positively related to women’s sense of self-esteem and empowerment. It reflects perceptions of sexual roles and women’s rights over their bodies.

Women’s Empowerment and Demographic and Health Outcomes | 221
Table 15.8 Indicators of women’s empowerment
Percentage of women age 15-49 who participate in all decisionmaking, percentage who disagree with all reasons for justifying wife beating, and percentage who agree with all reasons for refusing sexual intercourse with husband, by value on each of the indicators of women's empowerment, Timor-Leste 2009-10
Currently married women
Percentage who disagree with all the
reasons justifying
wife beating
Percentage who agree with
all the reasons for refusing sexual
intercourse with husband
Empowerment indicator
Percentage who participate in all decision-
making1 Number of
womenNumber of
women
Number of decisions in which women participate1
0 na 95 18.3 65.0 95 1-2 na 765 8.2 53.6 765 3-4 na 7,047 11.6 57.8 7,047
Number of reasons for which wife beating is justified2
0 76.6 895 na 39.4 1,815 1-2 70.2 1,867 na 41.1 2,984 3-4 74.0 3,414 na 47.8 5,552 5 76.5 1,730 na 73.5 2,785
Number of reasons given for refusing to have sexual intercourse with husband3
0 72.2 876 30.6 na 2,566 1-2 74.9 2,484 8.0 na 3,930 3 73.7 4,546 10.8 na 6,640
na = Not applicable 1 Restricted to currently married women. See Table 15.5.1 for the list of decisions. 2 See Table 15.6.1 for the list of reasons 3 See Table 15.7.1 for the list of reasons
Table 15.8 shows these three indicators of women’s empowerment and how they relate to each other. It shows the percentage of married women age 15-49 who participate in all decisionmaking, the percentage of women who disagree with all the specified reasons for justifying wife beating, and the percentage of women who agree with all the specified reasons for a wife refusing to have sexual intercourse with her husband, by the value on each of the indicators. In general, the expectation is that women who participate in making household decisions are more likely to have gender-egalitarian beliefs.
The findings on women’s empowerment indicate that among women who participate in all the
decisions, 58 percent justified their right to refuse sexual intercourse with their husband for all reasons, compared with women who participated in 1-2 decisions (54 percent) and in no decisions (65 percent). Similarly, women who participated in all decisions are more likely to disagree with all the reasons for justifying wife beating (12 percent) than women who participate in fewer decisions (8 percent). However, it is also important to point out that women who participate in no decisions are most likely to disagree with all the reasons for justifying wife beating (18 percent). This anomalous pattern is difficult to explain. Similarly, women who do not support wife beating for any reason at all are most likely to participate in all the decisionmaking in the household (77 percent), but this percentage is similar to women who justify all five reasons for wife beating. The direction of the relationship between participation in decisionmaking and reasons to justify wife beating is not clear. Similarly, there is no strong relationship between participation decisionmaking and the number of reasons for refusing sexual intercourse with a husband. This may be attributed to the fact that Timorese women in general exhibit a culture of tolerance and acceptance of male domination, since the majority of women mentioned that it is acceptable for a man to beat his wife for at least one reason (86 percent as seen in Table 15.6.1).
It is also noteworthy to point out that women who disagree with all the reasons justifying wife beating are also most likely to not accept any reason for a woman to refuse sexual intercourse with her husband (31 percent), and this percentage decreases to 8 percent for women who accept at least one to two reasons and 11 percent for women who accept all three reasons.

222 | Women’s Empowerment and Demographic and Health Outcomes
15.7 CURRENT USE OF CONTRACEPTION BY WOMEN’S STATUS
A woman’s desire and ability to control her fertility and her choice of contraceptive method are in part affected by her status in the household and her own sense of empowerment. A woman who feels that she is unable to control her life may be less likely to feel that she can make and carry out decisions about her fertility. She may also feel the need to choose methods that are less obvious or which do not depend on her husband’s cooperation. Table 15.9 shows the distribution of currently married women by contraceptive method used, according to the three empowerment indicators.
The data indicate that there is a positive relationship between use of contraception and participation in household decisionmaking. For example, current use of modern contraceptive methods rises from 13 percent among women who participate in none of the household decisions to 21 percent among women who participate in one or more household decisions. Also noteworthy is the finding that women who believe that wife beating is justified for all of the five specified reasons are most likely to use a method of contraception. There is no clear trend in using a method of contraception and the belief in a woman’s right to refuse sexual intercourse with her husband. Perhaps this could also be attributed to the fact that women less often justify a wife refusing sex with her husband for any reason due to cultural norms.
Table 15.9 Current use of contraception by women's status
Percent distribution of currently married women age 15-49 by current contraceptive method, according to selected indicators of women's status, Timor-Leste 2009-10
Modern methods
Empowerment indicator Any
method
Any modern method
Female sterilization
Temporary modern female
methods1 Male
condom
Any traditional method
Not currently
using Total
Number of
women
Number of decisions in which women participate2
0 16.2 12.5 0.0 12.5 0.0 3.8 83.8 100.0 95 1-2 23.8 21.4 0.7 20.7 0.0 2.4 76.2 100.0 765 3-4 22.2 21.2 0.8 20.1 0.3 1.1 77.8 100.0 7,047
Number of reasons for which wife beating is justified3
0 19.1 18.2 0.8 17.4 0.0 0.9 80.9 100.0 895 1-2 23.0 21.7 1.2 20.2 0.2 1.3 77.0 100.0 1,867 3-4 22.3 21.3 0.7 20.3 0.3 0.9 77.7 100.0 3,414 5 23.5 21.6 0.6 20.8 0.2 1.9 76.5 100.0 1,730
Number of reasons given for refusing to have sexual intercourse with husband4
0 22.5 21.8 0.6 20.5 0.7 0.8 77.5 100.0 876 1-2 27.8 26.3 1.1 24.8 0.3 1.5 72.2 100.0 2,484 3 19.3 18.2 0.6 17.4 0.1 1.2 80.7 100.0 4,546 Total 22.3 21.1 0.8 20.1 0.2 1.2 77.7 100.0 7,906
Note: If more than one method is used, only the most effective method is considered in this tabulation. 1 Pill, IUD, injectables, implants, female condom, diaphragm, foam/jelly, lactational amenorrhea method and standard days method 2 See Table 15.5.1 for the list of decisions. 3 See Table 15.6.1 for the list of reasons 4 See Table 15.7.1 for the list of reasons
15.8 IDEAL FAMILY SIZE AND UNMET NEED BY WOMEN’S STATUS
The ability of women to make decisions effectively has important implications for their fertility preferences and the practice of family planning. An increase in women’s status and empowerment is recognized as important for efforts to reduce fertility through at least two main
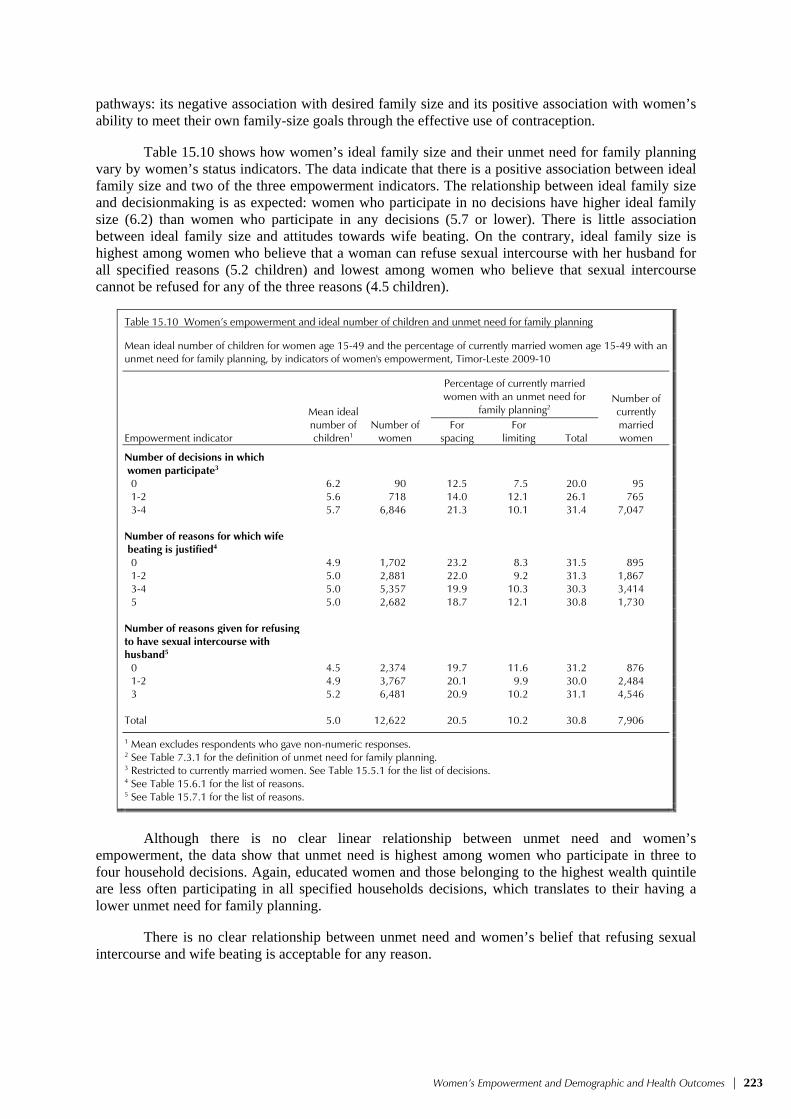
Women’s Empowerment and Demographic and Health Outcomes | 223
pathways: its negative association with desired family size and its positive association with women’s ability to meet their own family-size goals through the effective use of contraception.
Table 15.10 shows how women’s ideal family size and their unmet need for family planning vary by women’s status indicators. The data indicate that there is a positive association between ideal family size and two of the three empowerment indicators. The relationship between ideal family size and decisionmaking is as expected: women who participate in no decisions have higher ideal family size (6.2) than women who participate in any decisions (5.7 or lower). There is little association between ideal family size and attitudes towards wife beating. On the contrary, ideal family size is highest among women who believe that a woman can refuse sexual intercourse with her husband for all specified reasons (5.2 children) and lowest among women who believe that sexual intercourse cannot be refused for any of the three reasons (4.5 children).
Table 15.10 Women’s empowerment and ideal number of children and unmet need for family planning
Mean ideal number of children for women age 15-49 and the percentage of currently married women age 15-49 with an unmet need for family planning, by indicators of women's empowerment, Timor-Leste 2009-10
Mean ideal number of children1
Percentage of currently married women with an unmet need for
family planning2 Number of currently married women Empowerment indicator
Number of women
For spacing
For limiting Total
Number of decisions in which women participate3
0 6.2 90 12.5 7.5 20.0 95 1-2 5.6 718 14.0 12.1 26.1 765 3-4 5.7 6,846 21.3 10.1 31.4 7,047
Number of reasons for which wife beating is justified4
0 4.9 1,702 23.2 8.3 31.5 895 1-2 5.0 2,881 22.0 9.2 31.3 1,867 3-4 5.0 5,357 19.9 10.3 30.3 3,414 5 5.0 2,682 18.7 12.1 30.8 1,730
Number of reasons given for refusing to have sexual intercourse with husband5
0 4.5 2,374 19.7 11.6 31.2 876 1-2 4.9 3,767 20.1 9.9 30.0 2,484 3 5.2 6,481 20.9 10.2 31.1 4,546 Total 5.0 12,622 20.5 10.2 30.8 7,906
1 Mean excludes respondents who gave non-numeric responses. 2 See Table 7.3.1 for the definition of unmet need for family planning. 3 Restricted to currently married women. See Table 15.5.1 for the list of decisions. 4 See Table 15.6.1 for the list of reasons. 5 See Table 15.7.1 for the list of reasons.
Although there is no clear linear relationship between unmet need and women’s
empowerment, the data show that unmet need is highest among women who participate in three to four household decisions. Again, educated women and those belonging to the highest wealth quintile are less often participating in all specified households decisions, which translates to their having a lower unmet need for family planning.
There is no clear relationship between unmet need and women’s belief that refusing sexual intercourse and wife beating is acceptable for any reason.

224 | Women’s Empowerment and Demographic and Health Outcomes
15.9 REPRODUCTIVE HEALTH CARE BY WOMEN’S STATUS
Table 15.11 shows women’s use of antenatal, delivery, and postnatal care services by the three indicators of women’s empowerment. In societies where health care is widespread, women’s empowerment may not affect their access to reproductive health services. In other societies, however, increased empowerment of women is likely to increase their ability to seek out and use limited health services to better meet their own reproductive health goals, including the goal of safe motherhood.
Table 15.11 Reproductive health care by women’s empowerment
Percentage of women age 15-49 with a live birth in the five years preceding the survey who received antenatal care, delivery assistance, and postnatal care from health personnel for the most recent birth, by indicators of women's empowerment, Timor-Leste 2009-10
Empowerment indicator
Received antenatal care from health personnel
Received delivery
assistance from health
personnel
Received postnatal care from health personnel
within the first two days since
delivery1
Number of women with a child born in the past five
years
Number of decisions in which women participate2
0 85.3 36.4 20.7 66 1-2 84.5 43.9 34.9 528 3-4 86.6 32.4 23.6 5,208
Number of reasons for which wife beating is justified3
0 80.6 33.2 22.4 658 1-2 87.3 37.0 26.2 1,413 3-4 87.7 34.3 25.8 2,585 5 84.1 27.7 21.8 1,360
Number of reasons given for refusing to have sexual intercourse with husband4
0 85.9 45.0 29.3 642 1-2 89.9 42.9 32.6 1,850 3 84.0 26.2 19.6 3,523 Total 86.0 33.3 24.6 6,015
Note: “Health personnel” includes doctor, nurse, midwife, or assistant nurse. 1 Includes deliveries in a health facility and not in a health facility 2 Restricted to currently married women. See Table 15.5.1 for the list of decisions. 3 See Table 15.6.1 for the list of reasons. 4 See Table 15.7.1 for the list of reasons.
The data indicate that there is a correlation between women’s status, as measured by the
number of reasons for justifying wife beating, and utilization of health services. Women who believe that wife beating is justified for all five reasons are less likely to receive antenatal care, delivery assistance, or postnatal care from health personnel than women who believe that wife beating is justified for one to two reasons. The relationship between utilization of health services and the other two women’s empowerment indicators is less clear. As antenatal care is widely accessible to most women, differences by empowerment index are not clearly reflected.

Domestic Violence | 225
DOMESTIC VIOLENCE 16
In the words of former United Nations Secretary General, Kofi Annan, “violence against women is perhaps the most shameful human rights violation. And it is perhaps the most pervasive. It knows no boundaries of geography, culture, or wealth. As long as it continues, we cannot claim to be making real progress towards equality, development, and peace” (UNIFEM, 2003).
The World Health Organization (WHO) defines domestic violence as “the intentional use of physical force or power, threatened or actual, against oneself, another person, or against a group or community, that either results in or has a high likelihood of resulting in injury, death, psychological harm, mal-development, or deprivation” (Krug et al., 2002). Domestic violence is defined here as any act of violence resulting in physical, sexual, or psychological harm or suffering to women, girls, and also men, including threats of such acts, coercion, or arbitrary deprivation of liberty.
Domestic violence is the most common form of gender-based violence in Timor-Leste.
Studies have indicated that Timor-Leste has a long history of culturally accepted forms of domestic violence. People prefer not to talk about domestic violence, as it is considered a private matter. Therefore, reporting on domestic violence is considered a societal taboo. It is expressed that “Gender-based violence is widespread in Timor-Leste, yet perpetrators are rarely punished. Family disputes and domestic violence is often considered a ‘normal,’ yet very private occurrence within the family” (Concern.net, 2008).
It is not a common practice to seek justice through traditional justice systems; the perpetrators
of gender-based violence cannot simply be punished or removed from the community. Often the family of the perpetrator gives animals (water buffalos, goats, or pigs) to the victim’s family. This gift opens an avenue of reconciliation that concludes with a ceremony, usually a feast, indicating that there are no more hard feelings and no need for social disturbances. After the conclusion of such a ceremony, the perpetrator is once again allowed to move around freely. A baseline study conducted in 2007 in the two districts of Covalima and Bobonaro indicated that the patriarchal belief of women’s role in society, religion, and preconceived notions of sexuality make discussions of sexual and gender-based violence nearly impossible (UNMIT, 2009).
After a concerted lobbying effort led by the Office of the Secretariat of State for the Promotion of Equality, the United Nations Population Fund (UNFPA), the United Nations Development Fund for Women (UNIFEM), UNMIT and local and international NGOs, the National Parliament in Timor-Leste passed a Law Against Domestic Violence on May 3, 2010, which came into force one month later. These efforts represented the culmination of seven years’ work, which involved harmonization with relevant provisions of the Timorese Criminal Code. The Law Against Domestic Violence clearly states that crimes of domestic violence are public crimes and also provides for medical, legal, and psycho-social support for survivors. However, consideration of the law did not occur until 2009 after the penal code was approved which included domestic violence as a punishable crime for the first time under Timorese or Indonesian rule (UNIFEM, 2010). The law was finally promulgated by the President on June 21, 2010.
The 2009-10 TLDHS included a series of questions that focus on specific aspects of domestic
and interpersonal violence. The module addresses women’s experience of interpersonal violence, including acts of physical, sexual, and emotional violence. Information was collected on both domestic violence (also known as spousal violence or intimate partner violence) and violence by other family members or unrelated individuals. Specifically, this chapter presents the findings on women who ever experienced interpersonal violence—physical violence since the age of 15, lifetime experience of sexual violence—and women who experienced partner violence ever and in the past 12 months. In addition, detailed information is presented on partner violence, including the physical consequences of violence and when partner violence began.

226 | Domestic Violence
16.1 MEASUREMENT OF VIOLENCE Collecting valid, reliable, and ethical data on intimate partner violence poses particular challenges because (1) what constitutes violence or abuse varies across cultures and individuals; (2) a culture of silence usually surrounds domestic violence and can affect reporting; and (3) the topic is a sensitive one. Ensuring the safety of respondents and interviewers when asking about domestic violence in a familial setting and protecting women who disclose violence raises specific ethical concerns. The responses to these challenges by the 2009-10 TLDHS are described below. 16.1.1 The Use of Valid Measures of Violence The 2009-10 TLDHS measures violence committed by spouses and other household members. Accordingly, information was obtained from ever-married women on violence by spouses and by others, and from never-married women on violence by anyone, including boyfriends/ girlfriends. International research on violence shows that intimate partner violence is one of the most common forms of violence against women. Thus, spousal/partner violence was measured in more detail than violence by other perpetrators by using a modified Conflict Tactics Scale (CTS) (Strauss, 1990). Specifically, spousal violence was measured using the following set of questions for women: (Does/did) your (last) husband/partner ever do any of the following things to you? 1. Push you, shake you, or throw something at you? 2. Slap you? 3. Twist your arm or pull your hair? 4. Punch you with his fist or with something that could hurt you? 5. Kick you, drag you, or beat you up? 6. Try to choke you or burn you on purpose? 7. Threaten or attack you with a knife, gun, or any other weapon?
8. Physically force you to have sexual intercourse with him even when you did not want to?
9. Force you to perform any sexual acts you did not want to? When the answer to the question was “yes,” women (with the exception of widows) were asked about the frequency of the act in the 12 months preceding the survey. A “yes” answer to one or more of items 1-7 above constitutes evidence of physical violence, while a “yes” answer to items 8 or 9 constitutes evidence of sexual violence. Emotional violence among ever-married women was measured in a similar way, using the following set of questions: (Does/did) your (last) husband ever: 1. Say or do something to humiliate you in front of others? 2. Threaten to hurt or harm you or someone close to you? 3. Insult you or make you feel bad about yourself? This approach of asking about specific acts to measure different forms of violence has the advantage of not being affected by different understandings of what constitutes a summary term such as violence. By including a wide range of acts, this approach has the additional advantage of giving the respondent multiple opportunities to disclose any experience of violence. In addition to these questions asked only of ever-married women, all women were asked about physical violence from persons other than their current or most recent spouse/partner with the question: From the time you were 15 years old, has anyone [other than your (current/last) husband/

Domestic Violence | 227
partner] hit, slapped, kicked, or done anything else to hurt you physically? Respondents who answered this question in the affirmative were asked who had done this to them and the frequency of such violence during the 12 months preceding the survey. All women were also asked: At any time in your life, as a child or as an adult, has anyone ever forced you in any way to have sexual intercourse or perform any other sexual acts? Respondents who said “yes” were then asked questions about the age at which this first happened and the person who committed the act. Although this approach to questioning is generally considered to be optimal, the possibility of underreporting of violence, particularly sexual violence, cannot be entirely ruled out in any survey. 16.1.2 Ethical Considerations Three specific protections were built into the questionnaire, in accordance with the World Health Organization’s ethical and safety recommendations for research on domestic violence (WHO, 2001b):
• Only one eligible person in each household was administered the questions on violence. Individual interviews using TLDHS Women’s Questionnaires were carried out in every household selected for the DHS survey (that is, 11,463 households in the sample). The domestic violence module was administered to women in one-third of households selected for the TLDHS individual interview. The DHS protocol specifies that the domestic violence module can only be administered to one randomly selected person per household. Therefore, in households with more than one eligible woman, the respondent for the module was randomly selected through a specially designed simple selection procedure (based on the ‘Kish Grid’), which was built into the Household Questionnaire. Interviewing only one person in each household using the domestic violence module provides assurance to the selected respondent that other respondents in the household will not talk about the types of questions the selected respondent was asked.
• Informed consent for the survey was obtained from the respondent at the beginning of the individual interview. In addition, at the beginning of the domestic violence section respondents were read an additional statement informing them that the subsequent questions could be sensitive and reassuring them of the confidentiality of their responses.
• The domestic violence module was implemented only if privacy could be obtained. If privacy could not be obtained, the interviewer was instructed to skip the module, thank the respondent, and end the interview. If a translator was needed to conduct the interview, respondents were not asked questions from the domestic violence module to maintain privacy.
16.1.3 Special Training for Implementing the Domestic Violence Module Complete privacy is also essential for ensuring the security of the respondent and the interviewer. Asking about or reporting violence, especially in households where the perpetrator may be present at the time of interview, carries the risk of further violence. Accordingly, interviewers were provided specific training for implementing the domestic violence module in order to enable the field staff to collect violence data in a secure, confidential, and ethical manner. Although most women interviewed do not necessarily ask for help, some abused women may ask the interviewer for assistance. To prepare for this possibility, interviewers were provided with a nationwide list of available network services at the district level for women facing violence. These included contact information on central and regional offices of Psychosocial Recovery and

228 | Domestic Violence
Development East Timor (PRADET), Polisia National Timor-Leste (PNTL), Forum Komunikasi Untuk Perempuan Timor Lorosa’e (FOKUPERS), and Institute Maun Alin iha Kristo (ISMAIK). PRADET supports victims of violence through its Fatin Hakmatek (Safe Place) program. Fatin Hakmatek provides services through a treatment facility and coordinates with other agencies to extend services in the country (Trembath and Grenfell, 2007). The Vulnerable Person’s Unit under the PNTL provides services to victims of violence, including gender-based violence, and has extensive coverage with an office in each district. The main focus of FOKUPERS is on providing counseling, assistance, and safe house or shelter facilities to individuals who fall victim to domestic and sexual violence in Maliana, Suai, Ermera, and Liquiçá districts (Trembath and Grenfell, 2007). These organizations form the gender-based violence referral network that provides coordinated services in Timor-Leste.
The interviewers were trained to provide respondents with information on where they can seek help from officers at the district level. These officers are responsible for handling social welfare matters in the district, including the welfare of children and families. However, the interviewers were instructed to be very careful when providing such information, as in some cases men in the household may turn more violent towards women when they see such documents. 16.1.4 Characteristics of the Sub-sample of Respondents for the Domestic Violence Module
Given that only one person was administered the domestic violence module in each selected household and that the violence module was not administered if privacy could not be obtained, 65 of the 3,022 women eligible for the violence module had to be excluded because of lack of privacy, and six women refused to be interviewed with the domestic violence module. It is noteworthy that the age, marital status, and residential, regional, educational, and wealth index distributions of the sub-sample of respondents selected for the violence module are virtually identical to the entire TLDHS sample of respondents and therefore representative of the reporting domains selected for the TLDHS (data not shown).
16.2 EXPERIENCE OF DOMESTIC VIOLENCE BY WOMEN
This section of the chapter discusses women’s experience of violence by any individual. The data on domestic violence for women are weighted differently from the rest of the data collected in the Women’s Questionnaires. This was done to adjust for the fact that only one person per household was interviewed with the domestic violence module and to cater for nonresponse.
The section begins by examining the experience of physical violence since age 15 and physical violence during pregnancy, and continues with findings on women’s lifetime experience of sexual violence. Background characteristics associated with increased risk of violence are also discussed. This report mainly presents information on domestic violence against women.
Table 16.1 shows the percentage of women who have ever experienced physical violence since age 15, and in the past 12 months, by background characteristics. Approximately one-third of women (38 percent) have experienced physical violence since the age 15. Twenty-nine percent of women experienced physical violence often or sometimes in the past 12 months. One percent of women experienced physical violence often, while 28 percent experienced physical violence sometimes in the past 12 months.

Domestic Violence | 229
Table 16.1 Experience of physical violence
Percentage of women age 15-49 who have ever experienced physical violence since age 15 and percentage who have experienced physical violence during the 12 months preceding the survey, by background characteristics, Timor-Leste 2009-10
Percentage who
have ever experienced
physical violence since age 151
Percentage who have experienced physical violence in the
past 12 months
Background characteristic Often Sometimes
Often or sometimes
Number of women
Current age 15-19 30.3 0.1 24.6 24.7 700 20-24 34.8 1.3 25.7 27.0 513 25-29 48.1 0.7 37.9 38.6 403 30-39 43.6 2.2 31.2 33.4 765 40-49 36.5 1.2 23.3 24.4 570
Employed past 12 months Not employed 39.6 0.9 30.1 30.9 1,795 Employed for cash 42.9 4.5 24.6 29.1 219 Employed not for cash 34.3 0.9 25.0 25.9 937
Marital status Never married 28.7 0.1 21.4 21.4 992 Married or living together 42.3 1.3 32.4 33.7 1,843 Divorced/separated/widowed 52.9 7.9 16.5 24.4 116
Number of living children 0 29.4 0.1 22.2 22.3 1,106 1-2 44.3 2.1 34.5 36.6 527 3-4 44.3 1.2 32.0 33.2 594 5+ 41.9 2.0 29.0 31.0 724
Residence Urban 48.7 0.6 33.7 34.3 700 Rural 34.9 1.3 26.3 27.6 2,251
District Aileu 39.8 1.3 19.9 21.2 128 Ainaro 10.5 0.3 7.3 7.6 160 Baucau 44.3 3.5 31.0 34.5 334 Bobonaro 14.4 0.0 14.1 14.1 281 Covalima 57.4 0.4 57.0 57.4 177 Dili 52.7 1.0 31.8 32.8 474 Ermera 24.2 0.7 16.7 17.4 357 Lautem 53.1 1.1 41.2 42.3 192 Liquiçá 34.5 0.0 25.7 25.7 179 Manatuto 16.5 0.0 10.6 10.6 135 Manufahi 75.6 1.6 63.3 65.0 114 Oecussi 56.3 1.5 42.3 43.9 201 Viqueque 21.1 2.3 18.2 20.4 219
Education No education 37.4 1.4 27.6 29.0 896 Primary 41.1 1.8 30.6 32.4 695 Secondary 36.6 0.7 27.1 27.8 1,268 More than secondary 45.6 0.0 26.6 26.6 91
Wealth quintile Lowest 35.2 1.1 27.4 28.4 567 Second 36.8 2.3 27.0 29.3 572 Middle 36.2 1.2 27.1 28.3 597 Fourth 36.9 0.7 29.7 30.4 594 Highest 45.2 0.5 29.1 29.6 620 Total 38.1 1.1 28.1 29.2 2,951
Note: Includes women who are married by age 15.1 Includes in the past 12 months
The proportion of women who have ever experienced physical violence is highest among
women age 25-29. These women are also more likely to report having experienced physical violence sometimes or often in the past 12 months (39 percent). Women who are employed for cash are more likely to report having experienced physical violence since age 15 than women who are unemployed or employed but not for cash. This may be an indication that working women who have an independent source of cash income may pose a challenge to the established norm of being dependent

230 | Domestic Violence
on their male partners for their livelihood, and therefore this role reversal may subject them to greater violence.
Formerly married women (divorced, separated, or widowed) are more likely to have ever experienced physical violence since age 15 than currently married and never-married women (53 percent, compared with 42 and 29 percent, respectively). Formerly married women are also more likely to have experienced physical violence often in the past 12 months (8 percent) than currently married women (1 percent), perhaps indicating the vulnerable position of women who have lost their spouse and become dependent on others for their basic needs.
Women with no living children are the least likely to have experienced physical violence in the past 12 months. There is no clear pattern of rates of physical violence experienced by women with children. Urban women are more likely to have ever experienced physical violence since the age of 15 compared with rural women (49 percent compared with 35 percent). This is corroborated by the fact that more than half of the women in Dili district, which is primarily urban, reported experiencing physical violence since the age of 15 years. Women in Manufahi (76 percent) are most likely to report having ever experienced physical violence. Experience of physical violence in the past 12 months is highest among women in Manufahi (65 percent) and lowest in Ainaro (8 percent). The proportion of women who have ever experienced physical violence is highest among women with more than secondary education (46 percent) and those belonging to households in the highest wealth quintile (45 percent). This supports the assumption that highly educated women are usually from wealthier households, primarily located in urban areas and more likely to have access to cash earnings. These women may be victims of spousal violence because they have broken the cultural norms in a patriarchal society. On the other hand, it is also possible that educated, wealthier, and urban women are more likely to report any violence because they recognize that any form of violence is unacceptable, in contrast to their counterparts, who may be more accepting of violence against women as part and parcel of life and hence less likely to report their experience. 16.3 PERPETRATORS OF PHYSICAL VIOLENCE AGAINST WOMEN
Table 16.2 identifies the perpetrators of physical violence, by women’s current marital status. The percentages do not sum to 100 because respondents could have experienced violence at the hands of several people. Among ever-married women who have ever experienced physical violence, 74 percent reported that a current husband or partner committed the physical violence against them, while 6 percent reported that they experienced physical violence by a former husband/partner. Other perpetrators commonly reported by ever-married women were mother/stepmother (34 percent) and father/stepfather (26 percent), sisters and brothers (11 percent), and other relatives (6 percent).
Table 16.2 Persons committing physical violence
Among women age 15-49 who have experienced physical violence since age 15, percentage who report specific persons who committed the violence, according to the respondent’s marital status, Timor-Leste 2009-10
Marital status
PersonEver
married Never
married Total
Current husband/partner 73.8 na 55.2 Former husband/partner 6.3 na 4.7 Current boyfriend 0.0 0.4 0.1 Former boyfriend 0.5 0.0 0.4 Father/ stepfather 25.7 59.1 34.2 Mother/ stepmother 34.2 64.5 41.9 Sister/brother 11.3 26.7 15.2 Daughter/ son 0.4 1.6 0.7 Other relative 5.9 8.2 6.5 Mother-in-law 0.2 na 0.2 Father-in-law 0.4 na 0.3 Teacher 1.4 12.8 4.3 Employer/ someone at work 0.0 1.2 0.3 Other 1.1 1.0 1.1
Number of women 842 284 1,126
na= Not applicable

Domestic Violence | 231
Among women who have never been married, parents are the most common perpetrators of physical violence. Sixty-five percent reported mother/step-mother and 59 percent father/step-father as their perpetrators. Among never-married women, 27 percent also reported physical violence committed by siblings while 13 percent reported teachers as the perpetrators.
16.4 WOMEN’S EXPERIENCE OF FORCE AT SEXUAL INITIATION
The 2009-10 TLDHS investigated women’s experience of sexual violence, including a question on whether the respondent’s first sexual intercourse was forced against her will. Because the idea of force can be interpreted in various ways, the question was worded as follows: The first time you had sexual intercourse, would you say that you had it because you wanted to or because you were forced to do it against your will? Table 16.3 shows that only 1 percent of women said their first sexual experience was forced against their will. This proportion is relatively higher among those who first had sex before age 15 (4 percent).
In addition to the question on whether first sexual intercourse was forced, the 2009-10 TLDHS included two sets of questions on sexual violence. Sexual violence limits women’s ability to practice safe sex and to protect themselves from sexually transmitted infections and unwanted pregnancies (Krug et al., 2002). The first set of questions asked about sexual violence committed by their current spouse, if they were currently married, and the most recent spouse, if they were currently divorced, separated, or widowed. The second set of questions asked all respondents, irrespective of marital status, whether they had ever, as a child or as an adult, experienced sexual violence. Sexual violence here includes being forced to have sexual intercourse or perform any other sexual acts against one’s will. Tables 16.3 through 16.5 present the results on the experience of any sexual violence. The findings on sexual violence among women by a spouse or intimate partner are explored later in the chapter. 16.5 EXPERIENCE OF SEXUAL VIOLENCE AND
PERPETRATORS OF SEXUAL VIOLENCE As shown in Table 16.4, about 3 percent of women have experienced sexual violence. Women age 30-39 are slightly more likely than other women to have experienced sexual violence. Women who are employed for cash are twice as likely to face sexual violence compared with women who do not work and those who work but not for cash income. Women who work in a cash economy may be more likely to encounter violence in their workplace compared with women employed in a non-cash economy who usually work for a family member and at home or closer to home.
A higher proportion of women who are divorced/separated/widowed (9 percent) have experienced sexual violence compared with never-married women.
Table 16.3 Force at sexual initiation
Percentage of women age 15-49 who have ever had sexual intercourse who say that their first experience of sexual intercourse was forced against their will, by age at first sexual intercourse and whether the first sexual intercourse was at the time of first marriage or before, Timor-Leste 2009-10
Percentage whose first
sexual intercourse was forced against their
will
Number of women who
have ever had sex
Age at first sexual intercourse <15 3.7 103 15-19 0.9 865 20-24 1.1 682 25-29 0.3 198 30-49 1.9 64 Missing 1.4 54
First sexual intercourse was: At the time of first marriage/first cohabitation 1.1 1,717
Before first marriage/ first cohabitation1 1.0 194
Missing 1.4 54
Total 1.1 1,966
1 Includes never-married women

232 | Domestic Violence
Table 16.4 Experience of sexual violence
Percentage of women age 15-49 who have ever experienced sexual violence, by background characteristics, Timor-Leste 2009-10
Background characteristic
Percentage who have ever
experienced sexual violence1
Number of women
Current age 15-19 2.0 700 20-24 2.4 513 25-29 3.9 403 30-39 5.1 765 40-49 3.3 570
Employed past 12 monthsNot employed 3.3 1,795 Employed for cash 6.1 219 Employed not for cash 2.9 937
Marital status Never married 1.3 992 Married or living together 4.1 1,843 Divorced/separated/widowed 9.3 116
Residence Urban 3.5 700 Rural 3.3 2,251
District Aileu 6.6 128 Ainaro 2.6 160 Baucau 7.0 334 Bobonaro 1.4 281 Covalima 2.6 177 Dili 2.3 474 Ermera 3.4 357 Lautem 6.8 192 Liquiçá 4.5 179 Manatuto 2.3 135 Manufahi 1.4 114 Oecussi 2.9 201 Viqueque 0.4 219
Education No education 3.9 896 Primary 3.9 695 Secondary 2.9 1,268 More than secondary 0.0 91
Wealth quintile Lowest 3.4 567 Second 4.8 572 Middle 3.2 597 Fourth 3.0 594 Highest 2.5 620
Total 3.4 2,951
1 Includes those whose sexual initiation was forced against their will
Urban-rural differences in experience of sexual violence are minimal. By district, the
proportion of women who have experienced sexual violence ranges from less than 1 percent in Viqueque to 7 percent in Baucau, Lautem, and Aileu. Women with no education (4 percent) are slightly more likely to experience sexual violence than women with secondary or higher levels of education. Sexual violence is also slightly lower among women in the highest wealth quintile than those in the other wealth quintiles. The 2009-10 TLDHS also collected information on age at first sexual violence and perpetrators of sexual violence. For 16 percent of women who ever experienced sexual violence, the first experience of such violence occurred at age 15-19; 6 percent first experienced sexual violence at age 10-14; and less than 1 percent first experienced sexual violence before age 10. One in ten women

Domestic Violence | 233
who experienced sexual violence first experienced it at age 20-49 (data not shown). It is important to note that in the 2009-10 TLDHS questionnaire, if a respondent experienced sexual violence committed only by their current spouse/partner (or the most recent spouse if they are currently divorced/separated), and their sexual initiation was not forced against their will, information was not collected on age at first experience of sexual violence.
The main perpetrators of sexual violence against ever-married women are current husbands/partners (71 percent) or former husbands/partners (9 percent). Seven percent of all women who have experienced sexual violence experienced it at the hands of current or former boyfriends, while 6 percent of women each experienced sexual violence committed by a relative other than their husband, boyfriend, father, or step-father; 4 percent experienced sexual violence committed by strangers (data not shown). 16.6 EXPERIENCE OF DIFFERENT TYPES OF VIOLENCE Table 16.5 shows the percentage of respondents who have experienced different forms of physical and sexual violence, by age. Overall, 36 percent of women age 15-49 have experienced only physical violence, while 1 percent have experienced only sexual violence. About 2 percent of women have experienced both physical and sexual violence, and nearly two in five women (39 percent) have experienced either physical or sexual violence. The likelihood of having experienced either physical or sexual violence increases with age, from 31 percent among women age 15-19 to 49 percent among women age 25-29 before declining to 38 percent among women in their 40s.
Table 16.5 Experience of different forms of violence
Percentage of women age 15-49 who have experienced different forms of violence, by current age, Timor-Leste 2009-10
Age Physical
violence only Sexual
violence only1
Physical and sexual
violence1
Physical or sexual
violence1Number of
women
15-19 28.5 0.2 1.8 30.5 700 15-17 28.2 0.2 0.1 28.5 446 18-19 29.1 0.1 4.7 33.9 254 20-24 33.9 1.5 0.9 36.3 513 25-29 44.9 0.8 3.1 48.8 403 30-39 40.0 1.4 3.6 45.1 765 40-49 34.5 1.3 2.0 37.8 570 Total 35.8 1.0 2.3 39.2 2,951
1 Includes forced sexual initiation
16.7 VIOLENCE DURING PREGNANCY Women who have ever been pregnant were asked about the experience of physical violence during pregnancy. The findings presented in Table 16.6 indicate that overall, 4 percent of women in Timor-Leste experienced physical violence during pregnancy. By background characteristics, the results show that violence during pregnancy is higher among women age 30-39, unemployed women, formerly married women, women with five or more children, rural women, women living in Liquiçá, women with no education, and women in the lowest wealth quintile, than among their counterparts in the other categories.

234 | Domestic Violence
Table 16.6 Violence during pregnancy
Among women age 15-49 who have ever been pregnant, percentage who have ever experienced physical violence during pregnancy, by background characteristics, Timor-Leste 2009-10
Background characteristic
Percentage who have ever
experienced physical
violence during pregnancy
Number of women who
have ever been pregnant
Current age 15-19 3.2 63 20-24 2.6 257 25-29 2.4 329 30-39 4.9 717 40-49 3.5 539
Employed past 12 monthsNot employed 4.3 1,064 Employed for cash 1.5 167 Employed not for cash 3.2 675
Marital status Never married * 1 Married or living together 3.4 1,792 Divorced/separated/widowed 8.8 113
Number of living children0 1.1 61 1-2 3.9 527 3-4 3.1 594 5+ 4.3 724
Residence Urban 2.7 460 Rural 4.0 1,445
District Aileu 3.6 72 Ainaro 0.6 99 Baucau 4.7 224 Bobonaro 0.0 170 Covalima 0.9 107 Dili 3.3 326 Ermera 2.8 216 Lautem 11.1 136 Liquiçá 12.3 113 Manatuto 0.5 74 Manufahi 5.1 80 Oecussi 4.1 138 Viqueque 0.0 150
Education No education 4.8 733 Primary 3.6 483 Secondary 2.7 636 More than secondary (1.8) 54
Wealth quintile Lowest 5.1 376 Second 3.6 380 Middle 4.3 368 Fourth 3.7 378 Highest 1.9 404
Total 3.7 1,905
Note: Figures in parentheses are based on 25-49 unweighted cases. An asterisk indicates that a figure is based on fewer than 25 unweighted cases and has been suppressed.
16.8 MARITAL CONTROL
The International Rescue Committee reported in two studies conducted in 2003 that more than half of Timorese women felt unsafe in their relationship with their husband (IRC, 2003a) and 25 percent had experienced violence from an intimate partner (IRC, 2003b).

Domestic Violence | 235
Domestic violence is not limited to physical and sexual violence. Verbal abuse, restrictions on freedom of movement, and withholding funds can also constitute violent behavior. This section of the chapter examines women’s experiences of marital control. Table 16.7 shows the percentage of ever-married women whose husbands have exhibited various types of behaviors aimed at controlling their wife/partner.
Table 16.7 Degree of marital control exercised by husbands
Percentage of ever-married women age 15-49 whose husband/partner ever demonstrates specific types of controlling behaviors, according to background characteristics, Timor-Leste 2009-10
Percentage of women whose husband:
Background characteristic
Is jealous or angry if she talks to other
men
Frequently accuses her of being
unfaithful
Does not permit her to
meet her female friends
Tries to limit her contact with her family
Insists on knowing
where she is at all times
Does not trust her with any money
Displays 3 or more of the
specific behaviors
Displays none of
the specific
behaviors Number
of women Current age 15-19 21.3 19.7 16.4 8.4 49.0 6.3 16.0 46.8 67 20-24 36.1 17.3 10.7 3.3 36.7 8.5 16.1 49.2 271 25-29 36.4 15.5 9.8 6.3 32.3 9.4 14.5 47.0 341 30-39 27.9 13.4 7.4 3.3 27.5 7.6 11.1 56.6 729 40-49 29.9 15.8 8.0 3.4 29.3 6.2 14.7 55.3 551 Employed past 12 months Not employed 33.1 14.0 9.3 4.5 30.8 8.1 13.7 51.6 1,094 Employed for cash 42.3 20.2 10.7 3.4 38.7 17.0 15.6 38.9 170 Employed not for cash 24.5 15.9 7.5 3.5 29.1 4.5 12.9 59.2 695 Number of living children 0 35.3 23.0 14.9 8.8 35.9 8.8 22.6 50.9 115 1-2 33.9 16.6 9.1 3.7 33.1 8.6 14.0 49.0 527 3-4 32.0 13.7 9.6 3.9 29.2 7.7 13.0 53.8 594 5+ 27.0 14.2 6.8 3.6 29.8 6.6 12.3 56.1 724 Marital status and duration Currently married woman 30.7 14.3 8.6 3.8 30.6 7.1 13.0 53.6 1,843 Married only once 30.8 14.3 8.6 3.9 30.9 7.1 13.1 53.3 1,817 0-4 years 34.4 16.3 10.5 4.8 36.3 6.8 15.3 48.2 332 5-9 years 34.9 16.1 9.7 4.3 32.4 10.8 14.5 49.8 352 10+ years 28.5 13.2 7.8 3.5 28.8 6.0 12.0 55.8 1,133 Married more than once (19.1) (11.6) (8.2) (0.0) (13.5) (5.6) (10.8) (73.6) 26 Divorced/separated/widowed 34.2 29.4 10.5 7.0 34.6 16.4 22.1 47.7 116 Residence Urban 51.9 27.6 14.7 6.6 42.8 14.7 24.9 31.3 468 Rural 24.2 11.3 6.9 3.2 27.1 5.4 10.0 60.1 1,491 District Aileu 23.2 10.5 11.0 7.0 18.0 7.0 9.0 68.2 74 Ainaro 17.4 7.9 10.7 3.7 29.5 3.1 9.6 62.3 100 Baucau 48.1 9.0 5.5 3.3 30.4 7.8 8.1 43.5 230 Bobonaro 10.6 8.0 5.6 1.2 6.2 3.5 5.9 82.9 172 Covalima 11.1 19.2 4.0 0.6 28.0 0.0 8.0 66.6 115 Dili 66.8 34.0 17.0 6.1 45.2 18.5 30.3 19.8 336 Ermera 37.8 22.4 9.4 4.5 56.2 4.4 22.4 39.4 225 Lautem 28.6 12.3 12.7 10.2 27.8 11.0 16.2 53.6 136 Liquiçá 8.1 3.7 5.4 2.9 8.9 7.7 5.8 77.6 115 Manatuto 13.1 6.6 4.6 2.4 17.5 5.0 7.5 77.9 79 Manufahi 17.5 5.9 4.6 1.6 48.5 2.5 6.5 45.7 84 Oecussi 16.4 11.0 4.8 3.8 8.8 6.1 5.1 74.0 140 Viqueque 15.0 9.6 6.2 2.1 36.6 4.0 8.1 58.2 153 Education No education 24.0 13.0 7.3 2.9 28.1 5.1 11.1 59.6 753 Primary 29.2 16.6 9.7 6.0 31.3 8.1 16.0 54.6 495 Secondary 37.5 15.7 9.5 3.7 33.2 8.9 13.7 46.5 656 More than secondary (60.7) (27.3) (11.7) (5.1) (37.1) (22.7) (23.8) (32.7) 54 Wealth quintile Lowest 17.8 8.9 6.0 2.7 21.4 3.1 7.1 67.5 392 Second 27.6 11.7 8.7 4.5 30.8 8.3 11.8 57.0 389 Middle 26.1 15.2 9.0 3.8 29.5 4.5 12.7 56.1 379 Fourth 30.9 15.9 7.1 3.5 31.3 7.7 14.4 52.5 385 Highest 50.5 23.7 12.6 5.5 40.7 14.0 21.4 34.1 415 Total 30.9 15.2 8.8 4.0 30.9 7.6 13.6 53.2 1,959
Note: Husband/partner refers to the current husband/partner for currently married women and the most recent husband/partner for divorced, separated, or widowed women. Figures in parentheses are based on 25-49 unweighted cases.

236 | Domestic Violence
To determine the degree of marital control husbands exercise over their wives, ever-married women were asked whether their current or last husband exhibited each of the following controlling behaviors: a) becomes jealous or gets angry if she talks to other men; b) accuses her of being unfaithful; c) does not permit meetings with female friends; d) tries to limit contact with her family; e) insists on knowing where she is at all times; and f) does not trust her with any money.
The accumulation of such behaviors is more significant than the results for any single
behavior and so, the proportion of women whose husbands exhibited at least three of the specified behaviors is highlighted.
The findings show that nearly one in three (31 percent) ever-married women reported that
their husbands insist on knowing where they are at all times; a similar proportion (31 percent) said that their husbands get jealous or angry if they talk to other men; and 15 percent said that their husbands frequently accuse them of being unfaithful. Nearly one in 10 women reported that their husbands do not allow them to meet with their female friends, and 8 percent said that their husbands do not trust them with money. Relatively uncommon is a husband’s attempt to limit his wife’s contact with her family (reported by only 4 percent of ever-married women). Fourteen percent of women said that their husbands exhibit three or more of the above-mentioned controlling behaviors, and 53 percent said that their husbands exhibit none of the controlling behaviors. There is hardly any difference in the proportion of ever-married women who report that their husbands exhibit three or more of the specified behaviors by age. There is an inverse relationship between the number of living children a woman has and the degree of control her husband exercises over them. For example, 23 percent of women with no living children reported that their husbands exhibit three or more of the specified controlling behaviors, compared with 12 percent of women with five or more children. Women who were formerly married (22 percent) are more likely than currently married women (13 percent) to say that their former husbands exhibited three or more of the controlling behaviors.
The extent to which husbands exhibit three or more controlling behaviors is higher among urban women (25 percent) than the rural women (10 percent). This finding corroborates the fact that women in urban areas more often face domestic violence as discussed earlier in this chapter. Men in Dili (30 percent), Ermera (22 percent), and Lautem (16 percent) are more likely to exercise controlling behavior over their wives. Differences by education are not significant. Women in the highest wealth quintile report higher proportions of controlling behaviors exhibited by their husbands.
16.9 TYPES OF SPOUSAL VIOLENCE This section of the chapter is devoted to violence perpetrated by intimate partners who are married to the respondent or who live with the respondent as if married. Since spousal or intimate partner violence is the most common form of violence among women age 15-49, the 2009-10 TLDHS collected detailed information on the different types of violence experienced—physical, sexual, and emotional. Currently married women were asked about violence perpetrated by their current husband, and formerly married women were asked about violence perpetrated by their most recent husband. Respondents were asked about seven specific acts of physical violence, two acts of sexual violence, and three acts of emotional violence. The acts are listed in Table 16.8. The table shows that 34 percent of ever-married women have ever experienced physical violence at the hands of their husband or partner, and 31 percent have experienced physical violence in the past 12 months. Three percent have ever experienced sexual violence, and 2 percent experienced sexual violence in the past 12 months. The findings also show that 8 percent of women have ever experienced emotional violence and have experienced emotional violence in the past 12 months. Overall, 36 percent of ever-married women have experienced some kind of violence (physical, sexual, or emotional) by a husband or partner.

Domestic Violence | 237
Table 16.8 Forms of spousal violence
Percentage of ever-married women age 15-49 who have experienced various forms of violence ever or in the 12 months preceding the survey, committed by their husband/partner, Timor-Leste 2009-10
In the past 12 months1
Form of violence Ever Often Sometimes Often or
sometimes
Physical violence Any 33.5 1.7 29.0 30.7
Pushed her, shook her, or threw something at her 14.7 0.9 13.1 14.0
Slapped her 30.4 1.1 26.6 27.7 Twisted her arm or pulled her hair 7.9 0.8 6.7 7.4
Punched her with his fist or with something that could hurt her 5.3 0.0 4.8 4.9
Kicked her, dragged her, or beat her up 7.9 0.4 6.8 7.2
Tried to choke her or burn her on purpose 1.2 0.1 1.0 1.1
Threatened her or attacked her with a knife, gun, or any other weapon 0.9 0.0 0.6 0.6
Sexual violence Any 2.9 0.1 1.9 2.0
Physically forced her to have sexual intercourse with him even when she did not want to 2.0 0.1 1.6 1.7
Forced her to perform any sexual acts she did not want to 1.2 0.0 0.9 0.9
Sexual initiation was with current or most recent husband and was forced2 0.8 na na na
Emotional violence Any 8.3 1.5 6.2 7.7
Said or did something to humiliate her in front of others 5.8 1.0 4.3 5.3
Threatened to hurt or harm her or someone close to her 3.2 0.5 2.5 3.0
Insulted her or made her feel bad about herself 3.9 1.0 2.5 3.5
Any form of physical and/or sexual violence 34.6 1.7 29.8 31.5
Any form of physical and sexual violence 1.8 0.1 1.0 1.2
Any form of emotional, physical, and/or sexual violence 36.1 2.2 31.1 33.3
Any form of emotional, physical, and sexual violence 1.0 0.1 0.6 0.7
Number of ever married women 1,959 1,890 1,890 1,890
Note: Husband/partner refers to the current husband/partner for currently married women and the most recent husband/partner for divorced, separated, or widowed women. 1 Excludes widows 2 Excludes women who have been married more than once since their sexual initiation could not have been with the current/ most recent partner na= Not applicable
Among the various physical acts of violence experienced by women in the past 12 months, slapping was the most commonly reported act, experienced by 28 percent of women. Fourteen percent of women were pushed, shaken, or had something thrown at them by their husband or partner, 7 percent had their arms twisted or hair pulled by their husband or partner, and 7 percent were kicked, dragged, or beaten up. Two percent of women were forced to have sex by their husband/partner when they did not want to (Figure 16.1).

238 | Domestic Violence
Figure 16.1 Percentage of Ever-married Women Who Have Experienced Specific Forms of Physical and Sexual Violence
Committed by Their Husband/Partner15
30
8
5
8
1
1
2
1
34
14
28
7
5
7
1
1
2
1
32
0 10 20 30 40
Percent
Ever
Past 12 monthsPushed her, shook her, or threw something at her
Slapped her
Twisted her arm or pulled her hair
Punched her with his fist orwith something that could hurt her
Kicked her, dragged her, or beat her up
Tried to choke her or burn her on purpose
Threatened her or attacked herwith a knife, gun, or any other weapon
Physically forced her to have sexual intercourse with him even when she did not want to
Forced her to perform any sexual acts she did not want to
At least one of these acts
Timor-Leste 2009-10
Table 16.9 shows the experience of spousal violence among ever-married women by background characteristics. Women age 25-29 are generally more likely to have experienced emotional, physical, or sexual violence than those in the older or younger age groups. For instance, more than two in five women age 25-29 experienced all three forms of violence, compared with less than one in three women in the other cohorts. The findings show that women who are unemployed are most likely to experience emotional, physical, or sexual violence (39 percent).
Table 16.9 Spousal violence by background characteristics
Percentage of ever-married women age 15-49 by whether they have ever experienced emotional, physical or sexual violence committed by their husband/partner, according to background characteristics, Timor-Leste 2009-10
Emotional violence
Physical violence Sexual violence
Physical or sexual violence
Emotional, physical or
sexual violence Number of
women
Current age 15-19 12.1 22.7 9.2 29.8 30.9 67 20-24 6.2 30.9 3.0 32.8 33.8 271 25-29 8.2 40.3 2.1 40.9 42.7 341 30-39 8.9 35.3 3.4 35.9 37.1 729 40-49 8.1 29.5 1.8 30.2 32.3 551 Employed last 12 months Not employed 9.7 36.2 2.7 36.9 38.6 1,094 Employed for cash 13.0 31.9 6.5 35.7 36.3 170 Employed not for cash 4.9 29.7 2.3 30.7 32.1 695 Number of living children 0 5.7 24.8 1.8 26.6 26.6 115 1-2 9.8 33.5 3.2 35.3 37.7 527 3-4 6.7 35.4 2.4 36.1 37.3 594 5+ 9.0 33.4 3.2 34.0 35.5 724
Continued…

Domestic Violence | 239
Table 16.9—Continued
Emotional violence
Physical violence Sexual violence
Physical or sexual violence
Emotional, physical or
sexual violence Number of
women
Marital status and duration Currently married woman 7.2 33.3 2.6 34.1 35.3 1,843 ..Married only once 7.2 33.4 2.6 34.1 35.4 1,817 ....0-4 years 5.6 29.1 2.1 30.1 31.6 332 ....5-9 years 6.3 36.5 1.6 36.7 37.6 352 ....10+ years 8.0 33.7 3.1 34.5 35.8 1,133 ..Married more than once (7.0) (30.3) (0.0) (30.3) (30.3) 26 Divorced/separated/widowed 25.5 36.1 7.7 42.5 48.4 116 Residence Urban 13.8 43.9 3.4 45.5 48.5 468 Rural 6.6 30.2 2.7 31.1 32.2 1,491 District Aileu 7.7 22.5 5.4 26.5 28.0 74 Ainaro 3.1 11.0 0.5 11.5 13.0 100 Baucau 15.4 28.5 7.4 30.5 32.7 230 Bobonaro 3.0 22.1 1.8 23.3 24.2 172 Covalima 3.5 44.7 0.0 44.7 44.7 115 Dili 13.9 43.7 2.5 45.5 48.0 336 Ermera 2.5 16.1 1.2 16.1 17.0 225 Lautem 27.4 55.5 6.5 56.0 61.2 136 Liquiçá 4.0 24.0 4.1 25.3 26.2 115 Manatuto 2.2 10.6 2.1 11.1 12.0 79 Manufahi 4.7 77.0 1.3 77.6 77.6 84 Oecussi 4.6 53.8 2.4 54.8 55.3 140 Viqueque 2.1 25.7 0.5 25.7 26.2 153 Education No education 9.2 31.3 2.9 32.4 34.4 753 Primary 7.5 37.5 3.0 38.2 38.7 495 Secondary 8.1 32.4 3.0 33.8 35.5 656 More than secondary (5.1) (40.7) (0.0) (40.7) (43.5) 54 Wealth quintile Lowest 7.3 33.5 3.4 34.8 35.8 392 Second 8.5 34.5 3.6 35.4 36.5 389 Middle 6.5 28.9 2.9 29.4 30.1 379 Fourth 8.7 33.2 1.6 34.1 37.3 385 Highest 10.5 37.1 2.8 38.7 40.3 415
Respondent’s father beat her mother
Yes 11.6 56.4 4.9 57.8 59.2 632 No 5.9 20.9 1.7 21.9 23.9 999 DK 9.2 28.0 2.5 28.6 28.9 324 Total 8.3 33.5 2.9 34.6 36.1 1,959
Note: Husband/partner refers to the current husband/partner for currently married women and the most recent husband/partner for divorced, separated or widowed women. Total includes 4 women with information missing on whether their fathers beat their mothers. Figures in parentheses are based on 25-49 unweighted cases.
As expected, marital status shows a strong association with experience of violence. Women
who are divorced, separated, or widowed are more likely to have experienced violence than other women. This finding suggests that the experience of violence may have contributed to the likelihood of the termination of a relationship. Currently married women who have been married for five years or more are more likely to experience emotional, physical, or sexual violence than women who have been married for less than five years.

240 | Domestic Violence
By residence, urban women are more likely to experience violence than rural women. Women in Manufahi (78 percent), Lautem (61 percent), Oecussi (55 percent), and Dili (48 percent) are more likely to have ever experienced emotional, physical, or sexual violence than their counterparts in other districts. There is no distinct pattern between women experiencing violence committed by their husband by education. Women in the highest wealth quintile are slightly more likely to experience the three types of violence. Women with a history of family violence—whose father beat their mother —are more than twice as likely to experience all three types of violence from a husband or partner than women whose fathers or mothers were not abusive. This indicates that violence is accepted as a normal part of life.
16.10 VIOLENCE BY SPOUSAL CHARACTERISTICS AND EMPOWERMENT INDICATORS
The perpetrators of spousal violence are usually husbands or partners, and it is therefore important to understand their characteristics. It is also useful to examine whether spousal violence varies with indicators of women’s status. Table 16.10 shows the percentage of ever-married women who have ever experienced different forms of spousal violence by their current or most recent husband, by spousal characteristics and women’s empowerment indicators.
Husbands who have primary education are more likely to exhibit violent behavior against their wives/partners while those with no education and those with higher education are less likely to be violent.
The husband’s alcohol consumption is strongly related to the wife’s reporting of violence. For
example, the proportion of ever-married women who report having experienced emotional, physical, or sexual violence from their husbands varies from 26 percent among those whose husbands do not drink at all to 60 percent among those whose husbands get drunk very often.
Women who are of the same age as their husband are more likely to experience emotional,
physical, or sexual violence. Women in marriages in which neither spouse is educated are less likely to report experiencing violence from their husbands than those where both have equal levels of education (31 percent and 40 percent, respectively).
Results show that there is a strong relationship between women’s empowerment status and their experience of spousal violence. Women whose husbands display five to six controlling behaviors are more likely to report experiencing emotional, physical, or sexual violence by their husbands than women whose husbands display no controlling behaviors (58 and 29 percent, respectively). Women who participate in three or four household decisions are less likely to experience spousal violence than women who participate in fewer decisions. Women with one or two reasons justifying the refusal to have sexual intercourse with their husbands are more likely to experience all three types of violence from their husbands than those with no reasons. Views about wife beating also appear to be related to actual experience of physical abuse. Women who believe that wife beating is justified for any of the five specified circumstances are more likely to report having experienced emotional, physical, or sexual violence from their husbands than women who do not think wife beating is justified for any reason (36 and 19 percent, respectively). To some extent, this pattern could be due to women’s rationalization of the abuse they have experienced.

Domestic Violence | 241
Table 16.10 Spousal violence by husband’s characteristics and empowerment indicators
Percentage of ever-married women age 15-49 who have ever suffered emotional, physical, or sexual violence committed by their husband/partner, according to his characteristics, marital characteristics, and empowerment indicators, Timor-Leste 2009-10
Emotional violence
Physical violence
Sexual violence
Physical or sexual
violence
Emotional, physical, or
sexual violence
Number of women
Husband’s/partner’s education No education 7.4 27.9 1.5 28.6 30.0 590 Primary 10.0 39.1 3.8 40.4 42.1 573 Secondary 8.3 33.9 3.3 35.0 36.6 701 More than secondary 4.4 31.0 2.2 32.6 33.5 94
Husband’s/partner’s alcohol consumption
Does not drink 4.7 24.5 2.7 25.6 26.1 926 Drinks/never gets drunk 2.9 26.0 2.9 26.0 27.1 68 Gets drunk sometimes 10.5 42.2 2.6 43.4 45.1 889 Gets drunk very often 31.6 47.3 8.1 47.3 59.8 76
Spousal age difference1 Wife older 10.4 33.3 2.6 33.5 34.9 200 Wife is same age 5.7 38.1 0.6 38.1 41.1 124 Wife’s 1-4 years younger 7.7 34.8 2.0 35.6 37.2 634 Wife’s 5-9 years younger 6.0 28.8 3.0 30.0 30.8 544 Wife’s 10+ years younger 7.2 36.4 3.7 36.9 37.5 336
Spousal education difference Husband better educated 8.5 35.6 4.2 37.0 38.8 737 Wife better educated 8.3 33.1 2.2 33.8 35.2 649 Both equally educated 7.3 39.2 1.2 39.2 40.0 121 Neither educated 7.3 28.5 1.4 29.4 30.7 439
Number of marital control behaviors displayed by husband/partner
0 3.6 27.4 1.1 27.7 28.7 1,042 1-2 9.0 39.4 3.7 41.2 42.2 651 3-4 23.3 40.9 7.0 43.6 48.4 216 5-6 32.3 51.6 12.0 51.6 58.2 50
Number of decisions in which women participate1
0 (20.4) (36.3) (4.5) (40.8) (43.8) 25 1-2 15.5 37.8 6.9 38.0 40.2 175 3-4 6.1 32.8 2.1 33.5 34.7 1,643
Number of reasons given for refusing to have sexual intercourse with husband
0 2.5 29.1 1.7 29.4 30.5 210 1-2 10.2 46.0 2.6 46.6 48.5 592 3 8.4 27.9 3.3 29.3 30.8 1,157
Number of reasons for which wife beating is justified
0 3.5 15.5 1.0 16.5 18.6 203 1-2 8.4 37.7 3.8 39.6 40.7 530 3-4 8.7 34.5 2.9 35.4 37.5 779 5 9.6 34.9 2.6 35.3 36.1 447 Total 8.3 33.5 2.9 34.6 36.1 1,959
Note: Husband/partner refers to the current husband/partner for currently married women and the most recent husband/partner for divorced, separated, or widowed women. Total includes 2 women with information missing on husband’s education, 5 women with information missing on spousal age difference, and 15 women with information missing on spousal education difference. Figures in parentheses are based on 25-49 unweighted cases. 1 Includes only currently married women
16.11 FREQUENCY OF SPOUSAL VIOLENCE The percent distribution of ever-married women (excluding widows) who reported physical or sexual violence by their current or most recent spouse in the 12 months preceding the survey by frequency with which violence was experienced, according to selected background characteristics, is not shown separately because the numbers associated with most cells are too small for meaningful statistical analysis by each background characteristic. Ninety-one percent of women who ever experienced emotional violence by their current or most recent husband have experienced such

242 | Domestic Violence
violence in the 12 months preceding the survey, and 17 percent of them experienced emotional violence often (data not shown). Similarly, 91 percent of women who have ever experienced physical or sexual violence by their current or most recent husband have experienced such violence in the 12 months preceding the survey, and 5 percent have experienced such violence often. 16.12 ONSET OF SPOUSAL VIOLENCE
To examine the timing of the onset of marital violence, the 2009-10 TLDHS asked ever-married women who had experienced physical or sexual spousal violence when the first episode of violence took place. Violence starts early in marriage in Timor-Leste, with 15 percent of ever-married women reporting the onset of violence within two years of marriage. For about 5 percent of the women who had experienced violence, the violence was initiated three to five years after marriage (data not shown).
16.13 TYPES OF INJURIES TO WOMEN RESULTING FROM SPOUSAL VIOLENCE In the 2009-10 TLDHS, women who ever experienced spousal physical violence—or sexual violence—were asked about the physical consequences of the violence. Specifically, they were asked if, as a consequence of what their spouse did to them, they ever had: a) cuts, bruises or aches; b) eye injuries, sprains, dislocations, or burns; and c) deep wounds, broken bones, broken teeth, or any other serious injury. Table 16.11 shows the percentage of ever-married women who reported any spousal physical violence or sexual violence, by type of injuries sustained.
About one in five women who have ever experienced physical violence or sexual violence by their current or most recent husband/partner received at least one of the injuries asked about. Cuts, bruises, and aches are the most common injuries sustained by women for any type of violence. One percent of women reported receiving deep wounds, broken bones, broken teeth, or other serious injuries. A similar pattern is seen for women who experienced spousal violence in the past 12 months.
Table 16.11 Injuries to women due to spousal violence
Percentage of ever-married women age 15-49 who have experienced specific types of spousal violence by types of injuries resulting from what their husband/partner did to them, according to the type of violence and whether they have experienced the violence ever and in the 12 months preceding the survey, Timor-Leste 2009-10
Type of violence Cuts, bruises,
or aches
Eye injuries, sprains,
dislocations, or burns
Deep wounds, broken bones, broken teeth, or any other serious injury
Any of these
injuries
Number of ever married
women
Experienced physical violence1 Ever2 18.7 4.4 1.0 19.8 656 In the past 12 months3 17.8 4.3 0.9 18.9 579
Experienced sexual violence4 Ever2 (53.6) (18.2) (0.0) (56.2) 46 In the past 12 months3 (59.8) (21.5) (0.0) (62.9) 39
Experienced physical or sexual violence4 Ever2 19.3 5.0 1.0 20.4 673 In the past 12 months3 18.8 5.1 0.9 19.8 596
Note: Husband/partner refers to the current husband/partner for currently married women and the most recent husband/partner for divorced, separated, or widowed women. Figures in parentheses are based on 25-49 unweighted cases. 1 Excludes women who experienced physical violence only during pregnancy 2 Includes in the past 12 months 3 Excludes widows 4 Excludes women whose sexual initiation was forced but who have not experienced any other form of physical or sexual violence

Domestic Violence | 243
16.14 Physical Violence by Women against Their Spouse
Violence by husbands against wives is not the only form of spousal violence; women may sometimes be the perpetrators of violence. In most cultures, however, the level of spousal violence initiated by wives is only a fraction of the level of spousal violence initiated by husbands. To measure spousal violence by women, the 2009-10 TLDHS also asked women about violence they themselves initiated against their spouse or other intimate partner. Specifically, women were asked: Have you ever hit, slapped, kicked, or done anything else to physically hurt your (last) husband/partner at times when he was not already beating or physically hurting you? Respondents who said yes to this question were asked about the frequency of such violence in the 12 months preceding the survey.
Table 16.12 shows the percentage of ever-married women (excluding widows) who have ever initiated violence against their current or most recent husbands and the percentage of all ever-married women who say that they have initiated spousal violence in the 12 months preceding the survey. Results shown indicate that overall, 6 percent of ever-married women report that they have ever initiated physical violence against their current or most recent husbands, while 5 percent say that they have committed such violence in the 12 months preceding the survey.
Differentials by background characteristics for women who initiate physical violence against their current or most recent husbands are generally small. Women who reported experiencing physical violence at the hands of their husbands in the past 12 months (13 percent), women whose husbands get drunk sometimes (8 percent), and women in urban areas (8 percent) are more likely to initiate physical violence against their husbands than other women.
Table 16.12 Violence by women against their spouse
Percentage of ever-married women age 15-49 who have committed physical violence against their husband/partner when he was not already beating or physically hurting them ever and in the past 12 months, according to women’s own experience of spousal violence and their own and husband’s/partner’s characteristics, Timor-Leste 2009-10
Percentage who have committed physical violence against their
current or most recent husband/partner
Characteristic EverNumber of
women
In the past 12 months1
Number of women1
Woman’s experience of spousal physical violence
Ever 13.1 656 10.6 636 In the past 12 months 13.4 579 11.5 579 Not past 12 months/widow/missing 11.2 77 0.6 56 Never 1.7 1,303 1.5 1,254 Current age 15-19 10.4 67 7.6 67 20-24 7.1 271 7.2 267 25-29 7.4 341 5.8 335 30-39 4.9 729 3.9 706 40-49 4.0 551 2.9 514 Employed past 12 months Not employed 6.2 1,094 4.9 1,076 Employed for cash 8.1 170 7.9 160 Employed not for cash 4.0 695 3.1 654 Number of living children 0 2.2 115 1.7 111 1-2 7.2 527 6.4 509 3-4 5.4 594 4.3 574 5+ 5.0 724 3.8 696 Residence Urban 8.2 468 5.9 455 Rural 4.7 1,491 4.1 1,434
Continued…

244 | Domestic Violence
Table 16.12—Continued
Percentage who have committed physical violence against their
current or most recent husband/partner
Characteristic EverNumber of
women
In the past 12 months1
Number of women1
District Aileu 2.0 74 1.0 72 Ainaro 2.1 100 2.2 99 Baucau 3.8 230 3.9 225 Bobonaro 2.1 172 1.9 164 Covalima 4.0 115 4.2 110 Dili 7.8 336 5.5 326 Ermera 5.8 225 5.0 220 Lautem 15.0 136 12.2 131 Liquiçá 10.0 115 9.6 108 Manatuto 2.1 79 1.7 77 Manufahi 12.0 84 11.2 81 Oecussi 3.1 140 0.8 134 Viqueque 0.5 153 0.0 142 Wealth quintile Lowest 3.7 392 3.8 373 Second 5.3 389 5.0 372 Middle 5.2 379 2.7 367 Fourth 7.6 385 6.3 378 Highest 5.9 415 4.8 400 Marital status and duration Currently married woman 5.3 1,843 4.5 1,843 Married only once 5.2 1,817 4.4 1,817 0-4 years 6.6 332 6.0 332 5-9 years 5.9 352 4.8 352 10+ years 4.6 1,133 3.8 1,133 Married more than once (11.1) 26 (11.1) 26 Divorced/separated/widowed 9.0 116 7.6 47 Education No education 4.3 753 4.0 716 Primary 7.5 495 5.8 481 Secondary 5.3 656 4.0 644 More than secondary (8.9) 54 (7.3) 49 Husband’s/partner’s education No education 4.1 590 3.6 546 Elementary 5.6 573 3.8 561 High school 6.3 701 5.8 690 College 8.1 94 5.1 92
Husband’s/partner’s alcohol consumption
Does not drink 3.5 926 3.0 888 Drinks/never gets drunk 1.1 68 0.0 67 Gets drunk sometimes 7.9 889 6.4 861 Gets drunk very often 7.1 76 6.2 75 Spousal age difference2 Wife older 4.0 200 3.6 200 Wife is same age 6.0 124 6.0 124 Wife’s 1-4 years younger 5.6 634 4.9 634 Wife’s 5-9 years younger 3.7 544 2.5 544 Wife’s 10+ years younger 8.2 336 6.8 336 Spousal education difference Husband better educated 5.7 737 5.0 725 Wife better educated 6.0 649 4.5 629 Both equally educated 6.7 121 3.6 117 Neither educated 3.3 439 3.1 405 Total 5.5 1,959 4.5 1,890
Note: Husband/partner refers to the current husband/partner for currently married women and the most recent husband/partner for divorced, separated or widowed women. Total includes 2 women with information missing on husband’s education, 5 women with information missing on spousal age difference, and 15 women with information missing on spousal education difference. Figures in parentheses are based on 25-49 unweighted cases. 1 Excludes widows 2 Currently married women

Domestic Violence | 245
16.15 HELP-SEEKING BEHAVIOR OF WOMEN WHO EXPERIENCE VIOLENCE All respondents who have ever experienced physical or sexual violence by any person were asked a series of questions about whether and from whom they sought help to try to end the violence. This information is presented in Table 16.13.
About one in five women (24 percent) who experience violence seek help. Women who experience both physical and sexual violence1 (50 percent) are most likely to seek help. The percentage of respondents who seek help varies from 19 percent among women age 15-19 to 27 percent among women age 25-29. Unemployed women are less likely to seek help than those who are employed for cash (24 and 36 percent, respectively). Women with no living children are slightly less likely to seek help than other women. Formerly married women (53 percent) who experienced physical violence are more likely to seek help than other respondents.
District-level differences are large and could be due to differences in the degree of adherence to ingrained cultural norms. For example, 7 percent of women who experienced violence in Manufahi sought help, compared with one in two women in Covalima (51 percent). Women with no education and those in the lowest and second wealth quintiles were less likely to seek help than other women. Urban women were more likely to seek help to end violence.
Women most often sought help from their own family members (82 percent) and from in-laws (27 percent). About 14 percent of women sought help from friends/neighbors. It is interesting to note that only 4 percent of women sought help from the police, while 1 percent of women sought help from social service organizations (data not shown separately).
16.16 FAMILY SUPPORT FOR ABUSED WOMEN IN NEED Women having a strong fallback position could be in a better position than those with no fallback position when faced with domestic
1 Physical violence here excludes violence during pregnancy, and sexual violence excludes those whose first sex was forced.
Table 16.13 Help seeking to stop violence
Among women age 15-49 who have ever experienced physical or sexual violence, percentage who fought back physically, fought back verbally or sought help from any source to end the violence according to type of violence and background characteristics, Timor-Leste 2009-10
Have sought help from any
source Number of
womenType of violence
Physical only 21.8 1,057 Sexual only (27.4) 31 Both physical and sexual 50.3 69
Current age 15-19 19.2 214 20-24 25.1 186 25-29 27.1 197 30-39 24.3 345 40-49 22.7 215
Employed past 12 months Not employed 23.7 727 Employed for cash 35.6 96 Employed not for cash 20.1 333
Number of living children 0 17.1 330 1-2 26.8 240 3-4 25.3 273 5+ 26.7 312
Marital status and duration Never married 16.8 287 Currently married woman 23.8 805 Married only once 23.8 792 0-4 years 27.9 129 5-9 years 24.5 164 10+ years 22.5 499 Married more than once 21.0 13 Divorced/separated/widowed 52.7 64
Residence Urban 31.4 348 Rural 20.3 808
District Aileu 11.1 57 Ainaro (19.1) 20Baucau 20.5 154 Bobonaro (31.4) 44 Covalima 50.9 102 Dili 34.4 251 Ermera (14.2) 88 Lautem 21.7 103 Liquiçá 17.6 65 Manatuto (22.8) 23 Manufahi 6.8 87 Oecussi 17.9 116 Viqueque (3.6) 46
Education No education 19.9 348 Primary 24.2 294 Secondary 25.2 472 More than secondary (33.8) 42
Wealth quintile Lowest 19.9 208 Second 16.7 218 Middle 23.7 222 Fourth 22.8 226 Highest 32.4 282
Total 23.7 1,156
Note: Excludes women whose sexual initiation was forced but who have not experienced any other form of physical or sexual violence. Figures in parentheses are based on 25-49 unweighted cases.

246 | Domestic Violence
violence. Support from family members, the maternal home, and social service organizations established to support women in vulnerable positions all play an important role. The 2009-10 TLDHS asked women if they needed help or had a problem if they have any family members who could provide shelter for a few nights and provide financial support if needed. Table 16.14 indicates that 27 percent of women mentioned that they have family members who can provide shelter for them for a few nights if they needed it. However, it is worth noting that the majority of women do not have any family support outside the house, which makes them more vulnerable to their situation. Younger women (age 15-24), women employed for cash, never-married women, rural residents, and women residing in Ainaro are less likely to receive shelter from their families for a few days than their counterparts. One in five women have family members who can support the women financially if they needed it, again hinting at the fact that a majority of these women do not have such support. Women in Lautem and Ainaro are more vulnerable regarding these types of support systems.
Table 16.14 Family support
Percentage of women age 15-49 whose family can provide them shelter and financial support if they need it, by background characteristics, Timor-Leste 2009-10
Background characteristic
Percentage of women whose family can give
them shelter for a few nights if they
need it
Percentage of women whose family can give them financial support if they
need it Number of
women
Current age 15-19 23.2 20.6 700 20-24 24.0 16.7 513 25-29 30.5 20.6 403 30-39 26.9 18.9 765 40-49 30.9 23.7 570
Employed last 12 months Not employed 27.6 20.9 1,795 Employed for cash 23.0 16.2 219 Employed not for cash 26.0 19.3 937
Marital status Never married 23.0 19.1 992 Married or living together 28.5 20.0 1,843 Divorced/separated/widowed 30.9 28.9 116
Residence Urban 30.0 19.9 700 Rural 25.7 20.1 2,251
District Aileu 38.9 14.2 128 Ainaro 4.8 5.1 160 Baucau 53.2 46.7 334 Bobonaro 30.5 25.5 281 Covalima 43.1 41.2 177 Dili 30.9 18.0 474 Ermera 24.2 23.4 357 Lautem 14.2 2.5 192 Liquiçá 13.6 13.3 179 Manatuto 19.9 10.5 135 Manufahi 9.7 8.6 114 Oecussi 20.5 12.0 201 Viqueque 13.2 8.9 219
Education No education 27.9 21.4 896 Primary 26.6 19.2 695 Secondary 25.7 19.6 1,268 More than secondary 31.8 20.7 91
Wealth quintile Lowest 23.7 17.4 567 Second 28.1 22.3 572 Middle 25.0 18.9 597 Fourth 27.2 21.1 594 Highest 29.6 20.6 620
Total 26.8 20.1 2,951

Domestic Violence | 247
16.17 SOCIAL NORMS AND VALUES
The fact that domestic violence is often perceived as a private matter that should not be discussed in public provides a rationale for further exploration of the extent of social norms and values that exists in a society. Studies have shown that the cultural acceptance of gender roles and behavior has led to the reinforcement of violence against women. The 2009-10 TLDHS explored women’s attitudes regarding two specific behaviors used as a proxy for justifying patriarchal behavior that puts men in a higher social position than women. The first question asked if women believed that ‘men cannot control their sexual behavior.’ If women agree that men have no control over their sexual behavior, then they may believe that men’s unwanted sexual advances towards women are somehow justified and cannot be construed as violence. The second question asked women if they thought that ‘marital rape is allowable,’ meaning whether women believe that within marriage they cannot refuse sexual advances from their husband and therefore marital rape does not constitute sexual violence.
It is interesting that nearly half of the women (47 percent) believed that men cannot control
their sexual behavior (Table 16.15). Women in the older age cohort are more likely to believe this, with more than half of the women above age 25 years agreeing with the statement. The data shows that women who work for cash, those residing in urban areas, those with higher education and those belonging to wealthier households are least likely to support this belief. Still, the belief is strongly ingrained in the culture. Eighty-three percent of women in Ermera hold this belief compared with 18 percent of women in Bobonaro.
About 29 percent of women in the 2009-10 TLDHS believed that marital rape is allowable,
giving the husband authority over a woman’s sexuality. Women in the older cohort are more likely to believe this statement. Similarly, women who work but not for cash, who are currently married, who reside in rural areas, and who are not educated are more likely to believe that marital rape is allowable. Women in Manatuto (55 percent) and Ermera (46 percent) are more likely to believe that marital rape is allowable, while those living in Covalima (12 percent) are least likely to believe this.
These findings demonstrate a need to raise awareness among women and men about individual rights in relation to sexuality and how they can work to reduce sexual violence. The responsibility for sexual assault lies with the perpetrators, who choose to engage in inappropriate behavior. Decreases over time in the proportion of women who believe that ‘men sometimes cannot control their sexual behavior’ or ‘marital rape is allowable’ may indicate an improvement in the level of awareness and empowerment. The data shown here can be a useful guide for program managers to initiate awareness-raising activities and human rights education interventions.
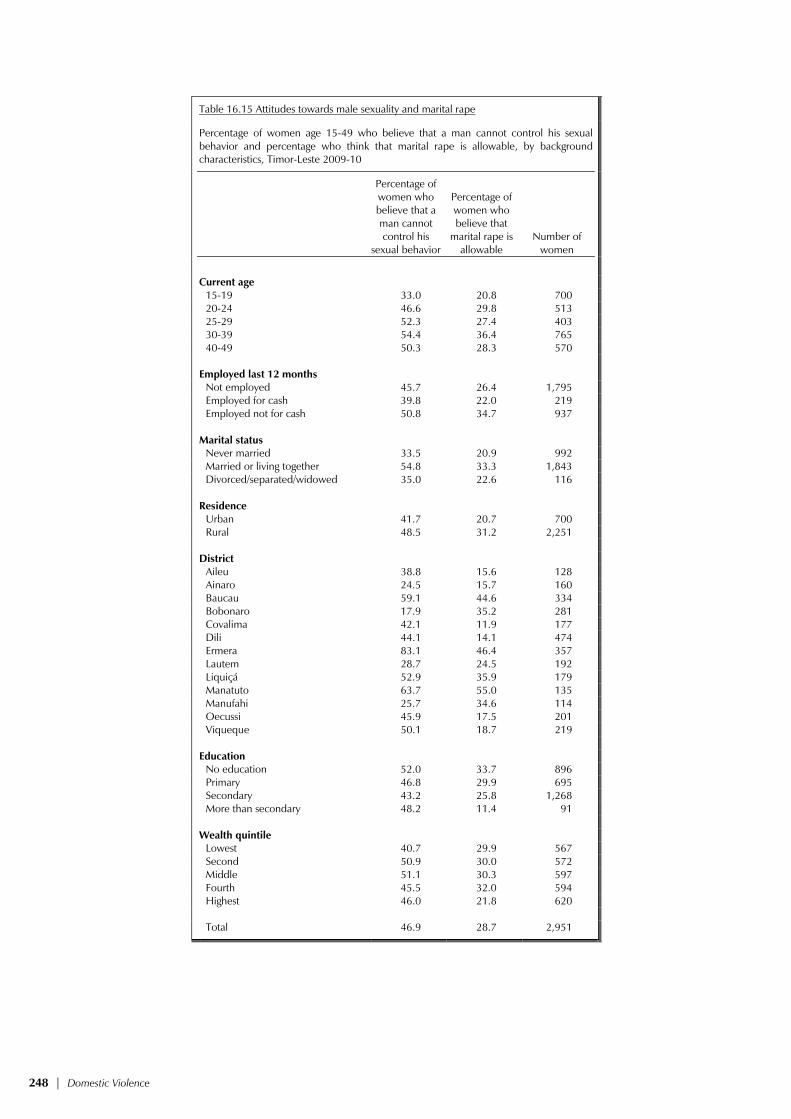
248 | Domestic Violence
Table 16.15 Attitudes towards male sexuality and marital rape
Percentage of women age 15-49 who believe that a man cannot control his sexual behavior and percentage who think that marital rape is allowable, by background characteristics, Timor-Leste 2009-10
Percentage of women who believe that a man cannot control his
sexual behavior
Percentage of women who believe that
marital rape is allowable
Number of women
Current age 15-19 33.0 20.8 700 20-24 46.6 29.8 513 25-29 52.3 27.4 403 30-39 54.4 36.4 765 40-49 50.3 28.3 570
Employed last 12 months
Not employed 45.7 26.4 1,795 Employed for cash 39.8 22.0 219 Employed not for cash 50.8 34.7 937 Marital status Never married 33.5 20.9 992 Married or living together 54.8 33.3 1,843 Divorced/separated/widowed 35.0 22.6 116 Residence Urban 41.7 20.7 700 Rural 48.5 31.2 2,251 District Aileu 38.8 15.6 128 Ainaro 24.5 15.7 160 Baucau 59.1 44.6 334 Bobonaro 17.9 35.2 281 Covalima 42.1 11.9 177 Dili 44.1 14.1 474 Ermera 83.1 46.4 357 Lautem 28.7 24.5 192 Liquiçá 52.9 35.9 179 Manatuto 63.7 55.0 135 Manufahi 25.7 34.6 114 Oecussi 45.9 17.5 201 Viqueque 50.1 18.7 219 Education No education 52.0 33.7 896 Primary 46.8 29.9 695 Secondary 43.2 25.8 1,268 More than secondary 48.2 11.4 91 Wealth quintile Lowest 40.7 29.9 567 Second 50.9 30.0 572 Middle 51.1 30.3 597 Fourth 45.5 32.0 594 Highest 46.0 21.8 620 Total 46.9 28.7 2,951

References | 249
REFERENCES
Acharya, M. 2010. Efforts at promotion of women in Nepal. Kathmandu, Nepal: Friedrich-Ebert-Stiftung. Kathmandu
AngloINFO. 2010. Education and schooling in Portugal. http://portugal.angloinfo.com/countries/portugal/schooling.asp
Centers for Disease Control and Prevention (CDC). 1998. Recommendations to prevent and control iron deficiencies in the United States. Morbidity and Mortality Weekly Report 47(RR-3): 1-30.
Central Bureau of Statistics (CBS) [Indonesia], State Ministry of Population/National Family Planning Coordinating Board (NFPCB), Ministry of Health (MOH), and Macro International Inc. (MI). 1998. Indonesia Demographic and Health Survey 1997. Calverton, Maryland: CBS and MI.
Central Intelligence Agency (CIA). 2010. World fact book of the United States Central Intelligence Agency. https://www.cia.gov/library/publications/the-world-factbook/geos/tt.html
Cody, C. (2009). Count every child: The right to birth registration. Woking, UK: Plan Ltd. http://plan-international.org/birthregistration/files/count-every-child-2009
Concern Worldwide. 2008. Gender-based violence in Timor-Leste. May 16, 2008. http://www.concern.net/news/gender-based-violence-timor-leste
Cooper, R.D., M.D. Edstein, S.P. Frances, and N.W. Beebe. 2010. Malaria vectors of Timor-Leste. Malaria Journal 9:40. doi:10.1186/1475-2875-9-40
Democratic Republic of Timor-Leste (DRTL). 2010. Democratic Republic of Timor-Leste UNGASS 2010 Country Progress Report, January 2008- December 2009. Dili, Timor-Leste: DRTL.
Fleischhacker, S. and S. Uhlin. 2004. Clashes and education in Timor-Leste. Thesis. Malmo, Sweden: Malmo University Electronic Publishing.
Graham, W., W. Brass, and R. Snow. 1989. Estimating maternal mortality: The sisterhood method. Studies in Family Planning 20(3): 125-135.
Head, J. 2006. “Analysis: E Timor’s security woes,” BBC News, May 24, 2006. http://news.bbc.co.uk/2/hi/asia-pacific/5012640.stm (accessed August 20, 2008)
Health Alliance International (HAI). 2005. Cultural practices and beliefs relating to pregnancy, birth and the post-partum period. Dili, Timor-Leste: HAI.
Health Alliance International (HAI) 2008. Maternal and child health in Timor-Leste: Final knowledge, practice and coverage survey report. Dili, Timor-Leste: HAI.
Health Alliance International (HAI). 2010. Key maternal and newborn health statistics in Timor-Leste. Compiled by HAI. Dili, Timor-Leste: HAI.
Heise, L., M. Ellsberg, and M. Gottemoeller. 1999. Ending violence against women. Population Reports, Series L, No. 11. Baltimore, Maryland, USA: Johns Hopkins University School of Public Health, Population Information Program.

250 | References
International Rescue Committee (IRC). 2003a. Prevalence of gender-based violence in East Timor. Dili, Timor-Leste: IRC, July 2003.
International Rescue Committee (IRC). 2003b. A determination of the prevalence of gender based violence among conflict-affected populations in East Timor, pilot study, 2003. Dili, Timor-Leste: IRC.
Joint United Nations Program on AIDS (UNAIDS) and the World Health Organization (WHO). 2009. AIDS epidemic update: November 2009. UNAIDS/09.36E/JC1700E. Geneva: UNAIDS and WHO.
Kandiyoti, D. 1988. Bargaining with patriarchy. Special issue to honor Jessie Bernard. Gender and Society 2(3): 274-290.
Krug, E.G., L. Dahlberg, J. Mercy, A. Zwi, and R. Lozano, eds. 2002. World report on violence and health. Geneva: World Health Organization.
Timor-Leste Institute for Development Monitoring and Analysis. 2009. Timor-Leste human development unchanged in 2007: As reported by 2009 UNDP Human Development Report, October 2009. http://www.laohamutuk.org/reports/09HDI.htm (accessed September 1, 2010)
Lawn, J.E., S. Cousens, and J. Zupan. 2005. 4 million neonatal deaths: When? Where? Why? Lancet 365:891-900. doi:10.1016/S0140-6736(05)71048-5
Marie Stopes International. 2010. Data on methods provided 2007-2009, Paper presented in April 2010 at the Family Planning Working Group, Dili, Timor-Leste.
Martins, J.S., A.B. Zwi, N. Martins, and P.M. Kelly. 2009. Malaria control in Timor-Leste during a period of political instability: what lessons can be learned? Conflict and Health 3(11). http://www.conflictandhealth.com/articles/browse.asp?date=12-2009
Ministry of Finance (MOF) [Timor-Leste]. 2010. Timor-Leste MDG Booklet 2010. Dili, Timor-Leste: MOF.
Ministry of Health (MOH) [Timor-Leste]. 2002a. East Timor’s health policy framework (HPF). Dili, Timor-Leste: MOH.
Ministry of Health (MOH) [Timor-Leste]. 2002b. Health profile, democratic republic of Timor-Leste. Dili, Timor-Leste: MOH.
Ministry of Health (MOH) [Timor-Leste]. 2003. National malaria strategy 2003-2013. Dili, Timor-Leste: MOH.
Ministry of Health (MOH) [Timor-Leste]. 2004a. Basic package of services policy. Dili, Timor-Leste: MOH.
Ministry of Health (MOH) [Timor-Leste]. 2004b. National family planning policy. Dili, Timor-Leste: MOH.
Ministry of Health (MOH) [Timor-Leste]. 2004c. National reproductive health strategy (NRHS) 2004-2015. Dili, Timor-Leste: MOH, United Nations Population Fund, and World Health Organization.
Ministry of Health (MOH) [Timor-Leste]. 2004d. Timor-Leste national nutrition strategy. Dili, Timor-Leste: MOH.
Ministry of Health (MOH) [Timor-Leste]. 2006. National HIV/AIDS/STIs strategic plan 2006-2010 (Draft). Dili, Timor-Leste.

References | 251
Ministry of Health (MOH) [Timor-Leste]. 2007. The management of STIs: guideline for health workers (Draft), Second edition. Dili, Timor-Leste: MOH.
Ministry of Health (MOH) [Timor-Leste], National Statistics Directorate (NSD) [Timor-Leste], University of Newcastle (UN), Australian National University (ANU), and ACIL Australia. 2004. Timor-Leste 2003 demographic and health survey. Newcastle, Australia: University of Newcastle.
National Statistics Directorate (NSD) [Timor-Leste]. 2006. Timor-Leste census of population and housing, 2004. Atlas. Dili, Timor-Leste: NSD.
National Statistics Directorate (NSD) [Timor-Leste]. 2007. Final statistical abstract: Timor-Leste survey of living standards 2007. Dili, Timor-Leste: MOF.
National Statistics Directorate (NSD) [Timor-Leste]. 2010. Preliminary results from the 2010 census. Dili, Timor-Leste: NSD.
Plan International. http://plan-international.org/birthregistration/resources/stories/plan2019s- partnership-work-with-unicef (accessed August 27, 2010)
Population Reference Bureau (PRB). 2010. 2010 world population data sheet. Washington, DC: PRB. http://www.prb.org/pdf10/10wpds_eng.pdf
Rutenberg, N., and J. Sullivan. 1991. Direct and indirect estimates of maternal mortality from the sisterhood method. In Proceedings of the Demographic and Health Surveys World Conference, Vol. 3, 1669-1696. Columbia, Maryland, USA: IRD and Macro International Inc.
Strauss, M.A. (1990) Measuring Intra-family conflict and violence, the conflict tactics scale. In Physical violence in American families: Risk factors and adaptation to violence in 8,145 families. New Brunswick, New Jersey: Transaction Publications.
Trembath, A., and D. Grenfell. 2007. Mapping the pursuit of gender equality: non-government and international agency activity in Timor-Leste. Dili, Timor-Leste: The Globalism Institute, RMIT University.
United Nations Children’s Fund (UNICEF). 2003. Multiple indicator cluster survey (MICS) Timor-Leste 2002. Dili, Timor-Leste: UNICEF.
United Nations Children’s Fund (UNICEF). 2005. Birth registration in the Pacific. Part II: regional workshop on enhancing birth registration in the Pacific, Fiji, Kirbati, Samoa, Solomon Islands, Tonga, Tuvalu, Vanuatu, and Timor-Leste. Tuva, Fiji: UNICEF, Pacific Office. http://www.unicef.org/pacificislands/BR_Report_Part2.pdf
United Nations Children’s Fund (UNICEF). 2007. Birth registration and armed conflict. Florence, Italy: Innocenti Research Center, UNICEF.
United Nations Development Fund for Women (UNIFEM). 2003. Not a minute more: Ending violence against women. New York: UNIFEM.
United Nations Development Fund for Women (UNIFEM). (2010). Domestic violence law passes in Timor-Leste, News, Communications Officer, UNIFEM Project Office in Timor-Leste.
United Nations Development Programme (UNDP). 2010. Human Development Report 2010. New York: UNDP.
United Nations Education, Scientific and Cultural Organization (UNESCO). 2009. Timor-Leste – UNESCO Country Programming Document, 2009-2013, UHJAK/2009/Pl/H/5. Jakarta: UNESCO. http://unesdoc.unesco.org/images/0018/001852/185239e.pdf

252 | References
United Nations General Assembly. 1989. Convention on the rights of the child. New York, NY: United Nations. http://www2.ohchr.org/english/law/crc.htm
United Nations Integrated Mission in Timor-Leste (UNMIT), 2009. Baseline study on sexual and gender-based violence in Covalima and Bobonaro, 2009.
United Nations Development Programme (UNDP) and the Government of Timor-Leste. 2009. The Millennium Development Goals, Timor-Leste, 2009. Dili, Timor-Leste: UNDP.
United Nations, Population Division of the Department of Economic and Social Affairs. 2007. World urbanization prospects: The 2007 revision population database. http://esa.un.org/unup (accessed August 20, 2010)
Wedner, S.H., D.A. Ross, N. Congdon, R. Balira, V. Spitzer, and A. Foster. 2004. Validation of night blindness reports among children and women in a vitamin A deficient population in rural Tanzania. European Journal of Clinical Nutrition 58(3): 409-419. doi:10.1038/sj.ejcn.1601797
WHO Regional Office for South-East Asia (WHO SEAR). 2010. MAKING PREGNANCY SAFER: a health sector strategy for reducing maternal and perinatal morbidity and mortality. New Delhi, India: WHO SEAR. http://www.searo.who.int/EN/Section13/Section36/Section129/Section396_2163.htm
WHO Regional Office for South-East Asia (WHO SEAR). 2010. Malaria situation in SEAR countries: Timor-Leste. New Delhi, India: WHO SEAR. http://www.searo.who.int/en/Section10/Section21/Section340_4028.htm
Wikipedia. 2010. History of East Timor. http://en.wikipedia.org/wiki/History_of_East_Timor
World Food Programme (WFP) and the Food and Agriculture Organization (FAO). 2003. WPF/WHO/DONOR Emergency Needs Assessment Mission Report. Dili, Timor-Leste: WFP and FAO.
World Health Organization (WHO). 1995. Physical status: the use and interpretation of anthropometry. Report of a WHO Expert Committee. Technical Report Series No. 854. Geneva, Switzerland: WHO. http://whqlibdoc.who.int/trs/WHO_TRS_854.pdf
World Health Organization (WHO). 2001a. Iron deficiency anaemia: assessment, prevention, and control. A guide for programme managers (WHO/NHD/01.3). Geneva: WHO.
World Health Organization (WHO), 2001b. Putting women first: Ethical and safety recommendations for research on domestic violence against women, Geneva, Switzerland: Department of Gender and Women’s Health, WHO.
World Health Organization (WHO). 2008. World health statistics 2008. Geneva: WHO. http://www.who.int/whosis/whostat/EN_WHS08_Full.pdf
World Health Organization (WHO) Multicentre Growth Reference Study Group. 2006. WHO child growth standards: Length/height-for-age, weight-for-age, weight-for-length, weight-for-height and body mass index-for-age: Methods and development. Geneva, Switzerland: WHO.
World Health Organization (WHO) Timor-Leste. 2004. Support health promotion program in Timor-Leste 2004-2007. Dili, Timor-Leste: WHO.
World Health Organization (WHO) and Joint United Nations Program on AIDS (UNAIDS). 2007. New data on male circumcision and HIV prevention: Policy and programme implications. (WHO/UNAIDS Technical Consultation, Male Circumcision, and HIV Prevention: Research Implications for Policy and Programming, Montreux, 6-8 March 2007, Conclusions and Recommendations). http://data.unaids.org/pub/Report/2007/mc_recommendations_en.pdf
References | 253
World Health Organization (WHO), World Bank, United Nations Children’s Fund (UNICEF), and United Nations Population Fund (UNFPA). 2005. Maternal mortality in 2000: Estimates developed by WHO, UNICEF, UNFPA, and the World Bank. Geneva, Switzerland: WHO.
World Health Organization (WHO), United Nations Children’s Fund (UNICEF), United Nations Population Fund (UNFPA), and the World Bank. 2010. Trends in maternal mortality in 1990-2008: Estimates developed by WHO, UNICEF, UNFPA, and the World Bank. Geneva, Switzerland: WHO.
Zwi, A.B., I. Blignault, D. Glazebrook, V. Correia, C.R. Bateman, E. Ferreira, and B Pinto. 2009. Timor-Leste health care seeking behaviour study. Sydney, Australia: UNSW School of Public Health and Community Medicine.


Appendix A | 255
SAMPLE DESIGN Appendix A
A.1 OBJECTIVES OF THE SURVEY
The 2009 Timor-Leste Demographic and Health Survey (TLDHS 2009-10) was the second of its kind following the survey conducted in 2003. TLDHS 2009-10 selected a nationally representative sample consisting of 12,285 residential households. In sampled households, all women between the ages of 15 and 49 who were members of the households or who stayed in the households the night before the survey were eligible for the individual interview. The survey was designed to yield about 11,800 completed interviews of women age 15-49. The sample was designed to produce representative results for most of the indicators for the country as a whole, for the urban and rural areas, and for each of the thirteen districts.
Apart from the female survey, a male survey was conducted in one-third of the households
selected for the female survey. All men age 15-49 who were usual members of the household or who stayed in the household the night before the survey were eligible for the male individual interview. This sampling plan was expected to yield about 3,800 completed interviews of men age 15-49. In this sub-sample, all women who were eligible for the individual interview and all their young children aged 6-59 months were asked consent for an anemia testing.
A.2 SAMPLING FRAME
The sampling frame used for the TLDHS 2009 was the 2004 Timor-Leste Population and Housing Census (TLPHC) (NSD, 2006), provided by the National Statistics Directorate (NSD). The sampling frame is a complete list of 1,163 Enumeration Areas (EAs) created for the 2004 census. Among the 1,163 EAs, 240 are urban residence and 923 are rural residence.
In Timor-Leste, 26.0% of the household population lives in urban areas, and they occupy
23.1% of the residential households. A.3 SAMPLING PROCEDURE AND SAMPLE ALLOCATION
The sample for TLDHS 2009 was a stratified sample selected in two stages from the TLPHC 2004. Stratification was achieved by separating each of the 13 districts into urban and rural areas. In total, 26 sampling strata were created. Samples were selected independently in every stratum, through a two-stage selection process. Implicit stratification was achieved at each of the lower administrative levels by sorting the sampling frame before sample selection, according to administrative units and by using a probability proportional to size selection at the first stage of sampling.
In the first stage, 455 EAs were selected with probability proportional to the EA size. The EA
size was the number of households residing in the EA at the time of the census. Standard DHS procedures call for a new listing of households in the selected EAs before conducting the household selection. However, because of time and other constraints, the households were selected from the TLPHC 2004 census results without conducting a new household listing operation.
In the second stage of selection, a fixed number of 27 households were randomly selected in
every cluster by an equal probability systematic sampling procedure. This number was increased from the original design of 24 households per EA to account for the outdated census household listing. The household selection was carried out in the office. The GPS coordinates collected for each household

256 | Appendix A
during the population census were used to relocate the selected households in the field during data collection.
Table A.1 shows the sample allocation of clusters/EAs and households according to district and by type of residence. The final allocation was an equal size allocation of 34 EAs for each of the twelve districts except Dili district; a larger sample size of 47 EAs was allocated to Dili district. Dili district received a higher number of EAs in order to get adequate representation of the urban population of the country. In total, there were 116 urban clusters and 339 rural clusters selected in the TLDHS 2009-10 sample. Table A.2 below shows the sample allocation of expected number completed women and men interviews by district and by type of residence.
Table A.1 Sample allocation of clusters and households according to district and by type of residence, Timor-Leste 2009-10
Allocation of EA Allocation of households District Urban Rural Total Urban Rural Total
Aileu 2 32 34 54 864 918 Ainaro 8 26 34 216 702 918 Baucau 5 29 34 135 783 918 Bobonaro 8 26 34 216 702 918 Covalima 8 26 34 216 702 918 Dili 40 7 47 1,080 189 1 269 Ermera 6 28 34 162 756 918 Liquica 5 29 34 135 783 918 Lautem 11 23 34 297 621 918 Manufahi 8 26 34 216 702 918 Manatuto 2 32 34 54 864 918 Oecussi 9 25 34 243 675 918 Viqueque 4 30 34 108 810 918 Timor-Leste 116 339 455 3,132 9,153 12,285
Note: The sample allocation has taken into account the reform of the urban EAs in Covalima and Manatuto districts.
Table A.2 Sample allocation of expected number of completed women and men interviews according to district and by type of residence, Timor-Leste 2009-10
Women 15-49 Men 15-49 (subsample) District Urban Rural Total Urban Rural Total
Aileu 52 834 886 17 272 289 Ainaro 209 678 887 68 222 290 Baucau 131 756 887 43 247 290 Bobonaro 209 678 887 68 222 290 Covalima 209 678 887 68 222 290 Dili 1,042 182 1,224 341 60 401 Ermera 157 729 886 51 238 289 Liquica 131 756 887 43 247 290 Lautem 286 599 885 94 196 290 Manufahi 209 678 887 68 222 290 Manatuto 52 834 886 17 272 289 Oecussi 235 652 887 76 212 288 Viqueque 104 782 886 34 255 289 Timor-Leste 3,026 8,836 11,862 988 2,887 3,875
The above sample allocation on expected number of interviews was calculated based on the facts obtained from the TLDHS 2003 and the TLPHC 2004: there were 1.07 women and men aged 15-49 per household. The numbers in Table A.2 assume a female response rate of 97 percent, a male response rate of 95 percent; and a household response rate of 93 percent in both urban and rural areas.

Appendix A | 257
A.4 SAMPLING PROBABILITY AND SAMPLING WEIGHTS
Because of the non-proportional allocation of the sample to the different districts and to their urban-rural areas, sampling weights will be required for any analysis using TLDHS 2009-10 data to ensure the actual representativeness of the sample at the national level as well as district level. Since the TLDHS 2009 sample is a two-stage stratified cluster sample, sampling weights were calculated based on sampling probabilities separately for each sampling stage and for each cluster. We use the following notations:
P1hi: first-stage sampling probability of the ith cluster in stratum h P2hi: second -stage sampling probability within the ith cluster (households) Let ah be the number of clusters selected in stratum h, Mhi the number of households
according to the sampling frame in the ith cluster, and ∑ hiM the total number of households in the stratum h. The probability of selecting the ith cluster in the TLDHS sample is calculated as follows:
M M a
hi
hih
∑
Let hib be the proportion of households in the selected segment compared to the total number of households in the EA i in stratum h if the EA is segmented, otherwise 1=hib . Then the probability of selecting cluster i in the sample is:
hihi
hih1hi b
M M a = P ×
∑
Let hig be the number of households selected in the cluster. The second stage’s selection probability for each household in the cluster is calculated as follows:
hihi
hihi bM
gP =2
The overall selection probability of each household in cluster i of stratum h is therefore the production of the selection probabilities:
hihihi PPP 21 ×= The design weight for each household in cluster i of stratum h is the inverse of its selection
probability:
hihi PW /1=
A spreadsheet containing all sampling parameters and selection probabilities was constructed to facilitate the calculation of sampling weights. Household sampling weights and the individual sampling weights were obtained by adjusting the above calculated design weight to compensate for household non-response and individual non-response, respectively. These weights were further normalized at the national level to achieve the number of un-weighted cases equal to the number of weighted cases for both households and individuals at the national level. The normalized weights are valid for estimating means, proportions, rates and ratios, but not valid for estimation of totals. No special weights were calculated for data collected on children because there was not a child’s questionnaire. For child indicators tabulated at the household level, household weights should be used; for child indicators tabulated at the individual level, the child’s mother’s/guardian’s weight should be used.
Sampling errors for selected indicators are calculated and presented in Appendix B.

A.5
SURV
EY R
ESU
LTS
Tab
le A
.3 S
ampl
e im
plem
enta
tion:
Wom
en
Perc
ent
dist
ribut
ion
of h
ouse
hold
s an
d el
igib
le w
omen
by
resu
lts o
f the
hou
seho
ld a
nd in
divi
dual
inte
rvie
ws,
and
hou
seho
ld, e
ligib
le w
omen
and
ove
rall
resp
onse
rat
es, a
ccor
ding
to
urba
n-ru
ral r
esid
ence
and
dist
ricts
, Tim
or-L
este
20
09-1
0
Re
siden
ce
Dist
rict
Res
ult
Urb
an
Rura
lAi
leu
Aina
roBa
ucau
Bobo
naro
Cov
a Li
ma
Dili
Erm
era
Laut
emLi
quic
aM
anat
uto
Man
ufah
iO
ecus
siVi
queq
ueTo
tal
Sel
ecte
d ho
useh
olds
C
ompl
eted
(C)
91.1
95
.6
92.4
96
.2
97.7
97
.7
94.0
90
.4
95.6
92
.8
94.2
96
.4
90.3
98
.0
93.9
94
.5
H
ouse
hold
pre
sent
but
no
com
pete
nt
resp
onde
nt a
t hom
e (H
P)
1.2
0.
4 1.
3 0.
0 0.
4 0.
0 1.
2 1.
2 0.
7 0.
3 0.
5 0.
0 1.
4 0.
1 0.
3 0.
6
Po
stpo
ned
(P)
0.1
0.
0 0.
0 0.
0 0.
0 0.
0 0.
0 0.
0 0.
2 0.
2 0.
0 0.
0 0.
0 0.
0 0.
0 0.
0
Re
fuse
d (R
) 1.
1
0.4
1.3
0.3
0.0
1.0
0.4
1.6
0.1
1.1
0.3
0.2
0.2
0.4
0.1
0.6
Dw
ellin
g no
t fou
nd (D
NF)
1.
2
0.3
0.3
0.1
0.0
0.0
0.7
2.3
0.0
1.5
0.2
0.4
0.3
0.2
0.2
0.5
Hou
seho
ld a
bsen
t (H
A)
1.7
0.
8 0.
4 0.
3 0.
1 0.
4 0.
9 2.
1 1.
2 2.
0 1.
1 1.
2 2.
4 0.
3 0.
4 1.
0
D
wel
ling
vaca
nt/a
ddre
ss n
ot a
d
wel
ling
(DV)
2.
2
1.2
2.1
2.0
1.7
0.8
2.0
1.1
0.7
0.4
1.9
1.2
2.2
0.4
2.6
1.5
Dw
ellin
g de
stro
yed
(DD
) 1.
5
1.3
2.1
1.1
0.0
0.1
0.9
1.3
1.5
1.6
1.7
0.5
3.2
0.4
2.5
1.3
Tot
al
100.
0
100.
0 10
0.0
100.
0 10
0.0
100.
0 10
0.0
100.
0 10
0.0
100.
0 10
0.0
100.
0 10
0.0
100.
0 10
0.0
100.
0
Num
ber o
f sam
pled
hou
seho
lds
3,01
2
9,11
6 91
0 91
8 91
8 91
8 91
8 1,
149
912
916
918
918
918
918
897
12,1
28
Hou
seho
ld re
spon
se ra
te (H
RR)1
96.3
98
.8
96.9
99
.5
99.6
99
.0
97.6
94
.7
99.0
96
.7
98.9
99
.3
97.9
99
.2
99.3
98
.2
Elig
ible
wom
en
Com
plet
ed (E
WC
) 89
.2
97.4
94
.1
97.9
98
.9
98.2
93
.8
86.2
95
.9
96.6
92
.8
98.7
95
.3
96.8
96
.4
95.2
Not
at h
ome
(EW
NH
) 4.
4
1.1
2.4
0.1
0.5
0.5
3.2
5.1
1.1
1.3
3.6
0.3
1.6
1.4
2.8
1.9
Post
pone
d (E
WP)
0.
2
0.0
0.0
0.2
0.0
0.0
0.1
0.1
0.0
0.3
0.0
0.1
0.0
0.0
0.0
0.1
Refu
sed
(EW
R)
5.2
0.
8 2.
7 1.
0 0.
3 1.
0 1.
4 7.
1 2.
4 0.
8 2.
6 0.
3 1.
9 1.
2 0.
7 2.
0
Pa
rtly
com
plet
ed (E
WPC
) 0.
6
0.1
0.3
0.2
0.0
0.3
0.0
1.0
0.0
0.6
0.1
0.1
0.4
0.2
0.2
0.3
Inca
paci
tate
d (E
WI)
0.4
0.
6 0.
5 0.
5 0.
3 0.
0 1.
4 0.
3 0.
6 0.
5 1.
0 0.
4 0.
7 0.
5 0.
0 0.
5
O
ther
(EW
O)
0.1
0.
0 0.
0 0.
0 0.
0 0.
0 0.
0 0.
2 0.
0 0.
0 0.
0 0.
0 0.
1 0.
0 0.
0 0.
0
Tot
al
100.
0
100.
0 10
0.0
100.
0 10
0.0
100.
0 10
0.0
100.
0 10
0.0
100.
0 10
0.0
100.
0 10
0.0
100.
0 10
0.0
100.
0
Num
ber o
f wom
en
3,62
5
10,1
71
1,10
1 85
9 1,
018
1,08
1 1,
054
1,42
3 1,
128
1,05
9 1,
152
1,15
0 83
0 1,
033
908
13,7
96
Elig
ible
wom
en re
spon
se ra
te (E
WRR
)2 89
.2
97.4
94
.1
97.9
98
.9
98.2
93
.8
86.2
95
.9
96.6
92
.8
98.7
95
.3
96.8
96
.4
95.2
Ove
rall
resp
onse
rate
(ORR
)385
.9
96.2
91.2
97.5
98.5
97.3
91.6
81.7
94.9
93
.491
.798
.093
.396
.195
.793
.5
1 Usin
g th
e nu
mbe
r of h
ouse
hold
s fa
lling
into
spe
cific
resp
onse
cat
egor
ies,
the
hous
ehol
d re
spon
se ra
te (H
RR) i
s ca
lcul
ated
as:
10
0 *
C
——
——
——
——
——
—
C +
HP
+ P
+ R
+ D
NF
2 Usin
g th
e nu
mbe
r of e
ligib
le w
omen
falli
ng in
to s
peci
fic re
spon
se c
ateg
orie
s, th
e el
igib
le w
oman
resp
onse
rate
(EW
RR) i
s ca
lcul
ated
as:
100
* EW
C
——
——
——
——
——
——
——
——
——
——
——
——
—
EWC
+ E
WN
H +
EW
P +
EW
R +
EW
PC +
EW
I + E
WO
3 T
he o
vera
ll re
spon
se ra
te (O
RR) i
s ca
lcul
ated
as:
ORR
= H
RR *
EW
RR/1
00
258 | Appendix A

Tab
le A
.4 S
ampl
e im
plem
enta
tion:
Men
Per
cent
dist
ribut
ion
of h
ouse
hold
s an
d el
igib
le m
en b
y re
sults
of t
he h
ouse
hold
and
indi
vidu
al in
terv
iew
s, a
nd h
ouse
hold
, elig
ible
men
and
ove
rall
resp
onse
rate
s, a
ccor
ding
to u
rban
-rur
al re
siden
ce a
nd d
istric
t, Ti
mor
-Les
te 2
009-
10
Re
siden
ce
Dist
rict
Res
ult
Urb
an
Rura
l Ai
leu
Aina
ro
Bauc
au
Bobo
naro
C
ova
Lim
a D
ili
Erm
era
Laut
em
Liqu
ica
Man
atut
o M
anuf
ahi
Oec
ussi
Viqu
eque
To
tal
Sel
ecte
d ho
useh
olds
C
ompl
eted
(C)
91.4
95
.7
91.8
97
.7
97.4
99
.3
93.5
90
.1
93.8
93
.8
95.4
96
.1
90.5
97
.7
94.3
94
.6
H
ouse
hold
pre
sent
but
no
com
pete
nt
resp
onde
nt a
t hom
e (H
P)
1.3
0.
5
1.0
0.
0
0.7
0.
0
1.3
1.
8
1.0
0.
0
1.0
0.
0
1.3
0.
0
0.3
0.
7
Po
stpo
ned
(P)
0.0
0.
0
0.0
0.0
0.0
0.0
0.0
0.0
0.
3 0.
0 0.
0 0.
0 0.
0 0.
0 0.
0 0.
0
Re
fuse
d (R
) 0.
9
0.5
2.
6 0.
3 0.
0 0.
0 0.
7 1.
8
0.3
1.3
0.3
0.3
0.0
0.0
0.0
0.6
Dw
ellin
g no
t fou
nd (D
NF)
1.
3
0.3
0.
7 0.
3 0.
0 0.
0 0.
3 1.
8
0.0
1.6
0.0
0.7
0.3
0.3
0.3
0.5
Hou
seho
ld a
bsen
t (H
A)
1.7
0.
7
0.7
0.3
0.0
0.0
0.3
2.6
0.
7 2.
0 0.
7 1.
3 2.
9 0.
3 0.
0 0.
9
D
wel
ling
vaca
nt/a
ddre
ss n
ot a
d
wel
ling
(DV)
1.
7
1.2
1.
3
0.7
2.
0
0.7
3.
3
1.0
0.
7
0.3
1.
6
1.6
1.
3
1.0
2.
0
1.3
Dw
ellin
g de
stro
yed
(DD
) 1.
7
1.1
2.
0 0.
7 0.
0 0.
0 0.
7 0.
8
3.3
1.0
1.0
0.0
3.6
0.7
3.0
1.3
Tot
al
100.
0
100.
0
100.
0 10
0.0
100.
0 10
0.0
100.
0 10
0.0
10
0.0
100.
0 10
0.0
100.
0 10
0.0
100.
0 10
0.0
100.
0
Num
ber o
f sam
pled
hou
seho
lds
1,00
4
3,04
0
304
306
306
306
306
383
30
4 30
6 30
6 30
6 30
6 30
6 29
9 4,
044
H
ouse
hold
resp
onse
rate
(HRR
)196
.3
98.7
95
.5
99.3
99
.3
100.
0 97
.6
94.3
98
.3
97.0
98
.6
99.0
98
.2
99.7
99
.3
98.1
Elig
ible
men
C
ompl
eted
(EM
C)
85.8
94
.5
81.4
96
.1
96.4
98
.5
90.0
85
.4
97.3
93
.6
84.2
98
.1
90.8
96
.1
95.7
92
.2
N
ot a
t hom
e (E
MN
H)
6.1
2.
9
6.0
1.9
1.0
0.6
8.5
6.6
0.
3 3.
3 7.
8 1.
1 5.
6 3.
2 1.
4 3.
8
Po
stpo
ned
(EM
P)
0.2
0.
0
0.3
0.0
0.0
0.0
0.0
0.4
0.
0 0.
0 0.
0 0.
0 0.
0 0.
0 0.
0 0.
1
Re
fuse
d (E
MR)
6.
4
1.3
8.
7 1.
3 1.
9 0.
6 0.
6 6.
6
1.1
0.8
6.7
0.3
1.2
0.0
1.4
2.6
Partl
y co
mpl
eted
(EM
PC)
0.8
0.
3
0.3
0.0
0.3
0.3
0.3
0.4
0.
3 1.
5 0.
3 0.
5 1.
2 0.
0 0.
4 0.
5
In
capa
cita
ted
(EM
I)
0.8
0.
9
3.3
0.6
0.3
0.0
0.6
0.6
1.
1 0.
8 1.
1 0.
0 1.
2 0.
7 1.
1 0.
9
Tot
al
100.
0
100.
0
100.
0 10
0.0
100.
0 10
0.0
100.
0 10
0.0
10
0.0
100.
0 10
0.0
100.
0 10
0.0
100.
0 10
0.0
100.
0
Num
ber o
f men
1,
183
3,
238
36
6 30
8 30
8 32
4 33
0 47
2
365
391
374
373
251
282
277
4,42
1
Elig
ible
men
resp
onse
rate
(EM
RR)2
85.8
94
.5
81.4
96
.1
96.4
98
.5
90.0
85
.4
97.3
93
.6
84.2
98
.1
90.8
96
.1
95.7
92
.2
Ove
rall
resp
onse
rate
(ORR
)382
.6
93.3
77
.895
.595
.898
.587
.880
.595
.690
.883
.197
.189
.295
.895
.090
.4
1 Usin
g th
e nu
mbe
r of h
ouse
hold
s fa
lling
into
spe
cific
resp
onse
cat
egor
ies,
the
hous
ehol
d re
spon
se ra
te (H
RR) i
s ca
lcul
ated
as:
10
0 *
C
——
——
——
——
——
—
C +
HP
+ P
+ R
+ D
NF
2 Usin
g th
e nu
mbe
r of e
ligib
le m
en fa
lling
into
spe
cific
resp
onse
cat
egor
ies,
the
elig
ible
man
resp
onse
rate
(EM
RR) i
s ca
lcul
ated
as:
100
* EM
C
——
——
——
——
——
——
——
——
——
——
——
——
EM
C +
EM
NH
+ E
MP
+ E
MR
+ E
MPC
+ E
MI +
EM
O
3 The
ove
rall
resp
onse
rate
(ORR
) is
calc
ulat
ed a
s:
O
RR =
HRR
* E
MRR
/100
| 259Appendix A


Appendix B | 261
ESTIMATES OF SAMPLING ERRORS Appendix B
The estimates from a sample survey are affected by two types of errors: non-sampling errors and sampling errors. Non-sampling errors are the results of mistakes made in implementing data collection and data processing, such as failure to locate and interview the correct household, misunderstanding of the questions on the part of either the interviewer or the respondent, and data entry errors. Although numerous efforts were made during the implementation of the Timor-Leste Demographic and Health Survey 2009-10 (TLDHS 2009-10) to minimize this type of error, non-sampling errors are impossible to avoid and difficult to evaluate statistically.
Sampling errors, on the other hand, can be evaluated statistically. The sample of respondents selected in the TLDHS 2009-10 is only one of many samples that could have been selected from the same population, using the same design and expected size. Each of these samples would yield results that differ somewhat from the results of the actual sample selected. Sampling errors are a measure of the variability between all possible samples. Although the degree of variability is not known exactly, it can be estimated from the survey results.
A sampling error is usually measured in terms of the standard error for a particular statistic (mean, percentage, etc.), which is the square root of the variance. The standard error can be used to calculate confidence intervals within which the true value for the population can reasonably be assumed to fall. For example, for any given statistic calculated from a sample survey, the value of that statistic will fall within a range of plus or minus two times the standard error of that statistic in 95 percent of all possible samples of identical size and design.
If the sample of respondents had been selected as a simple random sample, it would have been possible to use straightforward formulas for calculating sampling errors. However, the TLDHS 2009-10 sample is the result of a multi-stage stratified design, and, consequently, it was necessary to use more complex formulae. The computer software used to calculate sampling errors for the TLDHS 2009-10 is a Macro SAS procedure. This procedure used the Taylor linearization method of variance estimation for survey estimates that are means, proportions or ratios. The Jackknife repeated replication method is used for variance estimation of more complex statistics such as fertility and mortality rates. The Taylor linearization method treats any percentage or average as a ratio estimate, r = y/x, where y represents the total sample value for variable y, and x represents the total number of cases in the group or subgroup under consideration. The variance of r is computed using the formula given below, with the standard error being the square root of the variance:
∑ ∑= =
⎥⎦
⎤⎢⎣
⎡⎟⎟⎠
⎞⎜⎜⎝
⎛−
−−==
H
h h
hm
ihi
h
h
mzz
mm
xfrvarrSE
h
1
2
1
22
2
11)()(
in which
hihihi rxyz −= , and hhh rxyz −=
where h represents the stratum which varies from 1 to H,
mh is the total number of clusters selected in the hth stratum, yhi is the sum of the weighted values of variable y in the ith cluster in the hth stratum, xhi is the sum of the weighted number of cases in the ith cluster in the hth stratum, and f is the overall sampling fraction, which is so small that it is ignored.

262 | Appendix B
The Jackknife repeated replication method derives estimates of complex rates from each of several replications of the parent sample, and calculates standard errors for these estimates using simple formulae. Each replication considers all but one cluster in the calculation of the estimates. Pseudo-independent replications are thus created. In the TLDHS 2009-10, there were 455 non-empty clusters. Hence, 455 replications were created. The variance of a rate r is calculated as follows:
SE r var rk k
r ri
k
i2
1
211
( ) ( )( )
( )= =−
−=∑
in which
)()1( ii rkkrr −−= where r is the estimate computed from the full sample of 455 clusters,
r(i) is the estimate computed from the reduced sample of 454 clusters (ith cluster excluded), and
k is the total number of clusters.
In addition to the standard error, the design effect (DEFT) for each estimate is calculated, which is defined as the ratio between the standard error using the given sample design and the standard error that would result if a simple random sample had been used. A DEFT value of 1.0 indicates that the sample design is as efficient as a simple random sample, while a value greater than 1.0 indicates the increase in the sampling error due to the use of a more complex and less statistically efficient design. The relative standard error and confidence limits for the estimates are also calculated.
Sampling errors for the TLDHS 2009-10 are calculated for selected variables considered to be of primary interest. The results are presented in this appendix for the country as a whole, for urban and rural areas, and for each of the thirteen geographical/administrative districts. For each variable, the type of statistic (mean, proportion, or rate) and the base population are given in Table B.1. Tables B.2 through B.17 present the value of the statistic (R), its standard error (SE), the number of un-weighted (N) and weighted (WN) cases, the design effect (DEFT), the relative standard error (SE/R), and the 95 percent confidence limits (R±2SE), for each variable. The DEFT is considered undefined when the standard error considering simple random sample is zero (when the estimate is close to 0 or 1). In the case of the total fertility rate, the number of un-weighted cases is not relevant, as there is no known un-weighted value for woman-years of exposure to child-bearing. The confidence interval (e.g., as calculated for children ever born to women aged 40-49) can be interpreted as follows: the overall average from the national sample is 5.826 and its standard error is 0.073. Therefore, to obtain the 95 percent confidence limits, one adds and subtracts twice the standard error to the sample estimate, i.e., 5.826±2×0.073. There is a high probability (95 percent) that the true average number of children ever born to all women aged 40 to 49 is between 5.680 and 5.972.
For the total sample, the value of the DEFT, averaged over all variables, is 1.455. This means that, due to multi-stage clustering of the sample, the average standard error is increased by a factor of 1.455 over that in an equivalent simple random sample.

Appendix B | 263
Table B.1 List of selected variables for sampling errors, Timor-Leste 2009-10 –––––––––––––––––––––––––––––––––––––––––––––––––––––––––––––––––––––––––––––––––––––––––––––––––––––––––––––––––– Variable Estimate Base population ––––––––––––––––––––––––––––––––––––––––––––––––––––––––––––––––––––––––––––––––––––––––––––––––––––––––––––––––––
WOMEN –––––––––––––––––––––––––––––––––––––––––––––––––––––––––––––––––––––––––––––––––––––––––––––––––––––––––––––––––– Urban residence Proportion All women 15-49 Literacy Proportion All women 15-49 No education Proportion All women 15-49 Secondary education or higher Proportion All women 15-49 Net attendance ratio Ratio Household population 7-12 years Never married/in union Proportion All women 15-49 Currently married/in union Proportion All women 15-49 Married before age 20 Proportion All women 20-49 Currently pregnant Proportion All women 15-49 Children ever born Mean All women 15-49 Children surviving Mean All women 15-49 Children ever born to women age 40-49 Mean All women 40-49 Knows any contraceptive method Proportion Currently married women 15-49 Knows a modern method Proportion Currently married women 15-49 Ever used any contraceptive method Proportion Currently married women 15-49 Currently using any method Proportion Currently married women 15-49 Currently using a modern method Proportion Currently married women 15-49 Currently using a traditional method Proportion Currently married women 15-49 Currently using pill Proportion Currently married women 15-49 Currently using IUD Proportion Currently married women 15-49 Currently using condoms Proportion Currently married women 15-49 Currently using injectables Proportion Currently married women 15-49 Currently using female sterilization Proportion Currently married women 15-49 Currently using withdrawal Proportion Currently married women 15-49 Currently using periodic abstinence Proportion Currently married women 15-49 Using public sector source Proportion Current users of modern method Want no more children Proportion Currently married women 15-49 Want to delay at least 2 years Proportion Currently married women 15-49 Ideal number of children Mean All women 15-49 Mothers received medical assistance at delivery Proportion Births occurring 1-59 months before survey Mothers protected against tetanus for last birth Proportion Women with a live birth in last five years Had diarrhea in the past 2 weeks Proportion Children under 5 Treated with ORS packets Proportion Children under 5 with diarrhea in past 2 weeks Sought medical treatment Proportion Children under 5 with diarrhea in ppast 2 weeks Child having health card Proportion Children 12-23 months Received BCG vaccination Proportion Children 12-23 months Received DPT vaccination (3 doses) Proportion Children 12-23 months Received polio vaccination (3 doses) Proportion Children 12-23 months Received measles vaccination Proportion Children 12-23 months Received all vaccinations Proportion Children 12-23 months Height-for-age (-2SD) Proportion Children under 5 who are measured Weight-for-height (-2SD) Proportion Children under 5 who are measured Weight-for-age (-2SD) Proportion Children under 5 who are measured BMI <18.5 Proportion All women 15-49 who were measured Prevalence of anemia (children 6-59 months) Proportion All children 6-59 months who were tested Prevalence of anemia (women 14-49) Proportion All women 15-49 who were tested Has heard of HIV/AIDS Proportion All women 15-49 Knows about condoms to prevent AIDS Proportion All women 15-49 Knows about limiting partners to prevent AIDS Proportion All women 15-49 Comprehensive knowledge on HIV transmission Proportion All women 15-49 Total fertility rate (3 years) Rate Women-years of exposure to childbearing Neonatal mortality rate¹ Rate Children exposed to the risk of mortality Post-neonatal mortality rate¹ Rate Children exposed to the risk of mortality Infant mortality rate¹ Rate Children exposed to the risk of mortality Child mortality rate¹ Rate Children exposed to the risk of mortality Under-five mortality rate¹ Rate Children exposed to the risk of mortality Maternal mortality ratio Ratio Births in last 0-6 years ––––––––––––––––––––––––––––––––––––––––––––––––––––––––––––––––––––––––––––––––––––––––––––––––––––––––––––––––––
MEN –––––––––––––––––––––––––––––––––––––––––––––––––––––––––––––––––––––––––––––––––––––––––––––––––––––––––––––––––– Urban residence Proportion All men 15-49 Literacy Proportion All men 15-49 No education Proportion All men 15-49 Secondary education or higher Proportion All men 15-49 Never married/in union Proportion All men 15-49 Currently married/in union Proportion All men 15-49 Knows any contraceptive method Proportion Currently married men 15-49 Knows a modern method Proportion Currently married men 15-49 Ever used any contraceptive method Proportion Currently married men 15-49 Currently using any method Proportion Currently married men 15-49 Want no more children Proportion Currently married men 15-49 Ideal number of children Mean All men 15-49 Has heard of HIV/AIDS Proportion All men 15-49 Knows about condoms to prevent AIDS Proportion All men 15-49 Knows about limiting partners to prevent AIDS Proportion All men 15-49 Comprehensive knowledge on HIV transmission Proportion All men 15-49 –––––––––––––––––––––––––––––––––––––––––––––––––––––––––––––––––––––––––––––––––––––––––––––––––––––––––––––––––– 1 The mortality rates are calculated for 5 years and 10 years before the survey for the national sample and regional samples, respectively

264 | Appendix B
Table B.2 Sampling errors for National sample, Timor-Leste 2009-10 –––––––––––––––––––––––––––––––––––––––––––––––––––––––––––––––––––––––––––––––––––––––––––––––––––––––––––––––––– Number of cases Stand- –––––––––––––––– Rela- ard Un- Weight- Design tive Confidence limits Value error weighted ed effect error –––––––––––––––– Variable (R) (SE) (N) (WN) (DEFT) (SE/R) R-2SE R+2SE –––––––––––––––––––––––––––––––––––––––––––––––––––––––––––––––––––––––––––––––––––––––––––––––––––––
WOMEN ––––––––––––––––––––––––––––––––––––––––––––––––––––––––––––––––––––––––––––––––––––––––––––––––––––– Urban 0.262 0.008 13137 13137 2.127 0.031 0.245 0.278 Literacy 0.680 0.008 13137 13137 1.940 0.012 0.664 0.696 No education 0.293 0.008 13137 13137 1.897 0.026 0.278 0.308 Secondary education or higher 0.478 0.009 13137 13137 2.077 0.019 0.460 0.496 Net attendance ratio 0.777 0.009 12279 12228 1.981 0.011 0.760 0.794 Never married/in union 0.356 0.005 13137 13137 1.190 0.014 0.346 0.366 Currently married/in union 0.602 0.005 13137 13137 1.212 0.009 0.591 0.612 Married before age 20 0.406 0.006 9894 9993 1.308 0.016 0.394 0.419 Currently pregnant 0.068 0.002 13137 13137 1.076 0.035 0.064 0.073 Children ever born 2.732 0.032 13137 13137 1.245 0.012 2.667 2.797 Children surviving 2.438 0.028 13137 13137 1.202 0.011 2.383 2.493 Children ever born to women age 40-49 5.826 0.073 2494 2534 1.234 0.013 5.680 5.972 Knows any contraceptive method 0.781 0.008 7877 7906 1.776 0.011 0.765 0.798 Knows a modern method 0.777 0.008 7877 7906 1.786 0.011 0.761 0.794 Ever used any contraceptive method 0.315 0.007 7877 7906 1.413 0.023 0.300 0.330 Currently using any method 0.223 0.007 7877 7906 1.429 0.030 0.210 0.237 Currently using a modern method 0.211 0.007 7877 7906 1.441 0.031 0.198 0.224 Currently using a traditional method 0.012 0.002 7877 7906 1.400 0.142 0.009 0.016 Currently using pill 0.017 0.002 7877 7906 1.238 0.106 0.013 0.021 Currently using IUD 0.013 0.002 7877 7906 1.299 0.126 0.010 0.017 Currently using condoms 0.002 0.001 7877 7906 1.759 0.400 0.000 0.004 Currently use injectables 0.157 0.006 7877 7906 1.382 0.036 0.146 0.168 Currently using female sterilization 0.008 0.001 7877 7906 1.122 0.142 0.006 0.010 Currently using withdrawal 0.004 0.001 7877 7906 1.354 0.246 0.002 0.006 Currently using periodic abstinence 0.006 0.001 7877 7906 1.315 0.199 0.003 0.008 Used public sector source 0.884 0.018 1661 1647 2.293 0.020 0.848 0.920 Want no more children 0.356 0.007 7877 7906 1.333 0.020 0.341 0.370 Want to delay birth at least 2 years 0.351 0.007 7877 7906 1.336 0.020 0.336 0.365 Ideal number of children 5.003 0.027 12584 12622 1.444 0.005 4.948 5.057 Mothers received medical assistance at delivery 0.299 0.010 9806 9828 1.756 0.034 0.279 0.320 Mothers protected against tetanus for last birth 0.798 0.008 5999 6015 1.582 0.010 0.781 0.814 Had diarrhea in the past 2 weeks 0.156 0.006 9294 9328 1.306 0.035 0.145 0.167 Treated with ORS packets 0.710 0.017 1390 1454 1.250 0.024 0.676 0.744 Sought medical treatment 0.722 0.019 1390 1454 1.394 0.026 0.685 0.760 Vaccination card seen 0.496 0.017 1803 1752 1.422 0.034 0.462 0.531 Received BCG vaccination 0.767 0.014 1803 1752 1.353 0.018 0.740 0.795 Received DPT vaccination (3 doses) 0.664 0.016 1803 1752 1.389 0.024 0.633 0.696 Received polio vaccination (3 doses) 0.562 0.017 1803 1752 1.436 0.031 0.527 0.596 Received measles vaccination 0.678 0.016 1803 1752 1.404 0.023 0.646 0.710 Received all vaccinations 0.526 0.017 1803 1752 1.427 0.033 0.492 0.560 Height-for-age (below -2SD) 0.581 0.007 8141 8171 1.261 0.013 0.567 0.596 Weight-for-height (below -2SD) 0.186 0.006 8141 8171 1.316 0.032 0.174 0.199 Weight-for-age (below -2SD) 0.447 0.008 8141 8171 1.296 0.017 0.431 0.462 Prevalence of anemia (children 6-59) 0.382 0.012 2569 2567 1.196 0.031 0.359 0.406 Prevalence of anemia (women 15-49) 0.213 0.008 4113 4059 1.190 0.036 0.198 0.228 BMI <18.5 0.272 0.006 11715 11698 1.408 0.021 0.261 0.284 Has heard of HIV/AIDS 0.438 0.009 13137 13137 2.053 0.020 0.420 0.455 Knows about condoms to prevent AIDS 0.296 0.007 13137 13137 1.667 0.022 0.283 0.309 Konws about limitimg partners to prevent AIDS 0.356 0.009 13137 13137 2.050 0.024 0.339 0.373 Comprehensive knowledge on HIV transmission 0.106 0.005 13137 13137 1.716 0.044 0.097 0.115 Total fertility rate (past 3 years) 5.676 0.100 na 36278 1.328 0.018 5.475 5.877 Neonatal mortality (past 0-4 years) 21.815 1.771 9834 9848 1.111 0.081 18.274 25.356 Post-neonatal mortality (past 0-4 years) 22.771 1.787 9809 9811 1.116 0.078 19.197 26.346 Infant mortality (past 0-4 years) 44.587 2.566 9855 9868 1.137 0.058 39.454 49.719 Child mortality (past 0-4 years) 20.016 1.664 9674 9666 1.147 0.083 16.687 23.345 Under-five mortality (past 0-4 years) 63.710 3.084 9918 9939 1.166 0.048 57.541 69.879 Maternal mortality ratio (past 0-6 years) 557 74 na na 1.192 0.134 408 706 –––––––––––––––––––––––––––––––––––––––––––––––––––––––––––––––––––––––––––––––––––––––––––––––––––––
MEN ––––––––––––––––––––––––––––––––––––––––––––––––––––––––––––––––––––––––––––––––––––––––––––––––––––– Urban residence 0.270 0.010 4076 4076 1.427 0.037 0.250 0.290 Literacy 0.786 0.008 4076 4076 1.294 0.011 0.770 0.803 No education 0.194 0.008 4076 4076 1.289 0.041 0.178 0.210 With secondary eductation or higher 0.549 0.011 4076 4076 1.403 0.020 0.527 0.571 Never married/in union 0.458 0.009 4076 4076 1.133 0.019 0.440 0.475 Currently married/in union 0.530 0.009 4076 4076 1.128 0.017 0.512 0.547 Knowing any contraceptive method 0.666 0.012 2152 2158 1.177 0.018 0.642 0.690 Ever used any contraceptive method 0.089 0.008 2152 2158 1.229 0.085 0.074 0.104 Currently using any method 0.125 0.009 2152 2158 1.290 0.074 0.106 0.143 Want no more children 0.228 0.010 2152 2158 1.134 0.045 0.208 0.249 Ideal number fo children 5.007 0.048 3943 3954 1.401 0.010 4.910 5.103 Has heard of HIV/AIDS 0.607 0.011 4076 4076 1.411 0.018 0.585 0.629 Knows about condoms to prevent AIDS 0.454 0.012 4076 4076 1.512 0.026 0.431 0.478 Konws about limitimg partners to prevent AIDS 0.492 0.012 4076 4076 1.534 0.024 0.468 0.516 Comprehensive knowledge on HIV transmission 0.200 0.011 4076 4076 1.693 0.053 0.179 0.222 ––––––––––––––––––––––––––––––––––––––––––––––––––––––––––––––––––––––––––––––––––––––––––––––––––––––––––– na = Not applicable

Appendix B | 265
Table B.3 Sampling errors for Urban sample, Timor-Leste 2009-10 –––––––––––––––––––––––––––––––––––––––––––––––––––––––––––––––––––––––––––––––––––––––––––––––––––––––––––––––––– Number of cases Stand- –––––––––––––––– Rela- ard Un- Weight- Design tive Confidence limits Value error weighted ed effect error –––––––––––––––– Variable (R) (SE) (N) (WN) (DEFT) (SE/R) R-2SE R+2SE ––––––––––––––––––––––––––––––––––––––––––––––––––––––––––––––––––––––––––––––––––––––––––––––––––––––––––––––––––
WOMEN –––––––––––––––––––––––––––––––––––––––––––––––––––––––––––––––––––––––––––––––––––––––––––––––––––––––––––––––––– Urban 1.000 0.000 3233 3439 na 0.000 1.000 1.000 Literacy 0.838 0.011 3233 3439 1.769 0.014 0.815 0.861 No education 0.145 0.010 3233 3439 1.690 0.072 0.124 0.166 Secondary education or higher 0.696 0.017 3233 3439 2.088 0.024 0.662 0.730 Net attendance ratio 0.811 0.023 2860 2674 2.551 0.028 0.766 0.856 Never married/in union 0.372 0.009 3233 3439 1.078 0.025 0.354 0.391 Currently married/in union 0.589 0.010 3233 3439 1.143 0.017 0.569 0.609 Married before age 20 0.385 0.014 2425 2668 1.377 0.035 0.357 0.412 Currently pregnant 0.071 0.005 3233 3439 0.996 0.063 0.062 0.080 Children ever born 2.460 0.063 3233 3439 1.293 0.026 2.334 2.586 Children surviving 2.263 0.054 3233 3439 1.223 0.024 2.154 2.371 Children ever born to women age 40-49 5.548 0.148 567 611 1.237 0.027 5.253 5.844 Knows any contraceptive method 0.887 0.013 1868 2025 1.756 0.014 0.861 0.913 Knows a modern method 0.883 0.013 1868 2025 1.783 0.015 0.857 0.910 Ever used any contraceptive method 0.452 0.017 1868 2025 1.439 0.037 0.418 0.485 Currently using any method 0.304 0.016 1868 2025 1.491 0.052 0.272 0.336 Currently using a modern method 0.282 0.015 1868 2025 1.474 0.054 0.251 0.313 Currently using a traditional method 0.022 0.005 1868 2025 1.488 0.230 0.012 0.032 Currently using pill 0.037 0.005 1868 2025 1.249 0.147 0.026 0.048 Currently using IUD 0.026 0.005 1868 2025 1.386 0.198 0.016 0.036 Currently using condoms 0.010 0.004 1868 2025 1.631 0.385 0.002 0.017 Currently use injectables 0.177 0.011 1868 2025 1.277 0.064 0.155 0.200 Currently using female sterilization 0.017 0.003 1868 2025 1.130 0.201 0.010 0.023 Currently using withdrawal 0.006 0.002 1868 2025 1.127 0.338 0.002 0.010 Currently using periodic abstinence 0.016 0.004 1868 2025 1.381 0.253 0.008 0.024 Used public sector source 0.751 0.043 497 561 2.215 0.058 0.665 0.837 Want no more children 0.406 0.018 1868 2025 1.553 0.043 0.371 0.441 Want to delay birth at least 2 years 0.351 0.016 1868 2025 1.462 0.046 0.318 0.383 Ideal number of children 4.428 0.050 2994 3204 1.381 0.011 4.327 4.529 Mothers received medical assistance at delivery 0.591 0.025 2204 2353 1.905 0.042 0.541 0.641 Mothers protected against tetanus for last birth 0.843 0.015 1383 1484 1.487 0.017 0.813 0.872 Had diarrhea in the past 2 weeks 0.189 0.012 2120 2269 1.244 0.064 0.165 0.213 Treated with ORS packets 0.650 0.039 376 429 1.381 0.060 0.571 0.728 Sought medical treatment 0.693 0.043 376 429 1.570 0.063 0.607 0.780 Vaccination card seen 0.437 0.032 425 424 1.280 0.074 0.373 0.501 Received BCG vaccination 0.853 0.024 425 424 1.337 0.028 0.805 0.901 Received DPT vaccination (3 doses) 0.709 0.029 425 424 1.258 0.041 0.651 0.767 Received polio vaccination (3 doses) 0.492 0.030 425 424 1.199 0.062 0.432 0.553 Received measles vaccination 0.743 0.029 425 424 1.326 0.040 0.684 0.801 Received all vaccinations 0.477 0.031 425 424 1.214 0.064 0.416 0.539 Height-for-age (below -2SD) 0.492 0.016 1785 1794 1.275 0.032 0.460 0.523 Weight-for-height (below -2SD) 0.149 0.012 1785 1794 1.329 0.080 0.125 0.173 Weight-for-age (below -2SD) 0.349 0.015 1785 1794 1.218 0.042 0.320 0.378 Prevalence of anemia (children 6-59) 0.331 0.033 524 511 1.482 0.098 0.266 0.396 Prevalence of anemia (women 15-49) 0.191 0.016 972 1004 1.212 0.081 0.160 0.223 BMI <18.5 0.244 0.012 2819 2973 1.510 0.050 0.219 0.268 Has heard of HIV/AIDS 0.701 0.014 3233 3439 1.797 0.021 0.672 0.730 Knows about condoms to prevent AIDS 0.444 0.016 3233 3439 1.848 0.036 0.412 0.477 Konws about limitimg partners to prevent AIDS 0.553 0.017 3233 3439 1.897 0.030 0.520 0.586 Comprehensive knowledge on HIV transmission 0.140 0.012 3233 3439 1.944 0.085 0.116 0.163 Total fertility rate (past 3 years) 4.883 0.195 na 9653 1.311 0.040 4.493 5.273 Neonatal mortality (past 0-9 years) 20.945 3.583 4491 4745 1.404 0.171 13.780 28.110 Post-neonatal mortality (past 0-9 years) 20.636 2.701 4494 4730 1.185 0.131 15.234 26.037 Infant mortality (past 0-9 years) 41.581 4.847 4497 4748 1.393 0.117 31.887 51.275 Child mortality (past 0-9 years) 20.019 3.154 4439 4646 1.128 0.158 13.711 26.327 Under-five mortality (past 0-9 years) 60.768 5.680 4517 4775 1.337 0.093 49.407 72.128 ––––––––––––––––––––––––––––––––––––––––––––––––––––––––––––––––––––––––––––––––––––––––––––––––––––––––––––––––––
MEN ––––––––––––––––––––––––––––––––––––––––––––––––––––––––––––––––––––––––––––––––––––––––––––––––––––––––––––––––––Urban residence 1.000 0.000 1015 1102 na 0.000 1.000 1.000 Literacy 0.886 0.014 1015 1102 1.367 0.015 0.858 0.913 No education 0.093 0.012 1015 1102 1.369 0.135 0.068 0.118 With secondary eductation or higher 0.734 0.021 1015 1102 1.547 0.029 0.691 0.777 Never married/in union 0.481 0.020 1015 1102 1.268 0.041 0.441 0.521 Currently married/in union 0.514 0.020 1015 1102 1.259 0.038 0.475 0.554 Knowing any contraceptive method 0.840 0.023 515 567 1.423 0.027 0.794 0.886 Ever used any contraceptive method 0.194 0.023 515 567 1.344 0.121 0.147 0.241 Currently using any method 0.232 0.027 515 567 1.444 0.116 0.179 0.286 Want no more children 0.259 0.023 515 567 1.186 0.089 0.213 0.304 Ideal number fo children 4.528 0.128 972 1056 1.777 0.028 4.272 4.785 Has heard of HIV/AIDS 0.851 0.013 1015 1102 1.130 0.015 0.826 0.876 Knows about condoms to prevent AIDS 0.670 0.020 1015 1102 1.368 0.030 0.630 0.711 Konws about limitimg partners to prevent AIDS 0.737 0.020 1015 1102 1.430 0.027 0.697 0.776 Comprehensive knowledge on HIV transmission 0.342 0.028 1015 1102 1.889 0.082 0.286 0.398 –––––––––––––––––––––––––––––––––––––––––––––––––––––––––––––––––––––––––––––––––––––––––––––––––––––––––––––––––– na = Not applicable
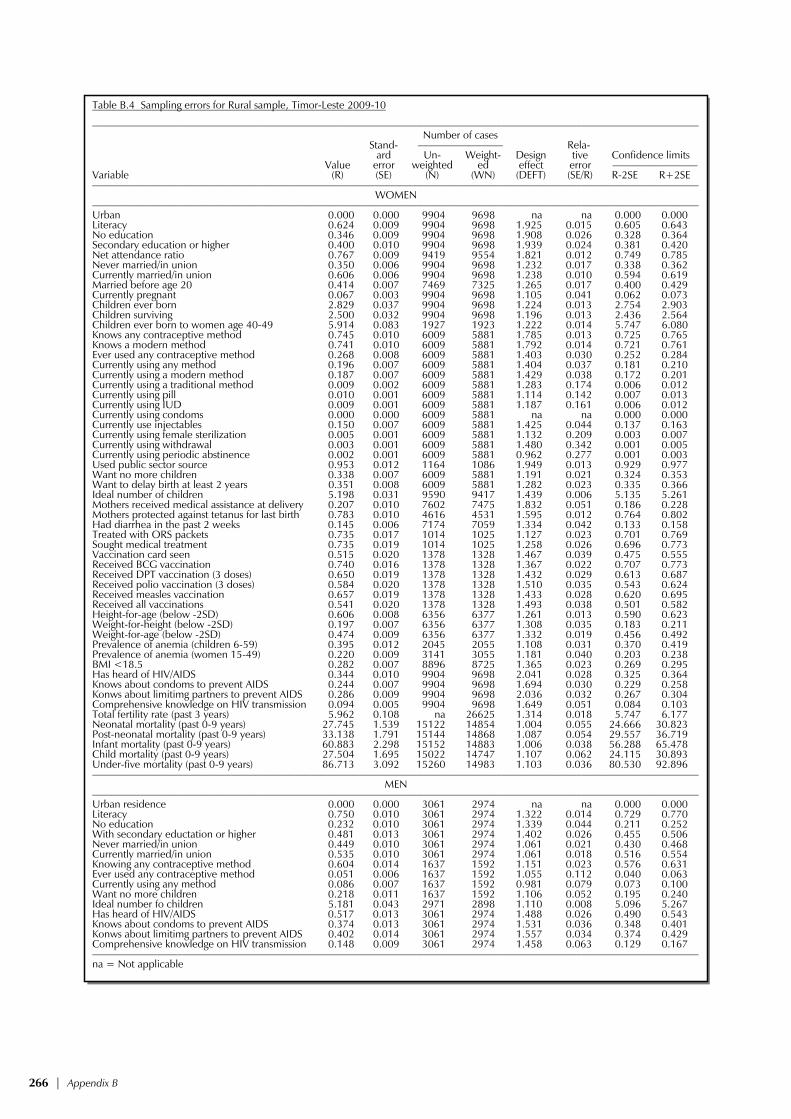
266 | Appendix B
Table B.4 Sampling errors for Rural sample, Timor-Leste 2009-10 –––––––––––––––––––––––––––––––––––––––––––––––––––––––––––––––––––––––––––––––––––––––––––––––––––––––––––––––––– Number of cases Stand- –––––––––––––––– Rela- ard Un- Weight- Design tive Confidence limits Value error weighted ed effect error –––––––––––––––– Variable (R) (SE) (N) (WN) (DEFT) (SE/R) R-2SE R+2SE ––––––––––––––––––––––––––––––––––––––––––––––––––––––––––––––––––––––––––––––––––––––––––––––––––––––––––––––––––
WOMEN –––––––––––––––––––––––––––––––––––––––––––––––––––––––––––––––––––––––––––––––––––––––––––––––––––––––––––––––––– Urban 0.000 0.000 9904 9698 na na 0.000 0.000 Literacy 0.624 0.009 9904 9698 1.925 0.015 0.605 0.643 No education 0.346 0.009 9904 9698 1.908 0.026 0.328 0.364 Secondary education or higher 0.400 0.010 9904 9698 1.939 0.024 0.381 0.420 Net attendance ratio 0.767 0.009 9419 9554 1.821 0.012 0.749 0.785 Never married/in union 0.350 0.006 9904 9698 1.232 0.017 0.338 0.362 Currently married/in union 0.606 0.006 9904 9698 1.238 0.010 0.594 0.619 Married before age 20 0.414 0.007 7469 7325 1.265 0.017 0.400 0.429 Currently pregnant 0.067 0.003 9904 9698 1.105 0.041 0.062 0.073 Children ever born 2.829 0.037 9904 9698 1.224 0.013 2.754 2.903 Children surviving 2.500 0.032 9904 9698 1.196 0.013 2.436 2.564 Children ever born to women age 40-49 5.914 0.083 1927 1923 1.222 0.014 5.747 6.080 Knows any contraceptive method 0.745 0.010 6009 5881 1.785 0.013 0.725 0.765 Knows a modern method 0.741 0.010 6009 5881 1.792 0.014 0.721 0.761 Ever used any contraceptive method 0.268 0.008 6009 5881 1.403 0.030 0.252 0.284 Currently using any method 0.196 0.007 6009 5881 1.404 0.037 0.181 0.210 Currently using a modern method 0.187 0.007 6009 5881 1.429 0.038 0.172 0.201 Currently using a traditional method 0.009 0.002 6009 5881 1.283 0.174 0.006 0.012 Currently using pill 0.010 0.001 6009 5881 1.114 0.142 0.007 0.013 Currently using IUD 0.009 0.001 6009 5881 1.187 0.161 0.006 0.012 Currently using condoms 0.000 0.000 6009 5881 na na 0.000 0.000 Currently use injectables 0.150 0.007 6009 5881 1.425 0.044 0.137 0.163 Currently using female sterilization 0.005 0.001 6009 5881 1.132 0.209 0.003 0.007 Currently using withdrawal 0.003 0.001 6009 5881 1.480 0.342 0.001 0.005 Currently using periodic abstinence 0.002 0.001 6009 5881 0.962 0.277 0.001 0.003 Used public sector source 0.953 0.012 1164 1086 1.949 0.013 0.929 0.977 Want no more children 0.338 0.007 6009 5881 1.191 0.021 0.324 0.353 Want to delay birth at least 2 years 0.351 0.008 6009 5881 1.282 0.023 0.335 0.366 Ideal number of children 5.198 0.031 9590 9417 1.439 0.006 5.135 5.261 Mothers received medical assistance at delivery 0.207 0.010 7602 7475 1.832 0.051 0.186 0.228 Mothers protected against tetanus for last birth 0.783 0.010 4616 4531 1.595 0.012 0.764 0.802 Had diarrhea in the past 2 weeks 0.145 0.006 7174 7059 1.334 0.042 0.133 0.158 Treated with ORS packets 0.735 0.017 1014 1025 1.127 0.023 0.701 0.769 Sought medical treatment 0.735 0.019 1014 1025 1.258 0.026 0.696 0.773 Vaccination card seen 0.515 0.020 1378 1328 1.467 0.039 0.475 0.555 Received BCG vaccination 0.740 0.016 1378 1328 1.367 0.022 0.707 0.773 Received DPT vaccination (3 doses) 0.650 0.019 1378 1328 1.432 0.029 0.613 0.687 Received polio vaccination (3 doses) 0.584 0.020 1378 1328 1.510 0.035 0.543 0.624 Received measles vaccination 0.657 0.019 1378 1328 1.433 0.028 0.620 0.695 Received all vaccinations 0.541 0.020 1378 1328 1.493 0.038 0.501 0.582 Height-for-age (below -2SD) 0.606 0.008 6356 6377 1.261 0.013 0.590 0.623 Weight-for-height (below -2SD) 0.197 0.007 6356 6377 1.308 0.035 0.183 0.211 Weight-for-age (below -2SD) 0.474 0.009 6356 6377 1.332 0.019 0.456 0.492 Prevalence of anemia (children 6-59) 0.395 0.012 2045 2055 1.108 0.031 0.370 0.419 Prevalence of anemia (women 15-49) 0.220 0.009 3141 3055 1.181 0.040 0.203 0.238 BMI <18.5 0.282 0.007 8896 8725 1.365 0.023 0.269 0.295 Has heard of HIV/AIDS 0.344 0.010 9904 9698 2.041 0.028 0.325 0.364 Knows about condoms to prevent AIDS 0.244 0.007 9904 9698 1.694 0.030 0.229 0.258 Konws about limitimg partners to prevent AIDS 0.286 0.009 9904 9698 2.036 0.032 0.267 0.304 Comprehensive knowledge on HIV transmission 0.094 0.005 9904 9698 1.649 0.051 0.084 0.103 Total fertility rate (past 3 years) 5.962 0.108 na 26625 1.314 0.018 5.747 6.177 Neonatal mortality (past 0-9 years) 27.745 1.539 15122 14854 1.004 0.055 24.666 30.823 Post-neonatal mortality (past 0-9 years) 33.138 1.791 15144 14868 1.087 0.054 29.557 36.719 Infant mortality (past 0-9 years) 60.883 2.298 15152 14883 1.006 0.038 56.288 65.478 Child mortality (past 0-9 years) 27.504 1.695 15022 14747 1.107 0.062 24.115 30.893 Under-five mortality (past 0-9 years) 86.713 3.092 15260 14983 1.103 0.036 80.530 92.896 ––––––––––––––––––––––––––––––––––––––––––––––––––––––––––––––––––––––––––––––––––––––––––––––––––––––––––––––––––
MEN –––––––––––––––––––––––––––––––––––––––––––––––––––––––––––––––––––––––––––––––––––––––––––––––––––––––––––––––––– Urban residence 0.000 0.000 3061 2974 na na 0.000 0.000 Literacy 0.750 0.010 3061 2974 1.322 0.014 0.729 0.770 No education 0.232 0.010 3061 2974 1.339 0.044 0.211 0.252 With secondary eductation or higher 0.481 0.013 3061 2974 1.402 0.026 0.455 0.506 Never married/in union 0.449 0.010 3061 2974 1.061 0.021 0.430 0.468 Currently married/in union 0.535 0.010 3061 2974 1.061 0.018 0.516 0.554 Knowing any contraceptive method 0.604 0.014 1637 1592 1.151 0.023 0.576 0.631 Ever used any contraceptive method 0.051 0.006 1637 1592 1.055 0.112 0.040 0.063 Currently using any method 0.086 0.007 1637 1592 0.981 0.079 0.073 0.100 Want no more children 0.218 0.011 1637 1592 1.106 0.052 0.195 0.240 Ideal number fo children 5.181 0.043 2971 2898 1.110 0.008 5.096 5.267 Has heard of HIV/AIDS 0.517 0.013 3061 2974 1.488 0.026 0.490 0.543 Knows about condoms to prevent AIDS 0.374 0.013 3061 2974 1.531 0.036 0.348 0.401 Konws about limitimg partners to prevent AIDS 0.402 0.014 3061 2974 1.557 0.034 0.374 0.429 Comprehensive knowledge on HIV transmission 0.148 0.009 3061 2974 1.458 0.063 0.129 0.167 –––––––––––––––––––––––––––––––––––––––––––––––––––––––––––––––––––––––––––––––––––––––––––––––––––––––––––––––––– na = Not applicable
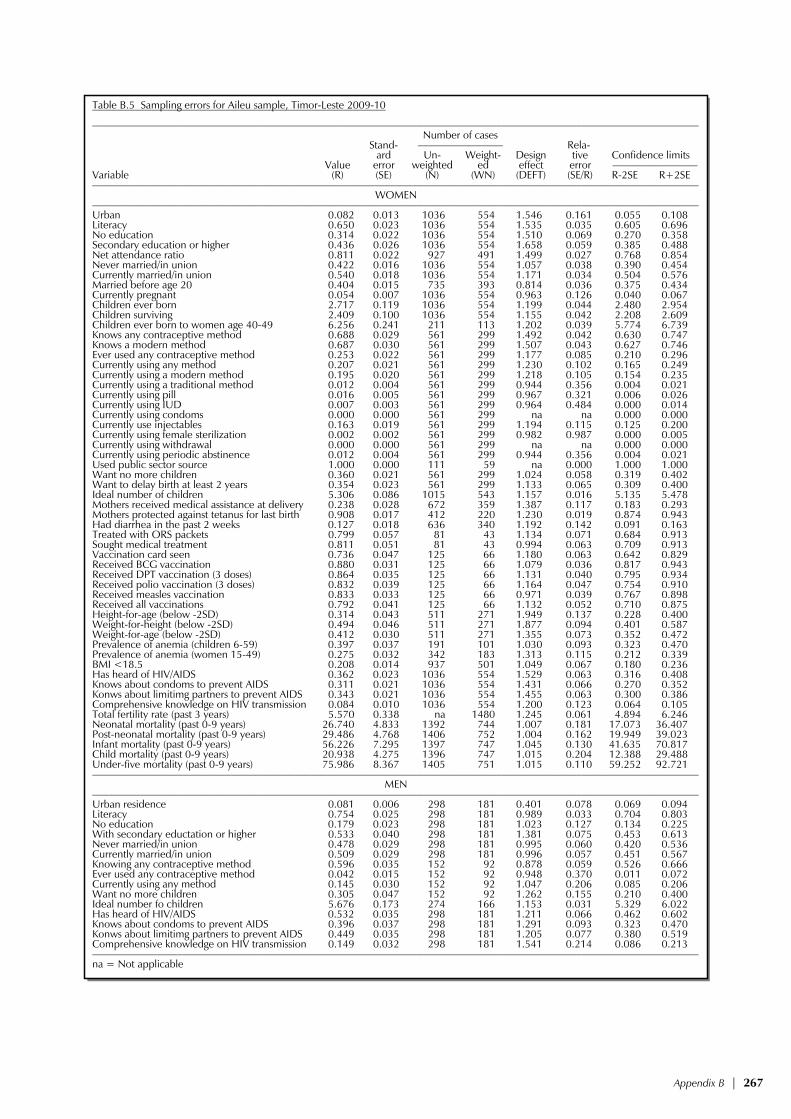
Appendix B | 267
Table B.5 Sampling errors for Aileu sample, Timor-Leste 2009-10 –––––––––––––––––––––––––––––––––––––––––––––––––––––––––––––––––––––––––––––––––––––––––––––––––––––––––––––––––– Number of cases Stand- –––––––––––––––– Rela- ard Un- Weight- Design tive Confidence limits Value error weighted ed effect error –––––––––––––––– Variable (R) (SE) (N) (WN) (DEFT) (SE/R) R-2SE R+2SE ––––––––––––––––––––––––––––––––––––––––––––––––––––––––––––––––––––––––––––––––––––––––––––––––––––––––––––––––––
WOMEN –––––––––––––––––––––––––––––––––––––––––––––––––––––––––––––––––––––––––––––––––––––––––––––––––––––––––––––––––– Urban 0.082 0.013 1036 554 1.546 0.161 0.055 0.108 Literacy 0.650 0.023 1036 554 1.535 0.035 0.605 0.696 No education 0.314 0.022 1036 554 1.510 0.069 0.270 0.358 Secondary education or higher 0.436 0.026 1036 554 1.658 0.059 0.385 0.488 Net attendance ratio 0.811 0.022 927 491 1.499 0.027 0.768 0.854 Never married/in union 0.422 0.016 1036 554 1.057 0.038 0.390 0.454 Currently married/in union 0.540 0.018 1036 554 1.171 0.034 0.504 0.576 Married before age 20 0.404 0.015 735 393 0.814 0.036 0.375 0.434 Currently pregnant 0.054 0.007 1036 554 0.963 0.126 0.040 0.067 Children ever born 2.717 0.119 1036 554 1.199 0.044 2.480 2.954 Children surviving 2.409 0.100 1036 554 1.155 0.042 2.208 2.609 Children ever born to women age 40-49 6.256 0.241 211 113 1.202 0.039 5.774 6.739 Knows any contraceptive method 0.688 0.029 561 299 1.492 0.042 0.630 0.747 Knows a modern method 0.687 0.030 561 299 1.507 0.043 0.627 0.746 Ever used any contraceptive method 0.253 0.022 561 299 1.177 0.085 0.210 0.296 Currently using any method 0.207 0.021 561 299 1.230 0.102 0.165 0.249 Currently using a modern method 0.195 0.020 561 299 1.218 0.105 0.154 0.235 Currently using a traditional method 0.012 0.004 561 299 0.944 0.356 0.004 0.021 Currently using pill 0.016 0.005 561 299 0.967 0.321 0.006 0.026 Currently using IUD 0.007 0.003 561 299 0.964 0.484 0.000 0.014 Currently using condoms 0.000 0.000 561 299 na na 0.000 0.000 Currently use injectables 0.163 0.019 561 299 1.194 0.115 0.125 0.200 Currently using female sterilization 0.002 0.002 561 299 0.982 0.987 0.000 0.005 Currently using withdrawal 0.000 0.000 561 299 na na 0.000 0.000 Currently using periodic abstinence 0.012 0.004 561 299 0.944 0.356 0.004 0.021 Used public sector source 1.000 0.000 111 59 na 0.000 1.000 1.000 Want no more children 0.360 0.021 561 299 1.024 0.058 0.319 0.402 Want to delay birth at least 2 years 0.354 0.023 561 299 1.133 0.065 0.309 0.400 Ideal number of children 5.306 0.086 1015 543 1.157 0.016 5.135 5.478 Mothers received medical assistance at delivery 0.238 0.028 672 359 1.387 0.117 0.183 0.293 Mothers protected against tetanus for last birth 0.908 0.017 412 220 1.230 0.019 0.874 0.943 Had diarrhea in the past 2 weeks 0.127 0.018 636 340 1.192 0.142 0.091 0.163 Treated with ORS packets 0.799 0.057 81 43 1.134 0.071 0.684 0.913 Sought medical treatment 0.811 0.051 81 43 0.994 0.063 0.709 0.913 Vaccination card seen 0.736 0.047 125 66 1.180 0.063 0.642 0.829 Received BCG vaccination 0.880 0.031 125 66 1.079 0.036 0.817 0.943 Received DPT vaccination (3 doses) 0.864 0.035 125 66 1.131 0.040 0.795 0.934 Received polio vaccination (3 doses) 0.832 0.039 125 66 1.164 0.047 0.754 0.910 Received measles vaccination 0.833 0.033 125 66 0.971 0.039 0.767 0.898 Received all vaccinations 0.792 0.041 125 66 1.132 0.052 0.710 0.875 Height-for-age (below -2SD) 0.314 0.043 511 271 1.949 0.137 0.228 0.400 Weight-for-height (below -2SD) 0.494 0.046 511 271 1.877 0.094 0.401 0.587 Weight-for-age (below -2SD) 0.412 0.030 511 271 1.355 0.073 0.352 0.472 Prevalence of anemia (children 6-59) 0.397 0.037 191 101 1.030 0.093 0.323 0.470 Prevalence of anemia (women 15-49) 0.275 0.032 342 183 1.313 0.115 0.212 0.339 BMI <18.5 0.208 0.014 937 501 1.049 0.067 0.180 0.236 Has heard of HIV/AIDS 0.362 0.023 1036 554 1.529 0.063 0.316 0.408 Knows about condoms to prevent AIDS 0.311 0.021 1036 554 1.431 0.066 0.270 0.352 Konws about limitimg partners to prevent AIDS 0.343 0.021 1036 554 1.455 0.063 0.300 0.386 Comprehensive knowledge on HIV transmission 0.084 0.010 1036 554 1.200 0.123 0.064 0.105 Total fertility rate (past 3 years) 5.570 0.338 na 1480 1.245 0.061 4.894 6.246 Neonatal mortality (past 0-9 years) 26.740 4.833 1392 744 1.007 0.181 17.073 36.407 Post-neonatal mortality (past 0-9 years) 29.486 4.768 1406 752 1.004 0.162 19.949 39.023 Infant mortality (past 0-9 years) 56.226 7.295 1397 747 1.045 0.130 41.635 70.817 Child mortality (past 0-9 years) 20.938 4.275 1396 747 1.015 0.204 12.388 29.488 Under-five mortality (past 0-9 years) 75.986 8.367 1405 751 1.015 0.110 59.252 92.721 ––––––––––––––––––––––––––––––––––––––––––––––––––––––––––––––––––––––––––––––––––––––––––––––––––––––––––––––––––
MEN –––––––––––––––––––––––––––––––––––––––––––––––––––––––––––––––––––––––––––––––––––––––––––––––––––––––––––––––––– Urban residence 0.081 0.006 298 181 0.401 0.078 0.069 0.094 Literacy 0.754 0.025 298 181 0.989 0.033 0.704 0.803 No education 0.179 0.023 298 181 1.023 0.127 0.134 0.225 With secondary eductation or higher 0.533 0.040 298 181 1.381 0.075 0.453 0.613 Never married/in union 0.478 0.029 298 181 0.995 0.060 0.420 0.536 Currently married/in union 0.509 0.029 298 181 0.996 0.057 0.451 0.567 Knowing any contraceptive method 0.596 0.035 152 92 0.878 0.059 0.526 0.666 Ever used any contraceptive method 0.042 0.015 152 92 0.948 0.370 0.011 0.072 Currently using any method 0.145 0.030 152 92 1.047 0.206 0.085 0.206 Want no more children 0.305 0.047 152 92 1.262 0.155 0.210 0.400 Ideal number fo children 5.676 0.173 274 166 1.153 0.031 5.329 6.022 Has heard of HIV/AIDS 0.532 0.035 298 181 1.211 0.066 0.462 0.602 Knows about condoms to prevent AIDS 0.396 0.037 298 181 1.291 0.093 0.323 0.470 Konws about limitimg partners to prevent AIDS 0.449 0.035 298 181 1.205 0.077 0.380 0.519 Comprehensive knowledge on HIV transmission 0.149 0.032 298 181 1.541 0.214 0.086 0.213 –––––––––––––––––––––––––––––––––––––––––––––––––––––––––––––––––––––––––––––––––––––––––––––––––––––––––––––––––– na = Not applicable

268 | Appendix B
Table B.6 Sampling errors for Ainaro sample, Timor-Leste 2009-10 –––––––––––––––––––––––––––––––––––––––––––––––––––––––––––––––––––––––––––––––––––––––––––––––––––––––––––––––––– Number of cases Stand- –––––––––––––––– Rela- ard Un- Weight- Design tive Confidence limits Value error weighted ed effect error –––––––––––––––– Variable (R) (SE) (N) (WN) (DEFT) (SE/R) R-2SE R+2SE ––––––––––––––––––––––––––––––––––––––––––––––––––––––––––––––––––––––––––––––––––––––––––––––––––––––––––––––––––
WOMEN –––––––––––––––––––––––––––––––––––––––––––––––––––––––––––––––––––––––––––––––––––––––––––––––––––––––––––––––––– Urban 0.173 0.009 841 619 0.673 0.051 0.155 0.190 Literacy 0.578 0.030 841 619 1.751 0.052 0.518 0.637 No education 0.399 0.026 841 619 1.546 0.066 0.347 0.451 Secondary education or higher 0.435 0.033 841 619 1.942 0.076 0.369 0.502 Net attendance ratio 0.737 0.023 1005 765 1.455 0.031 0.691 0.783 Never married/in union 0.346 0.020 841 619 1.214 0.058 0.306 0.386 Currently married/in union 0.617 0.021 841 619 1.228 0.033 0.576 0.659 Married before age 20 0.429 0.023 633 466 1.183 0.054 0.383 0.476 Currently pregnant 0.084 0.011 841 619 1.160 0.133 0.061 0.106 Children ever born 2.973 0.135 841 619 1.239 0.046 2.702 3.243 Children surviving 2.589 0.108 841 619 1.153 0.042 2.373 2.804 Children ever born to women age 40-49 6.679 0.342 118 87 1.147 0.051 5.995 7.363 Knows any contraceptive method 0.578 0.028 518 382 1.295 0.049 0.522 0.634 Knows a modern method 0.574 0.028 518 382 1.296 0.049 0.518 0.631 Ever used any contraceptive method 0.183 0.023 518 382 1.356 0.126 0.137 0.229 Currently using any method 0.141 0.023 518 382 1.520 0.165 0.094 0.187 Currently using a modern method 0.137 0.023 518 382 1.524 0.168 0.091 0.183 Currently using a traditional method 0.004 0.003 518 382 0.970 0.715 0.000 0.009 Currently using pill 0.009 0.004 518 382 0.924 0.423 0.001 0.017 Currently using IUD 0.008 0.004 518 382 0.964 0.470 0.000 0.016 Currently using condoms 0.000 0.000 518 382 na na 0.000 0.000 Currently use injectables 0.107 0.020 518 382 1.440 0.184 0.068 0.146 Currently using female sterilization 0.002 0.002 518 382 0.889 1.007 0.000 0.005 Currently using withdrawal 0.000 0.000 518 382 na na 0.000 0.000 Currently using periodic abstinence 0.000 0.000 518 382 na na 0.000 0.000 Used public sector source 0.962 0.022 69 51 0.956 0.023 0.918 1.006 Want no more children 0.197 0.018 518 382 1.042 0.093 0.161 0.234 Want to delay birth at least 2 years 0.360 0.025 518 382 1.181 0.069 0.310 0.410 Ideal number of children 6.456 0.123 743 552 1.599 0.019 6.210 6.703 Mothers received medical assistance at delivery 0.105 0.020 789 579 1.432 0.188 0.065 0.144 Mothers protected against tetanus for last birth 0.667 0.034 433 318 1.480 0.050 0.600 0.734 Had diarrhea in the past 2 weeks 0.039 0.008 729 536 0.971 0.193 0.024 0.054 Treated with ORS packets 0.584 0.092 31 21 0.988 0.157 0.400 0.767 Sought medical treatment 0.564 0.105 31 21 1.041 0.187 0.353 0.774 Vaccination card seen 0.323 0.047 152 113 1.242 0.146 0.229 0.417 Received BCG vaccination 0.593 0.066 152 113 1.645 0.111 0.462 0.724 Received DPT vaccination (3 doses) 0.520 0.065 152 113 1.603 0.125 0.390 0.650 Received polio vaccination (3 doses) 0.517 0.065 152 113 1.616 0.127 0.386 0.648 Received measles vaccination 0.504 0.063 152 113 1.546 0.124 0.379 0.630 Received all vaccinations 0.461 0.063 152 113 1.554 0.136 0.336 0.587 Height-for-age (below -2SD) 0.691 0.025 624 482 1.230 0.036 0.641 0.741 Weight-for-height (below -2SD) 0.182 0.014 624 482 0.847 0.075 0.155 0.209 Weight-for-age (below -2SD) 0.477 0.028 624 482 1.299 0.059 0.421 0.533 Prevalence of anemia (children 6-59) 0.311 0.043 208 161 1.226 0.139 0.225 0.397 Prevalence of anemia (women 15-49) 0.101 0.026 279 207 1.438 0.256 0.049 0.153 BMI <18.5 0.210 0.016 736 544 1.094 0.078 0.177 0.242 Has heard of HIV/AIDS 0.288 0.023 841 619 1.494 0.081 0.241 0.335 Knows about condoms to prevent AIDS 0.148 0.018 841 619 1.480 0.123 0.112 0.184 Konws about limitimg partners to prevent AIDS 0.172 0.020 841 619 1.505 0.114 0.133 0.211 Comprehensive knowledge on HIV transmission 0.032 0.009 841 619 1.500 0.283 0.014 0.051 Total fertility rate (past 3 years) 7.234 0.384 na 1711 1.337 0.053 6.466 8.002 Neonatal mortality (past 0-9 years) 30.948 4.321 1497 1099 0.919 0.140 22.305 39.590 Post-neonatal mortality (past 0-9 years) 45.562 7.244 1506 1105 1.220 0.159 31.073 60.051 Infant mortality (past 0-9 years) 76.510 7.501 1502 1102 0.968 0.098 61.507 91.512 Child mortality (past 0-9 years) 22.127 4.092 1490 1096 0.960 0.185 13.943 30.310 Under-five mortality (past 0-9 years) 96.943 9.285 1512 1110 1.035 0.096 78.374 115.513 ––––––––––––––––––––––––––––––––––––––––––––––––––––––––––––––––––––––––––––––––––––––––––––––––––––––––––––––––––
MEN –––––––––––––––––––––––––––––––––––––––––––––––––––––––––––––––––––––––––––––––––––––––––––––––––––––––––––––––––– Urban residence 0.154 0.019 296 217 0.911 0.124 0.116 0.192 Literacy 0.697 0.028 296 217 1.050 0.040 0.641 0.753 No education 0.297 0.029 296 217 1.082 0.097 0.239 0.355 With secondary eductation or higher 0.466 0.038 296 217 1.303 0.081 0.390 0.541 Never married/in union 0.508 0.028 296 217 0.971 0.056 0.452 0.565 Currently married/in union 0.467 0.027 296 217 0.939 0.058 0.413 0.522 Knowing any contraceptive method 0.514 0.040 138 101 0.930 0.077 0.435 0.594 Ever used any contraceptive method 0.006 0.006 138 101 0.898 0.996 0.000 0.018 Currently using any method 0.087 0.023 138 101 0.942 0.260 0.042 0.133 Want no more children 0.086 0.027 138 101 1.112 0.311 0.032 0.139 Ideal number fo children 5.948 0.156 265 196 1.152 0.026 5.636 6.261 Has heard of HIV/AIDS 0.464 0.033 296 217 1.134 0.071 0.398 0.530 Knows about condoms to prevent AIDS 0.186 0.033 296 217 1.452 0.177 0.120 0.252 Konws about limitimg partners to prevent AIDS 0.236 0.036 296 217 1.458 0.153 0.163 0.308 Comprehensive knowledge on HIV transmission 0.057 0.015 296 217 1.094 0.260 0.027 0.086 –––––––––––––––––––––––––––––––––––––––––––––––––––––––––––––––––––––––––––––––––––––––––––––––––––––––––––––––––– na = Not applicable

Appendix B | 269
Table B.7 Sampling errors for Baucau sample, Timor-Leste 2009-10 –––––––––––––––––––––––––––––––––––––––––––––––––––––––––––––––––––––––––––––––––––––––––––––––––––––––––––––––––– Number of cases Stand- –––––––––––––––– Rela- ard Un- Weight- Design tive Confidence limits Value error weighted ed effect error –––––––––––––––– Variable (R) (SE) (N) (WN) (DEFT) (SE/R) R-2SE R+2SE ––––––––––––––––––––––––––––––––––––––––––––––––––––––––––––––––––––––––––––––––––––––––––––––––––––––––––––––––––
WOMEN –––––––––––––––––––––––––––––––––––––––––––––––––––––––––––––––––––––––––––––––––––––––––––––––––––––––––––––––––– Urban 0.059 0.007 1007 1408 0.984 0.124 0.044 0.074 Literacy 0.693 0.031 1007 1408 2.100 0.044 0.632 0.754 No education 0.271 0.031 1007 1408 2.197 0.114 0.209 0.332 Secondary education or higher 0.504 0.038 1007 1408 2.376 0.075 0.428 0.579 Net attendance ratio 0.823 0.017 971 1442 1.302 0.021 0.789 0.857 Never married/in union 0.366 0.019 1007 1408 1.259 0.052 0.327 0.404 Currently married/in union 0.605 0.020 1007 1408 1.297 0.033 0.565 0.645 Married before age 20 0.343 0.022 755 1067 1.299 0.065 0.298 0.388 Currently pregnant 0.061 0.007 1007 1408 0.907 0.113 0.047 0.074 Children ever born 2.609 0.125 1007 1408 1.429 0.048 2.359 2.860 Children surviving 2.450 0.112 1007 1408 1.374 0.046 2.225 2.674 Children ever born to women age 40-49 5.034 0.232 226 318 1.299 0.046 4.570 5.498 Knows any contraceptive method 0.562 0.050 597 852 2.450 0.089 0.462 0.662 Knows a modern method 0.558 0.050 597 852 2.444 0.090 0.458 0.658 Ever used any contraceptive method 0.084 0.017 597 852 1.467 0.198 0.051 0.118 Currently using any method 0.080 0.016 597 852 1.426 0.198 0.049 0.112 Currently using a modern method 0.076 0.016 597 852 1.500 0.214 0.043 0.109 Currently using a traditional method 0.004 0.003 597 852 1.006 0.627 0.000 0.010 Currently using pill 0.012 0.005 597 852 1.210 0.453 0.001 0.023 Currently using IUD 0.007 0.004 597 852 1.227 0.611 0.000 0.015 Currently using condoms 0.000 0.000 597 852 na na 0.000 0.000 Currently use injectables 0.035 0.011 597 852 1.420 0.305 0.014 0.057 Currently using female sterilization 0.010 0.005 597 852 1.112 0.442 0.001 0.020 Currently using withdrawal 0.000 0.000 597 852 na na 0.000 0.000 Currently using periodic abstinence 0.002 0.002 597 852 0.981 0.816 0.000 0.006 Used public sector source 0.992 0.008 46 60 0.601 0.008 0.977 1.008 Want no more children 0.434 0.023 597 852 1.132 0.053 0.388 0.480 Want to delay birth at least 2 years 0.360 0.018 597 852 0.922 0.050 0.324 0.396 Ideal number of children 4.791 0.078 996 1391 1.230 0.016 4.635 4.947 Mothers received medical assistance at delivery 0.275 0.039 674 970 1.805 0.140 0.198 0.352 Mothers protected against tetanus for last birth 0.824 0.024 420 598 1.276 0.029 0.777 0.872 Had diarrhea in the past 2 weeks 0.151 0.016 653 941 1.014 0.103 0.120 0.182 Treated with ORS packets 0.921 0.034 98 142 1.009 0.037 0.853 0.989 Sought medical treatment 0.850 0.040 98 142 0.939 0.047 0.770 0.930 Vaccination card seen 0.480 0.059 125 180 1.329 0.123 0.362 0.599 Received BCG vaccination 0.582 0.056 125 180 1.270 0.096 0.470 0.694 Received DPT vaccination (3 doses) 0.518 0.056 125 180 1.260 0.108 0.406 0.631 Received polio vaccination (3 doses) 0.507 0.056 125 180 1.255 0.110 0.395 0.619 Received measles vaccination 0.520 0.056 125 180 1.248 0.107 0.409 0.631 Received all vaccinations 0.471 0.051 125 180 1.148 0.108 0.369 0.574 Height-for-age (below -2SD) 0.581 0.026 471 687 1.134 0.045 0.529 0.633 Weight-for-height (below -2SD) 0.216 0.022 471 687 1.172 0.103 0.171 0.260 Weight-for-age (below -2SD) 0.430 0.037 471 687 1.587 0.087 0.355 0.505 Prevalence of anemia (children 6-59) 0.511 0.036 173 252 1.000 0.070 0.440 0.583 Prevalence of anemia (women 15-49) 0.173 0.026 312 424 1.218 0.153 0.120 0.225 BMI <18.5 0.169 0.016 919 1282 1.331 0.098 0.136 0.202 Has heard of HIV/AIDS 0.543 0.036 1007 1408 2.285 0.066 0.471 0.615 Knows about condoms to prevent AIDS 0.357 0.021 1007 1408 1.360 0.058 0.316 0.398 Konws about limitimg partners to prevent AIDS 0.502 0.034 1007 1408 2.126 0.067 0.434 0.569 Comprehensive knowledge on HIV transmission 0.235 0.020 1007 1408 1.532 0.087 0.194 0.276 Total fertility rate (past 3 years) 5.468 0.279 na 3855 1.121 0.051 4.911 6.025 Neonatal mortality (past 0-9 years) 11.410 3.012 1411 2015 1.089 0.264 5.386 17.433 Post-neonatal mortality (past 0-9 years) 18.298 3.508 1418 2026 0.993 0.192 11.282 25.314 Infant mortality (past 0-9 years) 29.708 5.356 1414 2019 1.149 0.180 18.995 40.420 Child mortality (past 0-9 years) 12.418 4.342 1422 2019 1.396 0.350 3.734 21.101 Under-five mortality (past 0-9 years) 41.757 7.527 1417 2024 1.301 0.180 26.703 56.810 ––––––––––––––––––––––––––––––––––––––––––––––––––––––––––––––––––––––––––––––––––––––––––––––––––––––––––––––––––
MEN –––––––––––––––––––––––––––––––––––––––––––––––––––––––––––––––––––––––––––––––––––––––––––––––––––––––––––––––––– Urban residence 0.058 0.012 297 415 0.876 0.205 0.034 0.082 Literacy 0.830 0.033 297 415 1.532 0.040 0.764 0.897 No education 0.157 0.033 297 415 1.535 0.207 0.092 0.222 With secondary eductation or higher 0.542 0.045 297 415 1.542 0.083 0.453 0.632 Never married/in union 0.408 0.027 297 415 0.937 0.066 0.354 0.461 Currently married/in union 0.572 0.027 297 415 0.923 0.046 0.519 0.625 Knowing any contraceptive method 0.312 0.056 167 237 1.546 0.179 0.200 0.423 Ever used any contraceptive method 0.000 0.000 167 237 na na 0.000 0.000 Currently using any method 0.000 0.000 167 237 na na 0.000 0.000 Want no more children 0.205 0.036 167 237 1.139 0.174 0.134 0.277 Ideal number fo children 5.563 0.103 295 412 0.902 0.019 5.357 5.770 Has heard of HIV/AIDS 0.643 0.045 297 415 1.605 0.070 0.553 0.733 Knows about condoms to prevent AIDS 0.147 0.033 297 415 1.592 0.224 0.081 0.212 Konws about limitimg partners to prevent AIDS 0.224 0.044 297 415 1.796 0.195 0.137 0.312 Comprehensive knowledge on HIV transmission 0.061 0.019 297 415 1.392 0.317 0.022 0.100 –––––––––––––––––––––––––––––––––––––––––––––––––––––––––––––––––––––––––––––––––––––––––––––––––––––––––––––––––– na = Not applicable

270 | Appendix B
Table B.8 Sampling errors for Bobonaro sample, Timor-Leste 2009-10 –––––––––––––––––––––––––––––––––––––––––––––––––––––––––––––––––––––––––––––––––––––––––––––––––––––––––––––––––– Number of cases Stand- –––––––––––––––– Rela- ard Un- Weight- Design tive Confidence limits Value error weighted ed effect error –––––––––––––––– Variable (R) (SE) (N) (WN) (DEFT) (SE/R) R-2SE R+2SE ––––––––––––––––––––––––––––––––––––––––––––––––––––––––––––––––––––––––––––––––––––––––––––––––––––––––––––––––––
WOMEN –––––––––––––––––––––––––––––––––––––––––––––––––––––––––––––––––––––––––––––––––––––––––––––––––––––––––––––––––– Urban 0.100 0.010 1062 1262 1.046 0.096 0.081 0.120 Literacy 0.580 0.031 1062 1262 2.035 0.053 0.519 0.642 No education 0.396 0.032 1062 1262 2.142 0.081 0.332 0.461 Secondary education or higher 0.356 0.025 1062 1262 1.728 0.071 0.305 0.407 Net attendance ratio 0.789 0.023 921 1147 1.560 0.029 0.742 0.835 Never married/in union 0.365 0.014 1062 1262 0.924 0.037 0.338 0.393 Currently married/in union 0.586 0.014 1062 1262 0.953 0.025 0.557 0.614 Married before age 20 0.413 0.018 785 933 1.042 0.044 0.376 0.449 Currently pregnant 0.054 0.007 1062 1262 1.061 0.137 0.039 0.068 Children ever born 2.675 0.100 1062 1262 1.093 0.037 2.475 2.874 Children surviving 2.354 0.088 1062 1262 1.098 0.037 2.178 2.529 Children ever born to women age 40-49 5.988 0.220 219 253 1.143 0.037 5.548 6.428 Knows any contraceptive method 0.788 0.034 614 739 2.030 0.043 0.720 0.855 Knows a modern method 0.783 0.034 614 739 2.019 0.043 0.716 0.851 Ever used any contraceptive method 0.281 0.030 614 739 1.653 0.107 0.221 0.342 Currently using any method 0.204 0.025 614 739 1.513 0.121 0.155 0.253 Currently using a modern method 0.204 0.025 614 739 1.513 0.121 0.155 0.253 Currently using a traditional method 0.000 0.000 614 739 na na 0.000 0.000 Currently using pill 0.010 0.004 614 739 0.971 0.390 0.002 0.018 Currently using IUD 0.008 0.004 614 739 1.216 0.543 0.000 0.017 Currently using condoms 0.000 0.000 614 739 na na 0.000 0.000 Currently use injectables 0.161 0.024 614 739 1.592 0.147 0.114 0.209 Currently using female sterilization 0.008 0.003 614 739 0.962 0.429 0.001 0.015 Currently using withdrawal 0.000 0.000 614 739 na na 0.000 0.000 Currently using periodic abstinence 0.000 0.000 614 739 na na 0.000 0.000 Used public sector source 0.973 0.019 125 150 1.321 0.020 0.934 1.011 Want no more children 0.269 0.020 614 739 1.105 0.074 0.229 0.308 Want to delay birth at least 2 years 0.208 0.015 614 739 0.903 0.071 0.178 0.237 Ideal number of children 5.219 0.077 1046 1247 1.273 0.015 5.065 5.373 Mothers received medical assistance at delivery 0.256 0.035 748 934 1.815 0.136 0.186 0.325 Mothers protected against tetanus for last birth 0.781 0.022 476 587 1.180 0.028 0.737 0.826 Had diarrhea in the past 2 weeks 0.201 0.014 710 884 0.882 0.072 0.172 0.230 Treated with ORS packets 0.783 0.036 147 178 0.926 0.046 0.712 0.855 Sought medical treatment 0.836 0.042 147 178 1.228 0.050 0.753 0.919 Vaccination card seen 0.497 0.067 131 157 1.523 0.135 0.363 0.630 Received BCG vaccination 0.824 0.039 131 157 1.152 0.047 0.747 0.901 Received DPT vaccination (3 doses) 0.815 0.040 131 157 1.182 0.049 0.735 0.896 Received polio vaccination (3 doses) 0.561 0.067 131 157 1.519 0.119 0.427 0.695 Received measles vaccination 0.798 0.039 131 157 1.092 0.048 0.721 0.875 Received all vaccinations 0.552 0.066 131 157 1.489 0.119 0.421 0.684 Height-for-age (below -2SD) 0.726 0.023 611 792 1.201 0.031 0.681 0.771 Weight-for-height (below -2SD) 0.153 0.017 611 792 1.131 0.109 0.119 0.186 Weight-for-age (below -2SD) 0.525 0.030 611 792 1.438 0.057 0.465 0.585 Prevalence of anemia (children 6-59) 0.441 0.036 205 258 1.102 0.082 0.369 0.513 Prevalence of anemia (women 15-49) 0.256 0.029 313 376 1.183 0.114 0.198 0.314 BMI <18.5 0.394 0.023 969 1149 1.461 0.058 0.348 0.440 Has heard of HIV/AIDS 0.395 0.028 1062 1262 1.875 0.071 0.339 0.452 Knows about condoms to prevent AIDS 0.246 0.022 1062 1262 1.637 0.088 0.203 0.289 Konws about limitimg partners to prevent AIDS 0.260 0.023 1062 1262 1.729 0.090 0.214 0.307 Comprehensive knowledge on HIV transmission 0.053 0.010 1062 1262 1.448 0.187 0.033 0.074 Total fertility rate (past 3 years) 5.970 0.328 na 3471 1.346 0.055 5.315 6.625 Neonatal mortality (past 0-9 years) 27.431 5.062 1466 1805 1.057 0.185 17.306 37.556 Post-neonatal mortality (past 0-9 years) 22.676 4.337 1459 1793 1.031 0.191 14.002 31.350 Infant mortality (past 0-9 years) 50.107 7.126 1467 1806 1.117 0.142 35.855 64.359 Child mortality (past 0-9 years) 36.446 5.114 1433 1758 0.897 0.140 26.219 46.674 Under-five mortality (past 0-9 years) 84.727 9.898 1474 1816 1.166 0.117 64.930 104.523 ––––––––––––––––––––––––––––––––––––––––––––––––––––––––––––––––––––––––––––––––––––––––––––––––––––––––––––––––––
MEN –––––––––––––––––––––––––––––––––––––––––––––––––––––––––––––––––––––––––––––––––––––––––––––––––––––––––––––––––– Urban residence 0.113 0.012 319 357 0.663 0.104 0.090 0.137 Literacy 0.798 0.028 319 357 1.252 0.035 0.741 0.854 No education 0.289 0.032 319 357 1.258 0.111 0.225 0.353 With secondary eductation or higher 0.458 0.039 319 357 1.383 0.085 0.380 0.535 Never married/in union 0.514 0.027 319 357 0.967 0.053 0.460 0.568 Currently married/in union 0.477 0.028 319 357 0.998 0.059 0.421 0.533 Knowing any contraceptive method 0.876 0.034 149 170 1.264 0.039 0.807 0.944 Ever used any contraceptive method 0.003 0.003 149 170 0.663 0.997 0.000 0.009 Currently using any method 0.000 0.000 149 170 na na 0.000 0.000 Want no more children 0.234 0.045 149 170 1.286 0.192 0.144 0.323 Ideal number fo children 4.493 0.145 319 357 1.132 0.032 4.204 4.782 Has heard of HIV/AIDS 0.618 0.041 319 357 1.487 0.066 0.537 0.699 Knows about condoms to prevent AIDS 0.444 0.041 319 357 1.458 0.092 0.362 0.525 Konws about limitimg partners to prevent AIDS 0.476 0.043 319 357 1.541 0.091 0.389 0.562 Comprehensive knowledge on HIV transmission 0.264 0.032 319 357 1.273 0.119 0.201 0.327 –––––––––––––––––––––––––––––––––––––––––––––––––––––––––––––––––––––––––––––––––––––––––––––––––––––––––––––––––– na = Not applicable

Appendix B | 271
Table B.9 Sampling errors for Covalima sample, Timor-Leste 2009-10 –––––––––––––––––––––––––––––––––––––––––––––––––––––––––––––––––––––––––––––––––––––––––––––––––––––––––––––––––– Number of cases Stand- –––––––––––––––– Rela- ard Un- Weight- Design tive Confidence limits Value error weighted ed effect error –––––––––––––––– Variable (R) (SE) (N) (WN) (DEFT) (SE/R) R-2SE R+2SE ––––––––––––––––––––––––––––––––––––––––––––––––––––––––––––––––––––––––––––––––––––––––––––––––––––––––––––––––––
WOMEN –––––––––––––––––––––––––––––––––––––––––––––––––––––––––––––––––––––––––––––––––––––––––––––––––––––––––––––––––– Urban 0.189 0.012 989 781 0.929 0.061 0.166 0.212 Literacy 0.742 0.017 989 781 1.236 0.023 0.708 0.777 No education 0.217 0.017 989 781 1.309 0.079 0.183 0.251 Secondary education or higher 0.527 0.023 989 781 1.417 0.043 0.482 0.572 Net attendance ratio 0.840 0.015 956 760 1.185 0.018 0.810 0.869 Never married/in union 0.350 0.019 989 781 1.265 0.055 0.311 0.388 Currently married/in union 0.586 0.016 989 781 1.024 0.027 0.554 0.619 Married before age 20 0.480 0.023 702 559 1.235 0.049 0.433 0.526 Currently pregnant 0.058 0.009 989 781 1.165 0.149 0.041 0.076 Children ever born 2.562 0.086 989 781 0.976 0.034 2.390 2.734 Children surviving 2.206 0.072 989 781 0.962 0.033 2.062 2.350 Children ever born to women age 40-49 5.499 0.241 163 134 1.098 0.044 5.017 5.981 Knows any contraceptive method 0.955 0.010 572 458 1.147 0.010 0.935 0.975 Knows a modern method 0.955 0.010 572 458 1.147 0.010 0.935 0.975 Ever used any contraceptive method 0.658 0.025 572 458 1.261 0.038 0.608 0.708 Currently using any method 0.438 0.028 572 458 1.345 0.064 0.382 0.494 Currently using a modern method 0.432 0.028 572 458 1.362 0.065 0.375 0.488 Currently using a traditional method 0.006 0.003 572 458 1.011 0.548 0.000 0.012 Currently using pill 0.014 0.005 572 458 1.106 0.388 0.003 0.025 Currently using IUD 0.006 0.003 572 458 0.937 0.497 0.000 0.012 Currently using condoms 0.000 0.000 572 458 na na 0.000 0.000 Currently use injectables 0.386 0.027 572 458 1.306 0.069 0.333 0.439 Currently using female sterilization 0.009 0.005 572 458 1.216 0.534 0.000 0.019 Currently using withdrawal 0.000 0.000 572 458 na na 0.000 0.000 Currently using periodic abstinence 0.006 0.003 572 458 1.011 0.548 0.000 0.012 Used public sector source 0.996 0.004 254 203 1.071 0.005 0.987 1.005 Want no more children 0.384 0.023 572 458 1.149 0.061 0.338 0.431 Want to delay birth at least 2 years 0.414 0.022 572 458 1.059 0.053 0.370 0.457 Ideal number of children 4.579 0.100 942 739 1.652 0.022 4.379 4.779 Mothers received medical assistance at delivery 0.406 0.044 569 453 1.853 0.109 0.318 0.495 Mothers protected against tetanus for last birth 0.894 0.018 400 322 1.148 0.020 0.858 0.929 Had diarrhea in the past 2 weeks 0.181 0.020 536 426 1.131 0.111 0.141 0.221 Treated with ORS packets 0.689 0.056 93 77 1.105 0.082 0.576 0.802 Sought medical treatment 0.637 0.056 93 77 1.033 0.088 0.525 0.749 Vaccination card seen 0.412 0.069 90 69 1.267 0.167 0.275 0.549 Received BCG vaccination 0.912 0.031 90 69 1.012 0.034 0.851 0.974 Received DPT vaccination (3 doses) 0.812 0.051 90 69 1.193 0.062 0.711 0.913 Received polio vaccination (3 doses) 0.714 0.059 90 69 1.194 0.082 0.596 0.831 Received measles vaccination 0.797 0.043 90 69 0.985 0.054 0.711 0.883 Received all vaccinations 0.619 0.058 90 69 1.102 0.094 0.502 0.735 Height-for-age (below -2SD) 0.647 0.028 483 373 1.208 0.044 0.590 0.704 Weight-for-height (below -2SD) 0.138 0.015 483 373 0.953 0.110 0.108 0.169 Weight-for-age (below -2SD) 0.474 0.023 483 373 0.932 0.048 0.428 0.519 Prevalence of anemia (children 6-59) 0.361 0.038 140 108 0.951 0.105 0.285 0.437 Prevalence of anemia (women 15-49) 0.254 0.028 311 241 1.132 0.111 0.198 0.311 BMI <18.5 0.314 0.018 912 719 1.155 0.057 0.279 0.350 Has heard of HIV/AIDS 0.485 0.027 989 781 1.674 0.055 0.432 0.538 Knows about condoms to prevent AIDS 0.366 0.022 989 781 1.448 0.061 0.321 0.410 Konws about limitimg partners to prevent AIDS 0.404 0.024 989 781 1.532 0.059 0.356 0.451 Comprehensive knowledge on HIV transmission 0.111 0.012 989 781 1.167 0.105 0.088 0.135 Total fertility rate (past 3 years) 4.393 0.285 na 2119 1.248 0.065 3.823 4.963 Neonatal mortality (past 0-9 years) 37.244 6.710 1270 1021 1.176 0.180 23.825 50.664 Post-neonatal mortality (past 0-9 years) 38.268 6.536 1270 1021 1.137 0.171 25.196 51.340 Infant mortality (past 0-9 years) 75.513 8.493 1271 1022 1.095 0.112 58.526 92.499 Child mortality (past 0-9 years) 20.849 5.352 1279 1030 1.269 0.257 10.144 31.553 Under-five mortality (past 0-9 years) 94.787 9.478 1282 1031 1.093 0.100 75.831 113.743 ––––––––––––––––––––––––––––––––––––––––––––––––––––––––––––––––––––––––––––––––––––––––––––––––––––––––––––––––––
MEN –––––––––––––––––––––––––––––––––––––––––––––––––––––––––––––––––––––––––––––––––––––––––––––––––––––––––––––––––– Urban residence 0.196 0.018 297 236 0.774 0.091 0.160 0.231 Literacy 0.817 0.023 297 236 1.023 0.028 0.771 0.863 No education 0.125 0.023 297 236 1.204 0.185 0.079 0.171 With secondary eductation or higher 0.600 0.031 297 236 1.090 0.052 0.538 0.662 Never married/in union 0.473 0.029 297 236 1.008 0.062 0.415 0.532 Currently married/in union 0.521 0.028 297 236 0.959 0.053 0.465 0.576 Knowing any contraceptive method 0.928 0.025 154 123 1.199 0.027 0.878 0.978 Ever used any contraceptive method 0.349 0.040 154 123 1.029 0.114 0.270 0.428 Currently using any method 0.016 0.009 154 123 0.922 0.591 0.000 0.034 Want no more children 0.448 0.050 154 123 1.229 0.111 0.349 0.547 Ideal number fo children 4.560 0.096 288 228 1.135 0.021 4.368 4.753 Has heard of HIV/AIDS 0.773 0.032 297 236 1.308 0.041 0.710 0.837 Knows about condoms to prevent AIDS 0.717 0.036 297 236 1.384 0.051 0.645 0.790 Konws about limitimg partners to prevent AIDS 0.722 0.037 297 236 1.403 0.051 0.648 0.795 Comprehensive knowledge on HIV transmission 0.058 0.015 297 236 1.109 0.260 0.028 0.088 –––––––––––––––––––––––––––––––––––––––––––––––––––––––––––––––––––––––––––––––––––––––––––––––––––––––––––––––––– na = Not applicable
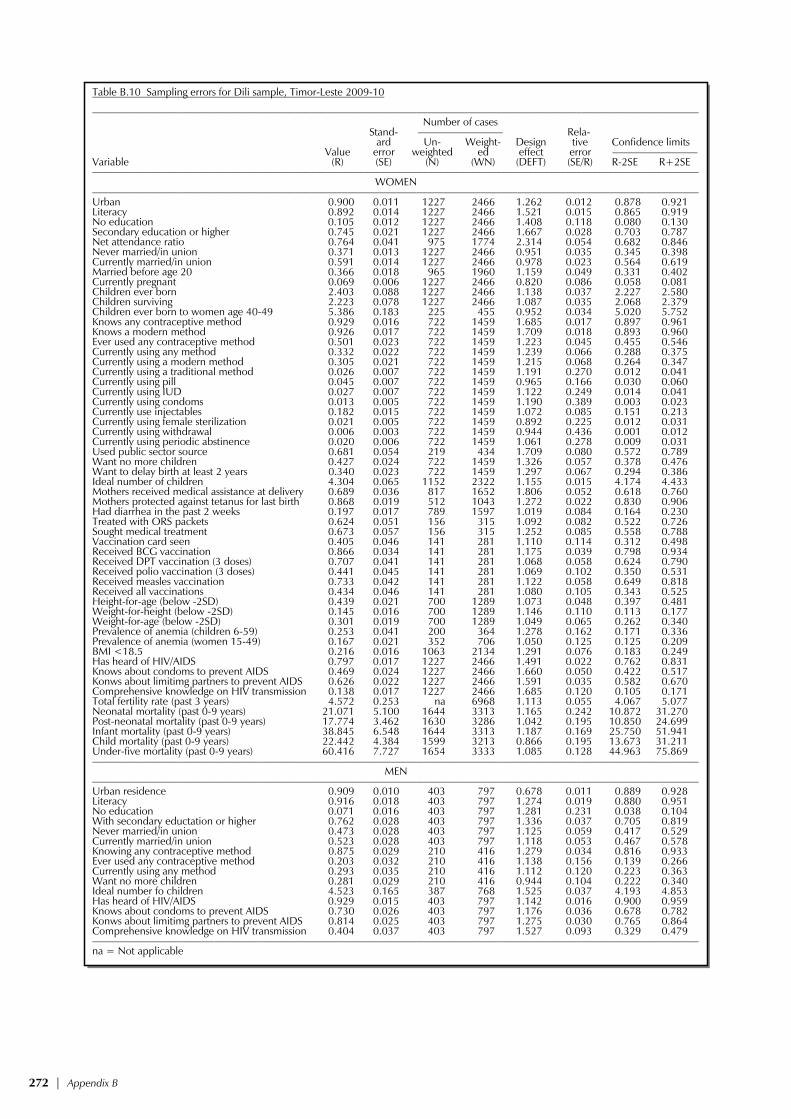
272 | Appendix B
Table B.10 Sampling errors for Dili sample, Timor-Leste 2009-10 –––––––––––––––––––––––––––––––––––––––––––––––––––––––––––––––––––––––––––––––––––––––––––––––––––––––––––––––––– Number of cases Stand- –––––––––––––––– Rela- ard Un- Weight- Design tive Confidence limits Value error weighted ed effect error –––––––––––––––– Variable (R) (SE) (N) (WN) (DEFT) (SE/R) R-2SE R+2SE ––––––––––––––––––––––––––––––––––––––––––––––––––––––––––––––––––––––––––––––––––––––––––––––––––––––––––––––––––
WOMEN –––––––––––––––––––––––––––––––––––––––––––––––––––––––––––––––––––––––––––––––––––––––––––––––––––––––––––––––––– Urban 0.900 0.011 1227 2466 1.262 0.012 0.878 0.921 Literacy 0.892 0.014 1227 2466 1.521 0.015 0.865 0.919 No education 0.105 0.012 1227 2466 1.408 0.118 0.080 0.130 Secondary education or higher 0.745 0.021 1227 2466 1.667 0.028 0.703 0.787 Net attendance ratio 0.764 0.041 975 1774 2.314 0.054 0.682 0.846 Never married/in union 0.371 0.013 1227 2466 0.951 0.035 0.345 0.398 Currently married/in union 0.591 0.014 1227 2466 0.978 0.023 0.564 0.619 Married before age 20 0.366 0.018 965 1960 1.159 0.049 0.331 0.402 Currently pregnant 0.069 0.006 1227 2466 0.820 0.086 0.058 0.081 Children ever born 2.403 0.088 1227 2466 1.138 0.037 2.227 2.580 Children surviving 2.223 0.078 1227 2466 1.087 0.035 2.068 2.379 Children ever born to women age 40-49 5.386 0.183 225 455 0.952 0.034 5.020 5.752 Knows any contraceptive method 0.929 0.016 722 1459 1.685 0.017 0.897 0.961 Knows a modern method 0.926 0.017 722 1459 1.709 0.018 0.893 0.960 Ever used any contraceptive method 0.501 0.023 722 1459 1.223 0.045 0.455 0.546 Currently using any method 0.332 0.022 722 1459 1.239 0.066 0.288 0.375 Currently using a modern method 0.305 0.021 722 1459 1.215 0.068 0.264 0.347 Currently using a traditional method 0.026 0.007 722 1459 1.191 0.270 0.012 0.041 Currently using pill 0.045 0.007 722 1459 0.965 0.166 0.030 0.060 Currently using IUD 0.027 0.007 722 1459 1.122 0.249 0.014 0.041 Currently using condoms 0.013 0.005 722 1459 1.190 0.389 0.003 0.023 Currently use injectables 0.182 0.015 722 1459 1.072 0.085 0.151 0.213 Currently using female sterilization 0.021 0.005 722 1459 0.892 0.225 0.012 0.031 Currently using withdrawal 0.006 0.003 722 1459 0.944 0.436 0.001 0.012 Currently using periodic abstinence 0.020 0.006 722 1459 1.061 0.278 0.009 0.031 Used public sector source 0.681 0.054 219 434 1.709 0.080 0.572 0.789 Want no more children 0.427 0.024 722 1459 1.326 0.057 0.378 0.476 Want to delay birth at least 2 years 0.340 0.023 722 1459 1.297 0.067 0.294 0.386 Ideal number of children 4.304 0.065 1152 2322 1.155 0.015 4.174 4.433 Mothers received medical assistance at delivery 0.689 0.036 817 1652 1.806 0.052 0.618 0.760 Mothers protected against tetanus for last birth 0.868 0.019 512 1043 1.272 0.022 0.830 0.906 Had diarrhea in the past 2 weeks 0.197 0.017 789 1597 1.019 0.084 0.164 0.230 Treated with ORS packets 0.624 0.051 156 315 1.092 0.082 0.522 0.726 Sought medical treatment 0.673 0.057 156 315 1.252 0.085 0.558 0.788 Vaccination card seen 0.405 0.046 141 281 1.110 0.114 0.312 0.498 Received BCG vaccination 0.866 0.034 141 281 1.175 0.039 0.798 0.934 Received DPT vaccination (3 doses) 0.707 0.041 141 281 1.068 0.058 0.624 0.790 Received polio vaccination (3 doses) 0.441 0.045 141 281 1.069 0.102 0.350 0.531 Received measles vaccination 0.733 0.042 141 281 1.122 0.058 0.649 0.818 Received all vaccinations 0.434 0.046 141 281 1.080 0.105 0.343 0.525 Height-for-age (below -2SD) 0.439 0.021 700 1289 1.073 0.048 0.397 0.481 Weight-for-height (below -2SD) 0.145 0.016 700 1289 1.146 0.110 0.113 0.177 Weight-for-age (below -2SD) 0.301 0.019 700 1289 1.049 0.065 0.262 0.340 Prevalence of anemia (children 6-59) 0.253 0.041 200 364 1.278 0.162 0.171 0.336 Prevalence of anemia (women 15-49) 0.167 0.021 352 706 1.050 0.125 0.125 0.209 BMI <18.5 0.216 0.016 1063 2134 1.291 0.076 0.183 0.249 Has heard of HIV/AIDS 0.797 0.017 1227 2466 1.491 0.022 0.762 0.831 Knows about condoms to prevent AIDS 0.469 0.024 1227 2466 1.660 0.050 0.422 0.517 Konws about limitimg partners to prevent AIDS 0.626 0.022 1227 2466 1.591 0.035 0.582 0.670 Comprehensive knowledge on HIV transmission 0.138 0.017 1227 2466 1.685 0.120 0.105 0.171 Total fertility rate (past 3 years) 4.572 0.253 na 6968 1.113 0.055 4.067 5.077 Neonatal mortality (past 0-9 years) 21.071 5.100 1644 3313 1.165 0.242 10.872 31.270 Post-neonatal mortality (past 0-9 years) 17.774 3.462 1630 3286 1.042 0.195 10.850 24.699 Infant mortality (past 0-9 years) 38.845 6.548 1644 3313 1.187 0.169 25.750 51.941 Child mortality (past 0-9 years) 22.442 4.384 1599 3213 0.866 0.195 13.673 31.211 Under-five mortality (past 0-9 years) 60.416 7.727 1654 3333 1.085 0.128 44.963 75.869 ––––––––––––––––––––––––––––––––––––––––––––––––––––––––––––––––––––––––––––––––––––––––––––––––––––––––––––––––––
MEN –––––––––––––––––––––––––––––––––––––––––––––––––––––––––––––––––––––––––––––––––––––––––––––––––––––––––––––––––– Urban residence 0.909 0.010 403 797 0.678 0.011 0.889 0.928 Literacy 0.916 0.018 403 797 1.274 0.019 0.880 0.951 No education 0.071 0.016 403 797 1.281 0.231 0.038 0.104 With secondary eductation or higher 0.762 0.028 403 797 1.336 0.037 0.705 0.819 Never married/in union 0.473 0.028 403 797 1.125 0.059 0.417 0.529 Currently married/in union 0.523 0.028 403 797 1.118 0.053 0.467 0.578 Knowing any contraceptive method 0.875 0.029 210 416 1.279 0.034 0.816 0.933 Ever used any contraceptive method 0.203 0.032 210 416 1.138 0.156 0.139 0.266 Currently using any method 0.293 0.035 210 416 1.112 0.120 0.223 0.363 Want no more children 0.281 0.029 210 416 0.944 0.104 0.222 0.340 Ideal number fo children 4.523 0.165 387 768 1.525 0.037 4.193 4.853 Has heard of HIV/AIDS 0.929 0.015 403 797 1.142 0.016 0.900 0.959 Knows about condoms to prevent AIDS 0.730 0.026 403 797 1.176 0.036 0.678 0.782 Konws about limitimg partners to prevent AIDS 0.814 0.025 403 797 1.275 0.030 0.765 0.864 Comprehensive knowledge on HIV transmission 0.404 0.037 403 797 1.527 0.093 0.329 0.479 –––––––––––––––––––––––––––––––––––––––––––––––––––––––––––––––––––––––––––––––––––––––––––––––––––––––––––––––––– na = Not applicable

Appendix B | 273
Table B.11 Sampling errors for Ermera sample, Timor-Leste 2009-10 –––––––––––––––––––––––––––––––––––––––––––––––––––––––––––––––––––––––––––––––––––––––––––––––––––––––––––––––––– Number of cases Stand- –––––––––––––––– Rela- ard Un- Weight- Design tive Confidence limits Value error weighted ed effect error –––––––––––––––– Variable (R) (SE) (N) (WN) (DEFT) (SE/R) R-2SE R+2SE ––––––––––––––––––––––––––––––––––––––––––––––––––––––––––––––––––––––––––––––––––––––––––––––––––––––––––––––––––
WOMEN –––––––––––––––––––––––––––––––––––––––––––––––––––––––––––––––––––––––––––––––––––––––––––––––––––––––––––––––––– Urban 0.058 0.006 1082 1542 0.831 0.102 0.046 0.070 Literacy 0.472 0.028 1082 1542 1.863 0.060 0.415 0.529 No education 0.493 0.026 1082 1542 1.709 0.053 0.441 0.545 Secondary education or higher 0.295 0.024 1082 1542 1.713 0.081 0.248 0.343 Net attendance ratio 0.645 0.031 1103 1582 1.788 0.048 0.583 0.707 Never married/in union 0.383 0.014 1082 1542 0.964 0.037 0.354 0.411 Currently married/in union 0.571 0.016 1082 1542 1.030 0.027 0.540 0.602 Married before age 20 0.399 0.020 807 1144 1.137 0.049 0.360 0.438 Currently pregnant 0.068 0.008 1082 1542 1.062 0.120 0.052 0.084 Children ever born 2.983 0.098 1082 1542 0.954 0.033 2.787 3.179 Children surviving 2.572 0.081 1082 1542 0.925 0.032 2.410 2.734 Children ever born to women age 40-49 6.943 0.237 201 290 1.077 0.034 6.469 7.416 Knows any contraceptive method 0.721 0.021 621 881 1.181 0.029 0.679 0.764 Knows a modern method 0.713 0.022 621 881 1.222 0.031 0.668 0.757 Ever used any contraceptive method 0.217 0.022 621 881 1.332 0.102 0.173 0.261 Currently using any method 0.188 0.021 621 881 1.337 0.112 0.146 0.230 Currently using a modern method 0.153 0.022 621 881 1.528 0.145 0.108 0.197 Currently using a traditional method 0.035 0.009 621 881 1.274 0.269 0.016 0.054 Currently using pill 0.004 0.002 621 881 0.965 0.600 0.000 0.009 Currently using IUD 0.006 0.003 621 881 0.964 0.502 0.000 0.012 Currently using condoms 0.000 0.000 621 881 na na 0.000 0.000 Currently use injectables 0.139 0.021 621 881 1.528 0.153 0.096 0.181 Currently using female sterilization 0.000 0.000 621 881 na na 0.000 0.000 Currently using withdrawal 0.018 0.007 621 881 1.335 0.402 0.003 0.032 Currently using periodic abstinence 0.000 0.000 621 881 na na 0.000 0.000 Used public sector source 0.841 0.079 91 135 2.026 0.094 0.683 1.000 Want no more children 0.314 0.021 621 881 1.130 0.067 0.272 0.356 Want to delay birth at least 2 years 0.487 0.027 621 881 1.335 0.055 0.434 0.541 Ideal number of children 5.753 0.084 1074 1534 1.196 0.015 5.585 5.920 Mothers received medical assistance at delivery 0.121 0.025 891 1252 1.751 0.209 0.071 0.172 Mothers protected against tetanus for last birth 0.655 0.040 508 719 1.865 0.060 0.576 0.734 Had diarrhea in the past 2 weeks 0.128 0.024 837 1172 1.754 0.190 0.079 0.177 Treated with ORS packets 0.722 0.073 113 150 1.480 0.101 0.576 0.869 Sought medical treatment 0.775 0.078 113 150 1.640 0.101 0.619 0.931 Vaccination card seen 0.452 0.068 149 200 1.611 0.151 0.315 0.588 Received BCG vaccination 0.646 0.056 149 200 1.365 0.086 0.535 0.758 Received DPT vaccination (3 doses) 0.515 0.065 149 200 1.519 0.125 0.386 0.645 Received polio vaccination (3 doses) 0.503 0.068 149 200 1.605 0.136 0.366 0.639 Received measles vaccination 0.542 0.067 149 200 1.568 0.123 0.409 0.675 Received all vaccinations 0.446 0.069 149 200 1.641 0.155 0.307 0.585 Height-for-age (below -2SD) 0.685 0.021 740 1077 1.203 0.031 0.642 0.728 Weight-for-height (below -2SD) 0.207 0.023 740 1077 1.435 0.109 0.162 0.252 Weight-for-age (below -2SD) 0.580 0.023 740 1077 1.237 0.039 0.535 0.625 Prevalence of anemia (children 6-59) 0.154 0.024 216 322 1.013 0.159 0.105 0.202 Prevalence of anemia (women 15-49) 0.214 0.023 340 494 1.046 0.108 0.168 0.260 BMI <18.5 0.313 0.019 960 1384 1.274 0.061 0.275 0.351 Has heard of HIV/AIDS 0.138 0.017 1082 1542 1.661 0.127 0.103 0.172 Knows about condoms to prevent AIDS 0.135 0.016 1082 1542 1.570 0.121 0.102 0.168 Konws about limitimg partners to prevent AIDS 0.137 0.017 1082 1542 1.662 0.127 0.102 0.172 Comprehensive knowledge on HIV transmission 0.052 0.008 1082 1542 1.212 0.158 0.036 0.068 Total fertility rate (past 3 years) 6.575 0.319 na 4218 1.383 0.049 5.936 7.214 Neonatal mortality (past 0-9 years) 23.277 3.970 1730 2427 1.005 0.171 15.336 31.218 Post-neonatal mortality (past 0-9 years) 47.167 5.827 1735 2435 1.098 0.124 35.513 58.821 Infant mortality (past 0-9 years) 70.444 6.814 1736 2436 1.058 0.097 56.817 84.071 Child mortality (past 0-9 years) 33.541 4.412 1733 2429 0.936 0.132 24.716 42.366 Under-five mortality (past 0-9 years) 101.622 8.613 1750 2457 1.091 0.085 84.397 118.847 ––––––––––––––––––––––––––––––––––––––––––––––––––––––––––––––––––––––––––––––––––––––––––––––––––––––––––––––––––
MEN –––––––––––––––––––––––––––––––––––––––––––––––––––––––––––––––––––––––––––––––––––––––––––––––––––––––––––––––––– Urban residence 0.054 0.007 355 491 0.622 0.138 0.039 0.069 Literacy 0.599 0.036 355 491 1.397 0.061 0.526 0.672 No education 0.371 0.035 355 491 1.376 0.095 0.301 0.442 With secondary eductation or higher 0.350 0.032 355 491 1.265 0.092 0.286 0.415 Never married/in union 0.509 0.024 355 491 0.915 0.048 0.460 0.557 Currently married/in union 0.475 0.024 355 491 0.919 0.051 0.426 0.524 Knowing any contraceptive method 0.175 0.029 167 233 0.994 0.167 0.116 0.234 Ever used any contraceptive method 0.000 0.000 167 233 na na 0.000 0.000 Currently using any method 0.006 0.006 167 233 1.029 0.997 0.000 0.019 Want no more children 0.100 0.023 167 233 0.980 0.228 0.055 0.146 Ideal number fo children 4.335 0.097 351 488 0.993 0.022 4.141 4.529 Has heard of HIV/AIDS 0.208 0.027 355 491 1.268 0.132 0.153 0.262 Knows about condoms to prevent AIDS 0.206 0.028 355 491 1.277 0.133 0.151 0.261 Konws about limitimg partners to prevent AIDS 0.200 0.028 355 491 1.309 0.139 0.144 0.256 Comprehensive knowledge on HIV transmission 0.019 0.007 355 491 0.986 0.381 0.004 0.033 –––––––––––––––––––––––––––––––––––––––––––––––––––––––––––––––––––––––––––––––––––––––––––––––––––––––––––––––––– na = Not applicable

274 | Appendix B
Table B.12 Sampling errors for Lautem sample, Timor-Leste 2009-10 –––––––––––––––––––––––––––––––––––––––––––––––––––––––––––––––––––––––––––––––––––––––––––––––––––––––––––––––––– Number of cases Stand- –––––––––––––––– Rela- ard Un- Weight- Design tive Confidence limits Value error weighted ed effect error –––––––––––––––– Variable (R) (SE) (N) (WN) (DEFT) (SE/R) R-2SE R+2SE ––––––––––––––––––––––––––––––––––––––––––––––––––––––––––––––––––––––––––––––––––––––––––––––––––––––––––––––––––
WOMEN –––––––––––––––––––––––––––––––––––––––––––––––––––––––––––––––––––––––––––––––––––––––––––––––––––––––––––––––––– Urban 0.232 0.015 1023 864 1.164 0.066 0.201 0.262 Literacy 0.781 0.020 1023 864 1.571 0.026 0.741 0.822 No education 0.202 0.021 1023 864 1.633 0.102 0.161 0.243 Secondary education or higher 0.534 0.023 1023 864 1.487 0.043 0.487 0.580 Net attendance ratio 0.893 0.014 1025 904 1.439 0.015 0.866 0.921 Never married/in union 0.320 0.018 1023 864 1.205 0.055 0.285 0.355 Currently married/in union 0.626 0.017 1023 864 1.117 0.027 0.592 0.660 Married before age 20 0.457 0.022 762 653 1.245 0.049 0.412 0.502 Currently pregnant 0.086 0.010 1023 864 1.122 0.114 0.067 0.106 Children ever born 3.105 0.097 1023 864 0.986 0.031 2.910 3.300 Children surviving 2.723 0.097 1023 864 1.130 0.036 2.529 2.917 Children ever born to women age 40-49 6.503 0.287 178 153 1.253 0.044 5.928 7.077 Knows any contraceptive method 0.880 0.017 629 541 1.325 0.020 0.845 0.914 Knows a modern method 0.876 0.019 629 541 1.416 0.021 0.839 0.913 Ever used any contraceptive method 0.269 0.023 629 541 1.279 0.084 0.223 0.314 Currently using any method 0.177 0.020 629 541 1.306 0.112 0.137 0.217 Currently using a modern method 0.175 0.020 629 541 1.320 0.114 0.135 0.215 Currently using a traditional method 0.002 0.001 629 541 0.750 0.674 0.000 0.005 Currently using pill 0.016 0.005 629 541 0.962 0.297 0.007 0.026 Currently using IUD 0.019 0.008 629 541 1.504 0.430 0.003 0.036 Currently using condoms 0.000 0.000 629 541 na na 0.000 0.000 Currently use injectables 0.134 0.017 629 541 1.230 0.125 0.100 0.167 Currently using female sterilization 0.003 0.002 629 541 1.005 0.747 0.000 0.007 Currently using withdrawal 0.000 0.000 629 541 na na 0.000 0.000 Currently using periodic abstinence 0.002 0.001 629 541 0.750 0.674 0.000 0.005 Used public sector source 0.989 0.007 118 95 0.763 0.008 0.974 1.004 Want no more children 0.299 0.015 629 541 0.831 0.051 0.269 0.329 Want to delay birth at least 2 years 0.442 0.018 629 541 0.892 0.040 0.406 0.477 Ideal number of children 5.575 0.096 950 806 1.398 0.017 5.382 5.768 Mothers received medical assistance at delivery 0.259 0.030 860 758 1.632 0.117 0.199 0.320 Mothers protected against tetanus for last birth 0.805 0.026 512 444 1.479 0.032 0.754 0.857 Had diarrhea in the past 2 weeks 0.217 0.016 820 719 1.037 0.072 0.186 0.249 Treated with ORS packets 0.615 0.037 171 156 0.923 0.060 0.541 0.690 Sought medical treatment 0.610 0.040 171 156 1.021 0.066 0.530 0.690 Vaccination card seen 0.738 0.049 161 140 1.381 0.066 0.641 0.836 Received BCG vaccination 0.868 0.036 161 140 1.283 0.041 0.796 0.939 Received DPT vaccination (3 doses) 0.809 0.041 161 140 1.294 0.051 0.727 0.892 Received polio vaccination (3 doses) 0.754 0.048 161 140 1.388 0.064 0.658 0.850 Received measles vaccination 0.801 0.044 161 140 1.374 0.055 0.713 0.890 Received all vaccinations 0.746 0.049 161 140 1.399 0.065 0.648 0.844 Height-for-age (below -2SD) 0.510 0.022 802 714 1.197 0.044 0.465 0.554 Weight-for-height (below -2SD) 0.096 0.013 802 714 1.150 0.131 0.071 0.121 Weight-for-age (below -2SD) 0.321 0.020 802 714 1.121 0.061 0.282 0.360 Prevalence of anemia (children 6-59) 0.463 0.033 277 247 1.091 0.071 0.397 0.529 Prevalence of anemia (women 15-49) 0.255 0.026 343 289 1.123 0.104 0.202 0.308 BMI <18.5 0.278 0.018 885 746 1.193 0.065 0.242 0.314 Has heard of HIV/AIDS 0.363 0.022 1023 864 1.463 0.061 0.319 0.407 Knows about condoms to prevent AIDS 0.265 0.024 1023 864 1.752 0.091 0.216 0.313 Konws about limitimg partners to prevent AIDS 0.303 0.021 1023 864 1.436 0.068 0.261 0.344 Comprehensive knowledge on HIV transmission 0.111 0.018 1023 864 1.796 0.159 0.075 0.146 Total fertility rate (past 3 years) 6.712 0.261 na 2342 1.241 0.039 6.190 7.234 Neonatal mortality (past 0-9 years) 36.086 3.698 1754 1531 0.726 0.102 28.689 43.483 Post-neonatal mortality (past 0-9 years) 33.138 5.261 1756 1531 1.163 0.159 22.616 43.659 Infant mortality (past 0-9 years) 69.224 6.255 1755 1532 0.904 0.090 56.714 81.734 Child mortality (past 0-9 years) 31.398 7.162 1705 1487 1.581 0.228 17.073 45.723 Under-five mortality (past 0-9 years) 98.448 10.174 1762 1539 1.186 0.103 78.099 118.797 ––––––––––––––––––––––––––––––––––––––––––––––––––––––––––––––––––––––––––––––––––––––––––––––––––––––––––––––––––
MEN –––––––––––––––––––––––––––––––––––––––––––––––––––––––––––––––––––––––––––––––––––––––––––––––––––––––––––––––––– Urban residence 0.233 0.026 366 308 1.181 0.112 0.181 0.285 Literacy 0.885 0.017 366 308 1.018 0.019 0.851 0.919 No education 0.110 0.017 366 308 1.015 0.151 0.076 0.143 With secondary eductation or higher 0.708 0.032 366 308 1.355 0.046 0.644 0.773 Never married/in union 0.456 0.034 366 308 1.288 0.074 0.389 0.523 Currently married/in union 0.531 0.034 366 308 1.313 0.065 0.462 0.599 Knowing any contraceptive method 0.871 0.022 194 163 0.911 0.025 0.827 0.915 Ever used any contraceptive method 0.057 0.017 194 163 1.027 0.301 0.023 0.091 Currently using any method 0.124 0.027 194 163 1.120 0.215 0.070 0.177 Want no more children 0.073 0.023 194 163 1.211 0.312 0.027 0.118 Ideal number fo children 6.336 0.173 366 308 1.336 0.027 5.989 6.683 Has heard of HIV/AIDS 0.580 0.039 366 308 1.521 0.068 0.502 0.659 Knows about condoms to prevent AIDS 0.516 0.040 366 308 1.516 0.077 0.437 0.596 Konws about limitimg partners to prevent AIDS 0.559 0.041 366 308 1.557 0.073 0.478 0.640 Comprehensive knowledge on HIV transmission 0.189 0.029 366 308 1.423 0.155 0.130 0.247 –––––––––––––––––––––––––––––––––––––––––––––––––––––––––––––––––––––––––––––––––––––––––––––––––––––––––––––––––– na = Not applicable

Appendix B | 275
Table B.13 Sampling errors for Liquiçá sample, Timor-Leste 2009-10 –––––––––––––––––––––––––––––––––––––––––––––––––––––––––––––––––––––––––––––––––––––––––––––––––––––––––––––––––– Number of cases Stand- –––––––––––––––– Rela- ard Un- Weight- Design tive Confidence limits Value error weighted ed effect error –––––––––––––––– Variable (R) (SE) (N) (WN) (DEFT) (SE/R) R-2SE R+2SE ––––––––––––––––––––––––––––––––––––––––––––––––––––––––––––––––––––––––––––––––––––––––––––––––––––––––––––––––––
WOMEN –––––––––––––––––––––––––––––––––––––––––––––––––––––––––––––––––––––––––––––––––––––––––––––––––––––––––––––––––– Urban 0.110 0.016 1069 801 1.635 0.142 0.079 0.142 Literacy 0.628 0.027 1069 801 1.851 0.044 0.573 0.683 No education 0.335 0.024 1069 801 1.647 0.071 0.287 0.383 Secondary education or higher 0.395 0.029 1069 801 1.919 0.073 0.337 0.452 Net attendance ratio 0.743 0.031 962 710 1.936 0.042 0.680 0.805 Never married/in union 0.383 0.014 1069 801 0.935 0.036 0.355 0.410 Currently married/in union 0.574 0.015 1069 801 0.970 0.026 0.545 0.604 Married before age 20 0.409 0.018 815 611 1.019 0.043 0.374 0.444 Currently pregnant 0.070 0.006 1069 801 0.816 0.091 0.058 0.083 Children ever born 2.816 0.111 1069 801 1.115 0.039 2.594 3.037 Children surviving 2.465 0.089 1069 801 1.031 0.036 2.286 2.643 Children ever born to women age 40-49 6.499 0.273 211 158 1.253 0.042 5.953 7.045 Knows any contraceptive method 0.762 0.022 614 460 1.252 0.028 0.719 0.805 Knows a modern method 0.756 0.023 614 460 1.299 0.030 0.711 0.801 Ever used any contraceptive method 0.354 0.030 614 460 1.538 0.084 0.294 0.413 Currently using any method 0.245 0.024 614 460 1.383 0.098 0.197 0.293 Currently using a modern method 0.238 0.023 614 460 1.343 0.097 0.192 0.285 Currently using a traditional method 0.007 0.003 614 460 0.952 0.471 0.000 0.013 Currently using pill 0.028 0.007 614 460 1.096 0.261 0.013 0.043 Currently using IUD 0.016 0.005 614 460 1.071 0.340 0.005 0.027 Currently using condoms 0.000 0.000 614 460 na na 0.000 0.000 Currently use injectables 0.169 0.020 614 460 1.305 0.117 0.129 0.209 Currently using female sterilization 0.011 0.004 614 460 0.905 0.344 0.003 0.019 Currently using withdrawal 0.000 0.000 614 460 na na 0.000 0.000 Currently using periodic abstinence 0.000 0.000 614 460 na na 0.000 0.000 Used public sector source 0.896 0.029 144 107 1.139 0.032 0.838 0.955 Want no more children 0.302 0.027 614 460 1.460 0.090 0.248 0.356 Want to delay birth at least 2 years 0.281 0.028 614 460 1.526 0.099 0.226 0.337 Ideal number of children 4.773 0.084 1005 755 1.373 0.018 4.605 4.941 Mothers received medical assistance at delivery 0.234 0.028 776 582 1.560 0.120 0.178 0.291 Mothers protected against tetanus for last birth 0.843 0.019 477 358 1.148 0.023 0.805 0.881 Had diarrhea in the past 2 weeks 0.253 0.023 733 550 1.264 0.090 0.208 0.298 Treated with ORS packets 0.636 0.036 185 139 0.888 0.056 0.565 0.708 Sought medical treatment 0.689 0.035 185 139 0.891 0.051 0.618 0.760 Vaccination card seen 0.522 0.059 141 106 1.395 0.112 0.405 0.640 Received BCG vaccination 0.856 0.031 141 106 1.040 0.036 0.795 0.918 Received DPT vaccination (3 doses) 0.594 0.048 141 106 1.167 0.081 0.497 0.690 Received polio vaccination (3 doses) 0.502 0.048 141 106 1.151 0.097 0.405 0.599 Received measles vaccination 0.663 0.053 141 106 1.332 0.080 0.557 0.769 Received all vaccinations 0.437 0.051 141 106 1.215 0.116 0.335 0.539 Height-for-age (below -2SD) 0.569 0.036 606 456 1.680 0.063 0.498 0.641 Weight-for-height (below -2SD) 0.151 0.018 606 456 1.182 0.117 0.116 0.187 Weight-for-age (below -2SD) 0.414 0.030 606 456 1.439 0.073 0.354 0.475 Prevalence of anemia (children 6-59) 0.405 0.040 186 142 1.066 0.098 0.325 0.485 Prevalence of anemia (women 15-49) 0.207 0.027 328 247 1.187 0.128 0.154 0.260 BMI <18.5 0.328 0.024 953 715 1.550 0.072 0.281 0.375 Has heard of HIV/AIDS 0.339 0.030 1069 801 2.050 0.088 0.280 0.399 Knows about condoms to prevent AIDS 0.256 0.027 1069 801 2.005 0.105 0.202 0.310 Konws about limitimg partners to prevent AIDS 0.287 0.026 1069 801 1.904 0.092 0.235 0.340 Comprehensive knowledge on HIV transmission 0.081 0.011 1069 801 1.327 0.136 0.059 0.104 Total fertility rate (past 3 years) 5.548 0.280 na 2223 1.014 0.050 4.989 6.108 Neonatal mortality (past 0-9 years) 31.051 4.727 1530 1147 0.999 0.152 21.596 40.506 Post-neonatal mortality (past 0-9 years) 36.721 5.977 1539 1154 1.175 0.163 24.766 48.676 Infant mortality (past 0-9 years) 67.772 6.753 1534 1150 0.985 0.100 54.265 81.279 Child mortality (past 0-9 years) 35.397 6.099 1536 1151 1.096 0.172 23.198 47.595 Under-five mortality (past 0-9 years) 100.770 9.739 1546 1159 1.150 0.097 81.291 120.248 ––––––––––––––––––––––––––––––––––––––––––––––––––––––––––––––––––––––––––––––––––––––––––––––––––––––––––––––––––
MEN –––––––––––––––––––––––––––––––––––––––––––––––––––––––––––––––––––––––––––––––––––––––––––––––––––––––––––––––––– Urban residence 0.119 0.011 315 252 0.578 0.089 0.098 0.140 Literacy 0.759 0.036 315 252 1.501 0.048 0.687 0.832 No education 0.175 0.030 315 252 1.407 0.172 0.115 0.236 With secondary eductation or higher 0.515 0.042 315 252 1.500 0.082 0.430 0.600 Never married/in union 0.486 0.028 315 252 0.985 0.057 0.431 0.542 Currently married/in union 0.494 0.025 315 252 0.888 0.051 0.444 0.544 Knowing any contraceptive method 0.750 0.046 157 124 1.331 0.062 0.658 0.842 Ever used any contraceptive method 0.080 0.023 157 124 1.068 0.290 0.034 0.127 Currently using any method 0.185 0.031 157 124 1.000 0.168 0.123 0.247 Want no more children 0.231 0.038 157 124 1.133 0.165 0.155 0.308 Ideal number fo children 5.214 0.146 286 226 1.193 0.028 4.922 5.505 Has heard of HIV/AIDS 0.529 0.063 315 252 2.233 0.120 0.402 0.656 Knows about condoms to prevent AIDS 0.441 0.065 315 252 2.293 0.147 0.311 0.570 Konws about limitimg partners to prevent AIDS 0.476 0.062 315 252 2.186 0.130 0.352 0.600 Comprehensive knowledge on HIV transmission 0.220 0.061 315 252 2.596 0.279 0.097 0.342 –––––––––––––––––––––––––––––––––––––––––––––––––––––––––––––––––––––––––––––––––––––––––––––––––––––––––––––––––– na = Not applicable
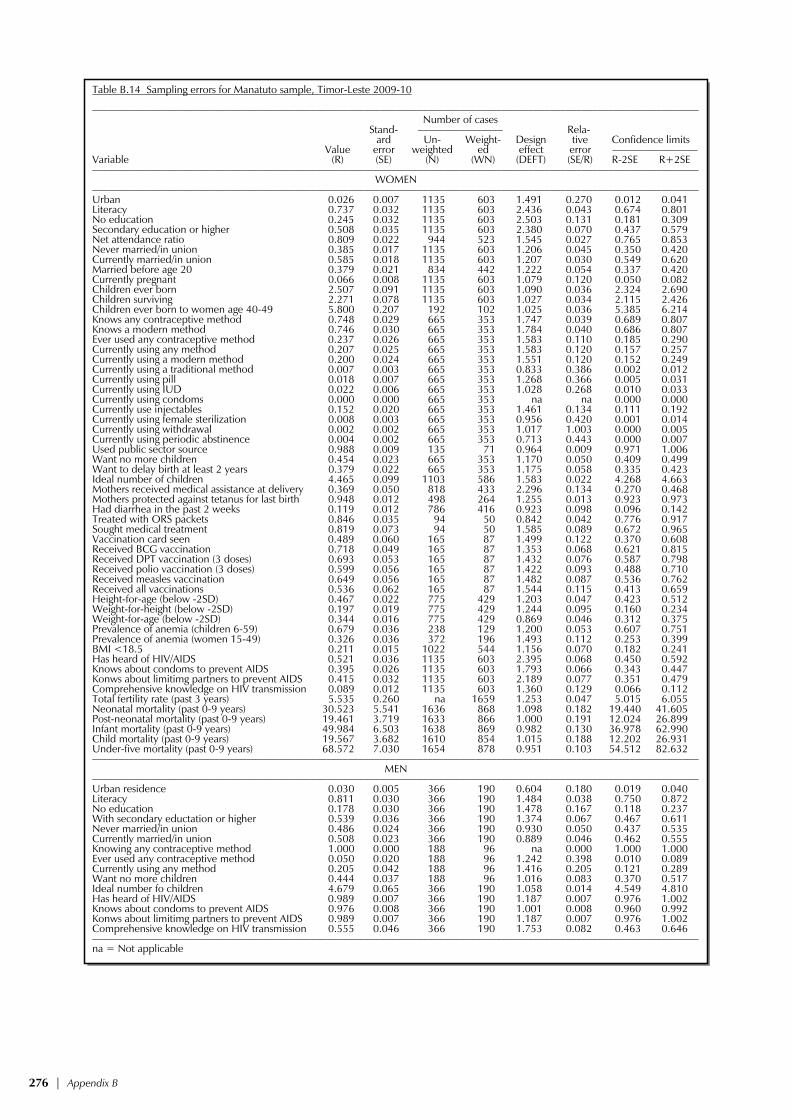
276 | Appendix B
Table B.14 Sampling errors for Manatuto sample, Timor-Leste 2009-10 –––––––––––––––––––––––––––––––––––––––––––––––––––––––––––––––––––––––––––––––––––––––––––––––––––––––––––––––––– Number of cases Stand- –––––––––––––––– Rela- ard Un- Weight- Design tive Confidence limits Value error weighted ed effect error –––––––––––––––– Variable (R) (SE) (N) (WN) (DEFT) (SE/R) R-2SE R+2SE ––––––––––––––––––––––––––––––––––––––––––––––––––––––––––––––––––––––––––––––––––––––––––––––––––––––––––––––––––
WOMEN –––––––––––––––––––––––––––––––––––––––––––––––––––––––––––––––––––––––––––––––––––––––––––––––––––––––––––––––––– Urban 0.026 0.007 1135 603 1.491 0.270 0.012 0.041 Literacy 0.737 0.032 1135 603 2.436 0.043 0.674 0.801 No education 0.245 0.032 1135 603 2.503 0.131 0.181 0.309 Secondary education or higher 0.508 0.035 1135 603 2.380 0.070 0.437 0.579 Net attendance ratio 0.809 0.022 944 523 1.545 0.027 0.765 0.853 Never married/in union 0.385 0.017 1135 603 1.206 0.045 0.350 0.420 Currently married/in union 0.585 0.018 1135 603 1.207 0.030 0.549 0.620 Married before age 20 0.379 0.021 834 442 1.222 0.054 0.337 0.420 Currently pregnant 0.066 0.008 1135 603 1.079 0.120 0.050 0.082 Children ever born 2.507 0.091 1135 603 1.090 0.036 2.324 2.690 Children surviving 2.271 0.078 1135 603 1.027 0.034 2.115 2.426 Children ever born to women age 40-49 5.800 0.207 192 102 1.025 0.036 5.385 6.214 Knows any contraceptive method 0.748 0.029 665 353 1.747 0.039 0.689 0.807 Knows a modern method 0.746 0.030 665 353 1.784 0.040 0.686 0.807 Ever used any contraceptive method 0.237 0.026 665 353 1.583 0.110 0.185 0.290 Currently using any method 0.207 0.025 665 353 1.583 0.120 0.157 0.257 Currently using a modern method 0.200 0.024 665 353 1.551 0.120 0.152 0.249 Currently using a traditional method 0.007 0.003 665 353 0.833 0.386 0.002 0.012 Currently using pill 0.018 0.007 665 353 1.268 0.366 0.005 0.031 Currently using IUD 0.022 0.006 665 353 1.028 0.268 0.010 0.033 Currently using condoms 0.000 0.000 665 353 na na 0.000 0.000 Currently use injectables 0.152 0.020 665 353 1.461 0.134 0.111 0.192 Currently using female sterilization 0.008 0.003 665 353 0.956 0.420 0.001 0.014 Currently using withdrawal 0.002 0.002 665 353 1.017 1.003 0.000 0.005 Currently using periodic abstinence 0.004 0.002 665 353 0.713 0.443 0.000 0.007 Used public sector source 0.988 0.009 135 71 0.964 0.009 0.971 1.006 Want no more children 0.454 0.023 665 353 1.170 0.050 0.409 0.499 Want to delay birth at least 2 years 0.379 0.022 665 353 1.175 0.058 0.335 0.423 Ideal number of children 4.465 0.099 1103 586 1.583 0.022 4.268 4.663 Mothers received medical assistance at delivery 0.369 0.050 818 433 2.296 0.134 0.270 0.468 Mothers protected against tetanus for last birth 0.948 0.012 498 264 1.255 0.013 0.923 0.973 Had diarrhea in the past 2 weeks 0.119 0.012 786 416 0.923 0.098 0.096 0.142 Treated with ORS packets 0.846 0.035 94 50 0.842 0.042 0.776 0.917 Sought medical treatment 0.819 0.073 94 50 1.585 0.089 0.672 0.965 Vaccination card seen 0.489 0.060 165 87 1.499 0.122 0.370 0.608 Received BCG vaccination 0.718 0.049 165 87 1.353 0.068 0.621 0.815 Received DPT vaccination (3 doses) 0.693 0.053 165 87 1.432 0.076 0.587 0.798 Received polio vaccination (3 doses) 0.599 0.056 165 87 1.422 0.093 0.488 0.710 Received measles vaccination 0.649 0.056 165 87 1.482 0.087 0.536 0.762 Received all vaccinations 0.536 0.062 165 87 1.544 0.115 0.413 0.659 Height-for-age (below -2SD) 0.467 0.022 775 429 1.203 0.047 0.423 0.512 Weight-for-height (below -2SD) 0.197 0.019 775 429 1.244 0.095 0.160 0.234 Weight-for-age (below -2SD) 0.344 0.016 775 429 0.869 0.046 0.312 0.375 Prevalence of anemia (children 6-59) 0.679 0.036 238 129 1.200 0.053 0.607 0.751 Prevalence of anemia (women 15-49) 0.326 0.036 372 196 1.493 0.112 0.253 0.399 BMI <18.5 0.211 0.015 1022 544 1.156 0.070 0.182 0.241 Has heard of HIV/AIDS 0.521 0.036 1135 603 2.395 0.068 0.450 0.592 Knows about condoms to prevent AIDS 0.395 0.026 1135 603 1.793 0.066 0.343 0.447 Konws about limitimg partners to prevent AIDS 0.415 0.032 1135 603 2.189 0.077 0.351 0.479 Comprehensive knowledge on HIV transmission 0.089 0.012 1135 603 1.360 0.129 0.066 0.112 Total fertility rate (past 3 years) 5.535 0.260 na 1659 1.253 0.047 5.015 6.055 Neonatal mortality (past 0-9 years) 30.523 5.541 1636 868 1.098 0.182 19.440 41.605 Post-neonatal mortality (past 0-9 years) 19.461 3.719 1633 866 1.000 0.191 12.024 26.899 Infant mortality (past 0-9 years) 49.984 6.503 1638 869 0.982 0.130 36.978 62.990 Child mortality (past 0-9 years) 19.567 3.682 1610 854 1.015 0.188 12.202 26.931 Under-five mortality (past 0-9 years) 68.572 7.030 1654 878 0.951 0.103 54.512 82.632 ––––––––––––––––––––––––––––––––––––––––––––––––––––––––––––––––––––––––––––––––––––––––––––––––––––––––––––––––––
MEN –––––––––––––––––––––––––––––––––––––––––––––––––––––––––––––––––––––––––––––––––––––––––––––––––––––––––––––––––– Urban residence 0.030 0.005 366 190 0.604 0.180 0.019 0.040 Literacy 0.811 0.030 366 190 1.484 0.038 0.750 0.872 No education 0.178 0.030 366 190 1.478 0.167 0.118 0.237 With secondary eductation or higher 0.539 0.036 366 190 1.374 0.067 0.467 0.611 Never married/in union 0.486 0.024 366 190 0.930 0.050 0.437 0.535 Currently married/in union 0.508 0.023 366 190 0.889 0.046 0.462 0.555 Knowing any contraceptive method 1.000 0.000 188 96 na 0.000 1.000 1.000 Ever used any contraceptive method 0.050 0.020 188 96 1.242 0.398 0.010 0.089 Currently using any method 0.205 0.042 188 96 1.416 0.205 0.121 0.289 Want no more children 0.444 0.037 188 96 1.016 0.083 0.370 0.517 Ideal number fo children 4.679 0.065 366 190 1.058 0.014 4.549 4.810 Has heard of HIV/AIDS 0.989 0.007 366 190 1.187 0.007 0.976 1.002 Knows about condoms to prevent AIDS 0.976 0.008 366 190 1.001 0.008 0.960 0.992 Konws about limitimg partners to prevent AIDS 0.989 0.007 366 190 1.187 0.007 0.976 1.002 Comprehensive knowledge on HIV transmission 0.555 0.046 366 190 1.753 0.082 0.463 0.646 –––––––––––––––––––––––––––––––––––––––––––––––––––––––––––––––––––––––––––––––––––––––––––––––––––––––––––––––––– na = Not applicable

Appendix B | 277
Table B.15 Sampling errors for Manufahi sample, Timor-Leste 2009-10 –––––––––––––––––––––––––––––––––––––––––––––––––––––––––––––––––––––––––––––––––––––––––––––––––––––––––––––––––– Number of cases Stand- –––––––––––––––– Rela- ard Un- Weight- Design tive Confidence limits Value error weighted ed effect error –––––––––––––––– Variable (R) (SE) (N) (WN) (DEFT) (SE/R) R-2SE R+2SE ––––––––––––––––––––––––––––––––––––––––––––––––––––––––––––––––––––––––––––––––––––––––––––––––––––––––––––––––––
WOMEN –––––––––––––––––––––––––––––––––––––––––––––––––––––––––––––––––––––––––––––––––––––––––––––––––––––––––––––––––– Urban 0.240 0.014 791 470 0.924 0.059 0.212 0.268 Literacy 0.703 0.026 791 470 1.611 0.037 0.651 0.756 No education 0.272 0.024 791 470 1.545 0.090 0.223 0.321 Secondary education or higher 0.503 0.027 791 470 1.529 0.054 0.449 0.558 Net attendance ratio 0.838 0.023 785 469 1.693 0.028 0.792 0.885 Never married/in union 0.299 0.021 791 470 1.284 0.070 0.257 0.340 Currently married/in union 0.679 0.021 791 470 1.244 0.030 0.638 0.720 Married before age 20 0.421 0.021 629 374 1.052 0.049 0.380 0.463 Currently pregnant 0.088 0.011 791 470 1.063 0.122 0.066 0.109 Children ever born 2.753 0.108 791 470 1.069 0.039 2.537 2.969 Children surviving 2.434 0.094 791 470 1.058 0.039 2.245 2.623 Children ever born to women age 40-49 5.542 0.306 134 79 1.339 0.055 4.930 6.153 Knows any contraceptive method 0.786 0.023 537 319 1.304 0.029 0.739 0.832 Knows a modern method 0.778 0.023 537 319 1.279 0.030 0.732 0.824 Ever used any contraceptive method 0.354 0.030 537 319 1.457 0.085 0.294 0.414 Currently using any method 0.253 0.024 537 319 1.287 0.096 0.204 0.301 Currently using a modern method 0.242 0.025 537 319 1.361 0.104 0.192 0.293 Currently using a traditional method 0.010 0.003 537 319 0.708 0.297 0.004 0.017 Currently using pill 0.011 0.005 537 319 1.070 0.443 0.001 0.020 Currently using IUD 0.016 0.007 537 319 1.363 0.464 0.001 0.031 Currently using condoms 0.000 0.000 537 319 na na 0.000 0.000 Currently use injectables 0.191 0.019 537 319 1.112 0.099 0.153 0.229 Currently using female sterilization 0.002 0.002 537 319 0.992 1.009 0.000 0.005 Currently using withdrawal 0.010 0.003 537 319 0.708 0.297 0.004 0.017 Currently using periodic abstinence 0.000 0.000 537 319 na na 0.000 0.000 Used public sector source 0.992 0.008 125 76 0.972 0.008 0.977 1.008 Want no more children 0.294 0.018 537 319 0.922 0.062 0.258 0.330 Want to delay birth at least 2 years 0.362 0.022 537 319 1.070 0.061 0.317 0.406 Ideal number of children 4.883 0.099 760 450 1.285 0.020 4.685 5.081 Mothers received medical assistance at delivery 0.190 0.022 660 393 1.217 0.117 0.145 0.234 Mothers protected against tetanus for last birth 0.712 0.030 400 238 1.342 0.043 0.652 0.773 Had diarrhea in the past 2 weeks 0.084 0.010 619 369 0.908 0.121 0.063 0.104 Treated with ORS packets 0.590 0.075 51 31 1.086 0.127 0.440 0.740 Sought medical treatment 0.494 0.062 51 31 0.879 0.126 0.369 0.618 Vaccination card seen 0.391 0.053 134 80 1.258 0.136 0.285 0.497 Received BCG vaccination 0.692 0.050 134 80 1.253 0.072 0.592 0.792 Received DPT vaccination (3 doses) 0.532 0.055 134 80 1.275 0.103 0.422 0.642 Received polio vaccination (3 doses) 0.464 0.054 134 80 1.249 0.116 0.356 0.571 Received measles vaccination 0.684 0.049 134 80 1.220 0.072 0.586 0.782 Received all vaccinations 0.428 0.052 134 80 1.225 0.122 0.323 0.532 Height-for-age (below -2SD) 0.647 0.030 496 296 1.341 0.046 0.588 0.707 Weight-for-height (below -2SD) 0.149 0.015 496 296 0.846 0.098 0.120 0.178 Weight-for-age (below -2SD) 0.437 0.023 496 296 0.985 0.053 0.391 0.484 Prevalence of anemia (children 6-59) 0.377 0.051 130 78 1.147 0.136 0.274 0.480 Prevalence of anemia (women 15-49) 0.128 0.021 231 137 0.962 0.166 0.086 0.171 BMI <18.5 0.298 0.021 689 409 1.181 0.069 0.256 0.339 Has heard of HIV/AIDS 0.363 0.025 791 470 1.433 0.068 0.314 0.412 Knows about condoms to prevent AIDS 0.272 0.023 791 470 1.421 0.083 0.227 0.317 Konws about limitimg partners to prevent AIDS 0.319 0.023 791 470 1.361 0.071 0.274 0.364 Comprehensive knowledge on HIV transmission 0.165 0.019 791 470 1.463 0.117 0.126 0.203 Total fertility rate (past 3 years) 5.853 0.317 na 1316 1.265 0.054 5.219 6.487 Neonatal mortality (past 0-9 years) 43.888 6.169 1262 751 0.942 0.141 31.551 56.226 Post-neonatal mortality (past 0-9 years) 18.530 4.205 1268 755 1.150 0.227 10.120 26.940 Infant mortality (past 0-9 years) 62.418 7.843 1264 752 1.032 0.126 46.733 78.104 Child mortality (past 0-9 years) 25.376 4.894 1259 750 0.955 0.193 15.588 35.164 Under-five mortality (past 0-9 years) 86.211 10.009 1274 758 1.094 0.116 66.193 106.228 ––––––––––––––––––––––––––––––––––––––––––––––––––––––––––––––––––––––––––––––––––––––––––––––––––––––––––––––––––
MEN –––––––––––––––––––––––––––––––––––––––––––––––––––––––––––––––––––––––––––––––––––––––––––––––––––––––––––––––––– Urban residence 0.229 0.043 228 137 1.530 0.187 0.144 0.315 Literacy 0.753 0.023 228 137 0.816 0.031 0.707 0.800 No education 0.200 0.027 228 137 1.011 0.134 0.146 0.254 With secondary eductation or higher 0.578 0.028 228 137 0.857 0.049 0.522 0.635 Never married/in union 0.418 0.026 228 137 0.794 0.062 0.366 0.470 Currently married/in union 0.557 0.027 228 137 0.833 0.049 0.502 0.612 Knowing any contraceptive method 0.389 0.048 127 77 1.114 0.125 0.292 0.486 Ever used any contraceptive method 0.054 0.021 127 77 1.028 0.382 0.013 0.096 Currently using any method 0.084 0.025 127 77 0.998 0.294 0.035 0.133 Want no more children 0.153 0.031 127 77 0.978 0.205 0.090 0.216 Ideal number fo children 5.072 0.132 225 135 0.969 0.026 4.808 5.335 Has heard of HIV/AIDS 0.460 0.036 228 137 1.073 0.077 0.389 0.531 Knows about condoms to prevent AIDS 0.450 0.034 228 137 1.035 0.076 0.382 0.518 Konws about limitimg partners to prevent AIDS 0.446 0.034 228 137 1.045 0.077 0.377 0.515 Comprehensive knowledge on HIV transmission 0.424 0.034 228 137 1.052 0.081 0.355 0.493 –––––––––––––––––––––––––––––––––––––––––––––––––––––––––––––––––––––––––––––––––––––––––––––––––––––––––––––––––– na = Not applicable

278 | Appendix B
Table B.16 Sampling errors for Oecussi sample, Timor-Leste 2009-10 –––––––––––––––––––––––––––––––––––––––––––––––––––––––––––––––––––––––––––––––––––––––––––––––––––––––––––––––––– Number of cases Stand- –––––––––––––––– Rela- ard Un- Weight- Design tive Confidence limits Value error weighted ed effect error –––––––––––––––– Variable (R) (SE) (N) (WN) (DEFT) (SE/R) R-2SE R+2SE ––––––––––––––––––––––––––––––––––––––––––––––––––––––––––––––––––––––––––––––––––––––––––––––––––––––––––––––––––
WOMEN –––––––––––––––––––––––––––––––––––––––––––––––––––––––––––––––––––––––––––––––––––––––––––––––––––––––––––––––––– Urban 0.166 0.010 1000 884 0.848 0.060 0.146 0.186 Literacy 0.516 0.027 1000 884 1.675 0.051 0.463 0.569 No education 0.410 0.025 1000 884 1.613 0.061 0.360 0.460 Secondary education or higher 0.230 0.021 1000 884 1.571 0.091 0.188 0.272 Net attendance ratio 0.716 0.031 823 751 1.797 0.043 0.654 0.778 Never married/in union 0.269 0.018 1000 884 1.309 0.068 0.232 0.306 Currently married/in union 0.682 0.019 1000 884 1.305 0.028 0.644 0.721 Married before age 20 0.504 0.024 794 705 1.370 0.048 0.456 0.553 Currently pregnant 0.070 0.008 1000 884 1.028 0.118 0.054 0.087 Children ever born 3.071 0.103 1000 884 1.199 0.034 2.864 3.277 Children surviving 2.734 0.085 1000 884 1.114 0.031 2.564 2.904 Children ever born to women age 40-49 5.436 0.173 238 214 1.089 0.032 5.089 5.783 Knows any contraceptive method 0.951 0.017 675 603 1.993 0.017 0.918 0.984 Knows a modern method 0.949 0.017 675 603 2.015 0.018 0.915 0.983 Ever used any contraceptive method 0.402 0.025 675 603 1.313 0.062 0.352 0.452 Currently using any method 0.241 0.024 675 603 1.432 0.098 0.193 0.288 Currently using a modern method 0.234 0.023 675 603 1.420 0.099 0.187 0.280 Currently using a traditional method 0.007 0.003 675 603 0.930 0.432 0.001 0.013 Currently using pill 0.001 0.001 675 603 0.818 1.004 0.000 0.003 Currently using IUD 0.006 0.003 675 603 0.998 0.475 0.000 0.013 Currently using condoms 0.001 0.001 675 603 0.816 1.001 0.000 0.003 Currently use injectables 0.194 0.021 675 603 1.348 0.106 0.152 0.235 Currently using female sterilization 0.002 0.001 675 603 0.764 0.663 0.000 0.005 Currently using withdrawal 0.003 0.002 675 603 0.960 0.724 0.000 0.006 Currently using periodic abstinence 0.003 0.002 675 603 0.964 0.726 0.000 0.006 Used public sector source 0.936 0.023 155 138 1.159 0.024 0.890 0.982 Want no more children 0.477 0.021 675 603 1.072 0.043 0.436 0.519 Want to delay birth at least 2 years 0.374 0.021 675 603 1.134 0.057 0.331 0.416 Ideal number of children 4.543 0.099 964 855 1.542 0.022 4.346 4.741 Mothers received medical assistance at delivery 0.098 0.019 870 783 1.548 0.190 0.060 0.135 Mothers protected against tetanus for last birth 0.758 0.028 548 492 1.549 0.037 0.701 0.815 Had diarrhea in the past 2 weeks 0.167 0.018 816 734 1.266 0.105 0.132 0.203 Treated with ORS packets 0.730 0.050 140 123 1.255 0.068 0.631 0.829 Sought medical treatment 0.688 0.060 140 123 1.447 0.088 0.568 0.809 Vaccination card seen 0.642 0.048 161 143 1.260 0.075 0.546 0.738 Received BCG vaccination 0.859 0.029 161 143 1.040 0.033 0.801 0.916 Received DPT vaccination (3 doses) 0.741 0.058 161 143 1.666 0.078 0.625 0.857 Received polio vaccination (3 doses) 0.638 0.062 161 143 1.618 0.097 0.514 0.761 Received measles vaccination 0.748 0.055 161 143 1.582 0.073 0.639 0.857 Received all vaccinations 0.600 0.062 161 143 1.591 0.103 0.476 0.723 Height-for-age (below -2SD) 0.691 0.022 754 708 1.285 0.031 0.647 0.734 Weight-for-height (below -2SD) 0.269 0.020 754 708 1.177 0.075 0.228 0.309 Weight-for-age (below -2SD) 0.628 0.022 754 708 1.232 0.035 0.584 0.672 Prevalence of anemia (children 6-59) 0.445 0.033 229 218 1.077 0.073 0.380 0.510 Prevalence of anemia (women 15-49) 0.225 0.027 323 288 1.159 0.119 0.172 0.279 BMI <18.5 0.363 0.022 898 794 1.374 0.061 0.319 0.407 Has heard of HIV/AIDS 0.276 0.024 1000 884 1.725 0.088 0.227 0.325 Knows about condoms to prevent AIDS 0.236 0.022 1000 884 1.640 0.093 0.192 0.280 Konws about limitimg partners to prevent AIDS 0.247 0.023 1000 884 1.670 0.092 0.202 0.293 Comprehensive knowledge on HIV transmission 0.027 0.009 1000 884 1.731 0.330 0.009 0.045 Total fertility rate (past 3 years) 6.641 0.310 na 2493 1.094 0.047 6.020 7.261 Neonatal mortality (past 0-9 years) 24.971 4.980 1654 1487 1.112 0.199 15.012 34.930 Post-neonatal mortality (past 0-9 years) 41.493 4.887 1654 1485 0.906 0.118 31.719 51.266 Infant mortality (past 0-9 years) 66.464 5.174 1658 1489 0.754 0.078 56.115 76.813 Child mortality (past 0-9 years) 27.236 5.124 1617 1454 1.176 0.188 16.988 37.484 Under-five mortality (past 0-9 years) 91.889 7.196 1667 1497 0.858 0.078 77.498 106.281 ––––––––––––––––––––––––––––––––––––––––––––––––––––––––––––––––––––––––––––––––––––––––––––––––––––––––––––––––––
MEN –––––––––––––––––––––––––––––––––––––––––––––––––––––––––––––––––––––––––––––––––––––––––––––––––––––––––––––––––– Urban residence 0.151 0.021 271 235 0.972 0.140 0.109 0.193 Literacy 0.559 0.037 271 235 1.225 0.066 0.485 0.633 No education 0.291 0.025 271 235 0.912 0.087 0.241 0.341 With secondary eductation or higher 0.299 0.042 271 235 1.519 0.142 0.214 0.384 Never married/in union 0.297 0.034 271 235 1.218 0.114 0.229 0.364 Currently married/in union 0.703 0.034 271 235 1.218 0.048 0.636 0.771 Knowing any contraceptive method 0.912 0.036 188 165 1.714 0.039 0.841 0.983 Ever used any contraceptive method 0.167 0.034 188 165 1.257 0.206 0.098 0.235 Currently using any method 0.228 0.033 188 165 1.071 0.144 0.162 0.294 Want no more children 0.293 0.032 188 165 0.957 0.109 0.229 0.357 Ideal number fo children 4.683 0.108 270 235 1.024 0.023 4.468 4.899 Has heard of HIV/AIDS 0.510 0.039 271 235 1.275 0.076 0.432 0.587 Knows about condoms to prevent AIDS 0.428 0.041 271 235 1.352 0.095 0.346 0.509 Konws about limitimg partners to prevent AIDS 0.454 0.039 271 235 1.295 0.087 0.376 0.533 Comprehensive knowledge on HIV transmission 0.054 0.021 271 235 1.518 0.387 0.012 0.096 –––––––––––––––––––––––––––––––––––––––––––––––––––––––––––––––––––––––––––––––––––––––––––––––––––––––––––––––––– na = Not applicable

Appendix B | 279
Table B.17 Sampling errors for Viqueque sample, Timor-Leste 2009-10 –––––––––––––––––––––––––––––––––––––––––––––––––––––––––––––––––––––––––––––––––––––––––––––––––––––––––––––––––– Number of cases Stand- –––––––––––––––– Rela- ard Un- Weight- Design tive Confidence limits Value error weighted ed effect error –––––––––––––––– Variable (R) (SE) (N) (WN) (DEFT) (SE/R) R-2SE R+2SE ––––––––––––––––––––––––––––––––––––––––––––––––––––––––––––––––––––––––––––––––––––––––––––––––––––––––––––––––––
WOMEN –––––––––––––––––––––––––––––––––––––––––––––––––––––––––––––––––––––––––––––––––––––––––––––––––––––––––––––––––– Urban 0.065 0.009 875 882 1.058 0.135 0.048 0.083 Literacy 0.666 0.022 875 882 1.356 0.032 0.623 0.710 No education 0.321 0.020 875 882 1.282 0.063 0.280 0.361 Secondary education or higher 0.431 0.023 875 882 1.348 0.052 0.386 0.476 Net attendance ratio 0.815 0.012 882 909 0.865 0.015 0.791 0.840 Never married/in union 0.317 0.021 875 882 1.335 0.066 0.275 0.359 Currently married/in union 0.634 0.024 875 882 1.480 0.038 0.586 0.682 Married before age 20 0.408 0.026 678 685 1.370 0.063 0.356 0.460 Currently pregnant 0.077 0.012 875 882 1.314 0.154 0.053 0.101 Children ever born 2.843 0.116 875 882 1.177 0.041 2.612 3.074 Children surviving 2.535 0.099 875 882 1.148 0.039 2.336 2.733 Children ever born to women age 40-49 5.308 0.284 178 179 1.193 0.054 4.740 5.877 Knows any contraceptive method 0.618 0.035 552 559 1.706 0.057 0.547 0.689 Knows a modern method 0.618 0.035 552 559 1.706 0.057 0.547 0.689 Ever used any contraceptive method 0.165 0.022 552 559 1.411 0.135 0.121 0.210 Currently using any method 0.131 0.020 552 559 1.367 0.150 0.092 0.170 Currently using a modern method 0.127 0.019 552 559 1.374 0.154 0.088 0.166 Currently using a traditional method 0.004 0.003 552 559 0.949 0.641 0.000 0.009 Currently using pill 0.004 0.003 552 559 0.995 0.704 0.000 0.009 Currently using IUD 0.010 0.004 552 559 0.985 0.426 0.001 0.018 Currently using condoms 0.000 0.000 552 559 na na 0.000 0.000 Currently use injectables 0.103 0.019 552 559 1.435 0.181 0.065 0.140 Currently using female sterilization 0.000 0.000 552 559 na na 0.000 0.000 Currently using withdrawal 0.000 0.000 552 559 na na 0.000 0.000 Currently using periodic abstinence 0.004 0.003 552 559 0.949 0.641 0.000 0.009 Used public sector source 0.989 0.011 69 68 0.839 0.011 0.968 1.010 Want no more children 0.256 0.022 552 559 1.176 0.085 0.213 0.300 Want to delay birth at least 2 years 0.197 0.028 552 559 1.632 0.141 0.142 0.252 Ideal number of children 5.377 0.096 834 843 1.341 0.018 5.184 5.569 Mothers received medical assistance at delivery 0.252 0.033 662 678 1.653 0.129 0.187 0.317 Mothers protected against tetanus for last birth 0.774 0.036 403 412 1.751 0.047 0.701 0.847 Had diarrhea in the past 2 weeks 0.046 0.013 630 644 1.370 0.276 0.021 0.071 Treated with ORS packets 0.767 0.076 30 30 0.934 0.099 0.615 0.919 Sought medical treatment 0.860 0.067 30 30 0.865 0.078 0.726 0.993 Vaccination card seen 0.488 0.053 128 130 1.193 0.109 0.382 0.594 Received BCG vaccination 0.744 0.045 128 130 1.162 0.060 0.654 0.834 Received DPT vaccination (3 doses) 0.644 0.056 128 130 1.314 0.088 0.531 0.756 Received polio vaccination (3 doses) 0.602 0.053 128 130 1.206 0.088 0.496 0.707 Received measles vaccination 0.668 0.051 128 130 1.209 0.076 0.566 0.770 Received all vaccinations 0.571 0.059 128 130 1.325 0.103 0.454 0.688 Height-for-age (below -2SD) 0.515 0.025 568 597 1.185 0.049 0.465 0.565 Weight-for-height (below -2SD) 0.194 0.025 568 597 1.445 0.127 0.145 0.243 Weight-for-age (below -2SD) 0.448 0.029 568 597 1.341 0.065 0.390 0.506 Prevalence of anemia (children 6-59) 0.437 0.039 176 185 1.052 0.089 0.359 0.515 Prevalence of anemia (women 15-49) 0.252 0.022 267 271 0.847 0.089 0.207 0.297 BMI <18.5 0.272 0.020 772 777 1.243 0.073 0.232 0.312 Has heard of HIV/AIDS 0.268 0.019 875 882 1.253 0.070 0.230 0.305 Knows about condoms to prevent AIDS 0.173 0.017 875 882 1.291 0.095 0.140 0.206 Konws about limitimg partners to prevent AIDS 0.180 0.017 875 882 1.292 0.093 0.146 0.214 Comprehensive knowledge on HIV transmission 0.115 0.013 875 882 1.198 0.112 0.089 0.141 Total fertility rate (past 3 years) 5.590 0.325 na 2422 1.085 0.058 4.939 6.241 Neonatal mortality (past 0-9 years) 23.936 4.452 1367 1391 1.038 0.186 15.032 32.841 Post-neonatal mortality (past 0-9 years) 30.539 4.675 1364 1388 0.929 0.153 21.190 39.889 Infant mortality (past 0-9 years) 54.476 5.709 1369 1394 0.858 0.105 43.058 65.893 Child mortality (past 0-9 years) 24.139 4.142 1382 1406 0.969 0.172 15.854 32.423 Under-five mortality (past 0-9 years) 77.300 7.657 1380 1405 0.992 0.099 61.985 92.614 ––––––––––––––––––––––––––––––––––––––––––––––––––––––––––––––––––––––––––––––––––––––––––––––––––––––––––––––––––
MEN –––––––––––––––––––––––––––––––––––––––––––––––––––––––––––––––––––––––––––––––––––––––––––––––––––––––––––––––––– Urban residence 0.068 0.011 265 260 0.681 0.156 0.047 0.089 Literacy 0.842 0.024 265 260 1.081 0.029 0.793 0.890 No education 0.190 0.032 265 260 1.336 0.170 0.125 0.254 With secondary eductation or higher 0.509 0.040 265 260 1.313 0.080 0.428 0.590 Never married/in union 0.364 0.032 265 260 1.078 0.088 0.300 0.428 Currently married/in union 0.610 0.034 265 260 1.144 0.056 0.541 0.678 Knowing any contraceptive method 0.472 0.053 161 159 1.331 0.112 0.367 0.577 Ever used any contraceptive method 0.024 0.011 161 159 0.940 0.477 0.001 0.046 Currently using any method 0.091 0.025 161 159 1.085 0.271 0.042 0.140 Want no more children 0.182 0.029 161 159 0.947 0.159 0.124 0.239 Ideal number fo children 5.549 0.226 251 246 1.435 0.041 5.096 6.001 Has heard of HIV/AIDS 0.317 0.040 265 260 1.378 0.125 0.238 0.396 Knows about condoms to prevent AIDS 0.196 0.034 265 260 1.392 0.174 0.127 0.264 Konws about limitimg partners to prevent AIDS 0.179 0.034 265 260 1.439 0.190 0.111 0.247 Comprehensive knowledge on HIV transmission 0.090 0.021 265 260 1.168 0.229 0.049 0.131 –––––––––––––––––––––––––––––––––––––––––––––––––––––––––––––––––––––––––––––––––––––––––––––––––––––––––––––––––– na = Not applicable


Appendix C | 281
DATA QUALITY TABLES Appendix C
Table C.1 Household age distribution
Single-year age distribution of the de facto household population by sex (weighted), Timor-Leste 2009-10
Women Men Age Number Percent Number Percent
0 974 2.9 1,072 3.2 1 911 2.7 934 2.8 2 1,093 3.3 1,037 3.1 3 1,078 3.2 1,076 3.2 4 924 2.8 993 3.0 5 930 2.8 938 2.8 6 1,198 3.6 1,270 3.8 7 1,030 3.1 1,089 3.2 8 1,132 3.4 1,167 3.5 9 884 2.7 1,006 3.0 10 1,064 3.2 1,168 3.5 11 744 2.2 809 2.4 12 1,074 3.2 1,063 3.2 13 883 2.7 829 2.5 14 797 2.4 825 2.5 15 768 2.3 820 2.4 16 662 2.0 696 2.1 17 657 2.0 791 2.4 18 648 1.9 648 1.9 19 594 1.8 605 1.8 20 653 2.0 617 1.8 21 474 1.4 434 1.3 22 494 1.5 458 1.4 23 419 1.3 417 1.2 24 498 1.5 350 1.0 25 537 1.6 497 1.5 26 389 1.2 351 1.0 27 397 1.2 418 1.2 28 358 1.1 347 1.0 29 319 1.0 294 0.9 30 370 1.1 407 1.2 31 258 0.8 180 0.5 32 328 1.0 316 0.9 33 267 0.8 232 0.7 34 379 1.1 323 1.0 35 426 1.3 452 1.3 36 328 1.0 348 1.0 37 321 1.0 368 1.1 38 326 1.0 303 0.9 39 350 1.1 335 1.0 40 412 1.2 525 1.6 41 252 0.8 264 0.8 42 298 0.9 273 0.8 43 249 0.7 263 0.8 44 240 0.7 220 0.7 45 278 0.8 380 1.1 46 268 0.8 232 0.7 47 189 0.6 230 0.7 48 193 0.6 215 0.6 49 257 0.8 270 0.8 50 455 1.4 367 1.1 51 218 0.7 163 0.5 52 258 0.8 204 0.6 53 203 0.6 174 0.5 54 199 0.6 209 0.6 55 166 0.5 216 0.6 56 150 0.5 165 0.5 57 108 0.3 131 0.4 58 116 0.3 157 0.5 59 161 0.5 174 0.5 60 456 1.4 383 1.1 61 228 0.7 194 0.6 62 256 0.8 235 0.7 63 190 0.6 183 0.5 64 194 0.6 201 0.6 65 234 0.7 249 0.7 66 94 0.3 90 0.3 67 128 0.4 126 0.4 68 89 0.3 87 0.3 69 140 0.4 128 0.4 70+ 641 1.9 631 1.9 Don't know 10 0.0 2 0.0 Total 33,265 100.0 33,626 100.0
Note: The de facto population includes all residents and non-residents who stayed in the household the night before the interview.

282 | Appendix C
Table C.2.1 Age distribution of eligible and interviewed women
De facto household population of women age 10-54, interviewed women age 15-49, and percentage of eligible women who were interviewed (weighted), by five-year age groups, Timor-Leste 2009-10
Household population of women age
10-54
Interviewed women
age 15-49 Percentage of
eligible women interviewed
Age group Number Percent
10-14 4,560 na na na 15-19 3,329 3,157 24.0 94.8 20-24 2,538 2,352 17.9 92.7 25-29 2,000 1,900 14.4 95.0 30-34 1,601 1,530 11.6 95.5 35-39 1,751 1,690 12.8 96.5 40-44 1,451 1,385 10.5 95.5 45-49 1,186 1,145 8.7 96.5 50-54 1,334 na na na 15-49 13,857 13,158 100.0 95.0
Note: The de facto population includes all residents and nonresidents who stayed in the household the night before the interview. Weights for both household population of women and interviewed women are household weights. Age is based on the household schedule. na = Not applicable
Table C.2.2 Age distribution of eligible and interviewed men
De facto household population of men aged 10-54, interviewed men age 15-49 and percent of eligible men who were interviewed (weighted), Timor-Leste 2009-10
Household population of
men age 10-54
Percentage of eligible men interviewed
Interviewed men
age 15-49 Age group Number Percent
10-14 1,529 na na na 15-19 1,095 1,008 24.5 92.1 20-24 722 650 15.8 89.9 25-29 635 585 14.2 92.1 30-34 470 447 10.9 95.1 35-39 593 553 13.5 93.4 40-44 490 467 11.3 95.3 45-49 429 402 9.8 93.8 50-54 378 na na na 15-49 4,433 4,112 100.0 92.8
Note: The de facto population includes all residents and nonresidents who stayed in the household the night before the interview. Weights for both household population of women and interviewed women are household weights. Age is based on the household schedule. na = Not applicable

Appendix C | 283
Table C.3 Completeness of reporting
Percentage of cases missing information for selected demographic and health questions (weighted), Timor-Leste 2009-10
Subject Reference group
Percentage with information
missing Number of
cases
Birth date Births in past 15 years Month only 0.35 26,962 Month and year 0.01 26,962 Age at death Dead children born in past 15 years 0.00 2,312 Age/date at first union1 Ever-married women age 15-49 0.21 8,462 Ever-married men age 15-49 0.21 2,211 Respondent's education All women age 15-49 0.00 13,137 All men age 15-49 0.00 4,076 Diarrhea in past 2 weeks Living children age 0-59 months 0.38 9,328
Anthropometry Living children age 0-59 months (from
Household Questionnaire) Height 11.42 10,104 Weight 8.65 10,104 Height or weight 11.46 10,104 Anemia Living children 6-59 months (from
Household Questionnaire)
Children 16.24 3,066 Women All women (from Household
Questionnaire) 9.65 4,554
1 Both year and age missing
Table C.4 Births by calendar years
Number of births, percentage with complete birth date, sex ratio at birth, and calendar year ratio by calendar year, according to living (L), dead (D), and total (T) children (weighted), Timor-Leste 2009-10
Number of births Percentage with complete
birth date1 Sex ratio at birth2 Calendar year ratio3 Calendar year Living Dead Total Living Dead Total Living Dead Total Living Dead Total
2010 15 0 15 100.0 na 100.0 66.8 na 66.8 na na na 2009 1,691 49 1,740 100.0 100.0 100.0 109.5 112.1 109.6 na na na 2008 1,835 93 1,929 100.0 100.0 100.0 106.7 142.2 108.2 101.1 117.3 101.8 2007 1,940 109 2,049 100.0 100.0 100.0 93.5 117.0 94.7 101.7 108.8 102.1 2006 1,979 108 2,087 99.9 100.0 99.9 103.2 117.5 103.9 108.1 90.2 107.0 2005 1,721 130 1,851 100.0 100.0 100.0 103.6 152.4 106.4 94.5 116.3 95.8 2004 1,663 115 1,779 100.0 100.0 100.0 104.5 122.1 105.6 86.2 64.2 84.4 2003 2,136 230 2,366 99.5 98.7 99.4 104.3 112.5 105.0 126.6 158.9 129.1 2002 1,712 174 1,886 99.1 98.1 99.0 108.4 92.8 106.9 85.4 87.1 85.6 2001 1,871 169 2,041 99.6 98.6 99.5 104.3 120.6 105.5 117.0 93.9 114.7 2006-2010 7,460 360 7,820 100.0 100.0 100.0 102.7 122.4 103.5 na na na 2001-2005 9,105 818 9,922 99.6 98.9 99.6 105.0 116.2 105.9 na na na 1996-2000 6,918 963 7,881 99.5 98.6 99.4 104.8 127.7 107.4 na na na 1991-1995 4,688 759 5,448 99.5 98.9 99.4 111.0 112.2 111.2 na na na <1991 3,852 968 4,820 99.6 98.5 99.4 106.5 106.6 106.6 na na na All 32,023 3,868 35,890 99.7 98.9 99.6 105.5 116.2 106.6 na na na
na = Not applicable 1 Both year and month of birth given 2 (Bm/Bf)x100, where Bm and Bf are the numbers of male and female births, respectively 3 [2Bx/(Bx-1+Bx+1)]x100, where Bx is the number of births in calendar year x

284 | Appendix C
Table C.5 Reporting of age at death in days
Distribution of reported deaths under one month of age by age at death in days and the percentage of neonatal deaths reported to occur at ages 0-6 days, for five-year periods of birth preceding the survey (weighted), Timor-Leste 2009-10
Age at death (days)
Number of years preceding the survey
0-4 5-9 10-14 15-19Total0-19
<1 63 81 94 71 309 1 39 82 63 55 239 2 17 39 31 19 106 3 15 14 14 19 61 4 14 7 4 7 32 5 3 9 9 13 33 6 8 7 6 6 28 7 12 16 15 17 59 8 1 1 1 4 8 9 4 11 2 7 24 10 5 1 7 3 17 11 0 1 0 0 1 12 6 3 2 1 11 13 1 0 0 1 2 14 6 8 13 12 39 15 4 1 2 1 8 16 1 2 0 1 3 18 2 0 0 0 2 19 1 0 2 0 3 20 1 3 1 2 6 21 1 2 1 1 4 23 2 1 0 0 2 24 0 1 1 2 3 25 0 0 2 0 2 27 0 0 2 1 2 28 1 0 1 0 2 29 3 1 0 0 3 30 1 0 1 2 4 31+ 0 2 0 1 3 Total 0-30 209 290 271 242 1,013 Percent early neonatal1 75.7 82.5 81.4 78.3 79.8
1 ≤6 days / ≤30 days

Appendix C | 285
Table C.6 Reporting of age at death in months
Distribution of reported deaths under two years of age by age at death in months and the percentage of infant deaths reported to occur at age under one month, for five-year periods of birth preceding the survey, Timor-Leste 2009-10
Age at death (months)
Number of years preceding the survey
0-4 5-9 10-14 15-19Total0-19
<1a 209 290 271 242 1,013 1 31 55 46 32 164 2 25 50 58 36 169 3 25 40 28 26 120 4 20 24 34 24 102 5 13 24 38 10 86 6 23 29 25 27 104 7 8 33 22 23 86 8 15 33 26 22 96 9 15 34 53 20 122 10 9 14 12 11 46 11 10 10 9 8 37 12 20 43 47 33 143 13 16 14 28 8 66 14 5 8 13 11 38 15 3 10 10 8 31 16 3 6 2 6 17 17 3 5 5 3 17 18 3 9 7 2 20 19 2 3 3 2 9 20 3 4 3 0 11 21 1 1 2 2 5 22 1 1 1 1 3 23 3 2 1 0 6 24+ 0 3 4 1 8 1 year 1 7 7 11 26
Total 0-11 405 637 623 480 2,145 Percent neonatal1 51.7 45.5 43.6 50.4 47.2
a Includes deaths under one month reported in days 1 Under one month / under one year

286 | Appendix C
Table C.7 Nutritional status of children
Percentage of children under five years classified as malnourished according to three anthropometric indices of nutritional status: height-for-age, weight-for-height, and weight-for-age, by background characteristics, Timor-Leste 2009-10
Height-for-age Weight-for-height Weight-for-age
Background characteristic
Per-centage below -3 SD
Per- centage below -2 SD1
Mean Z-
score (SD)
Per-centage below -3 SD
Per-centage below -2 SD1
Per-centage above +2 SD
Mean Z-
score (SD)
Per-centage below -3 SD
Per-centage below -2 SD1
Per-centage above +2 SD
Mean Z-score
(SD)
Number of
children
Age in months <6 6.3 16.8 (0.3) 2.8 9.9 14.3 0.1 0.5 5.7 7.4 (0.1) 555 6-8 11.5 26.6 (1.2) 3.4 12.4 8.3 (0.3) 5.4 21.7 0.2 (1.2) 345 9-11 13.2 32.6 (1.5) 2.5 13.1 5.2 (0.6) 12.7 39.6 1.0 (1.6) 389 12-17 29.0 58.5 (1.9) 4.4 20.0 2.7 (0.9) 19.0 57.0 1.1 (2.0) 816 18-23 39.7 68.7 (2.5) 4.0 19.0 3.6 (1.0) 20.0 59.0 1.6 (2.1) 681 24-35 30.7 55.5 (2.1) 4.7 17.3 1.1 (1.0) 18.9 60.1 0.5 (2.1) 1,792 36-47 31.7 60.7 (2.3) 3.7 16.4 1.6 (1.0) 16.7 54.4 0.3 (2.1) 1,872 48-59 27.6 55.3 (2.2) 3.9 19.8 1.4 (1.1) 16.3 59.5 0.1 (2.1) 1,727
Sex Male 28.0 54.6 (2.0) 4.3 18.2 3.1 (0.9) 16.3 51.7 0.9 (1.9) 4,144 Female 27.1 51.5 (1.9) 3.5 16.1 3.0 (0.9) 15.4 52.3 1.1 (1.9) 4,033
Birth interval in months2 First birth3 26.8 51.8 (1.9) 4.4 19.0 2.1 (1.0) 15.5 53.1 0.8 (1.9) 1,300 <24 28.2 55.0 (2.1) 4.3 16.7 3.3 (0.9) 16.5 51.7 0.6 (1.9) 1,787 24-47 27.8 53.7 (2.0) 3.3 15.8 2.9 (0.9) 15.7 52.5 1.2 (1.9) 3,542 48+ 22.8 47.1 (1.7) 4.0 19.9 4.4 (0.9) 14.9 48.0 1.3 (1.8) 958
Size at birth2 Very small 30.1 60.1 (2.1) 4.7 17.7 1.8 (1.1) 23.0 60.6 1.0 (2.1) 401 Small 27.6 54.8 (2.0) 2.7 15.2 2.8 (0.9) 16.3 55.2 0.9 (1.9) 805 Average or larger 27.1 52.5 (2.0) 4.0 17.4 3.3 (0.9) 15.4 51.1 1.1 (1.9) 6,211 Missing 15.3 41.5 (1.6) 1.7 12.3 0.0 (0.9) 9.2 43.3 0.0 (1.7) 168 Mother's interview status Interviewed 27.1 52.9 (2.0) 3.8 17.1 3.1 (0.9) 15.8 51.9 1.0 (1.9) 7,586
Not interviewed but in household 29.7 49.9 (2.0) 4.3 16.1 4.9 (0.8) 13.4 46.9 1.6 (1.8) 220
Not interviewed, and not in the household4 36.3 59.9 (2.2) 5.6 18.4 1.6 (1.0) 18.7 57.4 0.0 (2.1) 371
Mother's nutritional status5 Thin (BMI<18.5) 31.6 59.7 (2.2) 3.9 20.5 2.2 (1.1) 22.5 62.5 0.7 (2.2) 1,858 Normal (BMI 18.5-24.9) 26.5 51.3 (1.9) 3.9 16.4 3.2 (0.8) 13.9 49.2 1.2 (1.8) 5,258 Overweight/ obese (BMI ≥25) 16.1 43.4 (1.8) 2.2 11.1 4.6 (0.7) 9.6 39.4 0.7 (1.6) 450
Residence Urban 17.0 41.4 (1.7) 2.6 13.4 3.2 (0.8) 9.0 41.6 1.1 (1.7) 1,799
Rural 30.5 56.4 (2.1) 4.3 18.2 3.0 (0.9) 17.7 54.9 1.0 (2.0) 6,378
District Aileu 14.8 27.9 (0.5) 19.2 46.7 1.0 (1.7) 13.4 50.6 2.5 (1.7) 271
Baucau 35.7 55.6 (2.3) 3.7 19.0 6.4 (0.6) 19.7 52.2 1.8 (1.8) 691 Bobonaro 38.4 68.0 (2.4) 4.3 14.2 5.5 (0.7) 19.0 60.0 1.1 (2.0) 795 Cova Lima 30.6 59.9 (2.2) 1.8 12.5 2.7 (0.8) 13.0 55.1 0.5 (1.9) 372
Ermera 43.0 65.9 (2.5) 2.8 18.2 1.8 (1.0) 24.6 64.7 0.5 (2.2) 1,079 Lautem 15.3 44.8 (1.7) 1.5 8.0 1.3 (0.8) 6.6 41.7 0.1 (1.7) 714 Liquica 28.8 52.7 (2.0) 2.8 14.3 3.4 (0.8) 14.1 49.1 1.3 (1.8) 457
Manufahi 28.9 58.7 (2.1) 3.4 13.8 2.0 (0.9) 14.0 53.1 1.0 (2.0) 298 Oecussi 33.5 64.6 (2.3) 4.4 24.2 1.0 (1.3) 29.2 68.8 0.1 (2.4) 710
Mother's education6 No education 33.6 58.1 (2.1) 4.2 19.0 3.3 (0.9) 19.8 55.7 1.1 (2.0) 2,726 Primary 27.2 54.7 (2.0) 3.9 16.9 3.1 (0.9) 16.0 54.0 0.8 (1.9) 2,174
More than secondary 13.1 38.1 (1.5) 2.4 8.8 3.4 (0.7) 5.2 34.2 2.0 (1.5) 164
Wealth quintile Lowest 32.1 57.8 (2.1) 4.6 18.9 2.9 (0.9) 19.7 55.6 0.8 (2.0) 1,757
Middle 30.1 55.5 (2.1) 4.3 17.6 2.3 (0.9) 17.5 55.5 1.0 (2.0) 1,657 Fourth 23.9 50.5 (1.9) 3.7 16.2 2.5 (0.9) 13.1 50.3 0.3 (1.9) 1,609 Highest 16.4 40.2 (1.6) 2.9 15.6 3.6 (0.8) 9.3 42.1 1.6 (1.7) 1,527
Total 27.6 53.1 (2.0) 3.9 17.1 3.0 (0.9) 15.8 52.0 1.0 (1.9) 8,177
Note: Table is based on children who slept in the household the night before the interview. Each of the indices is expressed in standard deviation units (SD) from the median of the NCHS/CDC/WHO international reference population. Table is based on children with valid dates of birth (month and year) and valid measurement of both height and weight. 1 Includes children who are below -3 standard deviations (SD) from the international reference population median 2 Excludes children whose mothers were not interviewed 3 First born twins (triplets, etc.) are counted as first births because they do not have a previous birth interval 4 Includes children whose mothers are deceased 5 Excludes children whose mothers were not weighed and measured. Mother's nutritional status in terms of BMI (Body Mass Index) is presented in Table 11.10 6 For women who are not interviewed, information is taken from the Household Questionnaire. Excludes children whose mothers are not listed in the Household Questionnaire

Appendix C | 287
Table C.8: Completeness of information on siblings
Number of sisters and brothers reported by interviewed women and completeness of age data for living siblings and age at death (AD) and years since death (YSD) data for dead siblings, Timor-Leste 2009-10
Sisters Brothers Total
Number Percent Number Percent Number Percent
All siblings 30,861 100.0 32,621 100.0 63,481 100.0 Living 26,061 84.4 27,258 83.6 53,318 84.0 Dead 4,790 15.5 5,357 16.4 10,147 16.0 Status unknown 10 0.0 7 0.0 16 0.0
Living siblings 26,061 100.0 27,258 100.0 53,318 100.0 Age reported 26,013 99.8 27,215 99.8 53,228 99.8 Age missing 48 0.2 42 0.2 90 0.2
Dead siblings 4,790 100.0 5,357 100.0 10,147 100.0 AD and YSD reported 4,766 99.5 5,319 99.3 10,085 99.4 Missing only AD 4 0.1 9 0.2 13 0.1 Missing only YSD 2 0.0 4 0.1 7 0.1 Missing both 18 0.4 24 0.5 42 0.4
Table C.9 Indicators on data quality
Percent distribution of respondents and siblings by year of birth, Timor-Leste 2009-10
Year of birth Respondents Siblings
Before 1950 0.0 0.7 1950-54 0.0 1.3 1955-59 0.1 3.1 1960-64 8.7 5.4 1965-69 10.6 7.7 1970-74 12.9 9.8 1975-79 11.6 10.5 1980-84 14.6 13.6 1985 or later 41.5 48.0
Total 100.0 100.0
Lower range 1,959 1,923 Upper range 1,995 2,009 Median 1,971 1,971
Number of cases 13,137 63,458
Table C.10 Sibship size and sex ratio of siblings
Mean sibship size and sex ratio of births, Timor-Leste 2009-10
Year of birth of respondents
Mean sibship
size
Sex ratio at birth of siblings
1955-59 5.3 80.0 1960-64 5.1 106.6 1965-69 5.2 101.2 1970-74 5.3 104.3 1975-79 5.5 105.4 1980-84 5.8 101.0 1985-89 6.2 107.9 1990-95
Total
6.5
5.8
108.9
105.7


Appendix D | 289
PERSONS INVOLVED IN THE 2009-10 TIMOR-LESTE DEMOGRAPHIC AND HEALTH SURVEY Appendix D
Ministry of Finance
General Directorate Analysis and Research Ministry of Finance Antonio Freitas, Director General Analysis and Research
National Statistics Directorate
Elias dos Santos Ferreira, Director of National Statistics Directorate Americo Soares, Project Manager/Trainer Lourenço Soares, Data Manager/Trainer
Marianne Viatour, Trainer Fredrick Otieno Okwayo, Administration UNFPA
Anouska Charles, Focal Point DHS UNFPA Thinley Wangdi, Mapping and GIS Specialist
Alipio Moniz, Mapping and GIS Joao Gusmão, Mapping and GIS
Domingos Sebastiao Freitas, Design and Publication Walter Estrada, Administration
Silvina da Costa Soares, Finance Officer Terezinha Baptista Araújo, Logistics
Ministry of Health
Agapito Da Costa Soares, Director General Ministry of Health Pedro Canizio Amaral, Vocal Point DHS Ministry of Health
ICF Macro
Pav Govindasamy, Regional Coordinator for Anglophone Africa and Asia Anjushree Pradhan, Country Manager/Consultant
Ruilin Ren, Sampling Specialist Alexander Izmukhambetov, Data Processing Specialist
Elizabeth Britton, Data Processing Specialist Andrew Inglis, Senior GIS Specialist
Clara Burgert, GIS Specialist Joy Fishel, Survey Specialist
Velma Lopez, Survey Specialist Lyndsey Wilson-Williams, Survey Specialist
Anuja Jayaraman, Consultant Jyoti Manandhar, Consultant
Laurie Liskin, Senior Dissemination Specialist Nancy Johnson, Editor
Christopher L. Gramer, Document Production Kaye Mitchell, Document Production
Sarah Schneider, Dissemination Specialist Erica Nybro, Senior Communications Associate
Blake Zachary, GIS Specialist

290 | Appendix D
Field staff
Listing
Supervisor
Adriano de Araujo
Listers
Filomeno Amaral Terezinha Lopes Helena Gastaun Ferreira Rosmanino Mendonca Francisca X.C. Silva Antonio Soares Sebastiaon Dias Saldanha Armindo Mendonca Martinho Gusmao Mateus Pinheiro
Drivers
Herman M.J. Mauliku Ximenes Manuel Natalino P. Silva Julio Aniceto Lay
Fieldwork
Supervisors
Abel Petrus Alberto da Silva Ximenes Araujo Alcino da silva Casimiro Guterres de Sousa Denis Gomes dos Santos Domingos Moniz Elvis da Costa Lopes
Januario Ximenes Jose Belino de Almeida Luis Lobo da Costa Nemezio L. A. Fatima Pedro Paulo Inacio Araujo de Jesus Soares
Editors
Micaela Maria de Fatima Guterres Luizinha Pereira Luisinha Francisca Pereira Josefa Barros Moniz Martinha Sequeira da Costa Nunes Albina da Costa Mariana Freitas
Domingas Fernandes Joana Dircia do N.S. Guterres Justina Pinto Elisa Andrade dos Santos Sãozinha da Costa Carbafo Noronha Maria Lourdes Gomes
Quality Control
Leoncio Rogeiro da Costa Amaral Eddy Antonio Elson Martinho da Costa Antonio Amaral da Silva Ximenes Apoliana Maria de Vasconcelos Pinto
Lindalva Maria da Gloria Pinto Alvarito R. Alvares Florentina do Carmo Pires Cardoso Maria Ruth Raga Guterres Domitilia Araujo Caetano

Appendix D | 291
Interviewers
Martinho da Costa Cesaltina Falcao de Araujo Josefina Fernandes Pinto Senhorinha Joana Segurado Mariano C. Soares Barbara Araujo Gomes Anarela Baptista A. da Costa Madalena da Costa Sancho Pires Olimpia Fernandes Amaral Ina Alda de Rosa Ernestina dos Santos Silva Antonino Ximenes Pereira Beatriz Luisa Nunes Joaninha Araujo do Rego Refalina da Costa Ribeiro Pascal Sereno dos Reis Amelia Maculada da Costa Agusto
Ismenia Moniz Ediana Bento dos Anjos Afonso Branco Marcia Rebelo Soares Maria Freitas Soares Claudina da Cruz dos Reis Daniel Martins Marcolina Mendonça Margarida do Carmo Ursula Paulina Castro de Araujo Paulo da Cruz Albina Coelho Maria Jose Aleixo Barreto Lina Mariate Piedade João Sequeira Mendonça Ana Paula Martins dos Santos Isabel da Costa
Lurdes Magalhaes Guterres Ramalinho da Conceição Tavares Querobina de Jesus Ximenes Amelia Regina Gonsalves Carvalho Maria Lola Carvalho Tobias Soares Sarmento Clarinha Soares Palmira Carvalho Marina Ximenes de Jesus Jose da Costa Dulce M.B. da Conceição da Costa Domingas Daos Isabel da Silva Soares Salamao de Carvalho Antonia Alves da Costa Judit da Silva Etelvina de Fatima Sarmento
Drivers
Agapito R. da Conceincao Silva Herman M.J. Mauliku Ximenes Tobias Joaninho da Silva Junior Gergorio Fatima C. da Costa Francisco Mendonca Leonildo Ricardo Caetano Julio Aniceto Lay Severino Ramos da Silva Mausilo Marques Saul do Carmo Ximenes Valente Galucho Bhenk-Bhenk Expolito Quintao de Deus Paulo Rogerio Guterres Tomas Ximenes Manuel Natalino P. Silva Raul Pinto Domingos da Costa Rafael Lobato
Data Entry
Samuel da Conceição Amaral Nilda Fatima Exposto Ana Almeida de Araujo Leong Sonia Lay Gomes Claudina Barros de Jesus Florindo da Silva Teotonia Mafalda Boavida Joao de Fatima Basilio Vieira da Costa Alcino Menezes Octavianos Neto Abilio Maria Fe Lip Abel de Castro Soares Manuel Soares Diana Varia Francisco Xavier

292 | Appendix D
Members of the Steering Committee
Antonio Freitas, General Directorate for Analysis and Research Elias dos Santos Ferreira, National Statistics Directorate
Americo Soares, National Statistics Directorate Agapito da Costa Soares, Ministry of Health Pedro Canizio Amaral, Ministry of Health
Hernando Agudelo, UNFPA Pornchai Suchitta, UNFPA Teodulo Ximenes, USAID
Antonio Franco, World Bank Rab Habib, World Bank
Frederick Otieno Okwayo, UNFPA Anouska Charles, UNFPA
Jun Kukita, UNICEF Min Yuan, UNICEF
Monjur Honssain, UNICEF João da Costa, UNICEF
Paramita Sudharto, WHO Erling Larsson, WHO
Yuwono Sidharta, WHO Elaine Tan, UNIFEM
Christine Chan, UNIFEM Rui Gomes, UNDP
Armandina Amaral, AusAID Sinead Lynch, Irish AID Ubalda Alves, Irish AID
Veronica Correia, Alola Foundation

QUESTIONNAIRES Appendix E
| 293Appendix E


20 July 2009TIMOR-LESTE DEMOGRAPHIC AND HEALTH SURVEY (TLDHS)
HOUSEHOLD QUESTIONNAIRE
IDENTIFICATION
NAME AND CODE OF DISTRICT
NEW SUCO NAME AND NUMBER
CLUSTER NUMBER . . . . . . . . . . . . . . . . . . . . . . . . . . . . . . . . . . . . . . . . . . . . . . . . . . . . . . . . . . . . .
LOCATION ID NUMBER . . . . . . . . . . . . . . . . . . . . . . . . . . . . . . . . . . . . . . . . . . . . . . . . . . . . . .
URBAN/RURAL . . . . . . . . . . . . . . . . . . . . . . . . . . . . . . . . . . . . . . . . . . . . . . . . . . . . . . . . . . . . . . . (URBAN=1, RURAL=2)
NAME OF HOUSEHOLD HEAD
HOUSEHOLD SELECTED FOR MALE SURVEY (YES=1; NO=2) .............................................
DEGREES DECIMALSALTITUDE
LONGITUDE . . . . . . . . . . (E) . METERS
LATITUDE . . . . . . . . . . (S) . NEW LOCATIONYES=1; NO=2
INTERVIEWER VISITS
FINAL VISIT
DATE DAY
MONTH
YEAR
INTERVIEWER'S NAME INT. NUMBER
RESULT* RESULT
NEXT VISIT: DATETOTAL NUMBER
TIME OF VISITS
*RESULT CODES:1 COMPLETED TOTAL PERSONS2 NO HOUSEHOLD MEMBER AT HOME OR NO COMPETENT RESPONDENT IN HOUSEHOLD
AT HOME AT TIME OF VISIT3 ENTIRE HOUSEHOLD ABSENT FOR EXTENDED PERIOD OF TIME4 POSTPONED TOTAL ELIGIBLE5 REFUSED WOMEN6 DWELLING VACANT OR ADDRESS NOT A DWELLING7 DWELLING DESTROYED8 DWELLING NOT FOUND TOTAL ELIGIBLE9 OTHER MEN
(SPECIFY)
LINE NO. OFLANGUAGE OF QUESTIONNAIRE RESPONDENT
TO HOUSEHOLDLANGUAGE OF INTERVIEW QUESTIONNAIRE
NATIVE LANGUAGE OF RESPONDENT
TRANSLATOR USED (YES=1; NO=2)
LANGUAGE CODES: TETUM=1; BAHASA=2; PORTUGESE=3; OTHER=4
SUPERVISOR FIELD EDITOR
NAME NAME
DATE DATE
NATIONAL STATISTICS DIRECTORATE (NSD) AND MINISTRY OF HEALTH
EDITOROFFICE KEYED BY
1 2 3
| 295Appendix E

Introduction and Consent
Hello. My name is _______________________________________ and I am working with NATIONAL STATISTICS DIRECTORATE.We are conducting a national survey about various health issues. We would very much appreciate your participation in this survey.This information will help the government to plan health services. The survey usually takes between 10 and 15 minutes to complete.As part of the survey we would first like to ask some questions about your household. Whatever information you provide will be keptstrictly confidential, and will not be shared with anyone other than members of our survey team.
Participation in this survey is voluntary, and if we should come to any question you don't want to answer, just let me know and I will go on to the next question; or you can stop the interview at any time. However, we hope you will participate in the survey since your views are important.
At this time, do you want to ask me anything about the survey?May I begin the interview now?
Signature of interviewer: Date:
. . . 1 RESPONDENT DOES NOT AGREE TO BE INTERVIEWED . . . 2 ENDRESPONDENT AGREES TO BE INTERVIEWED
296 | Appendix E
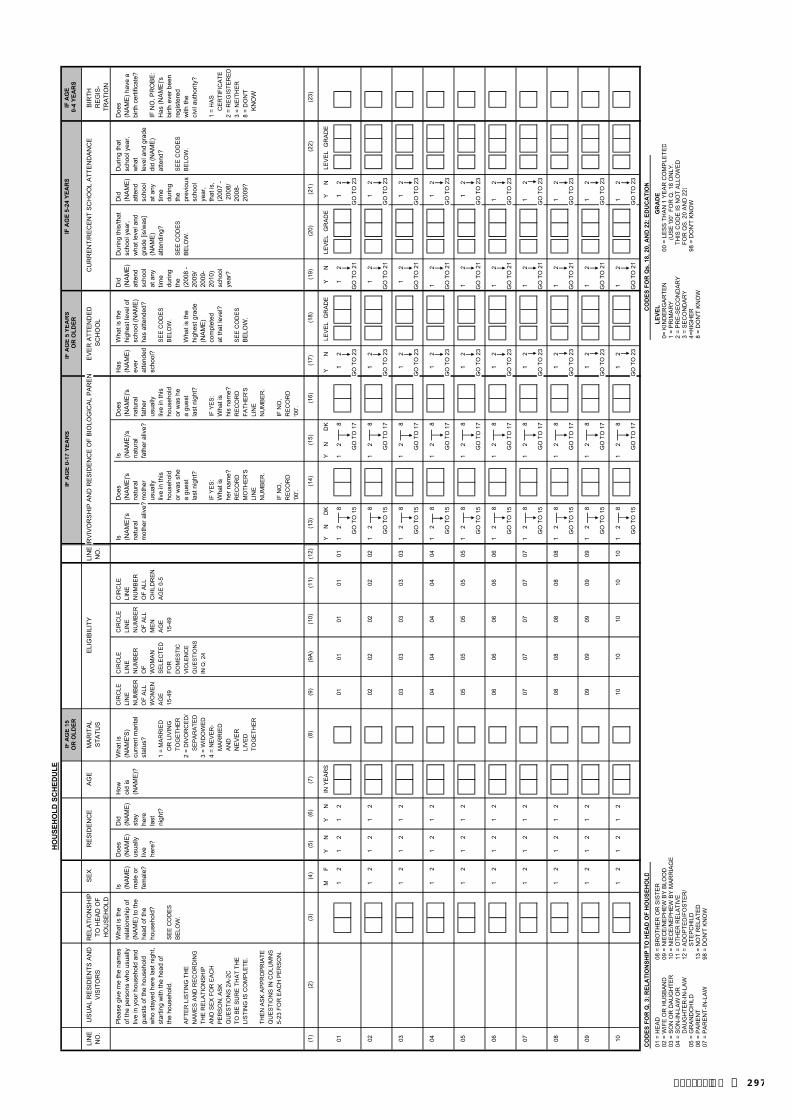
IF A
GE
15IF
AG
E 0-
17 Y
EAR
SIF
AG
E 5
YEA
RS
OR
OLD
ERO
R O
LDER
0-4
YEA
RS
LIN
EU
SU
AL
RE
SID
EN
TS A
ND
AG
ELI
NEU
RV
IVO
RS
HIP
AN
D R
ES
IDE
NC
E O
F B
IOLO
GIC
AL
PA
RE
NE
VE
R A
TTE
ND
ED
C
UR
RE
NT/
RE
CE
NT
SC
HO
OL
ATT
EN
DA
NC
EB
IRTH
N
O.
VIS
ITO
RS
NO
.S
CH
OO
LR
EG
IS-
Ple
ase
give
me
the
nam
es
Wha
t is
the
IsD
oes
Did
How
W
hat i
sC
IRC
LEC
IRC
LE
CIR
CLE
CIR
CLE
IsD
oes
IsD
oes
Has
Wha
t is
the
Did
D
urin
g th
is/th
atD
idD
urin
g th
atD
oes
of th
e pe
rson
s w
ho u
sual
lyre
latio
nshi
p of
(NA
ME
)(N
AM
E)
(NA
ME
)ol
d is
(NA
ME
'S)
LIN
ELI
NE
LIN
ELI
NE
(NA
ME
)'s(N
AM
E)'s
(NA
ME
)'s(N
AM
E)'s
(NA
ME
)hi
ghes
t lev
el o
f(N
AM
E)
scho
ol y
ear,
(NA
ME
)sc
hool
yea
r, (N
AM
E) h
ave
aliv
e in
you
r hou
seho
ld a
nd
(NA
ME
) to
the
mal
e or
usua
llyst
ay
(NA
ME
)?cu
rren
t mar
ital
NU
MB
ER
NU
MB
ER
NU
MB
ER
NU
MB
ER
natu
ral
natu
ral
natu
ral
natu
ral
ever
scho
ol (N
AM
E)
atte
ndw
hat l
evel
and
atte
ndw
hat
birth
cer
tific
ate?
gues
ts o
f the
hou
seho
ld
head
of t
hefe
mal
e?liv
ehe
rest
atus
?O
F A
LLO
F O
F A
LLO
F A
LLm
othe
r aliv
e?m
othe
rfa
ther
aliv
e?fa
ther
atte
nded
has
atte
nded
?sc
hool
grad
e [is
/was
]sc
hool
leve
l and
gra
de
who
sta
yed
here
last
nig
ht,
hous
ehol
d?he
re?
last
WO
ME
NW
OM
AN
ME
NC
HIL
DR
EN
us
ually
us
ually
sc
hool
?at
any
(NA
ME
)at
any
did
(NA
ME
)IF
NO
, PR
OB
E:
star
ting
with
the
head
of
nigh
t?1
= M
AR
RIE
DA
GE
SE
LEC
TED
AG
EA
GE
0-5
live
in th
isliv
e in
this
SE
E C
OD
ES
time
atte
ndin
g?tim
eat
tend
?H
as (N
AM
E)'s
the
hous
ehol
d.S
EE
CO
DE
SO
R L
IVIN
G
15-4
9FO
R
15-4
9ho
useh
old
hous
ehol
dB
ELO
W.
durin
gdu
ring
bi
rth e
ver b
een
BE
LOW
.TO
GE
THE
RD
OM
ES
TIC
or w
as s
he
or w
as h
e th
eS
EE
CO
DE
Sth
e S
EE
CO
DE
Sre
gist
ered
AFT
ER
LIS
TIN
G T
HE
2
= D
IVO
RC
ED
/V
IOLE
NC
Ea
gues
ta
gues
tW
hat i
s th
e(2
008
-B
ELO
W.
prev
ious
BE
LOW
.w
ith th
eN
AM
ES
AN
D R
EC
OR
DIN
GS
EP
AR
ATE
DQ
UE
STI
ON
Sla
st n
ight
?la
st n
ight
?hi
ghes
t gra
de20
09/
scho
olci
vil a
utho
rity?
THE
RE
LATI
ON
SH
IP
3 =
WID
OW
ED
IN Q
. 24
(NA
ME
)20
09-
year
,A
ND
SE
X F
OR
EA
CH
4
= N
EV
ER
-IF
YE
S:
IF Y
ES
:co
mpl
eted
20
10)
that
is,
1 =
HA
S
PE
RS
ON
, AS
K
MA
RR
IED
Wha
t is
Wha
t is
at th
at le
vel?
scho
ol(2
007
-C
ER
TIFI
CA
TEQ
UE
STI
ON
S 2
A-2
C
AN
D
her n
ame?
his
nam
e?ye
ar?
200
8/
2 =
RE
GIS
TER
ED
TO B
E S
UR
E T
HA
T TH
E
NE
VE
RR
EC
OR
DR
EC
OR
DS
EE
CO
DE
S20
08-
3 =
NE
ITH
ER
LIS
TIN
G IS
CO
MP
LETE
.LI
VE
DM
OTH
ER
'SFA
THE
R'S
BE
LOW
.)2
009?
8 =
DO
N'T
TO
GE
THE
RLI
NE
LI
NE
K
NO
WTH
EN
AS
K A
PP
RO
PR
IATE
N
UM
BE
R.
NU
MB
ER
.Q
UE
STI
ON
S IN
CO
LUM
NS
5-23
FO
R E
AC
H P
ER
SO
N.
IF N
O,
IF N
O,
RE
CO
RD
R
EC
OR
D
'00'
.'0
0'.
(1)
(2)
(9)
(9A
)(1
0)(1
1)(1
2)(1
4)(1
6)
MF
YN
YN
IN Y
EA
RS
YN
DK
YN
DK
YN
LE
VE
LG
RA
DE
YN
LE
VE
LG
RA
DE
YN
LE
VE
LG
RA
DE
011
21
21
201
0101
0101
12
81
28
12
12
12
GO
TO
15
GO
TO
17
GO
TO
23
GO
TO
21
GO
TO
23
021
21
21
202
0202
0202
12
81
28
12
12
12
GO
TO
15
GO
TO
17
GO
TO
23
GO
TO
21
GO
TO
23
031
21
21
203
0303
0303
12
81
28
12
12
12
GO
TO
15
GO
TO
17
GO
TO
23
GO
TO
21
GO
TO
23
041
21
21
204
0404
0404
12
81
28
12
12
12
GO
TO
15
GO
TO
17
GO
TO
23
GO
TO
21
GO
TO
23
051
21
21
205
0505
0505
12
81
28
12
12
12
GO
TO
15
GO
TO
17
GO
TO
23
GO
TO
21
GO
TO
23
061
21
21
206
0606
0606
12
81
28
12
12
12
GO
TO
15
GO
TO
17
GO
TO
23
GO
TO
21
GO
TO
23
071
21
21
207
0707
0707
12
81
28
12
12
12
GO
TO
15
GO
TO
17
GO
TO
23
GO
TO
21
GO
TO
23
081
21
21
208
0808
0808
12
81
28
12
12
12
GO
TO
15
GO
TO
17
GO
TO
23
GO
TO
21
GO
TO
23
091
21
21
209
0909
0909
12
81
28
12
12
12
GO
TO
15
GO
TO
17
GO
TO
23
GO
TO
21
GO
TO
23
101
21
21
210
1010
1010
12
81
28
12
12
12
GO
TO
15
GO
TO
17
GO
TO
23
GO
TO
21
GO
TO
23
CO
DES
FO
R Q
. 3: R
ELA
TIO
NSH
IP T
O H
EAD
OF
HO
USE
HO
LDC
OD
ES F
OR
Qs.
18,
20,
AN
D 2
2: E
DU
CA
TIO
N
01 =
HE
AD
08 =
BR
OTH
ER
OR
SIS
TER
LEVE
LG
RA
DE
02 =
WIF
E O
R H
US
BA
ND
09 =
NIE
CE
/NE
PH
EW
BY
BLO
OD
0= K
IND
ER
GA
RTE
N00
= L
ES
S T
HA
N 1
YE
AR
CO
MP
LETE
D03
= S
ON
OR
DA
UG
HTE
R10
= N
IEC
E/N
EP
HE
W B
Y M
AR
RIA
GE
1 =
PR
IMA
RY
(US
E '0
0' F
OR
Q. 1
8 O
NLY
. 04
= S
ON
-IN-L
AW
OR
11
= O
THE
R R
ELA
TIV
E2
= P
RE
-SE
CO
ND
AR
YTH
IS C
OD
E IS
NO
T A
LLO
WE
D
DA
UG
HTE
R-IN
-LA
W12
= A
DO
PTE
D/F
OS
TER
/3
= S
EC
ON
DA
RY
FOR
QS
. 20
AN
D 2
2)05
= G
RA
ND
CH
ILD
STE
PC
HIL
D4=
HIG
HE
R98
= D
ON
'T K
NO
W06
= P
AR
EN
T13
= N
OT
RE
LATE
D8
= D
ON
'T K
NO
W07
= P
AR
EN
T-IN
-LA
W98
= D
ON
'T K
NO
W
(13)
(17)
(18)
(15)
(3)
(4)
(5)
(6)
IF A
GE
TRA
TIO
N
(23)
IF A
GE
5-24
YEA
RS
(21)
(19)
(22)
(20)
HO
USE
HO
LD S
CH
EDU
LE
RE
LATI
ON
SH
IPTO
HE
AD
OF
HO
US
EH
OLD
SE
XE
LIG
IBIL
ITY
RE
SID
EN
CE
MA
RIT
AL
STA
TUS
(8)
(7)
| 297Appendix E

IF A
GE
15IF
AG
E 0-
17 Y
EAR
SIF
AG
E 5
YEA
RS
OR
OLD
ERO
R O
LDER
0-4
YEA
RS
LIN
EU
SU
AL
RE
SID
EN
TS A
ND
AG
ELI
NEU
RV
IVO
RS
HIP
AN
D R
ES
IDE
NC
E O
F B
IOLO
GIC
AL
PA
RE
NE
VE
R A
TTE
ND
ED
C
UR
RE
NT/
RE
CE
NT
SC
HO
OL
ATT
EN
DA
NC
EB
IRTH
N
O.
VIS
ITO
RS
NO
.S
CH
OO
LR
EG
IS-
Ple
ase
give
me
the
nam
es
Wha
t is
the
IsD
oes
Did
How
W
hat i
sC
IRC
LEC
IRC
LE
CIR
CLE
CIR
CLE
IsD
oes
IsD
oes
Has
Wha
t is
the
Did
D
urin
g th
is/th
atD
idD
urin
g th
atD
oes
of th
e pe
rson
s w
ho u
sual
lyre
latio
nshi
p of
(NA
ME
)(N
AM
E)
(NA
ME
)ol
d is
(NA
ME
'S)
LIN
ELI
NE
LIN
ELI
NE
(NA
ME
)'s(N
AM
E)'s
(NA
ME
)'s(N
AM
E)'s
(NA
ME
)hi
ghes
t lev
el o
f(N
AM
E)
scho
ol y
ear,
(NA
ME
)sc
hool
yea
r, (N
AM
E) h
ave
aliv
e in
you
r hou
seho
ld a
nd
(NA
ME
) to
the
mal
e or
usua
llyst
ay
(NA
ME
)?cu
rren
t mar
ital
NU
MB
ER
NU
MB
ER
NU
MB
ER
NU
MB
ER
natu
ral
natu
ral
natu
ral
natu
ral
ever
scho
ol (N
AM
E)
atte
ndw
hat l
evel
and
atte
ndw
hat
birth
cer
tific
ate?
gues
ts o
f the
hou
seho
ld
head
of t
hefe
mal
e?liv
ehe
rest
atus
?O
F A
LLO
F O
F A
LLO
F A
LLm
othe
r aliv
e?m
othe
rfa
ther
aliv
e?fa
ther
atte
nded
has
atte
nded
?sc
hool
grad
e [is
/was
]sc
hool
leve
l and
gra
de
who
sta
yed
here
last
nig
ht,
hous
ehol
d?he
re?
last
WO
ME
NW
OM
AN
ME
NC
HIL
DR
EN
us
ually
us
ually
sc
hool
?at
any
(NA
ME
)at
any
did
(NA
ME
)IF
NO
, PR
OB
E:
star
ting
with
the
head
of
nigh
t?1
= M
AR
RIE
DA
GE
SE
LEC
TED
AG
EA
GE
0-5
live
in th
isliv
e in
this
SE
E C
OD
ES
time
atte
ndin
g?tim
eat
tend
?H
as (N
AM
E)'s
the
hous
ehol
d.S
EE
CO
DE
SO
R L
IVIN
G
15-4
9FO
R
15-4
9ho
useh
old
hous
ehol
dB
ELO
W.
durin
gdu
ring
bi
rth e
ver b
een
BE
LOW
.TO
GE
THE
RD
OM
ES
TIC
or w
as s
he
or w
as h
e th
eS
EE
CO
DE
Sth
e S
EE
CO
DE
Sre
gist
ered
AFT
ER
LIS
TIN
G T
HE
2
= D
IVO
RC
ED
/V
IOLE
NC
Ea
gues
ta
gues
tW
hat i
s th
e(2
008
-B
ELO
W.
prev
ious
BE
LOW
.w
ith th
eN
AM
ES
AN
D R
EC
OR
DIN
GS
EP
AR
ATE
DQ
UE
STI
ON
Sla
st n
ight
?la
st n
ight
?hi
ghes
t gra
de20
09/
scho
olci
vil a
utho
rity?
THE
RE
LATI
ON
SH
IP
3 =
WID
OW
ED
IN Q
. 24
(NA
ME
)20
09-
year
,A
ND
SE
X F
OR
EA
CH
4
= N
EV
ER
-IF
YE
S:
IF Y
ES
:co
mpl
eted
20
10)
that
is,
1 =
HA
S
PE
RS
ON
, AS
K
MA
RR
IED
Wha
t is
Wha
t is
at th
at le
vel?
scho
ol(2
007
-C
ER
TIFI
CA
TEQ
UE
STI
ON
S 2
A-2
C
AN
D
her n
ame?
his
nam
e?ye
ar?
200
8/
2 =
RE
GIS
TER
ED
TO B
E S
UR
E T
HA
T TH
E
NE
VE
RR
EC
OR
DR
EC
OR
DS
EE
CO
DE
S20
08-
3 =
NE
ITH
ER
LIS
TIN
G IS
CO
MP
LETE
.LI
VE
DM
OTH
ER
'SFA
THE
R'S
BE
LOW
.)2
009?
8 =
DO
N'T
TO
GE
THE
RLI
NE
LI
NE
K
NO
WTH
EN
AS
K A
PP
RO
PR
IATE
N
UM
BE
R.
NU
MB
ER
.Q
UE
STI
ON
S IN
CO
LUM
NS
5-23
FO
R E
AC
H P
ER
SO
N.
IF N
O,
IF N
O,
RE
CO
RD
R
EC
OR
D
'00'
.'0
0'.
IF A
GE
TRA
TIO
N
IF A
GE
5-24
YEA
RS
RE
LATI
ON
SH
IPTO
HE
AD
OF
HO
US
EH
OLD
SE
XE
LIG
IBIL
ITY
RE
SID
EN
CE
MA
RIT
AL
STA
TUS
(1)
(2)
(9)
(9A
)(1
0)(1
1)(1
4)(1
6)
MF
YN
YN
YN
DK
YN
DK
YN
LE
VE
LG
RA
DE
YN
LE
VE
LG
RA
DE
YN
LE
VE
LG
RA
DE
111
21
21
211
1111
1111
12
81
28
12
12
12
GO
TO
15
GO
TO
17
GO
TO
23
GO
TO
21
GO
TO
23
121
21
21
212
1212
1212
12
81
28
12
12
12
GO
TO
15
GO
TO
17
GO
TO
23
GO
TO
21
GO
TO
23
131
21
21
213
1313
1313
12
81
28
12
12
12
GO
TO
15
GO
TO
17
GO
TO
23
GO
TO
21
GO
TO
23
141
21
21
214
1414
1414
12
81
28
12
12
12
GO
TO
15
GO
TO
17
GO
TO
23
GO
TO
21
GO
TO
23
151
21
21
215
1515
1515
12
81
28
12
12
12
GO
TO
15
GO
TO
17
GO
TO
23
GO
TO
21
GO
TO
23
161
21
21
216
1616
1616
12
81
28
12
12
12
GO
TO
15
GO
TO
17
GO
TO
23
GO
TO
21
GO
TO
23
171
21
21
217
1717
1717
12
81
28
12
12
12
GO
TO
15
GO
TO
17
GO
TO
23
GO
TO
21
GO
TO
23
181
21
21
218
1818
1818
12
81
28
12
12
12
GO
TO
15
GO
TO
17
GO
TO
23
GO
TO
21
GO
TO
23
191
21
21
219
1919
1919
12
81
28
12
12
12
GO
TO
15
GO
TO
17
GO
TO
23
GO
TO
21
GO
TO
23
201
21
21
220
2020
2020
12
81
28
12
12
12
GO
TO
15
GO
TO
17
GO
TO
23
GO
TO
21
GO
TO
23
TIC
K H
ER
E IF
CO
NTI
NU
ATI
ON
SH
EE
T U
SE
DC
OD
ES F
OR
Q. 3
: REL
ATI
ON
SHIP
TO
HEA
D O
F H
OU
SEH
OLD
CO
DES
FO
R Q
s. 1
8, 2
0, A
ND
22:
ED
UC
ATI
ON
2A) J
ust t
o m
ake
sure
that
I ha
ve a
com
plet
e
01 =
HE
AD
08 =
BR
OTH
ER
OR
SIS
TER
LEVE
LG
RA
DE
listin
g. A
re th
ere
any
othe
r per
sons
suc
h as
sm
all
02 =
WIF
E O
R H
US
BA
ND
09 =
NIE
CE
/NE
PH
EW
BY
BLO
OD
0= K
IND
ER
GA
RTE
N00
= L
ES
S T
HA
N 1
YE
AR
CO
MP
LETE
Dch
ildre
n or
infa
nts
that
we
have
not
list
ed?
YE
SN
O03
= S
ON
OR
DA
UG
HTE
R10
= N
IEC
E/N
EP
HE
W B
Y M
AR
RIA
GE
1 =
PR
IMA
RY
(US
E '0
0' F
OR
Q. 1
8 O
NLY
. 2B
) A
re th
ere
any
othe
r peo
ple
who
may
not
be
04 =
SO
N-IN
-LA
W O
R
11 =
OTH
ER
RE
LATI
VE
2 =
PR
E-S
EC
ON
DA
RY
THIS
CO
DE
IS N
OT
ALL
OW
ED
m
embe
rs o
f you
r fam
ily, s
uch
as d
omes
tic
DA
UG
HTE
R-IN
-LA
W12
= A
DO
PTE
D/F
OS
TER
/3
= S
EC
ON
DA
RY
FOR
QS
. 20
AN
D 2
2)se
rvan
ts, l
odge
rs, o
r frie
nds
who
usu
ally
live
her
eYE
SN
O05
= G
RA
ND
CH
ILD
STE
PC
HIL
D4=
HIG
HE
R98
= D
ON
'T K
NO
W
2C) A
re th
ere
any
gues
ts o
r tem
pora
ry v
isito
rs06
= P
AR
EN
T13
= N
OT
RE
LATE
D8
= D
ON
'T K
NO
Wst
ayin
g he
re, o
r any
one
else
who
sta
yed
here
last
07
= P
AR
EN
T-IN
-LA
W98
= D
ON
'T K
NO
Wni
ght,
who
hav
e no
t bee
n lis
ted?
YE
SN
O
(8)
(7)
(3)
(4)
(5)
(6)
AD
D T
O
TAB
LE
AD
D T
O
TAB
LE
AD
D T
O
TAB
LE
(23)
IN Y
EA
RS
(18)
(19)
(20)
(17)
(15)
(22)
(13)
(21)
298 | Appendix E

24. CHECK THE FRONT COVER OF HOUSEHOLD QUESTIONNAIRE. IS HOUSEHOLD SELECTED FOR MALE SURVEY?
HOUSEHOLD SELECTED HOUSEHOLD NOT SELECTED 101
0 1 2 2 4 3 6 5 4
1 1 1 3 1 4 1 6 5
2 1 2 1 2 5 2 7 6
3 1 1 2 3 1 3 1 7
4 1 2 3 4 2 4 2 8
5 1 1 1 1 3 5 3 1
6 1 2 2 2 4 6 4 2
7 1 1 3 3 5 1 5 3
8 1 2 1 4 1 2 6 4
9 1 1 2 1 2 3 7 5
CIRCLE THE LINE NUMBER FOR THIS WOMAN IN COLUMN 9A
6 7 8
24A. TABLE FOR SELECTION OF RESPONDENTS FOR SECTION ON DOMESTIC VIOLENCELOOK AT THE LAST DIGIT OF THE HOUSEHOLD LOCATION ID ON THE COVER PAGE. THIS IS THE ROW NUMBER YOU SHOULD GO TO. CHECK THE TOTAL NUMBER OF ELIGIBLE FEMALE RESPONDENTS ON THE COVER SHEET OF THE HOUSEHOLD QUESTIONNAIRE. FOR EACH NON-ZERO NUMBER, THIS IS THE COLUMN NUMBER TO GO TO. THE LINE NUMBER OF THE WOMAN SELECTED FOR THE DOMESTIC VIOLENCE MODULE IS THE NUMBER WHERE THE ROW AND COLUMN MEET.
FOR EXAMPLE, IF THE HOUSEHOLD LOCATION ID NUMBER IS ‘250126’, GO TO ROW ‘6’. IF THERE ARE THREE ELIGIBLE WOMEN AGE 15-49 IN THE HOUSEHOLD, GO TO COLUMN ‘3’. FIND THE NUMBER IN THE BOX WHERE THE ROW MEETS THE COLUMN (‘2'). NOW GO TO THE HOUSEHOLD SCHEDULE AND CIRCLE THE LINE NUMBER FOR THE SECOND WOMAN IN COLUMN 9A
TOTAL NUMBER OF ELIGIBLE WOMEN 15-49 IN THE HOUSEHOLDLAST DIGIT OF THE HOUSEHOLD LOCATION ID NUMBER 1 2 3 4 5
| 299Appendix E

NO. QUESTIONS AND FILTERS SKIP
101 What is the main source of drinking water for members PIPED WATERof your household? PIPED INTO DWELLING . . . . . . . . . . 11
PIPED TO YARD/PLOT . . . . . . . . . . . . 12 106PUBLIC TAP/STANDPIPE . . . . . . . . . . 13
TUBE WELL OR BOREHOLE . . . . . . . . . . 21DUG WELL
PROTECTED WELL . . . . . . . . . . . . . . 31 103UNPROTECTED WELL . . . . . . . . . . . . 32
WATER FROM SPRINGPROTECTED SPRING . . . . . . . . . . . . 41UNPROTECTED SPRING . . . . . . . . . . 42
RAINWATER . . . . . . . . . . . . . . . . . . . . . . 51 106TANKER TRUCK . . . . . . . . . . . . . . . . . . 61CART WITH SMALL TANK . . . . . . . . . . 71SURFACE WATER (RIVER/DAM/ 103
LAKE/POND/STREAM/CANAL/IRRIGATION CHANNEL) . . . . . . . . . . 81
BOTTLED WATER . . . . . . . . . . . . . . . . . . 91
OTHER 96 103(SPECIFY)
102 What is the main source of water used by your PIPED WATERhousehold for other purposes such as cooking and PIPED INTO DWELLING . . . . . . . . . . 11handwashing? PIPED TO YARD/PLOT . . . . . . . . . . . . 12 106
PUBLIC TAP/STANDPIPE . . . . . . . . . . 13TUBE WELL OR BOREHOLE . . . . . . . . . . 21DUG WELL
PROTECTED WELL . . . . . . . . . . . . . . 31UNPROTECTED WELL . . . . . . . . . . . . 32
WATER FROM SPRINGPROTECTED SPRING . . . . . . . . . . . . 41UNPROTECTED SPRING . . . . . . . . . . 42
RAINWATER . . . . . . . . . . . . . . . . . . . . . . 51 106TANKER TRUCK . . . . . . . . . . . . . . . . . . 61CART WITH SMALL TANK . . . . . . . . . . 71SURFACE WATER (RIVER/DAM/
LAKE/POND/STREAM/CANAL/IRRIGATION CHANNEL) . . . . . . . . . . 81
OTHER 96(SPECIFY)
103 Where is that water source located? IN OWN DWELLING . . . . . . . . . . . . . . . . 1IN OWN YARD/PLOT . . . . . . . . . . . . . . 2 106ELSEWHERE . . . . . . . . . . . . . . . . . . . . 3
104 How long does it take to go there, get water, and come back? MINUTES . . . . . . . . . . . . . . . .
DON'T KNOW . . . . . . . . . . . . . . . . . . . . 998
105 Who usually goes to this source to fetch the water for your ADULT WOMAN . . . . . . . . . . . . . . . . . . 1household? ADULT MAN . . . . . . . . . . . . . . . . . . . . . . 2
FEMALE CHILD UNDER 15 YEARS OLD . . . . . . . . . . 3
MALE CHILDUNDER 15 YEARS OLD . . . . . . . . . . 4
OTHER 6(SPECIFY)
HOUSEHOLD CHARACTERISTICS
CODING CATEGORIES
300 | Appendix E
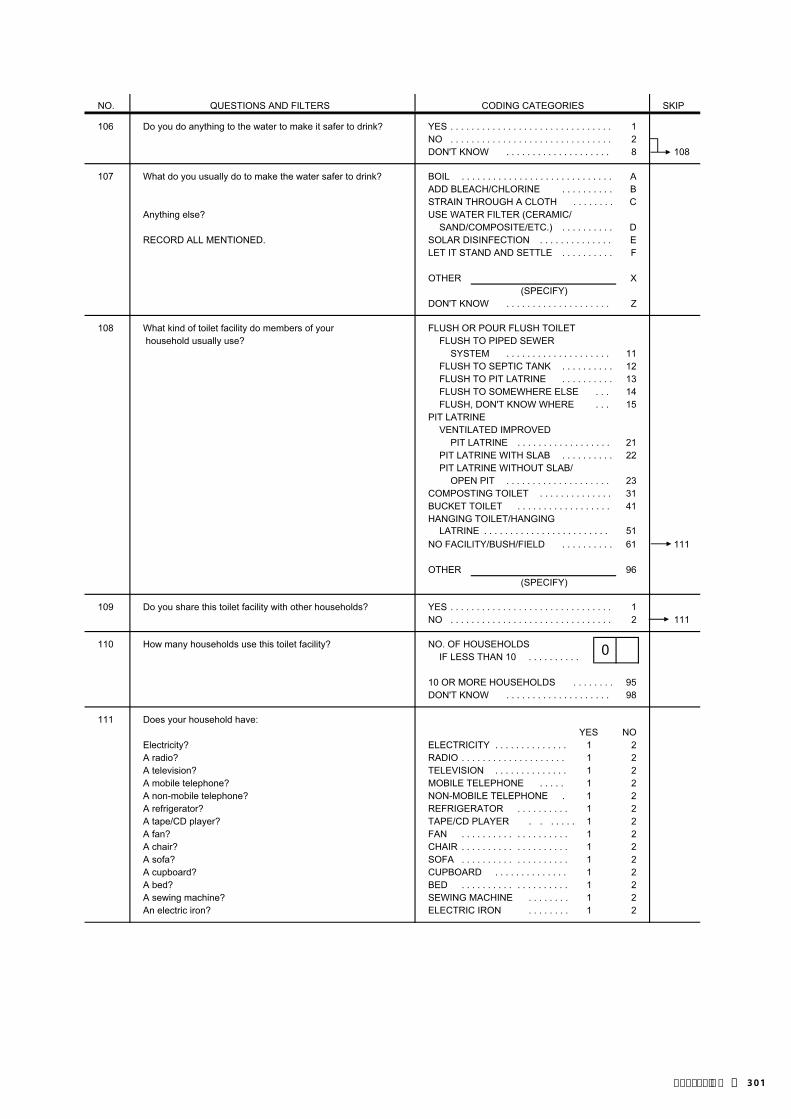
NO. QUESTIONS AND FILTERS SKIPCODING CATEGORIES
106 Do you do anything to the water to make it safer to drink? YES . . . . . . . . . . . . . . . . . . . . . . . . . . . . . . . 1NO . . . . . . . . . . . . . . . . . . . . . . . . . . . . . . . 2DON'T KNOW . . . . . . . . . . . . . . . . . . . . 8 108
107 What do you usually do to make the water safer to drink? BOIL . . . . . . . . . . . . . . . . . . . . . . . . . . . . . AADD BLEACH/CHLORINE . . . . . . . . . . BSTRAIN THROUGH A CLOTH . . . . . . . . C
Anything else? USE WATER FILTER (CERAMIC/SAND/COMPOSITE/ETC.) . . . . . . . . . . D
RECORD ALL MENTIONED. SOLAR DISINFECTION . . . . . . . . . . . . . . ELET IT STAND AND SETTLE . . . . . . . . . . F
OTHER X(SPECIFY)
DON'T KNOW . . . . . . . . . . . . . . . . . . . . Z
108 What kind of toilet facility do members of your FLUSH OR POUR FLUSH TOILET household usually use? FLUSH TO PIPED SEWER
SYSTEM . . . . . . . . . . . . . . . . . . . . 11FLUSH TO SEPTIC TANK . . . . . . . . . . 12FLUSH TO PIT LATRINE . . . . . . . . . . 13FLUSH TO SOMEWHERE ELSE . . . 14FLUSH, DON'T KNOW WHERE . . . 15
PIT LATRINEVENTILATED IMPROVED
PIT LATRINE . . . . . . . . . . . . . . . . . . 21PIT LATRINE WITH SLAB . . . . . . . . . . 22PIT LATRINE WITHOUT SLAB/
OPEN PIT . . . . . . . . . . . . . . . . . . . . 23COMPOSTING TOILET . . . . . . . . . . . . . . 31BUCKET TOILET . . . . . . . . . . . . . . . . . . 41HANGING TOILET/HANGING
LATRINE . . . . . . . . . . . . . . . . . . . . . . . . 51NO FACILITY/BUSH/FIELD . . . . . . . . . . 61 111
OTHER 96(SPECIFY)
109 Do you share this toilet facility with other households? YES . . . . . . . . . . . . . . . . . . . . . . . . . . . . . . . 1NO . . . . . . . . . . . . . . . . . . . . . . . . . . . . . . . 2 111
110 How many households use this toilet facility? NO. OF HOUSEHOLDSIF LESS THAN 10 . . . . . . . . . .
10 OR MORE HOUSEHOLDS . . . . . . . . 95DON'T KNOW . . . . . . . . . . . . . . . . . . . . 98
111 Does your household have: YES NO
Electricity? ELECTRICITY . . . . . . . . . . . . . . 1 2A radio? RADIO . . . . . . . . . . . . . . . . . . . . 1 2A television? TELEVISION . . . . . . . . . . . . . . 1 2A mobile telephone? MOBILE TELEPHONE . . . . . 1 2A non-mobile telephone? NON-MOBILE TELEPHONE . 1 2A refrigerator? REFRIGERATOR . . . . . . . . . . 1 2A tape/CD player? TAPE/CD PLAYER . . . . . . . 1 2A fan? FAN . . . . . . . . . . . . . . . . . . . . 1 2A chair? CHAIR . . . . . . . . . . . . . . . . . . . . 1 2A sofa? SOFA . . . . . . . . . . . . . . . . . . . . 1 2A cupboard? CUPBOARD . . . . . . . . . . . . . . 1 2A bed? BED . . . . . . . . . . . . . . . . . . . . 1 2A sewing machine? SEWING MACHINE . . . . . . . . 1 2An electric iron? ELECTRIC IRON . . . . . . . . 1 2
0
| 301Appendix E

NO. QUESTIONS AND FILTERS SKIPCODING CATEGORIES
112 What type of fuel does your household mainly use ELECTRICITY . . . . . . . . . . . . . . . . . . . . . . 01for cooking? LPG . . . . . . . . . . . . . . . . . . . . . . . . . . . . . 02 115
NATURAL GAS . . . . . . . . . . . . . . . . . . . . 03BIOGAS . . . . . . . . . . . . . . . . . . . . . . . . . . . 04KEROSENE . . . . . . . . . . . . . . . . . . . . . . 05COAL, LIGNITE . . . . . . . . . . . . . . . . . . . . 06CHARCOAL . . . . . . . . . . . . . . . . . . . . . . 07WOOD . . . . . . . . . . . . . . . . . . . . . . . . . . . 08STRAW/SHRUBS/GRASS . . . . . . . . . . . . 09AGRICULTURAL CROP . . . . . . . . . . . . . . 10ANIMAL DUNG . . . . . . . . . . . . . . . . . . . . 11
NO FOOD COOKED IN HOUSEHOLD . . . . . . . . . . . . . . . . . . 95 117
OTHER 96(SPECIFY)
113 In this household, is food cooked on an open fire, an open OPEN FIRE . . . . . . . . . . . . . . . . . . . . . . 1stove or a closed stove? OPEN STOVE . . . . . . . . . . . . . . . . . . . . . . 2
CLOSED STOVE WITH CHIMNEY . . . . . 3115
OTHER 6(SPECIFY)
114 Does this (fire/stove) have a chimney, a hood, or CHIMNEY . . . . . . . . . . . . . . . . . . . . . . . . 1neither of these? HOOD . . . . . . . . . . . . . . . . . . . . . . . . . . . . . 2
NEITHER . . . . . . . . . . . . . . . . . . . . . . . . 3
115 Is the cooking usually done in the house, in a separate IN THE HOUSE . . . . . . . . . . . . . . . . . . . . 1 building, or outdoors? IN A SEPARATE BUILDING . . . . . . . . . . 2
OUTDOORS . . . . . . . . . . . . . . . . . . . . . . 3 117
OTHER 6(SPECIFY)
116 Do you have a separate room which is used as a kitchen? YES . . . . . . . . . . . . . . . . . . . . . . . . . . . . . . . 1NO . . . . . . . . . . . . . . . . . . . . . . . . . . . . . . . 2
117 MAIN MATERIAL OF THE FLOOR. NATURAL FLOOREARTH/SAND . . . . . . . . . . . . . . . . . . 11
RECORD OBSERVATION. DUNG . . . . . . . . . . . . . . . . . . . . . . . . . . . 12RUDIMENTARY FLOOR
WOOD PLANKS . . . . . . . . . . . . . . . . 21PALM/BAMBOO . . . . . . . . . . . . . . . . 22
FINISHED FLOORPARQUET OR POLISHED
WOOD . . . . . . . . . . . . . . . . . . . . . . 31VINYL OR ASPHALT STRIPS . . . . . 32CERAMIC TILES . . . . . . . . . . . . . . . . 33CEMENT . . . . . . . . . . . . . . . . . . . . . . 34CARPET . . . . . . . . . . . . . . . . . . . . . . . . 35
OTHER 96(SPECIFY)
302 | Appendix E
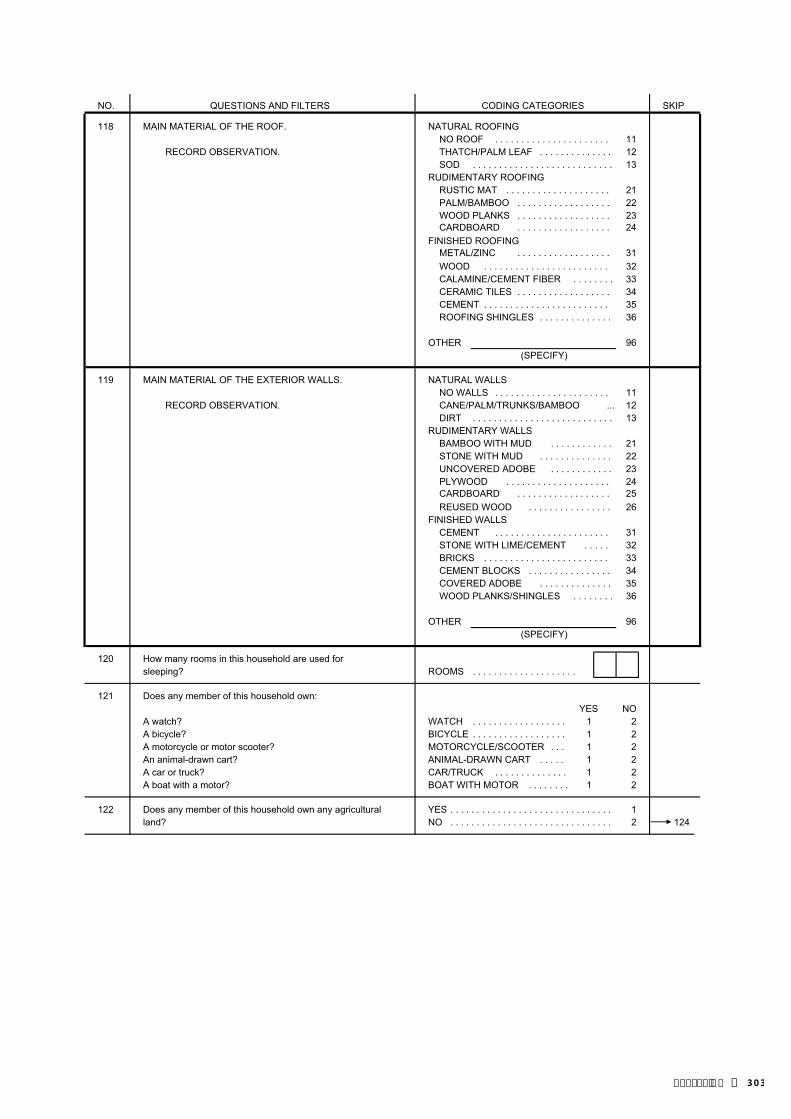
NO. QUESTIONS AND FILTERS SKIPCODING CATEGORIES
118 MAIN MATERIAL OF THE ROOF. NATURAL ROOFINGNO ROOF . . . . . . . . . . . . . . . . . . . . . . 11
RECORD OBSERVATION. THATCH/PALM LEAF . . . . . . . . . . . . . . 12SOD . . . . . . . . . . . . . . . . . . . . . . . . . . . 13
RUDIMENTARY ROOFINGRUSTIC MAT . . . . . . . . . . . . . . . . . . . . 21PALM/BAMBOO . . . . . . . . . . . . . . . . . . 22WOOD PLANKS . . . . . . . . . . . . . . . . . . 23CARDBOARD 24
FINISHED ROOFINGMETAL/ZINC 31WOOD . . . . . . . . . . . . . . . . . . . . . . . . 32CALAMINE/CEMENT FIBER . . . . . . . . 33CERAMIC TILES . . . . . . . . . . . . . . . . . . 34CEMENT . . . . . . . . . . . . . . . . . . . . . . . . 35ROOFING SHINGLES . . . . . . . . . . . . . . 36
OTHER 96(SPECIFY)
119 MAIN MATERIAL OF THE EXTERIOR WALLS. NATURAL WALLSNO WALLS . . . . . . . . . . . . . . . . . . . . . . 11
RECORD OBSERVATION. CANE/PALM/TRUNKS/BAMBOO ... 12DIRT . . . . . . . . . . . . . . . . . . . . . . . . . . . 13
RUDIMENTARY WALLSBAMBOO WITH MUD . . . . . . . . . . . . 21STONE WITH MUD . . . . . . . . . . . . . . 22UNCOVERED ADOBE . . . . . . . . . . . . 23PLYWOOD . . . . . . . . . . . . . . . . . . . . 24CARDBOARD 25REUSED WOOD . . . . . . . . . . . . . . . . 26
FINISHED WALLSCEMENT . . . . . . . . . . . . . . . . . . . . . . 31STONE WITH LIME/CEMENT . . . . . 32BRICKS . . . . . . . . . . . . . . . . . . . . . . . . 33CEMENT BLOCKS . . . . . . . . . . . . . . . . 34COVERED ADOBE . . . . . . . . . . . . . . 35WOOD PLANKS/SHINGLES . . . . . . . . 36
OTHER 96(SPECIFY)
120 How many rooms in this household are used forsleeping? ROOMS . . . . . . . . . . . . . . . . . . . .
121 Does any member of this household own:YES NO
A watch? WATCH . . . . . . . . . . . . . . . . . . 1 2A bicycle? BICYCLE . . . . . . . . . . . . . . . . . . 1 2A motorcycle or motor scooter? MOTORCYCLE/SCOOTER . . . 1 2An animal-drawn cart? ANIMAL-DRAWN CART . . . . . 1 2A car or truck? CAR/TRUCK . . . . . . . . . . . . . . 1 2A boat with a motor? BOAT WITH MOTOR . . . . . . . . 1 2
122 Does any member of this household own any agricultural YES . . . . . . . . . . . . . . . . . . . . . . . . . . . . . . . 1land? NO . . . . . . . . . . . . . . . . . . . . . . . . . . . . . . . 2 124
. . . . . . . . . . . . . . . . . .
. . . . . . . . . . . . . . . . . .
. . . . . . . . . . . . . . . . . .
| 303Appendix E

NO. QUESTIONS AND FILTERS SKIPCODING CATEGORIES
123 How many hectares of agricultural land do membersof this household own? HECTARES . . . . . . . . . . . . . . . .
95 OR MORE HECTARES . . . . . . . . . . . . 95DON'T KNOW . . . . . . . . . . . . . . . . . . . . 98
124 Does this household own any livestock, herds, YES . . . . . . . . . . . . . . . . . . . . . . . . . . . . . . . 1other farm animals, or poultry? NO . . . . . . . . . . . . . . . . . . . . . . . . . . . . . . . 2 126
125 How many of the following animals does this household own?IF NONE, ENTER '00'.IF MORE THAN 95, ENTER '95'.IF UNKNOWN, ENTER '98'.
Buffalo? BUFFALO . . . . . . . . . .
Milk cows or bulls? COWS/BULLS . . . . . . . . . . . . . .
Horses, or donkeys? HORSES/DONKEYS . . .
Goats? GOATS . . . . . . . . . . . . . . . . . . . .
Sheep? SHEEP . . . . . . . . . . . . . . . . . . . .
Pigs? PIGS . . . . . . . . . . . . . . . . . . . .
Chickens? CHICKENS . . . . . . . . . . . . . . . . . .
Ducks? DUCKS . . . . . . . . . . . . . . . . . .
Other? OTHER . . . . . . . . . . . . . . . . . . (SPECIFY)
126 Does any member of this household have a bank account? YES . . . . . . . . . . . . . . . . . . . . . . . . . . . . . . . 1NO . . . . . . . . . . . . . . . . . . . . . . . . . . . . . . . 2
127 Does your household have any mosquito nets that YES . . . . . . . . . . . . . . . . . . . . . . . . . . . . . . . 1can be used while sleeping? NO . . . . . . . . . . . . . . . . . . . . . . . . . . . . . . . 2
128 How many mosquito nets does your household have?NUMBER OF NETS ............................
IF 7 OR MORE NETS, RECORD '7'.
201
304 | Appendix E

129 ASK THE RESPONDENT TO SHOWYOU THE NETS IN THE HOUSEHOLD.
IF MORE THAN 3 NETS, USE OBSERVED . . . . . . . . 1 OBSERVED . . . . . 1 OBSERVED . . . . . 1ADDITIONAL QUESTIONNAIRE(S). NOT OBSERVED . 2 NOT OBSERVED . 2 NOT OBSERVED . 2
130 How many months ago did your MOS MOS MOShousehold obtain the mosquito net? AGO . . . . . AGO . . . . . AGO . . . . .
IF LESS THAN ONE MONTH, 37 OR MORE 37 OR MORE 37 OR MORERECORD '00'. MONTHS AGO . . . . . 95 MONTHS AGO . . . MONTHS AGO . . .
NOT SURE . . . . . . . . . . 98 NOT SURE . . . . . . . 98 NOT SURE . . . . . . . 98
131 OBSERVE OR ASK THE BRAND/ 'PERMANENT' NET 'PERMANENT' NET 'PERMANENT' NETTYPE OF MOSQUITO NET. OLYSET NET …… 11 OLYSET NET .. 11 OLYSET NET .. 11
PERMA NET …… 12 PERMA NET …. 12 PERMA NET …. 12OTHER/DK BRAND . . . . . . . . 16 DK BRAND . . . . . 16 DK BRAND . . . . . 16
'PRETREATED' NET 'PRETREATED' NET 'PRETREATED' NETNO BRAND . . . . . . . . 21 NO BRAND . . . . . 21 NO BRAND . . . . . 21DK BRAND . . . . . . . . 26 DK BRAND . . . . . 26 DK BRAND . . . . . 26
OTHER . . . . . . . . . . . . 31 OTHER . . . . . . . . . 31 OTHER . . . . . . . . . 31DK BRAND . . . . . . . . . . 98 DK BRAND . . . . . . . 98 DK BRAND . . . . . . . 98
135 Did anyone sleep under this mosquito YES . . . . . . . . . . . . . . 1 YES . . . . . . . . . . . 1 YES . . . . . . . . . . . 1net last night? NO . . . . . . . . . . . . . . . . 2 NO . . . . . . . . . . . . . 2 NO . . . . . . . . . . . . . 2
(SKIP TO 137) (SKIP TO 137) (SKIP TO 137) NOT SURE . . . . . . . . . . 8 NOT SURE . . . . . . . 8 NOT SURE . . . . . . . 8
136 Who slept under this mosquito net last night?RECORD THE PERSON'S NAME_____________ NAME_____________ NAME_____________LINE NUMBER FROM THE HOUSEHOLD SCHEDULE. LINE LINE LINE
NO. . . . . . NO. . . . . . NO. . . . . .
NAME_____________ NAME_____________ NAME_____________
LINE LINE LINE NO. . . . . . NO. . . . . . NO. . . . . .
NAME_____________ NAME_____________ NAME_____________
LINE LINE LINE NO. . . . . . NO. . . . . . NO. . . . . .
NAME_____________ NAME_____________ NAME_____________
LINE LINE LINE NO. . . . . . NO. . . . . . NO. . . . . .
NAME_____________ NAME_____________ NAME_____________
LINE LINE LINE NO. . . . . . NO. . . . . . NO. . . . . .
137 GO BACK TO 129 FOR GO BACK TO 129 FOR GO TO 129 IN FIRSTNEXT NET; OR, IF NO NEXT NET; OR, IF NO COLUMN OF A NEWMORE NETS, GO TO 201. MORE NETS, GO TO 201. QUESTIONNAIRE;
OR, IF NO MORENETS, GO TO 201.
NET #1 NET #2
OTHER/ OTHER/
NET #3
95 95
| 305Appendix E

WEIGHT, HEIGHT AND HEMOGLOBIN MEASUREMENT FOR CHILDREN AGE 0-5
201 CHECK COLUMN 11. RECORD THE LINE NUMBER AND AGE FOR ALL ELIGIBLE CHILDREN 0-5 YEARS IN QUESTION 202.IF MORE THAN SIX CHILDREN, USE ADDITIONAL QUESTIONNAIRE(S). A FINAL OUTCOME MUST BE RECORDED FOR THE WEIGHT AND HEIGHT MEASUREMENT IN 208 AND FOR THE ANEMIA PROCEDURE IN 213
CHILD 1 CHILD 2 CHILD 3
202 LINE NUMBER FROM COLUMN 11 LINE LINE LINENUMBER . . . NUMBER . . . NUMBER . . .
NAME FROM COLUMN 2 NAME NAME NAME
203 IF MOTHER INTERVIEWED, COPYMONTH AND YEAR FROM BIRTH DAY . . . . . . . . . DAY . . . . . . . . . DAY . . . . . . . . . HISTORY AND ASK DAY; IF MOTHERNOT INTERVIEWED, ASK: MONTH . . . . . MONTH . . . . . MONTH . . . . . What is (NAME'S) birth date?
YEAR YEAR YEAR
204 CHECK 203: YES . . . . . . . . . . . . . . . . 1 YES . . . . . . . . . . . . . . . . 1 YES . . . . . . . . . . . . . . . . 1CHILD BORN IN JANUARY 2004 OR NO . . . . . . . . . . . . . . . . 2 NO . . . . . . . . . . . . . . . . 2 NO . . . . . . . . . . . . . . . . 2LATER? (GO TO 203 FOR NEXT (GO TO 203 FOR NEXT (GO TO 203 FOR NEXT
CHILD OR, IF NO CHILD OR, IF NO CHILD OR, IF NO MORE, GO TO 215) MORE, GO TO 215) MORE, GO TO 215)
205 WEIGHT IN KILOGRAMSKG. . . . . KG. . . . . KG. . . . .
206 HEIGHT IN CENTIMETERSCM. . CM. . CM. .
207 MEASURED LYING DOWN OR LYING DOWN . . . . . . . 1 LYING DOWN . . . . . . . 1 LYING DOWN . . . . . . . 1STANDING UP? STANDING UP . . . . . . . 2 STANDING UP . . . . . . . 2 STANDING UP . . . . . . . 2
208 RESULT OF WEIGHT AND HEIGHT MEASURED . . . . . . . 1 MEASURED . . . . . . . 1 MEASURED . . . . . . . 1MEASUREMENT NOT PRESENT . . . . . 2 NOT PRESENT . . . . . 2 NOT PRESENT . . . . . 2
REFUSED . . . . . . . . . 3 REFUSED . . . . . . . . . 3 REFUSED . . . . . . . . . 3OTHER . . . . . . . . . . . 6 OTHER . . . . . . . . . . . 6 OTHER . . . . . . . . . . . 6
209 CHECK 203: 0-5 MONTHS . . . . . . . 1 0-5 MONTHS . . . . . . . 1 0-5 MONTHS . . . . . . . 1IS CHILD AGE 0-5 MONTHS, I.E., WAS (GO TO 203 FOR NEXT (GO TO 203 FOR NEXT (GO TO 203 FOR NEXTCHILD BORN IN MONTH OF CHILD OR, IF NO CHILD OR, IF NO CHILD OR, IF NO INTERVIEW OR FIVE PREVIOUS MORE, GO TO 215) MORE, GO TO 215) MORE, GO TO 215)MONTHS? OLDER . . . . . . . . . . . 2 OLDER . . . . . . . . . . . 2 OLDER . . . . . . . . . . . 2
210 LINE NUMBER OF PARENT/OTHER ADULT RESPONSIBLE FOR THE LINE LINE LINECHILD (COLUMN 1) NUMBER . . . NUMBER . . . NUMBER . . . RECORD '00' IF NOT LISTED.
211 READ CONSENT STATEMENT GRANTED 1 GRANTED 1 GRANTED 1TO PARENT/OTHER ADULT RESPONSIBLE FOR CHILD. (SIGN) (SIGN) (SIGN)CIRCLE CODE AND SIGN. REFUSED . . . . . . . . . 2 REFUSED . . . . . . . . . 2 REFUSED . . . . . . . . . 2
(IF REFUSED, GO TO 213) (IF REFUSED, GO TO 213) (IF REFUSED, GO TO 213)
212 RECORD HEMOGLOBIN LEVEL HERE AND IN THE ANEMIA PAMPHLET. G/DL . . G/DL . . G/DL . .
213 RECORD RESULT CODE OF MEASURED . . . . . . . 1 MEASURED . . . . . . . 1 MEASURED . . . . . . . 1HEMOGLOBIN MEASUREMENT NOT PRESENT . . . . . 2 NOT PRESENT . . . . . 2 NOT PRESENT . . . . . 2
REFUSED . . . . . . . . . 3 REFUSED . . . . . . . . . 3 REFUSED . . . . . . . . . 3OTHER . . . . . . . . . . . 6 OTHER . . . . . . . . . . . 6 OTHER . . . . . . . . . . . 6
214 GO BACK TO 203 IN NEXT COLUMN IN THIS QUESTIONNAIRE OR IN THE FIRSTCOLUMN OF THE ADDITIONAL QUESTIONNAIRE(S); IF NO MORE CHILDREN, GO TO 215.
CONSENT STATEMENT FOR ANEMIA FOR CHILDRENAs part of this survey, we are asking people all over the country to take an anemia test. Anemia is a serious health problem that usually results from poor nutrition, infection, or chronic disease. This survey will assist the government to develop programs to prevent and treat anemia.
We request that all children born in January 2004 or later participate in the anemia testing part of this survey and give a few drops of blood from a finger. The equipment used in taking the blood is clean and completely safe. It has never been used before and will be thrown away after each test.
The blood will be tested for anemia immediately, and the result told to you right away. The result will be kept strictly confidentialand will not be shared with anyone other than members of our survey team.
Do you have any questions?
You can say yes to the test, or you can say no. It is up to you to decide. Will you allow (NAME(S) OF CHILD(REN) to participate in the anemia test?
306 | Appendix E

WEIGHT, HEIGHT AND HEMOGLOBIN MEASUREMENT FOR CHILDREN AGE 0-5
CHILD 4 CHILD 5 CHILD 6
202 LINE NUMBER FROM COLUMN 11 LINE LINE LINENUMBER . . . NUMBER . . . NUMBER . . .
NAME FROM COLUMN 2 NAME NAME NAME
203 IF MOTHER INTERVIEWED, COPYMONTH AND YEAR FROM BIRTH DAY . . . . . . . . . DAY . . . . . . . . . DAY . . . . . . . . . HISTORY AND ASK DAY; IF MOTHERNOT INTERVIEWED, ASK: MONTH . . . . . MONTH . . . . . MONTH . . . . . What is (NAME'S) birth date?
YEAR YEAR YEAR
204 CHECK 203: YES . . . . . . . . . . . . . . . . 1 YES . . . . . . . . . . . . . . . . 1 YES . . . . . . . . . . . . . . . . 1CHILD BORN IN JANUARY 2004 OR NO . . . . . . . . . . . . . . . . 2 NO . . . . . . . . . . . . . . . . 2 NO . . . . . . . . . . . . . . . . 2LATER (GO TO 203 FOR NEXT (GO TO 203 FOR NEXT (GO TO 203 FOR NEXT
CHILD OR, IF NO CHILD OR, IF NO CHILD OR, IF NO MORE, GO TO 215) MORE, GO TO 215) MORE, GO TO 215)
205 WEIGHT IN KILOGRAMSKG. . . . . KG. . . . . KG. . . . .
206 HEIGHT IN CENTIMETERSCM. . CM. . CM. .
207 MEASURED LYING DOWN OR LYING DOWN . . . . . . . 1 LYING DOWN . . . . . . . 1 LYING DOWN . . . . . . . 1STANDING UP? STANDING UP . . . . . . . 2 STANDING UP . . . . . . . 2 STANDING UP . . . . . . . 2
208 RESULT OF WEIGHT AND HEIGHT MEASURED . . . . . . . 1 MEASURED . . . . . . . 1 MEASURED . . . . . . . 1MEASUREMENT NOT PRESENT . . . . . 2 NOT PRESENT . . . . . 2 NOT PRESENT . . . . . 2
REFUSED . . . . . . . . . 3 REFUSED . . . . . . . . . 3 REFUSED . . . . . . . . . 3OTHER . . . . . . . . . . . 6 OTHER . . . . . . . . . . . 6 OTHER . . . . . . . . . . . 6
209 CHECK 203: 0-5 MONTHS . . . . . . . 1 0-5 MONTHS . . . . . . . 1 0-5 MONTHS . . . . . . . 1IS CHILD AGE 0-5 MONTHS, I.E., WAS (GO TO 203 FOR NEXT (GO TO 203 FOR NEXT (GO TO 203 FOR NEXTCHILD BORN IN MONTH OF CHILD OR, IF NO CHILD OR, IF NO CHILD OR, IF NO INTERVIEW OR FIVE PREVIOUS MORE, GO TO 215) MORE, GO TO 215) MORE, GO TO 215)MONTHS? OLDER . . . . . . . . . . . 2 OLDER . . . . . . . . . . . 2 OLDER . . . . . . . . . . . 2
210 LINE NUMBER OF PARENT/OTHER ADULT RESPONSIBLE FOR THE LINE LINE LINECHILD (COLUMN 1) NUMBER . . . NUMBER . . . NUMBER . . . RECORD '00' IF NOT LISTED.
211 READ CONSENT STATEMENT GRANTED . . . . . . . . 1 GRANTED . . . . . . . . 1 GRANTED . . . . . . . . 1TO PARENT/OTHER ADULT RESPONSIBLE FOR CHILD. (SIGN) (SIGN) (SIGN)CIRCLE CODE AND SIGN. REFUSED . . . . . . . . . 2 REFUSED . . . . . . . . . 2 REFUSED . . . . . . . . . 2
(IF REFUSED, GO TO 213) (IF REFUSED, GO TO 213) (IF REFUSED, GO TO 213)
212 RECORD HEMOGLOBIN LEVEL HERE AND IN THE ANEMIA PAMPHLET G/DL . . G/DL . . G/DL . .
213 RECORD RESULT CODE OF MEASURED . . . . . . . 1 MEASURED . . . . . . . 1 MEASURED . . . . . . . 1HEMOGLOBIN MEASUREMENT. NOT PRESENT . . . . . 2 NOT PRESENT . . . . . 2 NOT PRESENT . . . . . 2
REFUSED . . . . . . . . . 3 REFUSED . . . . . . . . . 3 REFUSED . . . . . . . . . 3OTHER . . . . . . . . . . . 6 OTHER . . . . . . . . . . . 6 OTHER . . . . . . . . . . . 6
214 GO BACK TO 203 IN NEXT COLUMN IN THIS QUESTIONNAIRE OR IN THE FIRSTCOLUMN OF ADDITIONAL QUESTIONNAIRE(S); IF NO MORE CHILDREN,GO TO 215.
| 307Appendix E

WEIGHT, HEIGHT, AND HEMOGLOBIN MEASUREMENT FOR WOMEN AGE 15-49
215 CHECK COLUMN 9. RECORD THE LINE NUMBER AND NAME FOR ALL ELIGIBLE WOMEN IN 216.IF THERE ARE MORE THAN THREE WOMEN, USE ADDITIONAL QUESTIONNAIRE(S).
A FINAL OUTCOME MUST BE RECORDED FOR THE WEIGHT AND HEIGHT MEASUREMENT IN 219, FOR THE ANEMIA TEST PROCEDURE IN 228.
WOMAN 1 WOMAN 2 WOMAN 3
216 LINE NUMBER LINE LINE LINE(COLUMN 9) NUMBER . . . . . . . . . NUMBER . . . . . . . . . . . NUMBER . . . . . . . . . . .
NAME(COLUMN 2) NAME NAME NAME
217 WEIGHT IN KILOGRAMS KG. . . . . . . . . KG. . . . . . . KG. . . . . . .
218 HEIGHT IN CENTIMETERS CM. . . . . . . . . CM. . . . . . . CM. . . . . . .
219 RESULT OF MEASURED . . . . . . . . . . . . . . . . . . 1 MEASURED . . . . . . . . . . . . . . . . . . 1 MEASURED . . . . . . . . . . . . . . . . . 1WEIGHT NOT PRESENT . . . . . . . . . . . . . . . . 2 NOT PRESENT . . . . . . . . . . . . . . . . 2 NOT PRESENT . . . . . . . . . . . . . . . 2AND HEIGHT REFUSED . . . . . . . . . . . . . . . . . . . . 3 REFUSED . . . . . . . . . . . . . . . . . . . . 3 REFUSED . . . . . . . . . . . . . . . . . . . 3MEASUREMENT OTHER . . . . . . . . . . . . . . . . . . . . . . 6 OTHER . . . . . . . . . . . . . . . . . . . . . 6 OTHER . . . . . . . . . . . . . . . . . . . . . 6
220 AGE: CHECK 15-17 YEARS . . . . . . . . . . . . . . . . 1 15-17 YEARS . . . . . . . . . . . . . . . . 1 15-17 YEARS . . . . . . . . . . . . . . . . . 1COLUMN 7. 18-49 YEARS . . . . . . . . . . . . . . . . 2 18-49 YEARS . . . . . . . . . . . . . . . . 2 18-49 YEARS . . . . . . . . . . . . . . . . . 2
(GO TO 223) (GO TO 223) (GO TO 223)
221 MARITAL STATUS: CODE 4 (NEVER IN UNION . . . . . 1 CODE 4 (NEVER IN UNION. . . . . 1 CODE 4 (NEVER IN UNION. . . . . . . 1 CHECK COLUMN 8. OTHER . . . . . . . . . . . . . . . . . . . . 2 OTHER . . . . . . . . . . . . . . . . . . . 2 OTHER . . . . . . . . . . . . . . . . . . . . . 2
(GO TO 223) (GO TO 223) (GO TO 223)
222 RECORD LINENUMBER OF PARENT/OTHERADULT RESPON-SIBLE FOR LINE NUMBER OF LINE NUMBER OF LINE NUMBER OFADOLESCENT. PARENT OR OTHER PARENT OR OTHER PARENT OR OTHERRECORD '00' RESPONSIBLE ADULT . RESPONSIBLE ADULT . RESPONSIBLE ADULT . IF NOT LISTED.
223 READ ANEMIA GRANTED . . . . . . . . . . . . . . . . . . 1 GRANTED . . . . . . . . . . . . . . . . . . 1 GRANTED . . . . . . . . . . . . . . . . . 1TEST CONSENT PARENT/OTHER RESPONSIBLE PARENT/OTHER RESPONSIBLE PARENT/OTHER RESPONSIBLESTATEMENT. FOR ADULT REFUSED . . . . . . . . . . . 2 ADULT REFUSED. . . . . . . . . . . 2 ADULT REFUSED . . . . . . . . . . . 2NEVER-IN-UNION RESPONDENT RESPONDENT RESPONDENT WOMEN REFUSED . . . . . . . . . . . . . . . . . . 3 REFUSED. . . . . . . . . . . . . . . . . . 3 REFUSED . . . . . . . . . . . . . . . . . 3AGE 15-17, ASKCONSENT FROMPARENT/OTHER (SIGN) (SIGN) (SIGN)ADULT IDENTIFIEDIN 222 BEFORE (IF REFUSED, GO TO 228). (IF REFUSED, GO TO 228). (IF REFUSED, GO TO 228).ASKING RESPON-DENT'S CONSENT.
CONSENT STATEMENT FOR ANEMIA TEST READ CONSENT STATEMENT TO EACH RESPONDENT. CIRCLE CODE '1' IN 223 IF RESPONDENT CONSENTS TO THE ANEMIA TEST AND CODE '3' IF SHE REFUSES.
FOR NEVER-IN-UNION WOMEN AGE 15-17, ASK CONSENT FROM THE PARENT OR OTHER ADULT IDENTIFIED AS RESPONSIBLE FOR THE ADOLESCENT (SEE QUESTION 222) BEFORE ASKING THE ADOLESCENT FOR HER CONSENT. CIRCLE CODE '2' IN 223 IF THE PARENT (OTHER ADULT) REFUSES. CONDUCT THE TEST ONLY IF BOTH THE PARENT (OTHER ADULT) AND THE ADOLESCENT CONSENT.
As part of this survey, we are asking people all over the country to take an anemia test. Anemia is a serious health problem that usually results from poor nutrition, infection, or chronic disease. This survey will assist the government to develop programs to prevent and treat anemia.
For the anemia testing, we will need a few drops of blood from a finger. The equipment used in taking the blood is clean and completely safe.It has never been used before and will be thrown away after each test.
The blood will be tested for anemia immediately, and the result told to you right away. The result will be kept strictly confidentialand will not be shared with anyone other than members of our survey team.
Do you have any questions?
You can say yes to the test, or you can say no. It is up to you to decide. Will you (allow NAME OF ADOLESCENT to) take the anemia test?
308 | Appendix E

WOMAN 1 WOMAN 2 WOMAN 3
224 LINE NUMBER LINE LINE LINE(COLUMN 9) NUMBER . . . . . . . . . NUMBER . . . . . . . . . . . NUMBER . . . . . . . . . . .
NAME(COLUMN 2) NAME NAME NAME
225 PREGNANCY STATUS: CHECK
226 IN WOMAN'S YES . . . . . . . . . . . . . . . . . . . . . . . . . . 1 YES . . . . . . . . . . . . . . . . . . . . . . . . . 1 YES . . . . . . . . . . . . . . . . . . . . . . . . . 1QUESTIONNAIRE NO . . . . . . . . . . . . . . . . . . . . . . . . . . 2 NO . . . . . . . . . . . . . . . . . . . . . . . . . 2 NO . . . . . . . . . . . . . . . . . . . . . . . . . 2OR ASK: DK . . . . . . . . . . . . . . . . . . . . . . . . . . 8 DK . . . . . . . . . . . . . . . . . . . . . . . . . 8 DK . . . . . . . . . . . . . . . . . . . . . . . . . 8Are you pregnant?
226 CHECK 223 AND PREPARE EQUIPMENT AND SUPPLIES FOR THE ANIMIA TEST OBTAINED AND PROCEED WITH THE TEST.
A FINAL OUTCOME FOR THE THE ANEMIA TEST PROCEDURE MUST BE RECORDED IN 228 FOR EACH ELIGIBLE WOMAN EVEN IF SHE WAS NOT PRESENT, REFUSED, OR COULD NOT BE TESTED FOR SOME OTHER REASON.
227 RECORD HEMO-GLOBIN LEVEL G/DL . . . . . . . . . . G/DL . . . . . . . . . . G/DL . . . . . . . . . .HERE AND IN ANEMIA PAMPHLET
228 RECORD RESULT MEASURED . . . . . . . . . . . . . . . . . . 1 MEASURED . . . . . . . . . . . . . . . . . . 1 MEASURED . . . . . . . . . . . . . . . . . 1CODE OF HEMO- NOT PRESENT . . . . . . . . . . . . . . . . 2 NOT PRESENT . . . . . . . . . . . . . . . . 2 NOT PRESENT . . . . . . . . . . . . . . . 2GLOBIN MEASURE- REFUSED . . . . . . . . . . . . . . . . . . . . 3 REFUSED . . . . . . . . . . . . . . . . . . . . 3 REFUSED . . . . . . . . . . . . . . . . . . . 3MENT. OTHER . . . . . . . . . . . . . . . . . . . . . . 6 OTHER . . . . . . . . . . . . . . . . . . . . . 6 OTHER . . . . . . . . . . . . . . . . . . . . . 6
229 GO BACK TO 217 IN NEXT COLUMN IN THIS QUESTIONNAIRE OR IN THE FIRST COLUMNS OF ADDITIONAL QUESTIONNAIRE(S); IF NO MOREWOMEN, END HERE.
| 309Appendix E

310 | Appendix E

20 July 2009TIMOR-LESTE DEMOGRAPHIC AND HEALTH SURVEY (TLDHS)
WOMAN'S QUESTIONNAIRE
IDENTIFICATION
NAME AND CODE OF DISTRICT
NEW SUCO NAME AND NUMBER
CLUSTER NUMBER . . . . . . . . . . . . . . . . . . . . . . . . . . . . . . . . . . . . . . . . . . . . . . . . . . . . . . . . . . . . .
LOCATION ID NUMBER . . . . . . . . . . . . . . . . . . . . . . . . . . . . . . . . . . . . . . . . . . . . . . . . . . .
URBAN/RURAL . . . . . . . . . . . . . . . . . . . . . . . . . . . . . . . . . . . . . . . . . . . . . . . . . . . . . . . . . . . . . . (URBAN=1, RURAL=2)
NAME OF HOUSEHOLD HEAD
NAME AND LINE NUMBER OF WOMAN
WOMAN SELECTED FOR DOMESTIC VIOLENCE MODULE . . . . . . . . . . . . . . . . . . . . . . . . (YES=1; NO=2)
INTERVIEWER VISITS
FINAL VISIT
DATE DAY
MONTH
YEARINTERVIEWER'SNAME INT. NUMBER
RESULT* RESULT
NEXT VISIT: DATETOTAL NUMBER
TIME OF VISITS
*RESULT CODES:1 COMPLETED 4 REFUSED2 NOT AT HOME 5 PARTLY COMPLETED 7 OTHER3 POSTPONED 6 INCAPACITATED (SPECIFY)
LANGUAGE OF QUESTIONNAIRE
LANGUAGE OF INTERVIEW
NATIVE LANGUAGE OF RESPONDENT
TRANSLATOR USED (YES=1; NO=2)
LANGUAGE CODES: TETUM=1; BAHASA=2; PORTUGESE=3; OTHER=4
SUPERVISOR FIELD EDITOR
NAME NAME
DATE DATE
NATIONAL STATISTICS DIRECTORATE (NSD) AND MINISTRY OF HEALTH
EDITOROFFICE KEYED BY
1 2 3
| 311Appendix E

SECTION 1. RESPONDENT'S BACKGROUND
INTRODUCTION AND CONSENT
INFORMED CONSENT
Hello. My name is _______________________________________ and I am working with NATIONAL STATISTICS DIRECTORATE. We are conducting a national survey that asks women (and men) about various health issues. We would very much appreciate your participation in this survey. This information will help the government to plan health services. The survey usually takesabout 60 minutes to complete. Whatever information you provide will be kept strictly confidential and willnot be shared with anyone other than members of our survey team.
Participation in this survey is voluntary, and if we should come to any question you don't want to answer, just let me know andI will go on to the next question; or you can stop the interview at any time. However, we hope that you will participate in this survey since your views are important.At this time, do you want to ask me anything about the survey?May I begin the interview now?
Signature of interviewer: Date:
RESPONDENT AGREES TO BE INTERVIEWED . . . . . 1 RESPONDENT DOES NOT AGREE TO BE INTERVIEWED . . . 2 END
NO. QUESTIONS AND FILTERS CODING CATEGORIES SKIP
101 RECORD THE TIME.HOUR . . . . . . . . . . . . . . . . . . . .
MINUTES . . . . . . . . . . . . . . . . .
102 How long have you been living continuously in (NAME OFCURRENT PLACE OF RESIDENCE)? YEARS . . . . . . . . . . . . . . . . . .
IF LESS THAN ONE YEAR, RECORD '00' YEARS. ALWAYS . . . . . . . . . . . . . . . . . . . . . . 95VISITOR . . . . . . . . . . . . . . . . . . . . . . 96 106
103 Just before you moved here, did you live in a city, in a town, or in CITY . . . . . . . . . . . . . . . . . . . . . . . . . . . 1the countryside? TOWN . . . . . . . . . . . . . . . . . . . . . . . . . . . 2
COUNTRYSIDE . . . . . . . . . . . . . . . . . . 3
106 In what month and year were you born?MONTH . . . . . . . . . . . . . . . . . .
DON'T KNOW MONTH . . . . . . . . . . . . 98
YEAR . . . . . . . . . . . .
DON'T KNOW YEAR . . . . . . . . . . . . 9998
107 How old were you at your last birthday?AGE IN COMPLETED YEARS
COMPARE AND CORRECT 106 AND/OR 107 IF INCONSISTENT.
108 Have you ever attended school? YES . . . . . . . . . . . . . . . . . . . . . . . . . . . . . 1NO . . . . . . . . . . . . . . . . . . . . . . . . . . . . . 2 112
109 What is the highest level of school you attended: PRIMARY . . . . . . . . . . . . . . . . . . . . . . 1primary, pre-secondary, secondary, or higher? PRE-SECONDARY . . . . . . . . . . . . . . 2
SECONDARY . . . . . . . . . . . . . . . . . . . . 3HIGHER . . . . . . . . . . . . . . . . . . . . . . . . . 4
110 What is the highest (grade) you completed at thatlevel? GRADE . . . . . . . .
312 | Appendix E

NO. QUESTIONS AND FILTERS CODING CATEGORIES SKIP
111 CHECK 109:
PRIMARY PRE-SECONDARYOR HIGHER 115
112 Now I would like you to read this sentence to me. CANNOT READ AT ALL . . . . . . . . . . . . 1ABLE TO READ ONLY PARTS OF
SHOW CARD TO RESPONDENT. SENTENCE . . . . . . . . . . . . . . . . . . . . 2ABLE TO READ WHOLE SENTENCE. . 3
IF RESPONDENT CANNOT READ WHOLE SENTENCE, PROBE: NO CARD WITH REQUIREDCan you read any part of the sentence to me? LANGUAGE 4
(SPECIFY LANGUAGE)BLIND/VISUALLY IMPAIRED . . . . . . . 5
113 Have you ever participated in a literacy program or any otherprogram that involves learning to read or write (not including YES . . . . . . . . . . . . . . . . . . . . . . . . . . . . . 1primary school)? NO . . . . . . . . . . . . . . . . . . . . . . . . . . . . . 2
114 CHECK 112:
CODE '2', '3' CODE '1' OR '5'OR '4' CIRCLED 116
CIRCLED
115 Do you read a newspaper or magazine almost every day, at least ALMOST EVERY DAY . . . . . . . . . . . . . . 1once a week, less than once a week or not at all? AT LEAST ONCE A WEEK . . . . . . . . . . 2
LESS THAN ONCE A WEEK . . . . . . . . 3NOT AT ALL . . . . . . . . . . . . . . . . . . . . 4
116 Do you listen to the radio almost every day, at least once a week, ALMOST EVERY DAY . . . . . . . . . . . . . . 1less than once a week or not at all? AT LEAST ONCE A WEEK . . . . . . . . . . 2
LESS THAN ONCE A WEEK . . . . . . . . 3NOT AT ALL . . . . . . . . . . . . . . . . . . . . 4
117 Do you watch television almost every day, at least once a week, ALMOST EVERY DAY . . . . . . . . . . . . . . 1less than once a week or not at all? AT LEAST ONCE A WEEK . . . . . . . . . . 2
LESS THAN ONCE A WEEK . . . . . . . . 3NOT AT ALL . . . . . . . . . . . . . . . . . . . . 4
118 What is your religion? ROMAN CATHOLIC . . . . . . . . . . . . . . 1MUSLIM . . . . . . . . . . . . . . . . . . . . . . 2PROTESTANT . . . . . . . . . . . . . . . . . . 3HINDU . . . . . . . . . . . . . . . . . . . . . . . . . 4
OTHER 6(SPECIFY)(SPECIFY)
| 313Appendix E

SECTION 2. REPRODUCTION
NO. QUESTIONS AND FILTERS CODING CATEGORIES SKIP
201 Now I would like to ask about all the births you have had during YES . . . . . . . . . . . . . . . . . . . . . . . . . . . . . 1your life. Have you ever given birth? NO . . . . . . . . . . . . . . . . . . . . . . . . . . . . . 2 206
202 Do you have any sons or daughters to whom you have given YES . . . . . . . . . . . . . . . . . . . . . . . . . . . . . 1birth who are now living with you? NO . . . . . . . . . . . . . . . . . . . . . . . . . . . . . 2 204
203 How many sons live with you? SONS AT HOME . . . . . . . . . . . .
And how many daughters live with you? DAUGHTERS AT HOME . . . . .
IF NONE, RECORD '00'.
204 Do you have any sons or daughters to whom you have given YES . . . . . . . . . . . . . . . . . . . . . . . . . . . . . 1birth who are alive but do not live with you? NO . . . . . . . . . . . . . . . . . . . . . . . . . . . . . 2 206
205 How many sons are alive but do not live with you? SONS ELSEWHERE . . . . . . . .
And how many daughters are alive but do not live with you? DAUGHTERS ELSEWHERE .
IF NONE, RECORD '00'.
206 Have you ever given birth to a boy or girl who was born alivebut later died?
YES . . . . . . . . . . . . . . . . . . . . . . . . . . . . . 1IF NO, PROBE: Any baby who cried or showed signs of life but NO . . . . . . . . . . . . . . . . . . . . . . . . . . . . . 2 208
did not survive?
207 How many boys have died? BOYS DEAD . . . . . . . . . . . . . .
And how many girls have died? GIRLS DEAD . . . . . . . . . . . . . .
IF NONE, RECORD '00'.
208 SUM ANSWERS TO 203, 205, AND 207, AND ENTER TOTAL.IF NONE, RECORD '00'. TOTAL . . . . . . . . . . . . . . . . . . . .
209 CHECK 208:
Just to make sure that I have this right: you have had in TOTAL_____ births during your life. Is that correct?
PROBE ANDYES NO CORRECT
201-208 ASNECESSARY.
210 CHECK 208:
ONE OR MORE NO BIRTHSBIRTHS 226
314 | Appendix E

211 Now I would like to record the names of all your births, whether still alive or not, starting with the first one you had.RECORD NAMES OF ALL THE BIRTHS IN 212. RECORD TWINS AND TRIPLETS ON SEPARATE LINES.(IF THERE ARE MORE THAN 12 BIRTHS, USE AN ADDITIONAL QUESTIONNAIRE, STARTING WITH THE SECOND ROW).
IF ALIVE: IF ALIVE: IF ALIVE: IF DEAD:
What name Were Is In what month Is How old was Is (NAME) RECORD How old was (NAME) Were therewas given to any of (NAME) and year was (NAME) (NAME) at living with HOUSE- when he/she died? any otheryour these a boy or (NAME) born? still his/her last you? HOLD LINE live births(first/next) births a girl? alive? birthday? NUMBER OF IF '1 YR', PROBE: betweenbaby? twins? PROBE: CHILD How many months old (NAME OF
What is his/her RECORD (RECORD '00' was (NAME)? PREVIOUSbirthday? AGE IN IF CHILD NOT RECORD DAYS IF BIRTH) and
COM- LISTED IN LESS THAN 1 (NAME),PLETED HOUSE- MONTH; MONTHS IF includingYEARS. HOLD). LESS THAN TWO any children
YEARS; OR YEARS. who diedafter birth?
01 MONTH LINE NUMBER DAYS . . . 1SING 1 BOY 1 YES . . 1 YES . . . 1
YEAR MONTHS 2MULT 2 GIRL 2 NO . . . 2 NO . . . . 2
(NEXT BIRTH) YEARS . . 3220
02 MONTH LINE NUMBER DAYS . . . 1 YES . . . . 1SING 1 BOY 1 YES . . 1 YES . . . 1 ADD
YEAR MONTHS 2 BIRTHMULT 2 GIRL 2 NO . . . 2 NO . . . . 2 NO . . . . . 2
(GO TO 221) YEARS . . 3 NEXT220 BIRTH
03 MONTH LINE NUMBER DAYS . . . 1 YES . . . . 1SING 1 BOY 1 YES . . 1 YES . . . 1 ADD
YEAR MONTHS 2 BIRTHMULT 2 GIRL 2 NO . . . 2 NO . . . . 2 NO . . . . . 2
(GO TO 221) YEARS . . 3 NEXT220 BIRTH
04 MONTH LINE NUMBER DAYS . . . 1 YES . . . . 1SING 1 BOY 1 YES . . 1 YES . . . 1 ADD
YEAR MONTHS 2 BIRTHMULT 2 GIRL 2 NO . . . 2 NO . . . . 2 NO . . . . . 2
(GO TO 221) YEARS . . 3 NEXT220 BIRTH
05 MONTH LINE NUMBER DAYS . . . 1 YES . . . . 1SING 1 BOY 1 YES . . 1 YES . . . 1 ADD
YEAR MONTHS 2 BIRTHMULT 2 GIRL 2 NO . . . 2 NO . . . . 2 NO . . . . . 2
(GO TO 221) YEARS . . 3 NEXT220 BIRTH
06 MONTH LINE NUMBER DAYS . . . 1 YES . . . . 1SING 1 BOY 1 YES . . 1 YES . . . 1 ADD
YEAR MONTHS 2 BIRTHMULT 2 GIRL 2 NO . . . 2 NO . . . . 2 NO . . . . . 2
(GO TO 221) YEARS . . 3 NEXT220 BIRTH
07 MONTH LINE NUMBER DAYS . . . 1 YES . . . . 1SING 1 BOY 1 YES . . 1 YES . . . 1 ADD
YEAR MONTHS 2 BIRTHMULT 2 GIRL 2 NO . . . 2 NO . . . . 2 NO . . . . . 2
(GO TO 221) YEARS . . 3 NEXT220 BIRTH
220 221218 219214 215 216 217
AGE INYEARS
AGE INYEARS
AGE INYEARS
AGE INYEARS
AGE INYEARS
212 213
(NAME)
AGE INYEARS
AGE INYEARS
| 315Appendix E

IF ALIVE: IF ALIVE: IF ALIVE: IF DEAD:
What name Were Is In what month Is How old was Is (NAME) RECORD How old was (NAME) Were therewas given to any of (NAME) and year was (NAME) (NAME) at living with HOUSE- when he/she died? any otheryour next these a boy or (NAME) born? still his/her last you? HOLD LINE live birthsbaby? births a girl? alive? birthday? NUMBER OF IF '1 YR', PROBE: between
twins? PROBE: CHILD How many months old (NAME OFWhat is his/her RECORD (RECORD '00' was (NAME)? PREVIOUSbirthday? AGE IN IF CHILD NOT RECORD DAYS IF BIRTH) and
COM- LISTED IN LESS THAN 1 (NAME),PLETED HOUSE- MONTH; MONTHS IF includingYEARS. HOLD). LESS THAN TWO any children
YEARS; OR YEARS. who diedafter birth?
08 MONTH LINE NUMBER DAYS . . . 1 YES . . . . 1SING 1 BOY 1 YES . . 1 YES . . . 1 ADD
YEAR MONTHS 2 BIRTHMULT 2 GIRL 2 NO . . . 2 NO . . . . 2 NO . . . . . 2
(GO TO 221) YEARS . . 3 NEXT220 BIRTH
09 MONTH LINE NUMBER DAYS . . . 1 YES . . . . 1SING 1 BOY 1 YES . . 1 YES . . . 1 ADD
YEAR MONTHS 2 BIRTHMULT 2 GIRL 2 NO . . . 2 NO . . . . 2 NO . . . . . 2
(GO TO 221) YEARS . . 3 NEXT220 BIRTH
10 MONTH LINE NUMBER DAYS . . . 1 YES . . . . 1SING 1 BOY 1 YES . . 1 YES . . . 1 ADD
YEAR MONTHS 2 BIRTHMULT 2 GIRL 2 NO . . . 2 NO . . . . 2 NO . . . . . 2
(GO TO 221) YEARS . . 3 NEXT220 BIRTH
11 MONTH LINE NUMBER DAYS . . . 1 YES . . . . 1SING 1 BOY 1 YES . . 1 YES . . . 1 ADD
YEAR MONTHS 2 BIRTHMULT 2 GIRL 2 NO . . . 2 NO . . . . 2 NO . . . . . 2
(GO TO 221) YEARS . . 3 NEXT220 BIRTH
12 MONTH LINE NUMBER DAYS . . . 1 YES . . . . 1SING 1 BOY 1 YES . . 1 YES . . . 1 ADD
YEAR MONTHS 2 BIRTHMULT 2 GIRL 2 NO . . . 2 NO . . . . 2 NO . . . . . 2
(GO TO 221) YEARS . . 3 NEXT220 BIRTH
222 Have you had any live births since the birth of (NAME OF LAST YES . . . . . . . . . . . . . . . . . . . . . . . . . . . . . . . . . . . . . . . . . . . . 1BIRTH)? IF YES, RECORD BIRTH(S) IN TABLE. NO . . . . . . . . . . . . . . . . . . . . . . . . . . . . . . . . . . . . . . . . . . . . . . 2
223 COMPARE 208 WITH NUMBER OF BIRTHS IN HISTORY ABOVE AND MARK:
NUMBERS NUMBERS AREARE SAME DIFFERENT (PROBE AND RECONCILE)
CHECK: FOR EACH BIRTH: YEAR OF BIRTH IS RECORDED.
FOR EACH BIRTH SINCE JANUARY 2004: MONTH AND YEAR OF BIRTH ARE RECORDED.
FOR EACH LIVING CHILD: CURRENT AGE IS RECORDED.
FOR EACH DEAD CHILD: AGE AT DEATH IS RECORDED.
FOR AGE AT DEATH 12 MONTHS OR 1 YEAR: PROBE TO DETERMINE EXACTNUMBER OF MONTHS.
224 CHECK 215 AND ENTER THE NUMBER OF BIRTHS IN JANUARY 2004 OR LATER.IF NONE, RECORD '0' AND SKIP TO 226.
221220217216 218 219215214213212
AGE INYEARS
(NAME)
AGE INYEARS
YEARS
AGE IN
AGE IN
AGE IN
YEARS
YEARS
316 | Appendix E

NO. QUESTIONS AND FILTERS CODING CATEGORIES SKIP
225 FOR EACH BIRTH SINCE JANUARY 2004, ENTER 'B' IN THE MONTH OF BIRTH IN THECALENDAR. WRITE THE NAME OF THE CHILD TO THE LEFT OF THE 'B' CODE. FOR EACH BIRTH,ASK THE NUMBER OF MONTHS THE PREGNANCY LASTED AND RECORD 'P' IN EACH OF THEPRECEDING MONTHS ACCORDING TO THE DURATION OF PREGNANCY. (NOTE: THE NUMBER OF 'P's MUST BE ONE LESS THAN THE NUMBER OF MONTHS THAT THE PREGNANCY LASTED.)
226 Are you pregnant now? YES . . . . . . . . . . . . . . . . . . . . . . . . . . . . . 1NO . . . . . . . . . . . . . . . . . . . . . . . . . . . . . 2UNSURE . . . . . . . . . . . . . . . . . . . . . . . . 8 229
227 How many months pregnant are you?MONTHS . . . . . . . . . . . . . . . . . .
RECORD NUMBER OF COMPLETED MONTHS.ENTER 'P's IN THE CALENDAR, BEGINNING WITH THE MONTH OF INTERVIEW AND FOR THE TOTAL NUMBEROF COMPLETED MONTHS.
228 At the time you became pregnant, did you want to become THEN . . . . . . . . . . . . . . . . . . . . . . . . . . . 1pregnant then, did you want to wait until later, or did you not want LATER . . . . . . . . . . . . . . . . . . . . . . . . . . . 2to have any (more) children at all? NOT AT ALL . . . . . . . . . . . . . . . . . . . . . . 3
229 Have you ever had a pregnancy that miscarried, was aborted, or YES . . . . . . . . . . . . . . . . . . . . . . . . . . . . . 1ended in a stillbirth? NO . . . . . . . . . . . . . . . . . . . . . . . . . . . . . 2 237
230 When did the last such pregnancy end?MONTH . . . . . . . . . . . . . . . . . .
YEAR . . . . . . . . . . . .
231 CHECK 230:
LAST PREGNANCY LAST PREGNANCYENDED IN ENDED BEFORE 237
JAN. 2004 OR LATER JAN. 2004
232 How many months pregnant were you when the last suchpregnancy ended? MONTHS . . . . . . . . . . . . . . . . . .
RECORD NUMBER OF COMPLETED MONTHS. ENTER 'T' INTHE CALENDAR IN THE MONTH THAT THE PREGNANCYTERMINATED AND 'P' FOR THE REMAINING NUMBEROF COMPLETED MONTHS.
233 Since January 2004, have you had any other pregnancies YES . . . . . . . . . . . . . . . . . . . . . . . . . . . . . 1that did not result in a live birth? NO . . . . . . . . . . . . . . . . . . . . . . . . . . . . . 2 235
234 ASK THE DATE AND THE DURATION OF PREGNANCY FOR EACH EARLIER NON-LIVE BIRTH PREGNANCYBACK TO JANUARY 2004
ENTER 'T' IN THE CALENDAR IN THE MONTH THAT EACH PREGNANCY TERMINATED AND 'P'FOR THE REMAINING NUMBER OF COMPLETED MONTHS.
235 Did you have any miscarriages, abortions or stillbirths that YES . . . . . . . . . . . . . . . . . . . . . . . . . . . . . 1ended before 2004? NO . . . . . . . . . . . . . . . . . . . . . . . . . . . . . 2 237
236 When did the last such pregnancy that terminated before 2004end? MONTH . . . . . . . . . . . . . . . . . .
YEAR . . . . . . . . . . . .
| 317Appendix E

NO. QUESTIONS AND FILTERS CODING CATEGORIES SKIP
237 When did your last menstrual period start?DAYS AGO . . . . . . . . . . . . 1
WEEKS AGO . . . . . . . . . . 2
MONTHS AGO . . . . . . . . 3
(DATE, IF GIVEN) YEARS AGO . . . . . . . . . . 4
IN MENOPAUSE/HAS HAD HYSTERECTOMY . . . 994
BEFORE LAST BIRTH . . . . . . . . . . . . 995
NEVER MENSTRUATED . . . . . . . . . . 996
238 From one menstrual period to the next, are there certain days YES . . . . . . . . . . . . . . . . . . . . . . . . . . . . . 1when a woman is more likely to become pregnant if she has NO . . . . . . . . . . . . . . . . . . . . . . . . . . . . . 2sexual relations? DON'T KNOW . . . . . . . . . . . . . . . . . . . . 8 301
239 Is this time just before her period begins, during her period, right JUST BEFORE HER PERIODafter her period has ended, or halfway between two periods? BEGINS . . . . . . . . . . . . . . . . . . . . . . 1
DURING HER PERIOD . . . . . . . . . . . . 2RIGHT AFTER HER
PERIOD HAS ENDED . . . . . . . . . . . . 3HALFWAY BETWEEN
TWO PERIODS . . . . . . . . . . . . . . . . 4
OTHER 6(SPECIFY)
DON'T KNOW . . . . . . . . . . . . . . . . . . . . 8
________________________
318 | Appendix E

SECTION 3. CONTRACEPTION
301 Now I would like to talk about family planning - the various ways or methods that 302 Have you ever useda couple can use to delay or avoid a pregnancy (METHOD)?
Which ways or methods have you heard about?FOR METHODS NOT MENTIONED SPONTANEOUSLY, ASK:Have you ever heard of (METHOD)?
CIRCLE CODE 1 IN 301 FOR EACH METHOD MENTIONED SPONTANEOUSLY.THEN PROCEED DOWN COLUMN 301, READING THE NAME AND DESCRIPTION OFEACH METHOD NOT MENTIONED SPONTANEOUSLY. CIRCLE CODE 1 IF METHODIS RECOGNIZED, AND CODE 2 IF NOT RECOGNIZED. THEN, FOR EACH METHODWITH CODE 1 CIRCLED IN 301, ASK 302.
01 FEMALE STERILIZATION Women can have an operation to avoid YES . . . . . . . . . . . . . . 1 Have you ever had an operation tohaving any more children. NO . . . . . . . . . . . . . . 2 avoid having any more children?
YES . . . . . . . . . . . . . . . . . . . . . . . . 1NO . . . . . . . . . . . . . . . . . . . . . . . . 2
02 MALE STERILIZATION Men can have an operation to avoid having YES . . . . . . . . . . . . . . 1 Have you ever had a partner who hadany more children. NO . . . . . . . . . . . . . . 2 an operation to avoid having any
more children?YES . . . . . . . . . . . . . . . . . . . . . . . . 1NO . . . . . . . . . . . . . . . . . . . . . . . . 2
03 PILL Women can take a pill every day to avoid becoming pregnant. YES . . . . . . . . . . . . . . 1 YES . . . . . . . . . . . . . . . . . . . . . . . . 1NO . . . . . . . . . . . . . . 2
NO . . . . . . . . . . . . . . . . . . . . . . . . 2
04 IUD Women can have a loop or coil placed inside them by a doctor or YES . . . . . . . . . . . . . . 1 YES . . . . . . . . . . . . . . . . . . . . . . . . 1a nurse. NO . . . . . . . . . . . . . . 2
NO . . . . . . . . . . . . . . . . . . . . . . . . 2
05 INJECTABLES Women can have an injection by a health provider YES . . . . . . . . . . . . . . 1 YES . . . . . . . . . . . . . . . . . . . . . . . . 1that stops them from becoming pregnant for one or more months. NO . . . . . . . . . . . . . . 2
NO . . . . . . . . . . . . . . . . . . . . . . . . 2
06 IMPLANTS Women can have several small rods placed in their upper YES . . . . . . . . . . . . . . 1 YES . . . . . . . . . . . . . . . . . . . . . . . . 1arm by a doctor or nurse which can prevent pregnancy for one or more NO . . . . . . . . . . . . . . 2years. NO . . . . . . . . . . . . . . . . . . . . . . . . 2
07 CONDOM Men can put a rubber sheath on their penis before sexua YES . . . . . . . . . . . . . . 1 YES . . . . . . . . . . . . . . . . . . . . . . . . 1intercourse. NO . . . . . . . . . . . . . . 2
NO . . . . . . . . . . . . . . . . . . . . . . . . 2
08 FEMALE CONDOM Women can place a sheath in their vagina before YES . . . . . . . . . . . . . . 1 YES . . . . . . . . . . . . . . . . . . . . . . . . 1sexual intercourse. NO . . . . . . . . . . . . . . 2
NO . . . . . . . . . . . . . . . . . . . . . . . . 2
09 LACTATIONAL AMENORRHEA METHOD (LAM) YES . . . . . . . . . . . . . . 1 YES . . . . . . . . . . . . . . . . . . . . . . . . 1NO . . . . . . . . . . . . . . 2
NO . . . . . . . . . . . . . . . . . . . . . . . . 2
10 RHYTHM METHOD Every month that a woman is sexually active YES . . . . . . . . . . . . . . 1 YES . . . . . . . . . . . . . . . . . . . . . . . . 1she can avoid pregnancy by not having sexual intercourse NO . . . . . . . . . . . . . . 2on the days of the month she is most likely to get pregnant NO . . . . . . . . . . . . . . . . . . . . . . . . 2
11 STANDARD DAYS METHOD Women can use a cycle of beads to YES . . . . . . . . . . . . . . 1 YES . . . . . . . . . . . . . . . . . . . . . . . . 1count the days they are most likely to get pregnant and avoid NO . . . . . . . . . . . . . . 2sexual intercourse during those days. NO . . . . . . . . . . . . . . . . . . . . . . . . 2
12 WITHDRAWAL Men can be careful and pull out before climax. YES . . . . . . . . . . . . . . 1 YES . . . . . . . . . . . . . . . . . . . . . . . . 1NO . . . . . . . . . . . . . . 2
NO . . . . . . . . . . . . . . . . . . . . . . . . 2
13 EMERGENCY CONTRACEPTION As an emergency measure after YES . . . . . . . . . . . . . . 1 YES . . . . . . . . . . . . . . . . . . . . . . . . 1 unprotected sexual intercourse, women can take special pills at any NO . . . . . . . . . . . . . . 2time within five days to prevent pregnancy. NO . . . . . . . . . . . . . . . . . . . . . . . . 2
14 Have you heard of any other ways or methods that women or men can YES . . . . . . . . . . . . . . 1use to avoid pregnancy?
YES . . . . . . . . . . . . . . . . . . . . . . . . 1(SPECIFY) NO . . . . . . . . . . . . . . . . . . . . . . . . 2
YES . . . . . . . . . . . . . . . . . . . . . . . . 1(SPECIFY) NO . . . . . . . . . . . . . . . . . . . . . . . . 2
NO . . . . . . . . . . . . . . 2
303 CHECK 302:NOT A SINGLE AT LEAST ONE
"YES" "YES" 307(NEVER USED) (EVER USED)
| 319Appendix E

NO. QUESTIONS AND FILTERS CODING CATEGORIES SKIP
304 Have you ever used anything or tried in any way to delay or avoid YES . . . . . . . . . . . . . . . . . . . . . . . . . . . . . 1 306getting pregnant? NO . . . . . . . . . . . . . . . . . . . . . . . . . . . . . 2
305 ENTER '0' IN THE CALENDAR IN EACH BLANK MONTH. 333
306 What have you used or done?
CORRECT 302 AND 303 (AND 301 IF NECESSARY).
307 Now I would like to ask you about the first time that you didsomething or used a method to avoid getting pregnant. NUMBER OF CHILDREN . . . . .
How many living children did you have at that time, if any?
IF NONE, RECORD '00'.
308 CHECK 302 (01):
WOMAN NOT WOMANSTERILIZED STERILIZED 311A
309 CHECK 226:
NOT PREGNANT PREGNANTOR UNSURE 322
310 Are you currently doing something or using any method to delay YES . . . . . . . . . . . . . . . . . . . . . . . . . . . . . 1or avoid getting pregnant? NO . . . . . . . . . . . . . . . . . . . . . . . . . . . . . 2 322
311 Which method are you using? FEMALE STERILIZATION . . . . . . . . . . AMALE STERILIZATION . . . . . . . . . . . . B 316
CIRCLE ALL MENTIONED. PILL . . . . . . . . . . . . . . . . . . . . . . . . . . . . . CIUD . . . . . . . . . . . . . . . . . . . . . . . . . . . . . D
IF MORE THAN ONE METHOD MENTIONED, FOLLOW SKIP INJECTABLES . . . . . . . . . . . . . . . . . . E 315INSTRUCTION FOR HIGHEST METHOD IN LIST. IMPLANTS . . . . . . . . . . . . . . . . . . . . . . F
CONDOM . . . . . . . . . . . . . . . . . . . . . . GFEMALE CONDOM . . . . . . . . . . . . . . H
311A CIRCLE 'A' FOR FEMALE STERILIZATION. DIAPHRAGM . . . . . . . . . . . . . . . . . . . . I 315FOAM/JELLY . . . . . . . . . . . . . . . . . . . . JLACTATIONAL AMEN. METHOD . . . . . KRHYTHM METHOD . . . . . . . . . . . . . . . . LSTANDARD DAYS METHOD . . . . . . . . MWITHDRAWAL . . . . . . . . . . . . . . . . . . N 319A
OTHER ______________________ X(SPECIFY)
320 | Appendix E

NO. QUESTIONS AND FILTERS CODING CATEGORIES SKIP
314 How many (pill cycles/condoms) did you get NUMBER OF PILLthe last time? CYCLES/CONDOMS . . .
DON'T KNOW . . . . . . . . . . . . . . . . . . 998
315 The last time you obtained (HIGHEST METHOD ON LIST IN 311), how much did you pay in total, including the cost of the method COST . . . . . . . . . . . . . . . . and any consultation you may have had? 319A
FREE . . . . . . . . . . . . . . . . . . . . . . . . . 995DON'T KNOW . . . . . . . . . . . . . . . . . . 998
316 In what facility did the sterilization take place? PUBLIC SECTORNATIONAL HOSPITAL 11
PROBE TO IDENTIFY THE TYPE OF SOURCE AND CIRCLE REFERRAL HOSPITAL . . . . . 12THE APPROPRIATE CODE. COMMUNITY HEALTH CEN. 13
OTHER PUBLIC 16IF UNABLE TO DETERMINE IF HOSPITAL, HEALTH CENTER (SPECIFY)OR CLINIC IS PUBLIC OR PRIVATE MEDICAL, WRITETHE NAME OF THE PLACE. NON-GOVT (NGO) SECTOR
MARIE STOPES . . . . . . . . . . . . . . . . 21OTHER NGO ________________ 26
(SPECIFY)
PRIVATE MEDICAL SECTOR(NAME OF PLACE) PRIVATE HOSPITAL/CLINIC . . . 31
PRIVATE DOCTOR'S OFFICE . . . 32OTHER PRIVATE
MEDICAL 36(SPECIFY)
OTHER ______________________ 96(SPECIFY)
DON'T KNOW . . . . . . . . . . . . . . . . . . 98
317 CHECK 311/311A:
CODE 'A' CODE 'A'CIRCLED NOT CIRCLED
Before your sterilization Before the sterilization operation, YES . . . . . . . . . . . . . . . . . . . . . . . . . . . . . 1operation, were you told was your husband/partner told NO . . . . . . . . . . . . . . . . . . . . . . . . . . . . . 2that you would not be able that he would not be able to DON'T KNOW . . . . . . . . . . . . . . . . . . . . 8to have any (more) children have any (more) childrenbecause of the operation? because of the operation?
318 How much did you (your husband/partner) pay in total for thesterilization, including any consultation you (he) may have had? COST (Rp)
COST (USD) ....................
FREE . . . . . . . . . . . . . . . . . . . . . . . . . 9995DON'T KNOW . . . . . . . . . . . . . . . . . . 9998
319 In what month and year was the sterilization performed?
319A Since what month and year have you been using (CURRENT MONTH . . . . . . . . . . . . . . . . . . METHOD) without stopping?
YEAR . . . . . . . . . . . . PROBE: For how long have you been using (CURRENT METHOD) now without stopping?
320 CHECK 319/319A, 215 AND 230:
ANY BIRTH OR PREGNANCY TERMINATION AFTER MONTH AND YES NOYEAR OF START OF USE OF CONTRACEPTION IN 319/319A
GO BACK TO 319/319A, PROBE AND RECORD MONTH AND YEAR AT START OF CONTINUOUSUSE OF CURRENT METHOD (MUST BE AFTER LAST BIRTH OR PREGNANCY TERMINATION).
| 321Appendix E

NO. QUESTIONS AND FILTERS CODING CATEGORIES SKIP
321 CHECK 319/319A:
YEAR IS 2004 OR LATER YEAR IS 2003 OR EARLIER
ENTER CODE FOR METHOD USED IN MONTH OF ENTER CODE FOR METHOD USED IN MONTH OFINTERVIEW IN THE CALENDAR AND IN INTERVIEW IN THE CALENDAR ANDEACH MONTH BACK TO THE DATE STARTED USING. EACH MONTH BACK TO JANUARY 2004.
THEN SKIP TO
322 I would like to ask you some questions about the times you or your partner may have used a method to avoidgetting pregnant during the last few years.
USE CALENDAR TO PROBE FOR EARLIER PERIODS OF USE AND NONUSE, STARTING WITH MOST RECENT USE, BACK TO JANUARY 2004USE NAMES OF CHILDREN, DATES OF BIRTH, AND PERIODS OF PREGNANCY AS REFERENCE POINTS.
ENTER METHOD USE CODE OR '0' FOR NONUSE IN EACH BLANK MONTH.
ILLUSTRATIVE QUESTIONS:* When was the last time you used a method? Which method was that? * When did you start using that method? How long after the birth of (NAME)?* How long did you use the method then?
323 CHECK 311/311A: NO CODE CIRCLED . . . . . . . . . . . . 00 333FEMALE STERILIZATION . . . . . . . . 01 326
CIRCLE METHOD CODE: MALE STERILIZATION . . . . . . . . . . 02 335PILL . . . . . . . . . . . . . . . . . . . . . . . . . . . 03
IF MORE THAN ONE METHOD CODE CIRCLED IN 311/311A, IUD . . . . . . . . . . . . . . . . . . . . . . . . . . . 04CIRCLE CODE FOR HIGHEST METHOD IN LIST. INJECTABLES . . . . . . . . . . . . . . . . . . 05
IMPLANTS . . . . . . . . . . . . . . . . . . . . 06CONDOM . . . . . . . . . . . . . . . . . . . . 07FEMALE CONDOM . . . . . . . . . . . . . . 08DIAPHRAGM . . . . . . . . . . . . . . . . . . 09FOAM/JELLY . . . . . . . . . . . . . . . . . . 10LACTATIONAL AMEN. METHOD . . . 11 324ARHYTHM METHOD . . . . . . . . . . . . . . 12 324ASTANDARD DAYS METHOD 13 324AWITHDRAWAL . . . . . . . . . . . . . . . . 14 335OTHER METHOD . . . . . . . . . . . . . . 96 335
324 Where did you obtain (CURRENT METHOD) when you started PUBLIC SECTORusing it? NATIONAL HOSPITAL . . . . . . . . . . 11
REFERRAL HOSPITAL . . . . . 12COMMUNITY HEALTH CEN. . . . . 13HEALTH POST . . . . . . . . . . . . . . 14SISCa POST . . . . . . . . . . . . . . 15MOBILE CLINIC . . . . . . . . . . . . . . 17CONDOM BOX . . . . . . . . . . . . . . 18
OTHER PUBLIC ________________ 16(SPECIFY)
NON-GOVT (NGO) SECTORMARIE STOPES . . . . . . . . . . . . . . . . 21OTHER NGO ________________ 26
(SPECIFY)
324A Where did you learn how to use the rhythm/standard days/ PRIVATE MEDICAL SECTORlactational amenorhea method? PRIVATE HOSPITAL/CLINIC . . . 31
PHARMACY . . . . . . . . . . . . . . . . . . 32IF UNABLE TO DETERMINE IF HOSPITAL, HEALTH CENTER, OR PRIVATE DOCTOR . . . . . . . . . . . . 33CLINIC IS PUBLIC OR PRIVATE MEDICAL, WRITE THE NAME OF MOBILE CLINIC . . . . . . . . . . . . . . 34THE PLACE. FIELDWORKER . . . . . . . . . . . . . . 35
OTHER PRIVATEMEDICAL 36
(NAME OF PLACE) (SPECIFY)
OTHER SOURCESHOP . . . . . . . . . . . . . . . . . . . . . . 41FRIEND/RELATIVE . . . . . . . . . . . . 42
OTHER ______________________ 96(SPECIFY)
331
322 | Appendix E

NO. QUESTIONS AND FILTERS CODING CATEGORIES SKIP
325 CHECK 311/311A: PILL . . . . . . . . . . . . . . . . . . . . . . . . . . . 03IUD . . . . . . . . . . . . . . . . . . . . . . . . . . . 04
CIRCLE METHOD CODE: INJECTABLES . . . . . . . . . . . . . . . . . . 05IMPLANTS . . . . . . . . . . . . . . . . . . . . 06
IF MORE THAN ONE METHOD CODE CIRCLED IN 311/311A, CONDOM . . . . . . . . . . . . . . . . . . . . 07 332CIRCLE CODE FOR HIGHEST METHOD IN LIST. FEMALE CONDOM . . . . . . . . . . . . . . 08 329
DIAPHRAGM . . . . . . . . . . . . . . . . . . 09 329FOAM/JELLY . . . . . . . . . . . . . . . . . . 10 329LACTATIONAL AMEN. METHOD . . . 11 335RHYTHM METHOD . . . . . . . . . . . . . . 12 335STANDARD DAYS METHOD . . . . . 13 335
326 You obtained (CURRENT METHOD FROM 323) from (SOURCE OF METHOD FROM 316 OR 324) in (DATE FROM 319/319A). At YES . . . . . . . . . . . . . . . . . . . . . . . . . . . . . 1 328 that time, were you told about side effects or problems you NO . . . . . . . . . . . . . . . . . . . . . . . . . . . . . 2might have with the method?
327 Were you ever told by a health or family planning worker about YES . . . . . . . . . . . . . . . . . . . . . . . . . . . . . 1side effects or problems you might have with the method? NO . . . . . . . . . . . . . . . . . . . . . . . . . . . . . 2 329
328 Were you told what to do if you experienced side effects YES . . . . . . . . . . . . . . . . . . . . . . . . . . . . . 1or problems? NO . . . . . . . . . . . . . . . . . . . . . . . . . . . . . 2
329 CHECK 326:
CODE '1' CODE '1'CIRCLED NOT
CIRCLED
At that time, were you told When you obtained (CURRENTabout other methods of family METHOD FROM 323) from planning that you could use? (SOURCE OF METHOD FROM
316 OR 324) were you told YES . . . . . . . . . . . . . . . . . . . . . . . . . . . . . 1 331about other methods of family NO . . . . . . . . . . . . . . . . . . . . . . . . . . . . . 2planning that you could use?
330 Were you ever told by a health or family planning worker about YES . . . . . . . . . . . . . . . . . . . . . . . . . . . . . 1other methods of family planning that you could use? NO . . . . . . . . . . . . . . . . . . . . . . . . . . . . . 2
331 CHECK 311/311A: FEMALE STERILIZATION . . . . . . . . 01MALE STERILIZATION . . . . . . . . . . 02 335
CIRCLE METHOD CODE: PILL . . . . . . . . . . . . . . . . . . . . . . . . . . . 03IUD . . . . . . . . . . . . . . . . . . . . . . . . . . . 04
IF MORE THAN ONE METHOD CODE CIRCLED IN 311/311A, INJECTABLES . . . . . . . . . . . . . . . . . . 05CIRCLE CODE FOR HIGHEST METHOD IN LIST. IMPLANTS . . . . . . . . . . . . . . . . . . . . 06
CONDOM . . . . . . . . . . . . . . . . . . . . 07FEMALE CONDOM . . . . . . . . . . . . . . 08DIAPHRAGM . . . . . . . . . . . . . . . . . . 09FOAM/JELLY . . . . . . . . . . . . . . . . . . 10LACTATIONAL AMEN. METHOD . . . 11RHYTHM METHOD . . . . . . . . . . . . . . 12STANDARD DAYS METHOD 13 335WITHDRAWAL . . . . . . . . . . . . . . . . 14OTHER METHOD . . . . . . . . . . . . . . 96
| 323Appendix E

NO. QUESTIONS AND FILTERS CODING CATEGORIES SKIP
332 Where did you obtain (CURRENT METHOD) the last time? PUBLIC SECTORNATIONAL HOSPITAL . . . . . . . . . . 11
PROBE TO IDENTIFY THE TYPE OF SOURCE AND CIRCLE REFERRAL HOSPITAL . . . . . 12THE APPROPRIATE CODE. COMMUNITY HEALTH CEN. . . . . 13
HEALTH POST . . . . . . . . . . . . . . 14IF UNABLE TO DETERMINE IF HOSPITAL, HEALTH CENTER SISCa POST . . . . . . . . . . . . . . 15OR CLINIC IS PUBLIC OR PRIVATE MEDICAL, WRITE MOBILE CLINIC . . . . . . . . . . . . . . 17
CONDOM BOX . . . . . . . . . . . . . . . . 18THE NAME OF THE PLACE. OTHER PUBLIC ________________ 16
(SPECIFY)
NON-GOVT (NGO) SECTORMARIE STOPES . . . . . . . . . . . . . . . . 21OTHER NGO ________________ 26
(SPECIFY)
(NAME OF PLACE) PRIVATE MEDICAL SECTOR 335PRIVATE HOSPITAL/CLINIC . . . 31PHARMACY . . . . . . . . . . . . . . . . . . 32PRIVATE DOCTOR . . . . . . . . . . . . 33MOBILE CLINIC . . . . . . . . . . . . . . 34FIELDWORKER . . . . . . . . . . . . . . 35OTHER PRIVATE
MEDICAL 36(SPECIFY)
OTHER SOURCESHOP . . . . . . . . . . . . . . . . . . . . . . 41FRIEND/RELATIVE . . . . . . . . . . . . 42
OTHER ______________________ 96(SPECIFY)
333 Do you know of a place where you can obtain a method of family YES . . . . . . . . . . . . . . . . . . . . . . . . . . . . . 1planning? NO . . . . . . . . . . . . . . . . . . . . . . . . . . . . . 2 335
334 Where is that? PUBLIC SECTORNATIONAL HOSPITAL . . . . . . . . . . . . A
Any other place? REFERRAL HOSPITAL . . . . . . . . BCOMMUNITY HEALTH CEN. . . . . . . . C
PROBE TO IDENTIFY EACH TYPE OF SOURCE AND CIRCLE HEALTH POST . . . . . . . . . . . . . . . . DTHE APPROPRIATE CODE(S). SISCa POST . . . . . . . . . . . . . . . . E
MOBILE CLINIC . . . . . . . . . . . . . . . . FCONDOM BOX G
IF UNABLE TO DETERMINE IF HOSPITAL, HEALTH CENTER OTHER PUBLIC ________________ HOR CLINIC IS PUBLIC OR PRIVATE MEDICAL, WRITE (SPECIFY)
THE NAME OF THE PLACE. NON-GOVT (NGO) SECTORMARIE STOPES . . . . . . . . . . . . . . . . IOTHER NGO ________________ J
(SPECIFY)
PRIVATE MEDICAL SECTORPRIVATE HOSPITAL/CLINIC . . . . . K
(NAME OF PLACE(S)) PHARMACY . . . . . . . . . . . . . . . . . . LPRIVATE DOCTOR . . . . . . . . . . . . . . MMOBILE CLINIC . . . . . . . . . . . . . . . . NFIELDWORKER . . . . . . . . . . . . . . . . OOTHER PRIVATE
MEDICAL P(SPECIFY)
OTHER SOURCESHOP . . . . . . . . . . . . . . . . . . . . . . . . . QFRIEND/RELATIVE . . . . . . . . . . . . . . R
OTHER _________________________ X(SPECIFY)
335 In the last 12 months, were you visited by a fieldworker who YES . . . . . . . . . . . . . . . . . . . . . . . . . . . . . 1talked to you about family planning? NO . . . . . . . . . . . . . . . . . . . . . . . . . . . . . 2
336 In the last 12 months, have you visited a health facility for care YES . . . . . . . . . . . . . . . . . . . . . . . . . . . . . 1for yourself (or your children)? NO . . . . . . . . . . . . . . . . . . . . . . . . . . . . . 2 401
337 Did any staff member at the health facility speak to you about YES . . . . . . . . . . . . . . . . . . . . . . . . . . . . . 1family planning methods? NO . . . . . . . . . . . . . . . . . . . . . . . . . . . . . 2
324 | Appendix E

SECTION 4. PREGNANCY AND POSTNATAL CARE
401 CHECK 224:ONE OR MORE NO 576
BIRTHS BIRTHSIN 2004 IN 2004
OR LATER OR LATER
402 CHECK 215: ENTER IN THE TABLE THE LINE NUMBER, NAME, AND SURVIVAL STATUS OF EACH BIRTH IN 2004 ORLATER. ASK THE QUESTIONS ABOUT ALL OF THESE BIRTHS. BEGIN WITH THE LAST BIRTH.(IF THERE ARE MORE THAN 3 BIRTHS, USE LAST 2 COLUMNS OF ADDITIONAL QUESTIONNAIRES).
Now I would like to ask you some questions about the health of all your children born in the last five years. (We will talk about each separately.)
403 LAST BIRTH NEXT-TO-LAST BIRTH SECOND-FROM-LAST BIRTHLINE NUMBER FROM 212
LINE NO. LINE NO. LINE NO.
404 NAME __________________ NAME ________________ NAME _________________FROM 212 AND 216
LIVING DEAD LIVING DEAD LIVING DEAD
405 At the time you became pregnant THEN . . . . . . . . . . . . . 1 THEN . . . . . . . . . . . . 1 THEN . . . . . . . . . . . . 1with (NAME), did you want to (SKIP TO 407) (SKIP TO 432) (SKIP TO 432)become pregnant then, did you LATER . . . . . . . . . . . . . 2 LATER . . . . . . . . . . . . 2 LATER . . . . . . . . . . . . 2want to wait until later, or did you not want to have any (more) NOT AT ALL . . . . . . . 3 NOT AT ALL . . . . . 3 NOT AT ALL . . . . . 3children at all? (SKIP TO 407) (SKIP TO 432) (SKIP TO 432)
406 How much longer would you have liked to wait? MONTHS MONTHS MONTHS
YEARS YEARS YEARS
DON'T KNOW . . . . 998 DON'T KNOW . . . 998 DON'T KNOW . . . 998
407 Did you see anyone for antenatal HEALTH PERSONNELcare for this pregnancy? DOCTOR . . . . . . . . . A
NURSE/MIDWIFE .... BASSISTANT
NURSE . . . . . . . C
OTHER PERSONIF YES: Whom did you see? TRADITIONAL BIRTH
Anyone else? ATTENDANT .. DCOMMUNITY/VILLAGE
PROBE TO IDENTIFY EACH TYPE HEALTHOF PERSON AND RECORD ALL WORKER . . . . . EMENTIONED.
OTHER X(SPECIFY)
NO ONE . . . . . . . . . . . Y(SKIP TO 413A)
. .1
. .2
. .1
. .2
. .1
. .2
| 325Appendix E

LAST BIRTH NEXT-TO-LAST BIRTH SECOND-FROM-LAST BIRTH
NO. QUESTIONS AND FILTERS NAME __________________ NAME ________________ NAME _________________
408 Where did you receive antenatal HOMEcare for this pregnancy? YOUR HOME . . . . . A
OTHER HOME. . . . . BAnywhere else?
PUBLIC SECTORPROBE TO IDENTIFY TYPE(S) NATIONALOF SOURCE(S) AND CIRCLE HOSPITAL . . . . . CTHE APPROPRIATE CODE(S). REFERRAL
HOSPITAL . . . . . DIF UNABLE TO DETERMINE COMMUNITYIF A HOSPITAL, HEALTH HEALTH CEN. .. ECENTER, OR CLINIC IS HEALTH POSTS .. FPUBLIC OR PRIVATE SISCa POSTS . . . . . G
MOBILE CLINIC HMEDICAL, WRITE THE OTHER PUBLICTHE NAME OF THE PLACE. SEC. I
(SPECIFY)
NON-GOVT (NGO) SECTORMARIE STOPES .... JOTHER
(NAME OF PLACE(S)) NGOS KSPECIFY
PRIVATE MED. SECTORPVT. HOSPITAL/
CLINIC . . . . . . . . . LOTHER PRIVATEMED. M
(SPECIFY)
OTHER X(SPECIFY)
409 How many months pregnant were you when you first received MONTHS . . . antenatal care for this pregnancy?
DON'T KNOW . . . . . . . 98
410 How many times did you receive NUMBERantenatal care during this OF TIMES . pregnancy?
DON'T KNOW . . . . . . . 98
411 As part of your antenatal careduring this pregnancy, were any ofthe following done at least once? YES NO
Were you weighed? WEIGHT . . . 1 2Was your blood pressure
measured? BP . . . . . . . 1 2Did you give a urine sample? URINE . . . . . 1 2Did you give a blood sample? BLOOD . . . 1 2
412 During (any of) your antenatal YES . . . . . . . . . . . . . . . 1care visit(s), were you told about NO . . . . . . . . . . . . . . . 2the signs of pregnancy (SKIP TO 413A)complications? DON'T KNOW . . . . . . . 8
413 Were you told where to go if you YES . . . . . . . . . . . . . . . 1had any of these complications? NO . . . . . . . . . . . . . . . 2
DON'T KNOW . . . . . . . 8
413A What are the symptoms during VAGINAL BLEEDING Apregnancy indicating the need SEVERE LOWER to seek immediate care? ABDOMINAL PAIN B
SEVERE HEADACHE CPROBE: Any other? CONVULSION D
BLURRED VISION & RECORD ALL MENTIONED SWELLING OF
HANDS & FACE EOTHER X
(SPECIFY)DON'T KNOW Z
326 | Appendix E
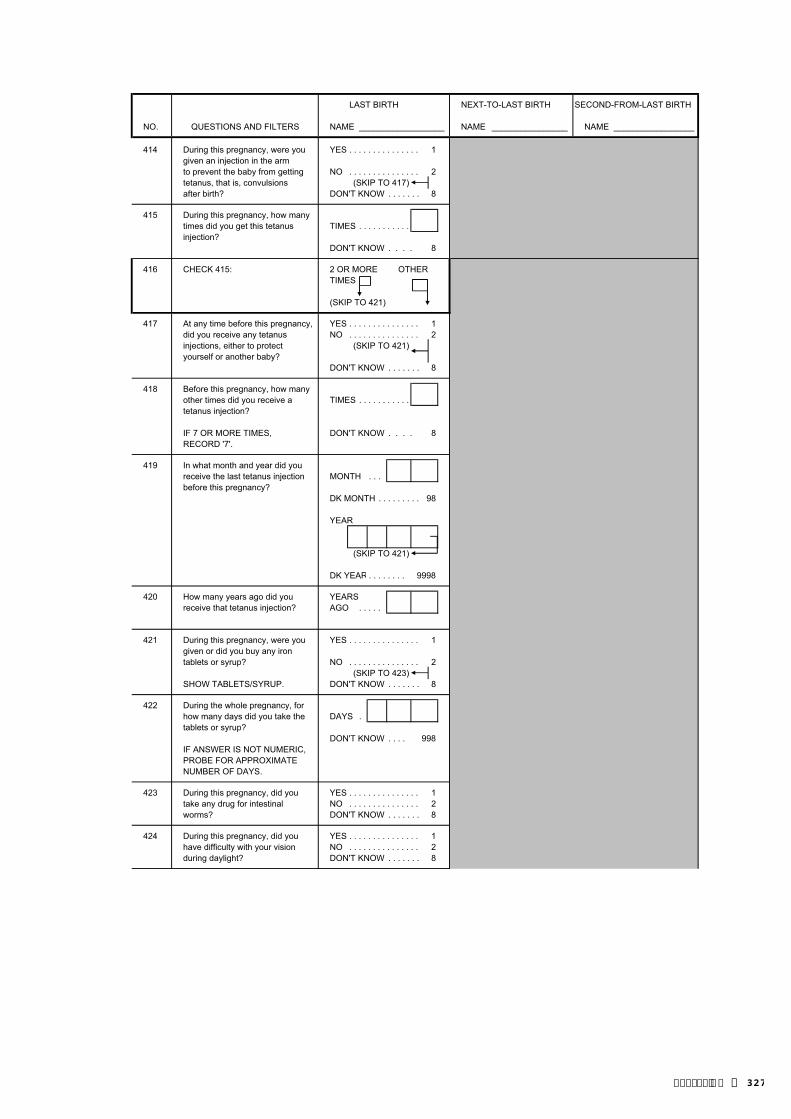
LAST BIRTH NEXT-TO-LAST BIRTH SECOND-FROM-LAST BIRTH
NO. QUESTIONS AND FILTERS NAME __________________ NAME ________________ NAME _________________
414 During this pregnancy, were you YES . . . . . . . . . . . . . . . 1given an injection in the armto prevent the baby from getting NO . . . . . . . . . . . . . . . 2tetanus, that is, convulsions (SKIP TO 417)after birth? DON'T KNOW . . . . . . . 8
415 During this pregnancy, how manytimes did you get this tetanus TIMES . . . . . . . . . . . injection?
DON'T KNOW . . . . 8
416 CHECK 415: 2 OR MORE OTHERTIMES
(SKIP TO 421)
417 At any time before this pregnancy, YES . . . . . . . . . . . . . . . 1did you receive any tetanus NO . . . . . . . . . . . . . . . 2injections, either to protect (SKIP TO 421)yourself or another baby?
DON'T KNOW . . . . . . . 8
418 Before this pregnancy, how many other times did you receive a TIMES . . . . . . . . . . . tetanus injection?
IF 7 OR MORE TIMES, DON'T KNOW . . . . 8RECORD '7'.
419 In what month and year did youreceive the last tetanus injection MONTH . . . before this pregnancy?
DK MONTH . . . . . . . . . 98
YEAR
(SKIP TO 421)
DK YEAR . . . . . . . . 9998
420 How many years ago did you YEARSreceive that tetanus injection? AGO . . . . .
421 During this pregnancy, were you YES . . . . . . . . . . . . . . . 1given or did you buy any irontablets or syrup? NO . . . . . . . . . . . . . . . 2
(SKIP TO 423)SHOW TABLETS/SYRUP. DON'T KNOW . . . . . . . 8
422 During the whole pregnancy, for how many days did you take the DAYS .tablets or syrup?
DON'T KNOW . . . . 998IF ANSWER IS NOT NUMERIC,PROBE FOR APPROXIMATENUMBER OF DAYS.
423 During this pregnancy, did you YES . . . . . . . . . . . . . . . 1take any drug for intestinal NO . . . . . . . . . . . . . . . 2worms? DON'T KNOW . . . . . . . 8
424 During this pregnancy, did you YES . . . . . . . . . . . . . . . 1have difficulty with your vision NO . . . . . . . . . . . . . . . 2during daylight? DON'T KNOW . . . . . . . 8
| 327Appendix E

LAST BIRTH NEXT-TO-LAST BIRTH SECOND-FROM-LAST BIRTH
NO. QUESTIONS AND FILTERS NAME __________________ NAME ________________ NAME _________________
425 During this pregnancy, did you YES . . . . . . . . . . . . . . . 1suffer from night blindness NO . . . . . . . . . . . . . . . 2[USE LOCAL TERM]? DON'T KNOW . . . . . . . 8
425A During this pregnancy, did youreceive supplementary food? YES NO
During pregnancy? PREGNANCY .. 1 2During lactating period? LACTATION .. 1 2
432 When (NAME) was born, was VERY LARGE . . . . . . . 1 VERY LARGE . . . . . 1 VERY LARGE . . . . . 1he/she very large, larger than LARGER THAN LARGER THAN LARGER THANaverage, average, smaller than AVERAGE . . . . . . . 2 AVERAGE . . . . . 2 AVERAGE . . . . . 2average, or very small? AVERAGE . . . . . . . . . 3 AVERAGE . . . . . . . 3 AVERAGE . . . . . . . 3
SMALLER THAN SMALLER THAN SMALLER THANAVERAGE . . . . . . . 4 AVERAGE . . . . . 4 AVERAGE . . . . . 4
VERY SMALL . . . . . . . 5 VERY SMALL . . . . . 5 VERY SMALL . . . . . 5DON'T KNOW . . . . . . . 8 DON'T KNOW . . . . . 8 DON'T KNOW . . . . . 8
433 Was (NAME) weighed at birth? YES . . . . . . . . . . . . . . . 1 YES . . . . . . . . . . . . . . 1 YES . . . . . . . . . . . . . . 1
NO . . . . . . . . . . . . . . . 2 NO . . . . . . . . . . . . . . 2 NO . . . . . . . . . . . . . . 2(SKIP TO 435) (SKIP TO 435) (SKIP TO 435)
DON'T KNOW . . . . . . . 8 DON'T KNOW . . . . . 8 DON'T KNOW . . . . . 8
434 How much did (NAME) weigh? KG FROM CARD KG FROM CARD KG FROM CARD
RECORD WEIGHT IN . . .KILOGRAMS FROM HEALTHCARD, IF AVAILABLE.
KG FROM RECALL KG FROM RECALL KG FROM RECALL
. . .
DON'T KNOW . 99.998 DON'T KNOW . 99.998 DON'T KNOW . 99.998
435 Who assisted with the delivery HEALTH PERSONNEL HEALTH PERSONNEL HEALTH PERSONNELof (NAME)? DOCTOR . . . . . . . A DOCTOR . . . . . A DOCTOR . . . . . A
NURSE/MIDWIFE . . B NURSE/MIDWIFE. B NURSE/MIDWIFE. BASSISTANT NURSE C ASSISTANT NURSE C ASSISTANT NURSE C
Anyone else?PROBE FOR THE TYPE(S) OF OTHER PERSON OTHER PERSON OTHER PERSONPERSON(S) AND RECORD ALL TRADITIONAL BIRTH TRADITIONAL BIRTH TRADITIONAL BIRTHMENTIONED. ATTENDANT . . D ATTENDANT . . D ATTENDANT . . D
RELATIVE/FRIEND . E RELATIVE/FRIEND E RELATIVE/FRIEND EIF RESPONDENT SAYS NO ONE OTHER OTHER OTHERASSISTED, PROBE TO X X XDETERMINE WHETHER ANY (SPECIFY) (SPECIFY) (SPECIFY)ADULTS WERE PRESENT AT NO ONE . . . . . . . . . . . Y NO ONE . . . . . . . . . . Y NO ONE . . . . . . . . . . YTHE DELIVERY.
1
2
1
2 2
1
328 | Appendix E

LAST BIRTH NEXT-TO-LAST BIRTH SECOND-FROM-LAST BIRTH
NO. QUESTIONS AND FILTERS NAME __________________ NAME ________________ NAME _________________
436 Where did you give birth to HOME HOME HOME(NAME)? YOUR HOME . . . . . 11 YOUR HOME . . . 11 YOUR HOME . . . 11
(SKIP TO 443) (SKIP TO 444) (SKIP TO 444)PROBE TO IDENTIFY THE TYPE OTHER HOME. . . . . 12 OTHER HOME . . . 12 OTHER HOME. . . 12OF SOURCE AND CIRCLE THEAPPROPRIATE CODE. PUBLIC SECTOR PUBLIC SECTOR PUBLIC SECTOR
NATIONAL NATIONAL NATIONALIF UNABLE TO DETERMINE HOSPITAL . . . . . 21 HOSPITAL . . . 21 HOSPITAL . . . 21IF A HOSPITAL, HEALTH REFERRAL REFERRAL REFERRALCENTER, OR CLINIC IS HOSPITAL . . . . . 22 HOSPITAL . . . 22 HOSPITAL . . . 22PUBLIC OR PRIVATE COMMUNITY COMMUNITY COMMUNITYMEDICAL, WRITE THE HEALTH CEN. .. 23 HEALTH CEN. .. 23 HEALTH CEN. .. 23THE NAME OF THE PLACE. HEALTH POSTS .. 24 HEALTH POSTS .. 24 HEALTH POSTS .. 24
SISCa POSTS . . . . . 25 SISCa POSTS . . . 25 SISCa POSTS . . . 25
OTHER PUBLIC OTHER PUBLIC OTHER PUBLIC(NAME OF PLACE) SEC. 26 SEC. 26 SEC. 26
(SPECIFY) (SPECIFY) (SPECIFY)
PRIVATE MED. SECTOR PRIVATE MED. SECTOR PRIVATE MED. SECTORPVT. HOSPITAL/ PVT. HOSPITAL/ PVT. HOSPITAL/
CLINIC . . . . . . . . . 31 CLINIC . . . . . . . 31 CLINIC . . . . . . . 31OTHER PRIVATE OTHER PRIVATE OTHER PRIVATEMED. 36 MED. 36 MED. 36
(SPECIFY) (SPECIFY) (SPECIFY)
OTHER 96 OTHER 96 OTHER 96(SPECIFY) (SPECIFY) (SPECIFY)
(SKIP TO 443) (SKIP TO 444) (SKIP TO 444)
437 How long after (NAME) wasdelivered did you stay there? HOURS 1 HOURS 1 HOURS 1
IF LESS THAN ONE DAY, DAYS 2 DAYS 2 DAYS 2RECORD HOURS.IF LESS THAN ONE WEEK, WEEKS 3 WEEKS 3 WEEKS 3RECORD DAYS.
DON'T KNOW . 998 DON'T KNOW . . . 998 DON'T KNOW . . . 998
438 Was (NAME) delivered by YES . . . . . 1 YES . . . . . . . . . . . . . . 1 YES . . . . . . . . . . . . . . 1caesarean section? NO . . . . . 2 NO . . . . . . . . . . . . . . 2 NO . . . . . . . . . . . . . . 2
439 Before you were discharged after YES . . . . . . . . . . . . . . . 1 YES . . . . . . . . . . . . . . 1 YES . . . . . . . . . . . . . . 1(NAME) was born, did any health NO . . . . . . . . . . . . . . . 2 (SKIP TO 455) (SKIP TO 455)care provider check on your health? (SKIP TO 442) NO . . . . . . . . . . . . . . 2 NO . . . . . . . . . . . . . . 2
440 How long after deliverydid the first check take place? HOURS 1
DAYS 2IF LESS THAN ONE DAY,RECORD HOURS. WEEKS 3IF LESS THAN ONE WEEK,RECORD DAYS. DON'T KNOW . . . . 998
441 Who checked on your health HEALTH PERSONNELat that time? DOCTOR . . . . . . . . . 11
NURSE/MIDWIFE 12PROBE FOR MOST QUALIFIED ASSISTANTPERSON. NURSE . . . . . . . 13
OTHER PERSONTRADITIONAL BIRTH
ATTENDANT 21COMMUNITY/VILLAGE
HEALTHWORKER . . . . . 22
OTHER 96(SPECIFY)
(SKIP TO 452A)
| 329Appendix E

LAST BIRTH NEXT-TO-LAST BIRTH SECOND-FROM-LAST BIRTH
NO. QUESTIONS AND FILTERS NAME __________________ NAME ________________ NAME _________________
442 After you were discharged, did YES . . . . . . . . . . . . . . . 1 YES . . . . . . . . . . . . . . 1 YES . . . . . . . . . . . . . . 1any health care provider (SKIP TO 445) (SKIP TO 455) (SKIP TO 455)check on your health? NO . . . . . . . . . . . . . . . 2 NO . . . . . . . . . . . . . . 2 NO . . . . . . . . . . . . . . 2
(SKIP TO 452A)
443 Why didn't you deliver in a health COST TOO MUCH . . . Afacility? FACILITY NOT OPEN . B
TOO FAR/ NO TRANS-PORTATION .......... C
PROBE: Any other reason? DON'T TRUST FACILITY/POOR
RECORD ALL MENTIONED. QUALITY SERVICE DNO FEMALE PROVID-
ER AT FACILITY . . EHUSBAND/FAMILY
DID NOT ALLOW . . FNOT NECESSARY . . GNOT CUSTOMARY . . HPLANNED BUT CHILD
BORN BEFOREREACHING FACILITYI
OTHER(SPECIFY) X
443A When (NAME) was born, what NEW/BOILED instrument was used to cut BLADE . . . . . . . . . 1the umblical cord? USED BLADE . . . . . 2
KNIFE . . . . . . . . . . . . . 3SCISSORS . . . . . . . . . 4BAMBOO . . . . . . 5
OTHER 6 (SPECIFY)DON'T KNOW . . . . . 8
443B Was anything placed on the YES . . . . . . . . . . . . . . . 1stump after the umblical cord NO . . . . . . . . . . . . . . . 2was cut? (SKIP TO 443D)
DON'T KNOW . . . . . . . 8
443C What was placed on the stump? OIL . . . . . . . . . . . . . . . AASH . . . . . . . . . . . . . B
PROBE: Any other things? OINTMENT/POWDER.... CTRADITIONAL MED . . DBETADINE . . . . . . . . . E
RECORD ALL MENTIONEDOTHER X
(SPECIFY)DON'T KNOW . . Z
443D Was (NAME) dried before the YES . . . . . . . . . . . . . . . 1placenta was delivered? NO . . . . . . . . . . . . . . . 2
DON'T KNOW . . . . 8
443E How long after delivery was(NAME) bathed for the first time? HOURS 1
IF LESS THAN ONE DAY, DAYS 2RECORD HOURS.IF LESS THAN ONE WEEK, WEEKS 3RECORD DAYS.
DON'T KNOW . . . . 998
444 After (NAME) was born, did any health care provider YES . . . . . . . . . . . . . . . 1 YES . . . . . . . . . . . . . . 1 YES . . . . . . . . . . . . . . 1check on your health? NO . . . . . . . . . . . . . . . 2 NO . . . . . . . . . . . . . . 2 NO . . . . . . . . . . . . . . 2
(SKIP TO 449)
330 | Appendix E

LAST BIRTH NEXT-TO-LAST BIRTH SECOND-FROM-LAST BIRTH
NO. QUESTIONS AND FILTERS NAME __________________ NAME ________________ NAME _________________
445 How long after delivery didthe first check take place? HOURS 1
DAYS 2IF LESS THAN ONE DAY,RECORD HOURS. WEEKS 3IF LESS THAN ONE WEEK,RECORD DAYS. DON'T KNOW . . . . 998
446 Who checked on your health HEALTH PERSONNELat that time? DOCTOR . . . . . . . . . 11
NURSE/MIDWIFE 12PROBE FOR MOST QUALIFIED ASSISTANTPERSON. NURSE . . . . . . . 13
OTHER PERSONTRADITIONAL BIRTH
ATTENDANT 21COMMUNITY/VILLAGE
HEALTHWORKER . . . . . 22
OTHER 96(SPECIFY)
447 Where did this first check HOMEtake place? YOUR HOME . . . . . 11
OTHER HOME. . . . . 12PROBE TO IDENTIFY THE TYPEOF SOURCE AND CIRCLE THE PUBLIC SECTORAPPROPRIATE CODE. NATIONAL
HOSPITAL . . . . . 21IF UNABLE TO DETERMINE REFERRALIF A HOSPITAL, HEALTH HOSPITAL . . . . . 22CENTER, OR CLINIC IS COMMUNITYPUBLIC OR PRIVATE HEALTH CEN. .. 23MEDICAL, WRITE THE HEALTH POSTS .. 24THE NAME OF THE PLACE. SISCa POSTS . . . . . 25
MOBILE CLINIC 27OTHER PUBLIC
SEC. 26(NAME OF PLACE) (SPECIFY)
NON-GOVT (NGO) SECTORMARIE STOPES .... 31OTHER
NGOS 36SPECIFY
PRIVATE MED. SECTORPVT. HOSPITAL/
CLINIC . . . . . . . . . 41OTHER PRIVATEMED. 46
(SPECIFY)
OTHER 96(SPECIFY)
448 CHECK 442: YES
(SKIP TO 452A)
449 In the two months after (NAME)was born, did any health YES . . . . . . . . . . . . . . . 1care provider check on his/her NO . . . . . . . . . . . . . . . 2health? (SKIP TO 452A)
DON'T KNOW . . . . . . . 8
NOT ASKED
| 331Appendix E

LAST BIRTH NEXT-TO-LAST BIRTH SECOND-FROM-LAST BIRTH
NO. QUESTIONS AND FILTERS NAME __________________ NAME ________________ NAME _________________
450 How many hours, days or weeks HRS AFTERafter the birth of (NAME) did the BIRTH . . 1first check take place? DAYS AFTER
BIRTH . . 2IF LESS THAN ONE DAY, WKS AFTERRECORD HOURS. BIRTH . . 3IF LESS THAN ONE WEEK,RECORD DAYS. DON'T KNOW . . . . 998
451 Who checked on (NAME)'s health HEALTH PERSONNELat that time? DOCTOR . . . . . . . . . 11
NURSE/MIDWIFE 12PROBE FOR MOST QUALIFIED ASSISTANTPERSON. NURSE . . . . . . . 13
OTHER PERSONTRADITIONAL BIRTH
ATTENDANT 21COMMUNITY/VILLAGE
HEALTHWORKER . . . . . 22
OTHER 96(SPECIFY)
452 Where did this first check of HOME(NAME) take place? YOUR HOME . . . . . 11
OTHER HOME. . . . . 12PROBE TO IDENTIFY THE TYPEOF SOURCE AND CIRCLE THE PUBLIC SECTORAPPROPRIATE CODE. NATIONAL
HOSPITAL . . . . . 21IF UNABLE TO DETERMINE REFERRALIF A HOSPITAL, HEALTH HOSPITAL . . . . . 22CENTER, OR CLINIC IS COMMUNITYPUBLIC OR PRIVATE HEALTH CEN. .. 23MEDICAL, WRITE THE HEALTH POSTS .. 24THE NAME OF THE PLACE. SISCa POSTS . . . . . 25
MOBILE CLINIC 27OTHER PUBLIC
SEC. 26(NAME OF PLACE) (SPECIFY)
NON-GOVT (NGO) SECTORMARIE STOPES .... 31OTHER
NGOS 36SPECIFY
PRIVATE MED. SECTORPVT. HOSPITAL/
CLINIC . . . . . . . . . 41OTHER PRIVATEMED. 46
(SPECIFY)OTHER 96
(SPECIFY)452A What are the symptoms of the
infant within one month after POOR SUCKLING .... Adelivery indicating the need to FAST BREATHING .... Bseek immediate health care? SEVERE CHEST
INDRAWING .......... CHYPOTHERMIA .......... DFEVER........................... EDIFFICULT TO WAKE/
LETHARGIC.............. FPROBE: Any other? PUSTULES ON SKIN
1 LARGE OR>10 SMALL ONES … G
RECORD ALL MENTIONED SEVERE UMBILICAL INFECTION SMELLINGDISCHARGE .......... H
OTHER X(SPECIFY)
DON'T KNOW . . . . . . . Z
332 | Appendix E

LAST BIRTH NEXT-TO-LAST BIRTH SECOND-FROM-LAST BIRTH
NO. QUESTIONS AND FILTERS NAME __________________ NAME ________________ NAME _________________
453 In the first two months after delivery, did you receive a YES . . . . . . . . . . . . . . . 1vitamin A dose (like this/any of these)? NO . . . . . . . . . . . . . . . 2
SHOW COMMON TYPES OF DON'T KNOW . . . . . . . 8CAPSULES.
454 Has your menstrual period returned YES . . . . . . . . . . . . . . . 1since the birth of (NAME)? (SKIP TO 456)
NO . . . . . . . . . . . . . . . 2(SKIP TO 457)
455 Did your period return between YES . . . . . . . . . . . . . . 1 YES . . . . . . . . . . . . . . 1the birth of (NAME) and your NO . . . . . . . . . . . . . . 2 NO . . . . . . . . . . . . . . 2next pregnancy? (SKIP TO 459) (SKIP TO 459)
456 For how many months after the birth of (NAME) did you not have MONTHS . . . MONTHS . . . MONTHS . . . a period?
DON'T KNOW . . . . . . . 98 DON'T KNOW . . . . . 98 DON'T KNOW . . . . . 98
457 CHECK 226: NOT PREGNANTPREG- OR
IS RESPONDENT PREGNANT? NANT UNSURE(SKIP TO 459)
458 Have you begun to have YES . . . . . . . . . . . . . . . 1sexual intercourse again since NO . . . . . . . . . . . . . . . 2the birth of (NAME)? (SKIP TO 460)
459 For how many months after the birth of (NAME) did you not have MONTHS . . . MONTHS . . . MONTHS . . . sexual intercourse?
DON'T KNOW . . . . . . . 98 DON'T KNOW . . . . . 98 DON'T KNOW . . . . . 98
460 Did you ever breastfeed (NAME)? YES . . . . . . . . . . . . . . . 1 YES . . . . . . . . . . . . . . 1 YES . . . . . . . . . . . . . . 1NO . . . . . . . . . . . . . . . 2 NO . . . . . . . . . . . . . . 2 NO . . . . . . . . . . . . . . 2
(SKIP TO 467) (SKIP TO 467) (SKIP TO 467)
461 How long after birth did you first put (NAME) to the breast?
IMMEDIATELY. . . . 000IF LESS THAN 1 HOUR, RECORD ‘00' HOURS.IF LESS THAN 24 HOURS, HOURS 1 RECORD HOURS.OTHERWISE, RECORD DAYS. DAYS 2
462 In the first three days after YES . . . . . . . . . . . . . . . 1delivery, was (NAME) given NO . . . . . . . . . . . . . . . 2anything to drink other than (SKIP TO 464)breast milk?
| 333Appendix E
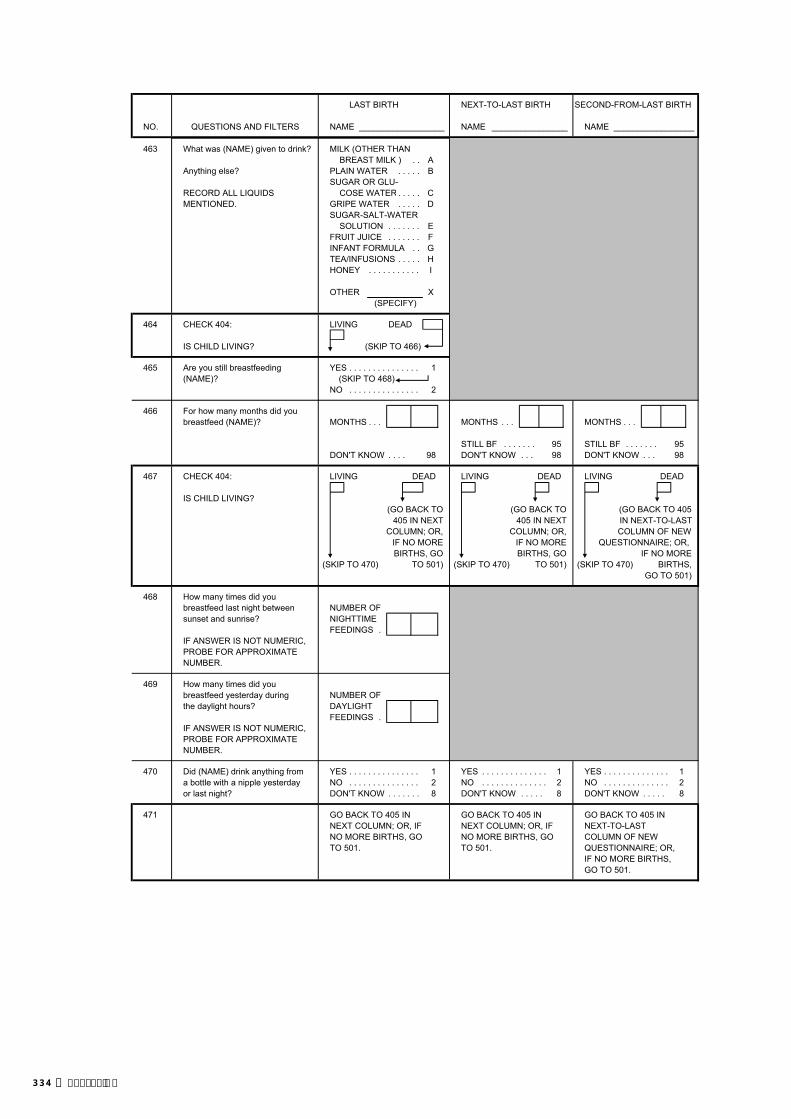
LAST BIRTH NEXT-TO-LAST BIRTH SECOND-FROM-LAST BIRTH
NO. QUESTIONS AND FILTERS NAME __________________ NAME ________________ NAME _________________
463 What was (NAME) given to drink? MILK (OTHER THANBREAST MILK ) . . A
Anything else? PLAIN WATER . . . . . BSUGAR OR GLU-
RECORD ALL LIQUIDS COSE WATER . . . . . CMENTIONED. GRIPE WATER . . . . . D
SUGAR-SALT-WATERSOLUTION . . . . . . . E
FRUIT JUICE . . . . . . . FINFANT FORMULA . . GTEA/INFUSIONS . . . . . HHONEY . . . . . . . . . . . I
OTHER X(SPECIFY)
464 CHECK 404: LIVING DEAD
IS CHILD LIVING? (SKIP TO 466)
465 Are you still breastfeeding YES . . . . . . . . . . . . . . . 1(NAME)? (SKIP TO 468)
NO . . . . . . . . . . . . . . . 2
466 For how many months did youbreastfeed (NAME)? MONTHS . . . MONTHS . . . MONTHS . . .
STILL BF . . . . . . . 95 STILL BF . . . . . . . 95DON'T KNOW . . . . 98 DON'T KNOW . . . 98 DON'T KNOW . . . 98
467 CHECK 404: LIVING DEAD LIVING DEAD LIVING DEAD
IS CHILD LIVING?(GO BACK TO (GO BACK TO (GO BACK TO 405
405 IN NEXT 405 IN NEXT IN NEXT-TO-LAST COLUMN; OR, COLUMN; OR, COLUMN OF NEW
IF NO MORE IF NO MORE QUESTIONNAIRE; OR, BIRTHS, GO BIRTHS, GO IF NO MORE
(SKIP TO 470) TO 501) (SKIP TO 470) TO 501) (SKIP TO 470) BIRTHS, GO TO 501)
468 How many times did you breastfeed last night between NUMBER OFsunset and sunrise? NIGHTTIME
FEEDINGS . IF ANSWER IS NOT NUMERIC, PROBE FOR APPROXIMATE NUMBER.
469 How many times did you breastfeed yesterday during NUMBER OFthe daylight hours? DAYLIGHT
FEEDINGS . IF ANSWER IS NOT NUMERIC, PROBE FOR APPROXIMATE NUMBER.
470 Did (NAME) drink anything from YES . . . . . . . . . . . . . . . 1 YES . . . . . . . . . . . . . . 1 YES . . . . . . . . . . . . . . 1a bottle with a nipple yesterday NO . . . . . . . . . . . . . . . 2 NO . . . . . . . . . . . . . . 2 NO . . . . . . . . . . . . . . 2or last night? DON'T KNOW . . . . . . . 8 DON'T KNOW . . . . . 8 DON'T KNOW . . . . . 8
471 GO BACK TO 405 IN GO BACK TO 405 IN GO BACK TO 405 IN NEXT COLUMN; OR, IF NEXT COLUMN; OR, IF NEXT-TO-LAST NO MORE BIRTHS, GO NO MORE BIRTHS, GO COLUMN OF NEWTO 501. TO 501. QUESTIONNAIRE; OR,
IF NO MORE BIRTHS,GO TO 501.
334 | Appendix E

SECTION 5. CHILD IMMUNIZATION AND HEALTH AND CHILD'S AND WOMAN'S NUTRITION
501 ENTER IN THE TABLE THE LINE NUMBER, NAME, AND SURVIVAL STATUS OF EACH BIRTH IN 2004OR LATER.ASK THE QUESTIONS ABOUT ALL OF THESE BIRTHS. BEGIN WITH THE LAST BIRTH.(IF THERE ARE MORE THAN 3 BIRTHS, USE LAST 2 COLUMNS OF ADDITIONAL QUESTIONNAIRES).
502 LAST BIRTH NEXT-TO-LAST BIRTH SECOND-FROM-LAST BIRTHLINE NUMBER LINE LINE LINE FROM 212 NUMBER . . . . . . . . NUMBER . . . . . . . . NUMBER . . . . . . .
503 NAME NAME NAMEFROM 212AND 216 LIVING DEAD LIVING DEAD LIVING DEAD
(GO TO 503 (GO TO 503 (GO TO 503 IN NEXT- IN NEXT COLUMN IN NEXT COLUMN TO-LAST COLUMN OF
OR, IF NO MORE OR, IF NO MORE NEW QUESTIONNAIRE, BIRTHS, GO TO 573) BIRTHS, GO TO 573) OR IF NO MORE
BIRTHS, GO TO 573)
504 Do you have a card or (LISIO)where (NAME'S) YES, SEEN . . . . . . . . . . . . . 1 YES, SEEN . . . . . . . . . . . . . 1 YES, SEEN . . . . . . . . . . . 1vaccinations are (SKIP TO 506) (SKIP TO 506) (SKIP TO 506)written down? YES, NOT SEEN . . . . . . . . 2 YES, NOT SEEN . . . . . . . . 2 YES, NOT SEEN . . . . . . . 2IF YES: (SKIP TO 508) (SKIP TO 508) (SKIP TO 508)May I see it please? NO CARD . . . . . . . . . . . . . . 3 NO CARD . . . . . . . . . . . . . . 3 NO CARD . . . . . . . . . . . . . 3
505 Did you ever have YES . . . . . . . . . . . . . . . . . . . 1 YES . . . . . . . . . . . . . . . . . . . 1 YES . . . . . . . . . . . . . . . . . . 1a card or LISIO (SKIP TO 508) (SKIP TO 508) (SKIP TO 508)for (NAME)? NO . . . . . . . . . . . . . . . . . . . 2 NO . . . . . . . . . . . . . . . . . . . 2 NO . . . . . . . . . . . . . . . . . . 2
506 (1) COPY VACCINATION DATE FOR EACH VACCINE FROM THE CARD OR LISIO. (2) WRITE ‘44' IN ‘DAY' COLUMN IF CARD SHOWS THAT A VACCINATION WAS GIVEN, BUT NO DATE IS RECORDED.(3) IF MORE THAN TWO VITAMIN 'A' DOSES, RECORD DATES FOR MOST RECENT AND SECOND MOST RECENT DOSES.
LAST BIRTH NEXT-TO-LAST BIRTH SECOND-FROM-LAST BIRTHDAY MONTH YEAR DAY MONTH YEAR DAY MONTH YEAR
506A CHECK 506: BCG TO MEASLES OTHER BCG TO MEASLES OTHER BCG TO MEASLES OTHERALL RECORDED ALL RECORDED ALL RECORDED
(GO TO 510) (GO TO 510) (GO TO 510)
MEASLES MEA
VIT AVITAMIN A (2ndMOST RECENT)
VITAMIN A(MOST RECENT) VIT A
BCG
P0
P1
P2
P3
D1
VIT A
D2
D3
H1
H2
H3
BCG
P0
P1
P2
BCG
POLIO 0 (POLIO GIVEN AT BIRTH)
POLIO 1
POLIO 2
POLIO 3
DPT 1
DPT 2
VIT A
D2
D3
MEA
DPT 3
P3
D1
HEP.B 1
HEP.B 2
HEP.B 3
H1
H2
H3
| 335Appendix E

LAST BIRTH NEXT-TO-LAST BIRTH SECOND-FROM-LAST BIRTH
NO. QUESTIONS AND FILTERS NAME ________________ NAME ________________ NAME _________________
507 Has (NAME) received any YES . . . . . . . . . . . . . . 1 YES . . . . . . . . . . . . . . 1 YES . . . . . . . . . . . . . . 1vaccinations that are not recorded (PROBE FOR (PROBE FOR (PROBE FORon this card (LISIO), including VACCINATIONS AND VACCINATIONS AND VACCINATIONS AND vaccinations received in a national WRITE ‘66' IN THE WRITE ‘66' IN THE WRITE ‘66' IN THEimmunization day campaign? CORRESPONDING CORRESPONDING CORRESPONDING
DAY COLUMN IN 506) DAY COLUMN IN 506) DAY COLUMN IN 506)
RECORD ‘YES' ONLY IF (SKIP TO 510) (SKIP TO 510) (SKIP TO 510)RESPONDENT MENTIONS BCG, POLIO 0-3, DPT 1-3, HEP 1-3 NO . . . . . . . . . . . . . . 2 NO . . . . . . . . . . . . . . 2 NO . . . . . . . . . . . . . . 2AND/OR MEASLES VACCINES. (SKIP TO 510) (SKIP TO 510) (SKIP TO 510)
DON'T KNOW . . . . . 8 DON'T KNOW . . . . . 8 DON'T KNOW . . . . . 8
508 Did (NAME) ever receive anyvaccinations to prevent him/her from getting diseases, including YES . . . . . . . . . . . . . . 1 YES . . . . . . . . . . . . . . 1 YES . . . . . . . . . . . . . . 1vaccinations received in a NO . . . . . . . . . . . . . . 2 NO . . . . . . . . . . . . . . 2 NO . . . . . . . . . . . . . . 2national immunization (SKIP TO 512) (SKIP TO 512) (SKIP TO 512)campaign? DON'T KNOW . . . . . 8 DON'T KNOW . . . . . 8 DON'T KNOW . . . . . 8
509 Please tell me if (NAME) received any of the following vaccinations:
509A A BCG vaccination against YES . . . . . . . . . . . . . . 1 YES . . . . . . . . . . . . . . 1 YES . . . . . . . . . . . . . . 1tuberculosis, that is, an injection NO . . . . . . . . . . . . . . 2 NO . . . . . . . . . . . . . . 2 NO . . . . . . . . . . . . . . 2in the arm or shoulder that usually DON'T KNOW . . . . . 8 DON'T KNOW . . . . . 8 DON'T KNOW . . . . . 8causes a scar?
509B Polio vaccine, that is, drops in the YES . . . . . . . . . . . . . . 1 YES . . . . . . . . . . . . . . 1 YES . . . . . . . . . . . . . . 1mouth? NO . . . . . . . . . . . . . . 2 NO . . . . . . . . . . . . . . 2 NO . . . . . . . . . . . . . . 2
(SKIP TO 509E) (SKIP TO 509E) (SKIP TO 509E)DON'T KNOW . . . . . 8 DON'T KNOW . . . . . 8 DON'T KNOW . . . . . 8
509C Was the first polio vaccine FIRST 2 WEEKS . . . 1 FIRST 2 WEEKS . . . 1 FIRST 2 WEEKS . . . 1received in the first two weeks LATER . . . . . . . . . . . . 2 LATER . . . . . . . . . . . . 2 LATER . . . . . . . . . . . . 2after birth or later?
509D How many times was the polio NUMBER NUMBER NUMBERvaccine received? OF TIMES . . . . . OF TIMES . . . . . OF TIMES . . . . .
509E A DPT vaccination, that is, an YES . . . . . . . . . . . . . . 1 YES . . . . . . . . . . . . . . 1 YES . . . . . . . . . . . . . . 1injection given in the thigh or NO . . . . . . . . . . . . . . 2 NO . . . . . . . . . . . . . . 2 NO . . . . . . . . . . . . . . 2buttocks, sometimes at the (SKIP TO 509G) (SKIP TO 509G) (SKIP TO 509G)same time as polio drops? DON'T KNOW . . . . . 8 DON'T KNOW . . . . . 8 DON'T KNOW . . . . . 8
509F How many times was a DPT NUMBER NUMBER NUMBERvaccination received? OF TIMES . . . . . OF TIMES . . . . . OF TIMES . . . . .
509G A HEP.B vaccination, that is, an YES . . . . . . . . . . . . . . 1 YES . . . . . . . . . . . . . . 1 YES . . . . . . . . . . . . . . 1injection given in the right NO . . . . . . . . . . . . . . 2 NO . . . . . . . . . . . . . . 2 NO . . . . . . . . . . . . . . 2thigh, given with DPT? (SKIP TO 509I) (SKIP TO 509I) (SKIP TO 509I)
DON'T KNOW . . . . . 8 DON'T KNOW . . . . . 8 DON'T KNOW . . . . . 8
509H How many times was a HEP.B NUMBER NUMBER NUMBERvaccination received? OF TIMES . . . . . OF TIMES . . . . . OF TIMES . . . . .
509I A measles injection YES . . . . . . . . . . . . . . 1 YES . . . . . . . . . . . . . . 1 YES . . . . . . . . . . . . . . 1 that is, a shot in the NO . . . . . . . . . . . . . . 2 NO . . . . . . . . . . . . . . 2 NO . . . . . . . . . . . . . . 2arm at the age of 9 months or DON'T KNOW . . . . . 8 DON'T KNOW . . . . . 8 DON'T KNOW . . . . . 8older - to prevent him/her from getting measles?
510 Were any of the vaccinations YES . . . . . . . . . . . . . . 1 YES . . . . . . . . . . . . . . 1 YES . . . . . . . . . . . . . . 1(NAME) received during the last NO . . . . . . . . . . . . . . 2 NO . . . . . . . . . . . . . . 2 NO . . . . . . . . . . . . . . 2two years given as part of a NO VACCINATION IN NO VACCINATION IN NO VACCINATION INnational immunization day THE LAST 2 YRS. 3 THE LAST 2 YRS. 3 THE LAST 2 YRS. 3campaign? DON'T KNOW . . . 8 DON'T KNOW . . . 8 DON'T KNOW . . . 8
(SKIP TO 512) (SKIP TO 512) (SKIP TO 512)
336 | Appendix E

LAST BIRTH NEXT-TO-LAST BIRTH SECOND-FROM-LAST BIRTH
NO. QUESTIONS AND FILTERS NAME ________________ NAME ________________ NAME _________________
511 At which national immunization MEASLES . . . . . . A MEASLES . . . . . . A MEASLES . . . . . . Aday campaigns did (NAME) (JUNE 2009) (JUNE 2009) (JUNE 2009)receive vaccinations?
512 CHECK 506: DATE/`44' DATE/`44' DATE/`44'FOR OTHER FOR OTHER FOR OTHER
DATE SHOWN OR `44' RECORED MOST MOST MOSTFOR VITAMIN A DOSE RECENT RECENT RECENT
VITAMIN VITAMIN VITAMINA DOSE A DOSE A DOSE
(SKIP TO (SKIP TO (SKIP TO514) 514) 514)
513 According to (NAME)'s health card,he/she received a vitamin A dose(like this/any of these) in (MONTHAND YEAR OF MOST RECENTDOSE FROM LISIO). YES . . . . . . . . . . . . . . 1 YES . . . . . . . . . . . . . . 1 YES . . . . . . . . . . . . . . 1Has (NAME) received another (SKIP TO 515) (SKIP TO 515) (SKIP TO 515)vitamin A dose since then? NO . . . . . . . . . . . . . . 2 NO . . . . . . . . . . . . . . 2 NO . . . . . . . . . . . . . . 2SHOW COMMON TYPE OF (SKIP TO 515A) (SKIP TO 515A) (SKIP TO 515A)CAPSULES. DON'T KNOW . . . . . 8 DON'T KNOW . . . . . 8 DON'T KNOW . . . . . 8
514 HAS (NAME) ever receiveda vitamin A dose (like this/ YES . . . . . . . . . . . . . . 1 YES . . . . . . . . . . . . . . 1 YES . . . . . . . . . . . . . . 1any of these)? NO . . . . . . . . . . . . . . 2 NO . . . . . . . . . . . . . . 2 NO . . . . . . . . . . . . . . 2SHOW COMMON TYPE OF (SKIP TO 515A) (SKIP TO 515A) (SKIP TO 515A)CAPSULES. DON'T KNOW . . . . . 8 DON'T KNOW . . . . . 8 DON'T KNOW . . . . . 8
515 Did (NAME) receive a vitamin A YES . . . . . . . . . . . . . . 1 YES . . . . . . . . . . . . . . 1 YES . . . . . . . . . . . . . . 1dose within the last six months? NO . . . . . . . . . . . . . . 2 NO . . . . . . . . . . . . . . 2 NO . . . . . . . . . . . . . . 2
DON'T KNOW . . . . . 8 DON'T KNOW . . . . . 8 DON'T KNOW . . . . . 8
515A In the last six months, did (NAME)show following symptoms YES NO YES NO YES NO
Less movement in evenings? MOVEMENT... 1 2 MOVEMENT... 1 2 MOVEMENT... 1 2Trip/bump over things in evenings? TRIP. . . . . . . . 1 2 TRIP. . . . . . . . 1 2 TRIP. . . . . . . . 1 2
516 In the last seven days, did (NAME)take iron pills, sprinkles with iron/ iron syrup (like this/any of these)?SHOW COMMON TYPES OF YES . . . . . . . . . . . . . . 1 YES . . . . . . . . . . . . . . 1 YES . . . . . . . . . . . . . . 1PILLS/SYRUPS. NO . . . . . . . . . . . . . . 2 NO . . . . . . . . . . . . . . 2 NO . . . . . . . . . . . . . . 2
DON'T KNOW . . . . . 8 DON'T KNOW . . . . . 8 DON'T KNOW . . . . . 8
517 Has (NAME) taken any drug for YES . . . . . . . . . . . . . . 1 YES . . . . . . . . . . . . . . 1 YES . . . . . . . . . . . . . . 1intestinal worms in the last six NO . . . . . . . . . . . . . . 2 NO . . . . . . . . . . . . . . 2 NO . . . . . . . . . . . . . . 2months? DON'T KNOW . . . . . 8 DON'T KNOW . . . . . 8 DON'T KNOW . . . . . 8
517A Has (NAME) ever received YES . . . . . . . . . . . . . . 1 YES . . . . . . . . . . . . . . 1 YES . . . . . . . . . . . . . . 1supplementary food? NO . . . . . . . . . . . . . . 2 NO . . . . . . . . . . . . . . 2 NO . . . . . . . . . . . . . . 2
DON'T KNOW . . . . . 8 DON'T KNOW . . . . . 8 DON'T KNOW . . . . . 8
518 Has (NAME) had diarrhea in the YES . . . . . . . . . . . . . . 1 YES . . . . . . . . . . . . . . 1 YES . . . . . . . . . . . . . . 1last 2 weeks? NO . . . . . . . . . . . . . . 2 NO . . . . . . . . . . . . . . 2 NO . . . . . . . . . . . . . . 2
(SKIP TO 533) (SKIP TO 533) (SKIP TO 533)DON'T KNOW . . . . . 8 DON'T KNOW . . . . . 8 DON'T KNOW . . . . . 8
519 Was there any blood in the stools? YES . . . . . . . . . . . . . . 1 YES . . . . . . . . . . . . . . 1 YES . . . . . . . . . . . . . . 1NO . . . . . . . . . . . . . . 2 NO . . . . . . . . . . . . . . 2 NO . . . . . . . . . . . . . . 2DON'T KNOW . . . . . 8 DON'T KNOW . . . . . 8 DON'T KNOW . . . . . 8
| 337Appendix E
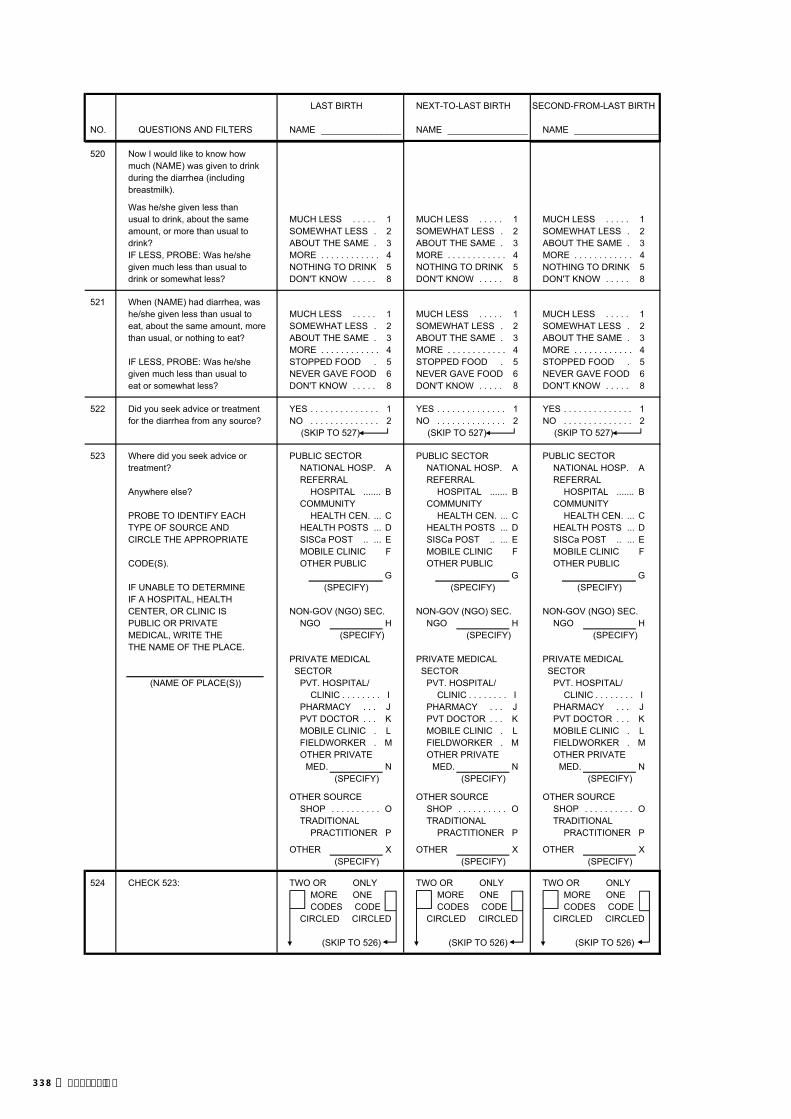
LAST BIRTH NEXT-TO-LAST BIRTH SECOND-FROM-LAST BIRTH
NO. QUESTIONS AND FILTERS NAME ________________ NAME ________________ NAME _________________
520 Now I would like to know how much (NAME) was given to drink during the diarrhea (includingbreastmilk).
Was he/she given less thanusual to drink, about the same MUCH LESS . . . . . 1 MUCH LESS . . . . . 1 MUCH LESS . . . . . 1amount, or more than usual to SOMEWHAT LESS . 2 SOMEWHAT LESS . 2 SOMEWHAT LESS . 2drink? ABOUT THE SAME . 3 ABOUT THE SAME . 3 ABOUT THE SAME . 3IF LESS, PROBE: Was he/she MORE . . . . . . . . . . . . 4 MORE . . . . . . . . . . . . 4 MORE . . . . . . . . . . . . 4given much less than usual to NOTHING TO DRINK 5 NOTHING TO DRINK 5 NOTHING TO DRINK 5drink or somewhat less? DON'T KNOW . . . . . 8 DON'T KNOW . . . . . 8 DON'T KNOW . . . . . 8
521 When (NAME) had diarrhea, was he/she given less than usual to MUCH LESS . . . . . 1 MUCH LESS . . . . . 1 MUCH LESS . . . . . 1eat, about the same amount, more SOMEWHAT LESS . 2 SOMEWHAT LESS . 2 SOMEWHAT LESS . 2than usual, or nothing to eat? ABOUT THE SAME . 3 ABOUT THE SAME . 3 ABOUT THE SAME . 3
MORE . . . . . . . . . . . . 4 MORE . . . . . . . . . . . . 4 MORE . . . . . . . . . . . . 4IF LESS, PROBE: Was he/she STOPPED FOOD . 5 STOPPED FOOD . 5 STOPPED FOOD . 5given much less than usual to NEVER GAVE FOOD 6 NEVER GAVE FOOD 6 NEVER GAVE FOOD 6eat or somewhat less? DON'T KNOW . . . . . 8 DON'T KNOW . . . . . 8 DON'T KNOW . . . . . 8
522 Did you seek advice or treatment YES . . . . . . . . . . . . . . 1 YES . . . . . . . . . . . . . . 1 YES . . . . . . . . . . . . . . 1for the diarrhea from any source? NO . . . . . . . . . . . . . . 2 NO . . . . . . . . . . . . . . 2 NO . . . . . . . . . . . . . . 2
(SKIP TO 527) (SKIP TO 527) (SKIP TO 527)
523 Where did you seek advice or PUBLIC SECTOR PUBLIC SECTOR PUBLIC SECTORtreatment? NATIONAL HOSP. A NATIONAL HOSP. A NATIONAL HOSP. A
REFERRAL REFERRAL REFERRAL Anywhere else? HOSPITAL ....... B HOSPITAL ....... B HOSPITAL ....... B
COMMUNITY COMMUNITY COMMUNITY PROBE TO IDENTIFY EACH HEALTH CEN. ... C HEALTH CEN. ... C HEALTH CEN. ... CTYPE OF SOURCE AND HEALTH POSTS ... D HEALTH POSTS ... D HEALTH POSTS ... DCIRCLE THE APPROPRIATE SISCa POST .. ... E SISCa POST .. ... E SISCa POST .. ... E
MOBILE CLINIC F MOBILE CLINIC F MOBILE CLINIC FCODE(S). OTHER PUBLIC OTHER PUBLIC OTHER PUBLIC
G G GIF UNABLE TO DETERMINE (SPECIFY) (SPECIFY) (SPECIFY)IF A HOSPITAL, HEALTH CENTER, OR CLINIC IS NON-GOV (NGO) SEC. NON-GOV (NGO) SEC. NON-GOV (NGO) SEC.PUBLIC OR PRIVATE NGO H NGO H NGO HMEDICAL, WRITE THE (SPECIFY) (SPECIFY) (SPECIFY)THE NAME OF THE PLACE.
PRIVATE MEDICAL PRIVATE MEDICAL PRIVATE MEDICAL SECTOR SECTOR SECTOR
(NAME OF PLACE(S)) PVT. HOSPITAL/ PVT. HOSPITAL/ PVT. HOSPITAL/CLINIC . . . . . . . . I CLINIC . . . . . . . . I CLINIC . . . . . . . . I
PHARMACY . . . J PHARMACY . . . J PHARMACY . . . JPVT DOCTOR . . . K PVT DOCTOR . . . K PVT DOCTOR . . . KMOBILE CLINIC . L MOBILE CLINIC . L MOBILE CLINIC . LFIELDWORKER . M FIELDWORKER . M FIELDWORKER . MOTHER PRIVATE OTHER PRIVATE OTHER PRIVATE
MED. N MED. N MED. N(SPECIFY) (SPECIFY) (SPECIFY)
OTHER SOURCE OTHER SOURCE OTHER SOURCESHOP . . . . . . . . . . O SHOP . . . . . . . . . . O SHOP . . . . . . . . . . OTRADITIONAL TRADITIONAL TRADITIONAL
PRACTITIONER P PRACTITIONER P PRACTITIONER P
OTHER X OTHER X OTHER X(SPECIFY) (SPECIFY) (SPECIFY)
524 CHECK 523: TWO OR ONLY TWO OR ONLY TWO OR ONLYMORE ONE MORE ONE MORE ONECODES CODE CODES CODE CODES CODE
CIRCLED CIRCLED CIRCLED CIRCLED CIRCLED CIRCLED
(SKIP TO 526) (SKIP TO 526) (SKIP TO 526)
338 | Appendix E

LAST BIRTH NEXT-TO-LAST BIRTH SECOND-FROM-LAST BIRTH
NO. QUESTIONS AND FILTERS NAME ________________ NAME ________________ NAME _________________
525 Where did you first seek advice or treatment?
FIRST PLACE . . . FIRST PLACE . . . FIRST PLACE . . . USE LETTER CODE FROM 523.
526 How many days after the diarrheabegan did you first seek adviceor treatment for (NAME)? DAYS . . . . . DAYS . . . . . DAYS . . . . . IF THE SAME DAY, RECORD '00'.
527 Does (NAME) still have diarrhea? YES . . . . . . . . . . . . . . 1 YES . . . . . . . . . . . . . . 1 YES . . . . . . . . . . . . . . 1NO . . . . . . . . . . . . . . 2 NO . . . . . . . . . . . . . . 2 NO . . . . . . . . . . . . . . 2DON'T KNOW . . . . . 8 DON'T KNOW . . . . . 8 DON'T KNOW . . . . . 8
528 Was he/she given any of the following to drink at any time sincehe/she started having the diarrhea:
YES NO DK YES NO DK YES NO DK
A fluid made from a special packet called Oralit? FLUID FROM FLUID FROM FLUID FROM
ORS PKT . . 1 2 8 ORS PKT . . 1 2 8 ORS PKT . . 1 2 8
A government-recommended HOMEMADE HOMEMADE HOMEMADEhomemade fluid? FLUID . . . 1 2 8 FLUID . . . 1 2 8 FLUID . . . 1 2 8
529 Was anything (else) given to YES . . . . . . . . . . . . . . 1 YES . . . . . . . . . . . . . . 1 YES . . . . . . . . . . . . . . 1treat the diarrhea? NO . . . . . . . . . . . . . . 2 NO . . . . . . . . . . . . . . 2 NO . . . . . . . . . . . . . . 2
(SKIP TO 533) (SKIP TO 533) (SKIP TO 533)DON'T KNOW . . . . . 8 DON'T KNOW . . . . . 8 DON'T KNOW . . . . . 8
530 What (else) was given to treat PILL OR SYRUP PILL OR SYRUP PILL OR SYRUPthe diarrhea? ANTIBIOTIC . . . . . A ANTIBIOTIC . . . . . A ANTIBIOTIC . . . . . A
ANTIMOTILITY . B ANTIMOTILITY . B ANTIMOTILITY . BAnything else? ZINC . . . . . . . . . . C ZINC . . . . . . . . . . C ZINC . . . . . . . . . . C
OTHER (NOT ANTI- OTHER (NOT ANTI- OTHER (NOT ANTI-RECORD ALL TREATMENTS BIOTIC, ANTI- BIOTIC, ANTI- BIOTIC, ANTI-GIVEN. MOTILITY, OR MOTILITY, OR MOTILITY, OR
ZINC) . . . . . . . . D ZINC) . . . . . . . . D ZINC) . . . . . . . . DUNKNOWN PILL UNKNOWN PILL UNKNOWN PILL
OR SYRUP . . . E OR SYRUP . . . E OR SYRUP . . . E
INJECTION INJECTION INJECTIONANTIBIOTIC . . . . . F ANTIBIOTIC . . . . . F ANTIBIOTIC . . . . . FNON-ANTIBIOTIC. G NON-ANTIBIOTIC. G NON-ANTIBIOTIC. GUNKNOWN UNKNOWN UNKNOWN
INJECTION . . . H INJECTION . . . H INJECTION . . . H
(IV) INTRAVENOUS . I (IV) INTRAVENOUS . I (IV) INTRAVENOUS . I
HOME REMEDY/ HOME REMEDY/ HOME REMEDY/HERBAL MED- HERBAL MED- HERBAL MED-ICINE . . . . . . . . . . J ICINE . . . . . . . . . . J ICINE . . . . . . . . . . J
OTHER X OTHER X OTHER X(SPECIFY) (SPECIFY) (SPECIFY)
531 CHECK 530: CODE "C" CODE "C" CODE "C" CODE "C" CODE "C" CODE "C"CIRCLED NOT CIRCLED NOT CIRCLED NOT
CIRCLED CIRCLED CIRCLED
GIVEN ZINC?(SKIP TO 533) (SKIP TO 533) (SKIP TO 533)
a)
b)
| 339Appendix E

LAST BIRTH NEXT-TO-LAST BIRTH SECOND-FROM-LAST BIRTH
NO. QUESTIONS AND FILTERS NAME ________________ NAME ________________ NAME _________________
532 How many times was (NAME) given zinc? TIMES . . . . . TIMES . . . . . TIMES . . . . .
DON'T KNOW . . . . . . 98 DON'T KNOW . . . . . . 98 DON'T KNOW . . . . . . 98
533 Has (NAME) been ill with a fever YES . . . . . . . . . . . . . . 1 YES . . . . . . . . . . . . . . 1 YES . . . . . . . . . . . . . . 1at any time in the last 2 weeks? NO . . . . . . . . . . . . . . 2 NO . . . . . . . . . . . . . . 2 NO . . . . . . . . . . . . . . 2
DON'T KNOW . . . . . 8 DON'T KNOW . . . . . 8 DON'T KNOW . . . . . 8
534 Has (NAME) had an illness with YES . . . . . . . . . . . . . . 1 YES . . . . . . . . . . . . . . 1 YES . . . . . . . . . . . . . . 1a cough at any time in the NO . . . . . . . . . . . . . . 2 NO . . . . . . . . . . . . . . 2 NO . . . . . . . . . . . . . . 2last 2 weeks? (SKIP TO 537) (SKIP TO 537) (SKIP TO 537)
DON'T KNOW . . . . . 8 DON'T KNOW . . . . . 8 DON'T KNOW . . . . . 8
535 When (NAME) had an illness with YES . . . . . . . . . . . . . . 1 YES . . . . . . . . . . . . . . 1 YES . . . . . . . . . . . . . . 1a cough, did he/she breathe faster NO . . . . . . . . . . . . . . 2 NO . . . . . . . . . . . . . . 2 NO . . . . . . . . . . . . . . 2than usual with short, rapid breaths (SKIP TO 538) (SKIP TO 538) (SKIP TO 538)or have difficulty breathing? DON'T KNOW . . . . . 8 DON'T KNOW . . . . . 8 DON'T KNOW . . . . . 8
536 Was the fast or difficult breathing CHEST ONLY . . . 1 CHEST ONLY . . . 1 CHEST ONLY . . . 1due to a problem in the chest or to NOSE ONLY . . . . . 2 NOSE ONLY . . . . . 2 NOSE ONLY . . . . . 2a blocked or runny nose? BOTH . . . . . . . . . . . . 3 BOTH . . . . . . . . . . . . 3 BOTH . . . . . . . . . . . . 3
OTHER 6 OTHER 6 OTHER 6(SPECIFY) (SPECIFY) (SPECIFY)
DON'T KNOW . . . . . 8 DON'T KNOW . . . . . 8 DON'T KNOW . . . . . 8(SKIP TO 538) (SKIP TO 538) (SKIP TO 538)
537 CHECK 533: YES NO OR DK YES NO OR DK YES NO OR DK
HAD FEVER?(GO BACK TO (GO BACK TO (GO TO 503
503 IN NEXT 503 IN NEXT IN NEXT-TO-LAST COLUMN; OR, COLUMN; OR, COLUMN OF NEW
IF NO MORE IF NO MORE QUESTIONNAIRE; OR, BIRTHS, GO BIRTHS, GO IF NO MORE BIRTHS,
TO 573) TO 573) GO TO 573)
538 Now I would like to know how much (NAME) was given to drink (including breastmilk) during theillness with a (fever/cough).Was he/she given less thanusual to drink, about the same MUCH LESS . . . . . 1 MUCH LESS . . . . . 1 MUCH LESS . . . . . 1amount, or more than usual to SOMEWHAT LESS . 2 SOMEWHAT LESS . 2 SOMEWHAT LESS . 2drink? ABOUT THE SAME . 3 ABOUT THE SAME . 3 ABOUT THE SAME . 3IF LESS, PROBE: Was he/she MORE . . . . . . . . . . . . 4 MORE . . . . . . . . . . . . 4 MORE . . . . . . . . . . . . 4given much less than usual to NOTHING TO DRINK 5 NOTHING TO DRINK 5 NOTHING TO DRINK 5drink or somewhat less? DON'T KNOW . . . . . 8 DON'T KNOW . . . . . 8 DON'T KNOW . . . . . 8
539 When (NAME) had a (fever/cough), was he/she given less than usual to eat, about the MUCH LESS . . . . . 1 MUCH LESS . . . . . 1 MUCH LESS . . . . . 1same amount, more than usual, SOMEWHAT LESS . 2 SOMEWHAT LESS . 2 SOMEWHAT LESS . 2or nothing to eat? ABOUT THE SAME . 3 ABOUT THE SAME . 3 ABOUT THE SAME . 3
MORE . . . . . . . . . . . . 4 MORE . . . . . . . . . . . . 4 MORE . . . . . . . . . . . . 4IF LESS, PROBE: Was he/she STOPPED FOOD . 5 STOPPED FOOD . 5 STOPPED FOOD . 5given much less than usual to NEVER GAVE FOOD 6 NEVER GAVE FOOD 6 NEVER GAVE FOOD 6eat or somewhat less? DON'T KNOW . . . . . 8 DON'T KNOW . . . . . 8 DON'T KNOW . . . . . 8
540 Did you seek advice or treatment YES . . . . . . . . . . . . . . 1 YES . . . . . . . . . . . . . . 1 YES . . . . . . . . . . . . . . 1for the illness from any source? NO . . . . . . . . . . . . . . 2 NO . . . . . . . . . . . . . . 2 NO . . . . . . . . . . . . . . 2
(SKIP TO 545) (SKIP TO 545) (SKIP TO 545)
340 | Appendix E

LAST BIRTH NEXT-TO-LAST BIRTH SECOND-FROM-LAST BIRTH
NO. QUESTIONS AND FILTERS NAME ________________ NAME ________________ NAME _________________
541 Where did you seek advice or PUBLIC SECTOR PUBLIC SECTOR PUBLIC SECTORtreatment? NATIONAL HOSP. A NATIONAL HOSP. A NATIONAL HOSP. A
REFERRAL REFERRAL REFERRAL Anywhere else? HOSPITAL ....... B HOSPITAL ....... B HOSPITAL ....... B
COMMUNITY COMMUNITY COMMUNITY PROBE TO IDENTIFY EACH HEALTH CEN. ... C HEALTH CEN. ... C HEALTH CEN. ... CTYPE OF SOURCE AND HEALTH POSTS ... D HEALTH POSTS ... D HEALTH POSTS ... DCIRCLE THE APPROPRIATE SISCa POST .. ... E SISCa POST .. ... E SISCa POST .. ... E
MOBILE CLINIC F MOBILE CLINIC F MOBILE CLINIC FCODE(S). OTHER PUBLIC OTHER PUBLIC OTHER PUBLIC
G G GIF UNABLE TO DETERMINE (SPECIFY) (SPECIFY) (SPECIFY)IF A HOSPITAL, HEALTH CENTER, OR CLINIC IS NON-GOVT. (NGO) SEC NON-GOVT. (NGO) SEC NON-GOVT. (NGO) SECPUBLIC OR PRIVATE NGO H NGO H NGO HMEDICAL, WRITE THE (SPECIFY) (SPECIFY) (SPECIFY)THE NAME OF THE PLACE.
PRIVATE MEDICAL PRIVATE MEDICAL PRIVATE MEDICAL(NAME OF PLACE(S)) SECTOR SECTOR SECTOR
PVT HOSPITAL/ PVT HOSPITAL/ PVT HOSPITAL/CLINIC . . . . . . . . I CLINIC . . . . . . . . I CLINIC . . . . . . . . I
PHARMACY . . . J PHARMACY . . . J PHARMACY . . . JPVT DOCTOR . . . K PVT DOCTOR . . . K PVT DOCTOR . . . KMOBILE CLINIC . L MOBILE CLINIC . L MOBILE CLINIC . LFIELDWORKER . M FIELDWORKER . M FIELDWORKER . MOTHER PRIVATE OTHER PRIVATE OTHER PRIVATE
MED. N MED. N MED. N(SPECIFY) (SPECIFY) (SPECIFY)
OTHER SOURCE OTHER SOURCE OTHER SOURCESHOP . . . . . . . . . . O SHOP . . . . . . . . . . O SHOP . . . . . . . . . . OTRADITIONAL TRADITIONAL TRADITIONAL
PRACTITIONER P PRACTITIONER P PRACTITIONER P
OTHER X OTHER X OTHER X(SPECIFY) (SPECIFY) (SPECIFY)
542 CHECK 541: TWO OR ONLY TWO OR ONLY TWO OR ONLYMORE ONE MORE ONE MORE ONECODES CODE CODES CODE CODES CODE
CIRCLED CIRCLED CIRCLED CIRCLED CIRCLED CIRCLED
(SKIP TO 544) (SKIP TO 544) (SKIP TO 544)
543 Where did you first seek advice or treatment?
FIRST PLACE . . . FIRST PLACE . . . FIRST PLACE . . . USE LETTER CODE FROM 541.
544 How many days after the illnessbegan did you first seek adviceor treatment for (NAME)? DAYS . . . . . DAYS . . . . . DAYS . . . . . IF THE SAME DAY, RECORD '00'.
545 Is (NAME) still sick with a (fever/ FEVER ONLY . . . . . 1 FEVER ONLY . . . . . 1 FEVER ONLY . . . . . 1cough)? COUGH ONLY . . . 2 COUGH ONLY . . . 2 COUGH ONLY . . . 2
BOTH FEVER AND BOTH FEVER AND BOTH FEVER ANDCOUGH . . . . . . . . 3 COUGH . . . . . . . . 3 COUGH . . . . . . . . 3
NO, NEITHER . . . . . 4 NO, NEITHER . . . . . 4 NO, NEITHER . . . . . 4DON'T KNOW . . . 8 DON'T KNOW . . . 8 DON'T KNOW . . . 8
546 At any time during the illness, did YES . . . . . . . . . . . . . . 1 YES . . . . . . . . . . . . . . 1 YES . . . . . . . . . . . . . . 1(NAME) take any drugs for the NO . . . . . . . . . . . . . . 2 NO . . . . . . . . . . . . . . 2 NO . . . . . . . . . . . . . . 2illness? (GO BACK TO 503 (GO BACK TO 503 (GO TO 503 IN
IN NEXT COLUMN; IN NEXT COLUMN; NEXT-TO-LASTOR, IF NO MORE OR, IF NO MORE COLUMN OF NEW
BIRTHS, GO TO 573) BIRTHS, GO TO 573) QUESTIONNAIRE; DON'T KNOW . . . . . 8 DON'T KNOW . . . . . 8 OR, IF NO MORE
BIRTHS, GO TO 573)DON'T KNOW . . . . . 8
| 341Appendix E

LAST BIRTH NEXT-TO-LAST BIRTH SECOND-FROM-LAST BIRTH
NO. QUESTIONS AND FILTERS NAME ________________ NAME ________________ NAME _________________
547 What drugs did (NAME) take? ANTIMALARIAL DRUGS ANTIMALARIAL DRUGS ANTIMALARIAL DRUGSSP/FANSIDAR . . . A SP/FANSIDAR . . . A SP/FANSIDAR . . . ACHLOROQUINE . B CHLOROQUINE . B CHLOROQUINE . B
Any other drugs? QUININE . . . . . . . . D QUININE . . . . . . . . D QUININE . . . . . . . . DCOMBINATION COMBINATION COMBINATION
WITH WITH WITHRECORD ALL MENTIONED. ARTEMISININ . E ARTEMISININ . E ARTEMISININ . E
OTHER ANTI- OTHER ANTI- OTHER ANTI-MALARIAL MALARIAL MALARIAL
. . . G . . . G . . . G(SPECIFY) (SPECIFY) (SPECIFY)
ANTIBIOTIC DRUGS ANTIBIOTIC DRUGS ANTIBIOTIC DRUGSPILL/SYRUP . . . H PILL/SYRUP . . . H PILL/SYRUP . . . HINJECTION . . . I INJECTION . . . I INJECTION . . . I
OTHER DRUGS OTHER DRUGS OTHER DRUGSPARACETAMOL .. J PARACETAMOL .. J PARACETAMOL .. JACETA- ACETA- ACETA-
MINOPHEN . . . K MINOPHEN . . . K MINOPHEN . . . KIBUPROFEN . . . L IBUPROFEN . . . L IBUPROFEN . . . L
OTHER X OTHER X OTHER X(SPECIFY) (SPECIFY) (SPECIFY)
DON'T KNOW . . . . . Z DON'T KNOW . . . . . Z DON'T KNOW . . . . . Z
548 CHECK 547: YES NO YES NO YES NO ANY CODE A-H CIRCLED?
(GO BACK TO (GO BACK TO (GO TO 503 503 IN NEXT 503 IN NEXT IN NEXT-TO-LAST
COLUMN; OR, COLUMN; OR, COLUMN OF NEW IF NO MORE IF NO MORE QUESTIONNAIRE; OR, BIRTHS, GO BIRTHS, GO IF NO MORE BIRTHS,
TO 573) TO 573) GO TO 573)
549 Did you already have (NAME OF ANTIMALARIAL DRUGS ANTIMALARIAL DRUGS ANTIMALARIAL DRUGSDRUG FROM 547) at home when SP/FANSIDAR . . . A SP/FANSIDAR . . A SP/FANSIDAR . . . Athe child became ill? CHLOROQUINE . B CHLOROQUINE . B CHLOROQUINE . B
QUININE . . . . . . . . D QUININE . . . . . . . . D QUININE . . . . . . . . DASK SEPARATELY FOR EACH COMBINATION COMBINATION COMBINATIONOF THE DRUGS 'A' THROUGH WITH WITH WITH'H' THAT THE CHILD IS ARTEMISININ . E ARTEMISININ . E ARTEMISININ . ERECORDED AS HAVING TAKEN IN 547. OTHER ANTI- OTHER ANTI- OTHER ANTI-
MALARIAL . . . G MALARIAL . . . G MALARIAL . . . GIF YES FOR ANY DRUG, CIRCLE CODE FOR THAT DRUG.
ANTIBIOTIC PILL/ ANTIBIOTIC PILL/ ANTIBIOTIC PILL/IF NO FOR ALL DRUGS, SYRUP . . . . . . . . H SYRUP . . . . . . . . H SYRUP . . . . . . . . HCIRCLE 'Y'.
NO DRUG AT HOME . Y NO DRUG AT HOME . Y NO DRUG AT HOME . Y
550 CHECK 547: YES NO YES NO YES NO ANY CODE A-G CIRCLED?
(GO BACK TO (GO BACK TO (GO TO 503 IN 503 IN NEXT 503 IN NEXT NEXT-TO-LAST
COLUMN; OR, COLUMN; OR, COLUMN OF NEW IF NO MORE IF NO MORE QUESTIONNAIRE; BIRTHS, GO BIRTHS, GO OR, IF NO MORE
TO 573) TO 573) BIRTHS, GO TO 573)
342 | Appendix E

LAST BIRTH NEXT-TO-LAST BIRTH SECOND-FROM-LAST BIRTH
NO. QUESTIONS AND FILTERS NAME ________________ NAME ________________ NAME _________________
551 CHECK 547: CODE 'A' CODE 'A' CODE 'A' CODE 'A' CODE 'A' CODE 'A'CIRCLED NOT CIRCLED NOT CIRCLED NOT
SP/FANSIDAR ('A') GIVEN CIRCLED CIRCLED CIRCLED
(SKIP TO 554) (SKIP TO 554) (SKIP TO 554)
552 How long after the fever SAME DAY . . . . . 0 SAME DAY . . . . . 0 SAME DAY . . . . . 0started did (NAME) first take NEXT DAY . . . . . 1 NEXT DAY . . . . . 1 NEXT DAY . . . . . 1SP/Fansidar? TWO DAYS AFTER TWO DAYS AFTER TWO DAYS AFTER
FEVER . . . . . 2 FEVER . . . . . 2 FEVER . . . . . 2THREE DAYS AFTER THREE DAYS AFTER THREE DAYS AFTER
FEVER . . . . . 3 FEVER . . . . . 3 FEVER . . . . . 3FOUR OR MORE DAYS FOUR OR MORE DAYS FOUR OR MORE DAYS
AFTER FEVER . . 4 AFTER FEVER . . 4 AFTER FEVER . . 4DON'T KNOW . . . 8 DON'T KNOW . . . 8 DON'T KNOW . . . 8
553 For how many days did (NAME)take the SP/Fansidar?
DAYS . . . . . . . . . . DAYS . . . . . . . . . . DAYS . . . . . . . . . . IF 7 DAYS OR MORE, RECORD7. DON'T KNOW . . . 8 DON'T KNOW . . . 8 DON'T KNOW . . . 8
554 CHECK 547: CODE 'B' CODE 'B' CODE 'B' CODE 'B' CODE 'B' CODE 'B'CIRCLED NOT CIRCLED NOT CIRCLED NOT
CHLOROQUINE ('B') GIVEN CIRCLED CIRCLED CIRCLED
(SKIP TO 560) (SKIP TO 560) (SKIP TO 560)
555 How long after the fever SAME DAY . . . . . 0 SAME DAY . . . . . 0 SAME DAY . . . . . 0started did (NAME) first take NEXT DAY . . . . . 1 NEXT DAY . . . . . 1 NEXT DAY . . . . . 1chloroquine? TWO DAYS AFTER TWO DAYS AFTER TWO DAYS AFTER
FEVER . . . . . 2 FEVER . . . . . 2 FEVER . . . . . 2THREE DAYS AFTER THREE DAYS AFTER THREE DAYS AFTER
FEVER . . . . . 3 FEVER . . . . . 3 FEVER . . . . . 3FOUR OR MORE DAYS FOUR OR MORE DAYS FOUR OR MORE DAYS
AFTER FEVER . . 4 AFTER FEVER . . 4 AFTER FEVER . . 4DON'T KNOW . . . 8 DON'T KNOW . . . 8 DON'T KNOW . . . 8
556 For how many days did (NAME)take the chloroquine?
DAYS . . . . . . . . . . DAYS . . . . . . . . . . DAYS . . . . . . . . . . IF 7 DAYS OR MORE, RECORD7. DON'T KNOW . . . 8 DON'T KNOW . . . 8 DON'T KNOW . . . 8
560 CHECK 547: CODE 'D' CODE 'D' CODE 'D' CODE 'D' CODE 'D' CODE 'D'CIRCLED NOT CIRCLED NOT CIRCLED NOT
QUININE ('D') GIVEN CIRCLED CIRCLED CIRCLED
(SKIP TO 563) (SKIP TO 563) (SKIP TO 563)
561 How long after the fever SAME DAY . . . . . 0 SAME DAY . . . . . 0 SAME DAY . . . . . 0started did (NAME) first take NEXT DAY . . . . . 1 NEXT DAY . . . . . 1 NEXT DAY . . . . . 1quinine? TWO DAYS AFTER TWO DAYS AFTER TWO DAYS AFTER
FEVER . . . . . 2 FEVER . . . . . 2 FEVER . . . . . 2THREE DAYS AFTER THREE DAYS AFTER THREE DAYS AFTER
FEVER . . . . . 3 FEVER . . . . . 3 FEVER . . . . . 3FOUR OR MORE DAYS FOUR OR MORE DAYS FOUR OR MORE DAYS
AFTER FEVER . . 4 AFTER FEVER . . 4 AFTER FEVER . . 4DON'T KNOW . . . 8 DON'T KNOW . . . 8 DON'T KNOW . . . 8
| 343Appendix E

LAST BIRTH NEXT-TO-LAST BIRTH SECOND-FROM-LAST BIRTH
NO. QUESTIONS AND FILTERS NAME ________________ NAME ________________ NAME _________________
562 For how many days did (NAME)take the quinine?
DAYS . . . . . . . . . . DAYS . . . . . . . . . . DAYS . . . . . . . . . . IF 7 DAYS OR MORE, RECORD7. DON'T KNOW . . . 8 DON'T KNOW . . . 8 DON'T KNOW . . . 8
563 CHECK 547: CODE 'E' CODE 'E' CODE 'E' CODE 'E' CODE 'E' CODE 'E'CIRCLED NOT CIRCLED NOT CIRCLED NOT
COMBINATION WITH CIRCLED CIRCLED CIRCLEDARTEMISININ ('E') GIVEN
(SKIP TO 569) (SKIP TO 569) (SKIP TO 569)
564 How long after the fever SAME DAY . . . . . 0 SAME DAY . . . . . 0 SAME DAY . . . . . 0started did (NAME) first take NEXT DAY . . . . . 1 NEXT DAY . . . . . 1 NEXT DAY . . . . . 1(COMBINATION WITH TWO DAYS AFTER TWO DAYS AFTER TWO DAYS AFTER ARTEMISININ)? FEVER . . . . . 2 FEVER . . . . . 2 FEVER . . . . . 2
THREE DAYS AFTER THREE DAYS AFTER THREE DAYS AFTERFEVER . . . . . 3 FEVER . . . . . 3 FEVER . . . . . 3
FOUR OR MORE DAYS FOUR OR MORE DAYS FOUR OR MORE DAYSAFTER FEVER . . 4 AFTER FEVER . . 4 AFTER FEVER . . 4
DON'T KNOW . . . 8 DON'T KNOW . . . 8 DON'T KNOW . . . 8
565 For how many days did (NAME)take the (COMBINATION WITH ARTEMISININ)? DAYS . . . . . . . . . . DAYS . . . . . . . . . . DAYS . . . . . . . . . . IF 7 DAYS OR MORE, RECORD7. DON'T KNOW . . . 8 DON'T KNOW . . . 8 DON'T KNOW . . . 8
569 CHECK 547: CODE 'G' CODE 'G' CODE 'G' CODE 'G' CODE 'G' CODE 'G'CIRCLED NOT CIRCLED NOT CIRCLED NOT
OTHER ANTIMALARIAL ('G') CIRCLED CIRCLED CIRCLEDGIVEN
(GO BACK TO (GO BACK TO (GO TO 503 IN 503 IN NEXT 503 IN NEXT NEXT-TO-LAST
COLUMN; OR, COLUMN; OR, COLUMN OF NEW IF NO MORE IF NO MORE QUESTIONNAIRE; BIRTHS, GO BIRTHS, GO OR, IF NO MORE
TO 573) TO 573) BIRTHS, GO TO 573)
570 How long after the fever SAME DAY . . . . . 0 SAME DAY . . . . . 0 SAME DAY . . . . . 0started did (NAME) first take NEXT DAY . . . . . 1 NEXT DAY . . . . . 1 NEXT DAY . . . . . 1(OTHER ANTIMALARIAL)? TWO DAYS AFTER TWO DAYS AFTER TWO DAYS AFTER
FEVER . . . . . 2 FEVER . . . . . 2 FEVER . . . . . 2THREE DAYS AFTER THREE DAYS AFTER THREE DAYS AFTER
FEVER . . . . . 3 FEVER . . . . . 3 FEVER . . . . . 3FOUR OR MORE DAYS FOUR OR MORE DAYS FOUR OR MORE DAYS
AFTER FEVER . . 4 AFTER FEVER . . 4 AFTER FEVER . . 4DON'T KNOW . . . 8 DON'T KNOW . . . 8 DON'T KNOW . . . 8
571 For how many days did (NAME)take the (OTHERANTIMALARIAL)? DAYS . . . . . . . . . . DAYS . . . . . . . . . . DAYS . . . . . . . . . . IF 7 DAYS OR MORE, RECORD7. DON'T KNOW . . . 8 DON'T KNOW . . . 8 DON'T KNOW . . . 8
572 GO BACK TO 503 IN GO BACK TO 503 IN GO TO 503 IN NEXT COLUMN; OR, IF NEXT COLUMN; OR, IF NEXT-TO-LAST NO MORE BIRTHS, GO NO MORE BIRTHS, GO COLUMN OF NEWTO 573. TO 573. QUESTIONNAIRE; OR,
IF NO MORE BIRTHS,GO TO 573.
344 | Appendix E
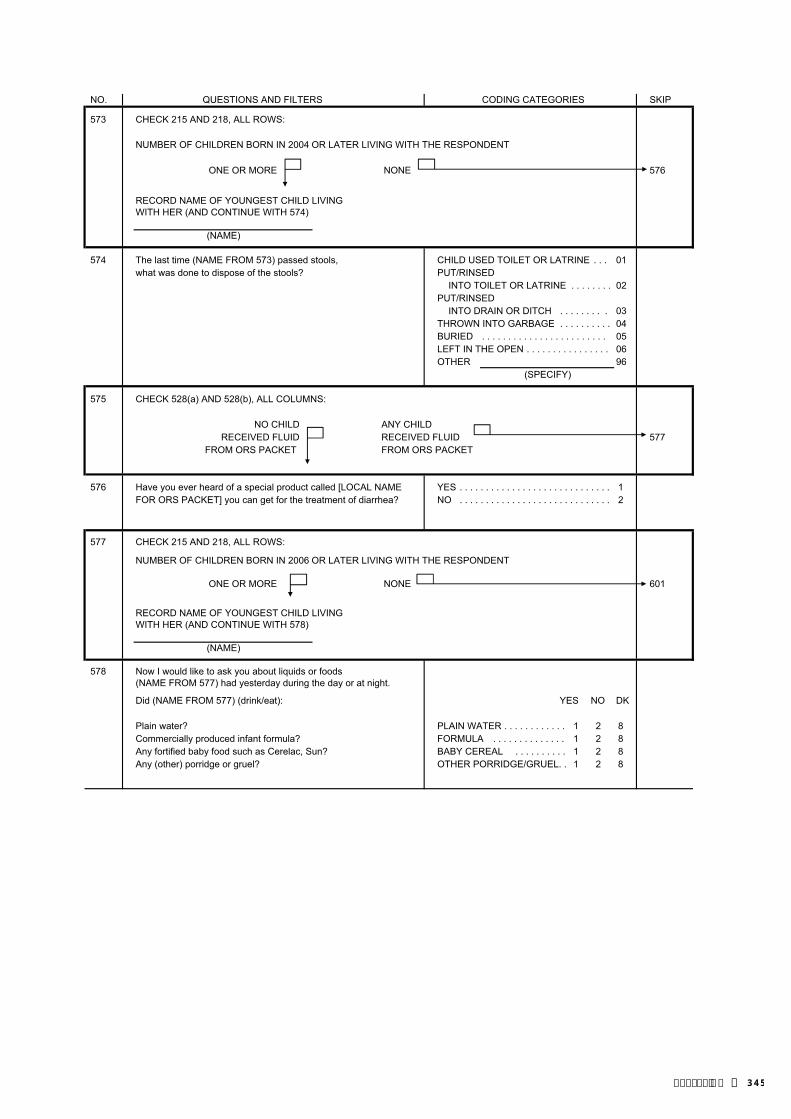
NO. QUESTIONS AND FILTERS CODING CATEGORIES SKIP
573 CHECK 215 AND 218, ALL ROWS:
NUMBER OF CHILDREN BORN IN 2004 OR LATER LIVING WITH THE RESPONDENT
ONE OR MORE NONE 576
RECORD NAME OF YOUNGEST CHILD LIVINGWITH HER (AND CONTINUE WITH 574)
(NAME)
574 The last time (NAME FROM 573) passed stools, CHILD USED TOILET OR LATRINE . . . 01what was done to dispose of the stools? PUT/RINSED
INTO TOILET OR LATRINE . . . . . . . . 02PUT/RINSED
INTO DRAIN OR DITCH . . . . . . . . . 03THROWN INTO GARBAGE . . . . . . . . . . 04BURIED . . . . . . . . . . . . . . . . . . . . . . . . 05LEFT IN THE OPEN . . . . . . . . . . . . . . . . 06OTHER 96
(SPECIFY)
575 CHECK 528(a) AND 528(b), ALL COLUMNS:
NO CHILD ANY CHILDRECEIVED FLUID RECEIVED FLUID 577
FROM ORS PACKET FROM ORS PACKET
576 Have you ever heard of a special product called [LOCAL NAME YES . . . . . . . . . . . . . . . . . . . . . . . . . . . . . 1FOR ORS PACKET] you can get for the treatment of diarrhea? NO . . . . . . . . . . . . . . . . . . . . . . . . . . . . . 2
577 CHECK 215 AND 218, ALL ROWS:
NUMBER OF CHILDREN BORN IN 2006 OR LATER LIVING WITH THE RESPONDENT
ONE OR MORE NONE 601
RECORD NAME OF YOUNGEST CHILD LIVINGWITH HER (AND CONTINUE WITH 578)
(NAME)
578 Now I would like to ask you about liquids or foods (NAME FROM 577) had yesterday during the day or at night.
Did (NAME FROM 577) (drink/eat): YES NO DK
Plain water? PLAIN WATER . . . . . . . . . . . . 1 2 8Commercially produced infant formula? FORMULA . . . . . . . . . . . . . . 1 2 8Any fortified baby food such as Cerelac, Sun? BABY CEREAL . . . . . . . . . . 1 2 8Any (other) porridge or gruel? OTHER PORRIDGE/GRUEL. . 1 2 8
| 345Appendix E
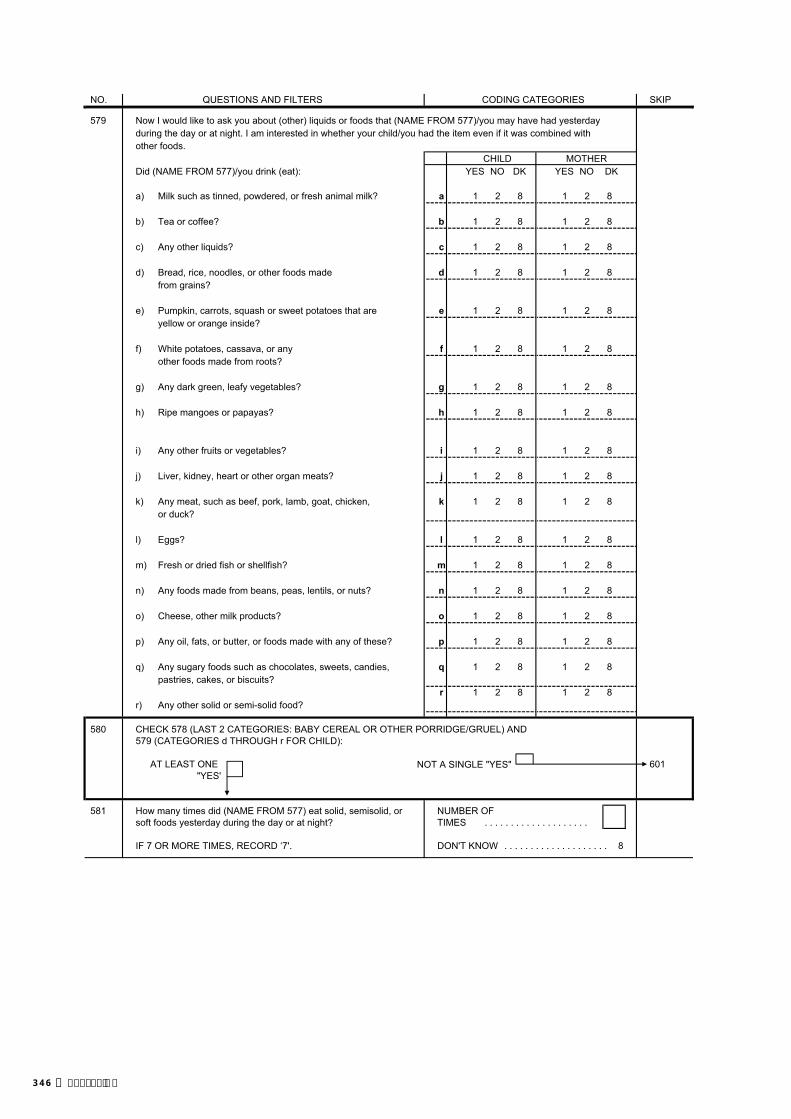
NO. QUESTIONS AND FILTERS CODING CATEGORIES SKIP
579 Now I would like to ask you about (other) liquids or foods that (NAME FROM 577)/you may have had yesterdayduring the day or at night. I am interested in whether your child/you had the item even if it was combined withother foods.
CHILD MOTHERDid (NAME FROM 577)/you drink (eat): YES NO DK YES NO DK
a) Milk such as tinned, powdered, or fresh animal milk? a 1 2 8 1 2 8
b) Tea or coffee? b 1 2 8 1 2 8
c) Any other liquids? c 1 2 8 1 2 8
d) Bread, rice, noodles, or other foods made d 1 2 8 1 2 8from grains?
e) Pumpkin, carrots, squash or sweet potatoes that are e 1 2 8 1 2 8yellow or orange inside?
f) White potatoes, cassava, or any f 1 2 8 1 2 8other foods made from roots?
g) Any dark green, leafy vegetables? g 1 2 8 1 2 8
h) Ripe mangoes or papayas? h 1 2 8 1 2 8
i) Any other fruits or vegetables? i 1 2 8 1 2 8
j) Liver, kidney, heart or other organ meats? j 1 2 8 1 2 8
k) Any meat, such as beef, pork, lamb, goat, chicken, k 1 2 8 1 2 8or duck?
l) Eggs? l 1 2 8 1 2 8
m) Fresh or dried fish or shellfish? m 1 2 8 1 2 8
n) Any foods made from beans, peas, lentils, or nuts? n 1 2 8 1 2 8
o) Cheese, other milk products? o 1 2 8 1 2 8
p) Any oil, fats, or butter, or foods made with any of these? p 1 2 8 1 2 8
q) Any sugary foods such as chocolates, sweets, candies, q 1 2 8 1 2 8pastries, cakes, or biscuits?
r 1 2 8 1 2 8r) Any other solid or semi-solid food?
580 CHECK 578 (LAST 2 CATEGORIES: BABY CEREAL OR OTHER PORRIDGE/GRUEL) AND 579 (CATEGORIES d THROUGH r FOR CHILD):
AT LEAST ONE NOT A SINGLE "YES" 601"YES'
581 How many times did (NAME FROM 577) eat solid, semisolid, or NUMBER OFsoft foods yesterday during the day or at night? TIMES . . . . . . . . . . . . . . . . . . . .
IF 7 OR MORE TIMES, RECORD ‘7'. DON'T KNOW . . . . . . . . . . . . . . . . . . . . 8
346 | Appendix E

SECTION 6. MARRIAGE AND SEXUAL ACTIVITY
NO. QUESTIONS AND FILTERS CODING CATEGORIES SKIP
601 Are you currently married or living together with a man as if YES, CURRENTLY MARRIED 1married? YES, LIVING WITH A MAN . . . . . . . . . . 2 604
NO, NOT IN UNION . . . . . . . . . . . . . . . . 3
602 Have you ever been married or lived together with a man as if YES, FORMERLY MARRIED . . . . . . . . 1married? YES, LIVED WITH A MAN . . . . . . . . . . 2
NO . . . . . . . . . . . . . . . . . . . . . . . . . . . . . 3 617
603 What is your marital status now: are you widowed, WIDOWED . . . . . . . . . . . . . . . . . . . . . . 1divorced, or separated? DIVORCED 2 609
SEPARATED 3
604 Is your husband/partner living with you now or is he staying LIVING WITH HER . . . . . . . . . . . . . . . . 1elsewhere? STAYING ELSEWHERE . . . . . . . . . . . . 2
605 RECORD THE HUSBAND'S/PARTNER'S NAME AND LINE NAME _____________________________NUMBER FROM THE HOUSEHOLD QUESTIONNAIRE.IF HE IS NOT LISTED IN THE HOUSEHOLD, RECORD '00'.
LINE NO. . . . . . . . . . . . . . . . . . .
606 Does your husband/partner have other wives or YES . . . . . . . . . . . . . . . . . . . . . . . . . . . . . 1does he live with other women as if married? NO . . . . . . . . . . . . . . . . . . . . . . . . . . . . . 2
DON'T KNOW . . . . . . . . . . . . . . . . . . . . 8 609
607 Including yourself, in total, how many wives or partners does TOTAL NUMBER OF WIVES your husband live with now as if married? AND LIVE-IN PARTNERS. . . . .
DON'T KNOW . . . . . . . . . . . . . . . . . . 98
608 Are you the first, second, … wife?RANK . . . . . . . . . . . . . . . . . . . .
609 Have you been married or lived with a man only once or ONLY ONCE . . . . . . . . . . . . . . . . . . . . 1more than once? MORE THAN ONCE . . . . . . . . . . . . . . 2
615 CHECK 609:
MARRIED/ MARRIED/LIVED WITH A MAN LIVED WITH A MAN MONTH . . . . . . . . . . . . . . . .
ONLY ONCE MORE THAN ONCE
In what month and year Now I would like to ask about DON'T KNOW MONTH . . . . . . . . . . 98did you start living with when you started living withyour husband/partner? your first husband/partner.
In what month and year YEAR . . . . . . . . . . . . 617was that?
DON'T KNOW YEAR . . . . . . . . . . . . 9998
616 How old were you when you first started living with him?AGE . . . . . . . . . . . . . . . . . . . .
617 CHECK FOR THE PRESENCE OF OTHERS. BEFORE CONTINUING, MAKE EVERY EFFORT TO ENSURE PRIVACY.
618 Now I need to ask you some questions about sexual activity in NEVER HAD SEXUALorder to gain a better understanding of some important life issues. INTERCOURSE . . . . . . . . . . . . . . 00
How old were you when you had sexual intercourse for the very AGE IN YEARS . . . . . . . . . . . . 621first time?
FIRST TIME WHEN STARTEDLIVING WITH (FIRST)HUSBAND/PARTNER . . . . . . . . . . . . 95 621
. . . . . . . .
. . . . . . . . . . . . . . . . . . . . . . . . . . . . . . . . . . . . . . . . . .
| 347Appendix E

NO. QUESTIONS AND FILTERS CODING CATEGORIES SKIP
619 CHECK 107: AGE AGE15-24 25-49 641
620 Do you intend to wait until you get married to have sexual YES . . . . . . . . . . . . . . . . . . . . . . . . . . . . . 1intercourse for the first time? NO . . . . . . . . . . . . . . . . . . . . . . . . . . . . . 2 641
DON'T KNOW/UNSURE . . . . . . . . . . . . 8.
621 CHECK 107: AGE AGE15-24 25-49 626
622 The first time you had sexual intercourse, was a condom YES . . . . . . . . . . . . . . . . . . . . . . . . . . . . . 1used? NO . . . . . . . . . . . . . . . . . . . . . . . . . . . . . 2
DON'T KNOW/DON'T REMEMBER . . . 8
623 How old was the person you first had sexual intercoursewith? AGE OF PARTNER . . . . . . . . . . 626
DON'T KNOW . . . . . . . . . . . . . . . . . . 98
624 Was this person older than you, younger than you, or about OLDER . . . . . . . . . . . . . . . . . . . . . . . . . 1the same age as you? YOUNGER . . . . . . . . . . . . . . . . . . . . . . 2
ABOUT THE SAME AGE . . . . . . . . . . . . 3 626DON'T KNOW/DON'T REMEMBER . . . 8
625 Would you say this person was ten or more years older than TEN OR MORE YEARS OLDER . . . . . 1you or less than ten years older than you? LESS THAN TEN YEARS OLDER . . . 2
OLDER, UNSURE HOW MUCH 3
626 When was the last time you had sexual intercourse?DAYS AGO . . . . . . . . . . . . 1
IF LESS THAN 12 MONTHS, ANSWER MUST BE RECORDEDIN DAYS, WEEKS OR MONTHS. WEEKS AGO . . . . . . . . . . 2IF 12 MONTHS (ONE YEAR) OR MORE, ANSWER MUST BERECORDED IN YEARS. MONTHS AGO . . . . . . . . 3
YEARS AGO . . . . . . . . . . 4 640
. . . . .
348 | Appendix E

626A Now I would like to ask you some questions about your recent sexual activity. Let me assure you again that your answers are completely confidential and will not be told to anyone. If we should come to any question that you don't wantto answer, just let me know and we will go to the next question. SKIP TO 628
627 When was the last time you hadsexual intercourse with this person? DAYS . 1 DAYS . 1
WEEKS 2 WEEKS 2
MONTHS 3 MONTHS 3
628 The last time you had sexual YES . . . . . . . . . . . . . . 1 YES . . . . . . . . . . . . . . 1 YES . . . . . . . . . . . . . . 1intercourse (with this second/third NO . . . . . . . . . . . . . . 2 NO . . . . . . . . . . . . . . 2 NO . . . . . . . . . . . . . . 2person), was a condom used? (SKIP TO 630) (SKIP TO 630) (SKIP TO 630)
629 Did you use a condom every YES . . . . . . . . . . . . . . 1 YES . . . . . . . . . . . . . . 1 YES . . . . . . . . . . . . . . 1time you had sexual intercourse NO . . . . . . . . . . . . . . 2 NO . . . . . . . . . . . . . . 2 NO . . . . . . . . . . . . . . 2with this person in the last12 months?
630 What was your relationship to HUSBAND . . . . . . . . . . . 1 HUSBAND . . . . . . . . . . . 1 HUSBAND . . . . . . . . . . . 1this person with whom you had (SKIP TO 636) (SKIP TO 636) (SKIP TO 636)sexual intercourse? LIVE-IN PARTNER . . . . 2 LIVE-IN PARTNER . . . . 2 LIVE-IN PARTNER . . . . 2
BOYFRIEND NOT BOYFRIEND NOT BOYFRIEND NOT IF BOYFRIEND: LIVING WITH LIVING WITH LIVING WITH Were you living together as if RESPONDENT . . . . 3 RESPONDENT . . . . 3 RESPONDENT . . . . 3
married? CASUAL CASUAL CASUAL IF YES, CIRCLE '2'. ACQUAINTANCE . . . 4 ACQUAINTANCE . . . 4 ACQUAINTANCE . . . 4IF NO, CIRCLE '3'. SEX WORKER. . . . . . . . 5 SEX WORKER. . . . . . . . 5 SEX WORKER. . . . . . . . 5
OTHER _____________ 6 OTHER _____________ 6 OTHER _____________ 6(SPECIFY) (SPECIFY) (SPECIFY)
631 For how long (have you had/didyou have) a sexual relationship DAYS . 1 DAYS . 1 DAYS . 1with this person?IF ONLY HAD SEXUAL MONTHS 2 MONTHS 2 MONTHS 2RELATIONS WITH THIS PERSONONCE, RECORD '01' DAYS. YEARS 3 YEARS 3 YEARS 3
632 CHECK 107: AGE AGE AGE AGE AGE AGE15-24 25-49 15-24 25-49 15-24 25-49
(SKIP TO 636) (SKIP TO 636) (SKIP TO 636)
633 How old is this person? AGE OF AGE OF AGE OF PARTNER PARTNER PARTNER
(SKIP TO 636) (SKIP TO 636) (SKIP TO 636)
DON'T KNOW . . . . . 98 DON'T KNOW . . . . . 98 DON'T KNOW . . . . . 98
634 Is this person older than you, OLDER . . . . . . . . 1 OLDER . . . . . . . . 1 OLDER . . . . . . . . 1younger than you, or about the YOUNGER . . . . . 2 YOUNGER . . . . . 2 YOUNGER . . . . . 2same age? SAME AGE . . . . . 3 SAME AGE . . . . . 3 SAME AGE . . . . . 3
DON'T KNOW . . . 8 DON'T KNOW . . . 8 DON'T KNOW . . . 8(SKIP TO 636) (SKIP TO 636) (SKIP TO 636)
635 Would you say this person is ten TEN OR MORE TEN OR MORE TEN OR MORE or more years older than you or YEARS OLDER . 1 YEARS OLDER . 1 YEARS OLDER . 1less than ten years older than you? LESS THAN TEN LESS THAN TEN LESS THAN TEN
YEARS OLDER . 2 YEARS OLDER . 2 YEARS OLDER . 2OLDER, UNSURE OLDER, UNSURE OLDER, UNSURE
HOW MUCH . . . 3 HOW MUCH . . . 3 HOW MUCH . . . 3
THIRD-TO-LASTSEXUAL PARTNER
LASTSEXUAL PARTNER
SECOND-TO-LASTSEXUAL PARTNER
| 349Appendix E
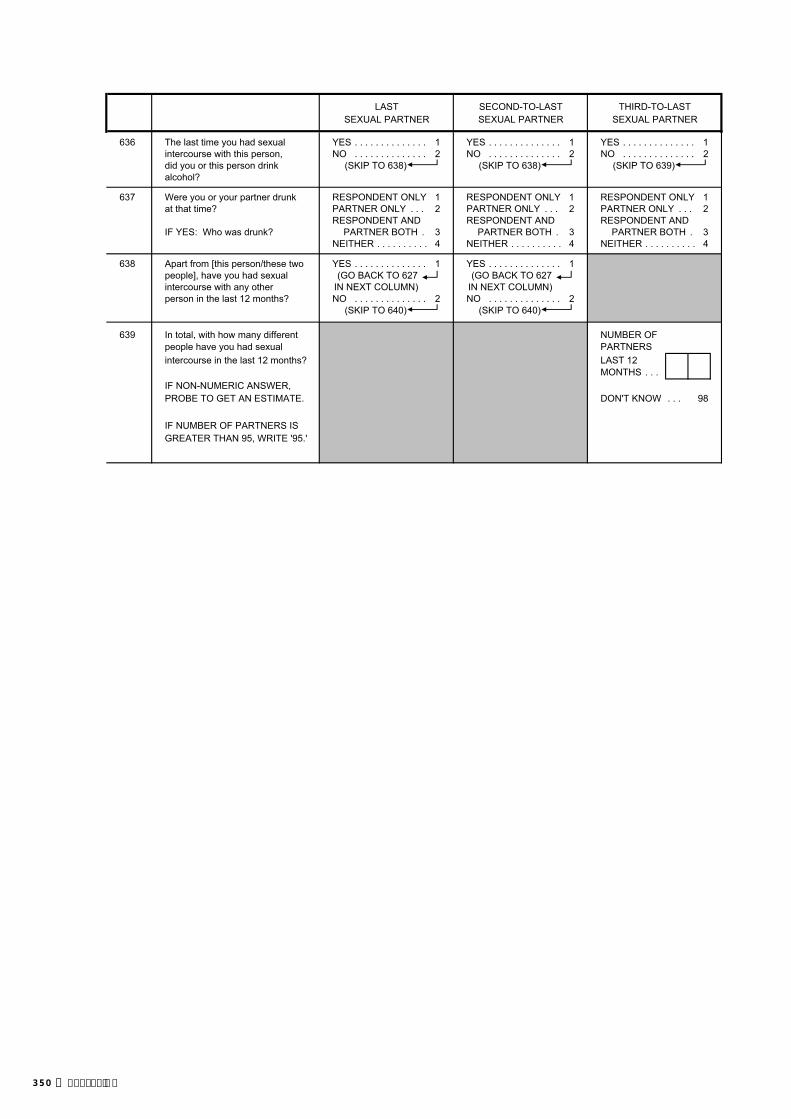
THIRD-TO-LASTSEXUAL PARTNER
LASTSEXUAL PARTNER
SECOND-TO-LASTSEXUAL PARTNER
636 The last time you had sexual YES . . . . . . . . . . . . . . 1 YES . . . . . . . . . . . . . . 1 YES . . . . . . . . . . . . . . 1intercourse with this person, NO . . . . . . . . . . . . . . 2 NO . . . . . . . . . . . . . . 2 NO . . . . . . . . . . . . . . 2did you or this person drink (SKIP TO 638) (SKIP TO 638) (SKIP TO 639)alcohol?
637 Were you or your partner drunk RESPONDENT ONLY 1 RESPONDENT ONLY 1 RESPONDENT ONLY 1at that time? PARTNER ONLY . . . 2 PARTNER ONLY . . . 2 PARTNER ONLY . . . 2
RESPONDENT AND RESPONDENT AND RESPONDENT ANDIF YES: Who was drunk? PARTNER BOTH . 3 PARTNER BOTH . 3 PARTNER BOTH . 3
NEITHER . . . . . . . . . . 4 NEITHER . . . . . . . . . . 4 NEITHER . . . . . . . . . . 4
638 Apart from [this person/these two YES . . . . . . . . . . . . . . 1 YES . . . . . . . . . . . . . . 1people], have you had sexual (GO BACK TO 627 (GO BACK TO 627intercourse with any other IN NEXT COLUMN) IN NEXT COLUMN)person in the last 12 months? NO . . . . . . . . . . . . . . 2 NO . . . . . . . . . . . . . . 2
(SKIP TO 640) (SKIP TO 640)
639 In total, with how many different NUMBER OFpeople have you had sexual PARTNERSintercourse in the last 12 months? LAST 12
. . . IF NON-NUMERIC ANSWER, PROBE TO GET AN ESTIMATE. DON'T KNOW . . .
IF NUMBER OF PARTNERS IS GREATER THAN 95, WRITE '95.'
98
MONTHS
350 | Appendix E

NO. QUESTIONS AND FILTERS CODING CATEGORIES SKIP
640 In total, with how many different people have you had sexual NUMBER OF PARTNERSintercourse in your lifetime? IN LIFETIME . . . . . . . . . . .
IF NON-NUMERIC ANSWER, PROBE TO GET AN ESTIMATE. DON'T KNOW . . . . . . . . . . . . . . . . . .
IF NUMBER OF PARTNERS IS GREATER THAN 95,WRITE '95.'
641 Do you know of a place where a person can get condoms? YES . . . . . . . . . . . . . . . . . . . . . . . . . . . . . 1NO . . . . . . . . . . . . . . . . . . . . . . . . . . . . . 2 701
642 Where is that? PUBLIC SECTORNATIONAL HOSPITAL . . . . . . . . A
Any other place? REFERRAL HOSPITAL . . . . . . . . BCOMMUNITY HEALTH CEN . . . . . . . . C
PROBE TO IDENTIFY EACH TYPE OF SOURCE AND HEALTH POST . . . . . . . . . . . . . . . . DCIRCLE THE APPROPRIATE CODE(S). SISCa POST . . . . . . . . . . . . . . . . E
MOBILE CLINIC . . . . . . . . . . . . . . . . FCONDOM BOX . . . . . . . . . . . . . . . . G
IF UNABLE TO DETERMINE IF HOSPITAL, HEALTH CENTER OTHER PUBLIC HOR CLINIC IS PUBLIC OR PRIVATE MEDICAL, WRITE (SPECIFY)THE NAME OF THE PLACE.
NON-GOVT (NGO) SECTORMARIE STOPES . . . . . . . . . . . . . . . . IOTHER NGO ________________ J
(SPECIFY)
PRIVATE MEDICAL SECTORPRIVATE HOSPITAL/CLINIC . . . . . K
(NAME OF PLACE(S)) PHARMACY . . . . . . . . . . . . . . . . . . LPRIVATE DOCTOR . . . . . . . . . . . . . . MMOBILE CLINIC . . . . . . . . . . . . . . . . NFIELDWORKER . . . . . . . . . . . . . . . . OOTHER PRIVATE
MEDICAL P(SPECIFY)
OTHER SOURCESHOP . . . . . . . . . . . . . . . . . . . . . . . . QFRIENDS/RELATIVES . . . . . . . . . . R
OTHER X(SPECIFY)
643 If you wanted to, could you yourself get a condom? YES . . . . . . . . . . . . . . . . . . . . . . . . . . . . . 1NO . . . . . . . . . . . . . . . . . . . . . . . . . . . . . 2DON'T KNOW/UNSURE . . . . . . . . . . . . 8
98
| 351Appendix E

SECTION 7. FERTILITY PREFERENCES
NO. QUESTIONS AND FILTERS CODING CATEGORIES SKIP
701 CHECK 311/311A:
NEITHER HE OR SHESTERILIZED STERILIZED 713
702 CHECK 226:
NOT PREGNANT PREGNANTOR UNSURE
Now I have some questions Now I have some questions HAVE (A/ANOTHER) CHILD . . . . . . . . 1about the future. about the future. NO MORE/NONE . . . . . . . . . . . . . . . . 2 704Would you like to have After the child you are SAYS SHE CAN'T GET PREGNANT . 3 713(a/another) child, or would you expecting now, would you like UNDECIDED/DON'T KNOW ANDprefer not to have any (more) to have another child, or would PREGNANT . . . . . . . . . . . . . . . . . . 4 709children? you prefer not to have any UNDECIDED/DON'T KNOW
more children? AND NOT PREGNANT OR UNSURE . . . . . . . . . . . . . . . . 5 708
703 CHECK 226:MONTHS . . . . . . . . . . . . . . 1
NOT PREGNANT PREGNANTOR UNSURE YEARS . . . . . . . . . . . . . . 2
How long would you like to wait After the birth of the child you SOON/NOW . . . . . . . . . . . . . . . . . . 993 708from now before the birth of are expecting now, how long SAYS SHE CAN'T GET PREGNANT 994 713(a/another) child? would you like to wait before AFTER MARRIAGE . . . . . . . . . . . . . . 995
the birth of another child?OTHER ______________________ 996 708
(SPECIFY)DON'T KNOW . . . . . . . . . . . . . . . . . . 998
704 CHECK 226:
NOT PREGNANT PREGNANTOR UNSURE 709
705 CHECK 310: USING A CONTRACEPTIVE METHOD?
NOT NOT CURRENTLYASKED CURRENTLY USING 713
USING
706 CHECK 703:
NOT 24 OR MORE MONTHS 00-23 MONTHSASKED OR 02 OR MORE YEARS OR 00-01 YEAR 709
352 | Appendix E

NO. QUESTIONS AND FILTERS CODING CATEGORIES SKIP
707 CHECK 702: NOT MARRIED . . . . . . . . . . . . . . . . . . A
WANTS TO HAVE WANTS NO MORE/ FERTILITY-RELATED REASONSA/ANOTHER CHILD NONE NOT HAVING SEX . . . . . . . . . . . . . . B
INFREQUENT SEX . . . . . . . . . . . . . . CMENOPAUSAL/HYSTERECTOMY . D
You have said that you do not You have said that you do not SUBFECUND/INFECUND . . . . . . . . Ewant (a/another) child soon, but want any (more) children, but POSTPARTUM AMENORRHEIC . . . Fyou are not using any method to you are not using any method to BREASTFEEDING . . . . . . . . . . . . . . Gavoid pregnancy. avoid pregnancy. FATALISTIC . . . . . . . . . . . . . . . . . . H
Can you tell me why you are Can you tell me why you are OPPOSITION TO USEnot using a method? not using a method? RESPONDENT OPPOSED . . . . . . . . I
HUSBAND/PARTNER OPPOSED . JAny other reason? Any other reason? OTHERS OPPOSED . . . . . . . . . . . . K
RELIGIOUS PROHIBITION . . . . . . . . L
RECORD ALL REASONS MENTIONED. LACK OF KNOWLEDGEKNOWS NO METHOD . . . . . . . . . . . . MKNOWS NO SOURCE . . . . . . . . . . . . N
METHOD-RELATED REASONSHEALTH CONCERNS . . . . . . . . . . . . OFEAR OF SIDE EFFECTS . . . . . . . . PLACK OF ACCESS/TOO FAR . . . . . QCOSTS TOO MUCH . . . . . . . . . . . . RINCONVENIENT TO USE . . . . . . . . SINTERFERES WITH BODY'S
NORMAL PROCESSES . . . . . . . . T
OTHER ______________________ X(SPECIFY)
DON'T KNOW . . . . . . . . . . . . . . . . . . . . Z
708 CHECK 310: USING A CONTRACEPTIVE METHOD?
NOT NO, YES,ASKED NOT CURRENTLY USING CURRENTLY USING 713
709 Do you think you will use a contraceptive method to delay or avoid YES . . . . . . . . . . . . . . . . . . . . . . . . . . . . . 1pregnancy at any time in the future? NO . . . . . . . . . . . . . . . . . . . . . . . . . . . . . 2 711
DON'T KNOW . . . . . . . . . . . . . . . . . . . . 8 713
710 Which contraceptive method would you prefer to use? FEMALE STERILIZATION . . . . . . . . . . 01MALE STERILIZATION . . . . . . . . . . . . 02PILL . . . . . . . . . . . . . . . . . . . . . . . . . . . . . 03IUD . . . . . . . . . . . . . . . . . . . . . . . . . . . . . 04INJECTABLES . . . . . . . . . . . . . . . . . . . . 05IMPLANTS . . . . . . . . . . . . . . . . . . . . . . 06CONDOM . . . . . . . . . . . . . . . . . . . . . . 07FEMALE CONDOM . . . . . . . . . . . . . . . . 08 713DIAPHRAGM . . . . . . . . . . . . . . . . . . . . 09FOAM/JELLY . . . . . . . . . . . . . . . . . . . . 10LACTATIONAL AMEN. METHOD . . . . . 11RHYTHM METHOD . . . . . . . . . . . . . . . . 12STANDARD DAYS METHOD . . . . . . . . 13WITHDRAWAL . . . . . . . . . . . . . . . . . . 14
OTHER ______________________ 96(SPECIFY)
UNSURE . . . . . . . . . . . . . . . . . . . . . . . . 98
| 353Appendix E

NO. QUESTIONS AND FILTERS CODING CATEGORIES SKIP
711 What is the main reason that you think you will not use a NOT MARRIED . . . . . . . . . . . . . . . . 11contraceptive method at any time in the future?
FERTILITY-RELATED REASONSINFREQUENT SEX/NO SEX . . . 22MENOPAUSAL/HYSTERECTOMY 23SUBFECUND/INFECUND . . . . . 24WANTS AS MANY CHILDREN AS
POSSIBLE . . . . . . . . . . . . . . . . 26
OPPOSITION TO USERESPONDENT OPPOSED . . . . . 31HUSBAND/PARTNER OPPOSED 32OTHERS OPPOSED . . . . . . . . . . 33RELIGIOUS PROHIBITION . . . . . 34
LACK OF KNOWLEDGEKNOWS NO METHOD . . . . . . . . . . 41 713KNOWS NO SOURCE . . . . . . . . . . 42
METHOD-RELATED REASONSHEALTH CONCERNS . . . . . . . . . . 51FEAR OF SIDE EFFECTS . . . . . 52LACK OF ACCESS/TOO FAR . . . 53COSTS TOO MUCH . . . . . . . . . . 54INCONVENIENT TO USE . . . . . . . . 55INTERFERES WITH BODY'S
NORMAL PROCESSES . . . . . 56
OTHER ______________________ 96(SPECIFY)
DON'T KNOW . . . . . . . . . . . . . . . . . . 98
712 Would you ever use a contraceptive method if you were married? YES . . . . . . . . . . . . . . . . . . . . . . . . . . . . . 1NO . . . . . . . . . . . . . . . . . . . . . . . . . . . . . 2DON'T KNOW . . . . . . . . . . . . . . . . . . . . 8
713 CHECK 216:
HAS LIVING CHILDREN NO LIVING CHILDRENNONE . . . . . . . . . . . . . . . . . . . . . . . . 00 715
If you could go back to the time If you could choose exactly theyou did not have any children number of children to have in NUMBER . . . . . . . . . . . . . . . . . . and could choose exactly the your whole life, how many number of children to have in would that be?your whole life, how many OTHER ______________________ 96 715would that be? (SPECIFY)
PROBE FOR A NUMERIC RESPONSE.
714 How many of these children would you like to be boys, how many BOYS GIRLS EITHERwould you like to be girls and for how many would the sex notmatter? NUMBER
OTHER ______________________ 96(SPECIFY)
715 In the last few months have you: YES NO
Heard about family planning on the radio? RADIO . . . . . . . . . . . . . . . . . . . . . . 1 2Seen about family planning on the television? TELEVISION . . . . . . . . . . . . . . . . 1 2Read about family planning in a newspaper or magazine? NEWSPAPER OR MAGAZINE . . . 1 2Seen about family planning in poster/billboard? POSTER/BILLBOARD . . . . . . . . 1 2Seen Street drama? STREET DRAMA . . . . . . . . . . . 1 2Watched film ? FILM . . . . . . . . . . . . . . . . . . . . 1 2
354 | Appendix E

NO. QUESTIONS AND FILTERS CODING CATEGORIES SKIP
717 CHECK 601:
YES, YES, NO,CURRENTLY LIVING NOT IN 801
MARRIED WITH A MAN UNION
718 CHECK 311/311A: CODE B, G, OR NCIRCLED
720NO CODECIRCLED 722
OTHER
719 Does your husband/partner know that you are using YES . . . . . . . . . . . . . . . . . . . . . . . . . . . . . 1a method of family planning? NO . . . . . . . . . . . . . . . . . . . . . . . . . . . . . 2
DON'T KNOW . . . . . . . . . . . . . . . . . . . . 8
720 Would you say that using contraception is mainly your MAINLY RESPONDENT . . . . . . . . . . 1decision, mainly your husband's/partner's decision, or did MAINLY HUSBAND/PARTNER . . . . . 2you both decide together? JOINT DECISION . . . . . . . . . . . . . . . . 3
OTHER 6(SPECIFY)
721 CHECK 311/311A:
NEITHER HE OR SHESTERILIZED STERILIZED 801
722 Does your husband/partner want the same number of SAME NUMBER . . . . . . . . . . . . . . . . . . 1children that you want, or does he want more or fewer than you MORE CHILDREN . . . . . . . . . . . . . . . . 2want? FEWER CHILDREN . . . . . . . . . . . . . . . . 3
DON'T KNOW . . . . . . . . . . . . . . . . . . . . 8
| 355Appendix E

SECTION 8. HUSBAND'S BACKGROUND AND WOMAN'S WORK
NO. QUESTIONS AND FILTERS CODING CATEGORIES SKIP
801 CHECK 601 AND 602:
CURRENTLY FORMERLY 803MARRIED/ MARRIED/ NEVER MARRIED
LIVING WITH LIVED WITH AND NEVER 807A MAN A MAN LIVED WITH A MAN
802 How old was your husband/partner on his last birthday?AGE IN COMPLETED YEARS
803 Did your (last) husband/partner ever attend school? YES . . . . . . . . . . . . . . . . . . . . . . . . . . . . . 1NO . . . . . . . . . . . . . . . . . . . . . . . . . . . . . 2 806
804 What was the highest level of school he attended: PRIMARY . . . . . . . . . . . . . . . . . . . . . . 1primary, pre-secondary, secondary, or higher? PRE-SECONDARY 2
SECONDARY . . . . . . . . . . . . . . . . . . . . 3HIGHER . . . . . . . . . . . . . . . . . . . . . . . . 4DON'T KNOW . . . . . . . . . . . . . . . . . . . . 8 806
805 What was the highest (grade) he completed atthat level? GRADE . . . . . . . . . . . . . . . .
DON'T KNOW . . . . . . . . . . . . . . . . . . 98
806 CHECK 801:
CURRENTLY MARRIED/ FORMERLY MARRIED/LIVING WITH A MAN LIVED WITH A MAN
What is your husband's/partner's What was your (last) husband's/occupation? partner's occupation?That is, what kind of work does That is, what kind of work did hehe mainly do? mainly do?
807 Aside from your own housework, have you done any work YES . . . . . . . . . . . . . . . . . . . . . . . . . . . . . 1 811in the last seven days? NO . . . . . . . . . . . . . . . . . . . . . . . . . . . . . 2
808 As you know, some women take up jobs for which they are paidin cash or kind. Others sell things, have a small business orwork on the family farm or in the family business. YES . . . . . . . . . . . . . . . . . . . . . . . . . . . . . 1 811In the last seven days, have you done any of these things NO . . . . . . . . . . . . . . . . . . . . . . . . . . . . . 2or any other work?
809 Although you did not work in the last seven days, do you haveany job or business from which you were absent for leave, YES . . . . . . . . . . . . . . . . . . . . . . . . . . . . . 1 811illness, vacation, maternity leave or any other such reason? NO . . . . . . . . . . . . . . . . . . . . . . . . . . . . . 2
810 Have you done any work in the last 12 months? YES . . . . . . . . . . . . . . . . . . . . . . . . . . . . . 1NO . . . . . . . . . . . . . . . . . . . . . . . . . . . . . 2 818
811 What is your occupation, that is, what kind of work do you mainlydo?
812 CHECK 811:
WORKS IN DOES NOT WORKAGRICULTURE IN AGRICULTURE 814
813 Do you work mainly on your own land or on family land, or do you OWN LAND . . . . . . . . . . . . . . . . . . . . . . 1work on land that you rent from someone else, or do you work on FAMILY LAND . . . . . . . . . . . . . . . . . . . . 2someone else's land? RENTED LAND . . . . . . . . . . . . . . . . . . 3
SOMEONE ELSE'S LAND . . . . . . . . . . 4
356 | Appendix E

NO. QUESTIONS AND FILTERS CODING CATEGORIES SKIP
814 Do you do this work for a member of your family, for someone FOR FAMILY MEMBER . . . . . . . . . . . . 1else, or are you self-employed? FOR SOMEONE ELSE . . . . . . . . . . . . 2
SELF-EMPLOYED . . . . . . . . . . . . 3
815 Do you usually work at home or away from home? HOME . . . . . . . . . . . . . . . . . . . . . . . . . . . 1AWAY . . . . . . . . . . . . . . . . . . . . . . . . . . . 2
816 Do you usually work throughout the year, or do you work THROUGHOUT THE YEAR . . . . . . . . . . 1seasonally, or only once in a while? SEASONALLY/PART OF THE YEAR . 2
ONCE IN A WHILE . . . . . . . . . . . . . . . . 3
817 Are you paid in cash or kind for this work or are you not paid at all? CASH ONLY . . . . . . . . . . . . . . . . . . . . 1CASH AND KIND . . . . . . . . . . . . . . . . . . 2IN KIND ONLY . . . . . . . . . . . . . . . . . . . . 3NOT PAID . . . . . . . . . . . . . . . . . . . . . . 4
818 CHECK 601:
CURRENTLYMARRIED/LIVING NOT IN UNION
WITH A MAN 827
819 CHECK 817:
CODE 1 OR 2CIRCLED OTHER 822
820 Who usually decides how the money you earn will be used: RESPONDENT . . . . . . . . . . . . . . . . . . 1mainly you, mainly your husband/partner, or HUSBAND/PARTNER . . . . . . . . . . . . . . 2you and your husband/partner jointly? RESPONDENT AND
HUSBAND/PARTNER JOINTLY . . . 3OTHER 6
(SPECIFY)
821 Would you say that the money that you earn is more than what MORE THAN HIM . . . . . . . . . . . . . . . . . . 1your husband/partner earns, less than what he earns, LESS THAN HIM . . . . . . . . . . . . . . . . . . 2or about the same? ABOUT THE SAME . . . . . . . . . . . . . . . . 3
HUSBAND/PARTNER DOESN'TBRING IN ANY MONEY . . . . . . . . . . 4 823
DON'T KNOW . . . . . . . . . . . . . . . . . . . . 8
822 Who usually decides how your husband's/partner's earnings RESPONDENT . . . . . . . . . . . . . . . . . . 1will be used: you, your husband/partner, or you and your HUSBAND/PARTNER . . . . . . . . . . . . . . 2husband/partner jointly? RESPONDENT AND
HUSBAND/PARTNER JOINTLY . . . 3HUSBAND/PARTNER HAS NO EARNINGS . . . . . . . . . . . . . . . . 4OTHER 6
(SPECIFY)
823 Who usually makes decisions about health care for yourself:you, your husband/partner, you and your husband/partnerjointly, or someone else?
1 2 3 4 6
824 Who usually makes decisions about making majorhousehold purchases? 1 2 3 4 6
825 Who usually makes decisions about making purchasesfor daily household needs? 1 2 3 4 6
826 Who usually makes decisions about visits to your familyor relatives? 1 2 3 4 6
RESPONDENT = 1HUSBAND/PARTNER = 2RESPONDENT & HUSBAND/PARTNER JOINTLY = 3 SOMEONE ELSE = 4OTHER = 6
| 357Appendix E

NO. QUESTIONS AND FILTERS CODING CATEGORIES SKIP
827 PRESENCE OF OTHERS AT THIS POINT (PRESENT AND PRES./ PRES./ NOTLISTENING, PRESENT BUT NOT LISTENING, OR NOT LISTEN. NOT PRES.PRESENT) LISTEN.
CHILDREN < 10 . . . . . 1 2 3HUSBAND . . . . . . . . . . 1 2 3OTHER MALES . . . . . 1 2 3OTHER FEMALES . . . 1 2 3
828 Sometimes a husband is annoyed or angered by things that hiswife does. In your opinion, is a husband justified in hitting orbeating his wife in the following situations: YES NO DK
If she goes out without telling him? GOES OUT . . . . . . . . . . 1 2 8If she neglects the children? NEGL. CHILDREN . . . 1 2 8If she argues with him? ARGUES . . . . . . . . . . . . 1 2 8If she refuses to have sex with him? REFUSES SEX . . . . . 1 2 8If she burns the food? BURNS FOOD . . . . . . . . 1 2 8
358 | Appendix E

SECTION 9. HIV/AIDS
NO. QUESTIONS AND FILTERS CODING CATEGORIES SKIP
901 Now I would like to talk about something else. YES . . . . . . . . . . . . . . . . . . . . . . . . . . . . . 1Have you ever heard of an illness called AIDS? NO . . . . . . . . . . . . . . . . . . . . . . . . . . . . . 2 915
902 Can people reduce their chance of getting the AIDS virus YES . . . . . . . . . . . . . . . . . . . . . . . . . . . . . 1by having just one uninfected sex partner who has no other NO . . . . . . . . . . . . . . . . . . . . . . . . . . . . . 2sex partners? DON'T KNOW . . . . . . . . . . . . . . . . . . . . 8
903 Can people get the AIDS virus from mosquito bites? YES . . . . . . . . . . . . . . . . . . . . . . . . . . . . . 1NO . . . . . . . . . . . . . . . . . . . . . . . . . . . . . 2DON'T KNOW . . . . . . . . . . . . . . . . . . . . 8
904 Can people reduce their chance of getting the AIDS virus by YES . . . . . . . . . . . . . . . . . . . . . . . . . . . . . 1using a condom every time they have sex? NO . . . . . . . . . . . . . . . . . . . . . . . . . . . . . 2
DON'T KNOW . . . . . . . . . . . . . . . . . . . . 8
905 Can people get the AIDS virus by sharing food with a person who YES . . . . . . . . . . . . . . . . . . . . . . . . . . . . . 1has AIDS? NO . . . . . . . . . . . . . . . . . . . . . . . . . . . . . 2
DON'T KNOW . . . . . . . . . . . . . . . . . . . . 8
906 Can people reduce their chance of getting the AIDS virus by YES . . . . . . . . . . . . . . . . . . . . . . . . . . . . . 1not having sexual intercourse at all? NO . . . . . . . . . . . . . . . . . . . . . . . . . . . . . 2
DON'T KNOW . . . . . . . . . . . . . . . . . . . . 8
907 Can people get the AIDS virus by sharing clothes with a person YES . . . . . . . . . . . . . . . . . . . . . . . . . . . . . 1who has AIDS virus? NO . . . . . . . . . . . . . . . . . . . . . . . . . . . . . 2
DON'T KNOW . . . . . . . . . . . . . . . . . . . . 8
908 Is it possible for a healthy-looking person to have the AIDS virus? YES . . . . . . . . . . . . . . . . . . . . . . . . . . . . . 1NO . . . . . . . . . . . . . . . . . . . . . . . . . . . . . 2DON'T KNOW . . . . . . . . . . . . . . . . . . . . 8
908A Can HIV/AIDS be cured? YES . . . . . . . . . . . . . . . . . . . . . . . . . . . . 1NO . . . . . . . . . . . . . . . . . . . . . . . . . . . . . 2DON'T KNOW . . . . . . . . . . . . . . . . . . . . 8
909 Do you know of a place where people can go to get tested for YES . . . . . . . . . . . . . . . . . . . . . . . . . . . . . 1the AIDS virus? NO . . . . . . . . . . . . . . . . . . . . . . . . . . . . . 2 911
910 Where is that? PUBLIC SECTORNATIONAL HOSPITAL A
Any other place? REFERRAL HOSPITAL BVCT CENTER . . . . . . . . . . . . . . . . . . C
PROBE TO IDENTIFY EACH TYPE OF SOURCE AND COMMUNITY HEALTH CEN DCIRCLE THE APPROPRIATE CODE(S). HEALTH POST E
SISCa POST FMOBILE CLINIC G
IF UNABLE TO DETERMINE IF HOSPITAL, HEALTH CENTERVCT CENTER, OR CLINIC IS PUBLIC OR PRIVATE MEDICAL, OTHER PUBLIC HWRITE THE NAME OF THE PLACE. (SPECIFY)
NON-GOVT(NGO) SECTORMARIE STOPES IOTHER NGOS J
(SPECIFY)
PRIVATE MEDICAL SECTOR(NAME OF PLACE(S)) PRIVATE HOSPITAL/CLINIC/
PRIVATE DOCTOR KVCT CENTER . . . . . . . . . . . . . . . . . . LPHARMACY MMOBILE CLINIC NFIELDWORKER OOTHER PRIVATE
MEDICAL P(SPECIFY)
OTHER X(SPECIFY)
911 Would you buy fresh vegetables from a shopkeeper or vendor YES . . . . . . . . . . . . . . . . . . . . . . . . . . . . . 1if you knew that this person had the AIDS virus? NO . . . . . . . . . . . . . . . . . . . . . . . . . . . . . 2
DON'T KNOW . . . . . . . . . . . . . . . . . . . . 8
912 If a member of your family got infected with the AIDS virus, YES, REMAIN A SECRET 1would you want it to remain a secret or not? NO . . . . . . . . . . . . . . . . . . . . . . . . . . . . . 2
DK/NOT SURE/DEPENDS 8
. . . . . .
. . . . . . . . . . . . . . . . . . . .
. . . . . . . . . . . . . . . . . . .
. . . . . .
. . . . . . . . . . . . . .
. . . . . . . . . . . . . .
. . . . . . . . . . . . . .
. . . . . . . . . . . . . .
. . . . . . . . . . . . . .
. . . . . . . . . .
. . . . . . . . . .
. . . . . . . . . .
| 359Appendix E

NO. QUESTIONS AND FILTERS CODING CATEGORIES SKIP
913 If a member of your family became sick with AIDS, would you YES . . . . . . . . . . . . . . . . . . . . . . . . . . . . . 1be willing to care for her or him in your own household? NO . . . . . . . . . . . . . . . . . . . . . . . . . . . . . 2
DK/NOT SURE/DEPENDS . . . . . . . . . . 8
914 In your opinion, if a female teacher has the AIDS virus but SHOULD BE ALLOWED . . . . . . . . . . . . 1is not sick, should she be allowed to continue teaching SHOULD NOT BE ALLOWED . . . . . . . . 2in the school? DK/NOT SURE/DEPENDS . . . . . . . . . . 8
915 CHECK 901:
HEARD ABOUT NOT HEARDAIDS ABOUT AIDS
Apart from AIDS, have Have you heard about infections you heard about other that can be transmitted throughinfections that can be sexual contact? YES . . . . . . . . . . . . . . . . . . . . . . . . . . . . . 1transmitted through NO . . . . . . . . . . . . . . . . . . . . . . . . . . . . . 2sexual contact?
916 CHECK 618:HAS HAD SEXUAL HAS NOT HAD SEXUAL
INTERCOURSE INTERCOURSE 924
917 CHECK 915: HEARD ABOUT OTHER SEXUALLY TRANSMITTED INFECTIONS?
YES NO 919
918 Now I would like to ask you some questions about your health in YES . . . . . . . . . . . . . . . . . . . . . . . . . . . . . 1the last 12 months. During the last 12 months, have you had a NO . . . . . . . . . . . . . . . . . . . . . . . . . . . . . 2disease which you got through sexual contact? DON'T KNOW . . . . . . . . . . . . . . . . . . . . 8
919 Sometimes women experience a bad smelling abnormal genital YES . . . . . . . . . . . . . . . . . . . . . . . . . . . . . 1discharge. NO . . . . . . . . . . . . . . . . . . . . . . . . . . . . . 2During the last 12 months, have you had a bad smelling abnormal DON'T KNOW . . . . . . . . . . . . . . . . . . . . 8genital discharge?
920 Sometimes women have a genital sore or ulcer. YES . . . . . . . . . . . . . . . . . . . . . . . . . . . . . 1During the last 12 months, have you had a genital sore or ulcer? NO . . . . . . . . . . . . . . . . . . . . . . . . . . . . . 2
DON'T KNOW . . . . . . . . . . . . . . . . . . . . 8
921 CHECK 918, 919, AND 920:HAS HAD AN HAS NOT HAD AN
INFECTION INFECTION OR 924(ANY 'YES') DOES NOT KNOW
922 The last time you had (PROBLEM FROM 918/919/920), YES . . . . . . . . . . . . . . . . . . . . . . . . . . . . . 1did you seek any kind of advice or treatment? NO . . . . . . . . . . . . . . . . . . . . . . . . . . . . . 2 924
360 | Appendix E

NO. QUESTIONS AND FILTERS CODING CATEGORIES SKIP
923 Where did you go? PUBLIC SECTORNATIONAL HOSPITAL . . . . . . . . A
Any other place? REFERRAL HOSPITAL . . . . . . . . BVCT CENTER . . . C
PROBE TO IDENTIFY EACH TYPE OF SOURCE AND COMMUNITY HEALTH CEN. . . . . . . . DCIRCLE THE APPROPRIATE CODE(S). HEALTH POST . . . . . . . . . . . . . . . . E
SISCa POST . . . . . . . . . . . . . . . . FMOBILE CLINIC . . . . . . . . . . . . . . . . G
IF UNABLE TO DETERMINE IF HOSPITAL, HEALTH CENTERVCT CENTER, OR CLINIC IS PUBLIC OR PRIVATE MEDICAL, OTHER PUBLIC HWRITE THE NAME OF THE PLACE. (SPECIFY)
NON-GOVT(NGO) SECTORMARIE STOPES IOTHER NGOS J
(SPECIFY)
(NAME OF PLACE(S)) PRIVATE MEDICAL SECTORPRIVATE HOSPITAL/CLINIC/
PRIVATE DOCTOR KVCT CENTER . . . . . . . . . . . . . . . . . . LPHARMACY . . . . . . . . . . . . . . . . . . MMOBILE CLINIC . . . . . . . . . . . . . . . . NFIELDWORKER . . . . . . . . . . . . . . . . OOTHER PRIVATE
MEDICAL P(SPECIFY)
OTHER SOURCESHOP . . . . . . . . . . . . . . . . . . . . . . . . . QOTHER X
(SPECIFY)
924 Husbands and wives do not always agree on everything. YES . . . . . . . . . . . . . . . . . . . . . . . . . . . . . 1If a wife knows her husband has a disease that she can get NO . . . . . . . . . . . . . . . . . . . . . . . . . . . . . 2during sexual intercourse, is she justified in refusing to have DON'T KNOW . . . . . . . . . . . . . . . . . . . . 8sex with him?
925 Is a wife justified in refusing to have sex with her husband when YES . . . . . . . . . . . . . . . . . . . . . . . . . . . . . 1she is tired or not in the mood? NO . . . . . . . . . . . . . . . . . . . . . . . . . . . . . 2
DON'T KNOW . . . . . . . . . . . . . . . . . . . . 8
926 Is a wife justified in refusing to have sex with her husband YES . . . . . . . . . . . . . . . . . . . . . . . . . . . . . 1when she knows her husband has sex with other women? NO . . . . . . . . . . . . . . . . . . . . . . . . . . . . . 2
DON'T KNOW . . . . . . . . . . . . . . . . . . . . 8
. . . . . . . . . . . .
. . . . . . . . . . . . . .
| 361Appendix E

SECTION 10. OTHER HEALTH ISSUES
NO. QUESTIONS AND FILTERS CODING CATEGORIES SKIP
1001 Have you ever heard of an illness called tuberculosis or TB? YES . . . . . . . . . . . . . . . . . . . . . . . . . . . . 1NO . . . . . . . . . . . . . . . . . . . . . . . . . . . . 2 1005
1002 How does tuberculosis spread from one person to another? THROUGH THE AIR WHENCOUGHING OR SNEEZING. . . . . . . A
PROBE: Any other ways? THROUGH SHARING UTENSILS. . . . . BTHROUGH TOUCHING A PERSON
RECORD ALL MENTIONED. WITH TB . . . . . . . . . . . . . . . . . . . . . . CTHROUGH FOOD . . . . . . . . . . . . . . . . DTHROUGH SEXUAL CONTACT . . . . . ETHROUGH MOSQUITO BITES. . . . . . . F
OTHER X(SPECIFY)
DON’T KNOW . . . . . . . . . . . . . . . . . . . . Z
1003 Can tuberculosis be cured? YES . . . . . . . . . . . . . . . . . . . . . . . . . . . . 1NO . . . . . . . . . . . . . . . . . . . . . . . . . . . . 2DON'T KNOW . . . . . . . . . . . . . . . . . . . . 8
1004 If a member of your family got tuberculosis, would you want it to YES, REMAIN A SECRET . . . . . . . . . . 1remain a secret or not? NO . . . . . . . . . . . . . . . . . . . . . . . . . . . . 2
DON'T KNOW/NOT SURE/DEPENDS . . . . . . . . . . . . . . . . . . . . 8
1005 Now I would like to ask you some other questions relating to health matters. Have you had an injectionfor any reason in the last 12 months? NUMBER OF INJECTIONS . . .
IF YES: How many injections have you had?
IF NUMBER OF INJECTIONS IS GREATER THAN 90, NONE . . . . . . . . . . . . . . . . . . . . . . . . . . 00 1009OR DAILY FOR 3 MONTHS OR MORE, RECORD '90'.
IF NON-NUMERIC ANSWER, PROBE TO GET AN ESTIMATE.
1006 Among these injections, how many were administered by a doctor, a nurse, a pharmacist, a dentist, or any other NUMBER OF INJECTIONS . . . health worker?
IF NUMBER OF INJECTIONS IS GREATER THAN 90, OR DAILY FOR 3 MONTHS OR MORE, RECORD '90'. NONE . . . . . . . . . . . . . . . . . . . . . . . . . . 00 1009
IF NON-NUMERIC ANSWER, PROBE TO GET AN ESTIMATE.
1007 The last time you had an injection given to you by a health worker, PUBLIC SECTORwhere did you go to get the injection? NATIONAL HOSPITAL . . . . . 11
REFERRAL HOSPITAL . . . . . . . 12COMMUNITY HEALTH CEN. . . . . . 13HEALTH POST . . . . . . . . . . . . . . . . 14
PROBE TO IDENTIFY THE TYPE OF SOURCE AND CIRCLE OTHER PUBLIC 16THE APPROPRIATE CODE. (SPECIFY)
PRIVATE MEDICAL SECTORIF UNABLE TO DETERMINE IF HOSPITAL, HEALTH CENTER PRIVATE HOSPITAL/CLINIC/OR CLINIC IS PUBLIC OR PRIVATE MEDICAL, WRITE PRIVATE DOCTOR . . . . . . . . . . 21THE NAME OF THE PLACE. DENTAL CLINIC/OFFICE . . . . . . . 22
PHARMACY . . . . . . . . . . . . . . . . . . 23(NAME OF PLACE) OFFICE OR HOME OF NURSE/
HEALTH WORKER . . . . . . . . . . . . 24OTHER PRIVATE
MEDICAL 26(SPECIFY)
OTHER PLACEAT HOME . . . . . . . . . . . . . . . . . . . . 31
OTHER 96(SPECIFY)
1008 Did the person who gave you that injection take the syringe and YES . . . . . . . . . . . . . . . . . . . . . . . . . . . . 1needle from a new, unopened package? NO . . . . . . . . . . . . . . . . . . . . . . . . . . . . 2
DON'T KNOW . . . . . . . . . . . . . . . . . . . . 8
362 | Appendix E

NO. QUESTIONS AND FILTERS CODING CATEGORIES SKIP
1009 Do you currently smoke cigarettes? YES . . . . . . . . . . . . . . . . . . . . . . . . . . . . 1NO . . . . . . . . . . . . . . . . . . . . . . . . . . . . 2 1011
1010 In the last 24 hours, how many cigarettes did you smoke?CIGARETTES . . . . . . . . . . . . . .
1011 Do you currently smoke or use any other type of tobacco? YES . . . . . . . . . . . . . . . . . . . . . . . . . . . . 1NO . . . . . . . . . . . . . . . . . . . . . . . . . . . . 2 1013
1012 What (other) type of tobacco do you currently smoke or use? PIPE . . . . . . . . . . . . . . . . . . . . . . . . . . ACHEWING TOBACCO . . . . . . . . . . . . B
RECORD ALL MENTIONED. SNUFF . . . . . . . . . . . . . . . . . . . . . . . . CROLLED TOBACCO . . . . . . . . . . . . . . D
OTHER X(SPECIFY)
1013 Many different factors can prevent women from getting medical advice or treatment for themselves. When you are sick and BIG NOT A BIGwant to get medical advice or treatment, is each of the following PROB- PROB-a big problem or not? LEM LEM
Getting permission to go? PERMISSION TO GO . . . 1 2
Getting money needed for treatment? GETTING MONEY . . . . . 1 2
The distance to the health facility? DISTANCE . . . . . . . . . . . . 1 2
Having to take transport? TAKING TRANSPORT . . . 1 2
Not wanting to go alone? GO ALONE . . . . . . . . . . . . 1 2
Concern that there may not be a female health provider? NO FEMALE PROV . . . 1 2
Concern that there may not be any health provider? NO PROVIDER . . . 1 2
Concern that there may be no drugs available? NO DRUGS . . . 1 2
1014 Did you use soap for any purpose yesterday? YES . . . . . . . . . . . . . . . . . . . . . . . . . . . . 1NO . . . . . . . . . . . . . . . . . . . . . . . . . . . . 2 1101
1015 For what purpose did you use soap? HANDWASHING . . . . . . . . . . . . . . . . AWASHING OWN BODY . . . . . . . . . . . . B
Any other purpose? WASHING CHILD'S HANDS . . . . . . . CWASHING CHILD'S BODY . . . . . . . D
RECORD ALL MENTIONED. WASHING CLOTHES . . . . . . . . . . . . EWASHING COOKING POTS F
OTHER X(SPECIFY)
CHECK 1015:
CODE 'A' CODE 'A'CIRCLED NOT CIRCLED
How many times did you wash your hands with soap yesterday? TIMES . . . . . . . . . . . . . . . . . . . .
IF MORE THAN 7 TIMES, RECORD '7.' DON'T KNOW . . . . . . . . . . . . . . . . . . . . 8
1016
1101
1017
| 363Appendix E

SECTION 11. MATERNAL MORTALITY
NO. QUESTIONS AND FILTERS CODING CATEGORIES SKIP
1101 Now I would like to ask you some questions about you NUMBER OF BIRTHS TObrothers and sisters, that is, all of the children born to your NATURAL MOTHER . . . . . . . . . natural mother, including those who are living with you,those living elsewhere and those who have died.
How many children did your mother give birth to, including you?
1102 CHECK 1101:
TWO OR MORE BIRTHS ONLY ONE BIRTH(RESPONDENT ONLY)
1103 How many of these births did your mother have before NUMBER OF you were born? PRECEDING BIRTHS . . . . . . . . .
1104 What was the (1) (2) (3) (4) (5) (6)name given toyour oldest(next oldest)brother or sister?
1105 Is (NAME) MALE 1 MALE 1 MALE 1 MALE 1 MALE 1 MALE 1male or female? FEMALE 2 FEMALE 2 FEMALE 2 FEMALE 2 FEMALE 2 FEMALE 2
1106 Is (NAME) still YES . . . 1 YES . . . 1 YES . . . 1 YES . . . 1 YES . . . 1 YES . . . 1alive? NO . . . 2 NO . . . 2 NO . . . 2 NO . . . 2 NO . . . 2 NO . . . 2
GO TO 1108 GO TO 1108 GO TO 1108 GO TO 1108 GO TO 1108 GO TO 1108DK . . . 8 DK . . . 8 DK . . . 8 DK . . . 8 DK . . . 8 DK . . . 8GO TO (2) GO TO (3) GO TO (4) GO TO (5) GO TO (6) GO TO (7)
1107 How old is(NAME)?
GO TO (2) GO TO (3) GO TO (4) GO TO (5) GO TO (6) GO TO (7)
1108 How many yearsago did (NAME)die?
1109 How old was(NAME) whenhe/she died?
IF MALE IF MALE IF MALE IF MALE IF MALE IF MALEOR DIED OR DIED OR DIED OR DIED OR DIED OR DIEDBEFORE BEFORE BEFORE BEFORE BEFORE BEFORE12 YEARS 12 YEARS 12 YEARS 12 YEARS 12 YEARS 12 YEARSOF AGE OF AGE OF AGE OF AGE OF AGE OF AGEGO TO (2) GO TO (3) GO TO (4) GO TO (5) GO TO (6) GO TO (7)
1110 Was (NAME) YES . . . 1 YES . . . 1 YES . . . 1 YES . . . 1 YES . . . 1 YES . . . 1pregnant when GO TO 1113 GO TO 1113 GO TO 1113 GO TO 1113 GO TO 1113 GO TO 1113she died? NO . . . 2 NO . . . 2 NO . . . 2 NO . . . 2 NO . . . 2 NO . . . 2
1111 Did (NAME) YES . . . 1 YES . . . 1 YES . . . 1 YES . . . 1 YES . . . 1 YES . . . 1die during GO TO 1113 GO TO 1113 GO TO 1113 GO TO 1113 GO TO 1113 GO TO 1113childbirth? NO . . . 2 NO . . . 2 NO . . . 2 NO . . . 2 NO . . . 2 NO . . . 2
1112 Did (NAME) YES . . . 1 YES . . . 1 YES . . . 1 YES . . . 1 YES . . . 1 YES . . . 1die within two NO . . . 2 NO . . . 2 NO . . . 2 NO . . . 2 NO . . . 2 NO . . . 2months afterthe end of apregnancy orchildbirth?
1113 How many liveborn children did(NAME) givebirth to duringher lifetime(before thispregnancy)?
IF NO MORE BROTHERS OR SISTERS, GO TO 1200.
1200
364 | Appendix E

NO. QUESTIONS AND FILTERS CODING CATEGORIES SKIP
1104 What was the (7) (8) (9) (10) (11) (12)name given toyour oldest (nextoldest) brotheror sister?
1105 Is (NAME) male MALE 1 MALE 1 MALE 1 MALE 1 MALE 1 MALE 1or female? FEMALE 2 FEMALE 2 FEMALE 2 FEMALE 2 FEMALE 2 FEMALE 2
1106 Is (NAME) YES . . . 1 YES . . . 1 YES . . . 1 YES . . . 1 YES . . . 1 YES . . . 1still alive? NO . . . 2 NO . . . 2 NO . . . 2 NO . . . 2 NO . . . 2 NO . . . 2
GO TO 1108 GO TO 1108 GO TO 1108 GO TO 1108 GO TO 1108 GO TO 1108DK . . . 8 DK . . . 8 DK . . . 8 DK . . . 8 DK . . . 8 DK . . . 8GO TO (8) GO TO (9) GO TO (10) GO TO (11) GO TO (12) GO TO (13)
1107 How old is(NAME)?
GO TO (8) GO TO (9) GO TO (10) GO TO (11) GO TO (12) GO TO (13)
1108 How many yearsago did (NAME)die?
1109 How old was(NAME) whenhe/she died?
IF MALE IF MALE IF MALE IF MALE IF MALE IF MALEOR DIED OR DIED OR DIED OR DIED OR DIED OR DIEDBEFORE BEFORE BEFORE BEFORE BEFORE BEFORE12 YEARS 12 YEARS 12 YEARS 12 YEARS 12 YEARS 12 YEARSOF AGE OF AGE OF AGE OF AGE OF AGE OF AGEGO TO (8) GO TO (9) GO TO (10) GO TO (11) GO TO (12) GO TO (13)
1110 Was (NAME) YES . . . 1 YES . . . 1 YES . . . 1 YES . . . 1 YES . . . 1 YES . . . 1pregnant when GO TO 1113 GO TO 1113 GO TO 1113 GO TO 1113 GO TO 1113 GO TO 1113she died? NO . . . 2 NO . . . 2 NO . . . 2 NO . . . 2 NO . . . 2 NO . . . 2
1111 Did (NAME) YES . . . 1 YES . . . 1 YES . . . 1 YES . . . 1 YES . . . 1 YES . . . 1die during GO TO 1113 GO TO 1113 GO TO 1113 GO TO 1113 GO TO 1113 GO TO 1113childbirth? NO . . . 2 NO . . . 2 NO . . . 2 NO . . . 2 NO . . . 2 NO . . . 2
1112 Did (NAME) YES . . . 1 YES . . . 1 YES . . . 1 YES . . . 1 YES . . . 1 YES . . . 1die within two NO . . . 2 NO . . . 2 NO . . . 2 NO . . . 2 NO . . . 2 NO . . . 2months afterthe end of apregnancy orchildbirth?
1113 How many liveborn childrendid (NAME) givebirth to duringher lifetime(before thispregnancy)?
IF NO MORE BROTHERS OR SISTERS, GO TO 1200.
| 365Appendix E
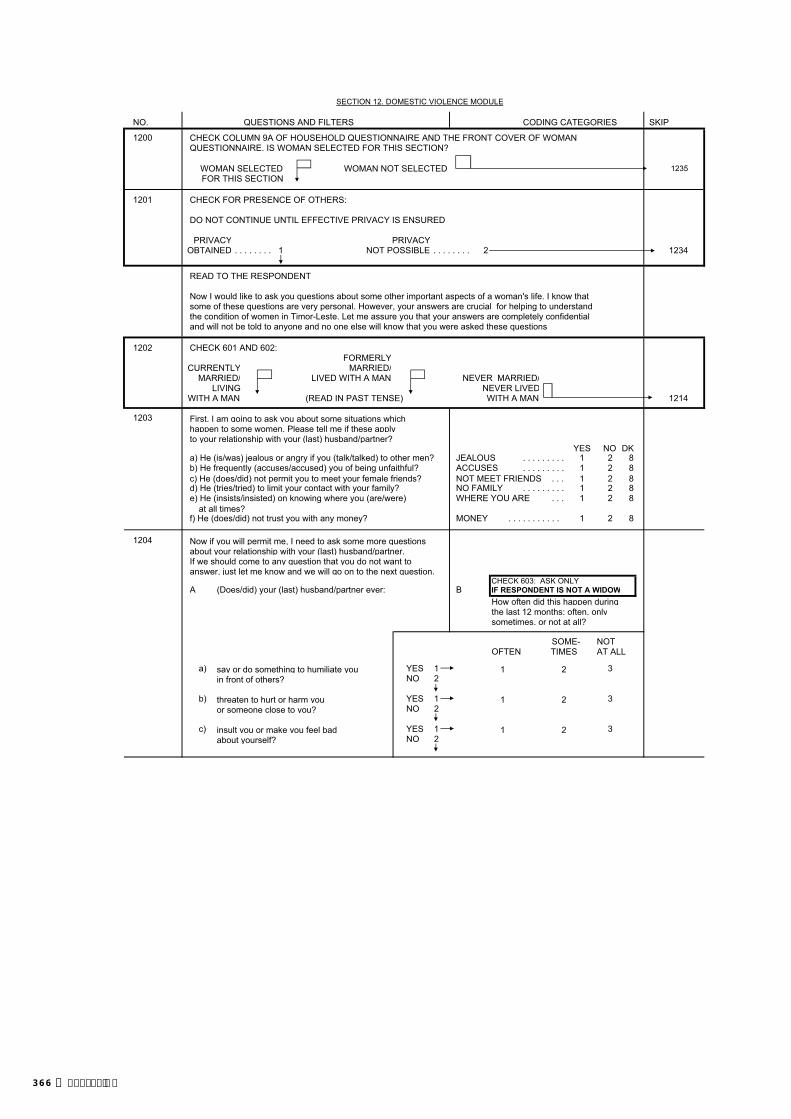
SECTION 12. DOMESTIC VIOLENCE MODULE
NO. QUESTIONS AND FILTERS CODING CATEGORIES SKIP
CHECK COLUMN 9A OF HOUSEHOLD QUESTIONNAIRE AND THE FRONT COVER OF WOMANQUESTIONNAIRE. IS WOMAN SELECTED FOR THIS SECTION?
WOMAN SELECTED WOMAN NOT SELECTED 1235FOR THIS SECTION
CHECK FOR PRESENCE OF OTHERS:
DO NOT CONTINUE UNTIL EFFECTIVE PRIVACY IS ENSURED.
PRIVACY PRIVACYOBTAINED . . . . . . . . 1 NOT POSSIBLE . . . . . . . . 2 1234
READ TO THE RESPONDENT
Now I would like to ask you questions about some other important aspects of a woman's life. I know that some of these questions are very personal. However, your answers are crucial for helping to understand the condition of women in Timor-Leste. Let me assure you that your answers are completely confidentialand will not be told to anyone and no one else will know that you were asked these questions.
1202 CHECK 601 AND 602: FORMERLY
CURRENTLY MARRIED/MARRIED/ LIVED WITH A MAN NEVER MARRIED/
LIVING NEVER LIVEDWITH A MAN (READ IN PAST TENSE) WITH A MAN 1214
1203 First, I am going to ask you about some situations which happen to some women. Please tell me if these applyto your relationship with your (last) husband/partner?
YES NO DKa) He (is/was) jealous or angry if you (talk/talked) to other men? JEALOUS 1 2 8b) He frequently (accuses/accused) you of being unfaithful? ACCUSES 1 2 8c) He (does/did) not permit you to meet your female friends? NOT MEET FRIENDS . . . 1 2 8d) He (tries/tried) to limit your contact with your family? NO FAMILY 1 2 8e) He (insists/insisted) on knowing where you (are/were) WHERE YOU ARE 1 2 8
at all times?f) He (does/did) not trust you with any money? MONEY 1 2 8
1204 Now if you will permit me, I need to ask some more questionsabout your relationship with your (last) husband/partner.If we should come to any question that you do not want to answer, just let me know and we will go on to the next question.
A (Does/did) your (last) husband/partner ever: B IF RESPONDENT IS NOT A WIDOWHow often did this happen duringthe last 12 months: often, onlysometimes, or not at all?
SOME- NOT OFTEN TIMES AT ALL
a) say or do something to humiliate you YES 1 1 2 3in front of others? NO 2
b) threaten to hurt or harm you YES 1 1 2 3or someone close to you? NO 2
c) insult you or make you feel bad YES 1 1 2 3about yourself? NO 2
. . . . . . . . . . .
CHECK 603: ASK ONLY
1200
1201
. . . . . . . . .
. . . . . . . . .
. . . . . . . . . . . .
366 | Appendix E

NO. QUESTIONS AND FILTERS CODING CATEGORIES SKIP
CHECK 603: ASK ONLY1205 A B IF RESPONDENT IS NOT A WIDOW
How often did this happen duringthe last 12 months: often, onlysometimes, or not at all?
SOME- NOT OFTEN TIMES AT ALL
a) push you, shake you, or throw something YES 1 1 2 3at you? NO 2
b) slap you? YES 1 1 2 3NO 2
c) twist your arm or pull your hair? YES 1 1 2 3NO 2
d) punch you with his fist or with something YES 1 1 2 3that could hurt you? NO 2
e) kick you, drag you or beat you up? YES 1 1 2 3NO 2
f) try to choke you or burn you on YES 1 1 2 3purpose? NO 2
g) threaten or attack you with a knife, gun, or YES 1 1 2 3any other weapon? NO 2
h) physically force you to have sexual YES 1 1 2 3intercourse with him even when you NO 2did not want to?
i) force you to perform any sexual acts YES 1 1 2 3you did not want to? NO 2
1206 CHECK 1205A (a-i):
AT LEAST ONE NOT A SINGLE'YES' 'YES' 1209
1207 How long after you first (got married to/started living with) your NUMBER OF YEARS(last) husband/partner did (this/any of these things) first happen? BEFORE MARRIAGE/BEFORE
LIVING TOGETHERIF LESS THAN ONE YEAR, RECORD '00'.
1208 Did the following ever happen as a result of whatyour (last) husband/partner did to you:
a) YES . . . . . . . . . . . . . . . . . . . . . . . . . 1NO . . . . . . . . . . . . . . . . . . . . . . . . . 2
b) You had eye injuries, sprains, dislocations, YES . . . . . . . . . . . . . . . . . . . . . . . . . 1or burns? NO . . . . . . . . . . . . . . . . . . . . . . . . . 2
c) You had deep wounds, broken bones, YES . . . . . . . . . . . . . . . . . . . . . . . . . 1broken teeth, or any other serious injury? NO . . . . . . . . . . . . . . . . . . . . . . . . . 2
1209 Have you ever hit, slapped, kicked, or done anything else to YES . . . . . . . . . . . . . . . . . . . . . . . . . 1physically hurt your (last) husband/partner at times when he NO . . . . . . . . . . . . . . . . . . . . . . . . . 2 1212was not already beating or physically hurting you?
1210 CHECK 603:
RESPONDENT IS RESPONDENT ISNOT A WIDOW A WIDOW 1212
1211 In the last 12 months, how often have you done this OFTEN 1to your husband/partner: often, only sometimes, SOMETIMES . . . . . . . . . . . . . . . . . 2or not at all? NOT AT ALL 3
1212 (Does/Did) your husband/partner drink alcohol? YES . . . . . . . . . . . . . . . . . . . . . . . . . 1NO . . . . . . . . . . . . . . . . . . . . . . . . . 2 1214
1213 How often (does/did) he get drunk: often, only sometimes, OFTEN 1or never? SOMETIMES . . . . . . . . . . . . . . . . . 2
NEVER . . . . . . . . . . . . . . . . . . . . . . 3
. . . . . . . . . . . . . . . . . . .
. . . . . . . . . . . . . . . . . . . . . .
. . . . . . . . . . . . . . . . . . . . . .
. . . . . . . . . .
95
(Does/did) your (last) husband/partner ever do
. . . . . . . . . .
any of the following things to you:
You had cuts, bruises or aches?
| 367Appendix E

NO. QUESTIONS AND FILTERS CODING CATEGORIES SKIP
1214 CHECK 601 AND 602:
EVER MARRIED/LIVED NEVER MARRIED/ NEVERWITH A MAN LIVED WITH A MAN
From the time you were 15 From the time you were 15 YES . . . . . . . . . . . . . . . . . . . . . . . . . 1years old has anyone other years old has anyone ever hit, NO . . . . . . . . . . . . . . . . . . . . . . . . . 2than your (current/last) slapped, kicked, or done REFUSED TO ANSWER/husband/partner hit, slapped, anything else to hurt you NO ANSWER . . . . . . . . . . . . . . . . . 3 1217kicked, or done anything else physically?to hurt you physically?
1215 Who has hurt you in this way? MOTHER/STEP-MOTHER . . . . . . . . AFATHER/STEP-FATHER . . . . . . . . BSISTER/BROTHER . . . . . . . . . . . . . C
Anyone else? DAUGHTER/SON . . . . . . . . . . . . . DOTHER RELATIVE . . . . . . . . . . . . . EFORMER HUSBAND/ LIVE-IN PARTNER . . . . . . . . . . . . . F
CURRENT BOYFRIEND . . . . . . . . . GRECORD ALL MENTIONED. FORMER BOYFRIEND H
MOTHER-IN-LAW . . . . . . . . . . . . . IFATHER-IN-LAW . . . . . . . . . . . . . . . JOTHER IN-LAW . . . . . . . . . . . . . . . KTEACHER . . . . . . . . . . . . . . . . . . . LEMPLOYER/SOMEONE AT WORK . . MPOLICE/MILITARY . . . . . . . . . . . . . N
OTHER X
1216 In the last 12 months, how often have you been hit, OFTEN . . . . . . . . . . . . . . . . . . . . . . 1slapped, kicked, or physically hurt by this/these person(s): SOMETIMES . . . . . . . . . . . . . . . . . 2often, only sometimes, or not at all? NOT AT ALL . . . . . . . . . . . . . . . . . . 3
1217 CHECK 201, 226, AND 229:
EVER BEEN PREGNANT NEVER BEEN
(YES ON 201 PREGNANTOR 226 OR 229) 1220
1218 Has any one ever hit, slapped, kicked, or done anything else to YES . . . . . . . . . . . . . . . . . . . . . . . . . 1hurt you physically while you were pregnant? NO . . . . . . . . . . . . . . . . . . . . . . . . . 2 1220
1219 Who has done any of these things to physically hurt you while CURRENT HUSBAND/you were pregnant? LIVE-IN PARTNER . . . . . . . . . . . . . A
MOTHER/STEP-MOTHER . . . . . . . . BFATHER/STEP-FATHER . . . . . . . . CSISTER/BROTHER . . . . . . . . . . . . . D
Anyone else? DAUGHTER/SON . . . . . . . . . . . . . EOTHER RELATIVE . . . . . . . . . . . . . FFORMER HUSBAND/ LIVE-IN PARTNER . . . . . . . . . . . . . G
RECORD ALL MENTIONED. CURRENT BOYFRIEND . . . . . . . . . HFORMER BOYFRIEND . . . . . . . . . IMOTHER-IN-LAW . . . . . . . . . . . . . JFATHER-IN-LAW . . . . . . . . . . . . . . . KOTHER IN-LAW . . . . . . . . . . . . . . . LTEACHER . . . . . . . . . . . . . . . . . . . MEMPLOYER/SOMEONE AT WORK . . NPOLICE/MILITARY . . . . . . . . . . . . . O
OTHER X
1220 CHECK 618: EVER HAD SEX?
HAS EVER NEVER HAD SEX HAD SEX 1225
1221 WANTED TO 1FORCED TO 2REFUSED TO ANSWER/
NO RESPONSE . . . . . . . . . . . . . 3
. . . . . . . . .
The first time you had sexual intercourse, would you say that you had it because you wanted to, or because you were forced to have it against your will?
. . . . . . . . . . . . . . . . .
. . . . . . . . . . . . . . . . .
(SPECIFY)
(SPECIFY)
368 | Appendix E

NO. QUESTIONS AND FILTERS CODING CATEGORIES SKIP
1222 CHECK 601 AND 602:
EVER MARRIED/LIVED NEVER MARRIED/ NEVERWITH A MAN LIVED WITH A MAN
In the last 12 months, has In the last 12 months YES . . . . . . . . . . . . . . . . . . . . . . . . . 1anyone other than your has anyone forced you NO . . . . . . . . . . . . . . . . . . . . . . . . . 2(current/last) husband/ to have sexual intercourse REFUSED TO ANSWER/ partner forced you to have against your will? NO ANSWER 3sexual intercourse againstyour will?
1223 CHECK 1221 AND 1222:
1221 ='1' OR '3' OTHERAND 1222 ='2' OR '3' 1226
1224 CHECK 1205(h) and 1205(i):
1205(h) IS NOT '1' OTHERAND 1205(i) IS NOT '1' 1228
1225 YES . . . . . . . . . . . . . . . . . . . . . . . . . 1NO . . . . . . . . . . . . . . . . . . . . . . . . . 2REFUSED TO ANSWER/
NO ANSWER . . . . . . . . . . . . . . . 3 1228
1226 How old were you the first first time you were forced tohave sexual intercourse or perform any other sexual acts? AGE IN COMPLETED YEARS
DON'T KNOW . . . . . . . . . . . . . . . . . 98
1227 Who was the person who was forcing you at that time? CURRENT HUSBAND/ LIVE-IN PARTNER . . . . . . . . . . . . . 01
FORMER HUSBAND/ LIVE-IN PARTNER . . . . . . . . . . . . . 02
CURRENT/FORMER BOYFRIEND . . 03FATHER . . . . . . . . . . . . . . . . . . . . . . 04STEP-FATHER . . . . . . . . . . . . . . . 05OTHER RELATIVE . . . . . . . . . . . 06IN-LAW 07OWN FRIEND/ACQUAINTANCE . . 08FAMILY FRIEND . . . . . . . . . . . . . . . . . 09TEACHER . . . . . . . . . . . . . . . . . . . . . . 10EMPLOYER/SOMEONE AT WORK . 11POLICE/MILITARY . . . . . . . . . . . . . 12PRIEST/RELIGIOUS LEADER 13STRANGER . . . . . . . . . . . . . . . . . . . 14
OTHER 96
(SPECIFY)1228 CHECK 1205A (a-i), 1214, 1218, 1221, 1222 AND 1225:
AT LEAST ONE 'YES' NOT A SINGLE 'YES'OR 1221=2 AND 1221 IS 1231A
NOT EQUAL TO 2
1229 Thinking about what you yourself have experienced among the different things we have been talking about, have you YES . . . . . . . . . . . . . . . . . . . . . . . . . 1ever tried to seek help to stop (the/these) person(s) from NO . . . . . . . . . . . . . . . . . . . . . . . . . 2 1231doing this to you again?
1230 From whom have you sought help? OWN FAMILY AHUSBAND/LIVE-IN PARTNER'S FAMILY . . . . . . . . . . . . . . . . . . . . . . B
Anyone else? CURRENT/LAST/LATEHUSBAND/LIVE-IN PARTNER . . C
RECORD ALL MENTIONED. CURRENT/FORMER BOYFRIEND . . DFRIEND ENEIGHBOR F 1231ARELIGIOUS LEADER GDOCTOR/MEDICAL PERSONNEL . . HPOLICE ILAWYER JSOCIAL SERVICE ORGANIZATION . K
OTHER X
. . . . . . . . . . . . . . . . . . .
. . . . . . . . . . . . . . . . . . . . . .
. . . . . . . . . . . . . . . . . . . . . .
. . . . . . . . . . . . .
(SPECIFY)
. . .
. . . . . . . . . . . . . . . . . . . . . .
. . . . . .
. . . . . . . . . . . . . . . . . . . . . .
. . . . . . . . . . . . . . . . .
. . . . . . . . . . . . . . . . .
At any time in your life, as a child or as an adult, has anyone ever forced you in any way to have sexual intercourse or perform any other sexual acts?
| 369Appendix E

NO. QUESTIONS AND FILTERS CODING CATEGORIES SKIP
1231 Have you ever told any one else about this? YES . . . . . . . . . . . . . . . . . . . . . . . . . 1NO . . . . . . . . . . . . . . . . . . . . . . . . . 2
1231A If you need help or have a problem, is there someone from your family who you can depend on to: YES NO DK
a) give you shelter for a few nights if you need it? SHELTER 1 2 8b) give you financial support if you need it? ECONOMIC SUPPORT 1 2 8
1231B Do you believe that a man cannot control his sexual YES . . . . . . . . . . . . . . . . . . . . . . 1behaviour? NO . . . . . . . . . . . . . . . . . 2
DON'T KNOW . . . . . . . . . . . . . . . . . . 8
1231C Do you think marital rape is allowable? YES . . . . . . . . . . . . . . . . . . . . . . 1NO . . . . . . . . . . . . . . . . . 2DON'T KNOW . . . . . . . . . . . . . . . . . . 8
1232 As far as you know, did your father ever beat your mother? YES . . . . . . . . . . . . . . . . . . . . . . . . . 1NO . . . . . . . . . . . . . . . . . . . . . . . . . 2DON'T KNOW 8
THANK THE RESPONDENT FOR HER COOPERATION AND REASSURE HER ABOUT THE CONFIDENTIALITY OF HERANSWERS. FILL OUT THE QUESTIONS BELOW WITH REFERENCE TO THE DOMESTIC VIOLENCE MODULE ONLY.
1233 DID YOU HAVE TO INTERRUPT THE YES YES, MOREINTERVIEW BECAUSE SOME ADULT WAS ONCE THAN ONCETRYING TO LISTEN, OR CAME INTO THE HUSBAND . . . . . . . . . . . . . . . . 1 2 3ROOM, OR INTERFERED IN ANY OTHER OTHER MALE ADULT . . . . 1 2 3WAY? FEMALE ADULT . . . . . . . . 1 2 3
1234 INTERVIEWER'S COMMENTS / EXPLANATION FOR NOT COMPLETING THE DOMESTIC VIOLENCE MODULE
1235 RECORD THE TIME.HOURS . . . . . . . . . . . . . . . . . . . . . . . . .
MINUTES . . . . . . . . . . . . . . . . . . . . . . . . .
NO
. . . . . . . . . . . . . . . . .
370 | Appendix E

INTERVIEWER'S OBSERVATIONS
TO BE FILLED IN AFTER COMPLETING INTERVIEW
COMMENTS ABOUT RESPONDENT:
COMMENTS ON SPECIFIC QUESTIONS:
ANY OTHER COMMENTS:
SUPERVISOR'S OBSERVATIONS
NAME OF SUPERVISOR: DATE:
EDITOR'S OBSERVATIONS
NAME OF EDITOR: DATE:
| 371Appendix E
INSTRUCTIONS: 2 04 APR 01 2ONLY ONE CODE SHOULD APPEAR IN ANY BOX. 0 03 MAR 02 0ALL MONTHS SHOULD BE FILLED IN. 1 02 FEB 03 1
0 01 JAN 04 0
12 DEC 0511 NOV 0610 OCT 07
INFORMATION TO BE CODED FOR EACH COLUMN 09 SEP 082 08 AUG 09 2
BIRTHS, PREGNANCIES, CONTRACEPTIVE USE ** 0 07 JUL 10 0B BIRTHS 0 06 JUN 11 0P PREGNANCIES 9 05 MAY 12 9T TERMINATIONS 04 APR 13
03 MAR 140 NO METHOD 02 FEB 151 FEMALE STERILIZATION 01 JAN 162 MALE STERILIZATION3 PILL 12 DEC 174 IUD 11 NOV 185 INJECTABLES 10 OCT 196 IMPLANTS 09 SEP 207 CONDOM 2 08 AUG 21 28 FEMALE CONDOM 0 07 JUL 22 09 DIAPHRAGM 0 06 JUN 23 0J FOAM OR JELLY 8 05 MAY 24 8K LACTATIONAL AMENORRHEA METHOD 04 APR 25L RHYTHM METHOD 03 MAR 26M STANDARD DAYS METHOD 02 FEB 27N WITHDRAWAL 01 JAN 28X OTHER
(SPECIFY) 12 DEC 2911 NOV 3010 OCT 3109 SEP 32
2 08 AUG 33 20 07 JUL 34 00 06 JUN 35 07 05 MAY 36 7
04 APR 3703 MAR 3802 FEB 3901 JAN 40
12 DEC 4111 NOV 4210 OCT 4309 SEP 44
2 08 AUG 45 20 07 JUL 46 00 06 JUN 47 06 05 MAY 48 6
04 APR 4903 MAR 5002 FEB 5101 JAN 52
12 DEC 5311 NOV 5410 OCT 5509 SEP 56
2 08 AUG 57 20 07 JUL 58 00 06 JUN 59 05 05 MAY 60 5
04 APR 6103 MAR 6202 FEB 6301 JAN 64
12 DEC 6511 NOV 6610 OCT 6709 SEP 68
2 08 AUG 69 20 07 JUL 70 00 06 JUN 71 04 05 MAY 72 4
04 APR 7303 MAR 7402 FEB 7501 JAN 76
372 | Appendix E

20 July 2009TIMOR-LESTE DEMOGRAPHIC AND HEALTH SURVEY (TLDHS)
MAN'S QUESTIONNAIRE
IDENTIFICATION
NAME AND CODE OF DISTRICT
NEW SUCO NAME AND NUMBER
CLUSTER NUMBER . . . . . . . . . . . . . . . . . . . . . . . . . . . . . . . . . . . . . . . . . . . . . . . . . . . . . . . . . . . . . . .
LOCATION ID NUMBER . . . . . . . . . . . . . . . . . . . . . . . . . . . . . . . . . . . . . . . . . . . . . . . . . . . .
URBAN/RURAL . . . . . . . . . . . . . . . . . . . . . . . . . . . . . . . . . . . . . . . . . . . . . . . . . . . . . . . . . . . . . . . (URBAN=1, RURAL=2)
NAME OF HOUSEHOLD HEAD
NAME AND LINE NUMBER OF MAN
INTERVIEWER VISITS
FINAL VISIT
DATE DAY
MONTH
YEARINTERVIEWER'SNAME INT. NUMBER
RESULT* RESULT
NEXT VISIT: DATETOTAL NUMBER
TIME OF VISITS
*RESULT CODES:1 COMPLETED 4 REFUSED2 NOT AT HOME 5 PARTLY COMPLETED 7 OTHER3 POSTPONED 6 INCAPACITATED (SPECIFY)
LANGUAGE OF QUESTIONNAIRE
LANGUAGE OF INTERVIEW
NATIVE LANGUAGE OF RESPONDENT
TRANSLATOR USED (YES=1; NO=2)
LANGUAGE CODES: TETUM=1; BAHASA=2; PORTUGESE=3; OTHER=4
SUPERVISOR FIELD EDITOR
NAME NAME
DATE DATE
NATIONAL STATISTICS DIRECTORATE (NSD) AND MINISTRY OF HEALTH
EDITOROFFICE KEYED BY
1 2 3
| 373Appendix E

SECTION 1. RESPONDENT'S BACKGROUND
INTRODUCTION AND CONSENT
INFORMED CONSENT
Hello. My name is _______________________________________ and I am working with NATIONAL STATISTICS DIRECTORATE.We are conducting a national survey that asks men and women about various health issues. We would very much appreciate your participation in this survey. This information will help the government to plan health services. The surveyusually takes about 20 minutes to complete. Whatever information you provide will be kept strictly confidential and will not be shared with anyone other than members of our survey team.
Participation in this survey is voluntary, and if we should come to any question you don't want to answer, just let me know andI will go on to the next question; or you can stop the interview at any time. However, we hope that you will participate in this survey since your views are important.
At this time, do you want to ask me anything about the survey?May I begin the interview now?
Signature of interviewer: Date:
RESPONDENT AGREES TO BE INTERVIEWED . . . . . 1 RESPONDENT DOES NOT AGREE TO BE INTERVIEWED . . . 2 END
NO. QUESTIONS AND FILTERS CODING CATEGORIES SKIP
101 RECORD THE TIME.HOUR . . . . . . . . . . . . . . . . . . . .
MINUTES . . . . . . . . . . . . . . . . .
102 How long have you been living continuously in (NAME OFCURRENT PLACE OF RESIDENCE)? YEARS . . . . . . . . . . . . . . . . . .
IF LESS THAN ONE YEAR, RECORD '00' YEARS. ALWAYS . . . . . . . . . . . . . . . . . . . . . . 95VISITOR . . . . . . . . . . . . . . . . . . . . . . 96 106
103 Just before you moved here, did you live in a city, in a town, or in CITY . . . . . . . . . . . . . . . . . . . . . . . . . . . 1the countryside? TOWN . . . . . . . . . . . . . . . . . . . . . . . . . . . 2
COUNTRYSIDE . . . . . . . . . . . . . . . . . . 3
106 In what month and year were you born?MONTH . . . . . . . . . . . . . . . . . .
DON'T KNOW MONTH . . . . . . . . . . . . 98
YEAR . . . . . . . . . . . .
DON'T KNOW YEAR . . . . . . . . . . . . 9998
107 How old were you at your last birthday?AGE IN COMPLETED YEARS
COMPARE AND CORRECT 106 AND/OR 107 IF INCONSISTENT.
108 Have you ever attended school? YES . . . . . . . . . . . . . . . . . . . . . . . . . . . . . 1NO . . . . . . . . . . . . . . . . . . . . . . . . . . . . . 2 112
109 What is the highest level of school you attended: PRIMARY . . . . . . . . . . . . . . . . . . . . . . 1primary, pre-secondary, secondary or higher? PRE-SECONDARY . . . . . . . . . . . . . . 2
SECONDARY . . . . . . . . . . . . . . . . . . . . 3HIGHER . . . . . . . . . . . . . . . . . . . . . . . . 4
110 What is the highest (grade) you completed at thatlevel? GRADE . . . . . . . . . . . . . . . . . .
374 | Appendix E

NO. QUESTIONS AND FILTERS CODING CATEGORIES SKIP
111 CHECK 109:
PRIMARY PRE-SECONDARYOR HIGHER 115
112 Now I would like you to read this sentence to me. CANNOT READ AT ALL . . . . . . . . . . . . 1ABLE TO READ ONLY PARTS OF
SHOW CARD TO RESPONDENT. SENTENCE . . . . . . . . . . . . . . . . . . . . 2ABLE TO READ WHOLE SENTENCE. . 3
IF RESPONDENT CANNOT READ WHOLE SENTENCE, PROBE: NO CARD WITH REQUIREDCan you read any part of the sentence to me? LANGUAGE 4
(SPECIFY LANGUAGE)BLIND/VISUALLY IMPAIRED . . . . . . . 5
113 Have you ever participated in a literacy program or any otherprogram that involves learning to read or write (not including YES . . . . . . . . . . . . . . . . . . . . . . . . . . . . . 1primary school)? NO . . . . . . . . . . . . . . . . . . . . . . . . . . . . . 2
114 CHECK 112:
CODE '2', '3' CODE '1' OR '5'OR '4' CIRCLED 116
CIRCLED
115 Do you read a newspaper or magazine almost every day, at least ALMOST EVERY DAY . . . . . . . . . . . . . . 1once a week, less than once a week or not at all? AT LEAST ONCE A WEEK . . . . . . . . . . 2
LESS THAN ONCE A WEEK . . . . . . . . 3NOT AT ALL . . . . . . . . . . . . . . . . . . . . 4
116 Do you listen to the radio almost every day, at least once a week, ALMOST EVERY DAY . . . . . . . . . . . . . . 1less than once a week or not at all? AT LEAST ONCE A WEEK . . . . . . . . . . 2
LESS THAN ONCE A WEEK . . . . . . . . 3NOT AT ALL . . . . . . . . . . . . . . . . . . . . 4
117 Do you watch television almost every day, at least once a week, ALMOST EVERY DAY . . . . . . . . . . . . . . 1less than once a week or not at all? AT LEAST ONCE A WEEK . . . . . . . . . . 2
LESS THAN ONCE A WEEK . . . . . . . . 3NOT AT ALL . . . . . . . . . . . . . . . . . . . . 4
118 What is your religion? ROMAN CATHOLIC . . . . . . . . . . . . . . 1MUSLIM . . . . . . . . . . . . . . . . . . . . . . 2PROTESTANT . . . . . . . . . . . . . . . . . . 3HINDU . . . . . . . . . . . . . . . . . . . . . . . . 4
OTHER 6(SPECIFY)
| 375Appendix E

SECTION 2. REPRODUCTION
NO. QUESTIONS AND FILTERS CODING CATEGORIES SKIP
201 Now I would like to ask about any children you have had duringyour life. I am interested in all of the children that are biologicallyyours, even if they are not legally yours or do not have your YES . . . . . . . . . . . . . . . . . . . . . . . . . . . . . . . . . 1last name. NO . . . . . . . . . . . . . . . . . . . . . . . . . . . . . . . . . 2Have you ever fathered any children with any woman? DON'T KNOW . . . . . . . . . . . . . . . . . . . . . . . 8 206
202 Do you have any sons or daughters that you have fathered who YES . . . . . . . . . . . . . . . . . . . . . . . . . . . . . . . . . 1are now living with you? NO . . . . . . . . . . . . . . . . . . . . . . . . . . . . . . . . . 2 204
203 How many sons live with you?SONS AT HOME . . . . . . . . . . . . .
And how many daughters live with you?DAUGHTERS AT HOME . . . . . .
IF NONE, RECORD ‘00'.
204 Do you have any sons or daughters that you have fathered who are YES . . . . . . . . . . . . . . . . . . . . . . . . . . . . . . . . . 1alive but do not live with you? NO . . . . . . . . . . . . . . . . . . . . . . . . . . . . . . . . . 2 206
205 How many sons are alive but do not live with you?SONS ELSEWHERE . . . . . . . . .
And how many daughters are alive but do not live with you?DAUGHTERS ELSEWHERE . . . .
IF NONE, RECORD ‘00'.
206 Have you ever fathered a son or a daughter who was born alivebut later died?
YES . . . . . . . . . . . . . . . . . . . . . . . . . . . . . . . . . 1IF NO, PROBE: Any baby who cried or showed signs of life but NO . . . . . . . . . . . . . . . . . . . . . . . . . . . . . . . . . 2
did not survive? DON'T KNOW . . . . . . . . . . . . . . . . . . . . . . . 8 208
207 How many boys have died?BOYS DEAD . . . . . . . . . . . . . . . .
And how many girls have died?GIRLS DEAD . . . . . . . . . . . . . . . .
IF NONE, RECORD ‘00'.
208 SUM ANSWERS TO 203, 205, AND 207, AND ENTER TOTAL.TOTAL CHILDREN . . . . . . . . . . .
IF NONE, RECORD ‘00'.
209 CHECK 208:
HAS HAD HAS HAD 212MORE THAN ONLY
ONE CHILD ONE CHILD HAS NOT HADANY CHILDREN 301
210 Did all of the children you have fathered have the same YES . . . . . . . . . . . . . . . . . . . . . . . . . . . . . . . . . 1 212biological mother? NO . . . . . . . . . . . . . . . . . . . . . . . . . . . . . . . . . 2
211 In all, how many women have you fathered children with?NUMBER OF WOMEN . . . . . .
212 How old were you when your (first) child was born?AGE IN YEARS . . . . . . . . . . . . .
213 CHECK 203 AND 205:
AT LEAST ONE NO LIVINGLIVING CHILD CHILDREN
214 How many years old is your (youngest) child?AGE IN YEARS . . . . . . . . . . . . .
215 CHECK 214:
(YOUNGEST) CHILD OTHERIS AGE 0-3 YEARS
301
301
376 | Appendix E
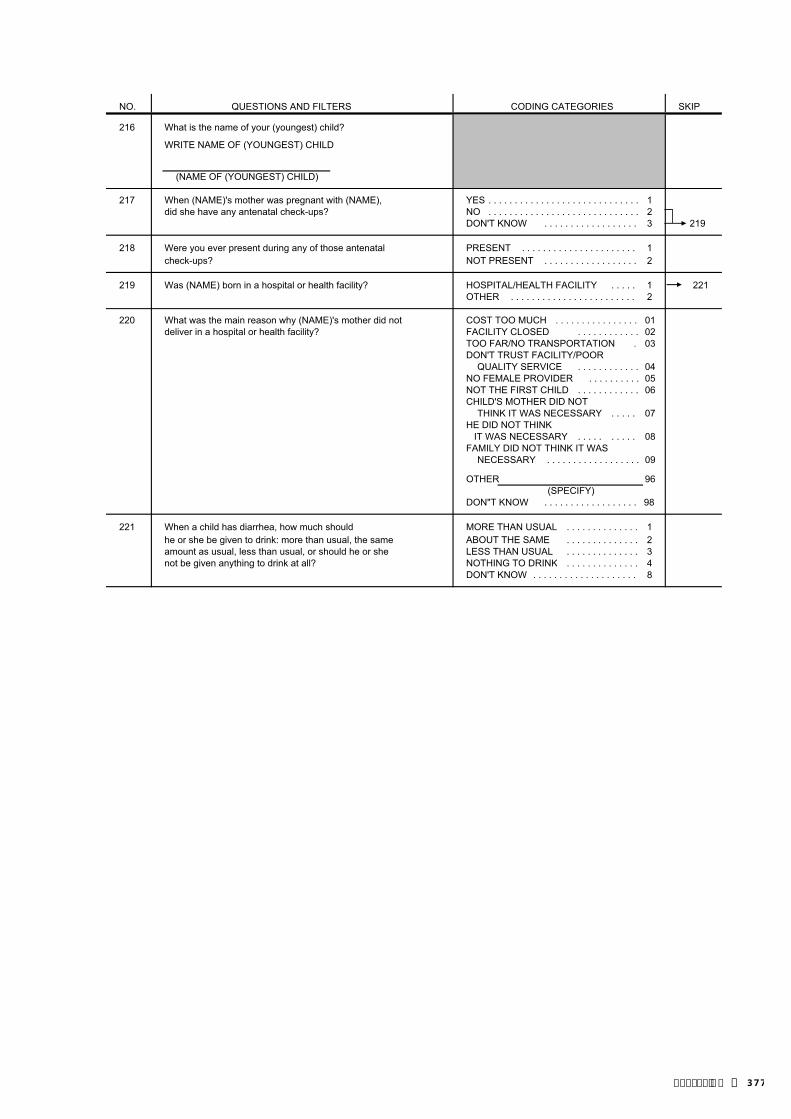
NO. QUESTIONS AND FILTERS CODING CATEGORIES SKIP
216 What is the name of your (youngest) child?
WRITE NAME OF (YOUNGEST) CHILD
(NAME OF (YOUNGEST) CHILD)
217 When (NAME)'s mother was pregnant with (NAME), YES . . . . . . . . . . . . . . . . . . . . . . . . . . . . . 1did she have any antenatal check-ups? NO . . . . . . . . . . . . . . . . . . . . . . . . . . . . . 2
DON'T KNOW . . . . . . . . . . . . . . . . . . 3 219
218 Were you ever present during any of those antenatal PRESENT . . . . . . . . . . . . . . . . . . . . . . 1check-ups? NOT PRESENT . . . . . . . . . . . . . . . . . . 2
219 Was (NAME) born in a hospital or health facility? HOSPITAL/HEALTH FACILITY . . . . . 1 221OTHER . . . . . . . . . . . . . . . . . . . . . . . . 2
220 What was the main reason why (NAME)'s mother did not COST TOO MUCH . . . . . . . . . . . . . . . . 01deliver in a hospital or health facility? FACILITY CLOSED . . . . . . . . . . . . 02
TOO FAR/NO TRANSPORTATION . 03DON'T TRUST FACILITY/POOR
QUALITY SERVICE . . . . . . . . . . . . 04NO FEMALE PROVIDER . . . . . . . . . . 05NOT THE FIRST CHILD . . . . . . . . . . . . 06CHILD'S MOTHER DID NOT THINK IT WAS NECESSARY . . . . . 07HE DID NOT THINK IT WAS NECESSARY . . . . . . . . . . 08FAMILY DID NOT THINK IT WAS
NECESSARY . . . . . . . . . . . . . . . . . . 09
OTHER 96(SPECIFY)
DON"T KNOW . . . . . . . . . . . . . . . . . . 98
221 When a child has diarrhea, how much should MORE THAN USUAL . . . . . . . . . . . . . . 1he or she be given to drink: more than usual, the same ABOUT THE SAME . . . . . . . . . . . . . . 2amount as usual, less than usual, or should he or she LESS THAN USUAL . . . . . . . . . . . . . . 3not be given anything to drink at all? NOTHING TO DRINK . . . . . . . . . . . . . . 4
DON'T KNOW . . . . . . . . . . . . . . . . . . . . 8
| 377Appendix E

SECTION 3. CONTRACEPTION
301 Now I would like to talk about family planning - the various ways or methods that 302 Have you ever useda couple can use to delay or avoid a pregnancy. (METHOD)?
Which ways or methods have you heard about?FOR METHODS NOT MENTIONED SPONTANEOUSLY, ASK:Have you ever heard of (METHOD)?
CIRCLE CODE 1 IN 301 FOR EACH METHOD MENTIONED SPONTANEOUSLY.THEN PROCEED DOWN COLUMN 301, READING THE NAME AND DESCRIPTION OFEACH METHOD NOT MENTIONED SPONTANEOUSLY. CIRCLE CODE 1 IF METHODIS RECOGNIZED, AND CODE 2 IF NOT RECOGNIZED. THEN, FOR METHODS 02, 07, 10, AND 11, ASK 302 IF 301 HAS CODE 1 CIRCLED.
01 FEMALE STERILIZATION Women can have an operation YES . . . . . . . . . . . 1to avoid having any more children. NO . . . . . . . . . . . 2
02 MALE STERILIZATION Men can have an operation to avoid YES . . . . . . . . . . . 1 Have you ever had an operationhaving any more children. NO . . . . . . . . . . . 2 to avoid having any more
children?YES . . . . . . . . . . . . . . . 1NO . . . . . . . . . . . . . . . 2
03 PILL Women can take a pill every day to avoid becoming YES . . . . . . . . . . . 1pregnant. NO . . . . . . . . . . . 2
04 IUD Women can have a loop or coil placed inside them by YES . . . . . . . . . . . 1a doctor or a nurse. NO . . . . . . . . . . . 2
05 INJECTABLES Women can have an injection by a health YES . . . . . . . . . . . 1provider that stops them from becoming pregnant NO . . . . . . . . . . . 2for one or more months.
06 IMPLANTS Women can have several small rods placed in YES . . . . . . . . . . . 1their upper arm by a doctor or nurse which can prevent NO . . . . . . . . . . . 2pregnancy for one or more years.
07 CONDOM Men can put a rubber sheath on their penis YES . . . . . . . . . . . 1 YES . . . . . . . . . . . . . . . 1before sexual ntercourse. NO . . . . . . . . . . . 2
NO . . . . . . . . . . . . . . . 2
08 FEMALE CONDOM Women can place a sheath in their YES . . . . . . . . . . . 1vagina before sexual intercourse. NO . . . . . . . . . . . 2
09 LACTATIONAL AMENORRHEA METHOD (LAM) YES . . . . . . . . . . . 1NO . . . . . . . . . . . 2
10 RHYTHM METHOD Every month that a woman is sexually YES . . . . . . . . . . . 1 YES . . . . . . . . . . . . . . . 1active she can avoid pregnancy by not having sexual NO . . . . . . . . . . . 2intercourse on the days of the month she is most likely to NO . . . . . . . . . . . . . . . 2get pregnant.
11 STANDARD DAYS METHOD YES . . . . . . . . . . . . . 1 YES . . . . . . . . . . . . . . . . . . 1NO . . . . . . . . . . . . . 2
NO . . . . . . . . . . . . . . . . . . 2
12 WITHDRAWAL Men can be careful and pull out before YES . . . . . . . . . . . 1 YES . . . . . . . . . . . . . . . 1climax. NO . . . . . . . . . . . 2
NO . . . . . . . . . . . . . . . 2
13 EMERGENCY CONTRACEPTION As an emergency YES . . . . . . . . . . . 1measure after sexual intercourse, women can take special NO . . . . . . . . . . . 2pills at any time within 5 days to prevent pregnancy.
14 Have you heard of any other ways or methods that women YES . . . . . . . . . . . 1or men can use to avoid pregnancy?
(SPECIFY)
(SPECIFY)NO . . . . . . . . . . . 2
378 | Appendix E

NO. QUESTIONS AND FILTERS CODING CATEGORIES SKIP
303 In the last few months have you: YES NOHeard about family planning on the radio? RADIO . . . . . . . . . . . . . . . . . . . 1 2Seen about family planning on the television? TELEVISION . . . . . . . . . . . . . 1 2Read about family planning in a newspaper or magazine? NEWSPAPER OR MAGAZINE 1 2Seen about family planning in poster/billboard? POSTER/BILLBOARD . . . . . . 1 2Seen Street drama? STREET DRAMA . . . . . . . . . 1 2Watched film ? FILM . . . . . . . . . . . . . . . . . 1 2
304 In the last few months, have you discussed the practice of family YES . . . . . . . . . . . . . . . . . . . . . . . . . . . 1planning with a health worker or health professional? NO . . . . . . . . . . . . . . . . . . . . . . . . . . . 2
305 Now I would like to ask you about a woman's risk of pregnancy.
From one menstrual period to the next, are there certain days YES . . . . . . . . . . . . . . . . . . . . . . . . . . . 1when a woman is more likely to become pregnant if she has NO . . . . . . . . . . . . . . . . . . . . . . . . . . . 2sexual relations? DON'T KNOW . . . . . . . . . . . . . . . . . . . 8 307
306 Is this time just before her period begins, during her period, right JUST BEFORE HER after her period has ended, or halfway between two periods? PERIOD BEGINS . . . . . . . . . . . . . 1
DURING HER PERIOD . . . . . . . . . . . 2RIGHT AFTER HER
PERIOD HAS ENDED . . . . . . . . . . . 3HALFWAY BETWEEN
TWO PERIODS . . . . . . . . . . . . . 4OTHER 6
(SPECIFY)DON'T KNOW . . . . . . . . . . . . . . . . . . . 8
307 Do you think that a woman who is breastfeeding her baby can YES . . . . . . . . . . . . . . . . . . . . . . . . . . . 1become pregnant? NO . . . . . . . . . . . . . . . . . . . . . . . . . . . 2
DEPENDS . . . . . . . . . . . . . . . . . . . . . 3DON'T KNOW . . . . . . . . . . . . . . . . . . . 8
308 I will now read you some statements about contraception. Please DIS-tell me if you agree or disagree with each one. AGREE AGREE DK
a) Contraception is women's business and a man should not CONTRACEPTIONhave to worry about it. WOMAN'S BUSINESS . 1 2 8
b) Women who use contraception may become promiscuous. WOMAN MAY BECOME PROMISCUOUS . . . 1 2 8
309 CHECK 301 (07) KNOWS MALE CONDOM
YES NO
310 Do you know of a place where a person can get condoms? YES . . . . . . . . . . . . . . . . . . . . . . . . . . . 1NO . . . . . . . . . . . . . . . . . . . . . . . . . . . 2 401
401
| 379Appendix E
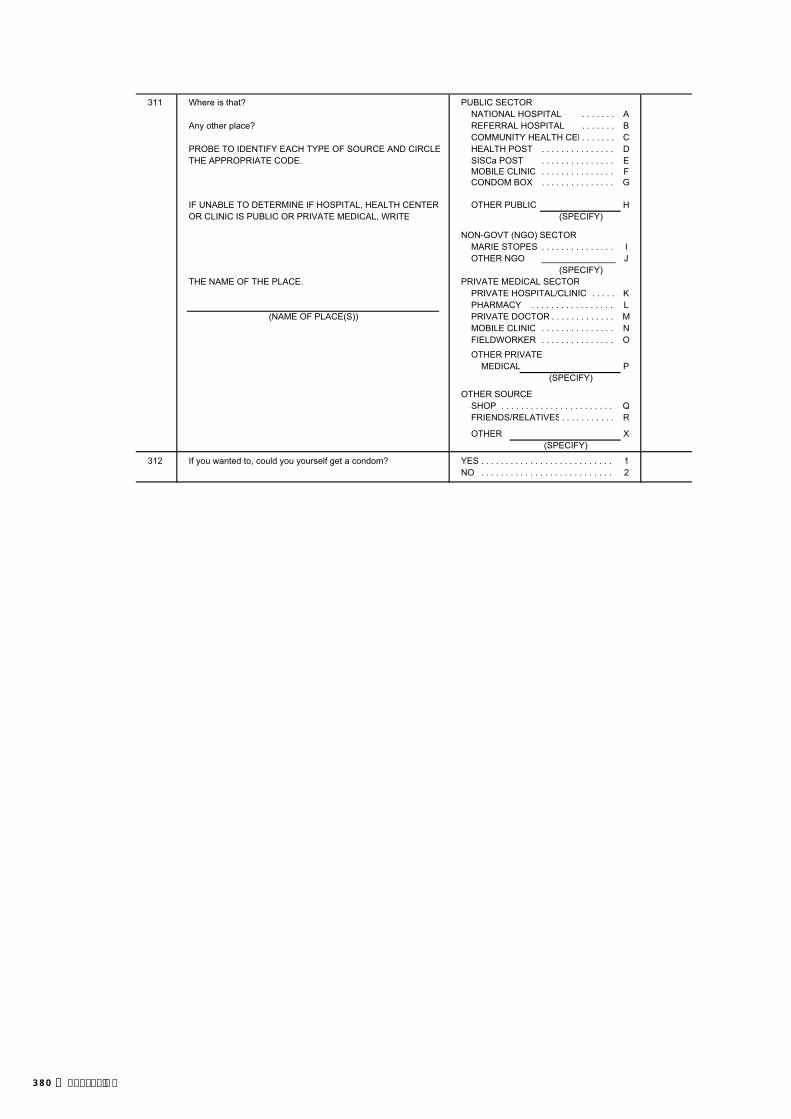
311 Where is that? PUBLIC SECTORNATIONAL HOSPITAL . . . . . . . A
Any other place? REFERRAL HOSPITAL . . . . . . . BCOMMUNITY HEALTH CEN. . . . . . . C
PROBE TO IDENTIFY EACH TYPE OF SOURCE AND CIRCLE HEALTH POST . . . . . . . . . . . . . . . DTHE APPROPRIATE CODE. SISCa POST . . . . . . . . . . . . . . . E
MOBILE CLINIC . . . . . . . . . . . . . . . FCONDOM BOX . . . . . . . . . . . . . . . G
IF UNABLE TO DETERMINE IF HOSPITAL, HEALTH CENTER OTHER PUBLIC HOR CLINIC IS PUBLIC OR PRIVATE MEDICAL, WRITE (SPECIFY)
NON-GOVT (NGO) SECTORMARIE STOPES . . . . . . . . . . . . . . . IOTHER NGO _______________ J
(SPECIFY)THE NAME OF THE PLACE. PRIVATE MEDICAL SECTOR
PRIVATE HOSPITAL/CLINIC . . . . . KPHARMACY . . . . . . . . . . . . . . . . . L
(NAME OF PLACE(S)) PRIVATE DOCTOR . . . . . . . . . . . . . MMOBILE CLINIC . . . . . . . . . . . . . . . NFIELDWORKER . . . . . . . . . . . . . . . O
OTHER PRIVATEMEDICAL P
(SPECIFY)
OTHER SOURCESHOP . . . . . . . . . . . . . . . . . . . . . . . QFRIENDS/RELATIVES. . . . . . . . . . . R
OTHER X(SPECIFY)
312 If you wanted to, could you yourself get a condom? YES . . . . . . . . . . . . . . . . . . . . . . . . . . . 1NO . . . . . . . . . . . . . . . . . . . . . . . . . . . 2
380 | Appendix E

SECTION 4. MARRIAGE AND SEXUAL ACTIVITY
NO. QUESTIONS AND FILTERS CODING CATEGORIES SKIP
401 Are you currently married or living together with a woman as if YES, CURRENTLY MARRIED 1married? YES, LIVING WITH A WOMAN . . . . . 2 404
NO, NOT IN UNION . . . . . . . . . . . . . . . . 3
402 Have you ever been married or lived together with a woman as if YES, FORMERLY MARRIED . . . . . . . . 1married? YES, LIVED WITH A WOMAN . . . . . . . . 2
NO . . . . . . . . . . . . . . . . . . . . . . . . . . . . . 3 413
403 What is your marital status now: are you widowed, WIDOWED . . . . . . . . . . . . . . . . . . . . . . 1divorced, or separated? DIVORCED 2 410
SEPARATED 3
404 Is your wife/partner living with you now or is she staying LIVING WITH HIM . . . . . . . . . . . . . . . . 1elsewhere? STAYING ELSEWHERE . . . . . . . . . . . . 2
405 Do you have more than one wife or woman you live with as if YES . . . . . . . . . . . . . . . . . . . . . . . . . . . . . 1married? NO . . . . . . . . . . . . . . . . . . . . . . . . . . . . . 2 407
406 Altogether, how many wives do you have or other partners TOTAL NUMBER OF WIVES do you live with as if married? AND LIVE-IN PARTNERS . . .
407 CHECK 405: 408 How old was
ONE WIFE/ MORE THAN (NAME)PARTNER ONE WIFE/ on her
PARTNER last Please tell me the name of Please tell me the name of birthday?your wife (the woman you each of your current wivesare living with as if married). (and/or of each woman you
are living with as if married). LINENAME NUMBER AGE
RECORD THE NAME AND THE LINE NUMBER FROMTHE HOUSEHOLD QUESTIONNAIRE FOR EACH WIFE AND LIVE-IN PARTNER. ____________
IF A WOMAN IS NOT LISTED IN THE HOUSEHOLD,RECORD '00'.
____________ASK 408 FOR EACH PERSON.
____________
____________
409 CHECK 407:MORE THAN
ONE WIFE/ ONE WIFE/PARTNER PARTNER 411A
410 Have you been married or lived with a woman only once or ONLY ONCE . . . . . . . . . . . . . . . . . . . . 1more than once? MORE THAN ONCE . . . . . . . . . . . . . . 2 411A
411 In what month and year did you start living with your (wife/ partner)?
MONTH . . . . . . . . . . . . . . . . 411A Now I would like to ask a question about your first wife/partner.
In what month and year did you start living with your first wife/ DON'T KNOW MONTH . . . . . . . . . . 98partner?
YEAR . . . . . . . . . . . .
DON'T KNOW YEAR . . . . . . . . . . . . 9998
412 How old were you when you first started living with her?AGE . . . . . . . . . . . . . . . . . . . .
413
. . . . . . . .
. . . . . . . . . . . . . . . . . . . . . . . . . . . . . . . . . . . . . . . . . .
| 381Appendix E

NO. QUESTIONS AND FILTERS CODING CATEGORIES SKIP
413 CHECK FOR THE PRESENCE OF OTHERS.
BEFORE CONTINUING, MAKE EVERY EFFORT TO ENSURE PRIVACY.
414 Now I would like to ask you some questions about sexual NEVER HAD SEXUALactivity in order to gain a better understanding of some INTERCOURSE . . . . . . . . . . . . . . 00important life issues.
How old were you when you had sexual intercourse for the AGE IN YEARS . . . . . . . . . . . . very first time?
FIRST TIME WHEN STARTEDLIVING WITH (FIRST)WIFE/PARTNER . . . . . . . . . . . . . . . . 95 417
415 CHECK 107: AGE AGE15-24 25-49 501
416 Do you intend to wait until you get married to have sexual YES . . . . . . . . . . . . . . . . . . . . . . . . . . . . . 1intercourse for the first time? NO . . . . . . . . . . . . . . . . . . . . . . . . . . . . . 2 501
DON'T KNOW/UNSURE . . . . . . . . . . . . 8.
417 CHECK 107: AGE AGE15-24 25-49 419
418 The first time you had sexual intercourse, was a condom YES . . . . . . . . . . . . . . . . . . . . . . . . . . . . . 1used? NO . . . . . . . . . . . . . . . . . . . . . . . . . . . . . 2
DON'T KNOW/DON'T REMEMBER . . . 8
419 When was the last time you had sexual intercourse?DAYS AGO . . . . . . . . . . . . 1
IF LESS THAN 12 MONTHS, ANSWER MUST BE RECORDEDIN DAYS, WEEKS OR MONTHS. WEEKS AGO . . . . . . . . . . 2IF 12 MONTHS (ONE YEAR) OR MORE, ANSWER MUST BERECORDED IN YEARS. MONTHS AGO . . . . . . . . 3
YEARS AGO . . . . . . . . . . 4 435
417
382 | Appendix E

420 Now I would like to ask you some questions about your recent sexual activity. Let me assure you again that your answers are completely confidential and will not be told to anyone. If we should come to anyquestion that you don't want to answer, just let me know and we will go to the next question. SKIP TO 422
421 When was the last time you hadsexual intercourse with this person? DAYS . 1 DAYS . 1
WEEKS 2 WEEKS 2
MONTHS 3 MONTHS 3
422 The last time you had sexual YES . . . . . . . . . . . . . . 1 YES . . . . . . . . . . . . . . 1 YES . . . . . . . . . . . . . . 1intercourse (with this second/third NO . . . . . . . . . . . . . . 2 NO . . . . . . . . . . . . . . 2 NO . . . . . . . . . . . . . . 2person), was a condom used? (SKIP TO 424) (SKIP TO 424) (SKIP TO 424)
423 Was a condom used every YES . . . . . . . . . . . . . . 1 YES . . . . . . . . . . . . . . 1 YES . . . . . . . . . . . . . . 1time you had sexual intercourse NO . . . . . . . . . . . . . . 2 NO . . . . . . . . . . . . . . 2 NO . . . . . . . . . . . . . . 2with this person in the last12 months?
424 What was your relationship to WIFE . . . . . . . . . . . 1 WIFE . . . . . . . . . . . 1 WIFE . . . . . . . . . . . 1this (second/third) person with (SKIP TO 426) (SKIP TO 426) (SKIP TO 426)whom you had sexual intercourse? LIVE-IN PARTNER . . . . 2 LIVE-IN PARTNER . . . . 2 LIVE-IN PARTNER . . . . 2
GIRLFRIEND NOT GIRLFRIEND NOT GIRLFRIEND NOT IF GIRLFRIEND: LIVING WITH LIVING WITH LIVING WITH Were you living together as if RESPONDENT . . . . 3 RESPONDENT . . . . 3 RESPONDENT . . . . 3
married? CASUAL CASUAL CASUAL IF YES, CIRCLE '2'. ACQUAINTANCE . . . 4 ACQUAINTANCE . . . 4 ACQUAINTANCE . . . 4IF NO, CIRCLE '3'. SEX WORKER. . . . . . . . . 5 SEX WORKER. . . . . . . . . 5 SEX WORKER. . . . . . . . . 5
OTHER _____________ 6 OTHER _____________ 6 OTHER _____________ 6(SPECIFY) (SPECIFY) (SPECIFY)
425 For how long (have you had/didyou have) a sexual relationship DAYS . 1 DAYS . 1 DAYS . 1with this (second/third) person?IF ONLY HAD SEXUAL MONTHS 2 MONTHS 2 MONTHS 2RELATIONS WITH THIS PERSONONCE, RECORD '01' DAYS. YEARS 3 YEARS 3 YEARS 3
426 The last time you had sexual YES . . . . . . . . . . . . . . 1 YES . . . . . . . . . . . . . . 1 YES . . . . . . . . . . . . . . 1intercourse with this (second/third) NO . . . . . . . . . . . . . . 2 NO . . . . . . . . . . . . . . 2 NO . . . . . . . . . . . . . . 2person, did you or this person (SKIP TO 428) (SKIP TO 428) (SKIP TO 429)drink alcohol?
427 Were you or your partner drunk RESPONDENT ONLY 1 RESPONDENT ONLY 1 RESPONDENT ONLY 1at that time? PARTNER ONLY . . . 2 PARTNER ONLY . . . 2 PARTNER ONLY . . . 2
RESPONDENT AND RESPONDENT AND RESPONDENT ANDIF YES: Who was drunk? PARTNER BOTH . 3 PARTNER BOTH . 3 PARTNER BOTH . 3
NEITHER . . . . . . . . . . 4 NEITHER . . . . . . . . . . 4 NEITHER . . . . . . . . . . 4
428 Apart from [this person/these two YES . . . . . . . . . . . . . . 1 YES . . . . . . . . . . . . . . 1people], have you had sexual (GO BACK TO 421 (GO BACK TO 421intercourse with any other IN NEXT COLUMN) IN NEXT COLUMN)person in the last 12 months? NO . . . . . . . . . . . . . . 2 NO . . . . . . . . . . . . . . 2
(SKIP TO 430) (SKIP TO 430)
429 In total, with how many different NUMBER OFpeople have you had sexual PARTNERSintercourse in the last 12 months? LAST 12
. . . IF NON-NUMERIC ANSWER, PROBE TO GET AN ESTIMATE. DON'T KNOW . . .
IF NUMBER OF PARTNERS IS GREATER THAN 95, WRITE '95.'
MONTHS
98
THIRD-TO-LASTSEXUAL PARTNER
LASTSEXUAL PARTNER
SECOND-TO-LASTSEXUAL PARTNER
| 383Appendix E

NO. QUESTIONS AND FILTERS CODING CATEGORIES SKIP
430 CHECK 424 (ALL COLUMNS):
AT LEAST ONE PARTNER NO PARTNERSIS SEX WORKER ARE SEX WORKERS 432
431 CHECK 424 AND 422 (ALL COLUMNS): CONDOM USED WITH 434EVERY SEX WORKER
OTHER
432 In the last 12 months, did you pay anyone in exchange YES . . . . . . . . . . . . . . . . . . . . . . . . . . . . . 1for having sexual intercourse? NO . . . . . . . . . . . . . . . . . . . . . . . . . . . . . 2 435
433 The last time you paid someone in exchange for having YES . . . . . . . . . . . . . . . . . . . . . . . . . . . . . 1sexual intercourse, was a condom used? NO . . . . . . . . . . . . . . . . . . . . . . . . . . . . . 2 435
434 Was a condom used during sexual intercourse YES . . . . . . . . . . . . . . . . . . . . . . . . . . . . . 1every time you paid someone in exchange for having sexual NO . . . . . . . . . . . . . . . . . . . . . . . . . . . . . 2intercourse in the last 12 months? DK . . . . . . . . . . . . . . . . . . . . . . . . . . . . . 8
435 In total, with how many different people have you had sexual NUMBER OF PARTNERSintercourse in your lifetime? IN LIFETIME . . . . . . . . . . . . . .
IF NON-NUMERIC ANSWER, PROBE TO GET AN ESTIMATE. DON'T KNOW . . . . . . . . . . . . . . . . . .
IF NUMBER OF PARTNERS IS GREATER THAN 95,WRITE '95.'
436 CHECK 422, MOST RECENT PARTNER (FIRST COLUMN):
NOTASKED 442
CONDOM NO CONDOMUSED USED 442
439 How many condoms did you get the last time? NUMBER OFCONDOMS . . . . . . . . . .
DON'T KNOW . . . . . . . . . . . . . . . . . . 998
440 The last time you obtained the condoms, how muchdid you pay in total, including the cost of the condom(s) COST . . . . . . . . . . . . . . . . and any consultation you may have had?
FREE . . . . . . . . . . . . . . . . . . . . . . . . 995DON'T KNOW . . . . . . . . . . . . . . . . . . 998
98
435
384 | Appendix E

NO. QUESTIONS AND FILTERS CODING CATEGORIES SKIP
441 From where did you obtain the condom the last time? PUBLIC SECTORNATIONAL HOSPITAL . . . . . . . . . . . . 11
PROBE TO IDENTIFY TYPE OF SOURCE AND CIRCLE REFERRAL HOSPITAL . . . . . . . . 12THE APPROPRIATE CODE. COMMUNITY HEALTH CEN . . . . . . . . 13
HEALTH POST . . . . . . . . . . . . . . . . 14IF UNABLE TO DETERMINE IF HOSPITAL, HEALTH CENTER SISCa POST . . . . . . . . . . . . . . . . 15OR CLINIC IS PUBLIC OR PRIVATE MEDICAL, WRITE MOBILE CLINIC . . . . . . . . . . . . . . . . 17
CONDOM BOX 18
THE NAME OF THE PLACE. OTHER PUBLIC 16(SPECIFY)
NON-GOVT (NGO) SECTORMARIE STOPES . . . . . . . . . . . . . . 21
(NAME OF PLACE) OTHER NGO ______________ 26(SPECIFY)
PRIVATE MEDICAL SECTORPRIVATE HOSPITAL/CLINIC . . . . . 31PHARMACY . . . . . . . . . . . . . . . . . . 32PRIVATE DOCTOR ........................ 33MOBILE CLINIC . . . . . . . . . . . . . . . . 34FIELDWORKER . . . . . . . . . . . . . . . . 35OTHER PRIVATE
MEDICAL 36(SPECIFY)
OTHER SOURCESHOP . . . . . . . . . . . . . . . . . . . . . . . . 41FRIENDS/RELATIVES . . . . . . . . . . . . 42
OTHER 96(SPECIFY)
442 CHECK 302 (02): RESPONDENT EVER STERILIZED
NO YES 501
443 The last time you had sex did you or your partner use any YES . . . . . . . . . . . . . . . . . . . . . . . . . . . . . 1method (other than a condom) to avoid or prevent a NO . . . . . . . . . . . . . . . . . . . . . . . . . . . . . 2pregnancy? DON'T KNOW . . . . . . . . . . . . . . . . . . 8 501
444 What method did you or your partner use? FEMALE STERILIZATION . . . . . . . . . . APILL . . . . . . . . . . . . . . . . . . . . . . . . . . . . . B
PROBE: IUD . . . . . . . . . . . . . . . . . . . . . . . . . . . . . CDid you or your partner use any other method to prevent INJECTABLES . . . . . . . . . . . . . . . . . . Dpregnancy? IMPLANTS . . . . . . . . . . . . . . . . . . . . . . E
FEMALE CONDOM . . . . . . . . . . . . . . FRECORD ALL MENTIONED. DIAPHRAGM . . . . . . . . . . . . . . . . . . . . G
FOAM/JELLY . . . . . . . . . . . . . . . . . . . . HLAM IRHYTHM METHOD . . . . . . . . . . . . . . . . JSTANDARD DAYS METHOD KWITHDRAWAL . . . . . . . . . . . . . . . . . . L
OTHER ______________________ X(SPECIFY)
. . . . . . . . . . . . . . . . . . . . . . . . . . . . .
| 385Appendix E

SECTION 5. FERTILITY PREFERENCES
NO. QUESTIONS AND FILTERS CODING CATEGORIES SKIP
501 CHECK 407:ONE OR MORE QUESTION
WIVES/PARTNERS NOT ASKED 508
502 CHECK 302:
MAN NOT MANSTERILIZED STERILIZED 508
503 (Is your wife (partner)/Are any of your wives (partners)) YES . . . . . . . . . . . . . . . . . . . . . . . . . . . . . 1currently pregnant? NO . . . . . . . . . . . . . . . . . . . . . . . . . . . . . 2
DON'T KNOW . . . . . . . . . . . . . . . . . . . . 8
504 CHECK 503:
NO WIFE/PARTNER WIFE(WIVES)/PREGNANT OR PARTNER(S)
DON'T KNOW PREGNANTHAVE (A/ANOTHER) CHILD . . . . . . . . 1
Now I have some questions Now I have some questions NO MORE/NONE . . . . . . . . . . . . . . . . 2about the future. about the future. COUPLE INFECUND . . . . . . . . . . . 3Would you like to have After the child(ren) you and your WIFE (WIVES)/PARTNER(S) 508(a/another) child, or would you (wife(wives)/partner(s)) are STERILIZED . . 4prefer not to have any (more) expecting now, would you UNDECIDED/DON'T KNOW . . . . . . . . 8children? like to have another child, or
would you prefer not to have any more children?
505 CHECK 407:ONE WIFE/ MORE THANPARTNER ONE WIFE/ 507
PARTNER
506 CHECK 503:WIFE/PARTNER WIFE/PARTNER MONTHS . . . . . . . . . . . . . . 1
NOT PREGNANT PREGNANTOR DON'T KNOW YEARS . . . . . . . . . . . . . . 2
How long would you like to wait After the birth of the child you SOON/NOW . . . . . . . . . . . . . . . . . . 993 508from now before the birth of are expecting now, how long COUPLE INFECUND . . . . . . . . . . 994(a/another) child? would you like to wait before
the birth of another child? OTHER ______________________ 996(SPECIFY)
DON'T KNOW . . . . . . . . . . . . . . . . . . 998
507 How long would you like to wait from now before the birth of(a/another) child? MONTHS . . . . . . . . . . . . . . 1
YEARS . . . . . . . . . . . . . . 2
SOON/NOW . . . . . . . . . . . . . . . . . . 993
HE/ALL HIS WIVES/PARTNERS ARE INFECUND . . . . . . . . . . . . . . 994
OTHER ______________________ 996(SPECIFY)
DON'T KNOW . . . . . . . . . . . . . . . . . . 998
. . . . . . . . . . . . . . . .
386 | Appendix E

NO. QUESTIONS AND FILTERS CODING CATEGORIES SKIP
508 CHECK 203 AND 205:
HAS LIVING CHILDREN NO LIVING CHILDRENNONE . . . . . . . . . . . . . . . . . . . . . . . . . 00 601
If you could go back to the time If you could choose exactly theyou did not have any children number of children to have in NUMBER . . . . . . . . . . . . . . . . . . and could choose exactly the your whole life, how many number of children to have in would that be?your whole life, how many OTHER ______________________ 96 601would that be? (SPECIFY)
PROBE FOR A NUMERIC RESPONSE.
509 How many of these children would you like to be boys, how many BOYS GIRLS EITHERwould you like to be girls and for how many would the sex notmatter? NUMBER
OTHER ______________________ 96(SPECIFY)
| 387Appendix E
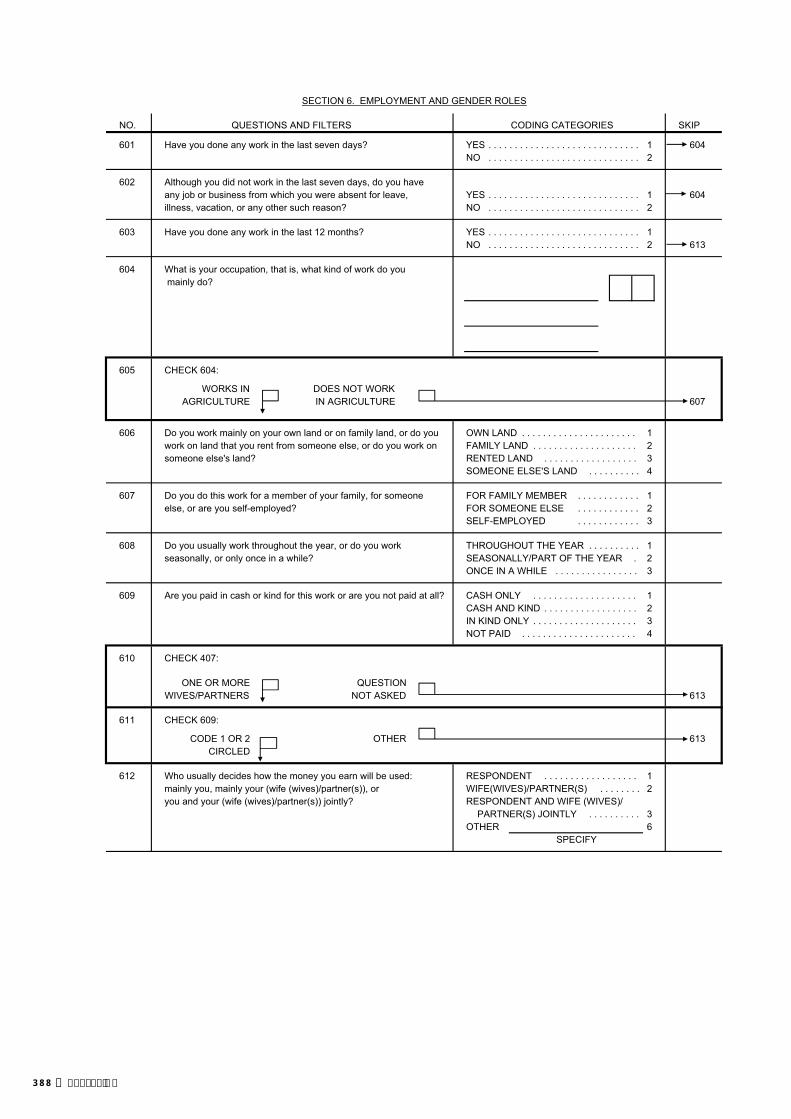
SECTION 6. EMPLOYMENT AND GENDER ROLES
NO. QUESTIONS AND FILTERS CODING CATEGORIES SKIP
601 Have you done any work in the last seven days? YES . . . . . . . . . . . . . . . . . . . . . . . . . . . . . 1 604NO . . . . . . . . . . . . . . . . . . . . . . . . . . . . . 2
602 Although you did not work in the last seven days, do you haveany job or business from which you were absent for leave, YES . . . . . . . . . . . . . . . . . . . . . . . . . . . . . 1 604illness, vacation, or any other such reason? NO . . . . . . . . . . . . . . . . . . . . . . . . . . . . . 2
603 Have you done any work in the last 12 months? YES . . . . . . . . . . . . . . . . . . . . . . . . . . . . . 1NO . . . . . . . . . . . . . . . . . . . . . . . . . . . . . 2 613
604 What is your occupation, that is, what kind of work do you mainly do?
605 CHECK 604:
WORKS IN DOES NOT WORKAGRICULTURE IN AGRICULTURE 607
606 Do you work mainly on your own land or on family land, or do you OWN LAND . . . . . . . . . . . . . . . . . . . . . . 1work on land that you rent from someone else, or do you work on FAMILY LAND . . . . . . . . . . . . . . . . . . . . 2someone else's land? RENTED LAND . . . . . . . . . . . . . . . . . . 3
SOMEONE ELSE'S LAND . . . . . . . . . . 4
607 Do you do this work for a member of your family, for someone FOR FAMILY MEMBER . . . . . . . . . . . . 1else, or are you self-employed? FOR SOMEONE ELSE . . . . . . . . . . . . 2
SELF-EMPLOYED . . . . . . . . . . . . 3
608 Do you usually work throughout the year, or do you work THROUGHOUT THE YEAR . . . . . . . . . . 1seasonally, or only once in a while? SEASONALLY/PART OF THE YEAR . 2
ONCE IN A WHILE . . . . . . . . . . . . . . . . 3
609 Are you paid in cash or kind for this work or are you not paid at all? CASH ONLY . . . . . . . . . . . . . . . . . . . . 1CASH AND KIND . . . . . . . . . . . . . . . . . . 2IN KIND ONLY . . . . . . . . . . . . . . . . . . . . 3NOT PAID . . . . . . . . . . . . . . . . . . . . . . 4
610 CHECK 407:
ONE OR MORE QUESTIONWIVES/PARTNERS NOT ASKED 613
611 CHECK 609:
CODE 1 OR 2 OTHER 613CIRCLED
612 Who usually decides how the money you earn will be used: RESPONDENT . . . . . . . . . . . . . . . . . . 1mainly you, mainly your (wife (wives)/partner(s)), or WIFE(WIVES)/PARTNER(S) . . . . . . . . 2you and your (wife (wives)/partner(s)) jointly? RESPONDENT AND WIFE (WIVES)/
PARTNER(S) JOINTLY . . . . . . . . . . 3OTHER 6
SPECIFY
388 | Appendix E

NO. QUESTIONS AND FILTERS CODING CATEGORIES SKIP
613 In a couple, who do you think should have the greater say ineach of the following decisions: the husband, the wife or both HUS- BOTHequally: BAND WIFE EQUALLY DEPENDS
a) making major household purchases? a) 1 2 3 8
b) making purchases for daily household needs? b) 1 2 3 8
c) deciding about visits to the wife's family or relatives? c) 1 2 3 8
d) deciding what to do with the money she earns for her d) 1 2 3 8work?
e) deciding how many children to have? e) 1 2 3 8
614 I will now read you some statements about pregnancy. DIS-Please tell me if you agree or disagree with them. AGREE AGREE DK
a) Childbearing is a woman's concern and there is no CHILDBEARINGneed for the father to get involved. WOMAN'S CONCERN 1 2 8
b) It is crucial for the mother's and child's health that a DOCTOR/NURSE'S woman have assistance from a doctor or nurse at delivery. ASSISTANCE
CRUCIAL 1 2 8
615 Sometimes a husband is annoyed or angered by things that hiswife does. In your opinion, is a husband justified in hitting orbeating his wife in the following situations: YES NO DK
If she goes out without telling him? GOES OUT . . . . . . . . . . 1 2 8If she neglects the children? NEGL. CHILDREN . . . 1 2 8If she argues with him? ARGUES . . . . . . . . . . . . 1 2 8If she refuses to have sex with him? REFUSES SEX . . . . . 1 2 8If she burns the food? BURNS FOOD . . . . . . . . 1 2 8
616 Do you think that if a woman refuses to have sex with her husband when he wants her to, he has the right to…
YES NO DEPENDS
a) Get angry and reprimand her? a) 1 2 8
b) Refuse to give her money or other means of support? b) 1 2 8
c) Use force and have sex with her even if she doesn't c) 1 2 8want to?
d) Go ahead and have sex with another woman? d) 1 2 8
DON'TKNOW/
DON'TKNOW/
| 389Appendix E

SECTION 7. HIV/AIDS
NO. QUESTIONS AND FILTERS CODING CATEGORIES SKIP
701 Now I would like to talk about something else. YES . . . . . . . . . . . . . . . . . . . . . . . . . . . . . 1Have you ever heard of an illness called AIDS? NO . . . . . . . . . . . . . . . . . . . . . . . . . . . . . 2 715
702 Can people reduce their chances of getting the AIDS virus YES . . . . . . . . . . . . . . . . . . . . . . . . . . . . . 1by having just one uninfected sex partner who has NO . . . . . . . . . . . . . . . . . . . . . . . . . . . . . 2no other sex partners? DON'T KNOW . . . . . . . . . . . . . . . . . . . . 8
703 Can people get the AIDS virus from mosquito bites? YES . . . . . . . . . . . . . . . . . . . . . . . . . . . . . 1NO . . . . . . . . . . . . . . . . . . . . . . . . . . . . . 2DON'T KNOW . . . . . . . . . . . . . . . . . . . . 8
704 Can people reduce their chance of getting the AIDS virus by YES . . . . . . . . . . . . . . . . . . . . . . . . . . . . . 1using a condom every time they have sex? NO . . . . . . . . . . . . . . . . . . . . . . . . . . . . . 2
DON'T KNOW . . . . . . . . . . . . . . . . . . . . 8
705 Can people get the AIDS virus by sharing food with a person who YES . . . . . . . . . . . . . . . . . . . . . . . . . . . . . 1has AIDS? NO . . . . . . . . . . . . . . . . . . . . . . . . . . . . . 2
DON'T KNOW . . . . . . . . . . . . . . . . . . . . 8
706 Can people reduce their chance of getting the AIDS virus by YES . . . . . . . . . . . . . . . . . . . . . . . . . . . . . 1not having sexual intercourse at all? NO . . . . . . . . . . . . . . . . . . . . . . . . . . . . . 2
DON'T KNOW . . . . . . . . . . . . . . . . . . . . 8
707 Can people get the AIDS virus by sharing clothes with a person YES . . . . . . . . . . . . . . . . . . . . . . . . . . . . . 1who has AIDS virus? NO . . . . . . . . . . . . . . . . . . . . . . . . . . . . . 2
DON'T KNOW . . . . . . . . . . . . . . . . . . . . 8
708 Is it possible for a healthy-looking person to have the AIDS virus? YES . . . . . . . . . . . . . . . . . . . . . . . . . . . . . 1NO . . . . . . . . . . . . . . . . . . . . . . . . . . . . . 2DON'T KNOW . . . . . . . . . . . . . . . . . . . . 8
708A Can HIV/AIDS be cured? YES . . . . . . . . . . . . . . . . . . . . . . . . . . . . . 1NO . . . . . . . . . . . . . . . . . . . . . . . . . . . . . 2DON'T KNOW . . . . . . . . . . . . . . . . . . . . 8
709 Do you know of a place where people can go to get tested for YES . . . . . . . . . . . . . . . . . . . . . . . . . . . . . 1the AIDS virus? NO . . . . . . . . . . . . . . . . . . . . . . . . . . . . . 2 711
710 Where is that? PUBLIC SECTORNATIONAL HOSPITAL A
Any other place? REFERRAL HOSPITAL BVCT CENTER . . . C
PROBE TO IDENTIFY EACH TYPE OF SOURCE AND CIRCLE COMMUNITY HEALTH CEN DTHE APPROPRIATE CODE(S). HEALTH POST E
SISCa POST FIF UNABLE TO DETERMINE IF HOSPITAL, HEALTH CENTER MOBILE CLINIC GVCT CENTER, OR CLINIC IS PUBLIC OR PRIVATE MEDICAL, WRITE THE NAME OF THE PLACE. OTHER PUBLIC H
(SPECIFY)
NON-GOVT(NGO) SECTORMARIE STOPES IOTHER NGOS J
(SPECIFY)
PRIVATE MEDICAL SECTOR(NAME OF PLACE) PRIVATE HOSPITAL/CLINIC/
PRIVATE DOCTOR KVCT CENTER . . . LPHARMACY MMOBILE CLINIC NFIELDWORKER OOTHER PRIVATE
MEDICAL P(SPECIFY)
OTHER X(SPECIFY)
. . . . . .
. . . . . . . . . . . . . .
. . . . . . . . . . . . . .
. . . . . .
. . . . . .
. . . . . . . . . .
. . . . . . . . . . . . . .
. . . . . . . . . . . . . .
. . . . . . . . . . . . . .
. . . . . . . . . . . . . . . . . . . . . . . . . . . . . . . . .
390 | Appendix E

NO. QUESTIONS AND FILTERS CODING CATEGORIES SKIP
711 Would you buy fresh vegetables from a shopkeeper or vendor YES . . . . . . . . . . . . . . . . . . . . . . . . . . . . . 1if you knew that this person had the AIDS virus? NO . . . . . . . . . . . . . . . . . . . . . . . . . . . . . 2
DON'T KNOW . . . . . . . . . . . . . . . . . . . . 8
712 If a member of your family got infected with the AIDS virus, YES, REMAIN A SECRET 1would you want it to remain a secret or not? NO . . . . . . . . . . . . . . . . . . . . . . . . . . . . . 2
DK/NOT SURE/DEPENDS 8
713 If a member of your family became sick with AIDS, would YES . . . . . . . . . . . . . . . . . . . . . . . . . . . . . 1you be willing to care for her or him in your own household? NO . . . . . . . . . . . . . . . . . . . . . . . . . . . . . 2
DK/NOT SURE/DEPENDS . . . . . . . . . . 8
714 In your opinion, if a female teacher has the AIDS virus but SHOULD BE ALLOWED . . . . . . . . . . . . 1is not sick, should she be allowed to continue teaching SHOULD NOT BE ALLOWED . . . . . . . . 2in the school? DK/NOT SURE/DEPENDS . . . . . . . . . . 8
715 CHECK 701:
HEARD ABOUT NOT HEARDAIDS ABOUT AIDS
Apart from AIDS, have Have you heard about infections you heard about other that can be transmitted throughinfections that can be sexual contact? YES . . . . . . . . . . . . . . . . . . . . . . . . . . . . . 1transmitted through NO . . . . . . . . . . . . . . . . . . . . . . . . . . . . . 2sexual contact?
716 CHECK 414:HAS HAD SEXUAL HAS NOT HAD SEXUAL
INTERCOURSE INTERCOURSE 724
717 CHECK 715: HEARD ABOUT OTHER SEXUALLY TRANSMITTED INFECTIONS?
YES NO 719
718 Now I would like to ask you some questions about your health in YES . . . . . . . . . . . . . . . . . . . . . . . . . . . . . 1the last 12 months. During the last 12 months, have you had a NO . . . . . . . . . . . . . . . . . . . . . . . . . . . . . 2disease which you got through sexual contact? DON'T KNOW . . . . . . . . . . . . . . . . . . . . 8
719 Sometimes men experience an abnormal discharge YES . . . . . . . . . . . . . . . . . . . . . . . . . . . . . 1from their penis. NO . . . . . . . . . . . . . . . . . . . . . . . . . . . . . 2During the last 12 months, have you had an abnormal discharge DON'T KNOW . . . . . . . . . . . . . . . . . . . . 8from your penis?
. . . . . . . . . .
. . . . . . . . . .
| 391Appendix E

NO. QUESTIONS AND FILTERS CODING CATEGORIES SKIP
720 Sometimes men have a sore or ulcer near their penis. YES . . . . . . . . . . . . . . . . . . . . . . . . . . . . . 1During the last 12 months, have you had a sore or ulcer near NO . . . . . . . . . . . . . . . . . . . . . . . . . . . . . 2your penis? DON'T KNOW . . . . . . . . . . . . . . . . . . . . 8
721 CHECK 718, 719, AND 720:HAS HAD AN HAS NOT HAD AN
INFECTION INFECTION OR 724(ANY 'YES') DOES NOT KNOW
722 The last time you had (PROBLEM FROM 718/719/720), YES . . . . . . . . . . . . . . . . . . . . . . . . . . . . . 1did you seek any kind of advice or treatment? NO . . . . . . . . . . . . . . . . . . . . . . . . . . . . . 2 724
723 Where did you go? PUBLIC SECTORNATIONAL HOSPITAL . . . . . . . . A
Any other place? REFERRAL HOSPITAL . . . . . . . . BVCT CENTER . . . C
PROBE TO IDENTIFY EACH TYPE OF SOURCE AND CIRCLE COMMUNITY HEALTH CEN. . . . . . . . DTHE APPROPRIATE CODE(S). HEALTH POST . . . . . . . . . . . . . . . . E
SISCa POST . . . . . . . . . . . . . . . . FIF UNABLE TO DETERMINE IF HOSPITAL, HEALTH CENTER MOBILE CLINIC . . . . . . . . . . . . . . . . GVCT CENTER, OR CLINIC IS PUBLIC OR PRIVATE MEDICAL, WRITE THE NAME OF THE PLACE. OTHER PUBLIC H
(SPECIFY)
NON-GOVT(NGO) SECTORMARIE STOPES IOTHER NGOS J
(SPECIFY)
(NAME OF PLACE(S)) PRIVATE MEDICAL SECTORPRIVATE HOSPITAL/CLINIC/
PRIVATE DOCTOR KVCT CENTER . . . LPHARMACY . . . . . . . . . . . . . . . . . . MMOBILE CLINIC . . . . . . . . . . . . . . . . NFIELDWORKER . . . . . . . . . . . . . . . . OOTHER PRIVATE
MEDICAL P(SPECIFY)
OTHER SOURCESHOP . . . . . . . . . . . . . . . . . . . . . . . . . QOTHER X
(SPECIFY)
724 Husband and wives do not always agree in everything. YES . . . . . . . . . . . . . . . . . . . . . . . . . . . . . 1If a wife knows her husband has a disease that she can get NO . . . . . . . . . . . . . . . . . . . . . . . . . . . . . 2during sexual intercourse, is she justified in refusing to have DON'T KNOW . . . . . . . . . . . . . . . . . . . . 8sex with him?
725 Is a wife justified in refusing to have sex with her husband YES . . . . . . . . . . . . . . . . . . . . . . . . . . . . . 1when she is tired or not in the mood? NO . . . . . . . . . . . . . . . . . . . . . . . . . . . . . 2
DON'T KNOW . . . . . . . . . . . . . . . . . . . . 8
726 Is a wife justified in refusing to have sex with her husband YES . . . . . . . . . . . . . . . . . . . . . . . . . . . . . 1when she knows her husband has sex with other women? NO . . . . . . . . . . . . . . . . . . . . . . . . . . . . . 2
DON'T KNOW . . . . . . . . . . . . . . . . . . . . 8
. . . . . . . . . . . .
. . . . . . . . . . . . . .
392 | Appendix E

SECTION 8. OTHER HEALTH ISSUES
NO. QUESTIONS AND FILTERS CODING CATEGORIES SKIP
801 Have you ever heard of an illness called tuberculosis or TB? YES . . . . . . . . . . . . . . . . . . . . . . . . . . . 1NO . . . . . . . . . . . . . . . . . . . . . . . . . . . 2 805
802 How does tuberculosis spread from one person to another? THROUGH THE AIR WHENCOUGHING OR SNEEZING . . . . . A
PROBE: Any other ways? THROUGH SHARING UTENSILS ... BTHROUGH TOUCHING A PERSON
RECORD ALL MENTIONED. WITH TB . . . . . . . . . . . . . . . . . . . . . CTHROUGH FOOD . . . . . . . . . . . . . . . DTHROUGH SEXUAL CONTACT ....... ETHROUGH MOSQUITO BITES . . . . . F
OTHER X(SPECIFY)
DON’T KNOW . . . . . . . . . . . . . . . . . . . Z
803 Can tuberculosis be cured? YES . . . . . . . . . . . . . . . . . . . . . . . . . . . 1NO . . . . . . . . . . . . . . . . . . . . . . . . . . . 2DON'T KNOW . . . . . . . . . . . . . . . . . . . 8
804 If a member of your family got tuberculosis, would you want it to YES, REMAIN A SECRET . . . . . . . . . 1remain a secret or not? NO . . . . . . . . . . . . . . . . . . . . . . . . . . . 2
DON'T KNOW/NOT SURE/DEPENDS . . . . . . . . . . . . . . . . . . . 8
805 Some men are circumcised. Are you circumcised? YES . . . . . . . . . . . . . . . . . . . . . . . . . . . 1NO . . . . . . . . . . . . . . . . . . . . . . . . . . . 2DON'T KNOW . . . . . . . . . . . . . . . . . . . 8
806 Now I would like to ask you some other questions relating to health matters. Have you had an injectionfor any reason in the last 12 months? NUMBER OF INJECTIONS ...
IF YES: How many injections have you had?
IF NUMBER OF INJECTIONS IS GREATER THAN 90, NONE . . . . . . . . . . . . . . . . . . . . . . . . . 00 810OR DAILY FOR 3 MONTHS OR MORE, RECORD '90'.
IF NON-NUMERIC ANSWER, PROBE TO GET AN ESTIMATE.
807 Among these injections, how many were administered by a doctor, a nurse, a pharmacist, a dentist, or any other NUMBER OF INJECTIONS . . . health worker?
IF NUMBER OF INJECTIONS IS GREATER THAN 90, OR DAILY FOR 3 MONTHS OR MORE, RECORD '90'. NONE . . . . . . . . . . . . . . . . . . . . . . . . . 00 810
IF NON-NUMERIC ANSWER, PROBE TO GET AN ESTIMATE.
808 The last time you had an injection given to you by a health worker, PUBLIC SECTORwhere did you go to get the injection? NATIONAL HOSPITAL . . . . . . . . . 11
REFERRAL HOSPITAL . . . . . . . 12COMMUNITY HEALTH CEN. . . . . . 13HEALTH POST . . . . . . . . . . . . . . 14
PROBE TO IDENTIFY THE TYPE OF SOURCE AND CIRCLE OTHER PUBLIC 16THE APPROPRIATE CODE. (SPECIFY)
PRIVATE MEDICAL SECTORIF UNABLE TO DETERMINE IF HOSPITAL, HEALTH CENTER PRIVATE HOSPITAL/CLINIC/OR CLINIC IS PUBLIC OR PRIVATE MEDICAL, WRITE PRIVATE DOCTOR . . . . . . . . . 21THE NAME OF THE PLACE. DENTAL CLINIC/OFFICE . . . . . . . 22
PHARMACY . . . . . . . . . . . . . . . . . 23OFFICE OR HOME OF NURSE/
HEALTH WORKER . . . . . . . . . . . 24(NAME OF PLACE) OTHER PRIVATE
MEDICAL 26(SPECIFY)
OTHER PLACEAT HOME . . . . . . . . . . . . . . . . . . . 31
OTHER 96(SPECIFY)
| 393Appendix E

NO. QUESTIONS AND FILTERS CODING CATEGORIES SKIP
809 Did the person who gave you that injection take the syringe and YES . . . . . . . . . . . . . . . . . . . . . . . . . . . 1needle from a new, unopened package? NO . . . . . . . . . . . . . . . . . . . . . . . . . . . 2
DON'T KNOW . . . . . . . . . . . . . . . . . . . 8
810 Do you currently smoke cigarettes? YES . . . . . . . . . . . . . . . . . . . . . . . . . . . 1NO . . . . . . . . . . . . . . . . . . . . . . . . . . . 2 812
811 In the last 24 hours, how many cigarettes did you smoke?CIGARETTES . . . . . . . . . . . . .
812 Do you currently smoke or use any other type of tobacco? YES . . . . . . . . . . . . . . . . . . . . . . . . . . . 1NO . . . . . . . . . . . . . . . . . . . . . . . . . . . 2 814
813 What (other) type of tobacco do you currently smoke or use? PIPE . . . . . . . . . . . . . . . . . . . . . . . . . ACHEWING TOBACCO . . . . . . . . . . . B
RECORD ALL MENTIONED. SNUFF . . . . . . . . . . . . . . . . . . . . . . . CROLLED TOBACCO . . . . . . . . . . . . . DOTHER X
(SPECIFY)
814 RECORD THE TIME.HOUR . . . . . . . . . . . . . . . . . . .
MINUTES . . . . . . . . . . . . . . .
394 | Appendix E

INTERVIEWER'S OBSERVATIONS
TO BE FILLED IN AFTER COMPLETING INTERVIEW
COMMENTS ABOUT RESPONDENT:
COMMENTS ON SPECIFIC QUESTIONS:
ANY OTHER COMMENTS:
SUPERVISOR'S OBSERVATIONS
NAME OF SUPERVISOR: DATE:
EDITOR'S OBSERVATIONS
NAME OF EDITOR: DATE:
| 395Appendix E