Embed Size (px)
Citation preview

DEMAND FOR HEALTH SERVICES
A. V. George “Health care system in Kerala : A case of primary health centres in Kozhikode district” Thesis. Department of Economics, Dr. John Matthai Centre, University of Calicut, 1999

Chapter 4
DEMAND FOR HEALTH SERVICES
This chapter provides an analysis of demand for health services in PHCs
and utilization of the health care facilities by beneficiaries and gives a brief
account of Governmental expenditure on PHCs. Broad issues on health
improvement are discussed and some definitional problems stated in the
beginning. The improvement in health standards directly increases human well-
being, reduces mortality and morbidity and augments the potential for economic
and social development . Income growth is not the sole goal of development,
but economic growth spurs improvements in wellbeing.
It may be said that on an average higher incomes lead to better health of
the population; the population is likely to avoid hunger and illiteracy. This may
be interpreted as income growth promoting human development. Public provision
of essential goods and services - clean drinking water, sanitation, health care,
elementary education leads to improved social outcomes. Here exist a relationship
between economic growth and life expectancy. The main channels by which
growth promotes human development in a typical developing country are through
its impact on income, poverty and public provisioning of health services.
Our theoretical framework - the health care utilization model depicting
various determinants that influence the utilization of health services and the
subsequent model dealing with the process of health care utilization analyses
factors influencing the health status of the people of a given community which
generate the need for health care. The need for health care plus economic factors
form an effective demand for health services. For the demand for health services
to exist the population must be aware of benefits of health care institutions. It is
the health consciousness of the people that plays the crucial role in the health
status of the region. It is pertinent to note that even with a high prevalence rate
and incidence rate Kerala shows low levels of duration of illness (Kumar 1993).
This should be attributed to the people's awareness about health facilities. In
1987 - 88,29.3 million were treated by the allopathic public health system. The
numbers who received treatment from the Ayurveda and homeopathic systems
were 16.7 and 9.5 million respectively. The ratio of the total number of persons
treated to the total population of the State thus works out almost to two. The
most important determinant of health services awareness is the level of education
or extent of literacy especially of the woman. Indicators of the health status of
as a whole show up with improvements in the physical quality of life of the two
groups - women and the rural population. Since women face grave risks during
pregnancy and childbirth and are able to observe early symptoms of disease

among children, an increase in their awareness would benefit them and their
children.
Table 4.1 - Literacy rates - 1981
Source: Occasional Paper No. l of 1987, Ofice of the
Registrar General of India p.21
India
Kerala
Table 4.1 clearly brings out the crucial advantage that Kerala enjoys in
the field of literacy in the case of females and rural population.
Total
Population
36.23
70.42
Urban Rural
Male
46.89
75-26
Total
57.4
76.1 1
Female
24.82
65.73
Female
17.96
64.25
Male
65.83
80.1
Total
29.65
69.1 1
Female
47.82
72.2
Male
40.79
74.13

There has been an increasing awareness in the health economics Iiterature
that the application of the conventional theory of demand to health and health
care is misleading. The economist's concept of demand is rooted in the notion
of what a person is able and willing to pay. Demand is seen to reflect both the
strength of the person's desire to receive the service, that is the value placed on it,
and the amount that will have to be sacrificed in order to do so. However, the
immediate relevance of this concept of "demand" may be far from clear in these
countries whose basic health services are provided fiee or at subsidised prices.
A community's demand for primary health care or potable water supply depends
on what that community is prepared to sacrifice in money, time, inconvenience
and incidental costs. Health care is a heterogenous commodity. Information on
the form of health care necessary for its investment effects is required to allow
the consumer to evaluate net utility and make rational choices.
4.1 Analysisofdernand
Results of the survey of households are presented. This study was based on
the primary data generated through household survey conducted at Mukkom
Community Health Centre, Cheruvadi Primary Health Centre and Pannikode
Subcentre area. The questionnaire pertained not only to health aspects but also
the socio-economic profile of the identified households and environmental as-
77

pects. Information on similar items, obtained flom different sources, was analysed
for similarities and differences. Self-administered questionnaires from health
workers and medical officers hrnished details about infrastructure facilities and
services rendered at health centres. This was compared with the information
collected personally from the health centres. This information was also com-
pared with details collected from household survey. The information collected
was of a qualitative nature which was then coded in to numbers by drawing up
certain codes basically inferred from information volunteered by informants.
The sample size was limited to 72 households. The sample was selected
according to the systematic random sampling in which the sample consisted of
the units numbered as
i, i+k, i+2k------- , i+(n- l ) k
Where i = l , k = 30 and n= 72
The schedule (Household survey) appended as A1 purpoted to obtain the
following information from identified households.
a) Demographic particulars which involved collecting information about
the composition of the family, income, level of education and occupation
particulars.
b) Environmental particulars which involved collecting information about
the type of house, water supply and sanitation facilities.
c) Details of illness of the population studied.
d) Details of the immunization status.
Demographic Particulars
Households were divided into socio-economic status (SES) groups.
Characteristics selected to reckon socio-economic status were income, educational
level and housing condition. The grouping of households and the selection of
characteristics were in line with the Anderson's health care utilisation model and
as per that model invidual determinants and system determinants affecting the
health service utilisation are probed in detail.
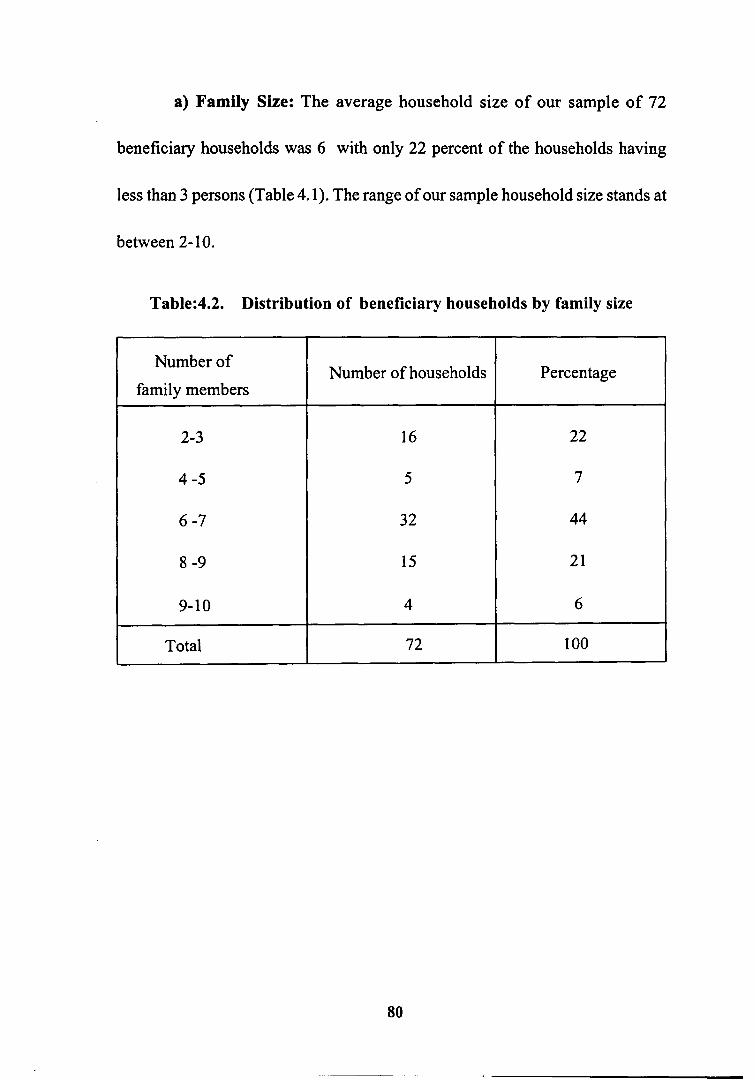
a) Family Size: The average household size of our sample of 72
beneficiary households was 6 with only 22 percent of the households having
less than 3 persons (Table 4.1). The range of our sample household size stands at
between 2- 10.
Table:4.2. Distribution of beneficiary households by family size
Number of
family members
2-3
4 -5
6 -7
8 -9
9-10
Total -
Number of households
16
5
3 2
15
4
72
Percentage
22
7
44
21
6
100

b) Income: Figures relating to income are those reported by informants.
This is not the best way of estimating income. Notwithstanding its imperfections,
figures are accepted on the presumption that the problem of underreporting bias
is evenly distributed across households. The rationale for selecting income is
that it may have an influence on health status because to be poor means to have
low purchasing power for buying goods and services including health services.
Households were ranked in to three categories viz low, middle and high.
Monthly income less than Rs 500
Monthly income Rs 50 1 - 1,500
Monthly income greater than Rs 1,501
Table: 4.3 Distribution of households by income
Percentage
43
38
19
100
SES category
Low (< Rs. 5001-)
Middle (Rs. 501-1500)
High (> Rs. 1501)
Total
Number of households
31
27
14
72

c) Level of education: Progress in education and especially female education
has contributed significantly towards the progress in health status of Kerala
(Kannan 1988; Bhat M and Irudaya Rajan, 1990). Therefore the categorisation is
as follows:
Low - At least one member of the household attended elementary school
and none having education above elementary level.
Middle - At least one member studied in the high school .
High - More than one member having education above high school.
The results are given in Table 4.4.
Tablc4.4. Distribution of households by level of education
Percentage
36
5 1
13
SES category
Low (elementary School)
Middle (high school)
High (college/polytechnic)
Number of persons
26
37
9

d.) Occupation: The most important occupational category among heads of
the sample households was casual labour. Casual labour included both skilled
and unskilled labour. Of the 72 households, 42 heads of households were casual
labour, 22 engaged in cultivation.
Table. 4.5 Occupational distribution of workers
Source : Block records, Office of the Block Development Office
Note: Figures in brackets represent percentages
Category
Cultivators
Allied Agricultural activities
Agricultural labourers
Cottage, household industries
Trade and commerce
Others
Total
Number of workers
22 (3 1)
17 (24)
13 (18)
11 (15)
3 (4)
6 (8)
72 (100)

e) Land holdings: Of the 72 sample households, 3 were landless, and 47
households were having landholdings below 50 cents. There were only 7 sample
households with more than 2 . acre of land (Table 4.6 )
Table 4.6. Landholding pattern of beneficiary households
The excessive pressure of population on land has resulted in fragmentation
of holdings in to uneconomic holdings. This indicates that small and marginal
farmers constitute the majority.
Size of holdings
Nil
upto 50 cents
between 5 1 cents & 1 acre
> l acre
Total
Number of households
3
47
15
7
72

f) Housing condition: The criterion for housing condition considered was
the type of roof.
SES 1 - If roof was made of grass, thatch, sheet, etc
SES 2 - If roof was made of tiles
SEs 3 - If roof was made of concrete
Table 4.7 Demographic and social characteristics
of the study population by SES status

Morbidity pattern
Attempts were made to assess the prevailing morbidity pattern. Data for this
were collected fiom patients attending OPD during the 3day observation period
and OPD register maintained at the CHC and PHC. The demand for health
services is stemming from the morbidity pattern of the population studied as
shown in table 4.8.
Table 4.8 Frequency of illness at the time of interview by sex
S1.No
1
2.
3
4
5
6
7
8
9
10
11
12
13
14
15
16
17
18
Illness
Diarrohoea
fever
Chicken pox
Conjunctivitis
Bronchial Asthma
Cardiac diseases
Tonsilitis
Allergy
Peptic ulcer
Tuberculosis
Headache
Rheumatic complaints
Abdominal pain
Epilepsy
Mental diseases
Worm infection
Dysentery
Others
Sex
male
-
8
1
3
10
3
6
2
5
3
7
1
2
0
1
2 1
11
2 5
female
4
15
2
4
17
1
2
7
6
1
14
1
9
2
3
26
9
27

Higher morbidity levels exert greater demands on the health care system.
Merely increasing the health care facilities may not be a solution. The solution
lies in making investments in the right areas as problems may be more due to
lack of proper food and living conditions, than just poor educational status and
low use of health care facilities.
The demand for public health facilities could also be seen from tables
4.3 to 4.7 which expose the lack of amenities like protected water supply, lack
of sanitary latrine, education etc. The greatest demand for health services is seen
in times of illness when it is found that the medical care facilities provided by
the governmental health care delivery system is quite insufficient. This is in
relation to the health care provided by CHCs, PHCs and Subcentres.
An analysis of data in the outpatient and inpatient registers of the CHC
shows that on an avarage 4,000 to 5,000 patients in a month get treated in the
out patient department and around 100 patients in a month are treated as inpatients.
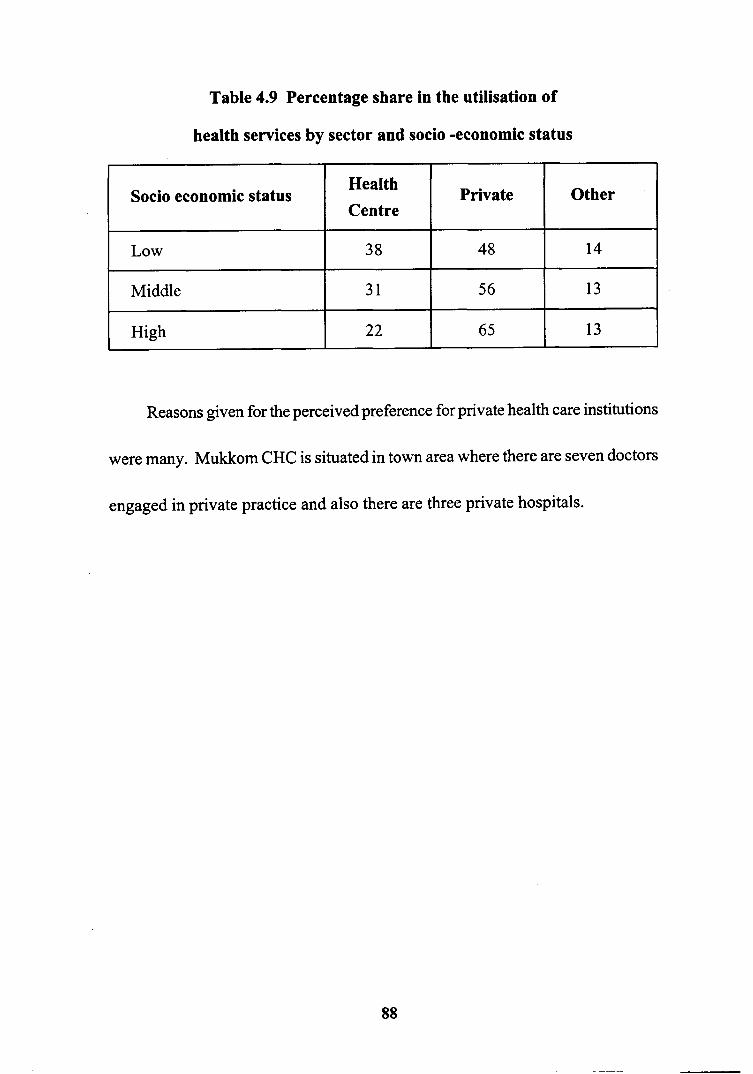
Table 4.9 Percentage share in the utilisation of
health services by sector and socio -economic status
Reasons given for the perceived preference for private health care institutions
were many. Mukkom CHC is situated in town area where there are seven doctors
engaged in private practice and also there are three private hospitals.
Other
14
13
13
Private
48
56
6 5
Socio economic status
Low
Middle
High
Health Centre
38
31
22

Table: 4.10 Response by households on good things about
Community Health Centre service by socio economic status
,-
Item
No comments
Good treatment
Good manners1 co-operation
Full time doctor1 staff
Availability of medicines
Inexpensive
Nearness
For immunisation
For minor illness
Low
15
2 1
5
4
3 9
21
0
19
1
Middle
7
14
7
2
15
10
0
9
0
High
6
5
3
2
14
3
0
10
0

Table 4.11. Response by households on factors hindering utilisation of
CHC services by socioeconomic status
Item
No comments
Waste of time
Complaints related to medicine
Non-availability of doctor
Poor attention and care
No neatness
No facilities
Do not give medicines
Lack of medicines and
equipment
Low
9
18
55
7
8
7
0
3
0
Middle
5
11
13
4
3
3
0
1
0
High
4
13
5
11
9
13
0
16
0

Table 4.12. Determinants of CHC service utilisation

Money spent for treatment
Data concerning the cost of treatment which included cost of medicine, fee
to doctors and travel cost were collected. It is found that per capita expenditure
for treatment is rather high.
Table. 4.13 Percapita annual expenditure for treatment and its
percentage to percapita annual income by SES
The percapita expenditure on treatment as well as the percentage share of it
to per capita income are found to be high. The lowest socioeconomic group
spends 20 per cent of their per capita income for treatment.
Status
(1)
SES 1
SES 2
SES 3
percapita expenditure
(Rs)
(2)
430
5 82
563
percapita
income (Rs)
(3)
2155
3900
6242
(2) as %
share of (3)
(4)
20.0
14.5
9.0
Of the 72 households surveyed, the majority belonged to the low socio-
economic status .with a meagre monthly income of Rs 500 and below. This
shows that their purchasing power is very low. If the educational status is analysed,
it could be inferred that the majority are in the middle and low educational status.
The percentage of subjects who have studied in high schools is considerably
high. However, those who have education above high school level is a lower
percentage. By and large the positive relationship between income and health
care utilisation holds true. However behavioural patterns that determine the actual
process of utilisation are varying. The fact that the majority of beneficiaries
have the influence of educated members in the family points to increased chances
for health care utilisation especially in times of morbidity.
It must be noted that major proportion of households surveyed use water.
from wells that is unprotected. Several of these wells turn dry during January to
May till the next monsoon. Higher rate of diorreahal diseases reported during
months of June-July-August could be related to the unprotected water supply to
which they depend on. The presence or the absence of latrine shows that majority
of households are using insanitary latrine and good number of them resort to
open air defaecation. This leads to high incidence of parasitic and helminthic
infections.

Although educational status is fairly good, it does not bring a decline in the
fertility pattern as shown by table 4.2 where the family size is large having 6 to
10 members. Perhaps the factors that play a major role in the high fertility rate
may be their low economic status, religious customs and insanitary living
conditions which also lead to high morbidity.
Analysis of the morbidity pattern reveals that there is a wide spectrum of
diseases. Among diseases reported, worm infections, dysentery, bronchial asthma
and fever have high incidence rate. Probably the low incidence of diarrhoea
may be due to the specific season of the year in which the study was undertaken
when such diarrhoea1 outbreaks are rare.
When responses of beneficiaries in relation to services offered by the
community health centre were analysed, it was seen that the majority of them
agreed that the health centre stocked medicines and treatment was inexpensive
and of a certain standard. A good number of them visited the health centre for
immunisation. It may be noted that there were no responses to show people's
antipathy for health centres.
As regards factors hindering utilisation of health centre services, the majority
of them have responded that they have complaints related to the supply of
medicines. On further probing, it was revealed that only very few medicines

were available at the centre and that they had to buy the rest from outside, most
of them being expensive. Other responses "going to health centres is a waste
of time and the doctor is not available". The investigator's observation also
confirms the finding that a few medicines are supplied by health centres and
doctors are available only from 9.00 a.m to 1 p.m and during other times patients
have to visit them either in their quarters or private clinics.
On analysis of the factors influencing the ulilization of services in the PHC,
it could be seen that 73 percent of respondents are satisfied with services offered
by the health centre. The majority of them visit the centre for treatment of minor
illness. A good proportion of the patients who visit PHC has diseases of chronic
nature. Probably the poor purchasing power and poor sanitary facilities make
them live in continued morbidity.
4.2 Analysis of health services expenditure
The health status of Kerala owes its present state in large measure to
Government spending. While Government expenditures on health are available,
information on household expenditure are not generally available. Per capita
expenditure on public health shows that it is only marginally higher in Kerala
compared to the average expenditure of all States.

Estimates of expenditure on health services are essential information for
health policy planning. Money is a convenient way of adding together the quantity
of resources of different types (for example, manpower, equipment and supplies)
just as mortality and morbidity rates are convenient ways of aggregating the
extent of health needs.
In the case of delivery of services through PHCs, expenditures on health
services may be found in the budget of the Department of Health which is
responsible for health services. The possible analysis on how the health budget
is spent revealed that the directly identifiable outlays on the control of
communicable diseases and on primary health care amounted to only 20 percent
of the health and medical budget.
Health care encompasses a multitude of services and programmes, ranging
fiom maintaining clean water and sanitation to organ transplants. Using economic
principles, we can subdivide health care into threee major categories: public,
merit and private. According to economic theory, it is socially optimal for the
Government to finance and possibly to provide the first two type of services;
while it may be more efficient for the private sector to finance and provide the
third.These concepts are simple but very powerful in mobilizing human emotion
and reasoning in support of public hnding for health services.
Most of public health and preventive measures are public goods. Examples
include disease eradication campaigns by means of immunisation or programmes
to provide clean water, sanitation, vector control, water pollution control and
mass health education. These are considered to be public goods because their
benefits accrue to all members of society.
There are several types of merit goods. One type consists of services whose
consumption produces greater social benefit than private benefit, such as family
planning. Another type produces externalities such as vaccination. Social
externalities are the effects on the health of the general public of decisions made
by individuals about their own medical care. These effects may be positive or
negative and are external to the individual making the decision. For example,
the treatment or immunisation of one person protects the health of others.
Conversely, a person's decision not to seek treatment for an infectious disease
can result in many healthy people becoming infected. Since the price of care
deters people from seeking it, it makes sense to provide it free of charge. Thus
if social externalities associated with use or non-use of specific health care services
are significant, they provide sufficient reason for public funding of these
services.A third type of merit goods includes services possessing significant

interpersonal utility values such as emergency services for trauma patients and
basic health services for vulnerable people.
Health and health outcomes can, in one sense, be viewed as outcomes which
are produced by a process involving capital (hospitals and equipment), labour
(doctors, nurses, other health personnel) and a lot of consumables (medicines,
bandages, dressings and such). The inputs that we use, whether they are buildings,
equipment, consumables, time or labour, can be collectively thought of as costs,
because they are the sacrifices we make to achieve the outputs.
Economists define cost as the value of resources used to produce something,
including a specific helath service or a set of services. When a resource, such as
man, money, material or time is used for some purposes the opportunity of using
the same elsewhere is lost. Hence the cost of using this resource for this particular
purpose is the relinquishment of its next best alternative use. This is the economic
cost or opportunity cost.
Capital costs are generally one-time commitments. But any capital
investment, buildings, machinery or such, has a useful life span. So the
opportunity cost of the capital can be thought of as equivalent to the value of the
returns foregone by locking up the money in this investment, for the period of
life of the project.
As health service is a public utility, it should be provided to all needy persons
from an equity point of view. Inputs of health services are of different kinds:
they include, on the one hand, overhead expenditure on PHC building, equipment
and furniture, and on the other hand direct expenditure on salaries of medical
officers and on the other type of health service personnel.
In theory the expenditure of PHC services can be broken down into
administrative cost, cost of curative services, care services and preventive services.
It is not however practical to distinguish between services provided with the aim
of effecting a cure and the provisions of services to persons for whom cure is not
a likely prospect. Similarly preventive services to some extent merge into curative
services. Preventive services which can usually be separately identified for costing
purposes include :
1. Antenatal and postnatal services
2. Immunization
3. Action for the control or eradication of communicable diseases.
Some of the activities can readily be costed when staff are wholly engaged
in the activity. But when the staff are engaged in both preventive and curative
work, estimates need to be made based on how staff actually spend their time
with an approprate allocation of supplies and overhead costs.
It is difficult to measure the output of the health sector, as the concept of
output is ambigious. Primary health centre, Cheruvadi, was selected for making
an analysis of health services expenditure. The PHC has two medical officers,
supervisory staff like the lady health inspector and the health inspector, field
staff including six junior public health nurses and two junior health inspectors
and emergency staff including a pharmacist. A clerk alongwith the supporting
staff consisted of a driver, an ophthalmic assistant, a peon and a class IV staff.
The PHC has seven subcentres. One of these subcentres is based at
Cheruvadi PHC itself. There is a separate PHC building from which various
health and family welfare activities are carried out. The building has four rooms,
one room each for doctor, lady health inspector, pharmacist and stores. It has
been noted that the largest component of the health expenditure has been pay
and allowances. If this has resulted in better service to beneficiaries then it
cannot be faulted. Consumers of health care need to receive better service as a
result of expenditure on personnel of the health centre.
Items of cost included in the study are cost of equipment like delivery tables,
refrigerator, sterilizer, weighing machines, small equipment, laboratory equipment
and cost of supplies like drugs, vaccines, syringes and catguts. Only the
depreciated value of these equipment except small equipment and laboratory

/2;~'3&.30 5- T k / 362. laoCi 5-9-83 Cn EO/,,
equipment is accounted as the cost for the year. As regards the cost of supplies,
the whole of it is treated as the cost for the year since it is a recurring item. When
expenditure on medicines, equipment and construction are reduced, all consumers
of health centre services will stand to lose, but the worst affected will be the poor
who would have received these facilities fiee of cost and who are denied access
to these due to their inability to pay for them.
Cost of transport consists of cost of pay and allowances to the driver, cost
of diesel, cost of repairs which are recurring costs and the whole of these costs
are treated as costs for the year. The cost of purchase of the vehicle is capital non
- recurring cost and only depreciated amount is added to the total cost.
The cost of building and land are not taken into account in this study. The
land belonged to the Government. The maintanance charges are met by the public
works department and amount spent is not included in the PHC budget.
The ice lined refigerator in the PHC was purchased for Rs 13,000 seven
years ago. If this money had been invested in a bank, it would have yielded a
monthly return depending upon the prevailing interest rate. This is the opportunity
cost of capital and it should be applied to all capital costs such as
buildings, land and equipment. The other element in the cost of capital is
depreciation. The loss in value of equipment and buildings with use or passage

of time is called 'depreciation'. For any usehl comparison of costs, the one- time
investment in capital has to be reduced to its annual equivalent. The process of
attributing the total capital costs over the usefbl life of the capital equipment is
called annuitization or amortization.
The health centre has vehicle which could be used for field visits by the
medical officershealth inspector. Is it more economical to let them use this
vehicle or reimburse them for their travel expenses? The right approach would
be to take in to account the fuel and other operational expenditure for vehicles in
comparison with the doctor's/ health inpector's travel claims. It is not necessary
here to take in to account capital costs of the vehicles used.
Whether costing is crucial or not in the health setting? Costing may be
important for many health facilities where the charges have to be related to costs.
Even if the charges are set so as not to cover the full costs, one should be aware
of the extent of the subsidy involved. Moreover, only if cost data is available is
the health manager or administrator able to plan ahead for the future, with optimum
use of available resources.

CLASSIFICATION OF COSTS BY INPUTS - PHC, CHERUVADI
Capital cost:
a) Jeep
b) Equipment : delivery table, refrigerators, sterilizers,
weighing machines, Xray machine
c) Buildings, space
Recurrent cost
a) Personnel (all types)
b) Supplies
c) Jeep, operation &
maintenance
d) Buildings, Operation
& maintenance
e) Operating cost
: drugs, vaccines, syringes, catguts small
equipment, laboratory equipments
: diesel, lubricants, tyres, spare parts,
registration & insurance
: electricity, water, heating, telephone,
cleaning, repairs
To take advantage of the treatment available in the health centre, people
need to travel to the centre and wait their turn. To do this, they may have to take
time off fiom paid work and forfeit wages. Or they may sacrifice useful time at
home. They may have to pay for public transport, consultations and medicines.
Costs may also be incurred by people who go to the centre but receive no treatment
(household costs). They may find that the health centre is closed, that the drugs
they need are not in stock or that they cannot afford to wait.
Resources provided for the primary health care sector in the State, as
Government expenditure forms a very minor part of the total budget outlays for
the State. These resources has been spent on increasing the number of providers
of health care without corresponding increase in productivity. This has resulted
in considerable decline in productivity per employee. It therefore suggests that
the increase in the share of expenditure of personnel has not increased the
efficiency of the primary health centre. Health expenditure in our study showed
that beneficiaries spent more money on many of the reported illnesses. Household
survey has also estimated the cost of illness episodes on an individual basis. The
survey has obtained information on how much is being spent on various
components of expenditure incurred by households in making direct payment
for doctors, medicines and other medical services.


![U.S. Federal Statistics and Statistical Ethics: The …entire indictment ˛ [Annas and Grodin, 1992: 84], pertained to the identification of a sample of ˝Jewish-Bolshevik ˛ prisoners](https://img.dokumen.tips/doc/110x75/5e834755dfbfdb384624b07e/us-federal-statistics-and-statistical-ethics-the-entire-indictment-annas.jpg)


