Embed Size (px)
Citation preview

Journal of Finance and Accountancy
Demand Curves and Partial Incorporation, Page 1
Demand curves and partial incorporation
of information in IPO pricing
Tanya Gulati
Birla Institute of Technology Mesra, India
ABSTRACT
This paper examines demand curves of 194 Indian IPO issued during year 2005 to year
2009 by book building procedure. Demand schedules are found to be highly inelastic and
maximum demand on the average concentrates on range maximum. During this period book
building process in India did not give any discretionary power to investment banker in matter of
allotment, and the allotment was to be done on proportionate basis. Present study finds evidence
that in spite of this restriction issuer incorporates the information from demand curves partially
while setting the issue price and underprices the issue. Our results also support Millers (1977)
hypothesis that given the short sale constrains, greater divergence of opinion results into more
underpricing of IPOs. Further examination of data on first day trading returns reveal, that issuer
not only partially incorporates information from demand curves, which is considered private, but
also incorporates public information partially while setting the issue price. We find that private
information, public information and ex-ante uncertainty together is able to explain 28.2% of
underpricing.
Keywords: IPO, underpricing, book building, demand curves, elasticity

Journal of Finance and Accountancy
Demand Curves and Partial Incorporation, Page 2
INTRODUCTION:
Book building has acquired dominant position all over the world as a method to sell
initial public offerings (Ljungqvist, Jenkinson, & Wilhelm, 2003). In India this method was
introduced in the year 1999 as an alternative to fixed price offering then in vogue and over a
period, majority of companies are using this method to introduce IPOs to the investors. Until
September 2005, investment bankers in India enjoyed complete discretion in allotment of shares
to institutional investors and in setting the issue price within the price range. Thereafter
discretion of allotment was withdrawn and uniform policy of allotting oversubscribed shares on
proportionate basis to all categories of investors was introduced. Present study covers period
from September 2005 to 2009 when this policy is in operation. This gives an opportunity to
investigate whether such an important shift from a typical book building process where
investment banker enjoys complete discretion of allotment, affects the price discovery of IPOs
and whether, and how far investment banker uses information from demand curves in setting the
issue price.
According to Benveniste and Spindt (1989) and Benveniste and Wilhelm,(1997),
discretionary power of investment banker in allotting IPOs is essential to extract truthful
information from institutional investors Based upon information asymmetry hypothesis, where it
is assumed that institutional investors are more informed about the valuation which market will
impart to an IPO than the investment banker and the issuer taken together; it is proposed that
investment banker uses his discretionary power as an inducement to the institutional investors by
underpricing the shares with strong demand and allotment of these underpriced IPOs to those
investors who truthfully reveal positive information and reducing or withholding the allotment to
those who understate or overstate their demand. Cornelli and Goldreich (2003) in their study of
demand curves and allotment schedules of sample size of 63 international issues, out of which 37
are IPOs, marketed by reputed European bank, confirm the hypothesis of Benveniste and Spindt
(1989) that investment banker partially incorporates information contained in demand curves i.e.
IPOs are underpriced and uses his discretion of allotment to favor those institutional investors
whose bids have most influence on setting the issue price.
Contrary to this hypothesis, Rocholl Jorg (2004) has studied demand and allocation for
41 European IPOs and concluded that results do not provide evidence that institutional investors
are rewarded for revealing information. They find support of quid pro quo hypothesis, wherein
institutional investors are awarded underpriced shares in lieu of their participation in cold issues
and helping underwriters in the successful placement of these issues. Jenkinson and Jones (2004)
also in their study of demand of 27 European IPO find evidence of certain institutional investors
being favored in allocation but they also do not find an evidence to establish that discretion is
meant to encourage informed investors to truthfully reveal their privately held price information.
Present study investigates demand schedules of 194 IPOs in a setting where institutional
features do not permit discretion of allotment. Sample size is much larger compared to other
studies done on the subject. It is observed that investment banker incorporates the information of
price almost fully and information on demand partially and sets the issue price closer to weighted
average price of bids. These findings are similar to what has been observed by Cornelli and
Goldreich (2003), but in a scenario where investment banker does not enjoy discretion in
allotment, providing evidence that discretion of allotment is not necessary to elicit privately held
information from the institutional investors.

Journal of Finance and Accountancy
Demand Curves and Partial Incorporation, Page 3
Elasticity of demand is important information, which demand curves reveal. High level of
elasticity show consensus between investors and lower level of it shows higher level of valuation
uncertainty due to information asymmetry or divergence of opinion among investors on the
underlying value of an asset. Lintner (1965) and Sharpe (1964) has hypothesized in Capital
Asset Pricing Model that price of a financial asset is independent of aggregate demand and
supply because perfect substitute is available and thus demand curves of financial assets are
virtually elastic (flat). Remarkable studies have been done in past and contrary to CAPM
hypothesis; evidences of downward sloping demand curves have been found (Chen, Hong
&Stein, 2002; Miller, 1977; Scholes, 1972; Shleifer, 1986). In these studies different proxies
have been used to capture the effect of change in demand on price. Studies also have been done
in past to investigate slope of demand curves from actual demand schedules. Notable among
these is the study done by Bagwell (1992) on repurchase of shares by 32 companies in secondary
market of USA by Dutch auction. Present study uses the methodology adopted by Bagwell
(1992) in calculating demand elasticity, investigates much larger sample of 194 IPOs and finds
the direct evidence of downward sloping demand curves.
Present study performs OLS regression on different variables used as proxies for private
and public information. Information revealed during book building process is considered private
information held by investors. Private information variables include elasticity of demand and
price revision with respect to midpoint of the price range. Contrary to findings of few studies
done in past on relationship between underpricing and demand elasticity; present study finds the
relationship between these two to be negative. Lower elasticity of demand indicates lower
consensus and more divergence of opinion within the investors on the valuation of an IPO.
Present study done on Indian IPO market provides direct evidence and corroborates Miller
(1977) hypothesis that higher divergence of opinion (lower elasticity) results into underpricing of
IPO stocks.
Relationship of underpricing and price revision that is revision of offer price with respect
to midpoint of the price range has been done by Hanley (1993) and it is observed that the issues
where offer price is set above midpoint of the price range are underpriced more than the issues
which are priced below the midpoint. This important finding has been also confirmed in OLS
regression performed in the present study. Hanley (1993) has studied US market, where issuer
can set the price above the range maximum or below the range minimum. This study, therefore,
provides evidence for US market that issues priced outside the range are underpriced more than
the issues priced within the range. Institutional features in India do not allow the issue price to be
set outside the range, without revising the range itself. Present study does not find a single issue
out of sample of 194 IPOs, where range has been revised upwards.
It is observed that not only private information but public information is also partially
adjusted by underwriters in setting the issue price. Loughran and Ritter(2002), while advancing
prospect theory based model, has found that first day returns can be predicted from public
information , meaning thereby that issuer not only adjusts private information partially but
adjusts public information partially too. Bradley and Jordan (2002) has also provided evidence
that public information such as information on overhang, 30 days lagged returns of IPOs and
returns on market index prior to setting the offer price can explain much greater portion of
underpricing. Present study done on Indian market provides evidence quite similar to what has
been observed in above referred studies done on developed market of USA that investment
banker incorporates private and public information partially and much greater portion of
underpricing can be explained from public information only.
Journal of Finance and Accountancy
Demand Curves and Partial Incorporation, Page 4
Ex-ante uncertainty has been observed to have strong relationship with underpricing.
Rock (1986) has hypothesized that information asymmetry between informed investors and
uninformed investors results into adverse selection problem for uninformed investors, who suffer
from winners curse. It has been observed that investment banker underprices riskier issues more
to overcome this and to ensure that uninformed investors continue participating in IPO market. .
Present study uses age of firm, which is an observable firm characteristic, as a proxy for risk due
to ex ante uncertainty (Loughran & Ritter, 2004). Present study also uses standard deviation of
21 trading days’ daily returns excluding the first day of trading as a proxy for risk similar to
proxy used by Ritter (1984) in multivariate regression of underpricing. As an alternative to
standard deviation, this study also uses another measure of variance suggested by Parkinson
(1980), who extends study on unidirectional continuous random walk concept and proposes that
extreme values method gives better estimate of variance of rate of return. He proposes a simple
method that if H and L are high and low values of stock in a given time interval then Log of
(H/L) will be a good estimate of variance.
Study has been divided into 2 sections. Section 1 examines demand schedules of IPOs
revealed during book building process and relevance of information contained in these in setting
the issue price by investment banker. In order to compare findings between developed and Indian
IPO market, study done by Cornelli and Goldreich (2003) has been used as a reference. Sample
size of demand schedules of 194 IPOs is much larger than sample size of 37 IPOs in study by
Cornelli and Goldreich (2003). With so much of difference in the mechanism and other
institutional features of Indian IPO, it can be hypothesized that demand schedules will have
different features and investment banker in India will be treating the information from demand
curves differently while setting the issue price. Section 1 of this study attempts to provide an
answer to this.
Section 2 examines whether unadjusted information from demand curves get revealed
when trading in issue starts. This section extends its study and includes various proxies for public
information in multivariate regression and find, that not only private information, issuer
incorporates public information also partially while setting the offer price. It also uses many
proxies used in literature for ex ante uncertainty and find that riskier issues are underpriced more.
This section also uses not so widely used variable Log (High /Low) of first day trading price of
IPO as proxy for ex ante uncertainty and finds evidence of its explanatory power in explaining
underpricing. This section also establishes positive relation between divergences of opinion
(opposite of consensus) between investors on expected price of security with underpricing thus
confirming hypothesis of Miller (1977).
.
DATA:
This study examines demand curves of 194 IPOs marketed between September 2005 and
year 2009 by book building procedure in Indian stock market. This period is specially selected as
during this interval investment bankers do not enjoy any discretion of allotment of shares, which
is done on proportionate basis for all category of investors. Data on demand schedules has been
taken from two major stock exchanges, Bombay Stock Exchange (BSE) and National Stock
Exchange (NSE) of India. Most of the issues are registered in both Exchanges. Data on issue
size, company size, age and retained shares have been taken from the red herring prospectus filed
with SEBI. Age has been calculated from date of incorporation. Companies which are subsidiary
companies, date of incorporation of parent company has been taken. Lot of efforts have been

Journal of Finance and Accountancy
Demand Curves and Partial Incorporation, Page 5
invested to cross verify the data from different sources and corrected. For information on market
returns and IPO returns, data has been collected from BSE and NSE.
SECTION 1
Information from Demand Curves, Issue Price and Partial Adjustment of Information
Introduction covers many important features of Indian book building process which
makes it different from what is practiced in other developed markets. Without discretion of
allotment to investment banker, Indian book building process comes closer to auction method
promoted by WR Hambrecht as lead underwriter in 19 IPOs in USA (Degeorge, Derrien, &
Womack, 2010) But unlike auction where price bids are invited in sealed tenders, Indian book
building procedure is totally transparent and construction of demand curves can be viewed in real
time on public web sites. This can result into herd behavior by investors (Banerjee, 1992) or
informational cascades (Welch, 1992). This can hinder the proper price discovery. On the other
hand, contrary to practice in USA , where bids are only indication of interest, these become
binding for Qualified Institutional Buyers in Indian IPO market after completion of bidding ;
this may encourage the investors to register their actual demand. Competition between investors
being very high as revealed by high level of over subscription among all categories of investors,
there can be tendency of the investors to bid high thus concentrating demand at range maximum.
To examine information from demand curves and its relevance in setting the issue price by
investment banker, study done on demand curves by Cornelli and Goldreich (2003) for 37 IPOs
conducted by a reputed European bank is taken as reference for the sake of comparison. For the
sake of brevity these authors will be referred as (CG, 2003).
Book building period in India is preceded by issuer taking out an abridged prospectus and
widely circulating it, informing the public of IPO and starting and closing dates of book building
period. Abridged prospectus contains relevant information required as per Disclosure and
Investor Protection Guidelines popularly known as DIP guidelines issued by market regulator
SEBI. Apart from information of company and its promoters, it contains information on issue
size, percentage reservation for different category of investors out of total issue size, allotment
rules, size of green shoe option and price range within which bids are accepted. Retail investors
if they so desire can submit bids without price which are called cut off bids. Books remain open
for 3 to 5 days. After closing of book, final demand curves are constructed and investment
banker sets the issue price in consultation with the issuer and allotment of shares is done for
different category of investors on pro rata basis. Issue price need not be at market clearing price
and can be any price within the price range. In the event of strong demand or poor demand of the
issue, issuer can revise the range upward or downward as the case may be.
Summary Statistics
Following is the description of variables used in this section and relevant findings from
summary statistics as indicated in Table 1(Appendix).
Normalized Issue Price
Journal of Finance and Accountancy
Demand Curves and Partial Incorporation, Page 6
Issue price has been normalized with respect to the initial price range. Normalization
with respect to initial price range adjusts for the information available before start of book
building. Issue price at range minimum has normalized value of 0 and the one set at range
maximum has value of 1. Issues set below the price range will have negative value and those set
above range maximum will have value more than 1. Wherever range has been revised by the
investment banker, issue price has been normalized with respect to initial price range. Mean
(median) of normalized issue price with respect to range in our case is 0.78 (1.0). The
corresponding values in CG (2003) are 0.51 (0.67).These two values being closer to range
maximum in present study indicate that issuer is setting the issue price in most of the cases very
close to range maximum. Out of 194 issues under study, issuer has set issue price at range
maximum in 141 (72 %) cases, which is fairly a high number. Concentration of issue price at
range maximum is consistent with the results obtained by Jenkinson, Morrison and Wilhelm
(2006), Ljungqvist et al. (2003), and Rocholl Jorg (2004).
Range Width
Range width is proxy for ex ante uncertainty. Hanley (1993) has stated that higher range
width shows that underwriter is not sure of the issue price and wants to be more flexible in
setting the final offer price. The variable is defined as percentage range width with respect to
range midpoint. This study finds mean (median) value for this variable to be 6.49 (6.56). Unlike
USA, in India, issuer cannot set the issue price outside the price range without revising the price
range itself. In case of strong demand or demand being poor, issuer can amend the price range at
the close of book building. In such an eventuality, book building period is extended and
information on amendment of range is to be widely publicized. In Indian IPO market, out of
sample size of 194 IPOs, price range of 11 issues with poor demand is revised downward. In
none of the cases, despite very strong demand, range has been revised upwards. This shows that
underwriter incorporates the negative information fully and incorporates the positive information
partially, while setting the issue price. There is another dimension to the issuer not revising price
range upwards despite strong demand. On an average IPO share allotment is done after 13 days
of closure of book building period. During this period, retail and other non institutional investors,
who constitute 50 % of IPO market, can withdraw their bids. There is a risk of even very
successful IPO facing situation of withdrawal during this period if market conditions turn
adverse. Present study has found few issues where bids were withdrawn in large numbers by
these investors after closure of books. Despite IPO being highly oversubscribed, issuers therefore
do not take the risk of revising the range upward.
Normalized Average Bid Price
Qualified Institutional Buyers (QIB) and Non institutional investors (NII) can submit
only price bids i.e. bid shall have information on quantity demanded and a price at which order is
placed. Retail investors can submit bids without price which are called cut off bids. Normalized
Average Bid Price is quantity weighted average bid price normalized with respect to price range.
In present study, we find mean (median) of normalized average bid price with respect to range is
0.88 (1.00). The corresponding figures for sample under study by (CG, 2003) being 0.49
(0.49).These values show that in Indian market, demand on an average for most of the issues is
concentrated at range maximum.

Journal of Finance and Accountancy
Demand Curves and Partial Incorporation, Page 7
Elasticity of demand
As per Capital Asset Pricing Model (CAPM) demand for any financial asset is virtually
elastic and its price is independent of the supply because of availability of perfect substitute.
CAPM model is based upon the assumption that all investors have identical expectations of
future earnings and probability distribution of returns from all securities. Contrary to this
hypothesis, literature referred in introduction provides enough evidence that demand curves
slope downward.
Miller (1977) has contradicted key assumption of ‘identical expectations’ of CAPM
model and has argued that in the scenario of uncertainty, reasonable men can differ in their
forecasts of expected returns. Miller (1977) has hypothesized that downward sloping demand
curves indicate divergence of opinion between different groups of investors. More is the
divergence of opinion; more will be the slope of demand curve and higher will be expected
equilibrium price of the security. Theories based upon information asymmetry hypothesize that
downward sloping demand curve is because of different valuations by the investors for a
common value object, which may arise because of information asymmetry (Milgrom and Weber,
1982).
Different researchers have taken elasticity of demand at different points on the
demand curve. Elasticity between two points (Q1, P1) and (Q2, P2) on the demand curve can be
measured as under
(Q2-Q1)/ (Q2+Q1) /2
(P2-P1)/ (P2+P1)/2
CG (2003) has taken this value at weighted average bid price and issue price and they
find mean (median) values to be 12.8 (3.6) at issue price. In literature on auctions, this value has
been taken at auction clearing price or gross elasticity between minimum price and auction
clearing price. Present study uses method adopted by Bagwell (1992) for calculating demand
elasticity in repurchase of shares in Dutch auction. Traditional CAPM rests on key assumption of
homothetic expectations (Sharpe, 1964). Contrary to this, study by Bagwell (1992) establishes
from actual demand curves of 32 repurchase auctions, that investors’ valuations are not
homogeneous.
To arrive at value of elasticity, the present study uses data of bid price and quantity for
every IPO in sample of 194 IPO and like Bagwell (1992) measures the downward slope of least
squares best fit line of demand curve in each IPO. Bid price has been normalized with midpoint
of the price range and demand at a particular price is normalized with quantity of shares offered
by the firm. The following regression has been used
Normalized Bid Price = α + β* Normalized Bid Quantity + ε
Value of β shows the heterogeneity (divergence) of opinion and inverse of this shows
consensus between investors on valuation of a particular IPO. Mean (Median) Elasticity of
sample under study is 1.28 (1.13). Bagwell (1992) computations show the corresponding mean
(median) elasticity to be 0.68(1.05). Kandel, Sarig, and Wohl (1999) in their study of demand
curves in uniform price auction of IPO in Israel market find these values at auction clearing
Journal of Finance and Accountancy
Demand Curves and Partial Incorporation, Page 8
price to be 37.1 (21). These results show that demand of IPO within the price range in present
study of Indian IPO is highly inelastic and there is high degree of divergence of opinion. To
measure divergence of opinion (reverse of consensus) this study also uses standard deviation of
demand , which is calculated as standard deviation of quantity weighted price bids, where price
bids are normalized by the price range and non cumulative quantities are normalized with
cumulative quantity of price bids ( excludes cut off bids). Mean (Median) standard deviation is
found to be 0.26 (0.24). The corresponding figures by CG (2003) are 0.75 (0.48).
Oversubscription Ratio
This is ratio of cumulative demand at range minimum and shares offered by the Issuer.
Investors in Indian IPO market are categorized into Qualified Institutional Buyers (QIB), Non
Institutional Investors (NII), sometimes called High Net worth Individuals and Retail Individual
Investors (RI). Each one of these bid for their respective share of the offer size, which is
generally 50 % for institutional, 15 % for non institutional and 35 % for retail investors. Small
portion of issue is reserved for employees. If a particular category is not fully subscribed,
unsubscribed portion of the issue is allotted to other category as per SEBI guidelines. In case of
oversubscription, allotment of shares is rationed and done on proportionate basis within its own
category.
Beatty and Ritter (1986) argue that investors who can incur the cost for acquisition of
information is termed informed investors and those who do not do so are uninformed investors.
Retail investors are small investors and during the period under study, are allowed to submit
orders only up to INR 100000/- per IPO. In present study, we club categories other than QIB and
term them as ‘Others’. ‘Others’ are uninformed investors, as being small in size; they do not
have any benefit by investing in information acquisition.
This study calculates oversubscription at range minimum and at issue price of demand
schedules. Oversubscription is also calculated for different category of investors i.e. Qualified
Institutional Buyers (QIB) considered as informed investors, Non Institutional Investors (NII),
Retail Investors (RI) and Others (NII+RI) grouped as Uninformed Investors. Mean (median),
max (min) oversubscription for all bids at range minimum in our sample are 23.8 (7.38), 159.94
and (0.59) respectively. Corresponding values for study done by CG (2003) at range minimum
are 9.9(5.4). This study shows a wide variation of demand for different IPOs in Indian market.
There is also a wide difference between demand from informed and uninformed investors. For
informed and uninformed investors mean (median) oversubscription are 29.32 (8.67) and 16.30
(5.19) respectively.
Regression Results
In order to find evidence whether underwriter uses the information from demand curves
and the extent to which he uses this in setting the issue price , OLS regression is performed,
taking normalized issue price as dependent variable and other variables described above as
independent variables. Results are summarized in Table 2 (Appendix)
Regression 1 is performed only with normalized average bid price. Its coefficient is
positive, is statistically significant at 1 % level (p value=0.000) and adjusted R square is 82.6 %.
In study by CG (2003), adjusted R square for this regression is 81.5%. Regression 2 is
performed with oversubscription at minimum price of all bids. Its coefficient is positive,
Journal of Finance and Accountancy
Demand Curves and Partial Incorporation, Page 9
statistically significant at 1% (p value=0.000) and its adjusted R square is 14.80 %. In study by
CG (2003), adjusted R square for this regression is 37.5 %. Regression 3, 4 and 5 are performed
with independent variables of normalized average bid price and oversubscription at minimum
price of all bids, oversubscription of QIBs and oversubscription of uniformed investors (Others)
respectively. The coefficient in all cases is positive and statistically significant at 1% level. When
normalized average bid price is taken with oversubscription of all bids at minimum price,
adjusted R square changes from 82.6 % to 84.2 %. This shows that institutional investor adjusts
the price information contained in the bids more fully than the information on demand, which is
partially incorporated in setting the issue price. Question arises whether he relies on information
on demand contained in bids by institutional (informed) investors or on demand information
contained in bids of other (uninformed) investors. Regression 4 and regression 5 are performed
with demand of institutional investors and with demand of other investors. Adjusted R square is
83.4 % when oversubscription of institutional bids is taken with the normalized average bid price
in regression 4 (P value .002). The corresponding value for regression 5 is 85.2 %, when demand
of institutional bids is replaced with demand of other uninformed investors (p value 0.000). This
shows that investment banker relies more on the demand information contained in bids of
uninformed investors than this information contained in institutional bids. He only partially
adjusts this demand to generate more aftermarket trading as investors in this category are more
optimistic and participate in secondary market when trading starts in IPO. These results cannot
be compared with the results from CG (2003) as in IPO market studied by them bids are mostly
invited from institutional investors and categories of investors are not defined while bidding.
Regression 6 is done by taking elasticity of demand along with variable of regression 3.
Coefficient of elasticity is negative and statistically significant at 5 % level (p=0.024). The result
is opposite to what has been observed by CG (2003). Lower elasticity of demand (higher
divergence of opinion) shows valuation uncertainty. Investment banker should set offer price
lower if issue is more risky to mitigate winners curse problem of uninformed investors (Rock,
1986).However, negative sign of coefficient of elasticity in the regression indicates that issuer
sets the price higher when there is more uncertainty about its valuation. This is an anomaly and is
not consistent with the information hypothesis. The result can be better explained by Miller
(1977) hypothesis which considers that in the absence of short sale in IPOs, demand is driven by
optimistic investors and more is the divergence of opinion between optimistic and other
investors, more is the equilibrium price of the security. This study finds that investment banker
considers lower value of elasticity as a proxy for more divergence of opinion between optimistic
and other investors and ascribes this to increased demand from optimistic investors, who impart
higher valuation to the stock than the average valuation of potential investors. If that be the case,
the expected first day market price will be higher than the mean expected valuation of potential
investors. Investment banker partially incorporates this information and sets the offer price
higher, when divergence of opinion is more (elasticity is low)
Regression 7 is performed replacing elasticity with standard deviation of quantity
weighted price bids. More is the value, higher is the diversity of opinion. Similar to regression 6,
its positive sign show that issuer considers this diversity of opinion of its expected valuation in a
positive way while setting the issue price. The value of this coefficient is statistically significant
at 1 % level (p value=0.000).
Regression 8 is performed by taking variable on range width along with other variables of
regression 6. The coefficient of range is positive but statistically insignificant (p value=.356).
Adjusted R square of regression 8 is 84.6 %. Variables of regression 8 take into account

Journal of Finance and Accountancy
Demand Curves and Partial Incorporation, Page 10
complete information available from demand curves. This is an improvement of 0.4 % only
when compared with the value in regression 3, when normalized average bid price and demand
of all investors at minimum price is taken in regression. This provides evidence that investment
banker incorporates almost fully the information of price contained in bids and partially demand
of investors when setting the issue price. Information on elasticity and range width is hardly used
Results are similar to what has been found by CG (2003).
The findings from OLS regression provides evidence that despite the different
institutional features and differences in book building methods in India, investment banker and
issuer does not use book building simply as a share placement mechanism but they use the
information contained in demand curves for setting the issue price. Similar to evidence found by
Hanley (1993), this study finds that investment banker incorporates the information of demand
partially and information which is not incorporated in the issue price is revealed on close of first
day of trading resulting into IPO being traded on an average at price higher than offer price.
SECTION 2
Underpricing and Partial Adjustment of Private and Public Information
Section 1 of the study establishes that investment banker partially incorporates the private
information revealed in demand curves, even though he does not enjoy discretion to favor
investors by way of allotment of underpriced shares. Bradley and Jordan (2002) has found that
substantial amount of underpricing can be explained by using different types of public
information. Loughran and Ritter(2002), while investigating the reasons for issuer agreeing to
leave money on table for underpriced issues, find that underwriter , while setting the issue price,
not only incorporates private information partially but does so for public information also. This
section investigates how far partial incorporation of private and public information can explain
expected underpricing by using different proxies for unadjusted private information revealed
through demand curves, easily observable public information and ex ante risk.
Study of several variables and its relation with underpricing gives an added opportunity
to find whether Indian IPO market is driven by optimistic investors. Study of demand curves in
section 1 for sample of 194 firms has revealed that demand curves are highly inelastic, meaning
high divergence of opinion between investors on the valuation of IPO. This may arise because of
valuation uncertainty due to asymmetry of information or because of divergence of opinion
between different investors for same set of information as hypothesized by Miller (1977). This
section uses elasticity of demand as a proxy for consensus (inverse of divergence) of opinion and
finds whether Indian IPO market is driven by optimistic investors.
Present study uses initial returns as dependent variable in OLS regression and different
proxies for private information, public information and ex ante uncertainty as independent
variables as indicated in Table 3 (Appendix). Initial returns are raw return and not adjusted for
market movements. This is defined as (Pf -Po)/Po, where Pf is closing price on first day of trading
and Po is offer price. Sample set constitutes of 193 IPOs. Complete data on 1 IPO is not
available; therefore it has been excluded from the sample.
Independent Variables
Journal of Finance and Accountancy
Demand Curves and Partial Incorporation, Page 11
Following is brief statement on independent variables used in this study as proxy for
unadjusted private information from demand curves, ex ante uncertainty and public information.
Price Revision from Range Midpoint
In previous section, it is observed that issuer incorporates information from demand
curves while setting the issue price. It is also stated that issuer adjusts the price information from
bids more fully but adjusts information of demand partially. Hanley (1993) argues that difference
of issue price with respect to midpoint of initial price range has predictive power in estimating
expected price when trading begins. This variable is called Price Revision. Consistent with
previous studies, she finds that issuer adjusts positive information partially and negative
information more fully while setting the issue price. Issues which are priced above midpoint of
the price range are underpriced more than which are priced below the midpoint. Present study
uses this variable as proxy for partial adjustment of private information revealed from demand
curves in book building process.
Ex- Ante Uncertainty
Beatty and Ritter(1986), and Ritter(1984) state that risk associated with IPO is not
systematic beta type risk of capital asset pricing model ( CAPM) but is risk arising out of
valuation uncertainty. Valuation uncertainty arises because a company going first time to market
has no prior trading history, has not much published information and has never attracted the
attention of investors and analysts before announcing decision to go for an IPO. Compared to
seasoned equity offerings, little information is available about an IPO issuing company. This
valuation uncertainty is called ex- ante risk (Beatty & Ritter, 1986). This causes adverse
selection for uninformed investors and winners curse problem (Rock, 1986). In order that
uninformed investors on the whole have positive returns and thus keep participating in IPO
market, issues are underpriced. Since underpricing arises as an equilibrium condition to induce
investors to participate in IPO market (Loughran & Ritter, 2004); greater is the ex ante
uncertainty greater is the expected under pricing.
Issue size and age as ex-ante risk
Beatty and Ritter (1986) has used issue size (gross proceeds) as proxy for ex ante
uncertainty as firms with smaller issue are more risky. Loughran and Ritter (2004) take age as
proxy for the ex ante risk as lesser information is available for younger firms and hence younger
firms are more risky. The present study takes age as proxy for ex ante risk due to firm
characteristics and issue size (gross proceeds) as proxy for ex ante risk attributed to issue
characteristics. Variables used in the study are log (1+age) and log (issue size) as proxies to
capture effect of these in OLS regression.
Variance of aftermarket returns as ex- ante risk
On close of book building period, investment banker has relatively fair amount of
information on the expected valuation of issue when trading will begin but valuation uncertainty
is not fully resolved (Falconieri, Murphy, & Weaver, 2007).Standard deviation of 21 trading
Journal of Finance and Accountancy
Demand Curves and Partial Incorporation, Page 12
days’ daily returns excluding the first day of trading, is proxy for the unresolved ex ante
uncertainty. Present study also uses extreme value method proposed by Parkinson (1980) as an
alternate measure of variance. If H and L are high and low values of stock in a given time
interval then Log of (H/L) will be a good estimate of variance. Similar to study done by Knopf
and Teall (1999), present study also uses this measure of variance of aftermarket returns taking
log of high and low values of IPO stock on first day of trading as a proxy for unresolved ex ante
risk.
Hot Issue Markets
Ibbotson and Jaffe (1975) and Ritter (1984) has found in the study of USA IPO markets,
evidence that there are periods when mean returns of IPO are high and large number of IPOs are
taken out. They term these periods as hot markets. Draho (2001) has argued that during hot
market period public information in the form of prices and returns from previous issues influence
the success of new issues. Ritter (1984) has also found a high degree of autocorrelation of mean
monthly first day returns of IPOs. Ritter and Welch (2002) has summarized that issuers are more
inclined to bring out IPOs after valuation in public markets have increased.
In order to capture the effect of varying activity in IPO market present study takes
volume of new issues taken out 60 days prior to the trading day of an IPO as a proxy for activity
of IPO market. Oehler, Rummer, and Smith (2004) have taken 30 days window for calculating
the volume in their study on German market by using sample set of 410 firms. In India, IPO
activity is not that high so 60 days window has been used to have a meaningful volume of IPOs
to capture effect of previous IPOs activity. Log of (1+volume) is being used in OLS regression.
Effect of Previous Market Returns
.
Loughran and Ritter(2002) has shown that mean market returns prior to start of trading of
an IPO has lot of predictive power in estimating expected first day returns. Those IPOs which
start trading after a period of positive returns from composite stock index are underpriced more
than those which are issued subsequent to a period of falling market. This public information is
available with the issuer but it is only partially adjusted. Similar to Bradley and Jordan (2002),
present study, to capture the effect of market movements on IPO underpricing, takes mean of
daily percentage returns of BSE stock index for 15 trading days before IPO listing date.
Overhang
It is defined as ratio of IPO shares retained by promoters and shares sold to public. Rules
laid by regulator in India do not permit any increase in gross proceeds than what has been given
in filing prospectus. Underpricing of issue by setting the lower offer price of IPO means only
marginally higher number of shares being sold without affecting the gross proceeds. Higher
overhang means that promoters do not face dilution of ownership by selling slightly more
number of shares at discount.
Aggarwal, Krigman, and Womack (2002) have argued that substantial underpricing
attracts enhanced analyst coverage and attention of investors and media which generates
information momentum and shift the demand curve outwards. Promoters and mangers of the
firm earn substantial returns when they sell the shares at expiry of lock up period. Aggarwal et

Journal of Finance and Accountancy
Demand Curves and Partial Incorporation, Page 13
al. (2002) have found positive relationship between percentages of shares retained i.e. overhang
and underpricing. Bradley and Jordon (2002), Dolvin and Jordon (2008), and Ljungqvist and
Wilhelm (2003) have also found same positive relationship between underpricing and fraction of
the firm sold (overhang). Loughran and Ritter (2002) has also argued that it is the net gain in
wealth , which issuer or pre issue share holders care about than bothering about leaving money
on the table. If retained shares are much higher in proportion to what is sold in the market, issuer
does not mind selling the shares at discount because that result in small loss on sold shares
compared to larger wealth gain on retained shares he experiences.
Divergence of Opinion
Section 1 uses elasticity of demand calculated as slope of least square best fits line
(Bagwell, 1992) from the actual demand schedules of 194 IPOs compiled after end of book
building period. Lower is the elasticity, more is divergence of opinion between investors. Section
2 uses the variable of elasticity to investigate the effect of divergence of opinion on the expected
underpricing.
Regression Results
Table 3 (Appendix) gives OLS regression results with underpricing as dependent variable
and other variables described above as independent variables.
Regression 1 finds Price Revision with respect to midpoint of range positively related
with underpricing and it is significant at 1 % level (p value=0.000). Adjusted R square is 8.7%.
Regression 2 examines Elasticity alone and finds its coefficient negative and statistically
significant at 1 % level (p value=0.000). Adjusted R square is 6.3%. Regression 3 examines
effect of both variables taken together. Adjusted R square is 10.5 %. Coefficients are significant
at 1 % for Price Revision and at 5% level for Elasticity. These two variables represent partial
adjustment of private information revealed during book building period and have strong
explanatory power. Regression 4 takes overhang with two variables from regression 3. The
coefficient of Overhang is positive and statistically significant at 5 % level. Adjusted R square is
12.8%. Overhang is public information and is available from prospectus filed with regulatory
authority much before book building process begins. In regression 5 additional variable, log of
issue size, is taken. This is inflation adjusted value. This is proxy for ex ante uncertainty. Smaller
issues are more risky. Its coefficient is negative and statistically significant at 1 % level (p
value=0.003). Adjusted R square is 16.2 %. Explanatory power of the model improves by 3.4%
by using this variable. Regression 6 takes log (1+age) as additional variable. It is also proxy for
ex ante uncertainty. Its relationship is positive, which is opposite to what is expected from
previous studies, which hypothesize that younger issues are more risky and underpriced more. .
It is statistically not significant (p value=0.742).
Regression 7 and regression 8 take two explanatory variables to capture the effect of
returns from stock market and previous IPO activity. Coefficient of Market Return is positive
and is statistically significant at 1 % level (p value=0.002). Coefficient of Volume is also
positive and is statistically significant at 10 % level (p=.067). Regression 8 has adjusted R square
of 20.6 %. It is an improvement by 4.8 % above the adjusted R square of regression 6. In India
number of days elapse before trading begins after announcement of issue price. Therefore
information on previous market returns is not available with investment banker, when issue price
Journal of Finance and Accountancy
Demand Curves and Partial Incorporation, Page 14
is declared and he cannot take this into consideration while setting the issue price. However
results do not differ from findings of Bradley and Jordon (2002), where trading starts on the
same day or next day of declaration of issue price.
Regression 9 and regression 10 take variance of aftermarket returns when trading in an
IPO starts. This information is not available to investment banker and it is proxy for ex ante
uncertainty. Higher value is proxy for riskier issues, which are underpriced more. Regression 9
uses variable “SD of Returns” and is explained as standard deviation of daily returns of 21
trading days after start of trading excluding first day of trading. This proxy has been widely used
in previous studies and its relationship with underpricing has been found to be positive. Present
study finds its coefficient to be positive and statistically significant at 5 % level. Improvement in
explanatory power is 1.8 % when this variable is added in regression 8. Regression 10 uses Log
High/Low as a substitute for SD of Returns. High and Low are high and low values of IPO
during first day of trading. The coefficient is positive and statistically significant at 1 % level
(p=0.000). Adjusted R square is 28.2%. By using this variable in regression adjusted R square
improves by 7.6 %- over and above the value in regression 8. Present study provides evidence
that this variable has much more explanatory power than standard deviation of returns and is a
better measure of variance of aftermarket returns and thus ex ante risk.
Summarizing the results of regression, present study finds that partial adjustment of
private information revealed during book building process has explanatory power of 10.5 %.
Explanatory power of model improves to 20.6 % when unadjusted public information of
overhang, issue size, age, market returns and previous IPO activity is taken into account. This
provides evidence that investment banker not only adjusts private information partially but does
so for public information too while setting the issue price. When additional risk proxy of Log
(H/L) is considered in the model, its explanatory power further improves to 28.2 %. Valuation
uncertainty or risk of an IPO can be only estimated partially by the investment bankers or the
investors. Therefore it is hard to arrive at a correct valuation. This is shown by an improvement
in the explanatory power of the model by adding proxy for risk in regression 10, which can be
known only after trading in an IPO begins.
Elasticity is another variable, which needs closer examination. Value of its coefficient is
negative and statistically significant at 5 % level. Cornelli and Goldreich (2003), Kandel et al.
(1999), and Liu, Wei, and Liaw (2001) have found this relation to be positive with underpricing.
Negative relation of this variable provides evidence of confirmation of Miller (1977) hypothesis.
Miller (1977) has argued that due to short selling constrains, price of IPO is governed by
valuation of optimistic investors and not by the mean valuation of potential investors.
Underwriter takes into account mean appraisal of typical investor while setting the offer price
and not the appraisal by optimistic investor, who constitutes the actual market of IPO. Thus he
sets the offer price lower than the expected valuation of optimistic investors, which results into
abnormal first day returns when issue start trading. More is the divergence of opinion, more will
be slope of demand curve (lesser the elasticity), and higher will be the equilibrium price of
security. Theoretically uncertainty is the variance of distribution of future values or returns and
divergence of opinion means the divergence of opinion on the distribution of the uncertainty
itself (Houge, Loughran, Suchanek, & Yan, 2001). In practice both the concepts go together and
one cannot be distinguished from the other. More is the uncertainty; higher will be divergence of
opinion.
Arbitrage is basic to efficient market hypothesis. Any constrains or restrictions on short
sales prevent the pessimistic investors to bring down the price of overvalued security and
Journal of Finance and Accountancy
Demand Curves and Partial Incorporation, Page 15
securities will continue to be traded above its fundamental value. By its very definition, IPO
market is a new issue market and inherently shorting is not possible. Negative relation of
coefficient of elasticity confirms Miller (1977) hypothesis and provides evidence that in the
absence of short selling in IPO market, IPOs valuations are driven by optimistic investors.
Houghe et al. (2000) use the percentage opening spread, time of first trade and flipping ratio as
proxies to divergence of opinion and find the positive relation of divergence of opinion with the
underpricing. Present study by investigating actual demand curves of 193 IPOs provides direct
evidence and confirms Millers (1977) hypothesis.
CONCLUSIONS
From investigation of demand curves in Indian IPO market, this study finds that issuer
and underwriters do not consider book building method as a placement mechanism only.
They use the information from demand curves in setting the offer price. Like Cornelli and
Goldreich (2003), it finds that information on price from bids is the most valuable information
and underwriter uses it almost fully in setting the issue price. Present study also takes revision of
price with respect to midpoint of the range (Hanley, 1993) as a proxy for partially adjusted
private information revealed during book building process. Cross sectional regression of this
information and different proxies for public information with underpricing, reveals that not only
private information but public information also is able to explain a great portion of underpricing
of IPOs. The findings are similar to what has been reported by Bradley and Jordon (2002) and
Loughran and Ritter (2002). It also finds that standard deviation of 21 days returns of IPO as a
measure of unresolved uncertainty has lesser explanatory power than Log (H/L) of first day
trading returns. The adjusted R square improves by 1.8 % when standard deviation is used. But
its value is improved by 7.6 % when Log (H/L) is used in its place. One reason can be the price
stabilization activities of underwriter in after market reduces the variation of stock returns. Use
of Log (H/L) variable needs further investigation in different IPO markets before this can find a
wider acceptance as a proxy for ex-ante uncertainty.
Present study also provides evidence that Indian IPO market is driven by optimistic
investors and confirms Miller ( 1977) hypothesis that in the absence or constrains on short
selling, stock prices reflect the valuation of optimistic investors , which is higher than the
average valuation of potential investors.
REFERENCES
Aggarwal, R. K., Krigman, L., & Womack, K. L. (2002). Strategic IPO underpricing,
information momentum, and lockup expiration selling. Journal of Financial Economics,
66(1), 105–137.
Bagwell, L. S. (1992). Dutch auction repurchases: An analysis of shareholder heterogeneity.
Journal of Finance, 47(1), 71–105.
Banerjee, A. V. (1992). A simple model of herd behavior. Quarterly Journal of Economics,
107(3), 797–817.
Beatty, R. P., & Ritter, J. R. (1986). Investment banking, reputation, and the underpricing of
initial public offerings. Journal of Financial Economics, 15(1/2), 213–232.

Journal of Finance and Accountancy
Demand Curves and Partial Incorporation, Page 16
Benveniste, L. M., & Spindt, P. A. (1989). How investment bankers determine the offer price
and allocation of new issues. Journal of Financial Economics, 24(2), 343–361.
Benveniste, L. M., & Wilhelm, W. J. (1997). Initial public offerings: Going by the book. Journal
of Applied Corporate Finance, 10(1), 98–108.
Bradley, D. J., & Jordan, B. D. (2002). Partial adjustment to public information and IPO
underpricing. Journal of Financial and Quantitative Analysis, 37(4), 595–616.
Chen, J., Hong, H., & Stein, J. C. (2002). Breadth of ownership and stock returns.
Journal of Financial Economics, 66(2/3), 171–205.
Cornelli, F., & Goldreich, D. (2003). Bookbuilding: How informative is the order book? Journal
of Finance, 58(4), 1415-1443.
Degeorge, F., Derrien, F., & Womack, K.L. (2010). Auctioned IPOs: The U.S. evidence. Journal
of Financial Economics, 98(2), 177-194.
Dolvin, S. D., & Jordan, B. D. (2008). Underpricing, overhang, and the cost of going public to
preexisting shareholders. Journal of Business Finance & Accounting, 35(3/4), 434–458.
Draho, J. (2001). The coordinating role of public information in hot market IPOs (Yale
University Working Paper).
Falconieri, S., Murphy, A., & Weaver, D. G. (2007). Underpricing and ex-post value uncertainty
(Working Paper Series WCRFS: 08-13).
Hanley, K. W. (1993). The underpricing of initial public offerings and the partial adjustment
phenomenon. Journal of Financial Economics, 34(2), 231–250.
Houge, T., Loughran, T., Suchanek, G., & Yan, X. (2001). Divergence of opinion, uncertainty,
and the quality of initial public offerings. Financial Management, 30(4), 5–23.
Ibbotson, R. G., & Jaffe, J. F. (1975). Hot issue markets. Journal of Finance, 30(4), 1027–1042.
Jenkinson, T., & Jones, H. (2004). Bids and allocations in European IPO bookbuilding. Journal
of Finance, 59(5), 2309–2338.
Jenkinson, T., Morrison, A. D., & Wilhelm, W. J. (2006). Why are European IPOs so rarely
priced outside the indicative price range? Journal of Financial Economics, 80(1), 185–
209.
Kandel, S., Sarig, O., & Wohl, A. (1999). The demand for stocks: An analysis of IPO auctions.
Review of Financial Studies, 12(2), 227–247.
Knopf, J. D., & Teall, J. L. (1999). The IPO effect and measurement of risk. Journal of Financial
and Strategic Decisions, 12(2), 51-58.
Lintner, J. (1965). The valuation of risk assets and the selection of risky investments in stock
portfolios and capital budgets. Review of Economics and Statistics, 47(1), 13–37.
Liu, Y-J., Wei, K. C. J., & Liaw, G. (2001). On the demand elasticity of initial public offerings:
An analysis of discriminatory auctions. International Review of Finance, 2(3), 151–178.
Ljungqvist, A. P., Jenkinson, T., & Wilhelm, W. J. (2003). Global integration in primary equity
markets: The role of U.S. banks and U.S. investors. Review of Financial Studies, 16(1),
63–99.
Ljungqvist, A., & Wilhelm, W. J. (2003). IPO pricing in the dot-com bubble. Journal of Finance,
58 (2), 723–752.
Loughran, T., & Ritter, J. R. (2002). Why don't issuers get upset about leaving money on the
table in IPOs? Review of Financial Studies, 15(2), 413-443.
Loughran, T., & Ritter, J. R. (2004). Why has IPO underpricing changed over time? Financial
Management, 33(3), 5–37.

Journal of Finance and Accountancy
Demand Curves and Partial Incorporation, Page 17
Milgrom, P. R., & Weber, R. J. (1982). A theory of auctions and competitive bidding.
Econometrica, 50(5), 1089-1122.
Miller, E. M. (1977). Risk, uncertainty, and divergence of opinion. Journal of Finance, 32(4),
1151–1168.
Oehler, A., Rummer, M., & Smith, P. N. (2004). IPO pricing and the relative importance of
investor sentiment – Evidence from Germany. Money Macro and Finance (MMF)
Research Group Conference 2004 No. 62.
Parkinson, M. (1980). The extreme value method for estimating the variance of the rate of return.
Journal of Business, 53(1), 61-65.
Ritter, J. R. (1984). The Hot issue market of 1980. Journal of Business, 57(2), 215–240.
Ritter, J. R., & Welch, I. (2002). A review of IPO activity, pricing and allocations. Journal of
Finance, 57(4), 1795-1828.
Rocholl, J. (2004). How does the underwriter match allocation and demand in IPO
bookbuilding? (Working Paper Series University of North Carolina at Chapel Hill).
Rock, K. (1986). Why new issues are underpriced. Journal of Financial Economics, 15(1/2), 187
–212.
Scholes, M. S. (1972). The market for securities: Substitution versus price pressure and the
effects of information on share prices. Journal of Business, 45(2), 179–211.
Sharpe, W. F. (1964). Capital asset prices: A theory of market equilibrium under conditions of
risk. Journal of Finance, 19(3), 425–442.
Shleifer, A. (1986). Do demand curves for stocks slope down? Journal of Finance, 41(3), 579–
590.
Welch, I. (1992). Sequential sales, learning and cascades. Journal of Finance, 47(2), 695-
732.
Journal of Finance and Accountancy
Demand Curves and Partial Incorporation, Page 18
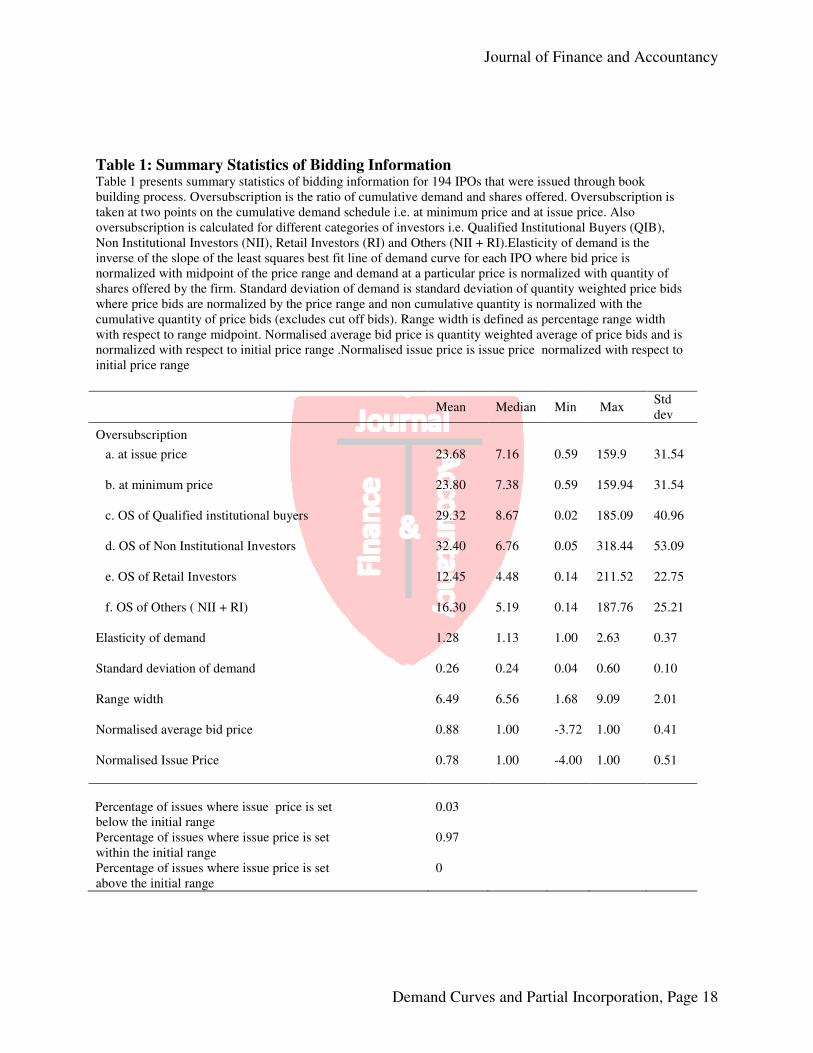
Table 1: Summary Statistics of Bidding Information Table 1 presents summary statistics of bidding information for 194 IPOs that were issued through book
building process. Oversubscription is the ratio of cumulative demand and shares offered. Oversubscription is
taken at two points on the cumulative demand schedule i.e. at minimum price and at issue price. Also
oversubscription is calculated for different categories of investors i.e. Qualified Institutional Buyers (QIB),
Non Institutional Investors (NII), Retail Investors (RI) and Others (NII + RI).Elasticity of demand is the
inverse of the slope of the least squares best fit line of demand curve for each IPO where bid price is
normalized with midpoint of the price range and demand at a particular price is normalized with quantity of
shares offered by the firm. Standard deviation of demand is standard deviation of quantity weighted price bids
where price bids are normalized by the price range and non cumulative quantity is normalized with the
cumulative quantity of price bids (excludes cut off bids). Range width is defined as percentage range width
with respect to range midpoint. Normalised average bid price is quantity weighted average of price bids and is
normalized with respect to initial price range .Normalised issue price is issue price normalized with respect to
initial price range
Mean Median Min Max Std
dev
Oversubscription
a. at issue price 23.68
7.16
0.59
159.9
31.54
b. at minimum price 23.80
7.38
0.59
159.94
31.54
c. OS of Qualified institutional buyers 29.32
8.67
0.02
185.09
40.96
d. OS of Non Institutional Investors 32.40
6.76
0.05
318.44
53.09
e. OS of Retail Investors 12.45
4.48
0.14
211.52
22.75
f. OS of Others ( NII + RI) 16.30
5.19
0.14
187.76
25.21
Elasticity of demand 1.28
1.13
1.00
2.63
0.37
Standard deviation of demand 0.26
0.24
0.04
0.60
0.10
Range width 6.49
6.56
1.68
9.09
2.01
Normalised average bid price 0.88
1.00
-3.72
1.00
0.41
Normalised Issue Price 0.78
1.00
-4.00
1.00
0.51
P
Percentage of issues where issue price is set
below the initial range
0.03
Percentage of issues where issue price is set
within the initial range
0.97
Percentage of issues where issue price is set
above the initial range
0
Journal of Finance and Accountancy
Demand Curves and Partial Incorporation
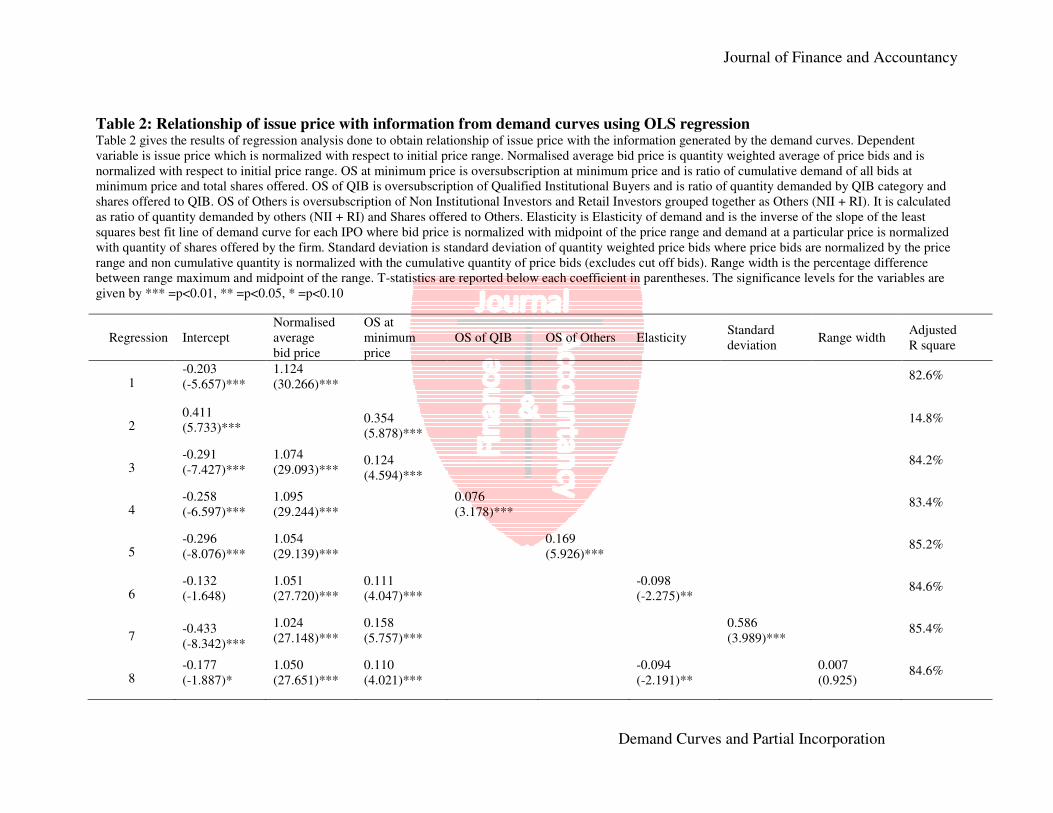
Table 2: Relationship of issue price with information from demand curves using OLS regression Table 2 gives the results of regression analysis done to obtain relationship of issue price with the information generated by the demand curves. Dependent
variable is issue price which is normalized with respect to initial price range. Normalised average bid price is quantity weighted average of price bids and is
normalized with respect to initial price range. OS at minimum price is oversubscription at minimum price and is ratio of cumulative demand of all bids at
minimum price and total shares offered. OS of QIB is oversubscription of Qualified Institutional Buyers and is ratio of quantity demanded by QIB category and
shares offered to QIB. OS of Others is oversubscription of Non Institutional Investors and Retail Investors grouped together as Others (NII + RI). It is calculated
as ratio of quantity demanded by others (NII + RI) and Shares offered to Others. Elasticity is Elasticity of demand and is the inverse of the slope of the least
squares best fit line of demand curve for each IPO where bid price is normalized with midpoint of the price range and demand at a particular price is normalized
with quantity of shares offered by the firm. Standard deviation is standard deviation of quantity weighted price bids where price bids are normalized by the price
range and non cumulative quantity is normalized with the cumulative quantity of price bids (excludes cut off bids). Range width is the percentage difference
between range maximum and midpoint of the range. T-statistics are reported below each coefficient in parentheses. The significance levels for the variables are
given by *** =p<0.01, ** =p<0.05, * =p<0.10
Regression Intercept
Normalised
average
bid price
OS at
minimum
price
OS of QIB OS of Others Elasticity Standard
deviation Range width
Adjusted
R square
1 -0.203
(-5.657)***
1.124
(30.266)***
82.6%
2 0.411
(5.733)***
0.354
(5.878)***
14.8%
3 -0.291
(-7.427)***
1.074
(29.093)***
0.124
(4.594)***
84.2%
4 -0.258
(-6.597)***
1.095
(29.244)***
0.076
(3.178)***
83.4%
5 -0.296
(-8.076)***
1.054
(29.139)***
0.169
(5.926)***
85.2%
6 -0.132
(-1.648)
1.051
(27.720)***
0.111
(4.047)***
-0.098
(-2.275)**
84.6%
7 -0.433
(-8.342)***
1.024
(27.148)***
0.158
(5.757)***
0.586
(3.989)***
85.4%
8 -0.177
(-1.887)*
1.050
(27.651)***
0.110
(4.021)***
-0.094
(-2.191)**
0.007
(0.925)
84.6%
Journal of Finance and Accountancy
Demand Curves and Partial Incorporation
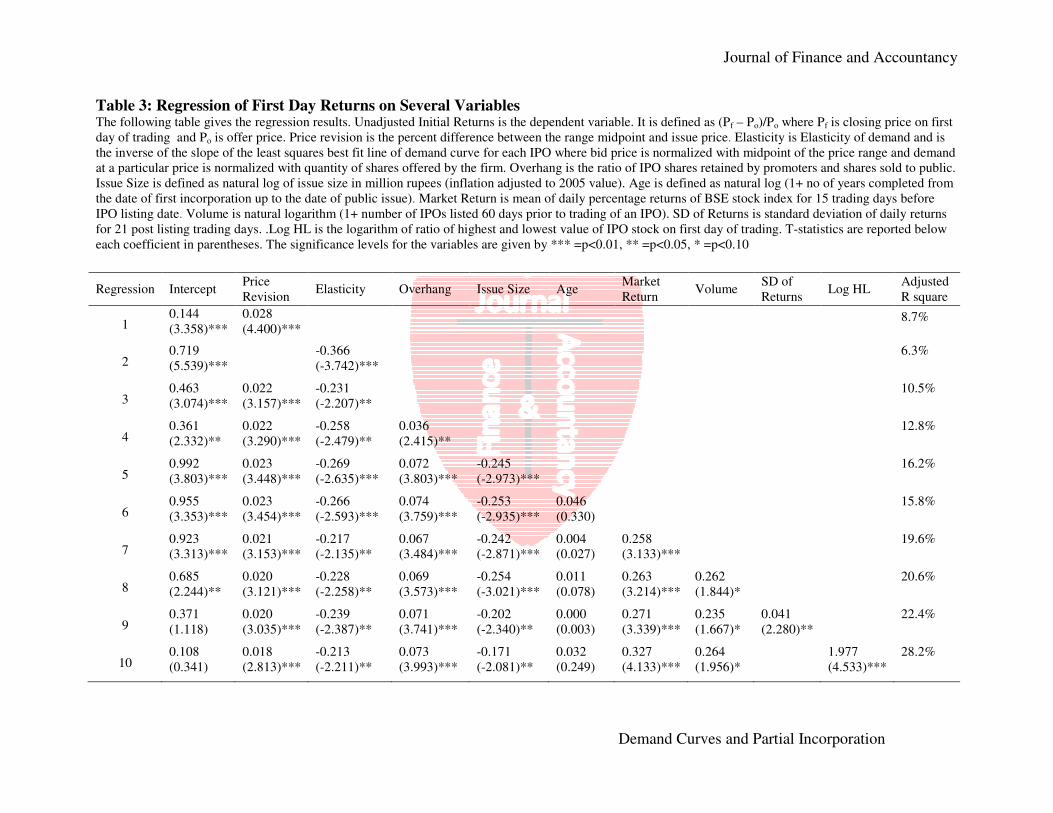
Table 3: Regression of First Day Returns on Several Variables The following table gives the regression results. Unadjusted Initial Returns is the dependent variable. It is defined as (Pf – Po)/Po where Pf is closing price on first
day of trading and Po is offer price. Price revision is the percent difference between the range midpoint and issue price. Elasticity is Elasticity of demand and is
the inverse of the slope of the least squares best fit line of demand curve for each IPO where bid price is normalized with midpoint of the price range and demand
at a particular price is normalized with quantity of shares offered by the firm. Overhang is the ratio of IPO shares retained by promoters and shares sold to public.
Issue Size is defined as natural log of issue size in million rupees (inflation adjusted to 2005 value). Age is defined as natural log (1+ no of years completed from
the date of first incorporation up to the date of public issue). Market Return is mean of daily percentage returns of BSE stock index for 15 trading days before
IPO listing date. Volume is natural logarithm (1+ number of IPOs listed 60 days prior to trading of an IPO). SD of Returns is standard deviation of daily returns
for 21 post listing trading days. .Log HL is the logarithm of ratio of highest and lowest value of IPO stock on first day of trading. T-statistics are reported below
each coefficient in parentheses. The significance levels for the variables are given by *** =p<0.01, ** =p<0.05, * =p<0.10
Regression Intercept Price
Revision Elasticity Overhang Issue Size Age
Market
Return Volume
SD of
Returns Log HL
Adjusted
R square
1 0.144
(3.358)***
0.028
(4.400)***
8.7%
2 0.719
(5.539)***
-0.366
(-3.742)***
6.3%
3 0.463
(3.074)***
0.022
(3.157)***
-0.231
(-2.207)**
10.5%
4 0.361
(2.332)**
0.022
(3.290)***
-0.258
(-2.479)**
0.036
(2.415)**
12.8%
5 0.992
(3.803)***
0.023
(3.448)***
-0.269
(-2.635)***
0.072
(3.803)***
-0.245
(-2.973)***
16.2%
6 0.955
(3.353)***
0.023
(3.454)***
-0.266
(-2.593)***
0.074
(3.759)***
-0.253
(-2.935)***
0.046
(0.330)
15.8%
7 0.923
(3.313)***
0.021
(3.153)***
-0.217
(-2.135)**
0.067
(3.484)***
-0.242
(-2.871)***
0.004
(0.027)
0.258
(3.133)***
19.6%
8 0.685
(2.244)**
0.020
(3.121)***
-0.228
(-2.258)**
0.069
(3.573)***
-0.254
(-3.021)***
0.011
(0.078)
0.263
(3.214)***
0.262
(1.844)*
20.6%
9 0.371
(1.118)
0.020
(3.035)***
-0.239
(-2.387)**
0.071
(3.741)***
-0.202
(-2.340)**
0.000
(0.003)
0.271
(3.339)***
0.235
(1.667)*
0.041
(2.280)**
22.4%
10 0.108
(0.341)
0.018
(2.813)***
-0.213
(-2.211)**
0.073
(3.993)***
-0.171
(-2.081)**
0.032
(0.249)
0.327
(4.133)***
0.264
(1.956)*
1.977
(4.533)***
28.2%