Embed Size (px)
Citation preview

DELL AND THE VALUE OF DENSITY
A Principled Technologies white paper commissioned by Dell Inc.

TABLE OF CONTENTS
Table of contents ..................................................................................... 2
Executive summary .................................................................................. 4
The value of density ............................................................................5
Density – Top 5 benefits .....................................................................6
What does density mean? ........................................................................ 8
Logical density – Consolidation via virtualization ...............................8
Physical density - The density spectrum .............................................9
The density decision - Trends ................................................................. 10
Density benefits ..................................................................................... 11
Consolidation efficiencies and performance benefits ..................... 11
Generational improvements that encourage density ..................... 14
Physical space, power, and cooling savings ..................................... 16
Infrastructure savings ...................................................................... 17
Software savings .............................................................................. 25
Dell offerings that create value from density .......................................... 25
Quarter-height, two-socket blade: Dell PowerEdge M420 blade server ............................................................................................... 27
Compute nodes for hyperscale datacenters: Dell PowerEdge C8220 ......................................................................................................... 28
Half-height, two-socket blade: Dell PowerEdge M620 blade server 29
Full-height, four-socket blade: Dell PowerEdge M820 blade server 30
Two-socket, 1U rack server: Dell PowerEdge R620 ......................... 31
Four-socket, 2U rack server: Dell PowerEdge R820 ........................ 31
Two-socket, 2U rack server: Dell PowerEdge R720 ......................... 32
Common myths about high density ........................................................ 32
Myth #1: Greater logical density increases risk of downtime ......... 32
Myth #2: Greater logical density makes environments more difficult to manage ........................................................................................ 33
Myth #3: Greater physical density significantly impedes compute efficiency .......................................................................................... 34
Myth #4: Greater physical density is expensive .............................. 35
Use cases - high density is valuable ......................................................... 36
Application density – The Enterprise server refresh ....................... 37
Physical density - Co-location and hosted space ............................. 37
Physical density - Portability ............................................................ 38
Physical density – HPC computing ................................................... 39
Engaging with Dell ................................................................................. 40
Summing it all up ................................................................................... 40
Appendix A – Server Infrastructure savings Details ................................. 42

Calculating chassis and rack count and costs for each solution ...... 42
Calculating power density requirements for each rack ................... 42
Estimating cooling equipment capital costs and building costs ...... 43
Calculating energy costs for power and cooling .............................. 43
Switch and cable costs ..................................................................... 43
Higher-density Dell PowerEdge R820 rack servers save on switch and cable costs over Dell PowerEdge R720 rack servers ................. 44
Higher-density Dell PowerEdge M420 blade servers save on switch and cable costs over Dell PowerEdge M620 blade servers ............. 45
Higher-density Dell PowerEdge M420 blade servers saves on switch and cable costs over Dell PowerEdge R720 rack servers ................. 46
Appendix B – About the CiRBA study ...................................................... 48
Appendix C – Recent PT studies supporting consolidation and density benefits ................................................................................................. 50
References ............................................................................................. 52
About Principled Technologies ............................................................... 54

A Principled Technologies white paper 4 Dell and the value of density
EXECUTIVE SUMMARY
IT buyers face a dizzying array of choices, one of which
revolves around a core issue in datacenter design – how
physically dense should their datacenter be, and why? Today,
businesses are implementing high-density computing solutions,
such as the ultra-compact quarter-height Dell PowerEdge
M420, to maximize return on investment and save
management costs. Trends indicate that organizations will seek
even higher densities in the future, using two approaches – a
physical compaction of the datacenter and a logical
compression achieved via virtualization. These related trends,
coupled with the move towards greater power (kW) densities
per rack, point to a dense compute future. Increasing physical
measures of density, such as sockets per U or cores per rack,
have the potential to improve the bottom line for companies.
Platforms such as the Dell PowerEdge M420 blade,
which compresses up to 512 compute cores in a single 10U
blade chassis, can help you realize this potential. For high-
performance computing (HPC) environments or datacenters
with a restricted physical footprint, this compression of
compute power into smaller space is ideal. This is true even for
customers who have already implemented blade server
solutions – collapsing existing medium-density environments
into smaller volumes can provide further advantages, such as
providing the opportunity increased density with denser blade
servers and new blade SAN storage technologies with no
additional chassis costs.
In this paper, we define high density, discuss its
relationship to the driving forces of virtualization and
consolidation, and offer cost savings examples from various
studies. We look at the entire density spectrum, including both
rack servers and blade compute nodes, highlighting specifically
the Dell hardware options and the enabling Dell technologies,
such as iDRAC and Dell Lifecycle Controller, which make density
with Dell a compelling choice.

A Principled Technologies white paper 5 Dell and the value of density
The value of density
Doing more with less is a requirement if you want your business to thrive.
Growing your business up to the sky is possible with ever-improving technology, which
allows you to do more with less.
But growing a business is like growing a city. You reach boundaries where you
can no longer grow outward—so you must either build up, or increase the usage density
for the property you already have. In a city, that means building taller, more space-
efficient places for people and businesses.
In a datacenter, you eventually face a similar decision—how do you increase
your usage density without expanding physical datacenter space? With high-density
computing infrastructure, you can shrink your server footprint and increase both your
compute efficiency and costs savings for power and cooling.

A Principled Technologies white paper 6 Dell and the value of density
Density – Top 5 benefits
What exactly is high density? At a physical level, it involves designing, building,
and implementing compute infrastructure to occupy the smallest amount of physical
space possible. Widening this definition beyond just physical compute power per square
foot or sockets per rack unit (U), we can also define density from application and
systems management perspectives. Using consolidation as a vehicle, companies can
increase their logical density by collapsing many workloads and applications from legacy
low-density solutions to fewer highly dense solutions using virtual machines (VMs). By
reducing the number of physical servers and increasing the amount of work performed
in less physical space, businesses can realize savings in management time, datacenter
space, power and cooling costs, and even in systems management time and budget. We
discuss and present multiple recent studies showing the benefits of consolidation in the
Other consolidation studies to consult section below.
Benefits of increased server densities and
consolidated workloads include the following:
Consolidation efficiencies and
performance benefits: Many studies
show that simple consolidation
exercises not only have the benefits
listed below, but have the potential
to dramatically increase
performance for the organization.
Capitalizing on generational
improvements in hardware and systems management: Generational
improvements in hardware let businesses take advantage of
consolidation through virtualization and increase density in server
deployments. Processor, RAM, and storage technologies all are
improving at such a pace that updating hardware alone enables
consolidation. Also, advances in firmware and software allow system
administrators to manage larger units of work in a more streamlined
manner, resulting in potential systems management savings.
Physical space, power, and cooling savings: High-density virtualized
solutions decrease the number of physical servers, which increases
available floor space, allowing companies to utilize physical space more
efficiently and free up area for new investments. As the physical

A Principled Technologies white paper 7 Dell and the value of density
footprint of servers decreases, opportunities for power and cooling
efficiencies increase.
Infrastructure savings: High-density consolidated solutions can reduce
build-out costs, as less square footage and cabling are required for
denser solutions that require fewer physical servers.
Software license savings: Per-processor licensing models favor placing
the same software on smaller numbers of physical servers. Doing this
intelligently can have a large impact on software licensing costs in the
datacenter.
Datacenter managers and virtualization engineers in a variety of situations can
realize these benefits, and many find that consolidation through virtualization and high-
density computing targets the problems they face.
Datacenter managers, IT directors, and organizations as a whole face a common
challenge without a simple solution. As server-based compute demands grow, there is
finite physical space to grow out existing datacenters, and the cost to build new
datacenter space is sometimes prohibitive. Recent studies show that datacenter costs
range from $1,2001 to $1,500 per square foot.2 Properly employing consolidation and
high-density practices allow you to avoid expanding your datacenter footprint as your
server count or business demands increase.
All sizes of organizations can benefit from consolidating the workloads of legacy
servers onto more powerful systems and climbing the density ladder as their
requirements and resources allow. In this paper, we show that whether you are moving
from a small, tower-based server environment to a single blade chassis or from a legacy
rack-server farm to a high-density compute cluster, you can potentially reduce costs – in
time, money, and power – for your organization by maximizing the density of your
datacenter and applications.

A Principled Technologies white paper 8 Dell and the value of density
WHAT DOES DENSITY MEAN?
For the purpose of this paper, we define density as the amount of work per rack
unit a given environment can perform. Put differently, “The amount of work done per
given amount of datacenter real estate is a function of the physical density of the
servers as well as the logical density of the workloads within those servers.”3 Increasing
density by this definition is possible by attacking the problem from two angles:
increasing logical density through virtualization and increasing physical density by
selecting servers with more processor cores that take up less physical space. When
combined, these two approaches result in a powerful savings strategy for organizations.
Logical density – Consolidation via virtualization
Through virtualization,
businesses have many different
options for replacing older servers
with new servers and virtualization
software. Several approaches are
possible to perform this transition,
and the right approach will depend
in part on many factors, including
performance requirements,
current application deployments,
and budget, and may include more
than one of the following:
Physical-to-virtual migration (P2V) – in a P2V migration, IT staff migrate the
operating system, applications, and data from legacy physical servers to
virtual machines hosted on one or more servers running virtualization
software.
Virtual-to-virtual migration (V2V) – in a V2V migration, IT staff migrate the
operating system, applications, and data from virtual machines on legacy
physical servers to virtual machines hosted on one or more servers running
virtualization software.
Application migration – in a partial migration, IT staff migrate legacy
applications, such as Microsoft® Exchange Server 2007 or Microsoft SQL
Server® 2008, from older legacy servers to virtual machines on new servers.
This type of migration does not include moving to new versions of those
applications.

A Principled Technologies white paper 9 Dell and the value of density
Application migration with application upgrades – in a full migration, in
addition to migrating from older legacy servers to new Dell PowerEdge
servers, IT staff also upgrade the application stack. For example, IT staff may
move application data from SQL Server 2008 R2 hosted on legacy servers to
virtualized SQL Server 2012 instances on new servers. This type of migration
allows businesses to take full advantage of new hardware and software and
maximize the consolidation ratio.
Physical density - The density spectrum
To increase density, one option is to logically consolidate legacy physical
servers’ workloads on newer, more powerful servers - either as VMs or by collapsing
multiple workloads onto a non-virtualized environment. Approaching the issue from a
different perspective, datacenter managers and IT buyers can also choose to increase
physical density by increasing processing power available in a certain amount of space,
often described as processing power per U of rack space or processing power per square
foot.
You’ve likely heard terms such as high density, low density, rack server, blade
server, and converged solutions before, and you may know what they mean at a high
level. But what do they mean, practically speaking, in a datacenter environment?
Datacenter density ranges from tower servers to highly dense compute nodes in
hyperscale server farms. While not every organization requires the densest solution
available, moving up the physical density spectrum has the potential to save businesses
time related to managing infrastructure, power consumption, and other associated
costs.
Low-density environments, such as small server closets or rooms common to
small businesses, frequently use less expensive tower servers to meet their computing
needs. Generally, these server infrastructures may not require additional equipment for
power supplies or cooling, but these larger, less dense servers have a large physical
footprint and may begin to take up a great deal of physical space as computing demand
increases and the organization grows.
To avoid the cost of adding racks and any related switches and cables, an
organization can instead choose to move up the density spectrum and replace their
cumbersome servers with denser servers that pack similar processing power into just 2U
of space. To realize even further savings, it’s possible for businesses to invest in 1U rack
servers.

A Principled Technologies white paper 10 Dell and the value of density
When the compute density that rack servers provide is no longer enough, blade
servers can increase density even further. Blade servers fit into blade chassis and offer
greater flexibility for configuring a datacenter environment, allowing you to use
integrated networking and storage or separate SAN storage with top-of-rack (ToR)
switches. Like rack servers, blade servers come in different sizes: Dell offers blades that
fill a whole chassis slot (8 per 10U), blades that fill half a chassis slot (16 per 10U), and
blades that fill a quarter of a chassis slot (32 per 10U).
The most compute-heavy infrastructures tend to require the most compute-
compact solutions available, such as ultra-dense PowerEdge M420 blade servers, which
can run many workloads in a single chassis. This level of server density is frequently
found in server farms and high-performance computing environments, where increasing
density can reduce the number of buildings that house servers, for impressive savings.
Climbing the density spectrum and changing server types isn’t the only way to
maximize the density of your datacenter. Same-sized servers do not all utilize the same
number of processors or cores, so upgrading and fitting more cores into the same
amount of space will also provide you with more computing power per unit of space, for
a more dense solution.
Clearly, increasing server density can deliver savings in a number of ways, from
reducing the number of racks or chassis, switches, and cables to manage to maximizing
and saving on datacenter space, both of which can affect an organization’s bottom line.
THE DENSITY DECISION - TRENDS
As servers continue to make strides in both performance capacity and power
efficiency, businesses turn to different technologies to increase server utilization and
maximize return on investment for server capital expenditures. One such technology,
virtualization, has facilitated server consolidation, which increases server density for
businesses regardless of size or the number of servers in deployment. A 2012 survey, in
fact, showed that x86 virtualization crossed a tipping point in 2012, with 51 percent of
servers now virtualized.4 That same study suggests the percentage of virtualized x86
servers will only increase, with more than two-thirds of those responding stating they
have not yet virtualized their datacenter enough.
This industry trend in server computing can benefit both the emerging business
concerned with datacenter expansion and build-out costs and the large enterprise with
thousands of servers. Recent 2012 IDC data on server shipments show a growing trend
in increased density in server deployments, and IDC expects blade servers and density-
optimized solutions to continue to gain market share: “Together, blade and density

A Principled Technologies white paper 11 Dell and the value of density
optimized servers grew 15 percent in annual revenue and now represent 22 percent of
the market. These modular form factors are expected to continue to gain adoption, with
blades targeting virtualized environments in enterprises and density optimized servers
targeting large-scale homogeneous environments in datacenters.”5
Organizations are also increasing physical density by investing in more dense
servers. Data from the Uptime Institute in 2012 shows this trend occurring year over
year (See Figure 1).6
Figure1: Current and designed physical density trends.
DENSITY BENEFITS
Consolidation efficiencies and performance benefits
High-density server deployments provide businesses of all sizes with benefits
through server consolidation. An emerging business replacing a larger quantity of tower
or rack servers with just a single rack of servers or single chassis of blade servers, for
example, can benefit immediately by reducing the number of physical servers that IT
staff has to manage. Increasing IT management efficiency for the emerging business can
reduce the ongoing operational expenses of growing IT demands.7
For the larger enterprise, consolidation to higher density servers can have a
similar impact on a larger scale, potentially reducing not only the number of physical
servers that IT staff has to manage, but possibly even facilitating consolidation of
physical locations of servers that the larger enterprise and its IT staff have to support.
For example, in a 5:1 server consolidation where one Dell PowerEdge R720 server

A Principled Technologies white paper 12 Dell and the value of density
replaces 5 legacy rack servers, annual administration costs could drop as much as 82
percent.8
For both emerging and established businesses, server consolidation can also
lead to dramatic savings for application licensing costs. For example, the same study,
looking at a sample 5:1 server consolidation, found that businesses could realize savings
of up to 60 percent for SQL Server licensing. The savings in the first year alone from
migrating to per-core licensing in SQL Server 2012 Enterprise Edition from per-processor
licensing in SQL Server 2008 R2 Enterprise Edition would easily pay back the initial
acquisition costs.
Recent studies proving the benefits of increased logical density
When you need additional application server capacity, simply adding more
physical servers can create headaches rather than alleviating them. Where will the new
servers go? What effect does adding physical servers have on power, cooling,
infrastructure, and IT management costs? Instead of adding capacity through more
physical servers, consolidation through virtualization increases application server
capacity while also providing lower operational costs, as the specific examples below
show.
Increasing Exchange Server capacity
First, we consider a business that needs to add additional capacity for Microsoft
Exchange Server. Moving to a hosted Exchange environment or increasing the number
of physical servers may be appealing options, but both can negatively affect the bottom
line in both the short and long term. In a recent study in the Principled Technologies
labs, we found that a Dell PowerEdge R720xd could handle four times the number of
Microsoft Exchange workloads of an HP ProLiant DL380 G6, while also offering lower
response times.9 Consolidating four HP ProLiant DL380 G6 to just one Dell PowerEdge

A Principled Technologies white paper 13 Dell and the value of density
R720xd offered not only lowered response times, but could reduce three-year TCO by as
much as $19,028 and pay back the initial investment and migration in as little as 19
months. This includes saving as much as 77 percent annually in server administration
costs and 67 percent annually in energy costs. While such a consolidation would
improve the bottom line of any size business, the larger the scale of consolidation, the
greater the savings.
Increasing SQL Server capacity with a full migration and application upgrade
Another recent PT study analyzed a sample business running out of capacity for
a Microsoft® SQL Server® deployment. We found that adding servers would increase
capacity, but would also increase operational expenses on top of the initial cost of the
new servers, enough to be prohibitive. Server consolidation provides an opportunity to
increase server capacity while lowering operational expenses. In the Principled
Technologies labs, we found that Dell PowerEdge R720xd could support five times the
SQL Server workload of a Dell PowerEdge 2950 III.10 With a 5:1 consolidation ratio, a
business moving from five Dell PowerEdge 2950 III servers to one Dell PowerEdge
R720xd could lower three-year TCO by as much as $151,747.94 when also migrating to
Microsoft SQL Server 2012 and its per-core licensing. In this scenario, where the
operational savings due to lower Microsoft SQL Server licensing costs are significant, a
business could achieve payback in as little as 5 months. Even when omitting Microsoft
SQL Server migration and its related costs, a business could payback the initial
investment in as little as 17 months. The Dell PowerEdge R720xd solution could save a
business as much as 82 percent annually in server administration costs and 75 percent
annually in energy costs.
Increasing SharePoint Server capacity by consolidating early
What about a business that only recently purchased new servers but is already
running out of capacity for a SharePoint Server deployment? In the Principled
Technologies labs, we compared a Dell PowerEdge R720 running SharePoint 2010 to an
HP ProLiant DL380 G7 running SharePoint 2007.11 We found the Dell PowerEdge R720
delivered 63.4 percent greater total performance, measured in requests per second.
When replacing two HP ProLiant DL380 G7 servers with one Dell PowerEdge R720, a
business in this scenario could achieve payback in just 36 months. While replacing
servers relatively early in the lifecycle may not be ideal, a 2:1 server consolidation can
still be a worthwhile investment. Moving to the Dell PowerEdge R720 could decrease
total three-year operational costs by 50 percent, including a 55 percent reduction in
server administration costs.

A Principled Technologies white paper 14 Dell and the value of density
Replacing aging infrastructure to minimize unplanned downtime
For a business that needs to replace aging infrastructure, concern over the cost
of new server hardware weighs against the cost of unplanned downtime from an
increasingly likely server failure. In this scenario, the business also faces the task of
consolidating a number of non-virtualized servers. In the Principled Technologies labs,
we found that virtualizing eight 6-year-old HP ProLiant DL360 G4p servers onto a single
Dell PowerEdge R720 could deliver 412.4 percent better performance for each database
workload.12 Even when also upgrading to Microsoft Windows Server 2012 and Microsoft
SQL Server 2012 in the consolidation, a business could lower three-year TCO by as much
as $64,035.13 Moving from Windows Server 2003 and SQL Server 2005 may be seem like
a costly and daunting task, but replacing legacy servers running outdated software with
the Dell PowerEdge R720 can be a smart investment.
Other consolidation studies to consult
The benefits you can reap by maximizing virtual server density with
consolidation via virtualization are many. At PT, we have performed a number of studies
that show these performance and cost benefits with Dell PowerEdge servers such as the
PowerEdge M420 and PowerEdge M620. For a list of studies supporting consolidation
and density on Dell, see Appendix C.
Generational improvements that encourage density
Hardware advancements
In a year, or even months sometimes, hardware can improve in ways that vastly
increases density potential. For example, in a Principled Technologies study, we found
that a virtualized Dell PowerEdge R720xd with five virtual machines running Microsoft
SQL Server 2012 delivered 461.7 percent more total performance than a legacy Dell
PowerEdge 2950 III running SQL Server 2008.14 The potential savings of increasing server
density and replacing five Dell PowerEdge 2950 III servers with one Dell PowerEdge
R720xd are enormous. We found that the potential savings in hardware, maintenance,
power, and cooling costs in this scenario can lower total cost of ownership (TCO) over
three years by as much as $151,747.94. The 5:1 server consolidation in this scenario can
pay back the investment in hardware and the migration effort in as little as 5 months.15
Dell also provides the performance capacity needed for increasing density in
blade server deployments. For example, in a previous study by Principled Technologies,
we found that a Dell PowerEdge M620 was able to support up to 50 percent more
virtual machines than the previous-generation HP ProLiant BL490.16 Even while
supporting more virtual machines, the Dell PowerEdge M620 and its new power-saving

A Principled Technologies white paper 15 Dell and the value of density
features offered 11.7 percent better performance per watt than the HP ProLiant BL490
did. According to that analysis, purchasing and running two new Dell PowerEdge M620
servers could give businesses a lower three-year TCO than running three HP ProLiant
BL490 servers, with the Dell PowerEdge M620 solution providing payback within 25
months by consolidating the workload of the HP ProLiant BL490 solution.
Firmware and software advancements contribute to systems management
advantages
Recent advances in systems management and power capping have changed
how IT professionals work by simplifying the processes they need to follow in order to
maintain their servers as well as unlocking more of the capabilities that are within the
servers themselves. This has changed the impact of massively scaling out the number of
compute nodes in a datacenter. While this previously required additional IT staff to take
on the increased workload, adding compute nodes is now of very little consequence in
the amount of daily work required by a company’s IT department.
Traditionally, maintenance tasks such as configuring a server and updating the
firmware took several hours for each system in the datacenter. BIOS settings, RAID
controller settings, and several network adapters per unit needed to be configured by
hand while directly connected to the server by an IT professional physically present in
the datacenter. Dell servers use Integrated Dell Remote Access Controller 7 (iDRAC7)
with Lifecycle Controller to speed up the management process.17 IT administrators can
connect to a system with no OS agent required; the connection to the iDRAC7 Enterprise
is directly through the hardware, out of band. Such management tools allow IT staff to
manage and patch hardware with ease. The iDRAC GUI allows administrators to connect
to systems remotely and broadcast configuration settings to other systems with the
push of a button. Administrators can quickly update firmware and drivers, as the
Lifecycle Controller can pull them automatically from the Dell Repository Manager site.
A recent survey found that the number one concern of datacenter managers
was the issue of running out of available power capacity in the near future.18 Technology
such as Intel® Node Manager provides a viable option to maximize existing power
capacity through the power capping capabilities it provides in the latest release of Dell
OpenManage™ Power Center.
The Dell OpenManage Power Center provides IT professionals the ability to
manage their power budget from a system, rack, row, and room level all from one
integrated interface using a predetermined rule-based approach. One would assume
that if a system’s power is capped significantly then performance would be negatively
affected, but this is not the case. A recent evaluation of Dell OpenManage Power Center

A Principled Technologies white paper 16 Dell and the value of density
showed that power usage on a server can be capped to 80 percent of its original
maximum, even at full CPU utilization, and experience just a 1 percent decrease in
system performance.19 This opens up a significant amount of power capacity that was
previously unavailable in the datacenter. Equipped with these powerful new power
management tools, datacenter managers can now confidently approach the idea of
moving to a denser, virtualized consolidation solution without the fear of running out of
available power capacity.
All Dell current generation servers come with the iDRAC7 with Lifecycle
Controller and other management features that can speed up your move to a high-
density solution
Physical space, power, and cooling savings
Datacenter space is extremely expensive, whether you rent space or have an in-
house datacenter. This expense is not just a question of real estate square-footage, but
the support infrastructure required to power, cool, and physically support the needs of
thousands of rack-mount cabinets.
On a massive scale, a 2012 example of this concept in action is the Federal
Government initiative to reduce their physical datacenter footprint: "As a result of the
Federal Datacenter Consolidation Initiative (FDCCI), the number of government
datacenters will shrink sharply from its current level of about 3,000 centers to about
1,800 by 2015 -- a reduction of 40 percent. Eventual savings could be in the range of US
$5 billion.”20
On a smaller scale, a coarse estimation method is to use synthetic
benchmarking tools to estimate workload consumption of different form factor servers.
Using the SPECint_rate2006 benchmark as a standard comparison point, the Dell
PowerEdge M420, a high–density, two-socket quarter-height blade server, provides two
times the performance of the Dell PowerEdge R900, a four-socket, 4U server.21, 22
Considering that you can fit 128 PowerEdge M420 servers into one 42U server rack, this
means that one rack of PowerEdge M420 blades could replace 26 racks of PowerEdge
R900 servers (at 10 per rack) under conditions similar to the SPECint workload. Using
SPECfp_rate2006 as the comparison point, the consolidation ratio jumps to a 39 to 1
advantage for the highly dense M420, which would allow you to reclaim an incredible
amount of physical space.23, 24
Power and cooling savings
Reducing the number of physical servers through consolidation can also have
significant benefits in power and cooling requirements for businesses of all sizes. As

A Principled Technologies white paper 17 Dell and the value of density
Figure 2 shows, in our sample 5:1 server consolidation ratio, annual energy costs could
drop by up to 76 percent.25
Figure 2: Sample annual energy cost comparison for a consolidated solution vs. running multiple physical legacy servers.
By virtualizing applications on a smaller number of servers, businesses can
increase power and cooling efficiencies by increasing server utilization in the datacenter
instead of powering a higher number of underutilized servers. For the large enterprise
with servers on multiple sites, server consolidation could potentially reduce the number
of physical locations to power and cool.
Using higher-density techniques, such as pressurized hot aisle/cold aisle cooling,
sensors, dampers, fresh air cooling, and so on, air flow can be used much more
efficiently than when using computer room air conditioners (CRACs). Other high-density
cooling methods include water-cooled rack systems, which have the potential to reduce
floor space usage significantly.
Infrastructure savings
Building Infrastructure savings
As organizations build new datacenters, they are choosing to move to physically
dense solutions. Multiple studies have pointed to the lower cost to build and operate
high-density datacenters compared to less dense datacenters.
A study from Emerson Network Power compares the cost for a 2,000 kW IT load
at a low density of 400 racks averaging 5kW each versus a high density of 100 racks
averaging 20kW each. They allowed 25 square-feet per rack and compared the costs for
$0
$500
$1,000
$1,500
$2,000
$2,500
$3,000
Dell PowerEdge R720xd solution Dell PowerEdge 2950 III solution
US
do
llars
Annual energy costs
(lower numbers are better)

A Principled Technologies white paper 18 Dell and the value of density
the resultant 10,000-square-foot low-density datacenter and the 2,500-square-foot
high-density datacenter.26 As Figure 3 shows, the study found that a high-density
datacenter could provide well over $3 million in savings over 5 years compared to a low-
density datacenter, using the example above.
Low density High density
Difference (bolded = savings for high density)
Building capital costs at $250 per square foot
$2,500,000 $625,000 $1,875,000
Rack capital costs at $2,500 per rack
$1,000,000 $250,000 $750,000
Cooling capital costs $830,000 $1,900,000 $1,070,000
Cooling operating costs (1 year)
$946,080 $525,600 $420,480
Total net savings of high density design
$1,975,480
5-year total net savings of high density
$3,657,400
Figure 3: Example savings of a high-density solution over 5 years, as reported from Emerson Network Power.
An earlier Intel study had similar findings – lower capital build costs and rack
costs, higher cooling capital costs, and lower cooling operating costs created an overall
large total net savings for the high density solution they analyzed.
The study compared costs for a low-density, 6.6kW-per-rack solution, and a
high-density, 17kW-per-rack solution for 10,000 400W servers.27 Figure 4 summarizes
Intel’s findings that a high-density solution could save well over $5 million dollars
compared to a low-density solution.
Low density High density
Capital cost – building at $220 per square foot $6,285,620 $2,393,600
Design cost for CFD N/A $54,440

A Principled Technologies white paper 19 Dell and the value of density
Low density High density
Capital cost for raised floor N/A $250,240
Additional cost of lighting for bigger low density datacenter $126,000 N/A
Racks $1,875,000 $714,000
Operating costs - cooling $1,091,000 $736,000
Total cost $9,377,620 $4,148,280
Cost savings $5,229,340
Figure 4: Example savings for a high-density solution, as reported by an Intel study.
Server infrastructure savings
Increasing density by maximizing processor count
One way to maximize density is to choose servers that have more processing
power per U of rack space. Here, we show two examples of how you can move up the
density spectrum with Dell rack and blade servers and the savings that are possible by
choosing the denser solution. In the scenarios we analyzed, we found that the denser
solutions could save on rack and chassis costs as well as power and cooling costs.
We compare datacenter costs for two rack server models deployed 20 to a rack:
the 2U, two-socket Dell PowerEdge R720 and the 2U four-socket Dell PowerEdge R820.
Then, we compare costs for two blade server models deployed in a fully populated
chassis, with three chassis per rack: the two-socket, half-height Dell PowerEdge M620
blades and the two-socket, quarter-height Dell PowerEdge M420 blades.
For more details on assumptions and methodologies used in this analysis, see
Appendix A.
We include the following costs in our analyses:
Cooling equipment capital costs
Building costs
Rack capital costs
Chassis capital costs (for blades only)
Ongoing energy costs for power and cooling
Please note that we do not include server costs in this anaylsis, and only analyze
datacenter costs.
Assumptions for our analyses
We made the following assumptions about the datacenter and its costs.

A Principled Technologies white paper 20 Dell and the value of density
Assumptions Value
Datacenter space per rack (in square feet) 27
Building cost $/sq foot $250
Capital cost per rack for the rack and its installation $3,000
Capital cost per M1000e chassis including redundant Dell Force10™ switches $33,000
Number processors in solution 1,920
Cost per KWh of power and cooling $0.11
Hours per year of datacenter operation 8,760
PUE (assume cost of cooling = .20 cost of power) 1.2
Figure 5: Assumptions for our 5-year TCO analysis.
Determining performance-equivalent configurations
In our analyses, we use processor count as a stand-in for performance
equivalency. For each server, we estimate datacenter costs for configurations with
1,920 processors, which is the number of processors that fill 30 fully populated chassis
of Dell PowerEdge M420 blades. At three chassis per rack, that is 10 racks of blades.
Figures 6 through 8 show the server counts for deployments of 1,920 processors
for the two rack server models and two blade server models, along with a rack versus
blade comparison. We also include rack counts for all four models and chassis counts for
the blade servers.
Rack server configurations Dell PowerEdge R720 Dell PowerEdge R820
Server socket count and rack units 2S,2U 4S,2U
Processors per server 2 4
Number of servers 960 480
Number of servers per rack 20 20
Number of racks 48 24
Figure 6: Equivalent deployments of 1,920 processors for the two rack servers.
Blade server configurations (in Dell PowerEdge M1000e chassis)
Dell PowerEdge M620 Dell PowerEdge M420
Server socket count and height 2S, half-height 2S, quarter-height
Number of servers 960 960
Number of servers per chassis 16 32
Number of servers per rack 48 96
Number of chassis 60 30
Number of racks 20 10
Figure 7: Equivalent deployments of 1,920 processors for the two blade servers.

A Principled Technologies white paper 21 Dell and the value of density
Dell PowerEdge R720 Dell PowerEdge M420
Server socket count and height or U 2S, 2U 2S, quarter-height
Number of servers 960 960
Number of servers per chassis N/A 32
Number of servers per rack 20 96
Number of chassis N/A 30
Number of racks 48 10
Figure 8: Equivalent deployments of 1,920 processors for one rack and one blade server.
Comparing the rack servers
Figure 9 compares cost estimates for the two- and four-socket 2U rack servers
for configurations that include 1,920 processors filling 40U of datacenter racks. As
Figure 9 shows, the higher-density four-socket, 2U Dell PowerEdge R820 servers in high-
density 12kW racks can save up to $2,062,352.64 in datacenter costs over five years
compared to the two-socket, 2U Dell PowerEdge R720 servers in medium-density 8kW
racks. For details on this cost comparison, see Appendix A.
We calculate the 5-year cost subtotal for power and cooling at 1.2 PUE by
multiplying the kWh for each solution by the cost per kWh (see Figure 5) by a PUE of 1.2
by five years.
Rack server comparison Dell PowerEdge R720 Dell PowerEdge R820 Cost savings for the 4-socket R820
Server socket count and rack units 2S,2U 4S,2U
Density (kW/Rack) 8 12 Processors per server 2 4 Number of servers 960 480 Number of servers per rack 20 20 Estimated power draw per
rack (W) 6,480 9,360 Number of racks 48 24 kWh per solution 2,724,710 1,967,846 Square feet (27 sq. ft. per rack) 1,296 648 Cooling equipment capital
costs (per rack) $55,000.00 $75,900.00 Building costs ($250/square
foot) for feet used $324,000.00 $162,000.00 $162,000.00
Rack capital costs ($3,000 per rack) $144,000.00 $72,000.00 $72,000.00

A Principled Technologies white paper 22 Dell and the value of density
Rack server comparison Dell PowerEdge R720 Dell PowerEdge R820 Cost savings for the 4-socket R820
10GbEthernet switch and 10Gb and management cable costs $1,020,844.80 $510,422.40 $510,422.40
Cooling equipment capital costs $2,640,000.00 $1,821,600.00 $818,400.00
Capital cost subtotal $4,128,844.80 $2,566,022.40 $1,562,822.40
5-year cost subtotal for power and cooling at 1.2 PUE $1,798,308.86 $1,298,778.62 $499,530.24
5 year total $5,927,153.66 $3,864,801.02 $2,062,352.64
Figure 9: Analysis of the savings possible over 5 years by choosing the denser PowerEdge R820 rack server.
Comparing the blade servers
Figure 10 compares cost estimates for the two-socket quarter-height and half-
height servers for configurations that include 1,920 processors. We assume three full
chassis per rack at the density we show in the earlier density calculation figure. As
Figure 10 shows, the higher-density quarter-height PowerEdge M420 blades in high-
density 20kW racks save can up to $2,601,606.73 in datacenter costs over five years
compared to the half-height Dell PowerEdge M620 blades in lower-density 16kW racks.
For this comparison, we include a cost of $33,000 per chassis to include the chassis and
redundant Dell Force10 switches. For details on this cost comparison, see Appendix A.
We calculate the 5-year cost subtotal for power and cooling at 1.2 PUE by
multiplying the kWh for each solution by the cost per kWh (see Figure 5) by a PUE of 1.2
by five years.
16 x Dell PowerEdge M620 per Dell PowerEdge M1000e
Blade Server Chassis
32 x Dell PowerEdge M420 per Dell PowerEdge M1000e
Blade Server Chassis
Cost savings for the quarter-height
M420
Server socket count and height 2-socket, half-height blades 2-socket, quarter- height
blades
Density (kW/Rack) 16 20
Number of servers per chassis 16 32
Number of servers 960 960
Number of chassis 60 30
Number of servers per rack 48 96
Power capped power per rack (cap power at kW/rack)
16 20
Number of racks 20 10

A Principled Technologies white paper 23 Dell and the value of density
16 x Dell PowerEdge M620 per Dell PowerEdge M1000e
Blade Server Chassis
32 x Dell PowerEdge M420 per Dell PowerEdge M1000e
Blade Server Chassis
Cost savings for the quarter-height
M420
kWh per solution 2,803,200 1,752,000
Square feet (27 sq. ft. per rack) 540 270
Cooling equipment capital costs (per rack) for this density
$94,133.00 $108,833.00
Cooling equipment capital costs $1,882,666.67 $1,088,333.33 $794,333.33
Building costs ($250/square foot) $135,000.00 $67,500.00 $67,500.00
Rack capital costs ($3,000 per rack)
$60,000.00 $30,000.00 $30,000.00
Chassis capital costs ($33,000 per chassis)
$1,980,000.00 $990,000.00 $990,000.00
10Gb Ethernet switch and 10Gb and management cable costs
$63,802.80 $37,821.40 $25,981.40
Capital cost total $4,121,469.47 $2,213,654.73 $1,907,814.73
5-year cost for power and cooling at 1.2 PUE
$1,850,112.00 $1,156,320.00 $693,792.00
5-year total $5,971,581.47 $3,369,974.73 $2,601,606.73
Figure 10: Analysis of the savings possible over 5 years by choosing the denser PowerEdge M420 blade server.
Comparing two-socket, 2U rack servers and dense blade servers
Figure 11 compares cost estimates for 1,920-processor configurations of the
two-socket quarter-height PowerEdge M420 blade servers and the two-socket, 2U rack
servers. As Figure 11 shows, the higher-density quarter-height PowerEdge M420 blades
in high-density 20kW racks save can up to $2,557,178.93 in datacenter costs over five
years compared to the two-socket, 2U Dell PowerEdge R720 rack servers in lower-
density 8kW racks. The M420 blade configuration includes 960 two-socket servers in
M1000e chassis installed three chassis per rack. The rack server configuration includes
960 two-socket servers installed 20 to a rack. For this comparison, we include a cost of
$33,000 per chassis to include the chassis and redundant Dell Force10 switches. For
details on this cost comparison, see Appendix A.
We calculate the 5-year cost subtotal for power and cooling at 1.2 PUE by
multiplying the kWh for each solution by the cost per kWh (see Figure 5) by a PUE of 1.2
by five years.

A Principled Technologies white paper 24 Dell and the value of density
Dell PowerEdge R720 Dell PowerEdge M420 blades
in Dell PowerEdge M1000e Blade Server Chassis
Cost savings for the quarter-height M420
Server socket count and size 2S,2U rack server 2-socket,quarter-height blade
Density (kW/Rack) 8 20
Number of servers per chassis N/A 32
Number of servers 960 960
Number of chassis N/A 30
Number of chassis per rack N/A 3
Number of servers per rack 20 96
Estimated power draw per rack (W)
6,480 25,062
Power capped power per rack (cap power at kW/rack)
N/A 20,000
Number of racks 48 10
kWh per solution 2,724,710 1,752,000
Square feet (27 square feet per rack)
1,296 270
Cooling equipment capital costs (per rack)
$55,000.00 $108,833.00
Building costs ($250/square foot) for feet used
$324,000.00 $67,500.00 $256,500.00
Rack capital costs ($3,000 per rack)
$144,000.00 $30,000.00 $114,000.00
Chassis capital costs ($33,000 per chassis)
N/A $990,000.00 -$990,000.00
10GB Ethernet switch and 10GB and management cable costs
$1,020,844.80 $37,821.40 $983,023.40
Cooling equipment capital costs $2,640,000.00 $1,088,333.33 $1,551,666.67
Capital cost total $4,128,844.80 $2,213,654.73 $1,915,190.07
5-year cost for power and cooling at 1.2 PUE
$1,798,308.86 $1,156,320.00 $641,988.86
5 year total $5,927,153.66 $3,369,974.73 $2,557,178.93
Figure 11: Analysis of the savings possible over 5 years by choosing the denser PowerEdge M420 blade compared to a two-socket, 2U PowerEdge R720 rack server.

A Principled Technologies white paper 25 Dell and the value of density
Software savings
Intelligently placing virtualized workloads on select physical hardware can
enable targeted software license savings for organizations. Advanced management and
consolidation analysis software can determine where costs advantages may exist in
these scenarios.
One such example is CiRBA, a provider of consolidation analysis software, in
early 2013 announced a Software License Control System that enables organizations to
reduce the costs associated with processor-based software licensing by an average of 55
percent. The Software License Control module is an add-on to CiRBA’s Capacity Control
Console and optimizes VM placements in virtual and cloud infrastructure.
DELL OFFERINGS THAT CREATE VALUE FROM DENSITY
Dell offers server solutions across the spectrum to meet your density needs–
from tower servers for the smallest businesses to highly dense server nodes for
demanding HPC environments. With so many options to choose from, including
different sizes and sockets of rack and blade servers, the Dell PowerEdge server
portfolio can help you expand as your business does. By updating your infrastructure
with new, more powerful servers, you can increase your workload density by virtualizing
older legacy servers onto fewer new servers, and you maximize physical density to help
save time, power, and money.

A Principled Technologies white paper 26 Dell and the value of density
In this section, we describe the options that Dell offers across the density
spectrum, which Figure 12 summarizes. Dell current generation PowerEdge R series and
PowerEdge M series servers incorporate systems management features such as the Dell
Lifecycle Controller, implement leading industry power efficiency standards, and are
designed to optimize performance while maintaining low power consumption.
Figure 12: Dell PowerEdge servers along the density spectrum.

A Principled Technologies white paper 27 Dell and the value of density
Quarter-height, two-socket blade: Dell PowerEdge M420 blade
server
The quarter-height Dell PowerEdge M420 blade server sets a new standard for
computing density in a blade environment, and uses the Dell PowerEdge M1000e blade
enclosure. The M420 can double the core count per rack unit over half-height blade
servers, as it features eight-core Intel Xeon® processor E5-2400-series units in a two-
socket configuration to allow you to use your rack space to its maximum potential at 32
blades per 10U enclosure.
For more information about the quarter-height Dell PowerEdge M420, see
http://www.dell.com/us/enterprise/p/poweredge-m420/pd.

A Principled Technologies white paper 28 Dell and the value of density
Compute nodes for hyperscale datacenters: Dell PowerEdge C8220
For hyperscale environments, the Dell PowerEdge C8220 microserver with the
PowerEdge C8000 chassis offers very high density. The platform combines compute,
GPU, and storage nodes designed to run multiple applications in a single chassis.
Each compute node features two processors from the Intel Xeon processor E5-
2600 family for up to eight cores, and the flexibility of the C8000 chassis’ power supply
options and the ability to meet your exact needs for computer, GPU, and storage
requirements make the PowerEdge C8220 an ideal platform for large-scale highly dense
environments.
For more information about the Dell PowerEdge C8220, visit
http://www.dell.com/us/enterprise/p/poweredge-c8000/pd.

A Principled Technologies white paper 29 Dell and the value of density
Half-height, two-socket blade: Dell PowerEdge M620 blade server
The Dell PowerEdge M620 is a half-height two-socket blade server powered by
the Intel Xeon processor E5-2600 series that can hold up to 768 GB of RAM in 24 DIMM
slots. The PowerEdge M620 comes standard with several management features,
including iDRAC7 Express with Lifecycle Controller for Blades, which allow
administrators to manage in physical or virtual environments locally or remotely. Along
with other members of the M-series PowerEdge server line, the PowerEdge M620 fits
right in with the power-efficient Dell PowerEdge M1000e Blade Enclosure.
For more information about the Dell PowerEdge M620, visit
http://www.dell.com/us/enterprise/p/poweredge-m620/pd.

A Principled Technologies white paper 30 Dell and the value of density
Full-height, four-socket blade: Dell PowerEdge M820 blade server
The Dell PowerEdge M820 is a scalable, full-height blade server powered by
eight-core Intel Xeon processor E5-4600-series units in a four-socket configuration with
the power needed to drive the most computation-intensive applications. The
PowerEdge M820 supports up to 1.5TB of DDR3 RAM across 48 slots, providing both
capacity and bandwidth to maximize throughput and reduce storage I/O. It has multiple
hot-plug storage options including SAS, SSD, and Express Flash PCIe SSDs. Along with
other blade servers in the PowerEdge line, the PowerEdge M820 fits right in with the
power-efficient Dell PowerEdge M1000e Blade Enclosure.
For more information about the Dell PowerEdge M820, see
http://www.dell.com/us/enterprise/p/poweredge-m820/pd.
A Principled Technologies white paper 31 Dell and the value of density
Two-socket, 1U rack server: Dell PowerEdge R620
The Dell PowerEdge R620 is a two-socket server with eight-core processors that
fits into just 1U of rack space. With up to 768 GB of RAM and holding up to 10 TB of
internal storage, the R620 can run demanding workloads while maximizing the density
of your rack server environment. The PowerEdge R620 offers a choice of network fabric
technologies and optional hot-plug front-access PCIe SSDs for efficient management and
performance.
In the past, server buyers were limited to 2U servers containing three PCIe
expansion slots and having advanced networking options. This is no longer a restriction
when selecting the Dell PowerEdge R620 – the Dell PowerEdge R620 has three PCIe slots
and a bevy of advanced networking adapters to choose from. In contrast, the latest
generation HP and IBM 1U competitors remain locked in at two PCIe slots.
For more information about the Dell PowerEdge R620, visit
http://www.dell.com/us/enterprise/p/poweredge-r620/pd.
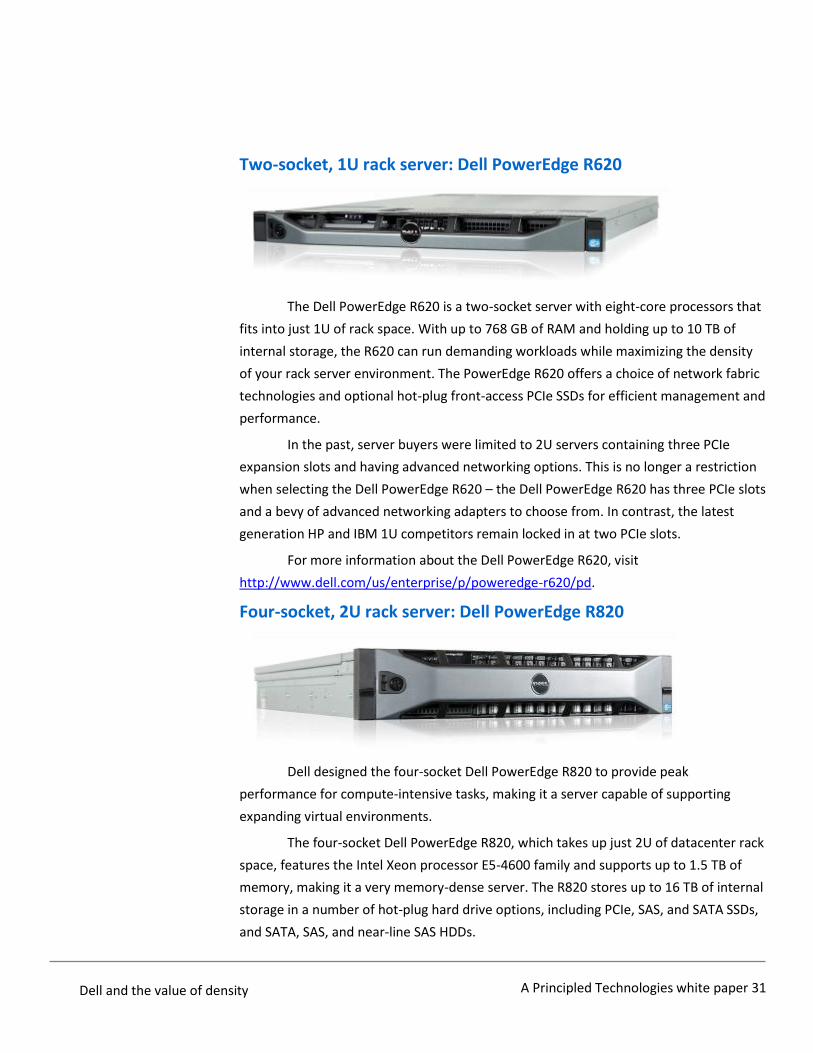
Four-socket, 2U rack server: Dell PowerEdge R820
Dell designed the four-socket Dell PowerEdge R820 to provide peak
performance for compute-intensive tasks, making it a server capable of supporting
expanding virtual environments.
The four-socket Dell PowerEdge R820, which takes up just 2U of datacenter rack
space, features the Intel Xeon processor E5-4600 family and supports up to 1.5 TB of
memory, making it a very memory-dense server. The R820 stores up to 16 TB of internal
storage in a number of hot-plug hard drive options, including PCIe, SAS, and SATA SSDs,
and SATA, SAS, and near-line SAS HDDs.

A Principled Technologies white paper 32 Dell and the value of density
For more information about the Dell PowerEdge R820, visit
http://www.dell.com/us/enterprise/p/poweredge-r820/pd.
Two-socket, 2U rack server: Dell PowerEdge R720
The Dell PowerEdge R720 is a 2U server that is powered by two processors from
the Intel Xeon processor E5-2600 series. It was designed to handle complex workloads,
with I/O and internal data management technologies (i.e., NSC, NPAR, CacheCade) to
allow faster access to information and GPU accelerators for fast computational
performance, making it a solid virtualization platform to consolidate legacy workloads.
The Dell PowerEdge R720 supports an impressive storage capacity for small
business servers, and is available in both an 8-bay and 16-bay chassis. The Dell
PowerEdge R720 holds up to 768 GB of RAM, many times the memory capacity of older
comparable servers, and supports up to 32TB of internal storage.
For more about the Dell PowerEdge R720, see
http://www.dell.com/us/enterprise/p/poweredge-r720/pd.
COMMON MYTHS ABOUT HIGH DENSITY
As technology evolves, certain barriers to technology adoption become less
relevant. High-density computing is a prime example of technology that was once
considered prohibitive but is now embraced by the technology industry. Advances in
virtualization, power efficiency, and systems management have made several of the
previously held negative views on high density computing less applicable. In this section,
we outline some common myths about high-density computing, from both application
and physical density perspectives. These myths have been disproved over the past few
years, proving that what were once barriers to the adoption of high density computing
may no longer apply.
Myth #1: Greater logical density increases risk of downtime
A common myth concerning workload consolidation is that moving distributed
workloads onto a few servers increases the risk of downtime. The thought behind the
myth is that if you reduce the number of servers in your datacenter, a hardware failure

A Principled Technologies white paper 33 Dell and the value of density
will impact a greater percentage of your business. Due to advances in virtualization and
high-availability clusters that provide hardware redundancy, workload consolidation is
considerably safer for your business and can actually provide greater uptime.
High-availability clusters provide protection for your data by having redundant
servers, storage, and networking to eliminate any single points of failure within the
cluster. A simple way to implement this type of cluster is through a 3-2-1 reference
configuration that has been validated to work properly to provide the data and uptime
protection required for your business.28 With the hardware safeguards in place, this
allows the virtualization software to manage the workloads and maintain their integrity.
Below are some of the data protection features offered in the latest releases of
Microsoft Hyper-V™ and VMware® vSphere®, both leaders in the hypervisor market
today.
Allow for planned downtime by moving virtual machines and their storage to
another physical server while keeping them fully functional during the move
using Live Migration with Microsoft Hyper-V29 or VMware vMotion™30 and
Storage vMotion31 with VMware vSphere.
Both Hyper-V Failover Clustering32 and vSphere High Availability33 (HA) protect
your data during unplanned downtime by automatically detecting hardware
failures, migrating the virtual machines to a backup server, and restarting them
within minutes.
Myth #2: Greater logical density makes environments more difficult
to manage
Many datacenter managers falsely believe that moving to a highly virtualized
environment will makes systems management more complex. The progression of
technology towards virtualization and consolidation has made this myth a thing of the
past. Systems management has evolved to where many of its functions are integrated
directly into the virtualization platform. The Dell management plug-in for VMware
vCenter34 is an excellent example of this integration.
The Dell vCenter plug-in allows systems administrators to manage both physical
and virtual hardware all from one interface, andiDRAC7 with Lifecycle Controller allow
admins to manage physical and virtual servers from one place. And with reduced cabling
and port count, moving switches and machine connections from the physical to the
virtual world further reduces the time needed to set up and administer servers.

A Principled Technologies white paper 34 Dell and the value of density
Myth #3: Greater physical density significantly impedes compute
efficiency
One of the most common myths about high-density solutions is that as compute
density physically increases, processing efficiency decreases significantly. While this may
have been true in the past, this is no longer the case. Advances in server power
management, power delivery and consumption, as well as in microprocessor
architecture have led to significant improvements in power versus performance
efficiency. Studies and tests show the latest generation of servers can achieve great
gains in density while also achieving the highest-ever scores in performance per watt.
SPECpower® is the industry-standard benchmark for measuring processing
efficiency as related to power. The benchmark takes the ratio of processing capability
(ssj_ops) divided by the amount of power used to perform these calculations (watts).
The number of server-side java (ssj) operations (ops) performed at system load levels
varying from 100 percent to 0 percent processor utilization are totaled and each is
divided by the amount of power it took to run that workload level to give a total
aggregate score. Figure 14 compares the processor density of a select group of Dell’s
latest generation servers. On this same axis is the published SPECpower score for each
server. Figure 13 shows that as the processor density per U of the servers increases
dramatically, there is just a small decrease in the power efficiency of the systems under
test. 35,36,37,38,39 Organizations can now implement high-density solutions without the
worry that they are trading power-efficiency for density.

A Principled Technologies white paper 35 Dell and the value of density
0
10
20
30
40
50
60
70
0
1,000
2,000
3,000
4,000
5,000
6,000
R720 R820 M820 M620 M420
Pro
cess
ors
pe
r 1
0U
of
rack
sp
ace
SPEC
po
we
r sc
ore
(ssj
_op
s/w
att)
Dell PowerEdge server model
Processor density and efficiency
ssj_ops/watt
Processors per10U
Figure 13: Dell PowerEdge servers and the relationship between processor density and power efficiency.
Myth #4: Greater physical density is expensive
Another common myth about high-density solutions is that they are costly to
implement, not only up front but also on a recurring basis. To the contrary, recent
studies by Emerson Power and Schneider Electric show that high-density datacenters
are more power-efficient than low-density datacenters, and can provide a significant
cost savings over the life of the datacenter.40 , 41 Replacing traditional forced air
computer room air conditioning (CRAC) units with liquid-cooled top-of-rack chillers and
containment aisles can provide a much more efficient use of power, lowering a
datacenter’s cooling costs. For example, consolidating the workload from 1,000 HP
ProLiant DL380 G6 servers to 460 Dell PowerEdge M420 blades servers would use 59
percent less energy for power and cooling.
According to the Emerson study, changing the compute density of a datacenter
from low to high can save new or retrofit datacenters an average of $3.65 million over
the first five years of implementing the new solution. This means that investing in a
high-density solution is not cost-prohibitive; it could actually save money for your
business over time.

A Principled Technologies white paper 36 Dell and the value of density
Figure 14 compares the cost of cooling both high-and low-density solutions from
the Emerson study, using traditional CRAC cooling versus specialized high-density
cooling modules. It takes just half the electricity to cool the high-density solution, which
can result in dramatic savings in operating costs.
Figure 14: Traditional chilled cooling wattage versus high-density cooling module wattage.42
USE CASES – HIGH DENSITY IS VALUABLE
There are specific application density scenarios and datacenter scenarios with
unique conditions that can make high density even more attractive. Not only can a high-
density solution provide your organization with significant cost savings, but depending
on which scenario applies, you can also find unique advantages to selecting high-density
servers. Below we discuss specific use cases and stories of real customers and real
density transitions and highlight savings and efficiencies these solutions can achieve.

A Principled Technologies white paper 37 Dell and the value of density
Application density – The Enterprise server refresh
Virtacore Systems, Inc. a hosting solutions company that provides virtual servers
in the cloud, had a significant need to upgrade its server and storage infrastructure.
With more than 10,000 VMs in public and private clouds and a 99.999 percent
availability guarantee made to its customers, management of the necessary hardware
infrastructure to support Virtacore’s business was becoming increasingly difficult for its
IT staff.43 Managing customer solutions in four datacenters across the country was
becoming increasingly inefficient and negatively impacting the bottom line.
To address this problem, Virtacore standardized on Dell PowerEdge servers and
Dell EqualLogic storage, allowing the company to take full advantage of management
tools such as Dell OpenManage Server Administrator, Dell Remote Access Controller
(iDRAC), Dell Lifecycle Controller, and Dell EqualLogic SAN HeadQuarters (SAN HQ). For
example, with Dell Lifecycle Controller, Virtacore can now build a server image and
easily deploy that image on multiple servers at a time, so that volume deployments now
require significantly less time and less opportunity for human error. Lifecycle Controller
also facilitates seamless server management, automating checks and installs for updates
remotely over iDRAC.
Virtacore’s entire business has benefited from moving to Dell hardware and
management tools, from deployment to management to even the offerings it can sell to
potential customers. Virtacore can now deploy new customer environments six times
faster, and deploy individual VMs seven times faster. Virtacore estimates savings
upwards of 1,000 hours a year that IT staff had previously allocated to server
management and 400+ hours a year allocated to storage management.44 These savings
eliminated the need to hire additional IT staff to manage the growing data volume. New
Dell EqualLogic storage paired with Dell PowerEdge servers also allowed Virtacore to
expand its offerings with tiered storage performance options at different price levels.
Physical density - Co-location and hosted space
There is significant cost associated with each square foot of rack space that
servers occupy in your datacenter. A recent study shows that for a Tier III-level
datacenter building, real estate, power, and cooling costs can cost up to an estimated
$900 per square foot when factored together.45 As such, for many organizations, it is
more cost advantageous to rent hosted or co-located space from a provider. Reducing
your physical footprint in these hosted datacenters will maximize your return on
investment by lowering recurring rental costs and providing flexibility by freeing up
those funds for other strategic projects. Below, we offer two examples of this use case.

A Principled Technologies white paper 38 Dell and the value of density
One common reason for renting rack space is disaster recovery; every business
needs to have a disaster recovery plan in place to ensure the integrity of the company’s
data. A recent study shows that depending on the business, downtime can cost
anywhere from $50K to over $6 million per hour.46 According to industry standard best
practices,47 every disaster recovery plan should include off-site hosted servers at least
30 miles from the headquarters to reduce replication latency, as well as a second-tier
site that is not in the same region in the event of a widespread disaster. According to
the article “Using a colocation datacenter for disaster recovery,” if a company chooses
to use a service provider for their disaster recovery site, co-location can cost between
$2,000 and $30,000 per month depending on the amount of rack space your servers
use.48 For example, according to Fogo Datacenters,49 they offer entry-level co-location
services starting at approximately $2,200 per server rack per month. This is $52 per U of
rack space per month.
Faced with this wide range of cost, it is beneficial to minimize these monthly
recurring costs by reducing the footprint of the servers your company needs at the
disaster recovery site. Moving to a highly dense disaster recovery solution incurs
hardware costs at the purchase stage, but could quickly pay for itself through the
savings in monthly hosting service expenses.
A fine-grain example of a co-located servers is the high-frequency trading
industry. High-frequency trading (HFT) is a class of stock trading that utilizes ultra-low
latency connections between a stock exchange’s execution engine and the firm’s servers
to take advantage of micro trends in the market price of stock to make huge gains in
trading.
To take advantage of the lowest possible latency connections, global stock
exchange firms have opened “liquidity centers.”50 These liquidity centers offer HFT firms
the opportunity to rent co-location space right next to the stock exchange’s execution
engine servers, or in centers with dedicated and specially engineered communication to
other trade exchanges. The cost to house servers in a liquidity center varies, but recent
estimates put the price at $25,000 per month for each rack of servers you deploy within
a liquidity center.51 With that much capital to rent rack space alone, HFT firms can
maximize their investment by deploying the densest compute solution available.
Physical density – Portability
In today’s fast-paced world, having a capable IT environment is more important
than ever, even in the most remote and harsh locations. In some economy sectors, the
only way to have a datacenter in these environments is to bring the datacenter to the
site. Self-contained, pre-configured portable datacenters such as the Dell Mobile

A Principled Technologies white paper 39 Dell and the value of density
Datacenter solution52 require only a generator to deploy and fit into sealed military-
grade container. For these solutions, which are ideal for military field operations,
remote scientific study, and disaster relief organizations, it is critical to pack as much
compute power into this limited space as possible.
According to the Federal Emergency Management Agency (FEMA),53 the first
step in the disaster relief process is to have first responders set up a central field office
to coordinate the recovery efforts. Connecting power to a portable datacenter and
reestablishing communication can speed up this process dramatically.
High density is also extremely valuable for military, where mobile command
centers are the communications hubs for units in the field, all while keeping the
communications secure using the latest available encryption technology.
Physical density – HPC computing
High-performance computing is a tool that helps complete complex tasks,
including automobile design and testing, cryptographic analysis, and even weather
prediction. Organizations use HPC when they need to generate, process, and analyze
large data amounts, and such infrastructures require many powerful servers.
Organizations choosing the highly dense Dell PowerEdge M420 quarter-height blade
servers for their CPU-intensive workloads on HPC clusters can benefit significantly,
especially when compared to half-height blade and rack-mount servers.
For this analysis, CiRBA54 analyzed the performance of a hypothetical set of 690
HPC workloads on a variety of blade and rack mount servers including the quarter-
height Dell PowerEdge M420 blade, 1U Dell PowerEdge R610 rack server, and half-
height HP ProLiant BL460c Gen8 blade server. For the simulation, the older Dell
PowerEdge R610 was configured with two hex-core Intel Xeon processors X5690. The
more current Dell PowerEdge M420 and HP ProLiant BL460c Gen8 servers were
configured with two eight-core Intel Xeon E5-2670 and Xeon E5-2680 processors,
respectively.
When modeling the HPC workloads on the target servers, CiRBA found that the
workloads were primarily constrained by the compute capacity of the target servers. In
the simulations, the Dell PowerEdge M420 quarter-height blade servers ran the
workloads in a physical footprint that was 43 percent smaller than the HP ProLiant
BL460c Gen8 and 77 percent smaller than the Dell PowerEdge R610 rack-mount servers.

A Principled Technologies white paper 40 Dell and the value of density
ENGAGING WITH DELL
Dell Services, using analytics engines provided by CiRBA and others, offer a
variety of assessment tools that can help you determine the best path forward on your
density journey. Dell Services take an empirical approach to assessing where you are
and defining the right strategies for driving increased virtualization, consideration of
cloud strategies and increasing efficiency and density significantly and safely. These
approaches drive maximum density while reducing risk. No matter what phase you are
in on a path to consolidation and virtualization, Dell offers an appropriate and practical
set of services to help you in your decision making.
SUMMING IT ALL UP
Businesses today want to get the most out of server infrastructure, and
increasing density through new hardware investment, consolidation, and virtualization
culminates in high-density datacenters that allow them to do just that. The greater
number of workloads you are able to push into a smaller amount of physical space, the
greater the potential for savings – time savings, money savings, and power savings. As
we have shown, consolidating your low-density solution into a higher-density solution –
moving up the density spectrum – has the potential to save you time, power, and
money, regardless of the size of your organization. And no matter where you are on the
density spectrum, Dell has a number of options through the rack and blade space, as
well as highly dense compute nodes that can help move your design up the density
ladder. From the small business running out of room to large service providers that need
maximum processing power of an entire datacenter in the smallest possible space,
moving up the density ladder matters and can help the bottom line immediately.
Increasing density has the potential to :
Reduce management overhead with fewer physical servers to manage
Lower the amount of power and cooling, saving on operating costs
Save physical space and the costs related to renting space or building
new locations to house servers
Enable portability of dense computing solutions for remote locations
Reduce infrastructure costs with fewer servers to house and cable
Reduce datacenter software licensing costs
Whether you’re looking to upgrade your current infrastructure, planning to
build a new datacenter, seeking to simplify systems management, improve power and

A Principled Technologies white paper 41 Dell and the value of density
cooling efficiency, or seeking to reduce costs of operating expenses – businesses are
consolidating and climbing the density ladder today, and you can too.

A Principled Technologies white paper 42 Dell and the value of density
APPENDIX A – SERVER INFRASTRUCTURE SAVINGS DETAILS
In this appendix, we provide further detail on how we arrived at the costs in our
rack and blade server cost comparisons in the Server Infrastructure savings section
above.
Calculating chassis and rack count and costs for each solution
Our analysis included chassis and rack counts for supporting 1,920 processors.
We calculated rack capital costs at $3,000 per rack for each server model and chassis
capital costs at $33,000 per chassis for the blade server models. The chassis cost
includes the cost of redundant Dell Force10 switches in each chassis.
Calculating power density requirements for each rack
We estimated the kW of power each rack requires. We used the Dell Energy
Smart Advisor (ESSA) to estimate power for a configuration of each server. Within the
tool, we configured a full rack of servers for each solution and requested results for the
tool’s computational load. For each configuration, we included the maximum number
processors for each server, 64GB (8x8) GB memory per processor, two 128GB hard
drives, and, where available, and an embedded RAID H310 controller. Because we
wanted a reasonable power utilization estimate, we were not rigid in those selections –
the M420 caps at six memory modules for two processors, so we configured it with 6x8
GB memory. We used the tool’s estimate of total power consumption in watts to assign
a rack density to each solution and to calculate the number of chassis per rack for the
blade solutions. For these estimates we had four chassis in each rack. The middle
column shows those results. Figure 15 estimates usage the energy usage of the four Dell
server models.
Assigning appropriate datacenter power density
We assume that the enterprise can choose among four different datacenter
power densities ranging from medium to high density: 8kW, 12kW, 16kW, or 20kW.
Each datacenter could deliver on average the specified kW of power and cooling to each
rack.
We estimated the power usage of a rack of each of the server models and
determined the closest match of the four rack densities for that rack. Watts per rack
estimates for four chassis of each blade solution exceeded our maximum density, so we
used three chassis per rack for the estimates instead. The right-hand column in Figure
15 shows those assignments. For the two blade solutions, we assume datacenter IT uses
power capping to keep rack power within the assigned limit.

A Principled Technologies white paper 43 Dell and the value of density
Full rack solution (40u) Estimated watts per rack
using Dell ESSA tool Density determination
20 x Dell PowerEdge R720 servers 6,480 Calculate costs for full rack at 8kW per rack
density
20 x Dell PowerEdge R820 servers 9,360 Calculate costs for full rack at 12kW per rack
density
64 x Dell PowerEdge M620 in 4 x Dell PowerEdge M1000e Blade Server Chassis
22,372 Calculate costs for 3 chassis at 16kW per rack
and cap the power at 16kW
128 x Dell PowerEdge M420 in 4 x Dell PowerEdge M1000e Blade Server Chassis
33,416 Calculate power for 3 chassis at 20kW per
rack and cap power at 20kW
Figure 15: Power density requirement calculations for each rack.
Estimating cooling equipment capital costs and building costs
We used the estimate from Figure 15 above and Schneider electric tool
estimates on cooling equipment costs estimates for racks of this density and multiply
that by the rack count for the solution. Those results are in Figure 10. We estimate cost
per square foot for datacenter construction at $250 per square foot for 27 square feet
of datacenter space per rack.
Calculating energy costs for power and cooling
We also estimate an annual cost for power and cooling that we multiply by the
5-year expected life of the solution. The power cost is calculated using a value of 11
cents per kWh. We assume an efficient datacenter operating at 1.2 PUE on average and
estimate the energy cost to cool the servers at 20 percent of the energy cost to power
the servers.
Switch and cable costs
For each configuration we compare the prices of 10Gb Ethernet switches, using
Dell PowerConnect™ 8100 series switches and the cables to connect the rack servers or
blade chassis to the switches. We assume each rack server is already configured with a
dual-port 10Gb Ethernet card. We include redundant Dell Force10 switches in the prices
of the chassis elsewhere in this model. We also include prices for a single management
cable from the rack servers or blade chassis for managing the servers through Integrated
Dell Remote Access Controller 7 (iDRAC7) with Lifecycle Controller technology.
10Gb Ethernet switches
We priced 64-port and 32-port models of the Dell PowerConnect 8100 series
switch, and use whichever one best fits each server configuration. The Dell
PowerConnect 8164 switch, with a list price of $25,752 includes 48x 10GBase-T + 2x

A Principled Technologies white paper 44 Dell and the value of density
40GbE base ports, up to 64 ports max via a 40GbE Module, which we included. The
starting price of the Dell PowerConnect 8132 32-port switch is $15,836 for a model that
includes 24x 10GBase-T ports, up to 32 ports max via a 40GbE Module, which we
included. For both models, the price includes 3-Year ProSupport and NBD On-site
Service. We include redundant Dell Force10 switches in the prices of the chassis
elsewhere in this model.
For the rack server configurations, we price 64-port switches, with redundant
switches for each set of three racks, using 60 of the 64 ports on each switch. Each 42U
rack in these configurations holds 20 servers and has 2U free; the 1U switches will fill
that free top of the rack space on every third rack.
For blade server configurations with fewer than 32 chassis, we price redundant
32-port switches. For bigger configurations we use the 64-port switches. At three 10U
chassis per rack, the racks have ample spare room for the 1U switches.
TwinAx cable
For each port we use, we also add in the $99.99 price of a PowerConnect SFP+ 7
meter TwinAx cable.
Management cables
For each rack server or each blade server chassis we include a single
management cable. We assume the datacenter can acquire these for $5 each.
Higher-density Dell PowerEdge R820 rack servers save on switch
and cable costs over Dell PowerEdge R720 rack servers
960 Dell PowerEdge R720 rack servers in 48 racks require 32x 10Gb Ethernet 64-
port switches and 1,920x 10Gb cables and 960 management cables. The 4S Dell
PowerEdge R820 servers fit the same number of processors in half the number of
servers and use only half the switches and cables of a configuration of Dell PowerEdge
R720 rack servers with the same processor count.
The higher-density Dell PowerEdge R820 rack servers save $510,422.40 on
switch and cable costs over the 2S, 2U rack servers. This solution saves 16U in rack space
for the switches. Dell lists the maximum wattage at 395W for the 64-port switch.55 The
fewer and smaller switches needed for the Dell PowerEdge R820 rack server
configuration draw 6,320 fewer watts based on their maximum wattage ratings. Figure
16 compares switch and cable cost estimates for the rack servers.

A Principled Technologies white paper 45 Dell and the value of density
Switch and cable costs Dell PowerEdge R720 rack servers Dell PowerEdge R820 rack servers
Quantity Cost Quantity Cost
10Gb Ethernet 64-port switch 32 $824,064.00 16 $412,032.00
10Gb cables 1,920 $191,980.80 960 $95,990.40
Management cables 960 $4,800.00 480 $2,400.00
Total $1,020,844.80 $510,422.40
Savings for Dell PowerEdge R820 rack servers
$510,422.40
Figure 16: R720 and R820 switch and cable costs.
Higher-density Dell PowerEdge M420 blade servers save on switch
and cable costs over Dell PowerEdge M620 blade servers
960 Dell PowerEdge M620 blade servers in 60 chassis on 20 racks use two 10Gb
Ethernet 64-port switches and 120 10Gb cables and 60 management cables. 960 quarter
height Dell PowerEdge M420 blade servers in 30 chassis require two 10Gb Ethernet 32-
port switches, 60x 10Gb cables, and 30 management cables at a savings of $25,981.40
over the Dell PowerEdge M620 blade server configuration with the same number of
servers and processors. Both solutions use 2U in rack space for the switches. Dell lists
maximum wattage at 240W for the 32-port switch and 395W for the 64-port switch.
Using those estimates, the smaller switches needed for the Dell PowerEdge M420 blade
server configuration draw 310 fewer watts. Figure 17 compares switch and cable cost
estimates for the blade servers.

A Principled Technologies white paper 46 Dell and the value of density
Switch and cable costs Dell PowerEdge M620 blade servers Dell PowerEdge M420 blade servers
Quantity Cost Quantity Cost
10Gb Ethernet 64-port switch 2 $51,504.00 0 $0.00
10Gb Ethernet 32-port switch 0 $0.00 2 $31,672.00
10Gb cables 120 $11,998.80 60 $5,999.40
Management cables 60 $300.00 30 $150.00
Total $63,802.80 $37,821.40
Savings for Dell PowerEdge M420 blade servers
$25,981.40
Figure 17: M620 and M420 switch and cable costs.
Higher-density Dell PowerEdge M420 blade servers saves on switch
and cable costs over Dell PowerEdge R720 rack servers
960 Dell PowerEdge R720 rack servers in 48 racks require 32x 10Gb Ethernet 64-
port switches and 1,920x 10Gb cables and 960 management cables. 960 Dell PowerEdge
M420 blade servers in 30 chassis require two 10Gb Ethernet 32-port switches, 60x 10Gb
cables, and 30 management cables at a savings of $983,023.40 over the Dell PowerEdge
R720 rack server configuration with the same number of servers and processors. This
solution saves 30U in rack space for the switches. Dell lists maximum wattage at 240W
for the 32-port switch and 395W for the 64-port switch. The fewer and smaller switches
needed for the Dell PowerEdge M420 blade server configuration draw 12,160 fewer
watts based on these maximum wattage ratings. Figure 18 compares switch and cable
cost estimates for the two servers.

A Principled Technologies white paper 47 Dell and the value of density
Switch and cable costs Dell PowerEdge R720 rack server Dell PowerEdge M420 blade server
Quantity Cost Quantity Cost
10Gb Ethernet 64-port switches in redundant configuration
32 $824,064.00 0 $0
10Gb Ethernet 32 -port switches in redundant configuration
0 $0.00 2 $31,672.00
10Gb cables 1920 $191,980.80 60 $5,999.40
Management cables 960 $4,800.00 30 $150.00
Total $1,020,844.80 $37,821.40
Savings for Dell PowerEdge M420 blade servers
$983,023.40
Figure 18: R720 and M420 switch and cable costs.

A Principled Technologies white paper 48 Dell and the value of density
APPENDIX B – ABOUT THE CIRBA STUDY
In this appendix, we provide details about the study CiRBA conducted, with
information they provided. For this analysis, CIRBA provided access to their
consolidation simulation tools, and tested a number of server models running compute-
intensive workloads like those that HPC computing would run. Figure 19 shows the
server models they used in their simulation, along with their configurations, CINT2006
scores, and the rack units that they occupy in a datacenter. As the data shows, the
quarter-height Dell PowerEdge M420 scores slightly less than the HP ProLiant BL460c
Gen8, but it packs that comparable performance in half the space, which can greatly
increase the density of a datacenter.
Model name Description Processor Memory CINT2006 Rate CPU
benchmark score Rack units
Dell PowerEdge M420
Current-generation quarter-height blade
2 x Intel Xeon E5-2470 (2300 MHz, 8 cores)
96 GB 551 0.3125U (32 blades/10U)
Dell PowerEdge R610
Previous-generation 1U rack
2 x Intel Xeon X5690 (3460 MHz, 6 cores)
96 GB 415 1U
HP ProLiant BL460c Gen8
Current-generation half-height blade
2 x Intel Xeon E5-2680 (2700 MHz, 8 cores)
128 GB 637 0.625U (16 blades/10U)
Figure 19: Server models, benchmark results, and rack units for the servers in the CiRBA simulation.
CiRBA ran their simulation of a migration of 690 hypothetical compute-bound
HPC workloads using the following assumptions:
CPU and memory utilization on target server does not exceed 70 percent and 90 percent
Primary constraint is CPU capacity of the target servers
Figure 20 compares the density of the server running the HPC workloads in the
simulation.
Model name Number of servers of
required Rack units per server
Percentage larger footprint than the M420
Dell PowerEdge M420 8 2.5U
Dell PowerEdge R610 11 11U 440%
HP ProLiant BL460c Gen8 7 4.4U 176%
Figure 20: The density of the servers running HPC workloads in the simulation.

A Principled Technologies white paper 49 Dell and the value of density
Figure 21 shows a screenshot of the HPC workload simulation results, provided
by CiRBA.
Figure 21: Screenshot from CiRBA’s HPC workload simulation.

A Principled Technologies white paper 50 Dell and the value of density
APPENDIX C – RECENT PT STUDIES SUPPORTING CONSOLIDATION AND DENSITY BENEFITS
At PT, we have performed a number of studies that show the performance and
cost benefits of consolidation and density. Figure 22 lists the most recent studies.
Title Link
Dell PowerEdge M420 blade server solution with Dell EqualLogic storage delivered database clustering performance
http://www.principledtechnologies.com/Dell/M420_database_0912.pdf
Server consolidation and TCO: Dell PowerEdge M620 vs. Dell PowerEdge M610
http://www.principledtechnologies.com/Dell/M620_vs_M610_0312.pdf
Server consolidation and TCO: Dell PowerEdge M620 vs. Dell PowerEdge M710HD
http://www.principledtechnologies.com/Dell/M620_vs_M710HD_0312.pdf
Server consolidation and TCO: Dell PowerEdge M620 vs. HP ProLiant BL490
http://www.principledtechnologies.com/Dell/M620_vs_HP_BL490_0312.pdf
Server consolidation and TCO: Dell PowerEdge R620 vs. Dell PowerEdge R610
http://www.principledtechnologies.com/Dell/R620_vs_R610_0312.pdf
Server consolidation and TCO: Dell PowerEdge R620 vs. HP ProLiant DL360 G7
http://www.principledtechnologies.com/Dell/R620_vs_HP_DL360G7_0312.pdf
Server consolidation with the Dell PowerEdge M620
http://www.principledtechnologies.com/Dell/M620_Exchange_consolidation_0512.pdf
Dell PowerEdge M820 blade server solution: Software cost advantages with Oracle Database 11g R2
http://www.principledtechnologies.com/Dell/M820_Oracle_0912.pdf
Dell PowerEdge M820 blade server solution: Software cost advantages with Microsoft SQL Server 2012
http://www.principledtechnologies.com/Dell/M820_SQLServer_0912.pdf
Microsoft Exchange consolidation and TCO: Dell PowerEdge R720xd vs. HP ProLiant DL380 G6
http://www.principledtechnologies.com/Dell/R720xd_Exchange_0312.pdf
Microsoft Exchange consolidation and TCO: Dell PowerEdge R720xd vs. HP ProLiant DL380 G7
http://www.principledtechnologies.com/Dell/R720xd_Exchange_G7_0312.pdf

A Principled Technologies white paper 51 Dell and the value of density
Title Link
Microsoft Lync Server consolidation and TCO: Dell PowerEdge R720 vs. HP ProLiant DL380 G7
http://www.principledtechnologies.com/Dell/R720_Lync_0312.pdf
Microsoft SharePoint consolidation and TCO: Dell PowerEdge R720 vs. HP ProLiant DL380 G7
http://www.principledtechnologies.com/Dell/R720_SharePoint_0312.pdf
Microsoft SQL Server consolidation and TCO: Dell PowerEdge R720xd and Dell PowerEdge 2950 III
http://www.principledtechnologies.com/Dell/R720_SQL_0312.pdf
Server Consolidation and TCO: Dell PowerEdge R720 vs. Dell PowerEdge R720
http://www.principledtechnologies.com/Dell/R720_vs%20_R710_0312.pdf
Server Consolidation and TCO: Dell PowerEdge R720 vs. HP ProLiant DL380 G7
http://www.principledtechnologies.com/Dell/R720_vs_HP_DL380G7_0312.pdf
TCO Analysis of Upgrading to Dell PowerEdge R720 Servers
http://www.principledtechnologies.com/Dell/R720_Consolidation_TCO_Server2012_SQL2012_1112.pdf
Figure 22: Recent studies on virtualization and consolidation in the PT labs.

A Principled Technologies white paper 52 Dell and the value of density
REFERENCES
1 http://www.missioncriticalmagazine.com/ext/resources/MC/Home/Files/PDFs/(TUI3011B)SimpleModelDetermingTrueTCO.pdf
2 http://www.forbes.com/sites/investor/2012/08/28/digital-space-a-bold-new-frontier-for-investing-in-reits/
3 “Increasing Density Requires Thinking “Inside The Box”, September 2011; Andrew Hiller, CTO and co-founder of CiRBA
4 http://www.serverwatch.com/server-trends/survey-51-of-x86-servers-now-virtualized.html
5 http://www.idc.com/getdoc.jsp?containerId=prUS23665812#.UP2JDqVG5FI
6 Data approximated from: http://symposium.uptimeinstitute.com/images/stories/Symposium_2012_PPTs/uptime-institute-data-
center-density-report.pdf 7 http://www.principledtechnologies.com/Dell/R720_SQL_0312.pdf
8 Ibid.
9 http://www.principledtechnologies.com/Dell/R720xd_Exchange_0312.pdf
10 http://www.principledtechnologies.com/Dell/R720_SQL_0312.pdf
11 http://www.principledtechnologies.com/Dell/R720_SharePoint_0312.pdf
12 http://www.principledtechnologies.com/clients/reports/Dell/R720_Consolidation_Performance_Server2012_SQL2012_1112.pdf
13 http://www.principledtechnologies.com/Dell/R720_Consolidation_TCO_Server2012_SQL2012_1112.pdf
14 http://www.principledtechnologies.com/Dell/R720_SQL_0312.pdf
15 If migrating from SQL Server 2008 R2 Enterprise licensed per processor to SQL Server Enterprise 2012 licensed per core.
16 http://www.principledtechnologies.com/Dell/M620_vs_HP_BL490_0312.pdf
17 http://i.dell.com/sites/content/business/solutions/engineering-docs/en/Documents/idrac7-overview-features.pdf
18 http://www.emersonnetworkpower.com/en-US/Brands/Liebert/Pages/LiebertGatingForm.aspx?gateID=886
19 http://www.principledtechnologies.com/Dell/R720_power_0312.pdf
20 http://www.ecommercetimes.com/story/76887.html
21 http://www.spec.org/cpu2006/results/res2012q2/cpu2006-20120522-22161.html
22 http://www.spec.org/cpu2006/results/res2008q4/cpu2006-20080914-05301.html
23 http://www.spec.org/cpu2006/results/res2012q2/cpu2006-20120522-22225.html
24 http://www.spec.org/cpu2006/results/res2008q4/cpu2006-20081105-05843.html
25 Ibid.
26 http://www.emersonnetworkpower.com/en-
US/Brands/Liebert/Documents/White%20Papers/Emerson%20Network%20Power%20Higher%20Density%20Equals%20Lower%20Cost.pdf 27
http://www.intel.com/technology/eep/datacenter.pdf 28
http://www.principledtechnologies.com/Dell/R720_321_configuration.pdf 29
http://en.community.dell.com/techcenter/virtualization/w/wiki/3020.aspx 30
http://www.vmware.com/products/datacenter-virtualization/vsphere/vmotion.html 31
http://www.vmware.com/products/datacenter-virtualixation/vsphere/storare-vmotion.html 32
http://technet.microsoft.com/en-us/magazine/hh127064.aspx 33
http://www.vmware.com/products/datacenter-virtualization/vsphere/high-availability.html 34
http://content.dell.com/us/en/enterprise/d/virtualization/management-plug-in-for-vmware-vcenter 35
R720: http://www.spec.org/power_ssj2008/results/res2012q4/power_ssj2008-20121113-00578.html 36
R820: http://www.spec.org/power_ssj2008/results/res2012q4/power_ssj2008-20121113-00586.html 37
M820: http://www.spec.org/power_ssj2008/results/res2012q3/power_ssj2008-20120807-00525.html 38
M620: http://www.spec.org/power_ssj2008/results/res2012q2/power_ssj2008-20120320-00447.html 39
M420: http://www.spec.org/power_ssj2008/results/res2012q3/power_ssj2008-20120626-00504.html

A Principled Technologies white paper 53 Dell and the value of density
40 http://www.emersonnetworkpower.com/en-
US/Brands/Liebert/Documents/White%20Papers/Emerson%20Network%20Power%20Higher%20Density%20Equals%20Lower%20Cost.pdf 41
http://www.apcmedia.com/salestools/VAVR-6J5VYJ_R2_EN.pdf 42
Data approximated from: http://www.emersonnetworkpower.com/en-US/Brands/Liebert/Documents/White%20Papers/Emerson%20Network%20Power%20Higher%20Density%20Equals%20Lower%20Cost.pdf 43
http://i.dell.com/sites/doccontent/corporate/case-studies/en/Documents/2011-virtacore-10009304.pdf 44
Ibid. 45
http://www.datacenterjournal.com/design/the-price-of-data-center-availability/ 46
Ibid. 47
http://searchdisasterrecovery.techtarget.com/feature/Using-a-colocation-data-center-for-disaster-recovery 48
Ibid. 49
http://www.fogodatacenters.com/how-much-does-colocation-cost/ 50
http://www.nytimes.com/2011/01/02/business/02speed.html?pagewanted=all&_r=1& 51
http://content.dell.com/us/en/fedgov/d/fed/mobile-data-center 52
http://content.dell.com/us/en/fedgov/d/fed/mobile-data-center 53
http://www.fema.gov/disaster-process-disaster-aid-programs 54
For details, see Appendix B. 55
http://www.dell.com/us/business/p/powerconnect-8100/pd

A Principled Technologies white paper 54 Dell and the value of density
ABOUT PRINCIPLED TECHNOLOGIES
We provide industry-leading technology assessment and fact-based marketing
services. We bring to every assignment extensive experience with and
expertise in all aspects of technology testing and analysis, from researching
new technologies, to developing new methodologies, to testing with existing
and new tools.
When the assessment is complete, we know how to present the results to a
broad range of target audiences. We provide our clients with the materials they
need, from market-focused data to use in their own collateral to custom sales
aids, such as test reports, performance assessments, and white papers. Every
document reflects the results of our trusted independent analysis.
We provide customized services that focus on our clients’ individual
requirements. Whether the technology involves hardware, software, Web sites,
or services, we offer the experience, expertise, and tools to help our clients
assess how it will fare against its competition, its performance, its market
readiness, and its quality and reliability.
Our founders, Mark L. Van Name and Bill Catchings, have worked together in
technology assessment for over 20 years. As journalists, they published over a
thousand articles on a wide array of technology subjects. They created and led
the Ziff-Davis Benchmark Operation, which developed such industry-standard
benchmarks as Ziff Davis Media’s Winstone and WebBench. They founded and
led eTesting Labs, and after the acquisition of that company by Lionbridge
Technologies were the head and CTO of VeriTest.
Principled Technologies, Inc. 1007 Slater Road, Suite 300 Durham, NC, 27703 www.principledtechnologies.com
Principled Technologies is a registered trademark of Principled Technologies, Inc.
All other product names are the trademarks of their respective owners.
Disclaimer of Warranties; Limitation of Liability:
PRINCIPLED TECHNOLOGIES, INC. HAS MADE REASONABLE EFFORTS TO ENSURE THE ACCURACY AND VALIDITY OF ITS TESTING, HOWEVER, PRINCIPLED TECHNOLOGIES, INC. SPECIFICALLY DISCLAIMS ANY WARRANTY, EXPRESSED OR IMPLIED, RELATING TO THE TEST RESULTS AND ANALYSIS, THEIR ACCURACY, COMPLETENESS OR QUALITY, INCLUDING ANY IMPLIED WARRANTY OF FITNESS FOR ANY PARTICULAR PURPOSE. ALL PERSONS OR ENTITIES RELYING ON THE RESULTS OF ANY TESTING DO SO AT THEIR OWN RISK, AND AGREE THAT PRINCIPLED TECHNOLOGIES, INC., ITS EMPLOYEES AND ITS SUBCONTRACTORS SHALL HAVE NO LIABILITY WHATSOEVER FROM ANY CLAIM OF LOSS OR DAMAGE ON ACCOUNT OF ANY ALLEGED ERROR OR DEFECT IN ANY TESTING PROCEDURE OR RESULT.
IN NO EVENT SHALL PRINCIPLED TECHNOLOGIES, INC. BE LIABLE FOR INDIRECT, SPECIAL, INCIDENTAL, OR CONSEQUENTIAL DAMAGES IN CONNECTION WITH ITS TESTING, EVEN IF ADVISED OF THE POSSIBILITY OF SUCH DAMAGES. IN NO EVENT SHALL PRINCIPLED TECHNOLOGIES, INC.’S LIABILITY, INCLUDING FOR DIRECT DAMAGES, EXCEED THE AMOUNTS PAID IN CONNECTION WITH PRINCIPLED TECHNOLOGIES, INC.’S TESTING. CUSTOMER’S SOLE AND EXCLUSIVE REMEDIES ARE AS SET FORTH HEREIN.


![[NDA] DellEMC Networking Portfolio Overview(2016 …...Dell Networking C9010 Network Director Dell Networking C1048P Rapid Access Node 3x More 10/40GbE port density than Catalyst 6807XL](https://img.dokumen.tips/doc/110x75/5e79ce552caf0a580c6b8d7a/nda-dellemc-networking-portfolio-overview2016-dell-networking-c9010-network.jpg)