Embed Size (px)
Citation preview

PP
L CO
RP
OR
AT
ION
AN
NU
AL R
EP
OR
T 20
16
Delivering today for a brighter tomorrow.
PPL CORPORATIONANNUAL REPORT 2016

Headquarters: Allentown, Pa.
$7.5 billion in annual revenue
Total assets of $38 billion
Market capitalization of $23 billion
Seven regulated utility companies
More than 10 million utility customers (electricity and gas) in the U.S. and U.K.
About 8,000 megawatts of regulated generation capacity
Approximately 12,700 full-time employees
Approximately 218,000 miles of electric lines
144 billion kilowatt-hours of electricity delivered
Recipient of multiple customer satisfaction honorsAs of December 31, 2016
MAJOR BUSINESS SEGMENTS
KEY INFORMATION
U.K. Regulated PPL’s U.K. segment consists of the regulated electricity distribution operations of Western Power Distribution, which serves 7.8 million customers in central and southwest England and south Wales.
Kentucky Regulated PPL’s Kentucky segment consists primarily of the regulated electricity and natural gas operations of Louisville Gas and Electric Company and Kentucky Utilities Company, which serve 1.3 million customers in Kentucky, Virginia and Tennessee, and operate about 8,000 megawatts of regulated generating capacity.
Pennsylvania Regulated PPL’s Pennsylvania segment consists of the regulated electricity delivery operations of PPL Electric Utilities Corporation, which serves 1.4 million customers in eastern and central Pennsylvania.
PPL CORPORATION AT A GLANCE
WPD South Wales
WPD South West
WPD East Midlands
WPD West Midlands
Western PowerDistribution
PPL Electric Utilities
Cover: PPL employee Tonya Harris, with daughter Fiona. Throughout our business, Tonya and her nearly 13,000 PPL colleagues, including husband Jason and father Ronald, are focused on delivering today for a brighter tomorrow. We understand that the work we do today benefits not only our current customers, but future generations like Fiona’s.
Louisville Gas and Electric
Kentucky Utilities
Virginia
Regulated Power Plants

MESSAGE TO SHAREOWNERS
PPL Corporation 2016 Annual Report I
Few things are as essential to our quality of life as electricity.
At PPL, we understand that and recognize the responsibility we have to provide safe, reliable and affordable power to our customers, while growing value for our shareowners.
It’s that understanding that drives us every day. Our focus, from the top executives in our company to our linemen in the field, is delivering today for a brighter tomorrow.
Our strategy for growth is simple: Deliver industry-leading customer service and reliability. Invest responsibly in a sustainable energy future. Execute flawlessly. Maintain a strong financial foundation. And engage and develop our people.
In each of these areas, your company excelled in 2016.
Delivering industry-leading customer service and reliability
All three of PPL’s U.S. utilities received J.D. Power awards for residential customer satisfaction, achieving the highest overall marks by class and region based on customer surveys.
In addition, PPL’s four Western Power Distribution utilities (WPD) remained the top four performers in the United Kingdom for customer satisfaction. U.K. regulator Ofgem rated WPD best at engaging stakeholders and addressing vulnerable customers. And in terms of overall performance, WPD earned the highest performance incentive payments of any U.K. distribution network operator.
PPL’s U.K. segment also delivered its best year for network reliability, while PPL Electric Utilities’ reliability performance was among the nation’s best.
Investing responsibly in a sustainable energy future
Across PPL, we invested $3 billion to make the grid smarter, more reliable and more secure, and to advance a cleaner energy future.
In the U.K., we continued to expand and reinforce our distribution networks and to “lead the way,” according to the U.K.’s regulator, in developing innovative solutions to connect solar power to local networks. Our U.K. utilities have already connected 200,000 private solar installations. In addition, WPD launched the world’s largest electric vehicle pilot of its kind in 2016.
In Pennsylvania, we remained focused on transmission expansion to reinforce the grid. As a result of our continued efforts, sustained transmission outages have declined by nearly 75 percent over five years. In addition, we continued to modernize our distribution system. Today, we have one of the most robust and advanced distribution automation systems in the country. Smart grid enhancements in 2016 prevented more than 100,000 customer interruptions. Additional smart grid enhancements are planned for 2017, including our Keystone Solar Project, a pilot project supported by the U.S. Department of Energy and aimed at integrating more solar on the grid.
DEAR SHAREOWNERS,
Our focus, from the top executives in our company to our linemen in the field, is delivering today for a brighter tomorrow.
II PPL Corporation 2016 Annual Report
In Kentucky, we completed a multi-year, nearly $3 billion project to cut air emissions from our coal-fired power plants, finished construction of the state’s largest universal solar facil-ity, and introduced new solar subscription and onsite solar development options for customers.
Executing flawlessly
In 2016, we also upheld our unwavering commitment to executing our business plans. Flawless execution, in fact, is at the heart of PPL’s success.
We exceeded the high end of our 2016 reported earnings forecast range, with all of our U.S. and U.K. companies either delivering or exceeding expected results. At the same time, we grew per-share earnings from ongoing operations by 11 percent, exceeding the midpoint of our ongoing earnings forecast for the seventh straight year.
We delivered as planned on $3 billion in capital spending that benefits customers and shareowners. We energized our $350 million Northeast-Pocono transmission expansion project in Pennsylvania a year ahead of schedule. And in Kentucky, we completed our multi-year emissions improvement projects on schedule, nearly $300 million under original cost estimates and with a safety incident rate one-fifth the industry average for similar work – all while operating the affected power plants 24/7 for our customers.
Lastly, we committed in 2016 to begin growing our dividend more meaningfully in 2017. In February of this year, we delivered on that commitment, increasing our dividend by 4 percent, PPL’s 15th increase in 16 years. Our 2016 dividend yield continued to be among the highest in our sector.
Maintaining a strong financial foundation
In addition to a competitive dividend, in 2016 we maintained a strong balance sheet, investment-grade credit ratings and strong cash flow, fundamentals we are committed to keeping strong going forward.
In the process, we rose to the challenge posed by the U.K.’s June 23 Brexit vote – which had no effect on PPL’s U.K. operations, but weakened British pound sterling exchange rates. We acted decisively to monetize hedges and capture $310 million in hedge gains. The gains, which resulted from our effective and disciplined foreign currency risk management program, will be used to offset lower expected repatriation amounts from the U.K. and to support future dividend growth.
We established a new 2017 baseline for future earnings growth, one that reflects lower exchange rates; set a new projection of 5 to 6 percent annual earnings-per-share growth from 2017 to 2020; and solidified PPL’s dividend growth strategy, with a target to increase the dividend about 4 percent a year through 2020.
We took additional steps in the weeks and months following the Brexit vote to manage future foreign currency risk and greatly improve our risk profile. As a result, we are very confident in our ability to deliver the earnings and dividend growth we have projected.
Engaging and developing our people
Finally, from apprentices to lineman trainees to leaders at all levels throughout the business, we continued to invest in and develop our team of nearly 13,000 strong. We recognize that our employees drive our success, and we understand that a diverse, inclusive workforce only makes PPL stronger.
In closing, I would offer that to be a great company requires more than delivering great earnings results. It’s about making the world a little better each day.
At PPL, we plan to invest nearly $16 billion in the next five years to do just that – making the grid smarter, tougher and more resilient; advancing a cleaner energy future; putting people to work in family-sustaining jobs; and powering progress and prosperity in the communities we serve.
To us, delivering today for a brighter tomorrow is more than just a line on an Annual Report cover. It’s a calling, one that generations of PPL employees have answered.
On behalf of all of our employees, I thank you for your continued investment in PPL. We are committed to growing value for you today and tomorrow, and we are excited about the future for your company.
Sincerely,
William H. Spence Chairman, President and Chief Executive Officer
FINANCIAL & OPERATING HIGHLIGHTS
PPL Corporation 2016 Annual Report III
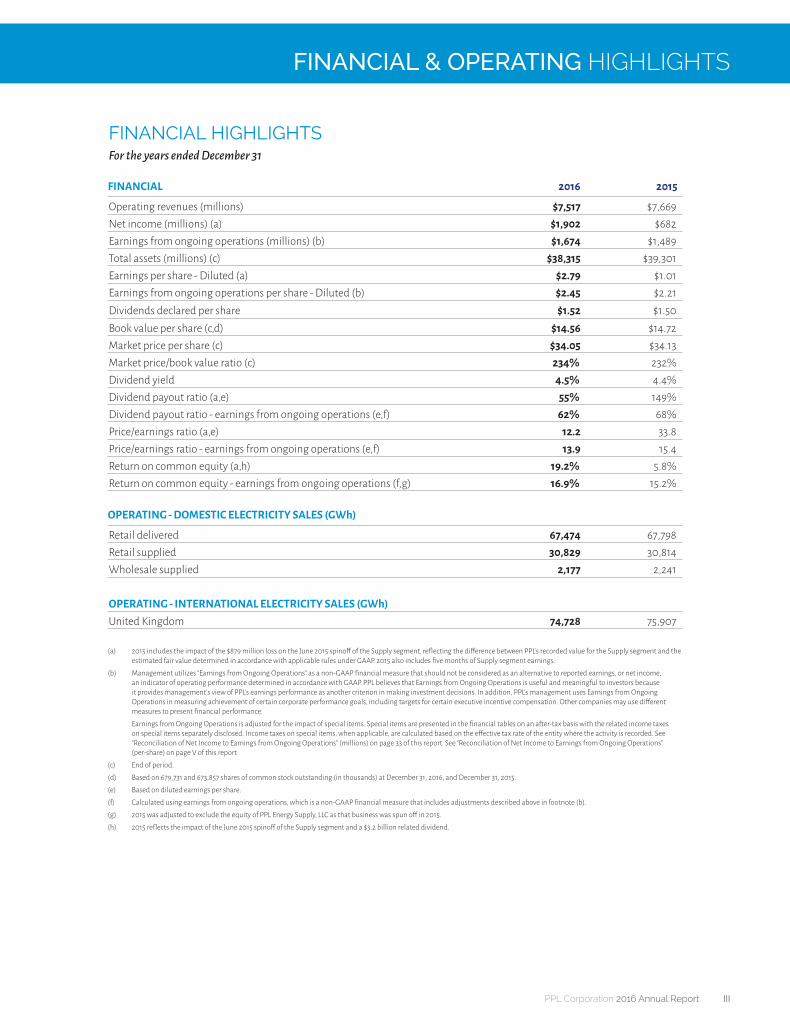
FINANCIAL HIGHLIGHTSFor the years ended December 31
FINANCIAL 2016 2015
Operating revenues (millions) $7,517 $7,669Net income (millions) (a) $1,902 $682Earnings from ongoing operations (millions) (b) $1,674 $1,489Total assets (millions) (c) $38,315 $39,301Earnings per share - Diluted (a) $2.79 $1.01Earnings from ongoing operations per share - Diluted (b) $2.45 $2.21Dividends declared per share $1.52 $1.50Book value per share (c,d) $14.56 $14.72Market price per share (c) $34.05 $34.13Market price/book value ratio (c) 234% 232%Dividend yield 4.5% 4.4%Dividend payout ratio (a,e) 55% 149%Dividend payout ratio - earnings from ongoing operations (e,f) 62% 68%Price/earnings ratio (a,e) 12.2 33.8Price/earnings ratio - earnings from ongoing operations (e,f) 13.9 15.4Return on common equity (a,h) 19.2% 5.8%Return on common equity - earnings from ongoing operations (f,g) 16.9% 15.2%
OPERATING - DOMESTIC ELECTRICITY SALES (GWh)
Retail delivered 67,474 67,798Retail supplied 30,829 30,814Wholesale supplied 2,177 2,241
OPERATING - INTERNATIONAL ELECTRICITY SALES (GWh)United Kingdom 74,728 75,907
(a) 2015 includes the impact of the $879 million loss on the June 2015 spinoff of the Supply segment, reflecting the difference between PPL’s recorded value for the Supply segment and the estimated fair value determined in accordance with applicable rules under GAAP. 2015 also includes five months of Supply segment earnings.
(b) Management utilizes “Earnings from Ongoing Operations” as a non-GAAP financial measure that should not be considered as an alternative to reported earnings, or net income, an indicator of operating performance determined in accordance with GAAP. PPL believes that Earnings from Ongoing Operations is useful and meaningful to investors because it provides management’s view of PPL’s earnings performance as another criterion in making investment decisions. In addition, PPL’s management uses Earnings from Ongoing Operations in measuring achievement of certain corporate performance goals, including targets for certain executive incentive compensation. Other companies may use different measures to present financial performance.
Earnings from Ongoing Operations is adjusted for the impact of special items. Special items are presented in the financial tables on an after-tax basis with the related income taxes on special items separately disclosed. Income taxes on special items, when applicable, are calculated based on the effective tax rate of the entity where the activity is recorded. See “Reconciliation of Net Income to Earnings from Ongoing Operations” (millions) on page 33 of this report. See “Reconciliation of Net Income to Earnings from Ongoing Operations” (per-share) on page V of this report.
(c) End of period.
(d) Based on 679,731 and 673,857 shares of common stock outstanding (in thousands) at December 31, 2016, and December 31, 2015.
(e) Based on diluted earnings per share.
(f) Calculated using earnings from ongoing operations, which is a non-GAAP financial measure that includes adjustments described above in footnote (b).
(g) 2015 was adjusted to exclude the equity of PPL Energy Supply, LLC as that business was spun off in 2015.
(h) 2015 reflects the impact of the June 2015 spinoff of the Supply segment and a $3.2 billion related dividend.

DIVIDENDS & TOTAL RETURN
IV PPL Corporation 2016 Annual Report
Dividends paid on PPL common stock are an important part of “total shareowner return,” which we define as common stock price appreciation plus reinvested dividends.
PPL has paid cash dividends on its stock in every quarter since 1946.
In February 2017, PPL announced a 4 percent increase in its dividend, raising the dividend from $1.52 per share to $1.58 per share on an annualized basis. The increased dividend was paid April 3 to shareowners of record as of March 10.
The increase was PPL’s 15th in 16 years. During that period, PPL’s dividend has increased 193 percent.
PPL’s high-performing regulated utility businesses provide a high level of stability to our earnings forecasts, dividend and credit ratings. Dividend increases reflect our continued confidence in the strength of PPL’s business portfolio and in its prospects for future growth.
Looking ahead, the company is targeting annual dividend growth of about 4 percent through 2020.
$166.92
$167.34
$195.26
$50
$60
$70
$80
$90
$100
$110
$120
$130
$140
$150
$160
$170
$180
$190
$200
$210
12/31/11 12/31/12 12/31/13 12/31/14 12/31/15 12/31/16
Value of Investment ($)
Comparison of 5-Year Cumulative Total ReturnFor PPL Corporation, S&P 500® Index and EEI Index of Investor-owned Electric Utilities*
PPL Corporation
S&P 500® Index
EEI Index of Investor-owned Electric Utilities
* Assumes investing $100 on December 31, 2011, and reinvesting dividends in PPL common stock, S&P 500® Index and EEI Index of Investor-owned Electric Utilities. Cash equivalent dividend of $2.505, related to the spin of the Supply business, is assumed reinvested on June 2, 2015, for PPL's TSR calculation.

FINANCIAL TABLE OF CONTENTS
Business ........................................................................................................................................................... 1
Selected Financial and Operating Data ........................................................................................................ 17
Combined Management's Discussion and Analysis of Financial Condition and
Results of Operations .................................................................................................................................... 18
Reports of Independent Registered Public Accounting Firms......................................................................68
Consolidated Statements of Income............................................................................................................. 71
Consolidated Statements of Comprehensive Income .................................................................................. 72
Consolidated Statements of Cash Flows....................................................................................................... 73
Consolidated Balance Sheets ........................................................................................................................74
Consolidated Statements of Equity............................................................................................................... 76
Combined Notes to Financial Statements
Note 1 Summary of Significant Accounting Policies ........................................................................ 77
Note 2 Segment and Related Information ........................................................................................92
Note 3 Preferred Securities ................................................................................................................94
Note 4 Earnings Per Share.................................................................................................................. 95
Note 5 Income and Other Taxes ........................................................................................................96
Note 6 Utility Rate Regulation......................................................................................................... 107
Note 7 Financing Activities ............................................................................................................... 117
Note 8 Acquisitions, Development and Divestitures...................................................................... 124
Note 9 Leases ................................................................................................................................... 128
Note 10 Stock-Based Compensation ................................................................................................. 128
Note 11 Retirement and Postemployment Benefits ..........................................................................133
Note 12 Jointly Owned Facilities......................................................................................................... 151
Note 13 Commitments and Contingencies........................................................................................152
Note 14 Related Party Transactions................................................................................................... 164
Note 15 Other Income (Expense) - net .............................................................................................. 165
Note 16 Fair Value Measurements..................................................................................................... 166
Note 17 Derivative Instruments and Hedging Activities .................................................................. 168
Note 18 Goodwill and Other Intangible Assets................................................................................. 176
Note 19 Asset Retirement Obligations.............................................................................................. 179
Note 20 Accumulated Other Comprehensive Income (Loss).............................................................181
Note 21 New Accounting Guidance Pending Adoption ................................................................... 182
Quarterly Financial, Common Stock Price and Dividend Data (Unaudited).............................................. 184
Management's Report on Internal Control over Financial Reporting ........................................................ 185
Glossary of Terms and Abbreviations.......................................................................................................... 186

Form 10-K for the year ended Dec. 31, 2016, was filed by PPL Corporation with the U.S. Securities and Exchange Commission on February 17, 2017. Please visit PPL Corporation's website, www.pplweb.com/investors, for the full text.
1
PART I
BUSINESS
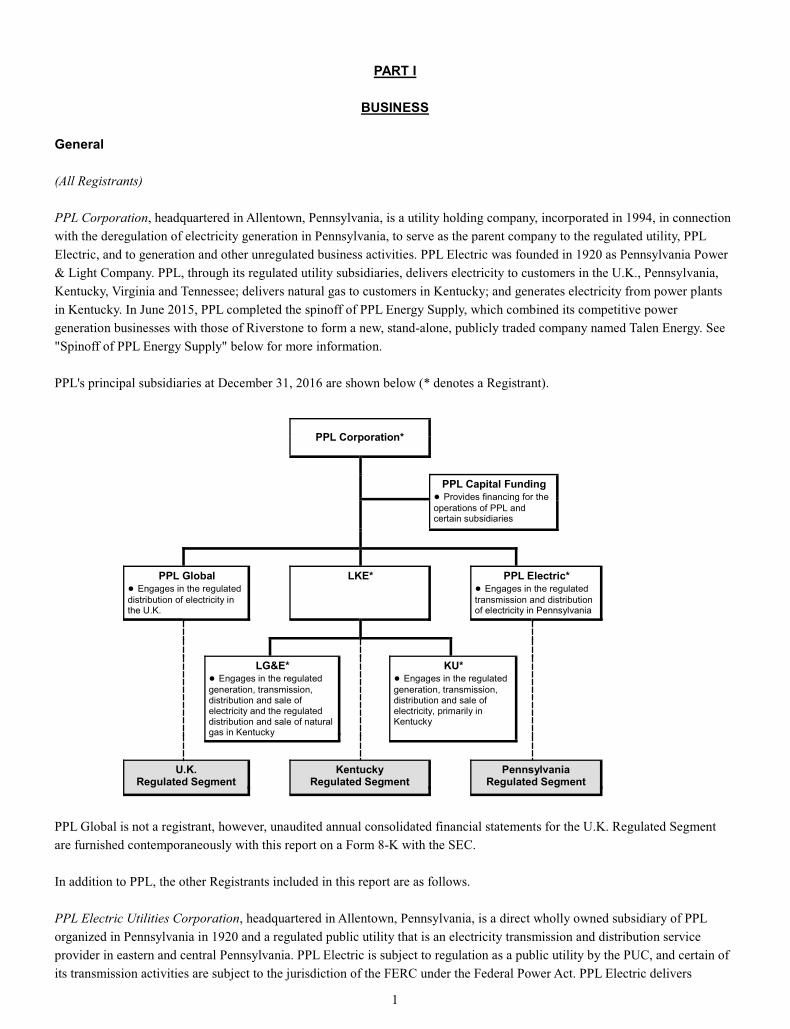
General (All Registrants) PPL Corporation, headquartered in Allentown, Pennsylvania, is a utility holding company, incorporated in 1994, in connection with the deregulation of electricity generation in Pennsylvania, to serve as the parent company to the regulated utility, PPL Electric, and to generation and other unregulated business activities. PPL Electric was founded in 1920 as Pennsylvania Power & Light Company. PPL, through its regulated utility subsidiaries, delivers electricity to customers in the U.K., Pennsylvania, Kentucky, Virginia and Tennessee; delivers natural gas to customers in Kentucky; and generates electricity from power plants in Kentucky. In June 2015, PPL completed the spinoff of PPL Energy Supply, which combined its competitive power generation businesses with those of Riverstone to form a new, stand-alone, publicly traded company named Talen Energy. See "Spinoff of PPL Energy Supply" below for more information. PPL's principal subsidiaries at December 31, 2016 are shown below (* denotes a Registrant).
PPL Corporation* PPL Capital Funding
Provides financing for the operations of PPL and certain subsidiaries
PPL Global Engages in the regulated
distribution of electricity in the U.K.
LKE*
PPL Electric* Engages in the regulated
transmission and distribution of electricity in Pennsylvania
LG&E* Engages in the regulated
generation, transmission, distribution and sale of electricity and the regulated distribution and sale of natural gas in Kentucky
KU* Engages in the regulated
generation, transmission, distribution and sale of electricity, primarily in Kentucky
U.K. Regulated Segment Kentucky
Regulated Segment Pennsylvania Regulated Segment
PPL Global is not a registrant, however, unaudited annual consolidated financial statements for the U.K. Regulated Segment are furnished contemporaneously with this report on a Form 8-K with the SEC. In addition to PPL, the other Registrants included in this report are as follows. PPL Electric Utilities Corporation, headquartered in Allentown, Pennsylvania, is a direct wholly owned subsidiary of PPL organized in Pennsylvania in 1920 and a regulated public utility that is an electricity transmission and distribution service provider in eastern and central Pennsylvania. PPL Electric is subject to regulation as a public utility by the PUC, and certain of its transmission activities are subject to the jurisdiction of the FERC under the Federal Power Act. PPL Electric delivers

2
electricity in its Pennsylvania service area and provides electricity supply to retail customers in that area as a PLR under the Customer Choice Act. LG&E and KU Energy LLC, headquartered in Louisville, Kentucky, is a wholly owned subsidiary of PPL and a holding company that owns regulated utility operations through its subsidiaries, LG&E and KU, which constitute substantially all of LKE's assets. LG&E and KU are engaged in the generation, transmission, distribution and sale of electricity. LG&E also engages in the distribution and sale of natural gas. LG&E and KU maintain separate corporate identities and serve customers in Kentucky under their respective names. KU also serves customers in Virginia under the Old Dominion Power name and in Tennessee under the KU name. LKE, formed in 2003, is the successor to a Kentucky entity incorporated in 1989. Louisville Gas and Electric Company, headquartered in Louisville, Kentucky, is a wholly owned subsidiary of LKE and a regulated utility engaged in the generation, transmission, distribution and sale of electricity and distribution and sale of natural gas in Kentucky. LG&E is subject to regulation as a public utility by the KPSC, and certain of its transmission activities are subject to the jurisdiction of the FERC under the Federal Power Act. LG&E was incorporated in 1913. Kentucky Utilities Company, headquartered in Lexington, Kentucky, is a wholly owned subsidiary of LKE and a regulated utility engaged in the generation, transmission, distribution and sale of electricity in Kentucky, Virginia and Tennessee. KU is subject to regulation as a public utility by the KPSC and the VSCC, and certain of its transmission and wholesale power activities are subject to the jurisdiction of the FERC under the Federal Power Act. KU serves its Virginia customers under the Old Dominion Power name and its Kentucky and Tennessee customers under the KU name. KU was incorporated in Kentucky in 1912 and in Virginia in 1991. (PPL) Spinoff of PPL Energy Supply In June 2014, PPL and PPL Energy Supply executed definitive agreements with affiliates of Riverstone to spin off PPL Energy Supply and immediately combine it with Riverstone's competitive power generation businesses to form a new, stand-alone, publicly traded company named Talen Energy. On April 29, 2015, PPL's Board of Directors declared the June 1, 2015 distribution to PPL's shareowners of record on May 20, 2015 of a newly formed entity, Holdco, which at closing owned all of the membership interests of PPL Energy Supply and all of the common stock of Talen Energy. Immediately following the spinoff on June 1, 2015, Holdco merged with a special purpose subsidiary of Talen Energy, with Holdco continuing as the surviving company to the merger and as a wholly owned subsidiary of Talen Energy and the sole owner of PPL Energy Supply. Substantially contemporaneous with the spinoff and merger, RJS Power was contributed by its owners to become a subsidiary of Talen Energy. PPL's shareowners received approximately 0.1249 shares of Talen Energy common stock for each share of PPL common stock they owned on May 20, 2015. Following completion of these transactions, PPL shareowners owned 65% of Talen Energy and affiliates of Riverstone owned 35%. The spinoff had no effect on the number of PPL common shares owned by PPL shareowners or the number of shares of PPL common stock outstanding. The transaction is intended to be tax-free to PPL and its shareowners for U.S. federal income tax purposes. PPL has no continuing ownership interest in or control of Talen Energy and Talen Energy Supply (formerly PPL Energy Supply). See Note 8 to the Financial Statements for additional information.
3
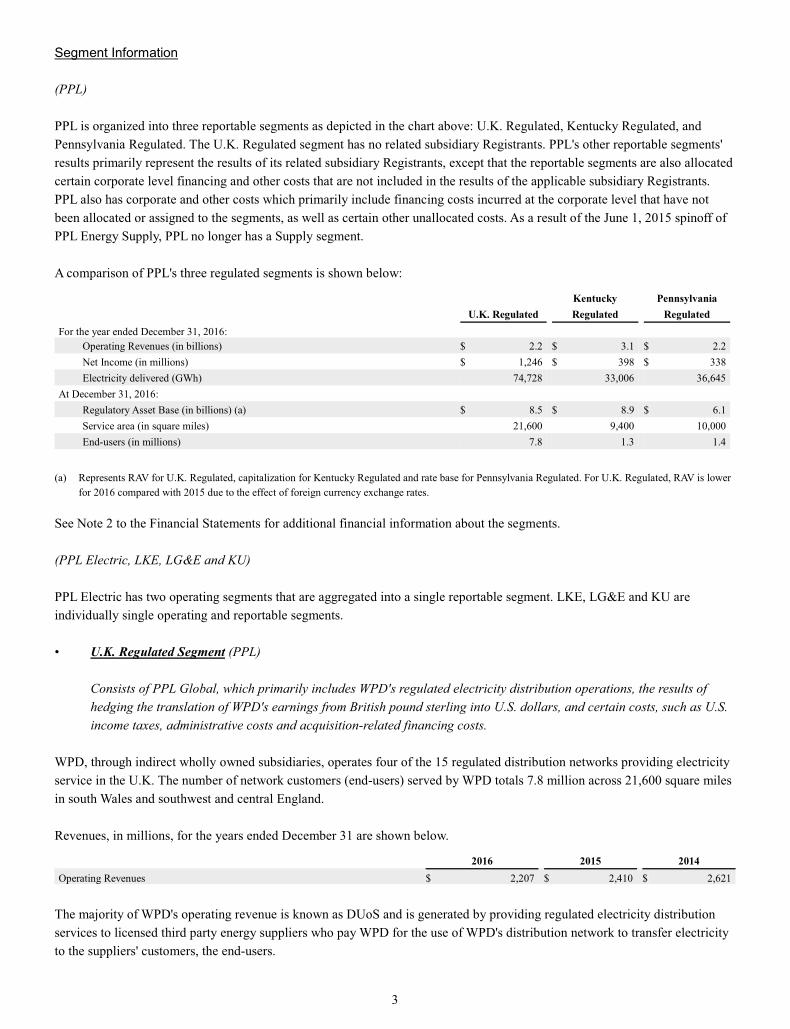
Segment Information (PPL) PPL is organized into three reportable segments as depicted in the chart above: U.K. Regulated, Kentucky Regulated, and Pennsylvania Regulated. The U.K. Regulated segment has no related subsidiary Registrants. PPL's other reportable segments' results primarily represent the results of its related subsidiary Registrants, except that the reportable segments are also allocated certain corporate level financing and other costs that are not included in the results of the applicable subsidiary Registrants. PPL also has corporate and other costs which primarily include financing costs incurred at the corporate level that have not been allocated or assigned to the segments, as well as certain other unallocated costs. As a result of the June 1, 2015 spinoff of PPL Energy Supply, PPL no longer has a Supply segment. A comparison of PPL's three regulated segments is shown below:
Kentucky Pennsylvania
U.K. Regulated Regulated Regulated For the year ended December 31, 2016:
Operating Revenues (in billions) $ 2.2 $ 3.1 $ 2.2 Net Income (in millions) $ 1,246 $ 398 $ 338 Electricity delivered (GWh) 74,728 33,006 36,645
At December 31, 2016: Regulatory Asset Base (in billions) (a) $ 8.5 $ 8.9 $ 6.1 Service area (in square miles) 21,600 9,400 10,000 End-users (in millions) 7.8 1.3 1.4
(a) Represents RAV for U.K. Regulated, capitalization for Kentucky Regulated and rate base for Pennsylvania Regulated. For U.K. Regulated, RAV is lower
for 2016 compared with 2015 due to the effect of foreign currency exchange rates.
See Note 2 to the Financial Statements for additional financial information about the segments. (PPL Electric, LKE, LG&E and KU) PPL Electric has two operating segments that are aggregated into a single reportable segment. LKE, LG&E and KU are individually single operating and reportable segments. • U.K. Regulated Segment (PPL)
Consists of PPL Global, which primarily includes WPD's regulated electricity distribution operations, the results of hedging the translation of WPD's earnings from British pound sterling into U.S. dollars, and certain costs, such as U.S. income taxes, administrative costs and acquisition-related financing costs.
WPD, through indirect wholly owned subsidiaries, operates four of the 15 regulated distribution networks providing electricity service in the U.K. The number of network customers (end-users) served by WPD totals 7.8 million across 21,600 square miles in south Wales and southwest and central England. Revenues, in millions, for the years ended December 31 are shown below.
2016 2015 2014 Operating Revenues $ 2,207 $ 2,410 $ 2,621
The majority of WPD's operating revenue is known as DUoS and is generated by providing regulated electricity distribution services to licensed third party energy suppliers who pay WPD for the use of WPD's distribution network to transfer electricity to the suppliers' customers, the end-users.

4
Franchise and Licenses The operations of WPD's principal subsidiaries, WPD (South West), WPD (South Wales), WPD (East Midlands) and WPD (West Midlands), are regulated by Ofgem under the direction of the Gas and Electricity Markets Authority. The Electricity Act 1989 provides the fundamental framework for electricity companies and established licenses that require each of the DNOs to develop, maintain and operate efficient distribution networks. WPD operates under a regulatory year that begins April 1 and ends March 31 of each year. WPD is authorized by Ofgem to provide electricity distribution services within its concession areas and service territories, subject to certain conditions and obligations. For instance, WPD is subject to Ofgem regulation with respect to the regulated revenue it can earn and the quality of service it must provide, and WPD can be fined or have its licenses revoked if it does not meet the mandated standard of service. Ofgem has formal powers to propose modifications to each distribution license. In January 2014, Ofgem and WPD agreed to a reduction of £5 per residential end-user in the 2014/15 regulatory year to be recovered in the 2016/17 regulatory year. See "Combined Management's Discussion and Analysis of Financial Condition and Results of Operations - Overview - U.K. Distribution Revenue Reduction" for additional information.
Competition Although WPD operates in non-exclusive concession areas in the U.K., it currently faces little competition with respect to end-users connected to its network. WPD's four distribution businesses are, therefore, regulated monopolies, which operate under regulatory price controls.
Revenue and Regulation Ofgem has adopted a price control mechanism that establishes the amount of base demand revenue WPD can earn, subject to certain true-ups, and provides for an increase or reduction in revenues based on incentives or penalties for performance relative to pre-established targets. WPD's allowed revenue primarily includes base demand revenue (adjusted for inflation using RPI), performance incentive revenues or penalties, adjustments for over- or under-recovery from prior periods and adjustments related to the DPCR4 line loss close out. WPD is currently operating under the eight-year price control period of RIIO-ED1, which commenced on April 1, 2015. The RIIO framework is intended to:
• encourage DNOs to deliver safe, reliable and sustainable network service at long-term value to customers; • enable DNOs to finance required investment in a timely and efficient way; • remunerate DNOs according to their delivery for customers; • increase emphasis on outputs and incentives; • enhance stakeholder engagement including network customers; • provide a stronger incentive framework to encourage more efficient investment and innovation; and • continue to stimulate innovation.
Additionally, from a financial perspective the RIIO-ED1 framework:
• regulates revenues for the DNOs in real terms using 2012/13 prices; • inflates revenue components using the RPI beginning March 31, 2013, which has the effect of inflating RAV, with
respect to base demand revenue; • splits the recovery of Totex between immediate recovery (called "fast pot") and deferred recovery as an addition to the
RAV (called "slow pot"); • provides DNOs with a general pass-through for costs over which the DNOs have no control (i.e., Ofgem fees, National
Grid transmission charges and property taxes); • provides a tax allowance based on Ofgem's notional tax charge, which may not equal the actual corporate tax paid;

5
• extends the recovery period for depreciation of RAV additions after April 1, 2015 from a 20 year life as used under DPCR5, to 45 years, with a transitional arrangement that will gradually increase the average asset life for RAV additions during RIIO-ED1 to approximately 35 years. The RAV as of March 31, 2015 will continue to be depreciated over 20 years. The asset lives used to determine depreciation expense for U.S. GAAP purposes are not the same as those used for the depreciation of the RAV in setting revenues and, as such, vary by asset type and are based on the expected useful lives of the assets;
• provides successful DNOs an incentive to be fast-tracked through the regulatory approval process, equivalent to 2.5% of Totex during the 8-year price control period; and
• maintains an incentive scheme for DNOs to be rewarded or penalized for performance in the areas of reliability and customer satisfaction, but places a maximum cap on the amount of incentive revenues that can be earned by a DNO.
The key components of WPD's four Ofgem-accepted RIIO-ED1 business plans are: • all four DNO business plans were accepted for fast-track status (fast-track incentive is worth approximately $35 million
annually for WPD assuming a $1.30/£ foreign currency exchange rate); • WPD received a higher level of cost savings retention, which was established at 70% for WPD compared to
approximately 55% for slow-tracked DNOs; • a cost of debt recovery comprised of a 10-year trailing average debt allowance, to be adjusted annually, compared to a
20-year trailing average for slow-tracked DNOs applied to 65% of RAV; • a return on regulatory equity (RORE) allowance with an equity ratio of 35% of RAV and a cost of equity rate of 6.4%
compared to 6.0% for slow-tracked DNOs; • a Totex split of 80% slow pot and 20% fast pot; • recovery of approximately 80% of pension deficit funding for certain of WPD's defined benefit pension plans; and • incentive targets that are significantly more stringent than those set under DPCR5, reducing the expected incentive
revenues WPD can earn in RIIO-ED1 compared to DPCR5.
WPD's combined business plans include funding for total expenditures of approximately $16.6 billion over the eight-year period (assuming a $1.30/£ foreign currency exchange rate), broken down as follows:
• Totex - $11.0 billion ($8.8 billion additions to RAV; $2.2 billion fast pot); • Pension deficit funding - $1.6 billion; • Cost of debt recovery - $1.3 billion; • Property taxes, Ofgem fees and National Grid transmissions charges - $2.1 billion; and • Corporate income taxes recovery - $600 million.
The U.K. regulatory structure is an incentive-based structure in contrast to the typical U.S. regulatory structure, which operates on a cost-recovery model. The base demand revenue that a DNO can earn in each year of the current price control period is the sum of:
• a return on capital from RAV; • a return of capital from RAV (i.e., depreciation); • the fast pot recovery; • pension deficit funding; • an allowance for cash taxes paid less a potential reduction for tax benefits from excess leverage if a DNO is levered
more than 65% Debt/RAV; • certain pass-through costs over which the DNO has no control; • certain legacy price control adjustments from preceding price control periods, including the information quality
incentive (also known as the rolling RAV incentive); • fast-track incentive - because WPD's four DNOs were fast-tracked through the price control review process for RIIO-
ED1, their base demand revenue also includes the fast-track incentive discussed above; • profiling adjustments - these adjustments do not affect the total base demand revenue in real terms over the eight-year
price control period, but change the year in which the revenue is earned; • adjustments from the Annual Iteration Process (AIP), discussed further below; and • adjustments for inflation true-ups, discussed further below.

6
In addition to base demand revenue, WPD's allowed revenue primarily includes:
• an increase or reduction in revenues based on incentives or penalties for actual performance against pre-established targets from prior periods;
• adjustments for over- or under-recovery of allowed revenue from prior periods; and • a reduction in revenue related to the DPCR4 line loss close out.
During DPCR5, the prior price control review period, WPD's total base demand revenue for the five-year period was profiled in a manner that resulted in a weighted-average increase of about 5.5% per year for all four DNOs. In the first year of RIIO-ED1, base demand revenue decreased by about 11.8% primarily due to a change in profiling methodology and a lower weighted-average cost of capital. Base demand revenue will then increase by approximately 2.5% per annum before inflation for regulatory years up to March 31, 2018 and by approximately 1% per annum before inflation for each regulatory year thereafter for the remainder of RIIO-ED1. As the regulatory model is incentive based rather than a cost recovery model, WPD is not subject to accounting for the effects of certain types of regulation as prescribed by GAAP. Therefore, the accounting treatment of adjustments to base demand revenue and/or allowed revenue is evaluated based on revenue recognition and contingency accounting guidance. Base Demand Revenue True-up Mechanisms Unlike prior price control reviews, base demand revenue under RIIO-ED1 will be adjusted during the price control period. The most significant of those adjustments are:
• Inflation True-Up - The base demand revenue for the RIIO-ED1 period was set in 2012/13 prices. Therefore an inflation factor as determined by forecasted RPI, provided by HM Treasury, is applied to base demand revenue. Forecasted RPI is trued up to actuals and affects future base demand revenue two regulatory years later. This revenue change is called the "TRU" adjustment.
The TRU for the 2015/16 regulatory year was a $40 million reduction to revenue and will reduce base demand revenue in calendar years 2017 and 2018 by $27 million and $13 million, respectively.
The projected TRU for the 2016/17 regulatory year is a $6 million reduction to revenue and will reduce base demand revenue in calendar years 2018 and 2019 by $4 million and $2 million, respectively.
• Annual Iteration Process - The RIIO-ED1 price control period also includes an Annual Iteration Process (AIP). This
will allow future base demand revenues agreed with the regulator as part of the price control review to be updated during the price control period for financial adjustments including tax, pensions and cost of debt, legacy price control adjustments from preceding price control periods and adjustments relating to actual and allowed total expenditure together with the Totex Incentive Mechanism (TIM). Under the TIM, WPD's DNOs are able to retain 70% of any amounts not spent against the RIIO-ED1 plan and bear 70% of any over-spends. The AIP calculates an incremental change to base demand revenue, known as the "MOD" adjustment.
The MOD provided by Ofgem in November 2016 included the TIM for the 2015/16 regulatory year as well as the cost of debt calculation based on the 10-year trailing average to October 2016. This MOD of $15 million will reduce base demand revenue in calendar years 2017 and 2018 by $10 million and $5 million, respectively.
The projected MOD for the 2016/17 regulatory year is a $52 million reduction to revenue and will reduce base demand revenue in calendar years 2018 and 2019 by $35 million and $17 million, respectively.
As both MOD and TRU are changes to future base demand revenues as determined by Ofgem, these adjustments are recognized as a component of revenues in future years in which service is provided and revenues are collected or returned to customers. PPL's projected earnings per share growth rate through 2020 includes both the TRU and MOD for regulatory year 2015/16 and the estimated TRU and MOD for 2016/17.
7
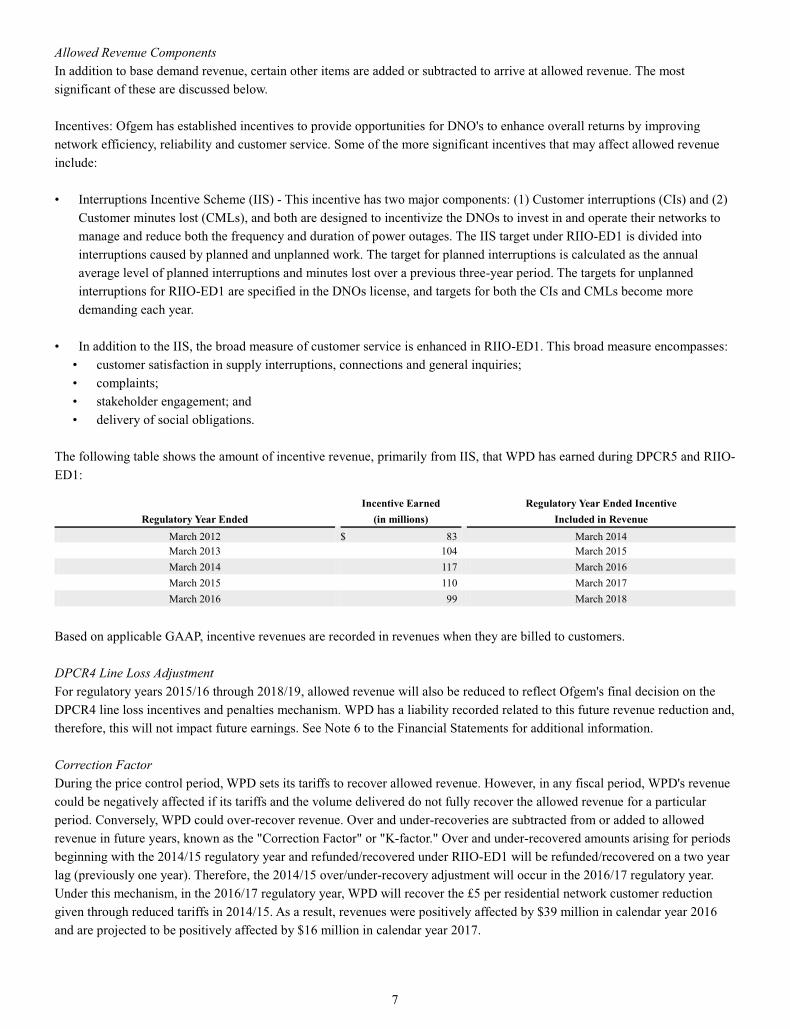
Allowed Revenue Components In addition to base demand revenue, certain other items are added or subtracted to arrive at allowed revenue. The most significant of these are discussed below. Incentives: Ofgem has established incentives to provide opportunities for DNO's to enhance overall returns by improving network efficiency, reliability and customer service. Some of the more significant incentives that may affect allowed revenue include: • Interruptions Incentive Scheme (IIS) - This incentive has two major components: (1) Customer interruptions (CIs) and (2)
Customer minutes lost (CMLs), and both are designed to incentivize the DNOs to invest in and operate their networks to manage and reduce both the frequency and duration of power outages. The IIS target under RIIO-ED1 is divided into interruptions caused by planned and unplanned work. The target for planned interruptions is calculated as the annual average level of planned interruptions and minutes lost over a previous three-year period. The targets for unplanned interruptions for RIIO-ED1 are specified in the DNOs license, and targets for both the CIs and CMLs become more demanding each year.
• In addition to the IIS, the broad measure of customer service is enhanced in RIIO-ED1. This broad measure encompasses: • customer satisfaction in supply interruptions, connections and general inquiries; • complaints; • stakeholder engagement; and • delivery of social obligations.
The following table shows the amount of incentive revenue, primarily from IIS, that WPD has earned during DPCR5 and RIIO-ED1:
Incentive Earned Regulatory Year Ended Incentive Regulatory Year Ended (in millions) Included in Revenue
March 2012 $ 83 March 2014 March 2013 104 March 2015 March 2014 117 March 2016 March 2015 110 March 2017 March 2016 99 March 2018
Based on applicable GAAP, incentive revenues are recorded in revenues when they are billed to customers. DPCR4 Line Loss Adjustment For regulatory years 2015/16 through 2018/19, allowed revenue will also be reduced to reflect Ofgem's final decision on the DPCR4 line loss incentives and penalties mechanism. WPD has a liability recorded related to this future revenue reduction and, therefore, this will not impact future earnings. See Note 6 to the Financial Statements for additional information. Correction Factor During the price control period, WPD sets its tariffs to recover allowed revenue. However, in any fiscal period, WPD's revenue could be negatively affected if its tariffs and the volume delivered do not fully recover the allowed revenue for a particular period. Conversely, WPD could over-recover revenue. Over and under-recoveries are subtracted from or added to allowed revenue in future years, known as the "Correction Factor" or "K-factor." Over and under-recovered amounts arising for periods beginning with the 2014/15 regulatory year and refunded/recovered under RIIO-ED1 will be refunded/recovered on a two year lag (previously one year). Therefore, the 2014/15 over/under-recovery adjustment will occur in the 2016/17 regulatory year. Under this mechanism, in the 2016/17 regulatory year, WPD will recover the £5 per residential network customer reduction given through reduced tariffs in 2014/15. As a result, revenues were positively affected by $39 million in calendar year 2016 and are projected to be positively affected by $16 million in calendar year 2017.

8
Historically, tariffs have been set a minimum of three months prior to the beginning of the regulatory year (April 1). In February 2015, Ofgem determined that, beginning with the 2017/18 regulatory year, tariffs would be established a minimum of fifteen months in advance. Therefore, in December 2015, WPD was required to establish tariffs for 2016/17 and 2017/18. This change will potentially increase volatility in future revenue forecasts due to the need to forecast components of allowed revenue including MOD, TRU, K-factor and incentive revenues. See Note 1 to the Financial Statements for additional information on revenue recognition.
Customers WPD provides regulated electricity distribution services to licensed third party energy suppliers who use WPD's networks to transfer electricity to their customers, the end-users. WPD bills energy suppliers for this service and the supplier is responsible for billing its end-users. Ofgem requires that all licensed electricity distributors and suppliers become parties to the Distribution Connection and Use of System Agreement. This agreement specifies how creditworthiness will be determined and, as a result, whether the supplier needs to collateralize its payment obligations. • Kentucky Regulated Segment (PPL)
Consists of the operations of LKE, which owns and operates regulated public utilities engaged in the generation, transmission, distribution and sale of electricity and distribution and sale of natural gas, representing primarily the activities of LG&E and KU. In addition, certain acquisition-related financing costs are allocated to the Kentucky Regulated segment.
(PPL, LKE, LG&E and KU) LG&E and KU, direct subsidiaries of LKE, are engaged in the regulated generation, transmission, distribution and sale of electricity in Kentucky and, in KU's case, Virginia and Tennessee. LG&E also engages in the distribution and sale of natural gas in Kentucky. LG&E provides electric service to approximately 407,000 customers in Louisville and adjacent areas in Kentucky, covering approximately 700 square miles in nine counties and provides natural gas service to approximately 324,000 customers in its electric service area and eight additional counties in Kentucky. KU provides electric service to approximately 521,000 customers in 77 counties in central, southeastern and western Kentucky, approximately 28,000 customers in five counties in southwestern Virginia, and four customers in Tennessee, covering approximately 4,800 non-contiguous square miles. KU also sells wholesale electricity to 11 municipalities in Kentucky under load following contracts. Details of operating revenues, in millions, by customer class for the years ended December 31 are shown below.
2016 2015 2014
Revenue % of Revenue Revenue % of
Revenue Revenue % of Revenue
LKE Commercial $ 834 27 $ 816 26 $ 815 26 Industrial 601 19 628 20 627 20 Residential 1,261 40 1,245 40 1,281 40 Retail - other 288 9 267 9 279 9 Wholesale - municipal 116 4 114 4 109 3 Wholesale - other (a) 41 1 45 1 57 2 Total $ 3,141 100 $ 3,115 100 $ 3,168 100
(a) Includes wholesale power and transmission revenues.

9
2016 2015 2014
Revenue % of Revenue Revenue % of
Revenue Revenue % of Revenue
LG&E Commercial $ 442 31 $ 436 30 $ 433 28 Industrial 185 13 199 14 194 13 Residential 627 44 633 44 650 43 Retail - other 135 9 117 8 130 8 Wholesale - other (a) (b) 41 3 59 4 126 8 Total $ 1,430 100 $ 1,444 100 $ 1,533 100
(a) Includes wholesale power and transmission revenues. (b) Includes intercompany power sales and transmission revenues, which are eliminated upon consolidation at LKE.
2016 2015 2014
Revenue % of Revenue Revenue % of
Revenue Revenue % of Revenue
KU Commercial $ 392 22 $ 380 22 $ 382 22 Industrial 416 24 429 25 433 25 Residential 634 36 612 35 631 36 Retail - other 153 9 150 9 149 9 Wholesale - municipal 116 7 114 7 109 6 Wholesale - other (a) (b) 38 2 43 2 33 2 Total $ 1,749 100 $ 1,728 100 $ 1,737 100
(a) Includes wholesale power and transmission revenues. (b) Includes intercompany power sales and transmission revenues, which are eliminated upon consolidation at LKE.
Franchises and Licenses
LG&E and KU provide electricity delivery service, and LG&E provides natural gas distribution service, in their respective service territories pursuant to certain franchises, licenses, statutory service areas, easements and other rights or permissions granted by state legislatures, cities or municipalities or other entities.
Competition There are currently no other electric public utilities operating within the electric service areas of LKE. From time to time, bills are introduced into the Kentucky General Assembly which seek to authorize, promote or mandate increased distributed generation, customer choice or other developments. Neither the Kentucky General Assembly nor the KPSC has adopted or approved a plan or timetable for retail electric industry competition in Kentucky. The nature or timing of legislative or regulatory actions, if any, regarding industry restructuring and their impact on LKE, which may be significant, cannot currently be predicted. Virginia, formerly a deregulated jurisdiction, has enacted legislation that implemented a hybrid model of cost-based regulation. KU's operations in Virginia have been and remain regulated. Alternative energy sources such as electricity, oil, propane and other fuels indirectly impact LKE's natural gas revenues. Marketers may also compete to sell natural gas to certain large end-users. LG&E's natural gas tariffs include gas price pass-through mechanisms relating to its sale of natural gas as a commodity; therefore, customer natural gas purchases from alternative suppliers do not generally impact LG&E's profitability. Some large industrial and commercial customers, however, may physically bypass LG&E's facilities and seek delivery service directly from interstate pipelines or other natural gas distribution systems.
10
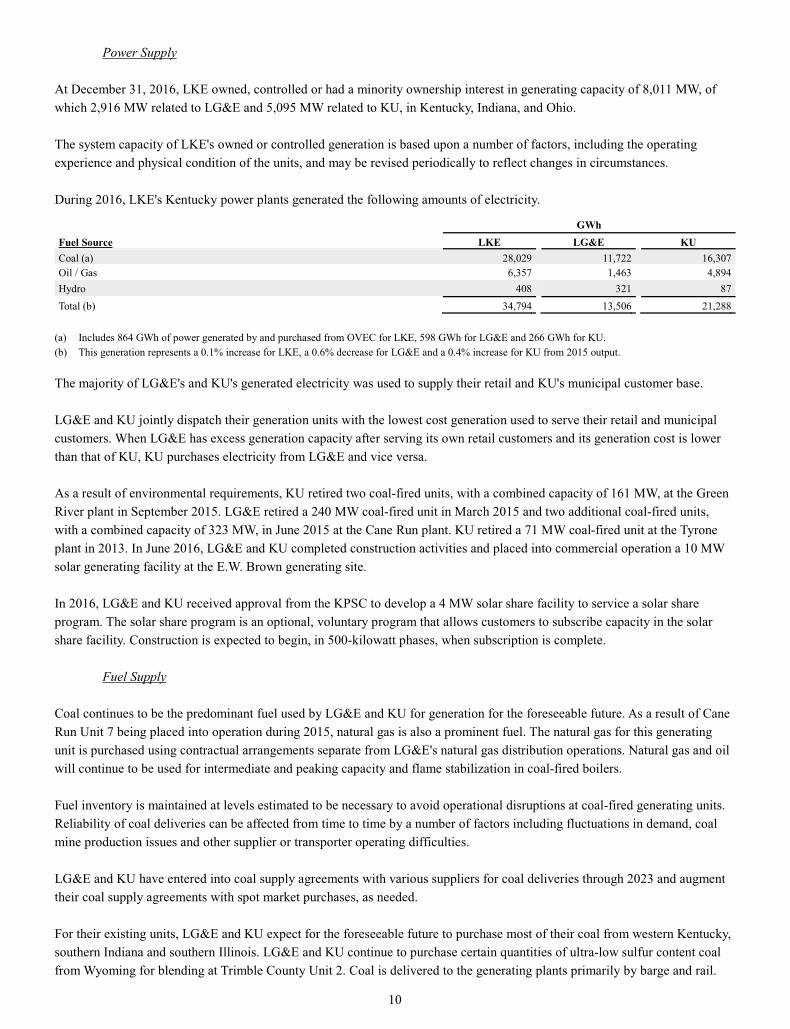
Power Supply At December 31, 2016, LKE owned, controlled or had a minority ownership interest in generating capacity of 8,011 MW, of which 2,916 MW related to LG&E and 5,095 MW related to KU, in Kentucky, Indiana, and Ohio. The system capacity of LKE's owned or controlled generation is based upon a number of factors, including the operating experience and physical condition of the units, and may be revised periodically to reflect changes in circumstances. During 2016, LKE's Kentucky power plants generated the following amounts of electricity.
GWh Fuel Source LKE LG&E KU Coal (a) 28,029 11,722 16,307 Oil / Gas 6,357 1,463 4,894 Hydro 408 321 87 Total (b) 34,794 13,506 21,288
(a) Includes 864 GWh of power generated by and purchased from OVEC for LKE, 598 GWh for LG&E and 266 GWh for KU. (b) This generation represents a 0.1% increase for LKE, a 0.6% decrease for LG&E and a 0.4% increase for KU from 2015 output.
The majority of LG&E's and KU's generated electricity was used to supply their retail and KU's municipal customer base. LG&E and KU jointly dispatch their generation units with the lowest cost generation used to serve their retail and municipal customers. When LG&E has excess generation capacity after serving its own retail customers and its generation cost is lower than that of KU, KU purchases electricity from LG&E and vice versa. As a result of environmental requirements, KU retired two coal-fired units, with a combined capacity of 161 MW, at the Green River plant in September 2015. LG&E retired a 240 MW coal-fired unit in March 2015 and two additional coal-fired units, with a combined capacity of 323 MW, in June 2015 at the Cane Run plant. KU retired a 71 MW coal-fired unit at the Tyrone plant in 2013. In June 2016, LG&E and KU completed construction activities and placed into commercial operation a 10 MW solar generating facility at the E.W. Brown generating site. In 2016, LG&E and KU received approval from the KPSC to develop a 4 MW solar share facility to service a solar share program. The solar share program is an optional, voluntary program that allows customers to subscribe capacity in the solar share facility. Construction is expected to begin, in 500-kilowatt phases, when subscription is complete.
Fuel Supply Coal continues to be the predominant fuel used by LG&E and KU for generation for the foreseeable future. As a result of Cane Run Unit 7 being placed into operation during 2015, natural gas is also a prominent fuel. The natural gas for this generating unit is purchased using contractual arrangements separate from LG&E's natural gas distribution operations. Natural gas and oil will continue to be used for intermediate and peaking capacity and flame stabilization in coal-fired boilers. Fuel inventory is maintained at levels estimated to be necessary to avoid operational disruptions at coal-fired generating units. Reliability of coal deliveries can be affected from time to time by a number of factors including fluctuations in demand, coal mine production issues and other supplier or transporter operating difficulties. LG&E and KU have entered into coal supply agreements with various suppliers for coal deliveries through 2023 and augment their coal supply agreements with spot market purchases, as needed. For their existing units, LG&E and KU expect for the foreseeable future to purchase most of their coal from western Kentucky, southern Indiana and southern Illinois. LG&E and KU continue to purchase certain quantities of ultra-low sulfur content coal from Wyoming for blending at Trimble County Unit 2. Coal is delivered to the generating plants primarily by barge and rail.

11
To enhance the reliability of natural gas supply, LG&E and KU have secured firm long-term pipeline transport capacity with contracts of various durations from 2019 to 2024 on the interstate pipeline serving Cane Run Unit 7. This pipeline also serves the six simple cycle combustion turbine units located at the Trimble County site as well as four other simple cycle units at the Cane Run and Paddy's Run sites. LG&E has also secured long-term firm pipeline transport capacity on an interstate pipeline for the summer months through October 2018 to serve an additional simple cycle gas turbine operated under a tolling agreement. For the seven simple cycle combustion turbines at the E.W. Brown facility, no firm long-term pipeline transport capacity has been purchased due to the facility being interconnected to two pipelines and some of the units having dual fuel capability. LG&E and KU have firm contracts for a portion of the natural gas fuel for Cane Run Unit 7 for delivery in future months. The bulk of the natural gas fuel remains purchased on the spot market. (PPL, LKE and LG&E)
Natural Gas Distribution Supply Five underground natural gas storage fields, with a current working natural gas capacity of approximately 15 billion cubic feet (Bcf), are used in providing natural gas service to LG&E's firm sales customers. By using natural gas storage facilities, LG&E avoids the costs typically associated with more expensive pipeline transportation capacity to serve peak winter heating loads. Natural gas is stored during the summer season for withdrawal during the following winter heating season. Without this storage capacity, LG&E would be required to purchase additional natural gas and pipeline transportation services during winter months when customer demand increases and the prices for natural gas supply and transportation services can be expected to be at their highest. At December 31, 2016, LG&E had 12 Bcf of natural gas stored underground with a carrying value of $42 million. LG&E has a portfolio of supply arrangements of varying durations and terms that provide competitively priced natural gas designed to meet its firm sales obligations. These natural gas supply arrangements include pricing provisions that are market-responsive. In tandem with pipeline transportation services, these natural gas supplies provide the reliability and flexibility necessary to serve LG&E's natural gas customers. LG&E purchases natural gas supply transportation services from two pipelines. LG&E has contracts with one pipeline that are subject to termination by LG&E between 2018 and 2021. Total winter season capacity under these contracts is 184,900 MMBtu/day and summer season capacity is 60,000 MMBtu/day. With this same pipeline, LG&E also has another contract for pipeline capacity through 2026 in the amount of 60,000 MMBtu/day during both the winter and summer seasons. LG&E has a single contract with a second pipeline with a total capacity of 20,000 MMBtu/day during both the winter and summer seasons that expires in 2018. LG&E expects to purchase natural gas supplies for its gas distribution operations from onshore producing regions in South Texas, East Texas, North Louisiana and Arkansas, as well as gas originating in the Marcellus and Utica production areas. (PPL, LKE, LG&E and KU)
Transmission LG&E and KU contract with the Tennessee Valley Authority to act as their transmission reliability coordinator and contract with TranServ International, Inc. to act as their independent transmission operator.
Rates LG&E is subject to the jurisdiction of the KPSC and the FERC, and KU is subject to the jurisdiction of the KPSC, the FERC and the VSCC. LG&E and KU operate under a FERC-approved open access transmission tariff.

12
LG&E's and KU's Kentucky base rates are calculated based on a return on capitalization (common equity, long-term debt and short-term debt) including adjustments for certain net investments and costs recovered separately through other means. As such, LG&E and KU generally earn a return on regulatory assets in Kentucky. KU's Virginia base rates are calculated based on a return on rate base (net utility plant plus working capital less deferred taxes and miscellaneous deductions). As all regulatory assets and liabilities, except the levelized fuel factor, are excluded from the return on rate base utilized in the calculation of Virginia base rates, no return is earned on the related assets. KU's rates to 11 municipal customers for wholesale power requirements are calculated based on annual updates to a formula rate that utilizes a return on rate base (net utility plant plus working capital less deferred taxes and miscellaneous deductions). As all regulatory assets and liabilities are excluded from the return on rate base utilized in the development of municipal rates, no return is earned on the related assets. In April 2014, nine municipalities submitted notices of termination, under the notice period provisions, to cease taking power under the wholesale requirements contracts. Such terminations are to be effective in 2019, except in the case of one municipality with a 2017 effective date. Rate Case On November 23, 2016, LG&E and KU filed requests with the KPSC for increases in annual base electricity rates of approximately $103 million at KU and an increase in annual base electricity and gas rates of approximately $94 million and $14 million at LG&E. The proposed base rate increases would result in an electricity rate increase of 6.4% at KU and electricity and gas rate increases of 8.5% and 4.2% at LG&E. New rates are expected to become effective on July 1, 2017. LG&E's and KU's applications include requests for CPCNs for implementing an Advanced Metering System and a Distribution Automation program. The applications are based on a forecasted test year of July 1, 2017 through June 30, 2018 and a requested return on equity of 10.23%. A number of parties have been granted intervention requests in the proceedings. Data discovery and the filing of written testimony will continue through April 2017. A public hearing on the applications is scheduled to commence on May 2, 2017. LG&E and KU cannot predict the outcome of these proceedings. On October 31, 2016, KU filed a request with the FERC to modify its formula rates to provide for the recovery of CCR impoundment closure costs from its departing municipal customers. On December 30, 2016, the FERC accepted the revised rate schedules providing recovery of the costs effective December 31, 2016, subject to refund, and established limited hearing and settlement judge procedures relating to determining the applicable amortization period. See Note 6 to the Financial Statements for additional information on cost recovery mechanisms. • Pennsylvania Regulated Segment (PPL)
Consists of PPL Electric, a regulated public utility engaged in the distribution and transmission of electricity.
(PPL and PPL Electric) PPL Electric delivers electricity to approximately 1.4 million customers in a 10,000-square mile territory in 29 counties of eastern and central Pennsylvania. PPL Electric also provides electricity supply to retail customers in this area as a PLR under the Customer Choice Act.

13
Details of revenues, in millions, by customer class for the years ended December 31 are shown below.
2016 2015 2014
Revenue % of Revenue Revenue % of
Revenue Revenue % of Revenue
Distribution Residential $ 1,327 61 $ 1,338 63 $ 1,285 63 Industrial 42 2 58 3 52 3 Commercial 338 16 377 18 367 18 Other (a) (4 ) — (44 ) (2) 5 —
Transmission 453 21 395 18 335 16 Total $ 2,156 100 $ 2,124 100 $ 2,044 100
(a) Includes regulatory over- or under-recovery reconciliation mechanisms, pole attachment revenues and street lighting, offset by contra revenue associated
with the network integration transmission service expense.
Franchise, Licenses and Other Regulations PPL Electric is authorized to provide electric public utility service throughout its service area as a result of grants by the Commonwealth of Pennsylvania in corporate charters to PPL Electric and companies, which it has succeeded and as a result of certification by the PUC. PPL Electric is granted the right to enter the streets and highways by the Commonwealth subject to certain conditions. In general, such conditions have been met by ordinance, resolution, permit, acquiescence or other action by an appropriate local political subdivision or agency of the Commonwealth.
Competition Pursuant to authorizations from the Commonwealth of Pennsylvania and the PUC, PPL Electric operates a regulated distribution monopoly in its service area. Accordingly, PPL Electric does not face competition in its electricity distribution business. Pursuant to the Customer Choice Act, generation of electricity is a competitive business in Pennsylvania, and PPL Electric does not own or operate any generation facilities. The PPL Electric transmission business, operating under a FERC-approved PJM Open Access Transmission Tariff, is subject to competition pursuant to FERC Order 1000 from entities that are not incumbent PJM transmission owners with respect to the construction and ownership of transmission facilities within PJM.
Rates and Regulation Transmission PPL Electric's transmission facilities are within PJM, which operates the electricity transmission network and electric energy market in the Mid-Atlantic and Midwest regions of the U.S. PJM serves as a FERC-approved Regional Transmission Operator (RTO) to promote greater participation and competition in the region it serves. In addition to operating the electricity transmission network, PJM also administers regional markets for energy, capacity and ancillary services. A primary objective of any RTO is to separate the operation of, and access to, the transmission grid from market participants that buy or sell electricity in the same markets. Electric utilities continue to own the transmission assets and to receive their share of transmission revenues, but the RTO directs the control and operation of the transmission facilities. Certain types of transmission investment are subject to competitive processes outlined in the PJM tariff. As a transmission owner, PPL Electric's transmission revenues are recovered through PJM and billed in accordance with a FERC-approved Open Access Transmission Tariff that allows recovery of incurred transmission costs, a return on transmission-related plant and an automatic annual update based on a formula-based rate recovery mechanism. Under this formula, rates are put into effect in June of each year based upon prior year actual expenditures and current year forecasted capital additions.

14
Rates are then adjusted the following year to reflect actual annual expenses and capital additions, as reported in PPL Electric’s annual FERC Form 1, filed under the FERC’s Uniform System of Accounts. Any difference between the revenue requirement in effect for the prior year and actual expenditures incurred for that year is recorded as a regulatory asset or regulatory liability. As a PLR, PPL Electric also purchases transmission services from PJM. See "PLR" below. See Note 6 to the Financial Statements for additional information on rate mechanisms. Distribution PPL Electric's distribution base rates are calculated based on a return on rate base (net utility plant plus a cash working capital allowance less plant-related deferred taxes and other miscellaneous additions and deductions). All regulatory assets and liabilities are excluded from the return on rate base; therefore, no return is earned on the related assets unless specifically provided for by the PUC. Currently, PPL Electric's Smart Meter rider and the DSIC are the only riders authorized to earn a return. Certain operating expenses are also included in PPL Electric's distribution base rates including wages and benefits, other operation and maintenance expenses, depreciation and taxes. Pennsylvania's Alternative Energy Portfolio Standard (AEPS) requires electricity distribution companies and electricity generation suppliers to obtain from alternative energy resources a portion of the electricity sold to retail customers in Pennsylvania. Under the default service procurement plans approved by the PUC, PPL Electric purchases all of the alternative energy generation supply it needs to comply with the AEPS. Act 129 created an energy efficiency and conservation program, a demand side management program, smart metering technology requirements, new PLR generation supply procurement rules, remedies for market misconduct and changes to the existing AEPS. Act 11 authorizes the PUC to approve two specific ratemaking mechanisms: the use of a fully projected future test year in base rate proceedings and, subject to certain conditions, the use of a DSIC. Such alternative ratemaking procedures and mechanisms provide opportunity for accelerated cost-recovery and, therefore, are important to PPL Electric as it is in a period of significant capital investment to maintain and enhance the reliability of its delivery system, including the replacement of aging assets. PPL Electric has utilized the fully projected future test year mechanism in the 2015 base rate proceeding. PPL has had the ability to utilize the DSIC recovery mechanism since July 2013. See "Regulatory Matters - Pennsylvania Activities" in Note 6 to the Financial Statements for additional information regarding Act 129 and other legislative and regulatory impacts. PLR The Customer Choice Act requires Electric Distribution Companies (EDCs), including PPL Electric, or an alternative supplier approved by the PUC to act as a PLR of electricity supply for customers who do not choose to shop for supply with a competitive supplier and provides that electricity supply costs will be recovered by the PLR pursuant to PUC regulations. In 2016, the following average percentages of PPL Electric's customer load were provided by competitive suppliers: 49% of residential, 86% of small commercial and industrial and 99% of large commercial and industrial customers. The PUC continues to be interested in expanding the competitive market for electricity. See "Regulatory Matters - Pennsylvania Activities - Act 129" in Note 6 to the Financial Statements for additional information. PPL Electric's cost of electricity generation is based on a competitive solicitation process. The PUC approved PPL Electric's default service plan for the period June 2015 through May 2017, which included 4 solicitations for electricity supply held semiannually in April and October. The PUC approved PPL Electric's default service plan for the period June 2017 through May 2021, which includes a total of 8 solicitations for electricity supply held semiannually in April and October. Pursuant to both the current and future plans, PPL Electric contracts for all of the electricity supply for residential customers and

15
commercial and industrial customers who elect to take that service from PPL Electric. These solicitations include a mix of 6- and 12-month fixed-price load-following contracts for residential and small commercial and industrial customers, and 12-month real-time pricing contracts for large commercial and industrial customers to fulfill PPL Electric's obligation to provide customer electricity supply as a PLR. Numerous alternative suppliers have offered to provide generation supply in PPL Electric's service territory. Since the cost of generation supply is a pass-through cost for PPL Electric, its financial results are not impacted if its customers purchase electricity supply from these alternative suppliers. • Corporate and Other (PPL)
PPL Services provides PPL subsidiaries with administrative, management and support services. The costs of these services are charged directly to the respective recipients for the services provided or indirectly charged to applicable recipients based on an average of the recipients' relative invested capital, operation and maintenance expenses and number of employees. PPL Capital Funding, PPL's financing subsidiary, provides financing for the operations of PPL and certain subsidiaries. PPL's growth in rate-regulated businesses provides the organization with an enhanced corporate level financing alternative, through PPL Capital Funding, that enables PPL to cost effectively support targeted credit profiles across all of PPL's rated companies. As a result, PPL plans to utilize PPL Capital Funding as a source of capital in future financings, in addition to continued direct financing by the operating companies. Unlike PPL Services, PPL Capital Funding's costs are not generally charged to PPL subsidiaries. Costs are charged directly to PPL. However, PPL Capital Funding participated significantly in the financing for the acquisitions of LKE and WPD Midlands and certain associated financing costs were allocated to the Kentucky Regulated and U.K. Regulated segments. The associated financing costs, as well as the financing costs associated with prior issuances of certain other PPL Capital Funding securities, have been assigned to the appropriate segments for purposes of PPL management's assessment of segment performance. The financing costs associated primarily with PPL Capital Funding's securities issuances beginning in 2013, with certain exceptions, have not been directly assigned or allocated to any segment.

[THIS PAGE INTENTIONALLY LEFT BLANK]
16

17
SELECTED FINANCIAL AND OPERATING DATA PPL Corporation (a) (b) 2016 2015 2014 2013 2012
Income Items (in millions) Operating revenues $ 7,517 $ 7,669 $ 7,852 $ 7,263 $ 6,856 Operating income 3,048 2,831 2,867 2,561 2,228 Income from continuing operations after income taxes attributable to PPL shareowners 1,902
1,603
1,437
1,368
1,114
Income (loss) from discontinued operations (net of income taxes) (f) —
(921 ) 300
(238) 412
Net income attributable to PPL shareowners (f) 1,902 682 1,737 1,130 1,526 Balance Sheet Items (in millions)
Total assets (d) 38,315 39,301 48,606 45,889 43,509 Short-term debt (d) 923 916 836 701 296 Long-term debt (d) 18,326 19,048 18,054 18,269 16,120 Noncontrolling interests — — — — 18 Common equity (d) 9,899 9,919 13,628 12,466 10,480 Total capitalization (d) 29,148 29,883 32,518 31,436 26,914
Financial Ratios Return on common equity - % (d)(f) 19.2 5.8 13.0 9.8 13.8 Ratio of earnings to fixed charges (c) 3.8 2.8 2.8 2.4 2.1
Common Stock Data Number of shares outstanding - Basic (in thousands)
Year-end 679,731 673,857 665,849 630,321 581,944 Weighted-average 677,592 669,814 653,504 608,983 580,276
Income from continuing operations after income taxes available to PPL common shareowners - Basic EPS $ 2.80
$ 2.38
$ 2.19
$ 2.24
$ 1.91
Income from continuing operations after income taxes available to PPL common shareowners - Diluted EPS $ 2.79
$ 2.37
$ 2.16
$ 2.12
$ 1.90
Net income available to PPL common shareowners - Basic EPS $ 2.80 $ 1.01 $ 2.64 $ 1.85 $ 2.61 Net income available to PPL common shareowners - Diluted EPS $ 2.79 $ 1.01 $ 2.61 $ 1.76 $ 2.60 Dividends declared per share of common stock $ 1.52 $ 1.50 $ 1.49 $ 1.47 $ 1.44 Book value per share (d) $ 14.56 $ 14.72 $ 20.47 $ 19.78 $ 18.01 Market price per share $ 34.05 $ 34.13 $ 36.33 $ 30.09 $ 28.63 Dividend payout ratio - % (e)(f) 55 149 57 84 55 Dividend yield - % (g) 4.5 4.4 4.1 4.9 5.0 Price earnings ratio (e)(f)(g) 12.2 33.8 13.9 17.1 11.0
Sales Data - GWh Domestic - Electric energy supplied - wholesale 2,177 2,241 2,365 2,383 2,304 Domestic - Electric energy delivered - retail 67,474 67,798 68,569 67,848 66,931 U.K. - Electric energy delivered 74,728 75,907 75,813 78,219 77,467
(a) The earnings each year were affected by several items that management considers special. See "Results of Operations - Segment Earnings" in “Combined
Management's Discussion and Analysis of Financial Condition and Results of Operations" for a description of special items in 2016, 2015 and 2014. The earnings were also affected by the spinoff of PPL Energy Supply and the sale of the Montana hydroelectric generating facilities. See Note 8 to the Financial Statements for a discussion of discontinued operations in 2015 and 2014.
(b) See Notes 1, 6 and 13 to the Financial Statements for a discussion of uncertainties that could affect PPL's future financial condition. (c) Computed using earnings and fixed charges of PPL and its subsidiaries. Fixed charges consist of interest on short and long-term debt, amortization of debt
discount, expense and premium-net, other interest charges, the estimated interest component of operating rentals and preferred securities distributions of subsidiaries. See Exhibit 12(a) for additional information.
(d) 2015 reflects the impact of the spinoff of PPL Energy Supply and a $3.2 billion related dividend. (e) Based on diluted EPS. (f) 2015 includes an $879 million loss on the spinoff of PPL Energy Supply, reflecting the difference between PPL's recorded value for the Supply segment
and the estimated fair value determined in accordance with the applicable accounting rules under GAAP. 2015 also includes five months of Supply segment earnings, compared to 12 months in 2014.
(g) Based on year-end market prices.
18
Combined Management's Discussion and Analysis of Financial Condition and Results of Operations (All Registrants) The following should be read in conjunction with the Registrants' Financial Statements and the accompanying Notes. Capitalized terms and abbreviations are defined in the glossary. Dollars are in millions, except per share data, unless otherwise noted. "Management's Discussion and Analysis of Financial Condition and Results of Operations" includes the following information:
• "Overview" provides a description of each Registrant's business strategy and a discussion of important financial and operational developments.
• "Results of Operations" for all Registrants includes a "Statement of Income Analysis," which discusses significant
changes in principal line items on the Statements of Income, comparing 2016 with 2015 and 2015 with 2014. For PPL, "Results of Operations" also includes "Segment Earnings" and "Margins" which provide a detailed analysis of earnings by reportable segment. These discussions include non-GAAP financial measures, including "Earnings from Ongoing Operations" and "Margins" and provides explanations of the non-GAAP financial measures and a reconciliation of the non-GAAP financial measures to the most comparable GAAP measure. The "2017 Outlook" discussion identifies key factors expected to impact 2017 earnings. For PPL Electric, LKE, LG&E and KU, a summary of earnings is also provided.
• "Financial Condition - Liquidity and Capital Resources" provides an analysis of the Registrants' liquidity positions and
credit profiles. This section also includes a discussion of forecasted sources and uses of cash and rating agency actions.
• "Financial Condition - Risk Management" provides an explanation of the Registrants' risk management programs
relating to market and credit risk. • "Application of Critical Accounting Policies" provides an overview of the accounting policies that are particularly
important to the results of operations and financial condition of the Registrants and that require their management to make significant estimates, assumptions and other judgments of inherently uncertain matters.
Overview
For a description of the Registrants and their businesses, see "Business." On June 1, 2015, PPL completed the spinoff of PPL Energy Supply, which combined its competitive power generation businesses with those of Riverstone to form a new, stand-alone, publicly traded company named Talen Energy. See Note 8 to the Financial Statements for additional information. Business Strategy (All Registrants) Following the June 1, 2015 spinoff of PPL Energy Supply, PPL completed its strategic transformation to a fully regulated business model consisting of seven diverse, high-performing utilities. These utilities are located in the U.K., Pennsylvania and Kentucky and each jurisdiction has different regulatory structures and customer classes. The Company believes this diverse portfolio provides strong earnings and dividend growth potential that will create significant value for its shareowners and positions PPL well for continued growth and success.

19
PPL's businesses of WPD, PPL Electric, LG&E and KU plan to achieve growth by providing efficient, reliable and safe operations and strong customer service, maintaining constructive regulatory relationships and achieving timely recovery of costs. These businesses are expected to achieve strong, long-term growth in rate base and RAV, as applicable, driven by planned significant capital expenditures to maintain existing assets and improve system reliability and, for LKE, LG&E and KU, to comply with federal and state environmental regulations related to coal-fired electricity generation facilities. Additionally, significant transmission rate base growth is expected through at least 2020 at PPL Electric. For the U.S. businesses, our strategy is to recover capital project costs efficiently through various rate-making mechanisms, including periodic base rate case proceedings using forward test years, annual FERC formula rate mechanisms and other regulatory agency-approved recovery mechanisms designed to limit regulatory lag. In Kentucky, the KPSC has adopted a series of regulatory mechanisms (ECR, DSM, GLT, fuel adjustment clause, gas supply clause and recovery on construction work-in-progress) that reduce regulatory lag and provide timely recovery of and return on, as appropriate, prudently incurred costs. In addition, the KPSC requires a utility to obtain a CPCN prior to constructing a facility, unless the construction is an ordinary extension of existing facilities in the usual course of business or does not involve sufficient capital outlay to materially affect the utility's financial condition. Although such KPSC proceedings do not directly address cost recovery issues, the KPSC, in awarding a CPCN, concludes that the public convenience and necessity require the construction of the facility on the basis that the facility is the lowest reasonable cost alternative to address the need. In Pennsylvania, the FERC transmission formula rate, DSIC mechanism, Smart Meter Rider and other recovery mechanisms are in place to reduce regulatory lag and provide for timely recovery of and a return on prudently incurred costs. Rate base growth in the domestic utilities is expected to result in earnings growth for the foreseeable future. In 2017, earnings from the U.K. Regulated segment are expected to decline mainly due to the unfavorable impact of lower GBP to U.S. dollar exchange rates. RAV growth is expected in the U.K. Regulated segment through the RIIO-ED1 price control period and to result in earnings growth after 2017. See "Business - Segment Information - U.K. Regulated Segment" for additional information on RIIO-ED1. To manage financing costs and access to credit markets, and to fund capital expenditures, a key objective of the Registrants is to maintain their investment grade credit ratings and adequate liquidity positions. In addition, the Registrants have financial and operational risk management programs that, among other things, are designed to monitor and manage exposure to earnings and cash flow volatility, as applicable, related to changes in interest rates, foreign currency exchange rates and counterparty credit quality. To manage these risks, PPL generally uses contracts such as forwards, options and swaps. See "Financial Condition - Risk Management" below for further information. Earnings generated by PPL's U.K. subsidiaries are subject to foreign currency translation risk. Due to the significant earnings contributed from WPD, PPL enters into foreign currency contracts to economically hedge the value of the GBP versus the U.S. dollar. These hedges do not receive hedge accounting treatment under GAAP. See "Financial and Operational Developments - U.K. Membership in European Union" for a discussion of the U.K. earnings hedging activity in the third and fourth quarters of 2016. The U.K. subsidiaries also have currency exposure to the U.S. dollar to the extent of their U.S. dollar denominated debt. To manage these risks, PPL generally uses contracts such as forwards, options and cross-currency swaps that contain characteristics of both interest rate and foreign currency exchange contracts. As discussed above, a key component of this strategy is to maintain constructive relationships with regulators in all jurisdictions in which we operate (U.K., U.S. federal and state). This is supported by our strong culture of integrity and delivering on commitments to customers, regulators and shareowners, and a commitment to continue to improve our customer service, reliability and efficiency of operations. Financial and Operational Developments U.S. Tax Reform (All Registrants)
20
Tax reform has been discussed as a high priority of the new U.S. presidential administration. Significant uncertainty exists as to the ultimate changes that may be made, the timing of those changes and the related impact to PPL's financial condition or results of operations. The Company is working with industry groups and carefully monitoring related developments in an effort both to have input to the legislative process where possible and plan effectively to respond to any forthcoming changes in a manner that will optimize value for ratepayers and shareowners. U.K. Membership in European Union (PPL) Significant uncertainty exists concerning the effects of the June 23, 2016 referendum in favor of the U.K. withdrawal from the European Union (EU). In October 2016, the U.K. Prime Minister, Theresa May, announced her intent to invoke Article 50 of the Lisbon Treaty (Article 50) by March 31, 2017. Article 50 specifies that if a member state decides to withdraw from the EU, it should notify the European Council of its intention to leave the EU, negotiate the terms of withdrawal and establish the legal grounds for its future relationship with the EU. Article 50 provides two years from the date of the Article 50 notification to conclude negotiations. Failure to complete negotiations within two years, unless negotiations are extended, would result in the treaties governing the EU no longer being applicable to the U.K. with there being no agreement in place governing the U.K.'s relationship with the EU. Under the terms of Article 50, negotiations can only be extended beyond two years if all of the 27 remaining EU states agree to an extension. Any withdrawal agreement will need to be approved by both the European Council and the European Parliament. There remains significant uncertainty as to whether the events referred to in the Prime Minister's announcement will occur within the times suggested as well as the ultimate outcome of the withdrawal negotiations and the related impact on the U.K. economy and the GBP to U.S. dollar exchange rate. In response to the decrease in the GBP to U.S. dollar exchange rate that occurred subsequent to the U.K.'s vote to withdraw from the EU, PPL has executed additional hedges to mitigate the foreign currency exposure to the Company's U.K. earnings. In the third quarter of 2016, PPL settled existing hedges related to 2017 and 2018 anticipated earnings, resulting in receipt of approximately $310 million of cash, and entered into new hedges at market rates. The notional amount of the settled hedges was approximately £1.3 billion (approximately $2.0 billion based on contracted rates) with termination dates from January 2017 through November 2018. The settlement did not have a significant impact on net income as the hedge values were previously marked to fair value and recognized in "Other Income (Expense) - net" on the Statement of Income. Additionally, in the third and fourth quarters of 2016, PPL restructured existing hedges related to 2016 and 2017 anticipated earnings and entered into additional hedges using forward contracts for 2018. This restructuring did not have a significant impact on 2016 net income as the hedge values continue to be marked to fair value. As of January 31, 2017, PPL's foreign currency exposure related to budgeted earnings is 92% hedged for 2017 at an average rate of $1.21 per GBP, 87% hedged for 2018 at an average rate of $1.42 per GBP and 50% hedged for 2019 at an average rate of $1.34 per GBP. PPL cannot predict either the short-term or long-term impact to foreign currency exchange rates or long-term impact on PPL's financial condition that may be experienced as a result of any actions that may be taken by the U.K. government to withdraw from the EU, although such impacts could be significant. Regulatory Requirements (All Registrants) The Registrants cannot predict the impact that future regulatory requirements may have on their financial condition or results of operations. (PPL, LKE, LG&E and KU) The businesses of LKE, LG&E and KU are subject to extensive federal, state and local environmental laws, rules and regulations, including those pertaining to CCRs, GHG, ELGs, MATS and the Clean Power Plan. See "Financial Condition - Environmental Matters" below for additional information on the CCRs requirements. See Note 6, Note 13 and Note 19 to the

21
Financial Statements for a discussion of the other significant environmental matters. These and other stringent environmental requirements led PPL, LKE, LG&E and KU to retire approximately 800 MW of coal-fired generating plants in Kentucky, primarily in 2015.
Also as a result of the environmental requirements discussed above, LKE projects $1.4 billion ($0.6 billion at LG&E and $0.8 billion at KU) in environmental capital investment over the next five years. See PPL's "Financial Condition - Forecasted Uses of Cash - Capital Expenditures", Note 6 and Note 13 for additional information. (PPL) U.K. Distribution Revenue Reduction In December 2013, WPD and other U.K. DNOs announced agreements with the U.K. Department of Energy and Climate Change and Ofgem to a reduction of £5 per residential customer of electricity distribution revenues that otherwise would have been collected in the regulatory year beginning April 1, 2014. Full recovery of the revenue reduction in GBP, together with the associated carrying cost will occur in the regulatory year which began April 1, 2016. Revenues for the U.K. Regulated segment were adversely affected by $19 million ($15 million after-tax or $0.02 per share) in 2015 and $40 million ($31 million after-tax or $0.05 per share) in 2014. Revenues for the U.K. Regulated segment were positively affected by $39 million ($31 million after-tax or $0.05 per share) in 2016. PPL projects revenues for 2017 will be positively affected by $16 million ($13 million after-tax or $0.02 per share). U.K. Tax Rate Change The U.K. Finance Act 2016, enacted in September 2016, reduced the U.K. statutory income tax rate effective April 1, 2020 from 18% to 17%. As a result of this change, PPL reduced its net deferred tax liabilities and recognized an income tax benefit of $42 million in 2016. Of this amount, $37 million relates to deferred taxes recorded in prior years and is treated as a special item.
U.K. Foreign Tax Credits PPL will amend certain prior year U.S. federal income tax returns to claim foreign tax credits, rather than deduct foreign taxes, resulting in an income tax benefit of approximately $35 million recognized in the fourth quarter of 2016. This decision was prompted by changes to the Company's most recent business plan. Discount Rate Change for U.K. Pension Plans In selecting the discount rate for its U.K. pension plans, WPD historically used a single weighted-average discount rate in the calculation of net periodic defined benefit cost. WPD began using individual spot rates to measure service cost and interest cost for the calculation of net periodic defined benefit cost in 2016. In 2016, this change in discount rate resulted in lower net periodic defined benefit costs recognized on PPL's Statement of Income of $43 million ($34 million after-tax or $0.05 per share). See "Application of Critical Accounting Policies-Defined Benefits" for additional information. Regional Transmission Expansion Plan (PPL and PPL Electric) In July 2014, PPL Electric announced Project Compass, a proposal to construct a new multi-state transmission line. In October 2015, PPL Electric filed an interconnection application with the New York Independent System Operator for the first segment of the project which contains a proposed 95-mile, $500 million to $600 million line between Blakely, Pennsylvania, and Ramapo, New York. The proposed line is intended to provide significant economic benefits for electricity customers in New York and also to provide grid reliability and grid security benefits for electricity customers in both states. The proposal envisions construction to begin in 2021 and for the project to be in operation by 2023. Numerous approvals will be required,

22
including, among others, the public utility commissions of Pennsylvania and New York, the New York Independent System Operator, PJM, and FERC. As originally proposed in 2014, Project Compass would have run from western Pennsylvania into New York and New Jersey and also south into Maryland, covering approximately 725 miles at an estimated cost of $4 billion to $6 billion. The project has been revised to include about 475 miles of transmission line in Pennsylvania and New York at an estimated cost of $3 billion to $4 billion. Beyond this segment, no schedule is proposed for the rest of the project. There can be no assurance that this segment of Project Compass will be approved as proposed. Additionally, PPL Electric is continuing to study the project and may modify it in the future. The capital expenditures related to this project are excluded from the Capital Expenditures table included in "Liquidity and Capital Resources-Forecasted Uses of Cash" below. Rate Case Proceedings (PPL, LKE, LG&E and KU) On November 23, 2016, LG&E and KU filed requests with the KPSC for increases in annual base electricity rates of approximately $103 million at KU and an increase in annual base electricity and gas rates of approximately $94 million and $14 million at LG&E. The proposed base rate increases would result in an electricity rate increase of 6.4% at KU and electricity and gas rate increases of 8.5% and 4.2% at LG&E. New rates are expected to become effective on July 1, 2017. LG&E's and KU's applications include requests for CPCNs for implementing an Advanced Metering System and a Distribution Automation program. The applications are based on a forecasted test year of July 1, 2017 through June 30, 2018 and a requested return on equity of 10.23%. A number of parties have been granted intervention requests in the proceedings. Data discovery and the filing of written testimony will continue through April 2017. A public hearing on the applications is scheduled to commence on May 2, 2017. LG&E and KU cannot predict the outcome of these proceedings. On October 31, 2016, KU filed a request with the FERC to modify its formula rates to provide for the recovery of CCR impoundment closure costs from its departing municipal customers. On December 30, 2016, the FERC accepted the revised rate schedules providing recovery of the costs effective December 31, 2016, subject to refund, and established limited hearing and settlement judge procedures relating to determining the applicable amortization period. Discontinued Operations (PPL) The operations of PPL's Supply segment prior to its June 1, 2015 spinoff are included in "Income (Loss) from Discontinued Operations (net of income taxes)" on the 2015 and 2014 Statements of Income. See Note 8 to the Financial Statements for additional information related to the spinoff of PPL Energy Supply, including the components of Discontinued Operations.
Results of Operations (PPL) The "Statement of Income Analysis" discussion below describes significant changes in principal line items on PPL's Statements of Income, comparing year-to-year changes. The "Segment Earnings" and "Margins" discussions for PPL provide a review of results by reportable segment. These discussions include non-GAAP financial measures, including "Earnings from Ongoing Operations" and "Margins," and provide explanations of the non-GAAP financial measures and a reconciliation of those measures to the most comparable GAAP measure. The "2017 Outlook" discussion identifies key factors expected to impact 2017 earnings. Tables analyzing changes in amounts between periods within "Statement of Income Analysis," "Segment Earnings" and "Margins" are presented on a constant GBP to U.S. dollar exchange rate basis, where applicable, in order to isolate the impact of the change in the exchange rate on the item being explained. Results computed on a constant GBP to U.S. dollar exchange rate basis are calculated by translating current year results at the prior year weighted-average GBP to U.S. dollar exchange rate.

23
(PPL Electric, LKE, LG&E and KU) A "Statement of Income Analysis, Earnings and Margins" is presented separately for PPL Electric, LKE, LG&E and KU. The "Statement of Income Analysis" discussion below describes significant changes in principal line items on the Statements of Income, comparing year-to-year changes. The "Earnings" discussion provides a summary of earnings. The "Margins" discussion includes a reconciliation of non-GAAP financial measures to "Operating Income."
PPL: Statement of Income Analysis, Segment Earnings and Margins Statement of Income Analysis Net income for the years ended December 31 includes the following results.
Change
2016 2015 2014 2016 vs. 2015 2015 vs. 2014 Operating Revenues $ 7,517 $ 7,669 $ 7,852 $ (152 ) $ (183 ) Operating Expenses
Operation Fuel 791 863 965 (72 ) (102 ) Energy purchases 706 855 924 (149 ) (69 ) Other operation and maintenance 1,745 1,938 1,856 (193 ) 82
Depreciation 926 883 923 43 (40 ) Taxes, other than income 301 299 317 2 (18 )
Total Operating Expenses 4,469 4,838 4,985 (369 ) (147 ) Other Income (Expense) - net 390 108 105 282 3 Interest Expense 888 871 843 17 28 Income Taxes 648 465 692 183 (227 )
Income from Continuing Operations After Income Taxes 1,902 1,603 1,437 299 166
Income (Loss) from Discontinued Operations (net of income taxes) — (921 ) 300
921 (1,221 )
Net Income $ 1,902 $ 682 $ 1,737 $ 1,220 $ (1,055 )

24
Operating Revenues The increase (decrease) in operating revenues was due to:
2016 vs. 2015 2015 vs. 2014
Domestic: PPL Electric Distribution price (a) $ 126 $ 22
PPL Electric Distribution volume (9 ) (4)
PPL Electric PLR Revenue (b) (135 ) 15
PPL Electric Transmission Formula Rate 59 60
LKE Base rates 68 64
LKE Volumes 1 (85)
LKE Fuel and other energy prices (b) (81 ) (113)
LKE ECR 39 86
Other (17 ) (17)
Total Domestic 51 28 U.K.:
Price 98 (99)
Volume (36 ) 5
Line loss accrual adjustments (c) — 65
Foreign currency exchange rates (255 ) (188)
Other (10 ) 6
Total U.K. (203 ) (211)
Total $ (152 ) $ (183 )
(a) Distribution rate case effective January 1, 2016, resulted in increases of $160 million for the year ended December 31, 2016. (b) Decreases due to lower recoveries of fuel and energy purchases primarily as a result of lower commodity costs at LKE and lower energy purchase prices
at PPL Electric. (c) In 2014, Ofgem issued its final decision on the DPCR4 line loss incentives and penalties mechanism, which resulted in a $65 million reduction to
Operating Revenues in 2014. See Note 6 to the Financial Statements for additional information. Fuel Fuel decreased $72 million in 2016 compared with 2015 primarily due to a decrease in market prices for coal and natural gas. Fuel decreased $102 million in 2015 compared with 2014 due to a $57 million decrease in volumes, driven by milder weather during the fourth quarter of 2015, and a $45 million decrease in commodity costs as a result of a decrease in market prices for coal and natural gas. Energy Purchases Energy purchases decreased $149 million in 2016 compared with 2015 primarily due to a $124 million decrease in PLR prices and a $12 million decrease in PLR volumes at PPL Electric, a $9 million decrease in the market price of natural gas and a $5 million decrease in natural gas volumes at LKE. Energy purchases decreased $69 million in 2015 compared with 2014 primarily due to a $38 million decrease in the market price of natural gas and a $30 million decrease in natural gas volumes at LKE.

25
Other Operation and Maintenance The increase (decrease) in other operation and maintenance was due to:
2016 vs. 2015 2015 vs. 2014 Domestic:
LKE plant operations and maintenance (a) $ (19 ) $ 9 LKE pension expense (12 ) 14 PPL Electric payroll-related costs (26 ) 2 PPL Electric Act 129 (15 ) 9 PPL Electric contractor related expenses 7 7 PPL Electric vegetation management 4 7 PPL Electric universal service programs 3 6 Storm costs 6 (18 ) Bad debts (5 ) — Third-party costs related to the spinoff of PPL Energy Supply (Note 8) (13 ) 5 Separation benefits related to the spinoff of PPL Energy Supply (Note 8) (8 ) (12 ) Corporate costs previously included in discontinued operations (b) 8 27 Stock compensation expense (6 ) 3 Other 18 26
U.K.: Pension expense (c) (86 ) (14 ) Foreign currency exchange rates (33 ) (33 ) Third-party engineering (8 ) 7 Engineering management 7 19 National Grid exit charges (2 ) 11 Other (13 ) 7
Total $ (193 ) $ 82 (a) Includes a $29 million reduction of costs in 2016 due to the retirement of Cane Run and Green River coal units partially offset by $5 million of additional
costs for Cane Run Unit 7 plant operations. (b) The increase in 2015 compared with 2014 was due to the corporate costs allocated to PPL Energy Supply (and included in discontinued operations) prior
to the spin. As a result of the spinoff on June 1, 2015, these corporate costs now remain in continuing operations. (c) The decrease in 2016 compared with 2015 was primarily due to an increase in expected returns on higher asset balances and lower interest costs due to a
change in the discount rate methodology.
Depreciation The increase (decrease) in depreciation was due to:
2016 vs. 2015 2015 vs. 2014 Additions to PP&E, net $ 76 $ 77 Foreign currency exchange rates (27 ) (19 ) Network asset useful life extension (a) — (84 ) Other (6 ) (14 ) Total $ 43 $ (40 )
(a) Effective January 1, 2015, after completion of a review of the useful lives of its distribution network assets, WPD extended the weighted average useful
lives of these assets to 69 years from 55 years resulting in lower depreciation. Taxes, Other Than Income The increase (decrease) in taxes, other than income was due to:

26
2016 vs. 2015 2015 vs. 2014
State gross receipts tax (a) $ 11 $ (14 ) Domestic property tax expense 4 5 Foreign currency exchange rates (15 ) (11 ) Other 2 2 Total $ 2 $ (18 )
(a) 2015 includes the settlement of the 2011 gross receipts tax audit that resulted in the reversal of $17 million of previously recognized reserves.
Other Income (Expense) - net Other income (expense) - net increased $282 million in 2016 compared with 2015 and increased $3 million in 2015 compared with 2014 primarily due to changes in realized and unrealized gains on foreign currency contracts to economically hedge GBP denominated earnings from WPD. Interest Expense The increase (decrease) in interest expense was due to:
2016 vs. 2015 2015 vs. 2014
Long-term debt interest expense (a) $ 63 $ 61 Hedging activities and ineffectiveness (4 ) (4 ) Loss on extinguishment of debt (b) — (9 ) Foreign currency exchange rates (43 ) (26 ) Other 1 6 Total $ 17 $ 28
(a) The increase in 2016 compared with 2015 was primarily due to debt issuances at WPD in November 2015, LG&E and KU in September 2015 and PPL
Capital Funding in May 2016 as well as higher interest rates on bonds refinanced in September 2015 at LG&E and KU. The increase in 2015 compared with 2014 was primarily due to 2015 including interest expense related to certain PPL Energy Funding debt that was previously associated with PPL's former Supply segment and included in "Income (Loss) from Discontinued Operations (net of income taxes) in 2014.
(b) In March 2014, a $9 million loss was recorded related to PPL Capital Funding's remarketing and debt exchange of the junior subordinated notes originally issued in April 2011 as a component of the 2011 Equity Units.
Income Taxes The increase (decrease) in income taxes was due to:
2016 vs. 2015 2015 vs. 2014
Change in pre-tax income at current period tax rates $ 184 $ (18 ) Valuation allowance adjustments (a) (8 ) (31 ) Federal and state tax reserve adjustments (b) 22 (21 ) U.S. income tax on foreign earnings net of foreign tax credit (c) (50 ) (55 ) U.K. Finance Act adjustments (d) 42 (90 ) Interest benefit on U.K. financing activities 3 (15 ) Stock-based compensation (e) (10 ) — Other — 3 Total $ 183 $ (227 )
(a) During 2016, PPL recorded deferred tax expense for valuation allowances primarily related to the increase in Pennsylvania net operating loss
carryforwards expected to be unutilized. During 2015, PPL recorded $24 million of deferred income tax expense related to deferred tax valuation allowances. PPL recorded state deferred income tax expense of $12 million primarily related to increased Pennsylvania net operating loss carryforwards expected to be unutilized and $12 million of

27
federal deferred income tax expense primarily related to federal tax credit carryforwards that are expected to expire as a result of lower future taxable earnings due to the extension of bonus depreciation. As a result of the PPL Energy Supply spinoff announcement, PPL recorded $50 million of deferred income tax expense during 2014 to adjust the valuation allowance on deferred tax assets primarily for state net operating loss carryforwards that were previously supported by the future earnings of PPL Energy Supply. See Note 8 to the Financial Statements for additional information on the spinoff.
(b) During 2015, PPL recorded a $9 million tax benefit related to a planned amendment of a prior period tax return and a $12 million tax benefit related to the settlement of the IRS audit for the tax years 1998-2011.
(c) During 2016, PPL recorded lower income taxes primarily attributable to foreign tax credit carryforwards, arising from a decision to amend prior year tax returns to claim foreign tax credits rather than deduct foreign taxes. This decision was prompted by changes to the Company's most recent business plan. During 2015, PPL recorded lower income taxes primarily due to a decrease in taxable dividends.
During 2014, PPL recorded $47 million of income tax expense primarily attributable to taxable dividends. (d) The U.K.’s Finance Act 2016, enacted in September 2016, reduces the U.K. statutory income tax rate from 18% to 17% effective April 1, 2020. As a
result, PPL reduced its net deferred tax liabilities and recognized a $42 million deferred tax benefit in 2016. The U.K.'s Finance Act 2015, enacted in November 2015, reduces the U.K. statutory income tax rate from 20% to 19% effective April 1, 2017 and from 19% to 18% effective April 1, 2020. As a result, PPL reduced its net deferred tax liabilities and recognized a $90 million deferred tax benefit in 2015 related to both rate decreases.
(e) During 2016, PPL recorded lower income tax expense related to the application of new stock-based compensation accounting guidance. See Note 1 of the Financial Statements for additional information.
See Note 5 to the Financial Statements for additional information on income taxes. Income (Loss) from Discontinued Operations (net of income taxes) Income (Loss) from Discontinued Operations (net of income taxes) for 2015 and 2014 includes the results of operations of PPL Energy Supply, which was spun off from PPL on June 1, 2015 and substantially represents PPL's former Supply segment. See "Discontinued Operations" in Note 8 to the Financial Statements for additional information. Segment Earnings PPL's net income by reportable segments were as follows:
Change
2016 2015 2014 2016 vs. 2015 2015 vs. 2014 U.K. Regulated $ 1,246 $ 1,121 $ 982 $ 125 $ 139 Kentucky Regulated 398 326 312 72 14 Pennsylvania Regulated 338 252 263 86 (11 ) Corporate and Other (a) (80 ) (96 ) (120) 16 24 Discontinued Operations (b) — (921 ) 300 921 (1,221 )
Net Income $ 1,902 $ 682 $ 1,737 $ 1,220 $ (1,055 )
(a) Primarily represents financing and certain other costs incurred at the corporate level that have not been allocated or assigned to the segments, which are
presented to reconcile segment information to PPL's consolidated results. 2015 and 2014 include certain costs related to the spinoff of PPL Energy Supply. See Note 8 to the Financial Statements for additional information.
(b) As a result of the spinoff of PPL Energy Supply, substantially representing PPL's former Supply segment, the earnings of the Supply segment prior to the spinoff are included in Discontinued Operations. 2015 includes an $879 million charge reflecting the difference between PPL's recorded value for the Supply segment and its estimated fair value as of the spinoff date, determined in accordance with the applicable accounting rules under GAAP. See Note 8 to the Financial Statements for additional information.
Earnings from Ongoing Operations Management utilizes "Earnings from Ongoing Operations" as a non-GAAP financial measure that should not be considered as an alternative to net income, an indicator of operating performance determined in accordance with GAAP. PPL believes that Earnings from Ongoing Operations is useful and meaningful to investors because it provides management's view of PPL's earnings performance as another criterion in making investment decisions. In addition, PPL's management uses Earnings from

28
Ongoing Operations in measuring achievement of certain corporate performance goals, including targets for certain executive incentive compensation. Other companies may use different measures to present financial performance. Earnings from Ongoing Operations is adjusted for the impact of special items. Special items are presented in the financial tables on an after-tax basis with the related income taxes on special items separately disclosed. Income taxes on special items, when applicable, are calculated based on the effective tax rate of the entity where the activity is recorded. Earnings from Ongoing Operations for 2014 also reflects, within the Corporate and Other category, the impact of spinoff dissynergies that, if not mitigated, would remain with PPL after completion of the spinoff. Special items include: • Unrealized gains or losses on foreign currency-related economic hedges (as discussed below). • Supply segment discontinued operations. • Gains and losses on sales of assets not in the ordinary course of business. • Impairment charges. • Workforce reduction and other restructuring effects. • Acquisition and divestiture-related adjustments. • Other charges or credits that are, in management's view, non-recurring or otherwise not reflective of the company's ongoing
operations. Unrealized gains or losses on foreign currency economic hedges include the changes in fair value of foreign currency contracts used to hedge GBP-denominated anticipated earnings. The changes in fair value of these contracts are recognized immediately within GAAP earnings. Management believes that excluding these amounts from Earnings from Ongoing Operations until settlement of the contracts provides a better matching of the financial impacts of those contracts with the economic value of PPL's underlying hedged earnings. See Note 17 to the Financial Statements and "Risk Management" below for additional information on foreign currency-related economic activity. PPL's Earnings from Ongoing Operations by reportable segment were as follows:
Change
2016 2015 2014 2016 vs. 2015 2015 vs. 2014 U.K. Regulated $ 1,015 $ 968 $ 907 $ 47 $ 61 Kentucky Regulated 398 343 312 55 31 Pennsylvania Regulated 338 252 265 86 (13 ) Corporate and Other (a)(b) (77 ) (74 ) (135) (3 ) 61 Earnings from Ongoing Operations $ 1,674 $ 1,489 $ 1,349 $ 185 $ 140
(a) 2014 was adjusted to include costs that were previously allocated to the Supply segment that would remain with PPL after the completion of the
transaction, if left unmitigated. (b) Costs were lower in 2015 compared with 2014 primarily due to the benefits of corporate restructuring. See "Reconciliation of Earnings from Ongoing Operations" below for a reconciliation of this non-GAAP financial measure to Net Income. U.K. Regulated Segment The U.K. Regulated segment consists of PPL Global, which primarily includes WPD's regulated electricity distribution operations, the results of hedging the translation of WPD's earnings from GBP into U.S. dollars, and certain costs, such as U.S. income taxes, administrative costs, and certain acquisition-related financing costs. The U.K. Regulated segment represents 66% of PPL's Net Income for 2016 and 38% of PPL's assets at December 31, 2016.

29
Net Income and Earnings from Ongoing Operations include the following results.
Change
2016 2015 2014 2016 vs. 2015 2015 vs. 2014 Operating revenues $ 2,207 $ 2,410 $ 2,621 $ (203 ) $ (211 ) Other operation and maintenance 344 477 482 (133 ) (5 ) Depreciation 233 242 337 (9 ) (95 ) Taxes, other than income 135 148 157 (13 ) (9 )
Total operating expenses 712 867 976 (155 ) (109 ) Other Income (Expense) - net 386 123 127 263 (4 ) Interest Expense 402 417 461 (15 ) (44 ) Income Taxes 233 128 329 105 (201 ) Net Income 1,246 1,121 982 125 139 Less: Special Items 231 153 75 78 78 Earnings from Ongoing Operations $ 1,015 $ 968 $ 907 $ 47 $ 61
The following after-tax gains (losses), which management considers special items, impacted the U.K. Regulated segment's results and are excluded from Earnings from Ongoing Operations.
Income Statement
Line Item 2016 2015 2014
Foreign currency-related economic hedges, net of tax of $4, ($30), ($68) (a) Other Income (Expense) - net $ (8 ) $ 55
$ 127
Settlement of foreign currency contracts, net of tax of ($108), $0, $0 (b) Other Income (Expense) - net 202
—
—
Change in U.K. tax rate (c) Income Taxes 37 78 —
WPD Midlands acquisition-related adjustment, net of tax of $0, ($1), $0 Other operation and maintenance —
2
—
Settlement of certain income tax positions (d) Income Taxes — 18 — Change in WPD line loss accrual, net of tax of $0, $0, $13 (e) Operating Revenues — — (52 )
Total $ 231 $ 153 $ 75
(a) Represents unrealized gains (losses) on contracts that economically hedge anticipated GBP-denominated earnings. 2016 includes the reversal of $310
million ($202 million after-tax) of unrealized gains related to the settlement of 2017 and 2018 contracts. (b) In 2016, PPL settled 2017 and 2018 foreign currency contracts, resulting in $310 million of cash received ($202 million after-tax). The settlement did not
have a material impact on net income as the contracts were previously marked to fair value and recognized in "Other Income (Expense) - net" on the Statement of Income. See Note 17 to the Financial Statements for additional information.
(c) The U.K. Finance Acts of 2016 and 2015 reduced the U.K.'s statutory income tax rates. As a result, PPL reduced its net deferred tax liability and recognized a deferred tax benefit in 2016 and 2015. See Note 5 to the Financial Statements for additional information.
(d) Relates to the April 2015 settlement of the IRS audit for the tax years 1998-2011. See Note 5 to the Financial Statements for additional information. (e) In 2014, Ofgem issued its final decision on the DPCR4 line loss incentives and penalties mechanism. As a result, during 2014 WPD increased its existing
liability for over-recovery of line losses. See Note 6 to the Financial Statements for additional information. The changes in the components of the U.K. Regulated segment's results between these periods were due to the factors set forth below, which reflect amounts classified as U.K. Gross Margins, the items that management considers special and the effects of movements in foreign currency exchange, including the effects of foreign currency hedge contracts, on separate lines and not in their respective Statement of Income line items.
2016 vs. 2015 2015 vs. 2014
U.K. Gross margins $ 62 $ (110 ) Other operation and maintenance 94 (14 ) Depreciation (18 ) 76 Interest expense (28 ) 3 Other (3 ) (5 ) Income taxes (18 ) 48
U.S. Interest expense and other (2 ) 12 Income taxes 41 55

30
2016 vs. 2015 2015 vs. 2014
Foreign currency exchange, after-tax (81 ) (4 ) Earnings from Ongoing Operations 47 61 Special items, after-tax 78 78 Net Income $ 125 $ 139
U.K. • See "Margins - Changes in Margins" for an explanation of U.K. Gross Margins. • Lower other operation and maintenance expense in 2016 compared with 2015 primarily due to $86 million from lower
pension expense due to an increase in estimated returns on higher asset balances and lower interest costs due to a change in the discount rate methodology.
• Lower depreciation expense in 2015 compared with 2014 primarily due to an $84 million impact of an extension of the network asset lives. See Note 1 to the Financial Statements for additional information.
• Lower income taxes in 2015 compared with 2014 primarily due to $25 million from lower U.K. tax rates and $11 million
from lower pre-tax income. U.S.
• Lower income taxes in 2016 compared with 2015 primarily due to a benefit related to foreign tax credit carryforwards.
• Lower income taxes in 2015 compared with 2014 primarily due to decreases in taxable dividends. Kentucky Regulated Segment The Kentucky Regulated segment consists primarily of LKE's regulated electricity generation, transmission and distribution operations of LG&E and KU, as well as LG&E's regulated distribution and sale of natural gas. In addition, certain acquisition-related financing costs are allocated to the Kentucky Regulated segment. The Kentucky Regulated segment represents 21% of PPL's Net Income for 2016 and 37% of PPL's assets at December 31, 2016. Net Income and Earnings from Ongoing Operations include the following results.
Change
2016 2015 2014 2016 vs. 2015 2015 vs. 2014 Operating revenues $ 3,141 $ 3,115 $ 3,168 $ 26 $ (53 ) Fuel 791 863 965 (72 ) (102 ) Energy purchases 171 184 253 (13 ) (69 ) Other operation and maintenance 804 837 815 (33 ) 22 Depreciation 404 382 354 22 28 Taxes, other than income 62 57 52 5 5
Total operating expenses 2,232 2,323 2,439 (91 ) (116 ) Other Income (Expense) - net (9 ) (13 ) (9) 4 (4 ) Interest Expense 260 232 219 28 13 Income Taxes 242 221 189 21 32 Net Income 398 326 312 72 14 Less: Special Items — (17 ) — 17 (17 ) Earnings from Ongoing Operations $ 398 $ 343 $ 312 $ 55 $ 31
The following after-tax gains (losses), which management considers special items, impacted the Kentucky Regulated segment's results and are excluded from Earnings from Ongoing Operations.

31
Income Statement Line Item 2016 2015 2014
Certain income tax valuation allowances (a) Income Taxes $ — $ (12 ) $ — LKE acquisition-related adjustment, net of tax of $0, $0, $0 (b) Other Income (Expense) - net — (5 ) — Total $ — $ (17 ) $ —
(a) Recorded at LKE and represents a valuation allowance against tax credits expiring through 2020 that are more likely than not to expire before being
utilized. (b) Recorded at PPL and allocated to the Kentucky Regulated segment. The amount represents a settlement between E.ON AG (a German corporation and
the indirect parent of E.ON US Investments Corp., the former parent of LKE) and PPL for a tax matter. The changes in the components of the Kentucky Regulated segment's results between these periods were due to the factors set forth below, which reflect amounts classified as Kentucky Gross Margins and the items that management considers special on separate lines and not in their respective Statement of Income line item.
2016 vs. 2015 2015 vs. 2014 Kentucky Gross Margins $ 83 $ 88 Other operation and maintenance 42 (21 ) Depreciation (4 ) (1 ) Taxes, other than income (4 ) (3 ) Other Income (Expense) - net (1 ) 1 Interest Expense (28 ) (13 ) Income Taxes (33 ) (20 ) Earnings from Ongoing Operations 55 31 Special Items, after-tax 17 (17 ) Net Income $ 72 $ 14
• See "Margins - Changes in Margins" for an explanation of Kentucky Gross Margins.
• Lower other operation and maintenance expense in 2016 compared with 2015 primarily due to a $29 million reduction of
costs as a result of coal units retired in 2015 at the Cane Run and Green River plants, partially offset by $5 million of additional costs for Cane Run Unit 7 plant operations and $12 million of lower pension expense mainly due to higher discount rates and deferred amortization of actuarial losses.
• Higher other operation and maintenance expense in 2015 compared with 2014 primarily due to $14 million of higher pension expense and $11 million of higher costs related to the Cane Run units' retirements consisting of an inventory write-down and separation benefits, partially offset by $7 million of lower storm costs and lower bad debt expense of $6 million.
• Higher interest expense for both periods primarily due to the September 2015 issuance of $550 million of incremental First Mortgage Bonds by LG&E and KU, higher interest rates on the September 2015 issuance of $500 million of First Mortgage Bonds by LG&E and KU used to retire the same amount of First Mortgage Bonds in November 2015 and $400 million of notes refinanced by LKE with an affiliate in November 2015.
• Higher income taxes for both periods primarily due to higher pre-tax income. Pennsylvania Regulated Segment The Pennsylvania Regulated segment includes the regulated electricity transmission and distribution operations of PPL Electric. In addition, certain costs are allocated to the Pennsylvania Regulated segment. The Pennsylvania Regulated segment represents 18% of PPL's Net Income for 2016 and 25% of PPL's assets at December 31, 2016. Net Income and Earnings from Ongoing Operations include the following results.

32
Change
2016 2015 2014 2016 vs. 2015 2015 vs. 2014 Operating revenues $ 2,156 $ 2,124 $ 2,044 $ 32 $ 80 Energy purchases
External 535 657 587 (122 ) 70 Intersegment — 14 84 (14 ) (70 )
Other operation and maintenance 601 607 543 (6 ) 64 Depreciation 253 214 185 39 29 Taxes, other than income 105 94 107 11 (13 )
Total operating expenses 1,494 1,586 1,506 (92 ) 80 Other Income (Expense) - net 17 8 7 9 1 Interest Expense 129 130 122 (1 ) 8 Income Taxes 212 164 160 48 4 Net Income 338 252 263 86 (11 ) Less: Special Items — — (2) — 2 Earnings from Ongoing Operations $ 338 $ 252 $ 265 $ 86 $ (13 )
The following after-tax loss, which management considers a special item, impacted the Pennsylvania Regulated segment's results and is excluded from Earnings from Ongoing Operations.
Income Statement Line Item 2016 2015 2014
Separation benefits, net of tax of $0, $0, $1 (a) Other operation and maintenance $ — $ — $ (2 )
(a) In June 2014, PPL Electric's largest IBEW local ratified a new three-year labor agreement. In connection with the new agreement, bargaining unit one-
time voluntary retirement benefits were recorded. The changes in the components of the Pennsylvania Regulated segment's results between these periods were due to the factors set forth below, which reflect amounts classified as Pennsylvania Gross Margins and the item that management considers special on separate lines and not in their respective Statement of Income line item.
2016 vs. 2015 2015 vs. 2014
Pennsylvania Gross Margins $ 177 $ 65 Other operation and maintenance — (58 ) Depreciation (39 ) (29 ) Taxes, other than income (14 ) 18 Other Income (Expense) - net 9 1 Interest Expense 1 (8 ) Income Taxes (48 ) (2 ) Earnings from Ongoing Operations 86 (13 ) Special Item, after-tax — 2 Net Income $ 86 $ (11 )
• See "Margins - Changes in Margins" for an explanation of Pennsylvania Gross Margins.
• Other operation and maintenance expense for 2016 was comparable with 2015 primarily due to $26 million of lower
payroll related expenses, partially offset by $8 million of higher corporate service costs allocated to PPL Electric, $8 million of higher costs for additional work done by outside vendors and other costs, which were not individually significant in comparison to the prior year.
• Higher other operation and maintenance expense for 2015 compared with 2014 primarily due to $30 million of higher corporate service costs allocated to PPL Electric, $11 million of higher vegetation management expenses and related costs for additional work done by outside vendors and $5 million of higher bad debt expenses.
• Higher depreciation expense for both periods primarily due to transmission and distribution additions placed into service related to the ongoing efforts to improve reliability and replace aging infrastructure, net of retirements.

33
• Higher taxes, other than income for 2016 compared with 2015 and lower taxes, other than income for 2015 compared with
2014 primarily due to the settlement of a 2011 gross receipts tax audit resulting in the reversal of $17 million of previously recognized reserves in 2015.
• Higher income taxes in 2016 compared with 2015 primarily due to higher pre-tax income.
Reconciliation of Earnings from Ongoing Operations The following tables contain after-tax gains (losses), in total, which management considers special items, that are excluded from Earnings from Ongoing Operations and a reconciliation to PPL's "Net Income" for the years ended December 31.
2016
U.K.
Regulated KY Regulated PA
Regulated Corporate and Other Total
Net Income $ 1,246 $ 398 $ 338 $ (80 ) $ 1,902 Less: Special Items (expense) benefit: Foreign currency-related economic hedges, net of tax of $4 (8 ) — — — (8) Spinoff of the Supply segment, net of tax of $2 — — — (3 ) (3) Other:
Settlement of foreign currency contracts, net of tax of ($108) 202 — — — 202 Change in U.K. tax rate 37 — — — 37
Total Special Items 231 — — (3 ) 228 Earnings from Ongoing Operations $ 1,015 $ 398 $ 338 $ (77 ) $ 1,674
2015
U.K.
Regulated KY Regulated PA
Regulated Corporate and Other Discontinued
Operations Total
Net Income $ 1,121 $ 326 $ 252 $ (96 ) $ (921 ) $ 682 Less: Special Items (expense) benefit: Foreign currency-related economic hedges, net of tax of ($30) 55 — — — — 55 Spinoff of the Supply segment:
Discontinued operations, net of tax of $30 — — — — (921 ) (921) Transition and transaction costs, net of tax of $6 — — — (12) — (12) Employee transitional services, net of tax of $2 — — — (5) — (5) Separation benefits, net of tax of $3 — — — (5) — (5)
Other: Change in U.K. tax rate 78 — — — — 78 Settlement of certain income tax positions 18 — — — — 18 WPD Midlands acquisition-related adjustment, net of tax of ($1) 2 — — — — 2 Certain income tax valuation allowances — (12 ) — — — (12) LKE acquisition-related adjustment, net of tax of $0 — (5 ) — — — (5)
Total Special Items 153 (17 ) — (22) (921 ) (807) Earnings from Ongoing Operations $ 968 $ 343 $ 252 $ (74 ) $ — $ 1,489
2014
U.K.
Regulated KY Regulated PA
Regulated Corporate and Other Discontinued
Operations Total
Net Income $ 982 $ 312 $ 263 $ (120 ) $ 300 $ 1,737 Less: Special Items (expense) benefit: Foreign currency-related economic hedges, net of tax of ($68) 127 — — — — 127 Spinoff of the Supply segment:
Supply segment earnings, net of tax of ($93) — — — — 307 307 Discontinued operations adjustments, net of tax of $3, ($3) — — — (5) 5 — Change in tax valuation allowances — — — (46) — (46) Transition and transaction costs, net of tax of $3, $7 — — — (5) (12 ) (17) Separation benefits, net of tax of $6 — — — (12) — (12)

34
2014
U.K.
Regulated KY Regulated PA
Regulated Corporate and Other
Discontinued Operations Total
Other: Change in WPD line loss accrual, net of tax of $13 (52) — — — — (52) Separation benefits, net of tax of $1 — — (2 ) — — (2)
Total Special Items 75 — (2 ) (68) 300 305 Dissynergies-spinoff of Supply segment expense (benefit):
Indirect operation and maintenance, net of tax of ($33) — — — 47 — 47 Interest expense, net of tax of ($20) — — — 29 — 29 Depreciation, net of tax of ($5) — — — 7 — 7
Total dissynergies-spinoff of Supply segment — — — 83 — 83 Earnings from Ongoing Operations $ 907 $ 312 $ 265 $ (135 ) $ — $ 1,349
Margins Management also utilizes the following non-GAAP financial measures as indicators of performance for its businesses. • "U.K. Gross Margins" is a single financial performance measure of the electricity distribution operations of the U.K.
Regulated segment. In calculating this measure, direct costs such as connection charges from National Grid, which owns and manages the electricity transmission network in England and Wales, and Ofgem license fees (recorded in "Other operation and maintenance" on the Statements of Income) are deducted from operating revenues, as they are costs passed through to customers. As a result, this measure represents the net revenues from the delivery of electricity across WPD's distribution network in the U.K. and directly related activities.
• "Kentucky Gross Margins" is a single financial performance measure of the electricity generation, transmission and distribution operations of the Kentucky Regulated segment, LKE, LG&E and KU, as well as the Kentucky Regulated segment's, LKE's and LG&E's distribution and sale of natural gas. In calculating this measure, fuel, energy purchases and certain variable costs of production (recorded in "Other operation and maintenance" on the Statements of Income) are deducted from operating revenues. In addition, certain other expenses, recorded in "Other operation and maintenance", "Depreciation" and "Taxes, other than income" on the Statements of Income, associated with approved cost recovery mechanisms are offset against the recovery of those expenses, which are included in operating revenues. These mechanisms allow for direct recovery of these expenses and, in some cases, returns on capital investments and performance incentives. As a result, this measure represents the net revenues from electricity and gas operations.
• "Pennsylvania Gross Margins" is a single financial performance measure of the electricity transmission and distribution operations of the Pennsylvania Regulated segment and PPL Electric. In calculating this measure, utility revenues and expenses associated with approved recovery mechanisms, including energy provided as a PLR, are offset with minimal impact on earnings. Costs associated with these mechanisms are recorded in "Energy purchases," "Other operation and maintenance," (which are primarily Act 129 and Universal Service program costs), and "Taxes, other than income," (which is primarily gross receipts tax) on the Statements of Income. This performance measure includes PLR energy purchases by PPL Electric from PPL EnergyPlus, which are reflected in "Energy purchases from affiliate" in the reconciliation tables. As a result of the June 2015 spinoff of PPL Energy Supply and the formation of Talen Energy, PPL EnergyPlus (renamed Talen Energy Marketing) is no longer an affiliate of PPL Electric. PPL Electric's purchases from Talen Energy Marketing subsequent to May 31, 2015 are reflected in "Energy Purchases" in the reconciliation tables. This measure represents the net revenues from the Pennsylvania Regulated segment's and PPL Electric's electricity delivery operations.
These measures are not intended to replace "Operating Income," which is determined in accordance with GAAP, as an indicator of overall operating performance. Other companies may use different measures to analyze and report their results of operations. Management believes these measures provide additional useful criteria to make investment decisions. These performance measures are used, in conjunction with other information, by senior management and PPL's Board of Directors to manage operations and analyze actual results compared with budget.

35
Changes in Margins The following table shows Margins by PPL's reportable segments and by component, as applicable, for the year ended December 31 as well as the changes between periods. The factors that gave rise to the changes are described following the table.
Change
2016 2015 2014 2016 vs. 2015 2015 vs.
2014 U.K. Regulated U.K. Gross Margins $ 2,067 $ 2,243 $ 2,527 $ (176) $ (284)
Impact of changes in foreign currency exchange rates (238 ) (174 ) U.K. Gross Margins excluding impact of foreign currency exchange rates $ 62 $ (110)
Kentucky Regulated Kentucky Gross Margins
LG&E $ 887 $ 867 $ 833 $ 20 $ 34 KU 1,122 1,059 1,005 63 54
Total Kentucky Gross Margins $ 2,009 $ 1,926 $ 1,838 $ 83 $ 88 Pennsylvania Regulated Pennsylvania Gross Margins
Distribution $ 960 $ 842 $ 837 $ 118 $ 5 Transmission 454 395 335 59 60
Total Pennsylvania Gross Margins $ 1,414 $ 1,237 $ 1,172 $ 177 $ 65
U.K. Gross Margins U.K. Gross Margins, excluding the impact of changes in foreign currency exchange rates, increased in 2016 compared with 2015 primarily due to $166 million from the April 1, 2016 price increase, which includes $39 million of the recovery of prior customer rebates, and $21 million of other revenue adjustments in the first quarter of 2016, partially offset by $89 million from the April 1, 2015 price decrease resulting from the commencement of RIIO-ED1 and $36 million from lower volumes. U.K. Gross Margins, excluding the impact of changes in foreign currency exchange rates, decreased in 2015 compared with 2014 primarily due to $171 million from the April 1, 2015 price decrease resulting from the commencement of RIIO-ED1, partially offset by $46 million from the April 1, 2014 price increase. Kentucky Gross Margins Kentucky Gross Margins increased in 2016 compared with 2015 primarily due to higher base rates of $68 million ($4 million at LG&E and $64 million at KU) and returns on additional environmental capital investments of $13 million at LG&E. The increases in base rates were the result of new rates approved by the KPSC effective July 1, 2015. Kentucky Gross Margins increased in 2015 compared with 2014 primarily due to higher base rates of $64 million ($3 million at LG&E and $61 million at KU) and returns on additional environmental capital investments of $53 million ($36 million at LG&E and $17 million at KU). The increases in base rates were the result of new rates approved by the KPSC effective July 1, 2015. These increases were partially offset by lower sales volumes of $28 million ($5 million at LG&E and $23 million at KU) driven by milder weather during the fourth quarter of 2015.

36
Pennsylvania Gross Margins Distribution Distribution margins increased in 2016 compared with 2015 primarily due to $121 million of higher base rates, effective January 1, 2016 as a result of the 2015 rate case.
Distribution margins increased in 2015 compared with 2014 primarily due to returns on additional distribution improvement capital investments of $17 million partially offset by a $12 million benefit recorded in the first quarter of 2014 as a result of a change in estimate of a regulatory liability. Transmission Transmission margins increased for both periods primarily due to returns on additional capital investments focused on replacing the aging infrastructure and improving reliability. Reconciliation of Margins The following tables contain the components from the Statement of Income that are included in the non-GAAP financial measures and a reconciliation to PPL's "Operating Income" for the years ended December 31.
2016
U.K. Gross
Margins
Kentucky Gross
Margins
PA Gross
Margins Other (a) Operating Income (b)
Operating Revenues $ 2,165 (c) $ 3,141 $ 2,156 $ 55 $ 7,517 Operating Expenses
Fuel — 791 — — 791 Energy purchases — 171 535 — 706 Other operation and maintenance 98 109 108 1,430 1,745 Depreciation — 56 — 870 926 Taxes, other than income — 5 99 197 301
Total Operating Expenses 98 1,132 742 2,497 4,469 Total $ 2,067 $ 2,009 $ 1,414 $ (2,442 ) $ 3,048
2015
U.K. Gross
Margins
Kentucky Gross
Margins
PA Gross
Margins Other (a) Operating Income (b)
Operating Revenues $ 2,364 (c) $ 3,115 $ 2,124 $ 66 $ 7,669 Operating Expenses
Fuel — 863 — — 863 Energy purchases — 184 657 14 855 Energy purchases from affiliate — — 14 (14 ) — Other operation and maintenance 121 100 114 1,603 1,938 Depreciation — 38 — 845 883 Taxes, other than income — 4 102 193 299
Total Operating Expenses 121 1,189 887 2,641 4,838 Total $ 2,243 $ 1,926 $ 1,237 $ (2,575 ) $ 2,831

37
2014
U.K. Gross
Margins
Kentucky Gross
Margins
PA Gross
Margins Other (a) Operating Income (b)
Operating Revenues $ 2,638 (c) $ 3,168 $ 2,044 $ 2 $ 7,852 Operating Expenses
Fuel — 965 — — 965 Energy purchases — 253 587 84 924 Energy purchases from affiliate — — 84 (84 ) — Other operation and maintenance 111 99 103 1,543 1,856 Depreciation — 11 — 912 923 Taxes, other than income — 2 98 217 317
Total Operating Expenses 111 1,330 872 2,672 4,985 Total $ 2,527 $ 1,838 $ 1,172 $ (2,670 ) $ 2,867
(a) Represents amounts excluded from Margins. (b) As reported on the Statements of Income. (c) 2016, 2015 and 2014 exclude $42 million, $46 million and $48 million of ancillary activity revenues. 2014 also excludes $65 million of revenue
reductions related to adjustments to WPD's line loss accrual related to DPCR4, which is considered a special item. 2017 Outlook (PPL) Lower net income is projected in 2017 compared with 2016 primarily from a lower assumed GBP exchange rate in 2017 and 2016 tax benefits that are not expected to repeat in 2017. The following projections and factors underlying these projections (on an after-tax basis) are provided for PPL's segments and the Corporate and Other category and the related Registrants. (PPL's U.K. Regulated Segment) Lower net income is projected in 2017 compared with 2016 due to a lower assumed GBP exchange rate in 2017, lower incentive revenues, higher interest expense, higher depreciation expense and higher income taxes, partially offset by lower operation and maintenance expense, including pension expense. (PPL's Kentucky Regulated Segment and LKE, LG&E and KU) Slightly higher net income is projected in 2017 compared with 2016 primarily driven by electricity and gas base rate increases, partially offset by higher operation and maintenance expense and higher depreciation expense. (PPL's Pennsylvania Regulated Segment and PPL Electric) Relatively flat net income is projected in 2017 compared with 2016 primarily driven by higher transmission earnings and lower operation and maintenance expense, offset by higher depreciation expense, higher interest expense and higher income taxes. (PPL's Corporate and Other Category) Relatively flat costs are projected in 2017 compared with 2016. (All Registrants) Earnings in future periods are subject to various risks and uncertainties. See "Business," the rest of this section, and Notes 1, 6 and 13 to the Financial Statements (as applicable) for a discussion of the risks, uncertainties and factors that may impact future earnings.

38
Financial Condition
Liquidity and Capital Resources (All Registrants) The Registrants' cash flows from operations and access to cost effective bank and capital markets are subject to risks and uncertainties. The Registrants had the following at:
PPL (a) PPL Electric LKE LG&E KU
December 31, 2016 Cash and cash equivalents $ 341 $ 13 $ 13 $ 5 $ 7 Short-term debt 923 295 185 169 16 Notes payable with affiliates — 163 — — December 31, 2015 Cash and cash equivalents $ 836 $ 47 $ 30 $ 19 $ 11 Short-term debt 916 — 265 142 48 Notes payable with affiliates — 54 — — December 31, 2014 Cash and cash equivalents $ 1,399 $ 214 $ 21 $ 10 $ 11 Short-term investments 120 — — — — Short-term debt 836 — 575 264 236 Notes payables with affiliates — 41 — —
(a) At December 31, 2016, $5 million of cash and cash equivalents were denominated in GBP. If these amounts would be remitted as dividends, PPL would
not anticipate a material incremental U.S. tax cost. Historically, dividends paid by foreign subsidiaries have been limited to distributions of the current year's earnings. See Note 5 to the Financial Statements for additional information on undistributed earnings of WPD.
(PPL) The Statements of Cash Flows separately report the cash flows of the discontinued operations. The "Operating Activities", "Investing Activities" and "Financing Activities" sections below include only the cash flows of continuing operations. (All Registrants) Net cash provided by (used in) operating, investing and financing activities for the years ended December 31 and the changes between periods were as follows.
PPL PPL Electric LKE LG&E KU
2016 Operating activities $ 2,890 $ 872 $ 1,027 $ 482 $ 606 Investing activities (2,918 ) (1,130 ) (790) (439 ) (349 ) Financing activities (439 ) 224 (254) (57 ) (261 )
2015 Operating activities $ 2,272 $ 602 $ 1,063 $ 554 $ 608 Investing activities (3,439 ) (1,108 ) (1,203) (689 ) (512 ) Financing activities 482 339 149 144 (96 )

39
PPL PPL Electric LKE LG&E KU
2014 Operating activities $ 2,941 $ 613 $ 999 $ 371 $ 566 Investing activities (3,826 ) (791 ) (1,191) (656 ) (603 ) Financing activities 262 367 178 287 27 2016 vs. 2015 Change Operating activities $ 618 $ 270 $ (36 ) $ (72 ) $ (2 ) Investing activities 521 (22 ) 413 250 163 Financing activities (921 ) (115 ) (403) (201 ) (165 )
2015 vs. 2014 Change Operating activities $ (669 ) $ (11 ) $ 64 $ 183 $ 42 Investing activities 387 (317 ) (12) (33 ) 91 Financing activities 220 (28 ) (29) (143 ) (123 )
Operating Activities The components of the change in cash provided by (used in) operating activities were as follows.
PPL PPL Electric LKE LG&E KU
2016 vs. 2015 Change - Cash Provided (Used):
Net income $ 299 $ 88 $ 65 $ 18 $ 31 Non-cash components 195 40 66 20 (20 ) Working capital 47 101 (206) (100 ) (51 ) Defined benefit plan funding 72 33 (15) (20 ) 1 Other operating activities 5 8 54 10 37
Total $ 618 $ 270 $ (36 ) $ (72 ) $ (2 )
2015 vs. 2014 Change - Cash Provided (Used):
Net income $ 166 $ (11 ) $ 20 $ 16 $ 14 Non-cash components (280 ) 181 (184) 21 (52 ) Working capital (341 ) (148 ) 335 190 152 Defined benefit plan funding (115 ) (10 ) (25) (13 ) (16 ) Other operating activities (99 ) (23 ) (82) (31 ) (56 )
Total $ (669 ) $ (11 ) $ 64 $ 183 $ 42 (PPL) PPL had a $618 million increase in cash provided by operating activities from continuing operations in 2016 compared with 2015.
• Net income improved by $299 million between the periods. This included an additional $195 million of net non-cash charges, including a $132 million increase in deferred income taxes and $96 million of lower unrealized gains on hedging activity (primarily due to the settlement of hedges in the third quarter of 2016) partially offset by a $96 million increase in defined benefit plan income (primarily due to an increase in estimated returns on higher asset balances and lower interest costs due to a change in the discount rate for the U.K. pension plans).
• The $47 million increase in cash from changes in working capital was primarily due to an increase in taxes payable (due to timing of payments) and an increase in accounts payable (primarily due to timing of payments) partially offset by an increase in unbilled revenues (primarily due to favorable weather compared to December 2015), an increase in

40
net regulatory assets/liabilities (due to timing of rate recovery mechanisms) and an increase in accounts receivable (primarily due to increased volumes and favorable weather in 2016).
• Defined benefit plan funding was $72 million lower in 2016. PPL had a $669 million decrease in cash from operating activities from continuing operations in 2015 compared with 2014.
• Net income improved by $166 million between the periods, but included a decrease in net non-cash charges of $280 million. These net non-cash charges included a $238 million decrease in deferred income taxes and $65 million of changes to the WPD line loss accrual. These decreases in non-cash charges were partially offset by $110 million of lower unrealized gains on hedging activities. The net $114 million decrease from net income and non-cash adjustments between the periods was primarily due to lower margins from the U.K. Regulated segment, partially offset by higher margins from the Kentucky and Pennsylvania Regulated segments.
• The $341 million decrease in cash from changes in working capital was primarily due to a decrease in taxes payable (primarily due to a decrease in current income tax expense in 2015) and a decrease in accounts payable (primarily due to timing of fuel purchases and payments and unfavorable weather in 2015) partially offset by a decrease in accounts receivable (primarily due to unfavorable weather in 2015).
• The $99 million decrease in cash provided by other operating activities was primarily due to payments of $101 million for the settlement in 2015 of forward starting interest rate swaps.
(PPL Electric) PPL Electric had a $270 million increase in cash provided by operating activities in 2016 compared with 2015.
• Net income improved by $88 million between the periods. This included an additional $40 million of net non-cash benefits primarily due to a $39 million increase in depreciation expense (primarily due to the replacement of aging infrastructure and to ensure system reliability).
• The $101 million increase in cash from changes in working capital was primarily due to an increase in accounts payable (primarily due to timing of payments), an increase in taxes payable (primarily due to timing of payments) and a decrease in prepayments (primarily due to higher tax payments in 2015) partially offset by an increase in net regulatory assets and liabilities (due to timing of rate recovery mechanisms), an increase in unbilled revenues (primarily due to higher volumes and favorable weather compared to December 2015) and an increase in accounts receivable.
• Pension funding was $33 million lower in 2016.
PPL Electric had an $11 million decrease in cash provided by operating activities in 2015 compared with 2014.
• Net income decreased by $11 million between the periods and included an additional $181 million of net non-cash charges primarily due to increases in deferred tax expense and depreciation.
• The $148 million decrease in cash from changes in working capital was partially due to a decrease in taxes payable (primarily due an increase in current income tax benefits in 2015) and a decrease in accounts payable (primarily due to milder weather and lower energy prices in December 2015), partially offset by a decrease in accounts receivable (primarily due to improved collection performance).
• Pension funding was $10 million higher in 2015. (LKE) LKE had a $36 million decrease in cash provided by operating activities in 2016 compared with 2015.

41
• Net income improved by $65 million and included an increase of $66 million of net non-cash charges primarily due to a $55 million increase in deferred income taxes and a $22 million increase in depreciation expense.
• The decrease in cash from changes in working capital was driven primarily by lower tax payments received from PPL for the use of prior year excess tax depreciation deductions. Other decreases in cash were related to accounts receivable and unbilled revenues due to more favorable weather in December 2016 compared to December 2015, and a decrease in taxes payable due to the timing of payments, partially offset by an increase in accounts payable due to the timing of fuel purchases and payments.
• Defined benefit plan funding was $15 million higher in 2016.
• The increase in cash from LKE's other operating activities was driven primarily by lower payments for the settlement of interest rate swaps, partially offset by an increase in ARO expenditures.
LKE had a $64 million increase in cash provided by operating activities in 2015 compared with 2014.
• LKE's non-cash components of net income included a $213 million decrease in deferred income taxes, partially offset by a $28 million increase in depreciation due to additional assets in service in 2015. Deferred income taxes were lower in 2015 as a large portion of the effect of accelerated tax depreciation did not result in cash as a result of the Federal net operating losses.
• The increase in cash from changes in working capital was driven primarily by a decrease in income tax receivable as a result of receiving payment from PPL in 2015 for the use of excess tax depreciation deductions in 2014, decreases in accounts receivable and unbilled revenues due to milder weather in December 2015, a decrease in coal inventory as a result of plant retirements, and a decrease in natural gas stored underground due to lower gas prices in 2015, partially offset by a decrease in accounts payable due to the timing of fuel purchases and payments.
• The decrease in cash from LKE's other operating activities was driven primarily by $88 million in payments for the settlement of interest rate swaps.
(LG&E) LG&E had a $72 million decrease in cash provided by operating activities in 2016 compared with 2015.
• Net income improved by $18 million and included an increase of $20 million of net non-cash charges primarily due to a $21 million increase in deferred income taxes.
• The decrease in cash from changes in working capital was driven primarily by lower tax payments received from LKE for the use of prior year excess tax depreciation deductions. Other decreases in cash were related to accounts receivable and unbilled revenues due to more favorable weather in December 2016 compared to December 2015, and an increase in accounts receivable from affiliates due to higher intercompany settlements associated with energy sales and inventory, partially offset by an increase in accounts payable due to the timing of fuel purchases and payments.
• Defined benefit plan funding was $20 million higher in 2016.
• The increase in cash from LG&E's other operating activities was driven primarily by lower payments for the settlement of interest rate swaps, partially offset by an increase in ARO expenditures.
LG&E had a $183 million increase in cash provided by operating activities in 2015 compared with 2014.
• LG&E's non-cash components of net income included an $8 million increase in deferred income taxes and a $5 million increase in depreciation due to additional assets in service in 2015.
42
• The increase in cash from changes in working capital was driven primarily by a decrease in income tax receivable as a result of receiving payment from LKE in 2015 for the use of excess tax depreciation deductions in 2014, a decrease in accounts receivable from affiliates due to lower fuel costs for jointly owned units compared to an increase in the prior year, a decrease in accounts receivable due to milder weather in December 2015 compared to an increase in the prior year, a decrease in coal inventory as a result of the retirement of Cane Run coal units, and a decrease in natural gas stored underground due to lower gas prices in 2015, partially offset by a decrease in accounts payable due to the timing of fuel purchases and payments compared to an increase in the prior year.
• The decrease in cash from LG&E's other operating activities was driven primarily by $44 million in payments for the settlement of interest rate swaps.
(KU) KU had a $2 million decrease in cash provided by operating activities in 2016 compared with 2015.
• Net income improved by $31 million and included a decrease of $20 million of net non-cash charges primarily due to a $34 million decrease in deferred income taxes, partially offset by a $14 million increase in depreciation expense.
• The decrease in cash from changes in working capital was driven primarily by lower tax payments received from LKE for the use of prior year excess tax depreciation deductions. Other decreases in cash were related to accounts receivable and unbilled revenues due to more favorable weather in December 2016 compared to December 2015, partially offset by an increase in accounts payable to affiliates due to higher intercompany settlements associated with energy purchases and inventory, and an increase in taxes payable due to the timing of payments.
• The increase in cash from KU's other operating activities was driven primarily by lower payments for the settlement of interest rate swaps, partially offset by an increase in ARO expenditures.
KU had a $42 million increase in cash provided by operating activities in 2015 compared with 2014.
• KU's non-cash components of net income included a $64 million decrease in deferred income taxes, partially offset by a $23 million increase in depreciation due to additional assets in service in 2015. Deferred income taxes were lower in 2015 as a large portion of the effect of accelerated tax depreciation did not result in cash as a result of the Federal net operating losses.
• The increase in cash from changes in working capital was driven primarily by a decrease in income tax receivable as a result of receiving payment from LKE in 2015 for the use of excess tax depreciation deductions in 2014, a decrease in coal inventory as a result of the retirement of Green River coal units, and decreases in accounts receivable and unbilled revenues due to milder weather in December 2015, partially offset by a decrease in accounts payable to affiliates compared to an increase in the prior year due to lower fuel costs for jointly owned units and a decrease in accounts payable due to the timing of fuel purchases and payments.
• The decrease in cash from KU's other operating activities was driven primarily by $44 million in payments for the settlement of interest rate swaps.

43
Investing Activities (All Registrants) The components of the change in cash provided by (used in) investing activities were as follows.
PPL PPL Electric LKE LG&E KU
2016 vs. 2015 Change - Cash Provided (Used):
Expenditures for PP&E $ 613 $ (28 ) $ 419 $ 250 $ 169 Investment activity, net (134 ) — — — — Other investing activities 42 6 (6) — (6 )
Total $ 521 $ (22 ) $ 413 $ 250 $ 163
2015 vs. 2014 Change - Cash Provided (Used):
Expenditures for PP&E $ 141 $ (166 ) $ 52 $ (33 ) $ 85 Notes receivable with affiliates activity, net — (150 ) (70) — — Restricted cash and cash equivalent activity (11 ) — — — — Investment activity, net 256 — — — — Other investing activities 1 (1 ) 6 — 6
Total $ 387 $ (317 ) $ (12 ) $ (33 ) $ 91 (PPL) For PPL, in 2016 compared with 2015, lower project expenditures at WPD, LG&E and KU were partially offset by higher project expenditures at PPL Electric. The decrease in expenditures for WPD was primarily due to a decrease in expenditures to enhance system reliability and a decrease in foreign currency exchange rates. The decrease in expenditures for LG&E was primarily driven by the completion of the environmental air projects at LG&E's Mill Creek Plant. The decrease in expenditures for KU was primarily driven by the completion of the environmental air projects at KU's Ghent plant and the CCR project at KU's E.W. Brown plant. The increase in expenditures for PPL Electric was primarily due to the Northern Lehigh and Greater Scranton transmission reliability projects and other various transmission and distribution projects, partially offset by the completion of the Northeast Pocono reliability project and Susquehanna-Roseland transmission project.
The change in "Investment activity, net" for 2016 compared with 2015 resulted from PPL receiving $136 million during 2015 for the sale of short-term investments. For PPL, in 2015 compared with 2014, lower project expenditures at WPD and KU were partially offset by higher project expenditures at PPL Electric and LG&E. The decrease in expenditures for WPD was primarily due to a decrease in expenditures to enhance system reliability associated with the end of the DPCR5 price control period and changes in foreign currency exchange rates. The decrease in expenditures for KU was related to lower expenditures for the construction of Cane Run Unit 7 which was put into commercial operation in June 2015, and lower expenditures for environmental air projects and CCR projects at KU's Ghent and E.W. Brown plants. The increase in expenditures for PPL Electric was primarily due to the Northeast Pocono reliability project, smart grid projects and other various projects, partially offset by the completion of the Susquehanna-Roseland transmission project. The increase in expenditures for LG&E was primarily due to environmental air projects at LG&E's Mill Creek plant, partially offset by lower expenditures for the construction of Cane Run Unit 7. The change in "Investment activity, net" for 2015 compared with 2014 resulted from PPL receiving $136 million during 2015 for the sale of short-term investments and paying $120 million during 2014 for the purchase of short-term investments.

44
(PPL Electric) For PPL Electric, in 2016 compared with 2015, the increase in expenditures was primarily due to the Northern Lehigh and Greater Scranton transmission reliability projects and other various transmission and distribution projects, which was partially offset by the completion of the Northeast Pocono reliability project and the Susquehanna-Roseland transmission project.
For PPL Electric, in 2015 compared with 2014, the increase in expenditures was primarily due to the Northeast Pocono reliability project, smart grid projects and other various projects, partially offset by the completion of the Susquehanna-Roseland transmission project.
The changes in "Notes receivable with affiliates activity, net" resulted from proceeds of $150 million received in 2014 from repayments on a note extended in 2013. (LKE) For LKE, in 2016 compared with 2015, cash used in investing activities decreased primarily due to lower PP&E expenditures. The decrease in expenditures for LG&E was primarily driven by completion of the environmental air projects at LG&E's Mill Creek plant. The decrease in expenditures for KU was primarily driven by completion of the environmental air projects at KU's Ghent plant and the CCR project at KU's E.W. Brown plant. For LKE, in 2015 compared with 2014, cash used in investing activities increased as a result of receiving payment from PPL in 2014 for the notes receivable issued in 2013, partially offset by lower PP&E expenditures. An increase in expenditures for LG&E was primarily due to higher expenditures for environmental air projects at the Mill Creek plant, partially offset by lower expenditures for the construction of Cane Run Unit 7. A decrease in expenditures for KU was primarily due to lower expenditures for the construction of Cane Run Unit 7 which was put into commercial operation in June 2015, and lower expenditures for environmental air projects and CCR projects at the Ghent and the E.W. Brown plants. (LG&E) For LG&E, in 2016 compared with 2015, cash used in investing activities decreased due to lower PP&E expenditures driven by completion of the environmental air projects at the Mill Creek plant. For LG&E, in 2015 compared with 2014, cash used in investing activities increased primarily due to higher expenditures for environmental air projects at the Mill Creek plant, partially offset by lower expenditures for the construction of Cane Run Unit 7 which was put into commercial operation in June 2015. (KU) For KU, in 2016 compared with 2015, cash used in investing activities decreased primarily due to lower PP&E expenditures driven by completion of the environmental air projects at the Ghent plant and the CCR project at the E.W. Brown plant. For KU, in 2015 compared with 2014, cash used in investing activities decreased primarily due to lower expenditures for the construction of Cane Run Unit 7 which was put into commercial operation in June 2015, and lower expenditures for environmental air projects and CCR projects at the Ghent and the E.W. Brown plants. (All Registrants) See "Forecasted Uses of Cash" for detail regarding projected capital expenditures for the years 2016 through 2020.

45
Financing Activities (All Registrants) The components of the change in cash provided by (used in) financing activities were as follows.
PPL PPL Electric LKE LG&E KU
2016 vs. 2015 Change - Cash Provided (Used):
Debt issuance/retirement, net $ (824 ) $ (248 ) $ (175 ) $ (325 ) $ (250 ) Debt issuance/retirement, affiliate — (400) — — Stock issuances/redemptions, net (59 ) — — — — Dividends (26 ) (107 ) — (9 ) (95 ) Capital contributions/distributions, net (55 ) (161) (19 ) 20 Changes in net short-term debt (a) (65 ) 295 326 149 156 Other financing activities 53 — 7 3 4
Total $ (921 ) $ (115 ) $ (403 ) $ (201 ) $ (165 )
PPL PPL Electric LKE LG&E KU
2015 vs. 2014 Change - Cash Provided (Used):
Debt issuance/retirement, net $ 1,177 $ (38 ) $ 150 $ 300 $ 250 Debt issuance/retirement, affiliate — 400 — — Stock issuances/redemptions, net (871 ) — — — — Dividends (37 ) (23 ) — (7 ) (5 ) Capital contributions/distributions, net 12 94 (67 ) (91 ) Changes in net short-term debt (a) (53 ) 20 (668) (366 ) (274 ) Other financing activities 4 1 (5) (3 ) (3 )
Total $ 220 $ (28 ) $ (29 ) $ (143 ) $ (123 ) (a) Includes net increase (decrease) in notes payable with affiliates. (PPL) For PPL, in 2016 compared with 2015, $921 million less cash from financing activities was required primarily due to improvements in cash from operations of $618 million. For PPL, in 2015 compared with 2014, $220 million additional cash from financing activities was required including the WPD, LG&E and KU long-term debt issuances in 2015, partially offset by lower common stock issuances in 2015. (PPL Electric) For PPL Electric, in 2016 compared with 2015, $115 million less cash from financing activities was required to support its significant capital expenditure program primarily due to improvements in cash from operations of $270 million. For PPL Electric, in 2015 compared with 2014, $28 million less cash from financing activities was required primarily due to the use of cash on hand which helped support the significant capital expenditure program. (LKE) For LKE, in 2016 compared with 2015, cash provided by financing activities decreased primarily as a result of a decrease in cash required to fund capital and general corporate expenditures.

46
For LKE, in 2015 compared with 2014, cash provided by financing activities decreased as a result of the repayment of short-term debt, partially offset by the $550 million of additional long-term debt issued by LG&E and KU in 2015 and lower distributions to PPL. (LG&E) For LG&E, in 2016 compared with 2015, cash provided by financing activities decreased primarily as a result of a decrease in cash required to fund capital and general corporate expenditures. For LG&E, in 2015 compared with 2014, cash provided by financing activities decreased as a result of the repayment of short-term debt and lower capital contributions from LKE, partially offset by the $300 million of additional long-term debt issued in 2015. (KU) For KU, in 2016 compared with 2015, cash provided by financing activities decreased primarily as a result of a decrease in cash required to fund capital and general corporate expenditures. For KU, in 2015 compared with 2014, cash provided by financing activities decreased as a result of the repayment of short-term debt and lower capital contributions from LKE, partially offset by the $250 million of additional long-term debt issued in 2015. (All Registrants) See "Long-term Debt and Equity Securities" below for additional information on current year activity. See "Forecasted Sources of Cash" for a discussion of the Registrants' plans to issue debt and equity securities, as well as a discussion of credit facility capacity available to the Registrants. Also see "Forecasted Uses of Cash" for a discussion of PPL's plans to pay dividends on common securities in the future, as well as the Registrants' maturities of long-term debt. Long-term Debt and Equity Securities Long-term debt and equity securities activity for 2016 included: Debt Net Stock
Issuances (a) Retirements Issuances Cash Flow Impact: PPL $ 1,342 $ 930 $ 144 PPL Electric 224 224 LKE 221 246 LG&E 125 150 KU 96 96
(a) Issuances are net of pricing discounts, where applicable, and exclude the impact of debt issuance costs.
See Note 7 to the Financial Statements for additional information about long-term debt.
ATM Program (PPL) During 2016, PPL issued 710 thousand shares of common stock under the program at an average price of $35.23 per share, receiving net proceeds of $25 million. See Note 7 to the Financial Statements for additional information about the ATM Program.
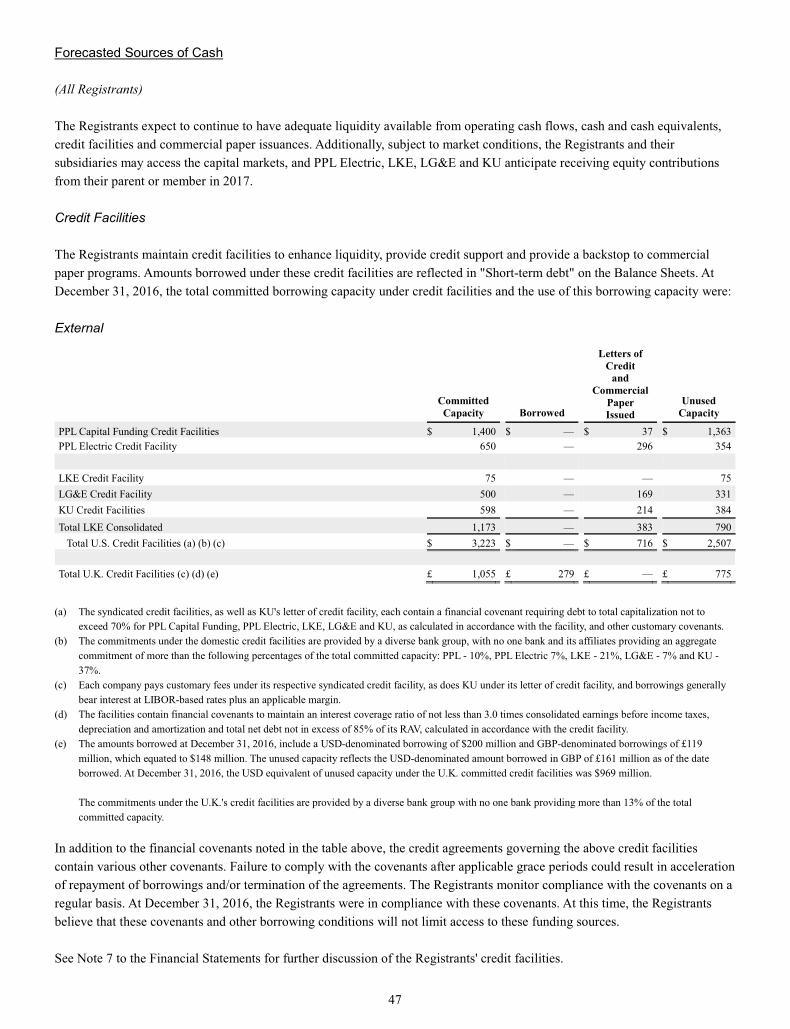
47
Forecasted Sources of Cash (All Registrants) The Registrants expect to continue to have adequate liquidity available from operating cash flows, cash and cash equivalents, credit facilities and commercial paper issuances. Additionally, subject to market conditions, the Registrants and their subsidiaries may access the capital markets, and PPL Electric, LKE, LG&E and KU anticipate receiving equity contributions from their parent or member in 2017. Credit Facilities The Registrants maintain credit facilities to enhance liquidity, provide credit support and provide a backstop to commercial paper programs. Amounts borrowed under these credit facilities are reflected in "Short-term debt" on the Balance Sheets. At December 31, 2016, the total committed borrowing capacity under credit facilities and the use of this borrowing capacity were: External
Committed Capacity Borrowed
Letters of Credit
and Commercial
Paper Issued
Unused Capacity
PPL Capital Funding Credit Facilities $ 1,400 $ — $ 37 $ 1,363 PPL Electric Credit Facility 650 — 296 354 LKE Credit Facility 75 — — 75 LG&E Credit Facility 500 — 169 331 KU Credit Facilities 598 — 214 384 Total LKE Consolidated 1,173 — 383 790
Total U.S. Credit Facilities (a) (b) (c) $ 3,223 $ — $ 716 $ 2,507
Total U.K. Credit Facilities (c) (d) (e) £ 1,055 £ 279 £ — £ 775
(a) The syndicated credit facilities, as well as KU's letter of credit facility, each contain a financial covenant requiring debt to total capitalization not to
exceed 70% for PPL Capital Funding, PPL Electric, LKE, LG&E and KU, as calculated in accordance with the facility, and other customary covenants. (b) The commitments under the domestic credit facilities are provided by a diverse bank group, with no one bank and its affiliates providing an aggregate
commitment of more than the following percentages of the total committed capacity: PPL - 10%, PPL Electric 7%, LKE - 21%, LG&E - 7% and KU - 37%.
(c) Each company pays customary fees under its respective syndicated credit facility, as does KU under its letter of credit facility, and borrowings generally bear interest at LIBOR-based rates plus an applicable margin.
(d) The facilities contain financial covenants to maintain an interest coverage ratio of not less than 3.0 times consolidated earnings before income taxes, depreciation and amortization and total net debt not in excess of 85% of its RAV, calculated in accordance with the credit facility.
(e) The amounts borrowed at December 31, 2016, include a USD-denominated borrowing of $200 million and GBP-denominated borrowings of £119 million, which equated to $148 million. The unused capacity reflects the USD-denominated amount borrowed in GBP of £161 million as of the date borrowed. At December 31, 2016, the USD equivalent of unused capacity under the U.K. committed credit facilities was $969 million. The commitments under the U.K.'s credit facilities are provided by a diverse bank group with no one bank providing more than 13% of the total committed capacity.
In addition to the financial covenants noted in the table above, the credit agreements governing the above credit facilities contain various other covenants. Failure to comply with the covenants after applicable grace periods could result in acceleration of repayment of borrowings and/or termination of the agreements. The Registrants monitor compliance with the covenants on a regular basis. At December 31, 2016, the Registrants were in compliance with these covenants. At this time, the Registrants believe that these covenants and other borrowing conditions will not limit access to these funding sources. See Note 7 to the Financial Statements for further discussion of the Registrants' credit facilities.

48
Intercompany (LKE, LG&E and KU)
Committed Capacity Borrowed Other Used
Capacity Unused Capacity
LKE Credit Facility $ 225 $ 163 $ — $ 62 LG&E Money Pool (a) 500 — 169 331 KU Money Pool (a) 500 — 16 484
(a) LG&E and KU participate in an intercompany agreement whereby LKE, LG&E and/or KU make available funds up to $500 million at an interest rate
based on a market index of commercial paper issues. However, the FERC has authorized a maximum aggregate short-term debt limit for each utility at $500 million from all covered sources.
Commercial Paper (All Registrants) PPL, PPL Electric, LG&E and KU maintain commercial paper programs to provide an additional financing source to fund short-term liquidity needs, as necessary. Commercial paper issuances, included in "Short-term debt" on the Balance Sheets, are supported by the respective Registrant's Syndicated Credit Facility. The following commercial paper programs were in place at:
December 31, 2016
Capacity
Commercial Paper
Issuances Unused
Capacity
PPL Capital Funding $ 1,000 $ 20 $ 980 PPL Electric 400 295 105 LG&E 350 169 181 KU 350 16 334 Total LKE 700 185 515
Total PPL $ 2,100 $ 500 $ 1,600 In January 2017, PPL Electric's commercial paper program capacity was increased to $650 million. See Note 7 to the Financial Statements for further discussion of the Registrants' commercial paper programs. Long-term Debt and Equity Securities (PPL) PPL and its subsidiaries are currently authorized to incur, subject to market conditions, up to approximately $3.4 billion of long-term indebtedness in 2017, the proceeds of which would be used to fund capital expenditures and for general corporate purposes. PPL plans to issue, subject to market conditions, up to $350 million of common stock in 2017. (PPL Electric) PPL Electric is currently authorized to incur, subject to market conditions, up to approximately $500 million of long-term indebtedness in 2017, the proceeds of which would be used to fund capital expenditures and for general corporate purposes. PPL Electric currently plans to remarket, subject to market conditions, $224 million of its bonds with put dates in 2017.

49
(LKE, LG&E and KU) LG&E is currently authorized to incur, subject to market conditions and regulatory approvals, up to approximately $400 million of long-term indebtedness in 2017, the proceeds of which would be used to fund capital expenditures and for general corporate purposes. LG&E currently plans to remarket, subject to market conditions, $194 million of its bonds with put dates in 2017. KU is currently authorized to incur, subject to market conditions and regulatory approvals, up to approximately $100 million of long-term indebtedness in 2017, the proceeds of which would be used to fund capital expenditures. Contributions from Parent/Member (PPL Electric, LKE, LG&E and KU) From time to time, LKE's member or the parents of PPL Electric, LG&E and KU make capital contributions to subsidiaries. The proceeds from these contributions are used to fund capital expenditures and for other general corporate purposes and, in the case of LKE, to make contributions to its subsidiaries. Forecasted Uses of Cash (All Registrants) In addition to expenditures required for normal operating activities, such as purchased power, payroll, fuel and taxes, the Registrants currently expect to incur future cash outflows for capital expenditures, various contractual obligations, payment of dividends on its common stock, distributions by LKE to its member, and possibly the purchase or redemption of a portion of debt securities. Capital Expenditures The table below shows the Registrants' current capital expenditure projections for the years 2017 through 2021. Expenditures for the domestic regulated utilities are expected to be recovered through rates, pending regulatory approval.
Projected
Total 2017 2018 2019 2020 2021 PPL Construction expenditures (a) (b)
Generating facilities $ 862 $ 220 $ 212 $ 195 $ 97 $ 138 Distribution facilities 8,849 1,855 1,743 1,761 1,732 1,758 Transmission facilities 4,077 900 881 875 859 562 Environmental 1,435 329 438 210 220 238 Other 664 137 215 189 66 57
Total Capital Expenditures $ 15,887 $ 3,441 $ 3,489 $ 3,230 $ 2,974 $ 2,753 PPL Electric (a) (b)
Distribution facilities $ 1,908 $ 434 $ 389 $ 390 $ 348 $ 347 Transmission facilities 3,283 768 737 675 704 399
Total Capital Expenditures $ 5,191 $ 1,202 $ 1,126 $ 1,065 $ 1,052 $ 746 LKE (b)
Generating facilities $ 862 $ 220 $ 212 $ 195 $ 97 $ 138 Distribution facilities 1,652 297 339 348 325 343 Transmission facilities 795 132 144 200 156 163 Environmental 1,435 329 438 210 220 238 Other 636 129 209 184 61 53
Total Capital Expenditures $ 5,380 $ 1,107 $ 1,342 $ 1,137 $ 859 $ 935

50
Projected
Total 2017 2018 2019 2020 2021
LG&E (b)
Generating facilities $ 422 $ 138 $ 104 $ 81 $ 36 $ 63 Distribution facilities 1,090 188 223 228 216 235 Transmission facilities 222 24 32 74 43 49 Environmental 645 150 201 78 95 121 Other 310 60 102 92 28 28
Total Capital Expenditures $ 2,689 $ 560 $ 662 $ 553 $ 418 $ 496 KU (b)
Generating facilities $ 440 $ 82 $ 108 $ 114 $ 61 $ 75 Distribution facilities 562 109 116 120 109 108 Transmission facilities 573 109 112 126 113 113 Environmental 789 178 237 131 126 117 Other 328 69 106 94 32 27
Total Capital Expenditures $ 2,692 $ 547 $ 679 $ 585 $ 441 $ 440 (a) Construction expenditures include capitalized interest and AFUDC, which are expected to total approximately $86 million for PPL and $67 million for
PPL Electric. (b) The 2017 total excludes amounts included in accounts payable as of December 31, 2016. Capital expenditure plans are revised periodically to reflect changes in operational, market and regulatory conditions. For the years presented, this table includes PPL Electric's asset optimization program to replace aging transmission and distribution assets. This table also includes LKE's environmental projects related to existing and proposed EPA compliance standards excluding the Clean Power Plan (actual costs may be significantly lower or higher depending on the final requirements and market conditions; most environmental compliance costs incurred by LG&E and KU in serving KPSC jurisdictional customers are generally eligible for recovery through the ECR mechanism). See Note 6 to the Financial Statements for information on LG&E's and KU's ECR mechanism and CPCN filing. In addition to cash on hand and cash from operations, the Registrants plan to fund capital expenditures in 2017 with proceeds from the sources noted below.
Source PPL PPL
Electric LKE LG&E KU
Issuance of common stock X Issuance of long-term debt securities X X X X X Equity contributions from parent/member X X X X Short-term debt X X X X X
X = Expected funding source.

51
Contractual Obligations The Registrants have assumed various financial obligations and commitments in the ordinary course of conducting business. At December 31, 2016, estimated contractual cash obligations were as follows:
Total 2017 2018 - 2019 2020 - 2021 After 2021 PPL Long-term Debt (a) $ 18,399 $ 518 $ 484 $ 2,412 $ 14,985 Interest on Long-term Debt (b) 14,556 808 1,577 1,502 10,669 Operating Leases (c) 118 31 42 19 26 Purchase Obligations (d) 3,596 1,050 1,179 579 788 Other Long-term Liabilities Reflected on the Balance Sheet (e) 878 377 428 73 — Total Contractual Cash Obligations $ 37,547 $ 2,784 $ 3,710 $ 4,585 $ 26,468
PPL Electric Long-term Debt (a) $ 2,864 $ 224 $ — $ 500 $ 2,140 Interest on Long-term Debt (b) 2,441 120 237 232 1,852 Unconditional Power Purchase Obligations 106 24 48 34 — Total Contractual Cash Obligations $ 5,411 $ 368 $ 285 $ 766 $ 3,992
LKE Long-term Debt (a) $ 5,110 $ 194 $ 234 $ 1,225 $ 3,457 Interest on Long-term Debt (b) 3,336 196 389 350 2,401 Operating Leases (c) 93 24 35 15 19 Coal and Natural Gas Purchase Obligations (f) 2,165 575 955 409 226 Unconditional Power Purchase Obligations (g) 705 29 57 58 561 Construction Obligations (h) 270 258 9 2 1 Pension Benefit Plan Obligations (e) 18 18 — — — Other Obligations 297 111 110 76 — Total Contractual Cash Obligations $ 11,994 $ 1,405 $ 1,789 $ 2,135 $ 6,665
LG&E Long-term Debt (a) $ 1,634 $ 194 $ 138 $ — $ 1,302 Interest on Long-term Debt (b) 1,257 61 118 112 966 Operating Leases (c) 50 15 21 6 8 Coal and Natural Gas Purchase Obligations (f) 912 248 416 163 85 Unconditional Power Purchase Obligations (g) 488 20 39 40 389 Construction Obligations (h) 147 143 3 1 — Other Obligations 138 45 53 40 — Total Contractual Cash Obligations $ 4,626 $ 726 $ 788 $ 362 $ 2,750
KU Long-term Debt (a) $ 2,351 $ — $ 96 $ 500 $ 1,755 Interest on Long-term Debt (b) 1,820 92 186 170 1,372 Operating Leases (c) 42 9 14 9 10 Coal and Natural Gas Purchase Obligations (f) 1,252 327 538 246 141 Unconditional Power Purchase Obligations (g) 217 9 18 18 172 Construction Obligations (h) 105 102 2 1 — Pension Benefit Plan Obligations (e) 18 18 — — — Other Obligations 117 40 45 32 — Total Contractual Cash Obligations $ 5,922 $ 597 $ 899 $ 976 $ 3,450
(a) Reflects principal maturities based on stated maturity or earlier put dates. See Note 7 to the Financial Statements for a discussion of variable-rate
remarketable bonds issued on behalf of LG&E and KU. The Registrants do not have any significant capital lease obligations. (b) Assumes interest payments through stated maturity or earlier put dates. For PPL, LKE, LG&E and KU the payments herein are subject to change, as
payments for debt that is or becomes variable-rate debt have been estimated and for PPL, payments denominated in British pounds sterling have been translated to U.S. dollars at a current foreign currency exchange rate.
(c) See Note 9 to the Financial Statements for additional information.

52
(d) The amounts include agreements to purchase goods or services that are enforceable and legally binding and specify all significant terms, including: fixed or minimum quantities to be purchased; fixed, minimum or variable price provisions; and the approximate timing of the transaction. Primarily includes as applicable, the purchase obligations of electricity, coal, natural gas and limestone, as well as certain construction expenditures, which are also included in the Capital Expenditures table presented above.
(e) The amounts for PPL include WPD's contractual deficit pension funding requirements arising from actuarial valuations performed in March 2013 and March 2016. The U.K. electricity regulator currently allows a recovery of a substantial portion of the contributions relating to the plan deficit. The amounts also include contributions made or committed to be made in 2017 for PPL's and LKE's U.S. pension plans (for PPL Electric, LG&E and KU includes their share of these amounts). Based on the current funded status of these plans, except for WPD's plans, no cash contributions are required. See Note 11 to the Financial Statements for a discussion of expected contributions.
(f) Represents contracts to purchase coal, natural gas and natural gas transportation. See Note 13 to the Financial Statements for additional information. (g) Represents future minimum payments under OVEC power purchase agreements through June 2040. See Note 13 to the Financial Statements for
additional information. (h) Represents construction commitments, including commitments for LG&E's and KU's Trimble County landfill construction, LG&E's Paddy's Run plant
demolition, Ohio Falls refurbishment and completion of the Mill Creek environmental air project, which are also reflected in the Capital Expenditures table presented above.
Dividends/Distributions (PPL) PPL views dividends as an integral component of shareowner return and expects to continue to pay dividends in amounts that are within the context of maintaining a capitalization structure that supports investment grade credit ratings. In November 2016, PPL declared its quarterly common stock dividend, payable January 3, 2017, at 38 cents per share (equivalent to $1.52 per annum). On February 1, 2017, PPL announced that the company is increasing its common stock dividend to 39.5 cents per share on a quarterly basis (equivalent to $1.58 per annum). Future dividends will be declared at the discretion of the Board of Directors and will depend upon future earnings, cash flows, financial and legal requirements and other relevant factors. See Note 8 to the Financial Statements for information regarding the June 1, 2015 distribution to PPL's shareowners of a newly formed entity, Holdco, which at closing owned all of the membership interests of PPL Energy Supply and all of the common stock of Talen Energy. Subject to certain exceptions, PPL may not declare or pay any cash dividend or distribution on its capital stock during any period in which PPL Capital Funding defers interest payments on its 2007 Series A Junior Subordinated Notes due 2067 or 2013 Series B Junior Subordinated Notes due 2073. At December 31, 2016, no interest payments were deferred. (PPL Electric, LKE, LG&E and KU) From time to time, as determined by their respective Board of Directors, the Registrants pay dividends or distributions, as applicable, to their respective shareholders or members. Certain of the credit facilities of PPL Electric, LKE, LG&E and KU include minimum debt covenant ratios that could effectively restrict the payment of dividends or distributions. (All Registrants) See Note 7 to the Financial Statements for these and other restrictions related to distributions on capital interests for the Registrants and their subsidiaries. Purchase or Redemption of Debt Securities The Registrants will continue to evaluate outstanding debt securities and may decide to purchase or redeem these securities in open market or privately negotiated transactions, in exchange transactions or otherwise, depending upon prevailing market conditions, available cash and other factors, and may be commenced or suspended at any time. The amounts involved may be material.

53
Rating Agency Actions Moody's and S&P have periodically reviewed the credit ratings of the debt of the Registrants and their subsidiaries. Based on their respective independent reviews, the rating agencies may make certain ratings revisions or ratings affirmations. A credit rating reflects an assessment by the rating agency of the creditworthiness associated with an issuer and particular securities that it issues. The credit ratings of the Registrants and their subsidiaries are based on information provided by the Registrants and other sources. The ratings of Moody's and S&P are not a recommendation to buy, sell or hold any securities of the Registrants or their subsidiaries. Such ratings may be subject to revisions or withdrawal by the agencies at any time and should be evaluated independently of each other and any other rating that may be assigned to the securities. The credit ratings of the Registrants and their subsidiaries affect their liquidity, access to capital markets and cost of borrowing under their credit facilities. A downgrade in the Registrants' or their subsidiaries' credit ratings could result in higher borrowing costs and reduced access to capital markets. The Registrants and their subsidiaries have no credit rating triggers that would result in the reduction of access to capital markets or the acceleration of maturity dates of outstanding debt. The following table sets forth the Registrants' and their subsidiaries' credit ratings for outstanding debt securities or commercial paper programs as of December 31, 2016.
Senior Unsecured Senior Secured Commercial Paper
Issuer Moody's S&P Moody's S&P Moody's S&P
PPL PPL Capital Funding Baa2 BBB+ P-2 A-2 WPD plc Baa3 BBB+ WPD (East Midlands) Baa1 A- WPD (West Midlands) Baa1 A- WPD (South Wales) Baa1 A- WPD (South West) Baa1 A- PPL and PPL Electric PPL Electric A1 A P-2 A-2
PPL and LKE LKE Baa1 BBB+ LG&E A1 A P-2 A-2 KU A1 A P-2 A-2
The rating agencies have taken the following actions related to the Registrants and their subsidiaries. (PPL) In February 2016, Moody's and S&P affirmed their commercial paper ratings for PPL Capital Funding's $1.0 billion commercial paper program. In May 2016, Moody's and S&P assigned ratings of Baa2 and BBB+ to PPL Capital Funding's $650 million 3.10% Senior Notes due 2026. In June 2016, S&P assigned a long-term issuer rating of A- and a short-term issuer rating of A-2 to PPL Capital Funding. (PPL Electric) In February 2016, Moody's and S&P affirmed their commercial paper ratings for PPL Electric's $400 million commercial paper program.
54
In February 2016, Moody's and S&P assigned ratings of A1 and A to LCIDA's $116 million 0.90% Pollution Control Revenue Refunding Bonds due 2029 and $108 million 0.90% Pollution Control Revenue Refunding Bonds due 2027, issued on behalf of PPL Electric. In January 2017, Moody's and S&P affirmed their commercial paper ratings for PPL Electric's $650 million commercial paper program. (LG&E) In September 2016, Moody's and S&P assigned ratings of A1 and A to the $125 million County of Trimble, Kentucky Pollution Control Revenue Refunding Bonds, Series 2016 A (Louisville Gas and Electric Company Project) due 2044, issued on behalf of LG&E. (KU) In August 2016, Moody's and S&P assigned ratings of A1 and A to the $96 million County of Carroll, Kentucky Pollution Control Revenue Refunding Bonds, Series 2016 A (Kentucky Utilities Company Project) due 2042, issued on behalf of KU. Ratings Triggers (PPL) As discussed in Note 7 to the Financial Statements, certain of WPD's senior unsecured notes may be put by the holders to the issuer for redemption if the long-term credit ratings assigned to the notes are withdrawn by any of the rating agencies (Moody's or S&P) or reduced to a non-investment grade rating of Ba1 or BB+ or lower in connection with a restructuring event. A restructuring event includes the loss of, or a material adverse change to, the distribution licenses under which WPD (East Midlands), WPD (South West), WPD (South Wales) and WPD (West Midlands) operate and would be a trigger event for each company. These notes totaled £4.4 billion (approximately $5.5 billion) nominal value at December 31, 2016. (PPL, LKE, LG&E and KU) Various derivative and non-derivative contracts, including contracts for the sale and purchase of electricity and fuel, commodity transportation and storage, interest rate and foreign currency instruments (for PPL), contain provisions that require the posting of additional collateral, or permit the counterparty to terminate the contract, if PPL's, LKE's, LG&E's or KU's or their subsidiaries' credit rating, as applicable, were to fall below investment grade. See Note 17 to the Financial Statements for a discussion of "Credit Risk-Related Contingent Features," including a discussion of the potential additional collateral requirements for PPL, LKE and LG&E for derivative contracts in a net liability position at December 31, 2016. Guarantees for Subsidiaries (PPL) PPL guarantees certain consolidated affiliate financing arrangements. Some of the guarantees contain financial and other covenants that, if not met, would limit or restrict the consolidated affiliates' access to funds under these financing arrangements, accelerate maturity of such arrangements or limit the consolidated affiliates' ability to enter into certain transactions. At this time, PPL believes that these covenants will not limit access to relevant funding sources. See Note 13 to the Financial Statements for additional information about guarantees. Off-Balance Sheet Arrangements (All Registrants) The Registrants have entered into certain agreements that may contingently require payment to a guaranteed or indemnified party. See Note 13 to the Financial Statements for a discussion of these agreements.

55
Risk Management Market Risk (All Registrants) See Notes 1, 16, and 17 to the Financial Statements for information about the Registrants' risk management objectives, valuation techniques and accounting designations. The forward-looking information presented below provides estimates of what may occur in the future, assuming certain adverse market conditions and model assumptions. Actual future results may differ materially from those presented. These disclosures are not precise indicators of expected future losses, but only indicators of possible losses under normal market conditions at a given confidence level. Interest Rate Risk The Registrants and their subsidiaries issue debt to finance their operations, which exposes them to interest rate risk. The Registrants and their subsidiaries utilize various financial derivative instruments to adjust the mix of fixed and floating interest rates in their debt portfolios, adjust the duration of their debt portfolios and lock in benchmark interest rates in anticipation of future financing, when appropriate. Risk limits under the risk management program are designed to balance risk exposure to volatility in interest expense and changes in the fair value of the debt portfolios due to changes in the absolute level of interest rates. The following interest rate hedges were outstanding at December 31.
2016 2015
Exposure Hedged
Fair Value, Net - Asset (Liability)
(a)
Effect of a 10%
Adverse Movement in Rates (b)
Maturities Ranging Through
Exposure Hedged
Fair Value, Net - Asset (Liability)
(a)
Effect of a 10%
Adverse Movement in Rates (b)
PPL Cash flow hedges
Interest rate swaps (c) $ — $ — $ — $ 300 $ (24 ) $ (7 ) Cross-currency swaps (d) 802 191 (90 ) 2028 1,262 87 (152)
Economic hedges Interest rate swaps (e) 147 (32 ) (2 ) 2033 179 (48 ) (2)
LKE Economic hedges
Interest rate swaps (e) 147 (32 ) (2 ) 2033 179 (48 ) (2) LG&E Economic hedges
Interest rate swaps (e) 147 (32 ) (2 ) 2033 179 (48 ) (2)
(a) Includes accrued interest, if applicable. (b) Effects of adverse movements decrease assets or increase liabilities, as applicable, which could result in an asset becoming a liability. Sensitivities
represent a 10% adverse movement in interest rates, except for cross-currency swaps which also includes a 10% adverse movement in foreign currency exchange rates.
(c) Changes in the fair value of such cash flow hedges are recorded in equity or as regulatory assets or regulatory liabilities, if recovered through regulated rates, and reclassified into earnings in the same period during which the item being hedged affects earnings.
(d) Cross-currency swaps are utilized to hedge the principal and interest payments of WPD's U.S. dollar-denominated senior notes. Changes in the fair value of these instruments are recorded in equity and reclassified into earnings in the same period during which the item being hedged affects earnings.
(e) Realized changes in the fair value of such economic hedges are recoverable through regulated rates and any subsequent changes in the fair value of these derivatives are included in regulatory assets or regulatory liabilities.

56
The Registrants are exposed to a potential increase in interest expense and to changes in the fair value of their debt portfolios. The estimated impact of a 10% adverse movement in interest rates on interest expense at December 31, 2016 and 2015 was insignificant for PPL, PPL Electric, LKE, LG&E and KU. The estimated impact of a 10% adverse movement in interest rates on the fair value of debt at December 31 is shown below.
10% Adverse Movement in Rates
2016 2015 PPL $ 590 $ 710 PPL Electric 138 152 LKE 182 192 LG&E 66 69 KU 100 104
Foreign Currency Risk (PPL) PPL is exposed to foreign currency risk primarily through investments in U.K. affiliates. Under its risk management program, PPL may enter into financial instruments to hedge certain foreign currency exposures, including translation risk of expected earnings, firm commitments, recognized assets or liabilities, anticipated transactions and net investments. The following foreign currency hedges were outstanding at December 31.
2016 2015
Exposure Hedged
Fair Value, Net - Asset (Liability)
Effect of a 10% Adverse
Movement in Foreign Currency Exchange Rates (a)
Maturities Ranging Through
Exposure Hedged
Fair Value, Net - Asset (Liability)
Effect of a 10% Adverse
Movement in Foreign Currency Exchange Rates (a)
Net investment hedges (b) £ — $ — $ — £ 50 $ 10 $ (7 ) Economic hedges (c) 1,909 184 (215) 2018 1,831 198 (246 )
(a) Effects of adverse movements decrease assets or increase liabilities, as applicable, which could result in an asset becoming a liability. (b) To protect the value of a portion of its net investment in WPD, PPL executes forward contracts to sell GBP. (c) To economically hedge the translation of expected earnings denominated in GBP. (All Registrants) Commodity Price Risk PPL is exposed to commodity price risk through its domestic subsidiaries as described below. • PPL Electric is exposed to commodity price risk from its obligation as PLR; however, its PUC-approved cost recovery
mechanism substantially eliminates its exposure to this risk. PPL Electric also mitigates its exposure to commodity price risk by entering into full-requirement supply agreements to serve its PLR customers. These supply agreements transfer the commodity price risk associated with the PLR obligation to the energy suppliers.
• LG&E's and KU's rates include certain mechanisms for fuel and fuel-related expenses. In addition, LG&E's rates include a mechanism for natural gas supply expenses. These mechanisms generally provide for timely recovery of market price fluctuations associated with these expenses.
Volumetric Risk PPL is exposed to volumetric risk through its subsidiaries as described below.
57
• WPD is exposed to volumetric risk which, is significantly mitigated as a result of the method of regulation in the U.K. Under the RIIO-ED1 price control period, recovery of such exposure occurs on a two year lag. See Note 1 for additional information on revenue recognition under RIIO-ED1.
• PPL Electric, LG&E and KU are exposed to volumetric risk on retail sales, mainly due to weather and other economic conditions for which there is limited mitigation between rate cases.
Defined Benefit Plans - Securities Price Risk See "Application of Critical Accounting Policies - Defined Benefits" for additional information regarding the effect of securities price risk on plan assets. Credit Risk (All Registrants) Credit risk is the risk that the Registrants would incur a loss as a result of nonperformance by counterparties of their contractual obligations. The Registrants maintain credit policies and procedures with respect to counterparty credit (including requirements that counterparties maintain specified credit ratings) and require other assurances in the form of credit support or collateral in certain circumstances in order to limit counterparty credit risk. However, the Registrants, as applicable, have concentrations of suppliers and customers among electric utilities, financial institutions and energy marketing and trading companies. These concentrations may impact the Registrants' overall exposure to credit risk, positively or negatively, as counterparties may be similarly affected by changes in economic, regulatory or other conditions. (PPL and PPL Electric) In 2014, PPL Electric filed a request with the PUC for approval of PPL Electric's PLR procurement plan for the period of June 2015 through May 2017, which was approved in January 2015. To date, PPL Electric has conducted all of its planned competitive solicitations. In February 2016, PPL Electric filed a request with the PUC for approval of PPL Electric's PLR procurement plan for the period June 2017 through May 2021, which includes a total of eight solicitations for electricity supply held semiannually in April and October. In October 2016, the PUC approved PPL Electric's plan with the exception of one item. On January 26, 2017, the PUC issued a Final Order approving its original position and concluded proceedings on the plan. Under the standard Supply Master Agreement (the Agreement) for the competitive solicitation process, PPL Electric requires all suppliers to post collateral if their credit exposure exceeds an established credit limit. In the event a supplier defaults on its obligation, PPL Electric would be required to seek replacement power in the market. All incremental costs incurred by PPL Electric would be recoverable from customers in future rates. At December 31, 2016, most of the successful bidders under all of the solicitations had an investment grade credit rating from S&P, and were not required to post collateral under the Agreement. A small portion of bidders were required to post an insignificant amount of collateral under the Agreement. There is no instance under the Agreement in which PPL Electric is required to post collateral to its suppliers. See Note 17 to the Financial Statements for additional information on credit risk. Foreign Currency Translation (PPL) The value of the British pound sterling fluctuates in relation to the U.S. dollar. In 2016, changes in this exchange rate resulted in a foreign currency translation loss of $1.1 billion, which primarily reflected a $2.1 billion decrease to PP&E and $490 million decrease to goodwill partially offset by a $1.3 billion decrease to long-term debt and a decrease of $208 million to other net liabilities. In 2015, changes in this exchange rate resulted in a foreign currency translation loss of $240 million, which primarily reflected a $472 million decrease to PP&E and $117 million decrease to goodwill partially offset by a $285 million decrease to long-term debt and a decrease of $64 million to other net liabilities. In 2014, changes in this exchange rate resulted

58
in a foreign currency translation loss of $290 million, which primarily reflected a $542 million decrease to PP&E and $138 million decrease to goodwill partially offset by a $337 million decrease to long-term debt and a decrease of $53 million to other net liabilities. The impact of foreign currency translation is recorded in AOCI. (All Registrants) Related Party Transactions The Registrants are not aware of any material ownership interests or operating responsibility by senior management in outside partnerships, including leasing transactions with variable interest entities, or other entities doing business with the Registrants. See Note 14 to the Financial Statements for additional information on related party transactions for PPL Electric, LKE, LG&E and KU. Acquisitions, Development and Divestitures The Registrants from time to time evaluate opportunities for potential acquisitions, divestitures and development projects. Development projects are reexamined based on market conditions and other factors to determine whether to proceed with, modify or terminate the projects. Any resulting transactions may impact future financial results. See Note 8 to the Financial Statements for information on the more significant activities. (PPL) See Note 8 to the Financial Statements for information on the spinoff of PPL Energy Supply. (All Registrants) Environmental Matters Extensive federal, state and local environmental laws and regulations are applicable to PPL's, PPL Electric's, LKE's, LG&E's and KU's air emissions, water discharges and the management of hazardous and solid waste, as well as other aspects of the Registrants' businesses. The cost of compliance or alleged non-compliance cannot be predicted with certainty but could be significant. In addition, costs may increase significantly if the requirements or scope of environmental laws or regulations, or similar rules, are expanded or changed. Costs may take the form of increased capital expenditures or operating and maintenance expenses, monetary fines, penalties or other restrictions. Many of these environmental law considerations are also applicable to the operations of key suppliers, or customers, such as coal producers and industrial power users, and may impact the cost for their products or their demand for the Registrants' services. Increased capital and operating costs are subject to rate recovery. PPL, PPL Electric, LKE, LG&E and KU can provide no assurances as to the ultimate outcome of future environmental or rate proceedings before regulatory authorities. See Note 13 to the Financial Statements for a discussion of the more significant environmental matters including:
• Legal Matters, • Climate Change, • Coal Combustion Residuals, • Effluent Limitations Guidelines, and • National Ambient Air Quality Standards.
Additionally, see "Business - Environmental Matters" for further information on environmental matters. See Note 19 to the Financial Statements for information related to the impacts of CCRs on AROs.

59
Sustainability Increasing attention has been focused on a broad range of corporate activities under the heading of “sustainability”, which has resulted in a significant increase in the number of requests from interested parties for information on sustainability topics. These parties range from investor groups focused on environmental, social, governance and other matters to non-investors concerned with a variety of public policy matters. Often the scope of the information sought is very broad and not necessarily relevant to an issuer’s business or industry. As a result, a number of private groups have proposed to standardize the subject matter constituting sustainability, either generally or by industry. Those efforts remain ongoing. In addition, certain of these private groups have advocated that the SEC promulgate regulations requiring specific sustainability reporting under the Securities Exchange Act of 1934, as amended (the “’34 Act”), or that issuers voluntarily include certain sustainability disclosure in their ’34 Act reports. To date, no new reporting requirements have been adopted or proposed by the SEC. As has been PPL’s practice, to the extent sustainability issues have or may have a material impact on the Registrants’ financial condition or results of operation, PPL discloses such matters in accordance with applicable securities law and SEC regulations. With respect to other sustainability topics that PPL deems relevant to investors but that are not required to be reported under applicable securities law and SEC regulation, PPL will continue each spring to publish its annual sustainability report and post that report on its corporate website at www.pplweb.com and on www.pplsustainability.com. Neither the information in such annual sustainability report nor the information at such websites is incorporated in this Form 10-K by reference, and it should not be considered a part of this Form 10-K. In preparing its sustainability report, PPL is guided by the framework established by the Global Reporting Initiative, which identifies environmental, social, governance and other subject matter categories, together with recent efforts by the Edison Electric Institute to provide guidance as to the appropriate subset of sustainability information that can be applied consistently across the electric utility industry. Competition See "Competition" under each of PPL's reportable segments in "Business - General - Segment Information" for a discussion of competitive factors affecting the Registrants.
New Accounting Guidance See Notes 1 and 21 to the Financial Statements for a discussion of new accounting guidance adopted and pending adoption.
Application of Critical Accounting Policies Financial condition and results of operations are impacted by the methods, assumptions and estimates used in the application of critical accounting policies. The following accounting policies are particularly important to an understanding of the reported financial condition or results of operations, and require management to make estimates or other judgments of matters that are inherently uncertain. Changes in the estimates or other judgments included within these accounting policies could result in a significant change to the information presented in the Financial Statements (these accounting policies are also discussed in Note 1 to the Financial Statements). Senior management has reviewed with PPL's Audit Committee these critical accounting policies, the following disclosures regarding their application and the estimates and assumptions regarding them. Price Risk Management (PPL) See "Financial Condition - Risk Management" above, as well as "Price Risk Management" in Note 1 to the Financial Statements.

60
Defined Benefits (All Registrants) Certain of the Registrants' subsidiaries sponsor or participate in, as applicable, various qualified funded and non-qualified unfunded defined benefit pension plans and both funded and unfunded other postretirement benefit plans. These plans are applicable to the majority of the Registrants' employees (based on eligibility for their applicable plans). The Registrants and certain of their subsidiaries record an asset or liability to recognize the funded status of all defined benefit plans with an offsetting entry to AOCI or in the case of PPL Electric, LG&E and KU, regulatory assets and liabilities for amounts that are expected to be recovered through regulated customer rates. Consequently, the funded status of all defined benefit plans is fully recognized on the Balance Sheets. See Notes 6 and 11 to the Financial Statements for additional information about the plans and the accounting for defined benefits. A summary of plan sponsors by Registrant and whether a Registrant or its subsidiaries sponsor (S) or participate in and receives allocations (P) from those plans is shown in the table below.
Plan Sponsor PPL PPL Electric LKE LG&E KU
PPL Services S P WPD (a) S LKE S P P LG&E S
(a) Does not sponsor or participate in other postretirement benefits plans. Management makes certain assumptions regarding the valuation of benefit obligations and the performance of plan assets. As such, annual net periodic defined benefit costs are recorded in current earnings or regulatory assets based on estimated results. Any differences between actual and estimated results are recorded in AOCI, or in the case of PPL Electric, LG&E and KU, regulatory assets and liabilities, for amounts that are expected to be recovered through regulated customer rates. These amounts in AOCI or regulatory assets and liabilities are amortized to income over future periods. The delayed recognition allows for a smoothed recognition of costs over the working lives of the employees who benefit under the plans. The primary assumptions are: • Discount Rate - The discount rate is used in calculating the present value of benefits, which is based on projections of
benefit payments to be made in the future. The objective in selecting the discount rate is to measure the single amount that, if invested at the measurement date in a portfolio of high-quality debt instruments, would provide the necessary future cash flows to pay the accumulated benefits when due.
• Expected Return on Plan Assets - Management projects the long-term rates of return on plan assets that will be earned over
the life of the plan. These projected returns reduce the net benefit costs the Registrants record currently. • Rate of Compensation Increase - Management projects employees' annual pay increases, which are used to project
employees' pension benefits at retirement. • Health Care Cost Trend Rate - Management projects the expected increases in the cost of health care. In addition to the economic assumptions above that are evaluated annually, Management must also make assumptions regarding the life expectancy of employees covered under their defined benefit pension and other postretirement benefit plans. • U.S. - at December 31, 2014, the plan sponsors adopted the new mortality tables issued by the Society of Actuaries in
October 2014 (RP-2014 base tables) for all U.S. defined benefit pension and other postretirement benefit plans. In

61
addition, plan sponsors updated the basis for estimating projected mortality improvements and selected the IRS BB-2D two-dimensional improvement scale on a generational basis for all U.S. defined benefit pension and other postretirement benefit plans. These new mortality assumptions reflect the recognition of both improved life expectancies and the expectation of continuing improvements in life expectancies.
• U.K. - at March 31 2016, the UK plan sponsors adopted the new mortality assumptions based on the “SAPS S2 All” tables issued by the Self-Administered Pensions Schemes’ (SAPS) study for all U.K. defined benefit pension plans. In addition, the UK plan sponsors updated the basis for estimating projected mortality improvements and selected the CMI 2015 Core Projections model published by the Continuous Mortality Investigation study with a long-term future improvement rate of 1% for all U.K. defined benefit pension plans. These new mortality assumptions reflect the impact of the most recently available actual scheme mortality data (which has been higher than previously expected) on both current life expectancies and the expectation of continuing improvements in life expectancies. The use of the new base tables and improvement scale resulted in a decrease to U.K. defined benefit pension obligations, a decrease to future expense and an increase to funded status.
(PPL) In selecting the discount rate for its U.K. pension plans, WPD starts with a cash flow analysis of the expected benefit payment stream for its plans. These plan-specific cash flows are matched against a spot-rate yield curve to determine the assumed discount rate. The spot-rate yield curve uses an iBoxx British pounds sterling denominated corporate bond index as its base. From this base, those bonds with the lowest and highest yields are eliminated to develop an appropriate subset of bonds. Historically, WPD used the single weighted-average discount rate derived from the spot rates used to discount the benefit obligation. Concurrent with the annual remeasurement of plan assets and obligations at December 31, 2015, WPD began using individual spot rates to measure service cost and interest cost beginning with the calculation of 2016 net periodic defined benefit cost. An individual bond matching approach, which is used for the U.S. pension plans as discussed below, is not used for the U.K. pension plans because the universe of bonds in the U.K. is not deep enough to adequately support such an approach.
(All Registrants) In selecting the discount rates for U.S. defined benefit plans, the plan sponsors start with a cash flow analysis of the expected benefit payment stream for their plans. The plan-specific cash flows are matched against the coupons and expected maturity values of individually selected bonds. This bond matching process begins with the full universe of Aa-rated non-callable (or callable with make-whole provisions) bonds, serving as the base from which those with the lowest and highest yields are eliminated to develop an appropriate subset of bonds. Individual bonds are then selected based on the timing of each plan's cash flows and parameters are established as to the percentage of each individual bond issue that could be hypothetically purchased and the surplus reinvestment rates to be assumed. To determine the expected return on plan assets, plan sponsors project the long-term rates of return on plan assets using a best-estimate of expected returns, volatilities and correlations for each asset class. Each plan's specific current and expected asset allocations are also considered in developing a reasonable return assumption. In selecting a rate of compensation increase, plan sponsors consider past experience in light of movements in inflation rates. The following table provides the weighted-average assumptions selected for discount rate, expected return on plan assets and rate of compensation increase at December 31 used to measure current year obligations and subsequent year net periodic defined benefit costs under GAAP, as applicable.
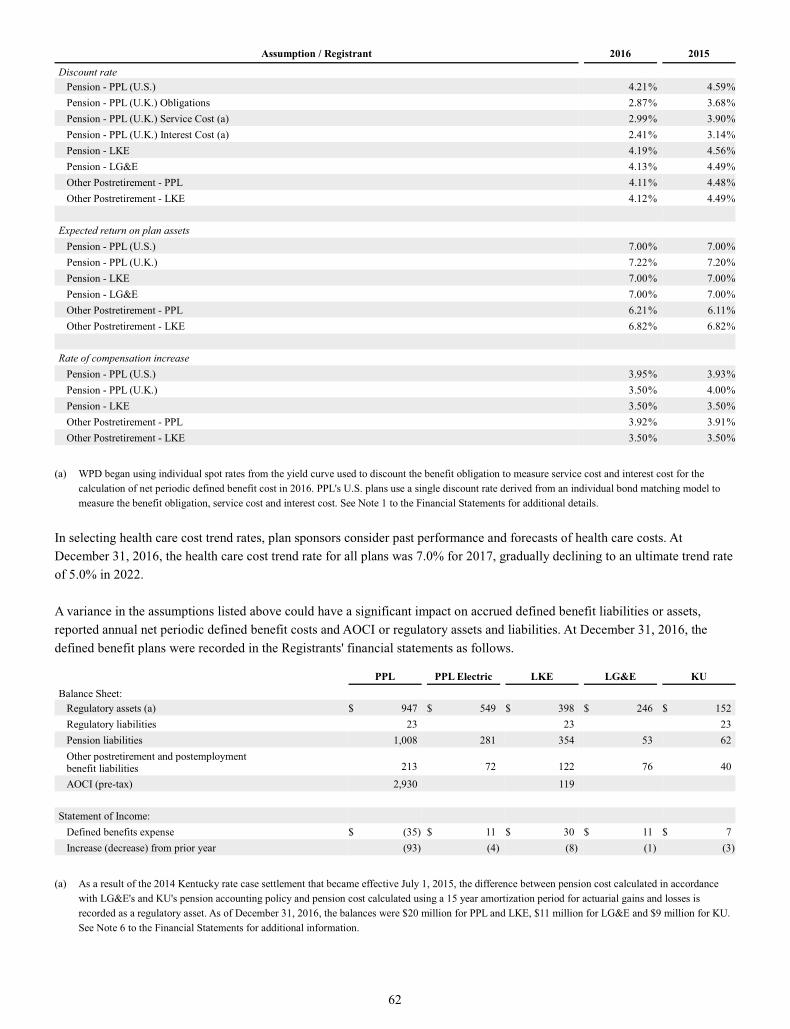
62
Assumption / Registrant 2016 2015
Discount rate Pension - PPL (U.S.) 4.21 % 4.59 % Pension - PPL (U.K.) Obligations 2.87 % 3.68 % Pension - PPL (U.K.) Service Cost (a) 2.99 % 3.90 % Pension - PPL (U.K.) Interest Cost (a) 2.41 % 3.14 % Pension - LKE 4.19 % 4.56 % Pension - LG&E 4.13 % 4.49 % Other Postretirement - PPL 4.11 % 4.48 % Other Postretirement - LKE 4.12 % 4.49 %
Expected return on plan assets
Pension - PPL (U.S.) 7.00 % 7.00 % Pension - PPL (U.K.) 7.22 % 7.20 % Pension - LKE 7.00 % 7.00 % Pension - LG&E 7.00 % 7.00 % Other Postretirement - PPL 6.21 % 6.11 % Other Postretirement - LKE 6.82 % 6.82 %
Rate of compensation increase
Pension - PPL (U.S.) 3.95 % 3.93 % Pension - PPL (U.K.) 3.50 % 4.00 % Pension - LKE 3.50 % 3.50 % Other Postretirement - PPL 3.92 % 3.91 % Other Postretirement - LKE 3.50 % 3.50 %
(a) WPD began using individual spot rates from the yield curve used to discount the benefit obligation to measure service cost and interest cost for the
calculation of net periodic defined benefit cost in 2016. PPL's U.S. plans use a single discount rate derived from an individual bond matching model to measure the benefit obligation, service cost and interest cost. See Note 1 to the Financial Statements for additional details.
In selecting health care cost trend rates, plan sponsors consider past performance and forecasts of health care costs. At December 31, 2016, the health care cost trend rate for all plans was 7.0% for 2017, gradually declining to an ultimate trend rate of 5.0% in 2022.
A variance in the assumptions listed above could have a significant impact on accrued defined benefit liabilities or assets, reported annual net periodic defined benefit costs and AOCI or regulatory assets and liabilities. At December 31, 2016, the defined benefit plans were recorded in the Registrants' financial statements as follows.
PPL PPL Electric LKE LG&E KU Balance Sheet:
Regulatory assets (a) $ 947 $ 549 $ 398 $ 246 $ 152 Regulatory liabilities 23 23 23 Pension liabilities 1,008 281 354 53 62 Other postretirement and postemployment benefit liabilities 213
72
122
76
40
AOCI (pre-tax) 2,930 119 Statement of Income:
Defined benefits expense $ (35 ) $ 11 $ 30 $ 11 $ 7 Increase (decrease) from prior year (93 ) (4 ) (8) (1 ) (3 )
(a) As a result of the 2014 Kentucky rate case settlement that became effective July 1, 2015, the difference between pension cost calculated in accordance
with LG&E's and KU's pension accounting policy and pension cost calculated using a 15 year amortization period for actuarial gains and losses is recorded as a regulatory asset. As of December 31, 2016, the balances were $20 million for PPL and LKE, $11 million for LG&E and $9 million for KU. See Note 6 to the Financial Statements for additional information.

63
The following tables reflect changes in certain assumptions based on the Registrants' primary defined benefit plans. The tables reflect either an increase or decrease in each assumption. The inverse of this change would impact the accrued defined benefit liabilities or assets, reported annual net periodic defined benefit costs and AOCI or regulatory assets and liabilities by a similar amount in the opposite direction. The sensitivities below reflect an evaluation of the change based solely on a change in that assumption.
Actuarial assumption Discount Rate (0.25 %) Expected Return on Plan Assets (0.25 %) Rate of Compensation Increase 0.25 % Health Care Cost Trend Rate (a) 1 %
(a) Only impacts other postretirement benefits.
Increase (Decrease) (Increase)
Decrease Increase (Decrease) Increase
(Decrease)
Actuarial assumption Defined Benefit
Liabilities AOCI (pre-tax) Net Regulatory
Assets Defined Benefit Costs
PPL Discount rate $ 460 $ 361 $ 99 $ 33 Expected return on plan assets n/a n/a n/a 26 Rate of compensation increase 63 52 11 9 Health care cost trend rate (a) 5 1 4 —
PPL Electric
Discount rate 60 — 60 4 Expected return on plan assets n/a — n/a 4 Rate of compensation increase 7 — 7 1 Health care cost trend rate (a) 1 — 1 —
LKE
Discount rates 64 25 39 5 Expected return on plan assets n/a n/a n/a 3 Rate of compensation increase 8 4 4 1 Health care cost trend rate (a) 4 1 3 —
LG&E
Discount rates 21 n/a 21 2 Expected return on plan assets n/a n/a n/a 1 Rate of compensation increase 2 n/a 2 — Health care cost trend rate (a) 1 n/a 1 —
KU
Discount rates 18 n/a 18 2 Expected return on plan assets n/a n/a n/a 1 Rate of compensation increase 2 n/a 2 — Health care cost trend rate (a) 2 n/a 2 —
(a) Only impacts other postretirement benefits. Goodwill Impairment (PPL, LKE, LG&E and KU) Goodwill is tested for impairment at the reporting unit level. PPL has determined its reporting units to be at the same level as its reportable segments. LKE, LG&E and KU are individually single operating and reportable segments. A goodwill impairment test is performed annually or more frequently if events or changes in circumstances indicate that the carrying amount of the reporting unit may be greater than the reporting unit's fair value. Additionally, goodwill is tested for impairment after a portion of goodwill has been allocated to a business to be disposed of.

64
PPL, LKE, LG&E and KU may elect either to initially make a qualitative evaluation about the likelihood of an impairment of goodwill or to bypass the qualitative evaluation and test goodwill for impairment using a two-step quantitative test. If the qualitative evaluation (referred to as "step zero") is elected and the assessment results in a determination that it is not more likely than not that the fair value of a reporting unit is less than the carrying amount, the two-step quantitative impairment test is not necessary. When the two-step quantitative impairment test is elected or required as a result of the step zero assessment, in step one, PPL, LKE, LG&E and KU determine whether a potential impairment exists by comparing the estimated fair value of a reporting unit with its carrying amount, including goodwill, on the measurement date. If the estimated fair value exceeds its carrying amount, goodwill is not considered impaired. If the carrying amount exceeds the estimated fair value, the second step is performed to measure the amount of impairment loss, if any. The second step of the quantitative test requires a calculation of the implied fair value of goodwill, which is determined in the same manner as the amount of goodwill in a business combination. That is, the estimated fair value of a reporting unit is allocated to all of the assets and liabilities of that reporting unit as if the reporting unit had been acquired in a business combination and the estimated fair value of the reporting unit was the price paid to acquire the reporting unit. The excess of the estimated fair value of a reporting unit over the amounts assigned to its assets and liabilities is the implied fair value of goodwill. The implied fair value of the reporting unit's goodwill is then compared with the carrying amount of that goodwill. If the carrying amount exceeds the implied fair value, an impairment loss is recognized in an amount equal to that excess. The loss recognized cannot exceed the carrying amount of the reporting unit's goodwill. PPL's goodwill was $3.1 billion at December 31, 2016, which consists of $2.4 billion related to the acquisition of WPD and $662 million related to the acquisition of LKE. PPL (for its U.K. Regulated and Kentucky Regulated segments), and individually, LKE, LG&E and KU elected to perform the qualitative step zero evaluation of goodwill in the fourth quarter of 2016. These evaluations considered the excess of fair value over the carrying value of each reporting unit that was calculated during step one of the quantitative impairment tests performed in the fourth quarter of 2015, and the relevant events and circumstances that occurred since those tests were performed including: • current year financial performance versus the prior year, • changes in planned capital expenditures, • the consistency of forecasted free cash flows, • earnings quality and sustainability, • changes in market participant discount rates, • changes in long-term growth rates, • changes in PPL's market capitalization, and • the overall economic and regulatory environments in which these regulated entities operate. Based on these evaluations, management concluded it was not more likely than not that the fair value of these reporting units was less than their carrying values. As such, the two-step quantitative impairment test was not performed. Asset Retirement Obligations (PPL, LKE, LG&E and KU) ARO liabilities are required to be recognized for legal obligations associated with the retirement of long-lived assets. The initial obligation is measured at its estimated fair value. An ARO must be recognized when incurred if the fair value of the ARO can be reasonably estimated. An equivalent amount is recorded as an increase in the value of the capitalized asset and amortized to expense over the useful life of the asset. For LKE, LG&E and KU, all ARO accretion and depreciation expenses are reclassified as a regulatory asset. ARO regulatory assets associated with approved ECR projects for CCRs are amortized to expense over a period of 10 to 25 years based on retirement expenditures made related to the obligation. For other AROs, at the time of retirement, the related ARO regulatory asset is offset against the associated cost of removal regulatory liability, PP&E and ARO liability.
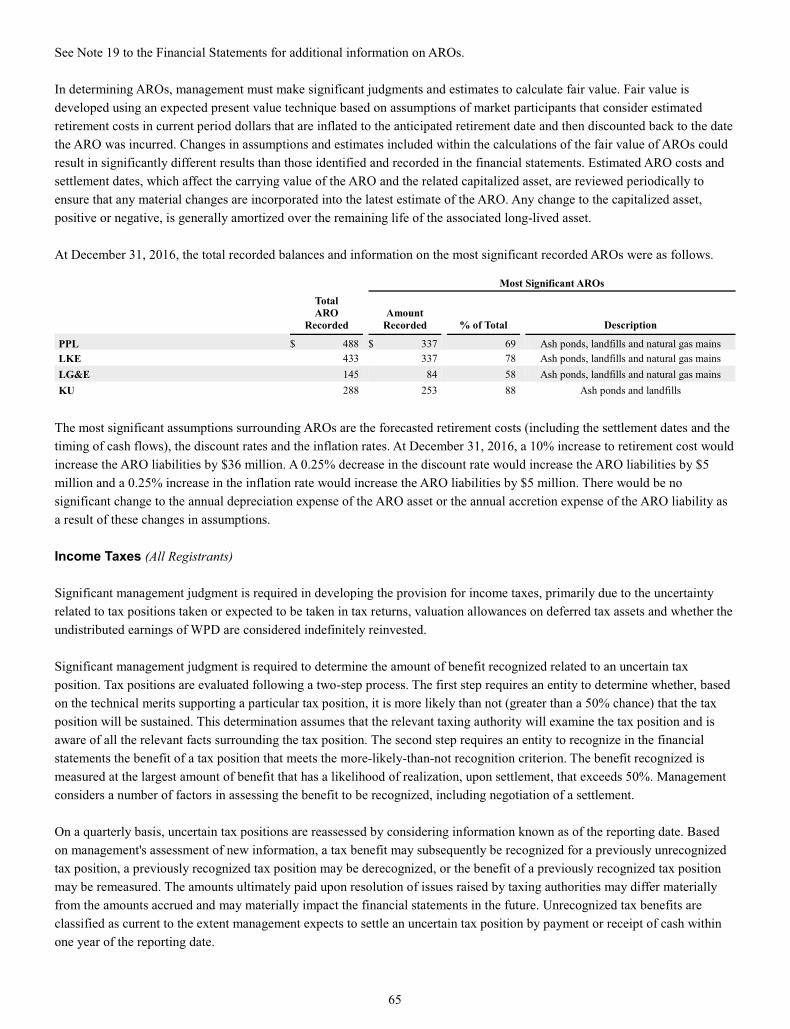
65
See Note 19 to the Financial Statements for additional information on AROs. In determining AROs, management must make significant judgments and estimates to calculate fair value. Fair value is developed using an expected present value technique based on assumptions of market participants that consider estimated retirement costs in current period dollars that are inflated to the anticipated retirement date and then discounted back to the date the ARO was incurred. Changes in assumptions and estimates included within the calculations of the fair value of AROs could result in significantly different results than those identified and recorded in the financial statements. Estimated ARO costs and settlement dates, which affect the carrying value of the ARO and the related capitalized asset, are reviewed periodically to ensure that any material changes are incorporated into the latest estimate of the ARO. Any change to the capitalized asset, positive or negative, is generally amortized over the remaining life of the associated long-lived asset. At December 31, 2016, the total recorded balances and information on the most significant recorded AROs were as follows.
Most Significant AROs
Total ARO
Recorded Amount
Recorded % of Total Description
PPL $ 488 $ 337 69 Ash ponds, landfills and natural gas mains LKE 433 337 78 Ash ponds, landfills and natural gas mains LG&E 145 84 58 Ash ponds, landfills and natural gas mains KU 288 253 88 Ash ponds and landfills
The most significant assumptions surrounding AROs are the forecasted retirement costs (including the settlement dates and the timing of cash flows), the discount rates and the inflation rates. At December 31, 2016, a 10% increase to retirement cost would increase the ARO liabilities by $36 million. A 0.25% decrease in the discount rate would increase the ARO liabilities by $5 million and a 0.25% increase in the inflation rate would increase the ARO liabilities by $5 million. There would be no significant change to the annual depreciation expense of the ARO asset or the annual accretion expense of the ARO liability as a result of these changes in assumptions. Income Taxes (All Registrants) Significant management judgment is required in developing the provision for income taxes, primarily due to the uncertainty related to tax positions taken or expected to be taken in tax returns, valuation allowances on deferred tax assets and whether the undistributed earnings of WPD are considered indefinitely reinvested. Significant management judgment is required to determine the amount of benefit recognized related to an uncertain tax position. Tax positions are evaluated following a two-step process. The first step requires an entity to determine whether, based on the technical merits supporting a particular tax position, it is more likely than not (greater than a 50% chance) that the tax position will be sustained. This determination assumes that the relevant taxing authority will examine the tax position and is aware of all the relevant facts surrounding the tax position. The second step requires an entity to recognize in the financial statements the benefit of a tax position that meets the more-likely-than-not recognition criterion. The benefit recognized is measured at the largest amount of benefit that has a likelihood of realization, upon settlement, that exceeds 50%. Management considers a number of factors in assessing the benefit to be recognized, including negotiation of a settlement. On a quarterly basis, uncertain tax positions are reassessed by considering information known as of the reporting date. Based on management's assessment of new information, a tax benefit may subsequently be recognized for a previously unrecognized tax position, a previously recognized tax position may be derecognized, or the benefit of a previously recognized tax position may be remeasured. The amounts ultimately paid upon resolution of issues raised by taxing authorities may differ materially from the amounts accrued and may materially impact the financial statements in the future. Unrecognized tax benefits are classified as current to the extent management expects to settle an uncertain tax position by payment or receipt of cash within one year of the reporting date.

66
At December 31, 2016, no significant changes in unrecognized tax benefits are projected over the next 12 months. The need for valuation allowances to reduce deferred tax assets also requires significant management judgment. Valuation allowances are initially recorded and reevaluated each reporting period by assessing the likelihood of the ultimate realization of a deferred tax asset. Management considers a number of factors in assessing the realization of a deferred tax asset, including the reversal of temporary differences, future taxable income and ongoing prudent and feasible tax planning strategies. Any tax planning strategy utilized in this assessment must meet the recognition and measurement criteria utilized to account for an uncertain tax position. Management also considers the uncertainty posed by political risk and the effect of this uncertainty on the various factors that management takes into account in evaluating the need for valuation allowances. The amount of deferred tax assets ultimately realized may differ materially from the estimates utilized in the computation of valuation allowances and may materially impact the financial statements in the future. See Note 5 to the Financial Statements for income tax disclosures, including management's conclusion that the undistributed earnings of WPD are considered indefinitely reinvested. Based on this conclusion, PPL Global does not record U.S. income taxes on WPD's undistributed earnings. Regulatory Assets and Liabilities (PPL) WPD operates in an incentive-based regulatory structure under distribution licenses granted by Ofgem. As the regulatory model is incentive-based rather than a cost recovery model, WPD is not subject to accounting for the effects of certain types of regulation as prescribed by GAAP for entities subject to cost-based rate regulation. Therefore, the accounting treatment of adjustments to base demand revenue and/or allowed revenue is evaluated based on revenue recognition and contingency guidance. See Note 1 to the Financial Statements for additional information. (All Registrants) PPL Electric, LG&E and KU, are subject to cost-based rate regulation. As a result, the effects of regulatory actions are required to be reflected in the financial statements. Assets and liabilities are recorded that result from the regulated ratemaking process that may not be recorded under GAAP for non-regulated entities. Regulatory assets generally represent incurred costs that have been deferred because such costs are probable of future recovery in regulated customer rates. Regulatory liabilities are recognized for amounts expected to be returned through future regulated customer rates. In certain cases, regulatory liabilities are recorded based on an understanding or agreement with the regulator that rates have been set to recover costs that are expected to be incurred in the future, and the regulated entity is accountable for any amounts charged pursuant to such rates and not yet expended for the intended purpose. Management continually assesses whether the regulatory assets are probable of future recovery by considering factors such as changes in the applicable regulatory and political environments, the ability to recover costs through regulated rates, recent rate orders to other regulated entities, and the status of any pending or potential deregulation legislation. Based on this continual assessment, management believes the existing regulatory assets are probable of recovery. This assessment reflects the current political and regulatory climate at the state and federal levels, and is subject to change in the future. If future recovery of costs ceases to be probable, the regulatory asset would be written-off. Additionally, the regulatory agencies can provide flexibility in the manner and timing of recovery of regulatory assets. At December 31, 2016, regulatory assets and regulatory liabilities were recorded as reflected in the table below. All regulatory assets are either currently being recovered under specific rate orders, represent amounts that are expected to be recovered in future rates or benefit future periods based upon established regulatory practices.
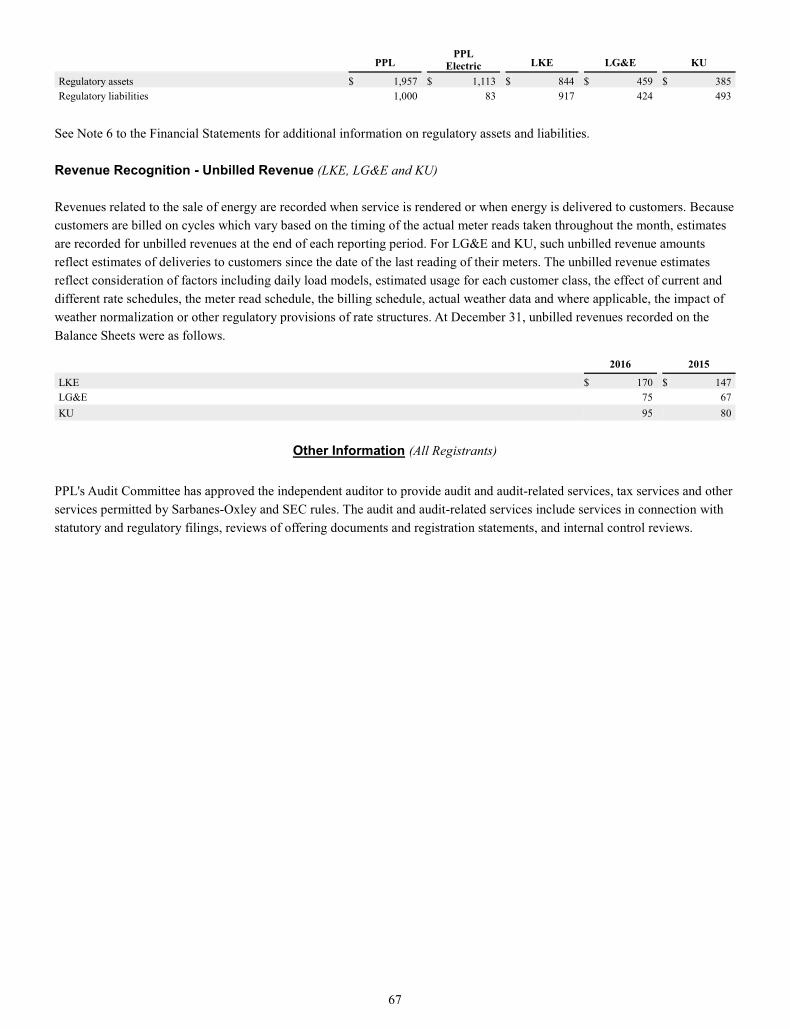
67
PPL PPL Electric LKE LG&E KU
Regulatory assets $ 1,957 $ 1,113 $ 844 $ 459 $ 385 Regulatory liabilities 1,000 83 917 424 493
See Note 6 to the Financial Statements for additional information on regulatory assets and liabilities. Revenue Recognition - Unbilled Revenue (LKE, LG&E and KU) Revenues related to the sale of energy are recorded when service is rendered or when energy is delivered to customers. Because customers are billed on cycles which vary based on the timing of the actual meter reads taken throughout the month, estimates are recorded for unbilled revenues at the end of each reporting period. For LG&E and KU, such unbilled revenue amounts reflect estimates of deliveries to customers since the date of the last reading of their meters. The unbilled revenue estimates reflect consideration of factors including daily load models, estimated usage for each customer class, the effect of current and different rate schedules, the meter read schedule, the billing schedule, actual weather data and where applicable, the impact of weather normalization or other regulatory provisions of rate structures. At December 31, unbilled revenues recorded on the Balance Sheets were as follows.
2016 2015
LKE $ 170 $ 147 LG&E 75 67 KU 95 80
Other Information (All Registrants)
PPL's Audit Committee has approved the independent auditor to provide audit and audit-related services, tax services and other services permitted by Sarbanes-Oxley and SEC rules. The audit and audit-related services include services in connection with statutory and regulatory filings, reviews of offering documents and registration statements, and internal control reviews.

68
REPORT OF INDEPENDENT REGISTERED PUBLIC ACCOUNTING FIRM
To the Board of Directors and Shareowners of PPL Corporation We have audited the accompanying consolidated balance sheet of PPL Corporation and subsidiaries (the "Company") as of December 31, 2016, and the related consolidated statements of income, comprehensive income, equity, and cash flows for the year then ended. These financial statements are the responsibility of the Company's management. Our responsibility is
to express an opinion on the financial statements based on our audit.
We conducted our audit in accordance with the standards of the Public Company Accounting Oversight Board (United States). Those standards require that we plan and perform the audit to obtain reasonable assurance about whether the financial statements are free of material misstatement. An audit includes examining, on a test basis, evidence supporting the amounts and disclosures in the financial statements. An audit also includes assessing the accounting principles used and significant estimates made by management, as well as evaluating the overall financial statement presentation. We believe that our audit provides a reasonable basis for our opinion. In our opinion, such consolidated financial statements present fairly, in all material respects, the financial position of PPL Corporation and subsidiaries as of December 31, 2016, and the results of their operations and their cash flows for the year then ended, in conformity with accounting principles generally accepted in the United States of America. We have also audited, in accordance with the standards of the Public Company Accounting Oversight Board (United States), the Company's internal control over financial reporting as of December 31, 2016, based on the criteria established in Internal Control-Integrated Framework (2013) issued by the Committee of Sponsoring Organizations of the Treadway Commission and our report dated February 17, 2017 expressed an unqualified opinion on the Company's internal control over financial reporting.
Parsippany, NJ February 17, 2017

69
REPORT OF INDEPENDENT REGISTERED PUBLIC ACCOUNTING FIRM To the Board of Directors and Shareowners of PPL Corporation We have audited the internal control over financial reporting of PPL Corporation and subsidiaries (the "Company") as of December 31, 2016, based on criteria established in Internal Control-Integrated Framework (2013) issued by the Committee of Sponsoring Organizations of the Treadway Commission. The Company's management is responsible for maintaining effective internal control over financial reporting and for its assessment of the effectiveness of internal control over financial reporting, included in Management’s Report on Internal Control over Financial Reporting at Item 9A. Our responsibility is to express an opinion on the Company's internal control over financial reporting based on our audit. We conducted our audit in accordance with the standards of the Public Company Accounting Oversight Board (United States). Those standards require that we plan and perform the audit to obtain reasonable assurance about whether effective internal control over financial reporting was maintained in all material respects. Our audit included obtaining an understanding of internal control over financial reporting, assessing the risk that a material weakness exists, testing and evaluating the design and operating effectiveness of internal control based on the assessed risk, and performing such other procedures as we considered necessary in the circumstances. We believe that our audit provides a reasonable basis for our opinion. A company's internal control over financial reporting is a process designed by, or under the supervision of, the company's principal executive and principal financial officers, or persons performing similar functions, and effected by the company's board of directors, management, and other personnel to provide reasonable assurance regarding the reliability of financial reporting and the preparation of financial statements for external purposes in accordance with generally accepted accounting principles. A company's internal control over financial reporting includes those policies and procedures that (1) pertain to the maintenance of records that, in reasonable detail, accurately and fairly reflect the transactions and dispositions of the assets of the company; (2) provide reasonable assurance that transactions are recorded as necessary to permit preparation of financial statements in accordance with generally accepted accounting principles, and that receipts and expenditures of the company are being made only in accordance with authorizations of management and directors of the company; and (3) provide reasonable assurance regarding prevention or timely detection of unauthorized acquisition, use, or disposition of the company's assets that could have a material effect on the financial statements. Because of the inherent limitations of internal control over financial reporting, including the possibility of collusion or improper management override of controls, material misstatements due to error or fraud may not be prevented or detected on a timely basis. Also, projections of any evaluation of the effectiveness of the internal control over financial reporting to future periods are subject to the risk that the controls may become inadequate because of changes in conditions, or that the degree of compliance with the policies or procedures may deteriorate. In our opinion, the Company maintained, in all material respects, effective internal control over financial reporting as of December 31, 2016, based on the criteria established in Internal Control - Integrated Framework (2013) issued by the Committee of Sponsoring Organizations of the Treadway Commission. We have also audited, in accordance with the standards of the Public Company Accounting Oversight Board (United States), the consolidated financial statements and financial statement schedule as of and for the year ended December 31, 2016 of the Company, and our report dated February 17, 2017, expressed an unqualified opinion on those financial statements and financial statement schedule.
Parsippany, NJ February 17, 2017
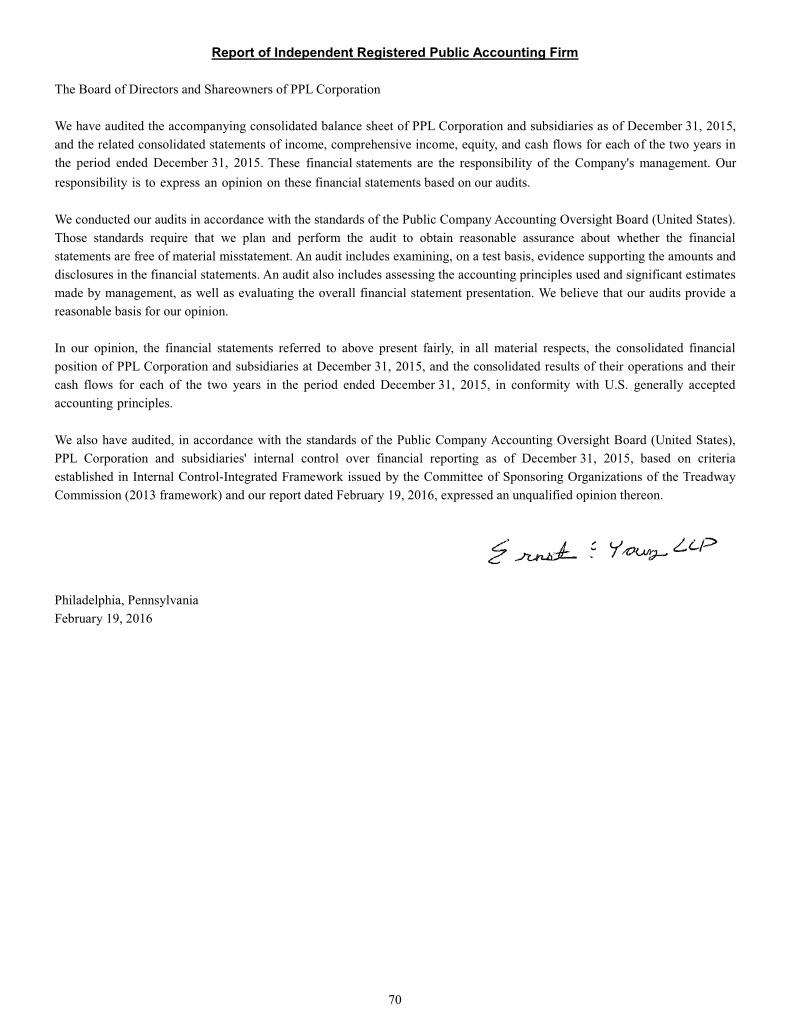
70
Report of Independent Registered Public Accounting Firm
We have audited the accompanying consolidated balance sheet of PPL Corporation and subsidiaries as of December 31, 2015, and the related consolidated statements of income, comprehensive income, equity, and cash flows for each of the two years in the period ended December 31, 2015. These financial statements are the responsibility of the Company's management. Our
responsibility is to express an opinion on these financial statements based on our audits.
We conducted our audits in accordance with the standards of the Public Company Accounting Oversight Board (United States). Those standards require that we plan and perform the audit to obtain reasonable assurance about whether the financial statements are free of material misstatement. An audit includes examining, on a test basis, evidence supporting the amounts and disclosures in the financial statements. An audit also includes assessing the accounting principles used and significant estimates made by management, as well as evaluating the overall financial statement presentation. We believe that our audits provide a reasonable basis for our opinion. In our opinion, the financial statements referred to above present fairly, in all material respects, the consolidated financial position of PPL Corporation and subsidiaries at December 31, 2015, and the consolidated results of their operations and their cash flows for each of the two years in the period ended December 31, 2015, in conformity with U.S. generally accepted accounting principles. We also have audited, in accordance with the standards of the Public Company Accounting Oversight Board (United States), PPL Corporation and subsidiaries' internal control over financial reporting as of December 31, 2015, based on criteria established in Internal Control-Integrated Framework issued by the Committee of Sponsoring Organizations of the Treadway Commission (2013 framework) and our report dated February 19, 2016, expressed an unqualified opinion thereon.
Philadelphia, Pennsylvania February 19, 2016
The Board of Directors and Shareowners of PPL Corporation
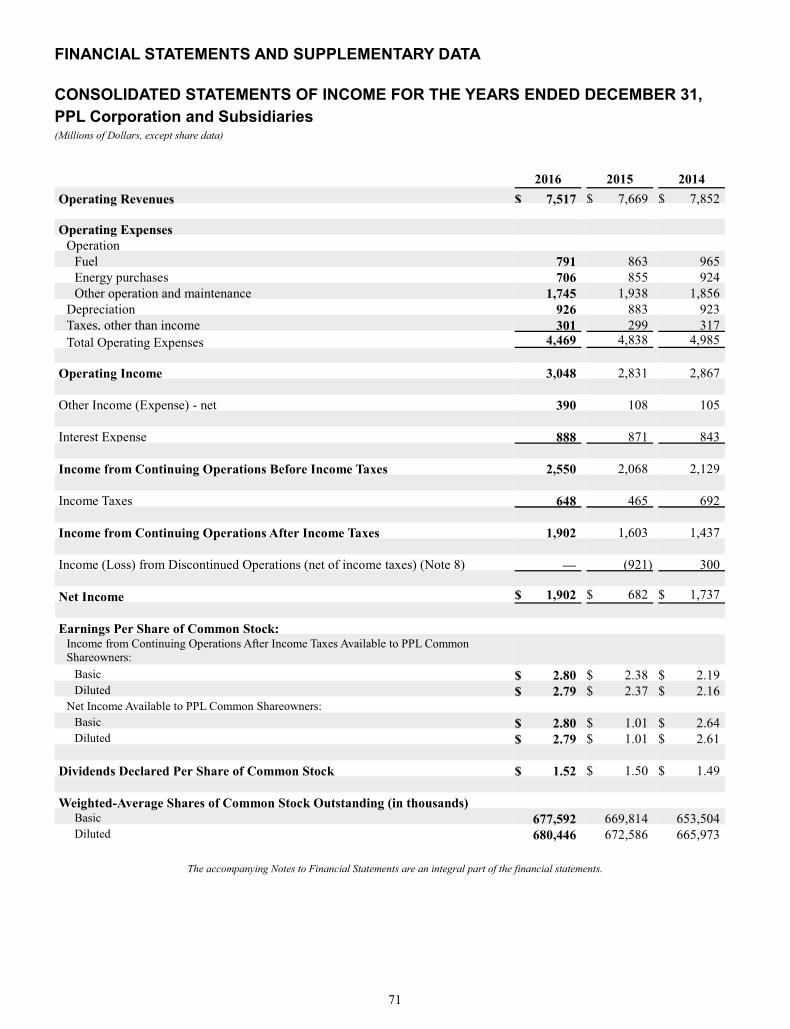
71
FINANCIAL STATEMENTS AND SUPPLEMENTARY DATA
CONSOLIDATED STATEMENTS OF INCOME FOR THE YEARS ENDED DECEMBER 31, PPL Corporation and Subsidiaries (Millions of Dollars, except share data)
2016 2015 2014 Operating Revenues $ 7,517 $ 7,669 $ 7,852 Operating Expenses
Operation Fuel 791 863 965 Energy purchases 706 855 924 Other operation and maintenance 1,745 1,938 1,856
Depreciation 926 883 923 Taxes, other than income 301 299 317 Total Operating Expenses 4,469 4,838 4,985
Operating Income 3,048 2,831 2,867 Other Income (Expense) - net 390 108 105 Interest Expense 888 871 843 Income from Continuing Operations Before Income Taxes 2,550 2,068 2,129 Income Taxes 648 465 692 Income from Continuing Operations After Income Taxes 1,902 1,603 1,437 Income (Loss) from Discontinued Operations (net of income taxes) (Note 8) — (921 ) 300 Net Income $ 1,902 $ 682 $ 1,737
Earnings Per Share of Common Stock: Income from Continuing Operations After Income Taxes Available to PPL Common Shareowners:
Basic $ 2.80 $ 2.38 $ 2.19 Diluted $ 2.79 $ 2.37 $ 2.16
Net Income Available to PPL Common Shareowners: Basic $ 2.80 $ 1.01 $ 2.64 Diluted $ 2.79 $ 1.01 $ 2.61
Dividends Declared Per Share of Common Stock $ 1.52 $ 1.50 $ 1.49 Weighted-Average Shares of Common Stock Outstanding (in thousands)
Basic 677,592 669,814 653,504 Diluted 680,446 672,586 665,973
The accompanying Notes to Financial Statements are an integral part of the financial statements.

72
CONSOLIDATED STATEMENTS OF COMPREHENSIVE INCOME FOR THE YEARS ENDED DECEMBER 31, PPL Corporation and Subsidiaries (Millions of Dollars)
2016 2015 2014 Net income $ 1,902 $ 682 $ 1,737 Other comprehensive income (loss): Amounts arising during the period - gains (losses), net of tax (expense) benefit:
Foreign currency translation adjustments, net of tax of ($4), $1, ($8) (1,107 ) (234 ) (275) Available-for-sale securities, net of tax of $0, ($9), ($39) — 8 35 Qualifying derivatives, net of tax of ($18), $0, $23 91 26 (10) Defined benefit plans:
Prior service costs, net of tax of $2, $6, ($4) (3 ) (9 ) 5 Net actuarial gain (loss), net of tax of $40, $67, $225 (61 ) (366 ) (509)
Reclassifications to net income - (gains) losses, net of tax expense (benefit): Available-for-sale securities, net of tax of $0, $2, $7 — (2 ) (6) Qualifying derivatives, net of tax of $21, ($15), $23 (91 ) 2 (64) Equity investees' other comprehensive (income) loss, net of tax of $0, $0, $0 (1 ) (1 ) — Defined benefit plans:
Prior service costs, net of tax of ($1), $0, ($3) 1 — 4 Net actuarial (gain) loss, net of tax of ($35), ($46), ($34) 121 146 111
Total other comprehensive income (loss) (1,050 ) (430 ) (709) Comprehensive income $ 852 $ 252 $ 1,028
The accompanying Notes to Financial Statements are an integral part of the financial statements.
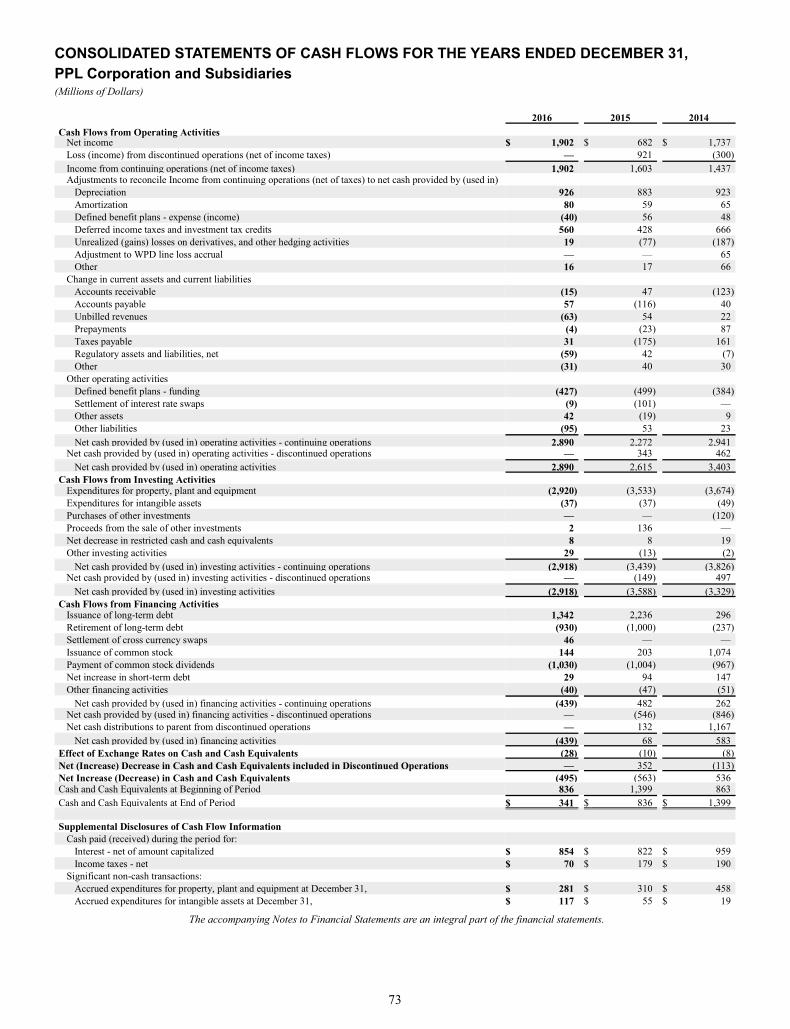
73
CONSOLIDATED STATEMENTS OF CASH FLOWS FOR THE YEARS ENDED DECEMBER 31, PPL Corporation and Subsidiaries (Millions of Dollars)
2016 2015 2014 Cash Flows from Operating Activities
Net income $ 1,902 $ 682 $ 1,737 Loss (income) from discontinued operations (net of income taxes) — 921 (300 ) Income from continuing operations (net of income taxes) 1,902 1,603 1,437 Adjustments to reconcile Income from continuing operations (net of taxes) to net cash provided by (used in)
Depreciation 926 883 923 Amortization 80 59 65 Defined benefit plans - expense (income) (40 ) 56 48 Deferred income taxes and investment tax credits 560 428 666 Unrealized (gains) losses on derivatives, and other hedging activities 19 (77 ) (187 ) Adjustment to WPD line loss accrual — — 65 Other 16 17 66
Change in current assets and current liabilities Accounts receivable (15 ) 47 (123 ) Accounts payable 57 (116 ) 40 Unbilled revenues (63 ) 54 22 Prepayments (4 ) (23 ) 87 Taxes payable 31 (175 ) 161 Regulatory assets and liabilities, net (59 ) 42 (7 ) Other (31 ) 40 30
Other operating activities Defined benefit plans - funding (427 ) (499 ) (384 ) Settlement of interest rate swaps (9 ) (101 ) — Other assets 42 (19 ) 9 Other liabilities (95 ) 53 23 Net cash provided by (used in) operating activities - continuing operations 2,890 2,272 2,941
Net cash provided by (used in) operating activities - discontinued operations — 343 462 Net cash provided by (used in) operating activities 2,890 2,615 3,403
Cash Flows from Investing Activities Expenditures for property, plant and equipment (2,920 ) (3,533 ) (3,674 ) Expenditures for intangible assets (37 ) (37 ) (49 ) Purchases of other investments — — (120 ) Proceeds from the sale of other investments 2 136 — Net decrease in restricted cash and cash equivalents 8 8 19 Other investing activities 29 (13 ) (2 )
Net cash provided by (used in) investing activities - continuing operations (2,918 ) (3,439 ) (3,826 ) Net cash provided by (used in) investing activities - discontinued operations — (149 ) 497
Net cash provided by (used in) investing activities (2,918 ) (3,588 ) (3,329 ) Cash Flows from Financing Activities
Issuance of long-term debt 1,342 2,236 296 Retirement of long-term debt (930 ) (1,000 ) (237 ) Settlement of cross currency swaps 46 — — Issuance of common stock 144 203 1,074 Payment of common stock dividends (1,030 ) (1,004 ) (967 ) Net increase in short-term debt 29 94 147 Other financing activities (40 ) (47 ) (51 )
Net cash provided by (used in) financing activities - continuing operations (439 ) 482 262 Net cash provided by (used in) financing activities - discontinued operations — (546 ) (846 ) Net cash distributions to parent from discontinued operations — 132 1,167
Net cash provided by (used in) financing activities (439 ) 68 583 Effect of Exchange Rates on Cash and Cash Equivalents (28 ) (10 ) (8 ) Net (Increase) Decrease in Cash and Cash Equivalents included in Discontinued Operations — 352 (113 ) Net Increase (Decrease) in Cash and Cash Equivalents (495 ) (563 ) 536 Cash and Cash Equivalents at Beginning of Period 836 1,399 863 Cash and Cash Equivalents at End of Period $ 341 $ 836 $ 1,399
Supplemental Disclosures of Cash Flow Information Cash paid (received) during the period for:
Interest - net of amount capitalized $ 854 $ 822 $ 959 Income taxes - net $ 70 $ 179 $ 190
Significant non-cash transactions: Accrued expenditures for property, plant and equipment at December 31, $ 281 $ 310 $ 458 Accrued expenditures for intangible assets at December 31, $ 117 $ 55 $ 19
The accompanying Notes to Financial Statements are an integral part of the financial statements.

74
CONSOLIDATED BALANCE SHEETS AT DECEMBER 31, PPL Corporation and Subsidiaries (Millions of Dollars, shares in thousands)
2016 2015
Assets Current Assets
Cash and cash equivalents $ 341 $ 836
Accounts receivable (less reserve: 2016, $54; 2015, $41) Customer 666 673
Other 46 59
Unbilled revenues 480 453
Fuel, materials and supplies 356 357
Prepayments 63 66
Price risk management assets 63 139
Other current assets 52 63
Total Current Assets 2,067 2,646
Property, Plant and Equipment
Regulated utility plant 34,674 34,399
Less: accumulated depreciation - regulated utility plant 6,013 5,683
Regulated utility plant, net 28,661 28,716
Non-regulated property, plant and equipment 413 516 Less: accumulated depreciation - non-regulated property, plant and equipment 134 165
Non-regulated property, plant and equipment, net 279 351 Construction work in progress 1,134 1,315
Property, Plant and Equipment, net 30,074 30,382
Other Noncurrent Assets
Regulatory assets 1,918 1,733
Goodwill 3,060 3,550
Other intangibles 700 679
Price risk management assets 336 156 Other noncurrent assets 160 155
Total Other Noncurrent Assets 6,174 6,273
Total Assets $ 38,315 $ 39,301
The accompanying Notes to Financial Statements are an integral part of the financial statements.

75
CONSOLIDATED BALANCE SHEETS AT DECEMBER 31, PPL Corporation and Subsidiaries (Millions of Dollars, shares in thousands)
2016 2015
Liabilities and Equity Current Liabilities
Short-term debt $ 923 $ 916 Long-term debt due within one year 518 485 Accounts payable 820 812 Taxes 101 85 Interest 270 303 Dividends 259 255 Customer deposits 276 326 Regulatory liabilities 101 145 Other current liabilities 569 549 Total Current Liabilities 3,837 3,876
Long-term Debt 17,808 18,563 Deferred Credits and Other Noncurrent Liabilities
Deferred income taxes 3,889 3,440 Investment tax credits 132 128 Accrued pension obligations 1,001 1,405 Asset retirement obligations 428 536 Regulatory liabilities 899 945 Other deferred credits and noncurrent liabilities 422 489 Total Deferred Credits and Other Noncurrent Liabilities 6,771 6,943
Commitments and Contingent Liabilities (Notes 5, 6 and 13) Equity
Common stock - $0.01 par value (a) 7 7 Additional paid-in capital 9,841 9,687 Earnings reinvested 3,829 2,953 Accumulated other comprehensive loss (3,778 ) (2,728 ) Total Equity 9,899 9,919
Total Liabilities and Equity $ 38,315 $ 39,301
(a) 1,560,000 shares authorized; 679,731 shares issued and outstanding at December 31, 2016; 780,000 shares authorized; 673,857 shares issued and
outstanding at December 31, 2015.
The accompanying Notes to Financial Statements are an integral part of the financial statements.

76
CONSOLIDATED STATEMENTS OF EQUITY PPL Corporation and Subsidiaries (Millions of Dollars)
PPL Shareowners
Common stock shares outstanding
(a) Common
stock
Additional paid-in capital
Earnings reinvested
Accumulated other
comprehensive loss Total
December 31, 2013 630,321 $ 6 $ 8,316 $ 5,709 $ (1,565 ) $ 12,466 Common stock issued 35,528 1 1,089 1,090
Stock-based compensation 28 28
Net income 1,737 1,737
Dividends and dividend equivalents (984 ) (984 ) Other comprehensive income (loss) (709 ) (709 ) December 31, 2014 665,849 $ 7 $ 9,433 $ 6,462 $ (2,274 ) $ 13,628
Common stock issued 8,008 249 249
Stock-based compensation 5 5
Net income 682 682
Dividends and dividend equivalents (1,010 ) (1,010 ) Distribution of PPL Energy Supply (Note 8) (3,181 ) (24 ) (3,205 ) Other comprehensive income (loss) (430 ) (430 ) December 31, 2015 673,857 $ 7 $ 9,687 $ 2,953 $ (2,728 ) $ 9,919
Common stock issued 5,874 185 185
Stock-based compensation (31 ) (31 ) Net income 1,902 1,902
Dividends and dividend equivalents (1,033 ) (1,033 ) Other comprehensive income (loss) (1,050 ) (1,050 ) Adoption of stock-based compensation guidance cumulative effect adjustment (Note 1) 7
7
December 31, 2016 679,731 $ 7 $ 9,841 $ 3,829 $ (3,778 ) $ 9,899
(a) Shares in thousands. Each share entitles the holder to one vote on any question presented at any shareowners' meeting.
The accompanying Notes to Financial Statements are an integral part of the financial statements.

77
COMBINED NOTES TO FINANCIAL STATEMENTS
1. Summary of Significant Accounting Policies (All Registrants) General Capitalized terms and abbreviations appearing in the combined notes to financial statements are defined in the glossary. Dollars are in millions, except per share data, unless otherwise noted. The specific Registrant to which disclosures are applicable is identified in parenthetical headings in italics above the applicable disclosure or within the applicable disclosure for each Registrants' related activities and disclosures. Within combined disclosures, amounts are disclosed for any Registrant when significant. Business and Consolidation (PPL) PPL is a utility holding company that, through its regulated subsidiaries, is primarily engaged in: 1) the distribution of electricity in the U.K.; 2) the generation, transmission, distribution and sale of electricity and the distribution and sale of natural gas, primarily in Kentucky; and 3) the transmission, distribution and sale of electricity in Pennsylvania. Headquartered in Allentown, PA, PPL's principal subsidiaries are PPL Global, LKE (including its principal subsidiaries, LG&E and KU) and PPL Electric. PPL's corporate level financing subsidiary is PPL Capital Funding. WPD, a subsidiary of PPL Global, through indirect, wholly owned subsidiaries, operates distribution networks providing electricity service in the U.K. WPD serves end-users in South Wales and southwest and central England. Its principal subsidiaries are WPD (South Wales), WPD (South West), WPD (East Midlands) and WPD (West Midlands). PPL consolidates WPD on a one-month lag. Material events, such as debt issuances that occur in the lag period, are recognized in the current period financial statements. Events that are significant but not material are disclosed. (PPL and PPL Electric) PPL Electric is a cost-based rate-regulated utility subsidiary of PPL. PPL Electric's principal business is the transmission and distribution of electricity to serve retail customers in its franchised territory in eastern and central Pennsylvania and the regulated supply of electricity to retail customers in that territory as a PLR. (PPL, LKE, LG&E and KU) LKE is a utility holding company with cost-based rate-regulated utility operations through its subsidiaries, LG&E and KU. LG&E and KU are engaged in the generation, transmission, distribution and sale of electricity. LG&E also engages in the distribution and sale of natural gas. LG&E and KU maintain their separate identities and serve customers in Kentucky under their respective names. KU also serves customers in Virginia (under the Old Dominion Power name) and in Tennessee under the KU name. (PPL) "Income (Loss) from Discontinued Operations (net of income taxes)" on the Statements of Income for the years 2015 and 2014 includes the activities of PPL Energy Supply, substantially representing PPL's former Supply segment, which was spun off and
78
distributed to PPL shareowners on June 1, 2015. In addition, the Statements of Cash Flows for the same periods separately report the cash flows of the discontinued operations. See Note 8 for additional information. (All Registrants) The financial statements of the Registrants include each company's own accounts as well as the accounts of all entities in which the company has a controlling financial interest. Entities for which a controlling financial interest is not demonstrated through voting interests are evaluated based on accounting guidance for Variable Interest Entities (VIEs). The Registrants consolidate a VIE when they are determined to have a controlling interest in the VIE, and thus are the primary beneficiary of the entity. The Registrants are not the primary beneficiary in any VIEs. Investments in entities in which a company has the ability to exercise significant influence but does not have a controlling financial interest are accounted for under the equity method. All other investments are carried at cost or fair value. All significant intercompany transactions have been eliminated. The financial statements of PPL, LKE, LG&E and KU include their share of any undivided interests in jointly owned facilities, as well as their share of the related operating costs of those facilities. See Note 12 for additional information. Regulation (PPL) WPD operates in an incentive-based regulatory structure under distribution licenses granted by Ofgem. Electricity distribution revenues are set by Ofgem for a given time period through price control reviews that are not directly based on cost recovery. The price control formula that governs WPD's allowed revenue is designed to provide economic incentives to minimize operating, capital and financing costs. As a result, WPD is not subject to accounting for the effects of certain types of regulation as prescribed by GAAP and does not record regulatory assets and liabilities. (All Registrants) PPL Electric, LG&E and KU are cost-based rate-regulated utilities for which rates are set by regulators to enable PPL Electric, LG&E and KU to recover the costs of providing electric or gas service, as applicable, and to provide a reasonable return to shareholders. Base rates are generally established based on a future test period. As a result, the financial statements are subject to the accounting for certain types of regulation as prescribed by GAAP and reflect the effects of regulatory actions. Regulatory assets are recognized for the effect of transactions or events where future recovery of underlying costs is probable in regulated customer rates. The effect of such accounting is to defer certain or qualifying costs that would otherwise currently be charged to expense. Regulatory liabilities are recognized for amounts expected to be returned through future regulated customer rates. In certain cases, regulatory liabilities are recorded based on an understanding or agreement with the regulator that rates have been set to recover costs that are expected to be incurred in the future, and the regulated entity is accountable for any amounts charged pursuant to such rates and not yet expended for the intended purpose. The accounting for regulatory assets and regulatory liabilities is based on specific ratemaking decisions or precedent for each transaction or event as prescribed by the FERC or the applicable state regulatory commissions. See Note 6 for additional details regarding regulatory matters. (All Registrants) Accounting Records The system of accounts for domestic regulated entities is maintained in accordance with the Uniform System of Accounts prescribed by the FERC and adopted by the applicable state regulatory commissions.

79
Use of Estimates The preparation of financial statements in conformity with GAAP requires management to make estimates and assumptions that affect the reported amounts of assets and liabilities, the disclosure of contingent liabilities at the date of the financial statements and the reported amounts of revenues and expenses during the reporting period. Actual results could differ from those estimates. Loss Accruals Potential losses are accrued when (1) information is available that indicates it is "probable" that a loss has been incurred, given the likelihood of the uncertain future events and (2) the amount of the loss can be reasonably estimated. Accounting guidance defines "probable" as cases in which "the future event or events are likely to occur." The Registrants continuously assess potential loss contingencies for environmental remediation, litigation claims, regulatory penalties and other events. Loss accruals for environmental remediation are discounted when appropriate. The accrual of contingencies that might result in gains is not recorded, unless realization is assured. Changes in Classification The classification of certain amounts in the 2015 and 2014 financial statements have been changed to conform to the current presentation. These reclassifications did not affect the Registrants' net income or equity. Earnings Per Share (PPL) EPS is computed using the two-class method, which is an earnings allocation method for computing EPS that treats a participating security as having rights to earnings that would otherwise have been available to common shareowners. Share-based payment awards that provide recipients a non-forfeitable right to dividends or dividend equivalents are considered participating securities. Price Risk Management (All Registrants) Interest rate contracts are used to hedge exposure to change in the fair value of debt instruments and to hedge exposures to variability in expected cash flows associated with existing floating-rate debt instruments or forecasted fixed-rate issuances of debt. Foreign currency exchange contracts are used to hedge foreign currency exposures, primarily associated with PPL's investments in U.K. subsidiaries. Similar derivatives may receive different accounting treatment, depending on management's intended use and documentation. Certain contracts may not meet the definition of a derivative because they lack a notional amount or a net settlement provision. In cases where there is no net settlement provision, markets are periodically assessed to determine whether market mechanisms have evolved that would facilitate net settlement. Certain derivative contracts may be excluded from the requirements of derivative accounting treatment because NPNS has been elected. These contracts are accounted for using accrual accounting. Contracts that have been classified as derivative contracts are reflected on the balance sheets at fair value. The portion of derivative positions that deliver within a year are included in "Current Assets" and "Current Liabilities," while the portion of derivative positions that deliver beyond a year are recorded in "Other Noncurrent Assets" and "Deferred Credits and Other Noncurrent Liabilities." See Note 17 for additional information. Cash inflows and outflows related to derivative instruments are included as a component of operating, investing or financing activities on the Statements of Cash Flows, depending on the classification of the hedged items.
80
PPL and its subsidiaries have elected not to offset net derivative positions against the right to reclaim cash collateral (a receivable) or the obligation to return cash collateral (a payable) under master netting arrangements. (PPL) Processes exist that allow for subsequent review and validation of the contract information as it relates to interest rate and foreign currency derivatives. See Note 17 for additional information. The accounting department provides the treasury department with guidelines on appropriate accounting classifications for various contract types and strategies. Examples of accounting guidelines provided to the treasury department staff include, but are not limited to: • Transactions to lock in an interest rate prior to a debt issuance can be designated as cash flow hedges, to the extent the
forecasted debt issuances remain probable of occurring. • Cross-currency transactions to hedge interest and principal repayments can be designated as cash flow hedges.
• Transactions entered into to hedge fluctuations in the fair value of existing debt can be designated as fair value hedges.
• Transactions entered into to hedge the value of a net investment of foreign operations can be designated as net investment
hedges.
• Derivative transactions that do not qualify for cash flow or net investment hedge treatment are marked to fair value through earnings. These transactions generally include foreign currency forwards and options to hedge GBP earnings translation risk associated with PPL's U.K. subsidiaries that report their financial statements in GBP. As such, these transactions reduce earnings volatility due solely to changes in foreign currency exchange rates.
• Derivative transactions may be marked to fair value through regulatory assets/liabilities at PPL Electric, LG&E and KU if approved by the appropriate regulatory body. These transactions generally include the effect of interest rate swaps that are included in customer rates.
(PPL and PPL Electric) To meet its obligation as a PLR to its customers, PPL Electric has entered into certain contracts that meet the definition of a derivative. However, NPNS has been elected for these contracts. See Notes 16 and 17 for additional information on derivatives. Revenue (PPL) Operating Revenues For the years ended December 31, the Statements of Income "Operating Revenues" line item contains revenue from the following:
2016 2015 2014
Domestic electric and gas revenues (a) $ 5,297 $ 5,239 $ 5,209 U.K. operating revenues (b) 2,207 2,410 2,621 Domestic - other 13 20 22 Total $ 7,517 $ 7,669 $ 7,852

81
(a) Represents revenues from cost-based rate-regulated generation, transmission and/or distribution in Pennsylvania, Kentucky, Virginia and Tennessee, including regulated wholesale revenue.
(b) Primarily represents regulated electricity distribution revenues from the operation of WPD's distribution networks. Revenue Recognition (All Registrants) Operating revenues are primarily recorded based on energy deliveries through the end of the calendar month. Unbilled retail revenues result because customers' bills are rendered throughout the month, rather than bills being rendered at the end of the month. For LKE, LG&E and KU, unbilled revenues for a month are calculated by multiplying an estimate of unbilled kWh by the estimated average cents per kWh. Any difference between estimated and actual revenues is adjusted the following month. For PPL Electric, unbilled revenues for a month are calculated by multiplying the actual unbilled kWh by an average rate per customer class. (PPL) WPD is currently operating under the eight-year price control period of RIIO-ED1, which commenced on April 1, 2015. Ofgem has adopted a price control mechanism that establishes the amount of base demand revenue WPD can earn, subject to certain true-ups, and provides for an increase or reduction in revenues based on incentives or penalties for performance relative to pre-established targets. WPD's allowed revenue primarily includes base demand revenue (adjusted for inflation using RPI), performance incentive revenues/penalties, adjustments for over or under-recovery from prior periods and adjustments related to the DPCR4 line loss close out. As the regulatory model is incentive based rather than a cost recovery model, WPD is not subject to accounting for the effects of certain types of regulation as prescribed by GAAP. Therefore, the accounting treatment of adjustments to base demand revenue and/or allowed revenue is evaluated based on revenue recognition and contingency accounting guidance. Unlike prior price control reviews, base demand revenue under RIIO-ED1 will be adjusted during the price control period. The most significant of those adjustments are:
• Inflation True-Up - The base demand revenue for the RIIO-ED1 period was set in 2012/13 prices. Therefore an inflation factor as determined by forecasted RPI, provided by HM Treasury, is applied to base demand revenue. Forecasted RPI is trued up to actuals and affects future base demand revenue two regulatory years later. This revenue change is called the "TRU" adjustment.
• Annual Iteration Process - The RIIO-ED1 price control period also includes an Annual Iteration Process (AIP). This will allow future base demand revenues agreed with the regulator as part of the price control review to be updated during the price control period for financial adjustments including tax, pensions and cost of debt, legacy price control adjustments from preceding price control periods and adjustments relating to actual and allowed total expenditure together with the Totex Incentive Mechanism (TIM). Under the TIM, WPD's DNOs are able to retain 70% of any amounts not spent against the RIIO-ED1 plan and bear 70% of any over-spends. The AIP calculates an incremental change to base demand revenue, known as the "MOD" adjustment.
As both MOD and TRU are changes to future base demand revenues as determined by Ofgem, under applicable GAAP, these adjustments are recognized as a component of revenues in future years in which service is provided and revenues are collected or returned to customers. In addition to base demand revenue, certain other items are added or subtracted to arrive at allowed revenue. The most significant of these are:

82
• Incentives - Ofgem has established incentives to provide opportunities for DNO's to enhance overall returns by improving network efficiency, reliability and customer service. Based on applicable GAAP, incentive revenues are not recorded as assets and are included in revenues when they are billed to customers.
• DPCR4 Line Loss Adjustment - For regulatory years 2015/16 through 2018/19 allowed revenue will also be reduced to reflect Ofgem's final decision on the DPCR4 line loss incentives and penalties mechanism. WPD has a liability recorded related to this future revenue reduction and, therefore, this will not impact future earnings. See Note 6 for additional information.
• Correction Factor - During the price control period, WPD sets its tariffs to recover allowed revenue. However, in any fiscal period, WPD's revenue could be negatively affected if its tariffs and the volume delivered do not fully recover the revenue allowed for a particular period. Conversely, WPD could also over-recover revenue. Over and under-recoveries are subtracted from or added to allowed revenue in future years, known as the "Correction Factor" or "K-factor." Over and under-recovered amounts arising for the periods beginning with the 2014/15 regulatory year and refunded/recovered under RIIO-ED1 will be refunded/recovered on a two year lag (previously one year). Therefore the 2014/15 over/under-recovery adjustment will occur in the 2016/17 regulatory year.
Under applicable GAAP, WPD does not record a receivable for under-recoveries, but does record a liability for over-recoveries. K-factor is measured as of the end of the regulatory year, March 31. While WPD estimates over-recoveries and records a liability when it is probable that there will be an over-recovered position at the end of the regulatory-year, weather-related volume changes and other factors such as sales mix can affect the over or under-recovery between the end of PPL's calendar year and the end of the regulatory year. Accounts Receivable (All Registrants) Accounts receivable are reported on the Balance Sheets at the gross outstanding amount adjusted for an allowance for doubtful accounts. (PPL and PPL Electric) In accordance with a PUC-approved purchase of accounts receivable program, PPL Electric purchases certain accounts receivable from alternative electricity suppliers at a discount, which reflects a provision for uncollectible accounts. The alternative electricity suppliers have no continuing involvement or interest in the purchased accounts receivable. Accounts receivable that are acquired are initially recorded at fair value on the date of acquisition. During 2016, 2015 and 2014, PPL Electric purchased $1.4 billion, $1.3 billion and $1.1 billion of accounts receivable from unaffiliated third parties. During 2015 and 2014, PPL Electric purchased $146 million and $336 million of accounts receivable from PPL EnergyPlus. PPL Electric's purchases from PPL EnergyPlus for 2015 include purchases through May 31, 2015, which is the period during which PPL Electric and PPL EnergyPlus were affiliated entities. As a result of the June 1, 2015 spinoff of PPL Energy Supply and creation of Talen Energy, PPL EnergyPlus (renamed Talen Energy Marketing) is no longer an affiliate of PPL Electric. PPL Electric's purchases from Talen Energy Marketing subsequent to May 31, 2015 are included as purchases from unaffiliated third parties. Allowance for Doubtful Accounts (All Registrants) Accounts receivable collectability is evaluated using a combination of factors, including past due status based on contractual terms, trends in write-offs and the age of the receivable. Specific events, such as bankruptcies, are also considered when applicable. Adjustments to the allowance for doubtful accounts are made when necessary based on the results of analysis, the aging of receivables and historical and industry trends.
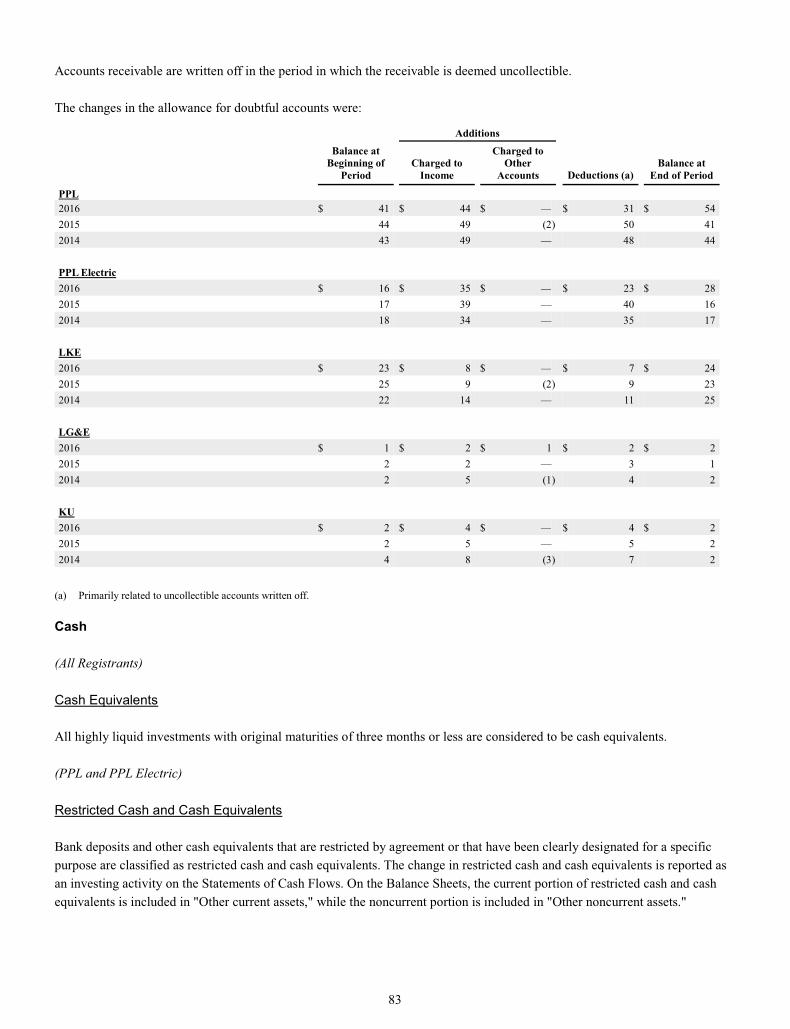
83
Accounts receivable are written off in the period in which the receivable is deemed uncollectible. The changes in the allowance for doubtful accounts were:
Additions
Balance at Beginning of
Period Charged to
Income
Charged to Other
Accounts Deductions (a) Balance at
End of Period
PPL 2016 $ 41 $ 44 $ — $ 31 $ 54 2015 44 49 (2 ) 50 41 2014 43 49 — 48 44 PPL Electric 2016 $ 16 $ 35 $ — $ 23 $ 28 2015 17 39 — 40 16 2014 18 34 — 35 17 LKE 2016 $ 23 $ 8 $ — $ 7 $ 24 2015 25 9 (2 ) 9 23 2014 22 14 — 11 25 LG&E 2016 $ 1 $ 2 $ 1 $ 2 $ 2 2015 2 2 — 3 1 2014 2 5 (1 ) 4 2 KU 2016 $ 2 $ 4 $ — $ 4 $ 2 2015 2 5 — 5 2 2014 4 8 (3 ) 7 2
(a) Primarily related to uncollectible accounts written off.
Cash (All Registrants) Cash Equivalents All highly liquid investments with original maturities of three months or less are considered to be cash equivalents. (PPL and PPL Electric) Restricted Cash and Cash Equivalents Bank deposits and other cash equivalents that are restricted by agreement or that have been clearly designated for a specific purpose are classified as restricted cash and cash equivalents. The change in restricted cash and cash equivalents is reported as an investing activity on the Statements of Cash Flows. On the Balance Sheets, the current portion of restricted cash and cash equivalents is included in "Other current assets," while the noncurrent portion is included in "Other noncurrent assets."
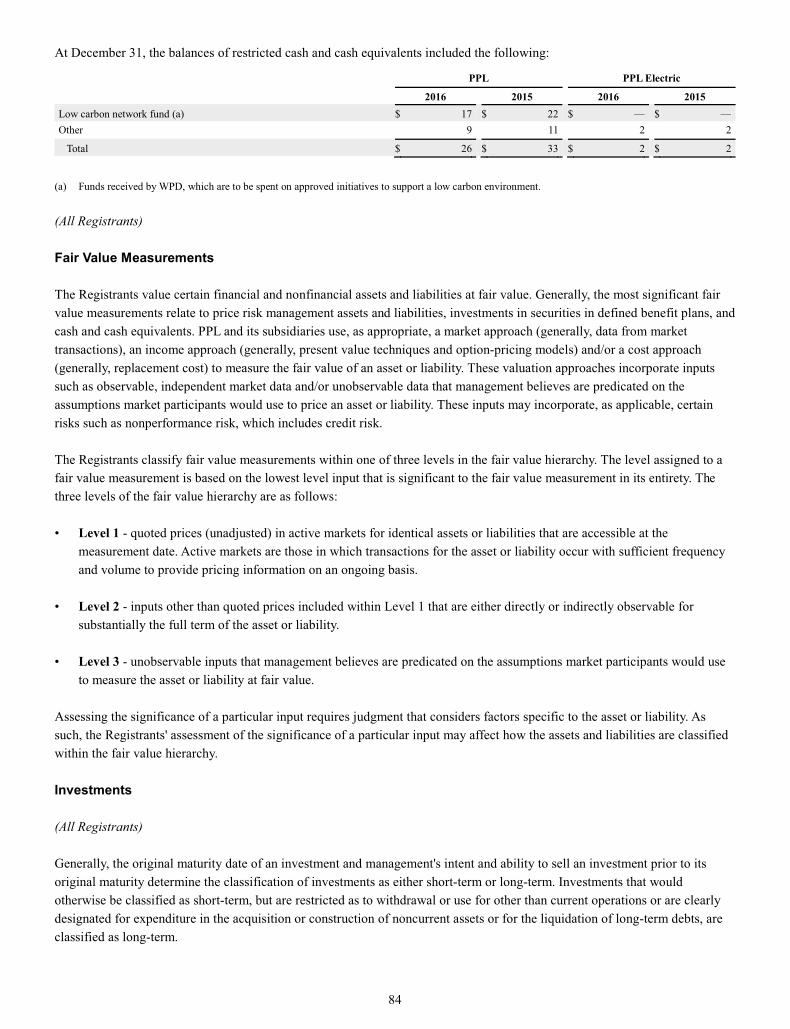
84
At December 31, the balances of restricted cash and cash equivalents included the following:
PPL PPL Electric
2016 2015 2016 2015 Low carbon network fund (a) $ 17 $ 22 $ — $ — Other 9 11 2 2
Total $ 26 $ 33 $ 2 $ 2
(a) Funds received by WPD, which are to be spent on approved initiatives to support a low carbon environment. (All Registrants) Fair Value Measurements The Registrants value certain financial and nonfinancial assets and liabilities at fair value. Generally, the most significant fair value measurements relate to price risk management assets and liabilities, investments in securities in defined benefit plans, and cash and cash equivalents. PPL and its subsidiaries use, as appropriate, a market approach (generally, data from market transactions), an income approach (generally, present value techniques and option-pricing models) and/or a cost approach (generally, replacement cost) to measure the fair value of an asset or liability. These valuation approaches incorporate inputs such as observable, independent market data and/or unobservable data that management believes are predicated on the assumptions market participants would use to price an asset or liability. These inputs may incorporate, as applicable, certain risks such as nonperformance risk, which includes credit risk. The Registrants classify fair value measurements within one of three levels in the fair value hierarchy. The level assigned to a fair value measurement is based on the lowest level input that is significant to the fair value measurement in its entirety. The three levels of the fair value hierarchy are as follows: • Level 1 - quoted prices (unadjusted) in active markets for identical assets or liabilities that are accessible at the
measurement date. Active markets are those in which transactions for the asset or liability occur with sufficient frequency and volume to provide pricing information on an ongoing basis.
• Level 2 - inputs other than quoted prices included within Level 1 that are either directly or indirectly observable for substantially the full term of the asset or liability.
• Level 3 - unobservable inputs that management believes are predicated on the assumptions market participants would use to measure the asset or liability at fair value.
Assessing the significance of a particular input requires judgment that considers factors specific to the asset or liability. As such, the Registrants' assessment of the significance of a particular input may affect how the assets and liabilities are classified within the fair value hierarchy. Investments (All Registrants) Generally, the original maturity date of an investment and management's intent and ability to sell an investment prior to its original maturity determine the classification of investments as either short-term or long-term. Investments that would otherwise be classified as short-term, but are restricted as to withdrawal or use for other than current operations or are clearly designated for expenditure in the acquisition or construction of noncurrent assets or for the liquidation of long-term debts, are classified as long-term.

85
Short-term Investments Short-term investments generally include certain deposits as well as securities that are considered highly liquid or provide for periodic reset of interest rates. Investments with original maturities greater than three months and less than a year, as well as investments with original maturities of greater than a year that management has the ability and intent to sell within a year, are included in "Other current assets" on the Balance Sheets. (PPL, LKE, LG&E and KU) Cost Method Investment LG&E and KU each have an investment in OVEC, which is accounted for using the cost method. The investment is recorded in "Other noncurrent assets" on the PPL, LKE, LG&E and KU Balance Sheets. LG&E and KU and ten other electric utilities are equity owners of OVEC. OVEC's power is currently supplied to LG&E and KU and 11 other companies affiliated with the various owners. LG&E and KU own 5.63% and 2.5% of OVEC's common stock. Pursuant to a power purchase agreement, LG&E and KU are contractually entitled to their ownership percentage of OVEC's output, which is approximately 120 MW for LG&E and approximately 53 MW for KU. LG&E's and KU's combined investment in OVEC is not significant. The direct exposure to loss as a result of LG&E's and KU's involvement with OVEC is generally limited to the value of their investments; however, LG&E and KU are conditionally responsible for a pro-rata share of certain OVEC obligations, pursuant to their power purchase contract with OVEC. As part of PPL's acquisition of LKE, the value of the power purchase contract was recorded as an intangible asset with an offsetting regulatory liability, both of which are being amortized using the units-of-production method until March 2026. See Notes 6, 13 and 18 for additional discussion of the power purchase agreement. Long-Lived and Intangible Assets Property, Plant and Equipment (All Registrants) PP&E is recorded at original cost, unless impaired. PP&E acquired in business combinations is recorded at fair value at the time of acquisition. If impaired, the asset is written down to fair value at that time, which becomes the new cost basis of the asset. Original cost for constructed assets includes material, labor, contractor costs, certain overheads and financing costs, where applicable. The cost of repairs and minor replacements are charged to expense as incurred. The Registrants record costs associated with planned major maintenance projects in the period in which the costs are incurred. No costs associated with planned major maintenance projects are accrued to PP&E in advance of the period in which the work is performed. LG&E and KU accrue costs of removal net of estimated salvage value through depreciation, which is included in the calculation of customer rates over the assets' depreciable lives in accordance with regulatory practices. Cost of removal amounts accrued through depreciation rates are accumulated as a regulatory liability until the removal costs are incurred. For LKE, LG&E and KU, all ARO depreciation expenses are reclassified to a regulatory asset. See "Asset Retirement Obligations" below and Note 6 for additional information. PPL Electric records net costs of removal when incurred as a regulatory asset. The regulatory asset is subsequently amortized through depreciation over a five-year period, which is recoverable in customer rates in accordance with regulatory practices. AFUDC is capitalized at PPL Electric as part of the construction costs for cost-based rate-regulated projects for which a return on such costs is recovered after the project is placed in service. The debt component of AFUDC is credited to "Interest Expense" and the equity component is credited to "Other Income (Expense) - net" on the Statements of Income. LG&E and KU generally do not record AFUDC, except for certain instances in KU's FERC approved rates charged to its municipal customers, as a return is provided on construction work in progress.

86
(PPL) PPL capitalizes interest costs as part of construction costs. Capitalized interest, including the debt component of AFUDC for PPL, was as follows:
PPL 2016 $ 11 2015 11 2014 16
Depreciation (All Registrants) Depreciation is recorded over the estimated useful lives of property using various methods including the straight-line, composite and group methods. When a component of PP&E that was depreciated under the composite or group method is retired, the original cost is charged to accumulated depreciation. When all or a significant portion of an operating unit that was depreciated under the composite or group method is retired or sold, the property and the related accumulated depreciation account is reduced and any gain or loss is included in income, unless otherwise required by regulators. Following are the weighted-average annual rates of depreciation, for regulated utility plant, for the years ended December 31:
2016 2015 2014 PPL 2.73% 2.57 % 2.92 % PPL Electric 2.63% 2.46 % 2.46 % LKE 3.69% 3.69 % 3.80 % LG&E 3.58% 3.65 % 4.05 % KU 3.77% 3.71 % 3.63 %
(PPL) Effective January 1, 2015, after completing a review of the useful lives of its distribution network assets, WPD extended the weighted average useful lives of these assets to 69 years from 55 years for GAAP reporting of depreciation expense. For 2015, this change in useful lives resulted in lower depreciation expense compared with 2014 of $84 million ($66 million after-tax or $0.10 per share). (All Registrants) Goodwill and Other Intangible Assets Goodwill represents the excess of the purchase price paid over the fair value of the identifiable net assets acquired in a business combination. Other acquired intangible assets are initially measured based on their fair value. Intangibles that have finite useful lives are amortized over their useful lives based upon the pattern in which the economic benefits of the intangible assets are consumed or otherwise used. Costs incurred to obtain an initial license and renew or extend terms of licenses are capitalized as intangible assets. When determining the useful life of an intangible asset, including intangible assets that are renewed or extended, PPL and its subsidiaries consider the expected use of the asset; the expected useful life of other assets to which the useful life of the intangible asset may relate; legal, regulatory, or contractual provisions that may limit the useful life; the company's historical experience as evidence of its ability to support renewal or extension; the effects of obsolescence, demand, competition, and
87
other economic factors; and the level of maintenance expenditures required to obtain the expected future cash flows from the asset. Asset Impairment (Excluding Investments) The Registrants review long-lived assets that are subject to depreciation or amortization, including finite-lived intangibles, for impairment when events or circumstances indicate carrying amounts may not be recoverable. A long-lived asset classified as held and used is impaired when the carrying amount of the asset exceeds the sum of the undiscounted cash flows expected to result from the use and eventual disposition of the asset. If impaired, the asset's carrying value is written down to its fair value. A long-lived asset classified as held for sale is impaired when the carrying amount of the asset (disposal group) exceeds its fair value less cost to sell. If impaired, the asset's (disposal group's) carrying value is written down to its fair value less cost to sell. PPL, LKE, LG&E and KU review goodwill for impairment at the reporting unit level annually or more frequently when events or circumstances indicate that the carrying amount of a reporting unit may be greater than the unit's fair value. Additionally, goodwill must be tested for impairment in circumstances when a portion of goodwill has been allocated to a business to be disposed. PPL's, LKE's, LG&E's and KU's reporting units are at the operating segment level. PPL, LKE, LG&E and KU may elect either to initially make a qualitative evaluation about the likelihood of an impairment of goodwill or to bypass the qualitative evaluation and test goodwill for impairment using a two-step quantitative test. If the qualitative evaluation (referred to as "step zero") is elected and the assessment results in a determination that it is not more likely than not that the fair value of a reporting unit is less than the carrying amount, the two-step quantitative impairment test is not necessary. However, the quantitative impairment test is required if management concludes it is more likely than not that the fair value of a reporting unit is less than the carrying amount based on the step zero assessment. If the carrying amount of the reporting unit, including goodwill, exceeds its fair value, the implied fair value of goodwill must be calculated in the same manner as goodwill in a business combination. The fair value of a reporting unit is allocated to all assets and liabilities of that unit as if the reporting unit had been acquired in a business combination. The excess of the fair value of the reporting unit over the amounts assigned to its assets and liabilities is the implied fair value of goodwill. If the implied fair value of goodwill is less than the carrying amount, goodwill is written down to its implied fair value. PPL (for its U.K. Regulated and Kentucky Regulated segments), and individually, LKE, LG&E and KU elected to perform the qualitative step zero evaluation of goodwill in the fourth quarter of 2016. These evaluations considered the excess of fair value over the carrying value of each reporting unit that was calculated during step one of the quantitative impairment tests performed in the fourth quarter of 2015, and the relevant events and circumstances that occurred since those tests were performed including: • current year financial performance versus the prior year, • changes in planned capital expenditures, • the consistency of forecasted free cash flows, • earnings quality and sustainability, • changes in market participant discount rates, • changes in long-term growth rates, • changes in PPL's market capitalization, and • the overall economic and regulatory environments in which these regulated entities operate. Based on these evaluations, management concluded it was not more likely than not that the fair value of these reporting units was less than their carrying value. As such, the two-step quantitative impairment test was not performed and no impairment was recognized.

88
(PPL, LKE, LG&E and KU) Asset Retirement Obligations PPL and its subsidiaries record liabilities to reflect various legal obligations associated with the retirement of long-lived assets. Initially, this obligation is measured at fair value and offset with an increase in the value of the capitalized asset, which is depreciated over the asset's useful life. Until the obligation is settled, the liability is increased through the recognition of accretion expense classified within "Other operation and maintenance" on the Statements of Income to reflect changes in the obligation due to the passage of time. For LKE, LG&E and KU, all ARO accretion and depreciation expenses are reclassified as a regulatory asset. ARO regulatory assets associated with approved ECR projects for CCRs are amortized to expense over a period of 10 to 25 years based on retirement expenditures made related to the obligations. For other AROs, at the time of retirement, the related ARO regulatory asset is offset against the associated cost of removal regulatory liability, PP&E and ARO liability. Estimated ARO costs and settlement dates, which affect the carrying value of the ARO and the related capitalized asset, are reviewed periodically to ensure that any material changes are incorporated into the latest estimate of the ARO. Any change to the capitalized asset, positive or negative, is generally amortized over the remaining life of the associated long-lived asset. See Note 19 for additional information on AROs. Compensation and Benefits Defined Benefits (All Registrants) Certain PPL subsidiaries sponsor various defined benefit pension and other postretirement plans. An asset or liability is recorded to recognize the funded status of all defined benefit plans with an offsetting entry to AOCI or, for LG&E, KU and PPL Electric, to regulatory assets or liabilities. Consequently, the funded status of all defined benefit plans is fully recognized on the Balance Sheets. The expected return on plan assets is determined based on a market-related value of plan assets, which is calculated by rolling forward the prior year market-related value with contributions, disbursements and long-term expected return on investments. One-fifth of the difference between the actual value and the expected value is added (or subtracted if negative) to the expected value to determine the new market-related value. PPL uses an accelerated amortization method for the recognition of gains and losses for its defined benefit pension plans. Under the accelerated method, actuarial gains and losses in excess of 30% of the plan's projected benefit obligation are amortized on a straight-line basis over one-half of the expected average remaining service of active plan participants. Actuarial gains and losses in excess of 10% of the greater of the plan's projected benefit obligation or the market-related value of plan assets and less than 30% of the plan's projected benefit obligation are amortized on a straight-line basis over the expected average remaining service period of active plan participants. See Note 6 for a discussion of the regulatory treatment of defined benefit costs and Note 11 for a discussion of defined benefits. Discount Rate Change for U.K. Pension Plans (PPL) In selecting the discount rate for its U.K. pension plans, WPD historically used a single weighted-average discount rate in the calculation of net periodic defined benefit cost. WPD began using individual spot rates to measure service cost and interest cost for the calculation of net periodic defined benefit cost in 2016. In 2016, this change in discount rate resulted in lower net periodic defined benefit costs recognized on PPL's Statement of Income of $43 million ($34 million after-tax or $0.05 per share).

89
See Note 11 for additional information. Stock-Based Compensation (PPL, PPL Electric and LKE) PPL has several stock-based compensation plans for purposes of granting stock options, restricted stock, restricted stock units and performance units to certain employees as well as stock units and restricted stock units to directors. PPL grants most stock-based awards in the first quarter of each year. PPL and its subsidiaries recognize compensation expense for stock-based awards based on the fair value method. Forfeitures of awards are recognized when they occur. See Note 10 for a discussion of stock-based compensation. All awards are recorded as equity or a liability on the Balance Sheets. Stock-based compensation is primarily included in "Other operation and maintenance" on the Statements of Income. Stock-based compensation expense for PPL Electric and LKE includes an allocation of PPL Services' expense. Taxes Income Taxes (All Registrants) PPL and its domestic subsidiaries file a consolidated U.S. federal income tax return. Significant management judgment is required in developing the Registrants' provision for income taxes, primarily due to the uncertainty related to tax positions taken or expected to be taken in tax returns, valuation allowances on deferred tax assets and whether the undistributed earnings of WPD are considered indefinitely reinvested. Significant management judgment is also required to determine the amount of benefit to be recognized in relation to an uncertain tax position. The Registrants use a two-step process to evaluate tax positions. The first step requires an entity to determine whether, based on the technical merits supporting a particular tax position, it is more likely than not (greater than a 50% chance) that the tax position will be sustained. This determination assumes that the relevant taxing authority will examine the tax position and is aware of all the relevant facts surrounding the tax position. The second step requires an entity to recognize in the financial statements the benefit of a tax position that meets the more-likely-than-not recognition criterion. The benefit recognized is measured at the largest amount of benefit that has a likelihood of realization, upon settlement, that exceeds 50%. The amounts ultimately paid upon resolution of issues raised by taxing authorities may differ materially from the amounts accrued and may materially impact the financial statements of the Registrants in future periods. Deferred income taxes reflect the net future tax effects of temporary differences between the carrying amounts of assets and liabilities for accounting purposes and their basis for income tax purposes, as well as the tax effects of net operating losses and tax credit carryforwards. The Registrants record valuation allowances to reduce deferred tax assets to the amounts that are more likely than not to be realized. The Registrants consider the reversal of temporary differences, future taxable income and ongoing prudent and feasible tax planning strategies in initially recording and subsequently reevaluating the need for valuation allowances. If the Registrants determine that they are able to realize deferred tax assets in the future in excess of recorded net deferred tax assets, adjustments to the valuation allowances increase income by reducing tax expense in the period that such determination is made. Likewise, if the Registrants determine that they are not able to realize all or part of net deferred tax assets in the future, adjustments to the valuation allowances would decrease income by increasing tax expense in the period that such determination is made. The Registrants defer investment tax credits when the credits are utilized and amortize the deferred amounts over the average lives of the related assets. The Registrants recognize interest and penalties in "Income Taxes" on their Statements of Income.
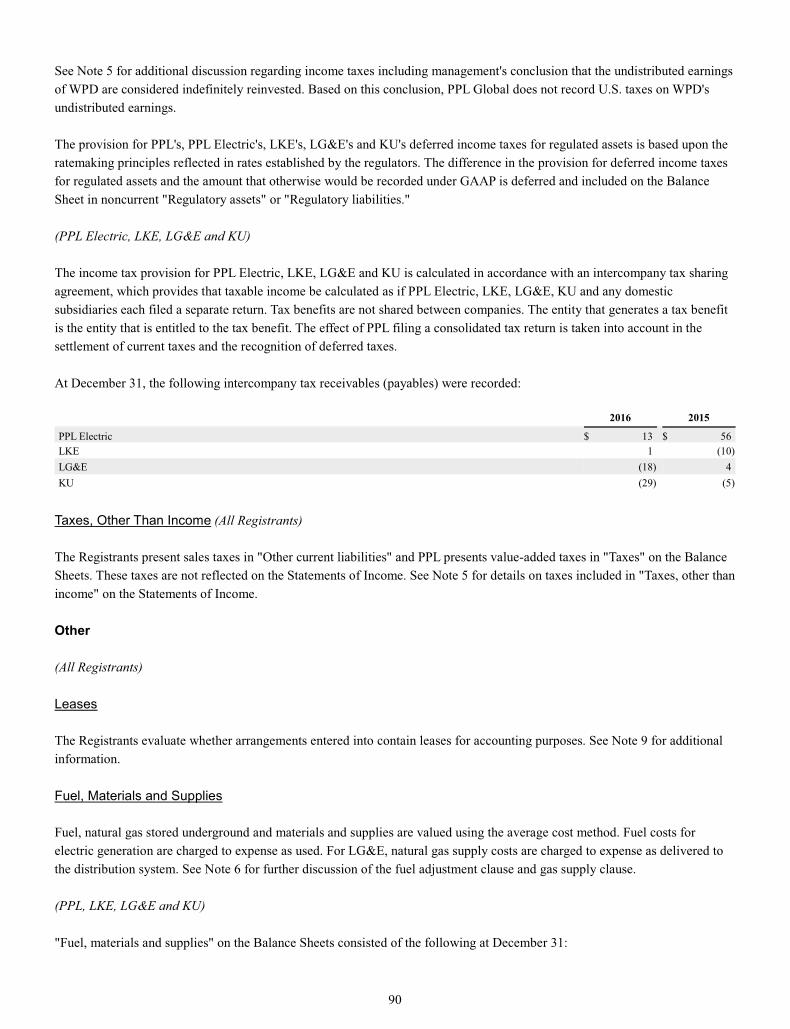
90
See Note 5 for additional discussion regarding income taxes including management's conclusion that the undistributed earnings of WPD are considered indefinitely reinvested. Based on this conclusion, PPL Global does not record U.S. taxes on WPD's undistributed earnings. The provision for PPL's, PPL Electric's, LKE's, LG&E's and KU's deferred income taxes for regulated assets is based upon the ratemaking principles reflected in rates established by the regulators. The difference in the provision for deferred income taxes for regulated assets and the amount that otherwise would be recorded under GAAP is deferred and included on the Balance Sheet in noncurrent "Regulatory assets" or "Regulatory liabilities." (PPL Electric, LKE, LG&E and KU) The income tax provision for PPL Electric, LKE, LG&E and KU is calculated in accordance with an intercompany tax sharing agreement, which provides that taxable income be calculated as if PPL Electric, LKE, LG&E, KU and any domestic subsidiaries each filed a separate return. Tax benefits are not shared between companies. The entity that generates a tax benefit is the entity that is entitled to the tax benefit. The effect of PPL filing a consolidated tax return is taken into account in the settlement of current taxes and the recognition of deferred taxes. At December 31, the following intercompany tax receivables (payables) were recorded:
2016 2015
PPL Electric $ 13 $ 56 LKE 1 (10 ) LG&E (18 ) 4 KU (29 ) (5 )
Taxes, Other Than Income (All Registrants) The Registrants present sales taxes in "Other current liabilities" and PPL presents value-added taxes in "Taxes" on the Balance Sheets. These taxes are not reflected on the Statements of Income. See Note 5 for details on taxes included in "Taxes, other than income" on the Statements of Income. Other (All Registrants) Leases The Registrants evaluate whether arrangements entered into contain leases for accounting purposes. See Note 9 for additional information. Fuel, Materials and Supplies Fuel, natural gas stored underground and materials and supplies are valued using the average cost method. Fuel costs for electric generation are charged to expense as used. For LG&E, natural gas supply costs are charged to expense as delivered to the distribution system. See Note 6 for further discussion of the fuel adjustment clause and gas supply clause. (PPL, LKE, LG&E and KU) "Fuel, materials and supplies" on the Balance Sheets consisted of the following at December 31:
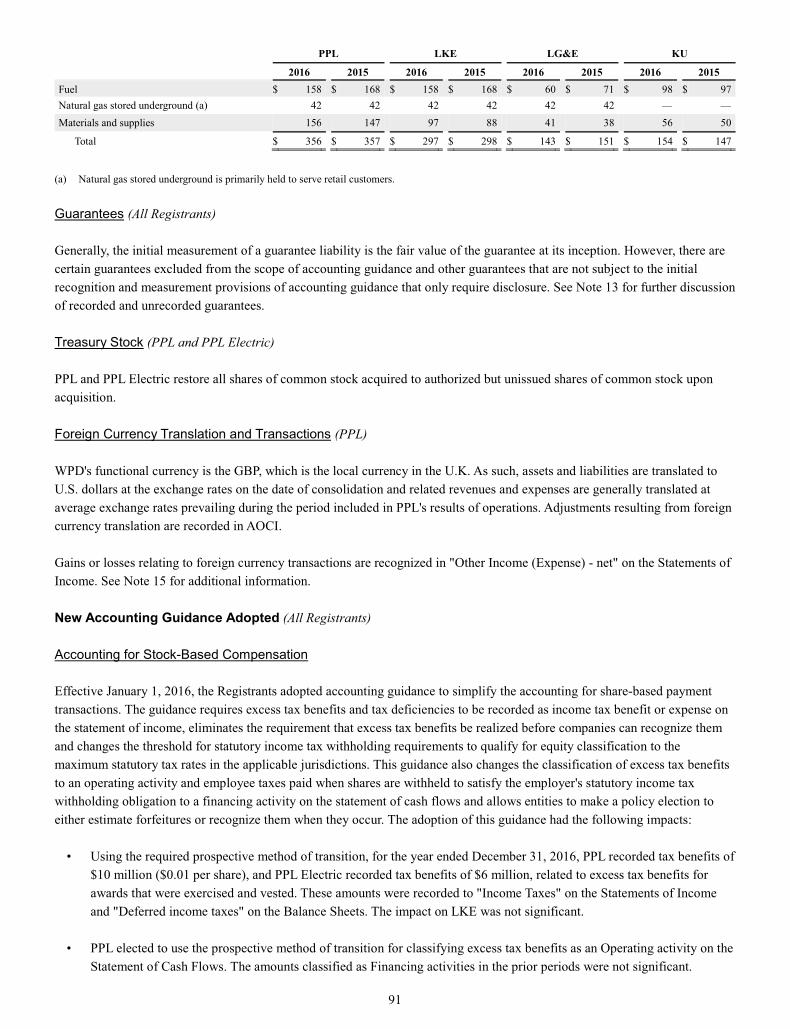
91
PPL LKE LG&E KU
2016 2015 2016 2015 2016 2015 2016 2015 Fuel $ 158 $ 168 $ 158 $ 168 $ 60 $ 71 $ 98 $ 97 Natural gas stored underground (a) 42 42 42 42 42 42 — — Materials and supplies 156 147 97 88 41 38 56 50
Total $ 356 $ 357 $ 297 $ 298 $ 143 $ 151 $ 154 $ 147
(a) Natural gas stored underground is primarily held to serve retail customers. Guarantees (All Registrants) Generally, the initial measurement of a guarantee liability is the fair value of the guarantee at its inception. However, there are certain guarantees excluded from the scope of accounting guidance and other guarantees that are not subject to the initial recognition and measurement provisions of accounting guidance that only require disclosure. See Note 13 for further discussion of recorded and unrecorded guarantees. Treasury Stock (PPL and PPL Electric) PPL and PPL Electric restore all shares of common stock acquired to authorized but unissued shares of common stock upon acquisition. Foreign Currency Translation and Transactions (PPL) WPD's functional currency is the GBP, which is the local currency in the U.K. As such, assets and liabilities are translated to U.S. dollars at the exchange rates on the date of consolidation and related revenues and expenses are generally translated at average exchange rates prevailing during the period included in PPL's results of operations. Adjustments resulting from foreign currency translation are recorded in AOCI. Gains or losses relating to foreign currency transactions are recognized in "Other Income (Expense) - net" on the Statements of Income. See Note 15 for additional information. New Accounting Guidance Adopted (All Registrants) Accounting for Stock-Based Compensation Effective January 1, 2016, the Registrants adopted accounting guidance to simplify the accounting for share-based payment transactions. The guidance requires excess tax benefits and tax deficiencies to be recorded as income tax benefit or expense on the statement of income, eliminates the requirement that excess tax benefits be realized before companies can recognize them and changes the threshold for statutory income tax withholding requirements to qualify for equity classification to the maximum statutory tax rates in the applicable jurisdictions. This guidance also changes the classification of excess tax benefits to an operating activity and employee taxes paid when shares are withheld to satisfy the employer's statutory income tax withholding obligation to a financing activity on the statement of cash flows and allows entities to make a policy election to either estimate forfeitures or recognize them when they occur. The adoption of this guidance had the following impacts:
• Using the required prospective method of transition, for the year ended December 31, 2016, PPL recorded tax benefits of $10 million ($0.01 per share), and PPL Electric recorded tax benefits of $6 million, related to excess tax benefits for awards that were exercised and vested. These amounts were recorded to "Income Taxes" on the Statements of Income and "Deferred income taxes" on the Balance Sheets. The impact on LKE was not significant.
• PPL elected to use the prospective method of transition for classifying excess tax benefits as an Operating activity on the Statement of Cash Flows. The amounts classified as Financing activities in the prior periods were not significant.

92
• Upon adoption, using the required modified retrospective method of transition, PPL recorded a cumulative effect
adjustment of $7 million to increase "Earnings reinvested" and decrease "Deferred income taxes" on the Balance Sheet related to prior period unrecognized excess tax benefits.
• PPL has historically presented employee taxes paid for net settled awards as a Financing activity on the Statement of Cash Flows. Therefore, there is no transition impact for this requirement.
• PPL has elected to recognize forfeitures when they occur. Due to past experience of insignificant forfeitures, there is no transition impact of this policy election.
2. Segment and Related Information (PPL) PPL is organized into three segments: U.K. Regulated, Kentucky Regulated and Pennsylvania Regulated. PPL's segments are segmented by geographic location. The U.K. Regulated segment consists of PPL Global, which primarily includes WPD's regulated electricity distribution operations, the results of hedging the translation of WPD's earnings from GBP into U.S. dollars, and certain costs, such as U.S. income taxes, administrative costs, and certain acquisition-related financing costs. The Kentucky Regulated segment consists primarily of LKE's regulated electricity generation, transmission and distribution operations of LG&E and KU, as well as LG&E's regulated distribution and sale of natural gas. In addition, certain acquisition-related financing costs are allocated to the Kentucky Regulated segment. The Pennsylvania Regulated segment includes the regulated electricity transmission and distribution operations of PPL Electric. In addition, certain costs are allocated to the Pennsylvania Regulated segment. "Corporate and Other" primarily includes financing costs incurred at the corporate level that have not been allocated or assigned to the segments, as well as certain other unallocated costs, which is presented to reconcile segment information to PPL's consolidated results. On June 1, 2015, PPL completed the spinoff of PPL Energy Supply, which substantially represented PPL's Supply segment. As a result of this transaction, PPL no longer has a Supply segment. See Note 8 for additional information. Financial data for the segments for the years ended December 31 are as follows:
2016 2015 2014 Income Statement Data Operating Revenues from external customers (a)
U.K. Regulated $ 2,207 $ 2,410 $ 2,621 Kentucky Regulated 3,141 3,115 3,168 Pennsylvania Regulated 2,156 2,124 2,044 Corporate and Other 13 20 19
Total $ 7,517 $ 7,669 $ 7,852
Depreciation U.K. Regulated $ 233 $ 242 $ 337 Kentucky Regulated 404 382 354 Pennsylvania Regulated 253 214 185 Corporate and Other 36 45 47
Total $ 926 $ 883 $ 923
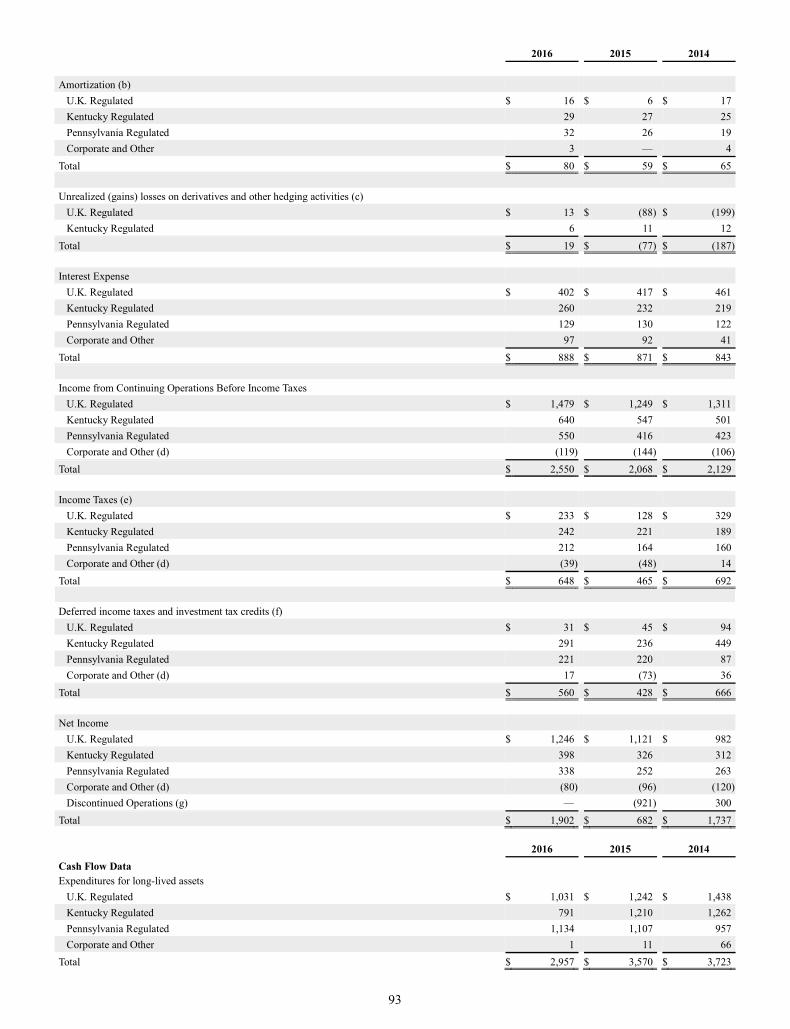
93
2016 2015 2014
Amortization (b) U.K. Regulated $ 16 $ 6 $ 17 Kentucky Regulated 29 27 25 Pennsylvania Regulated 32 26 19 Corporate and Other 3 — 4
Total $ 80 $ 59 $ 65
Unrealized (gains) losses on derivatives and other hedging activities (c) U.K. Regulated $ 13 $ (88 ) $ (199 ) Kentucky Regulated 6 11 12
Total $ 19 $ (77 ) $ (187 )
Interest Expense U.K. Regulated $ 402 $ 417 $ 461 Kentucky Regulated 260 232 219 Pennsylvania Regulated 129 130 122 Corporate and Other 97 92 41
Total $ 888 $ 871 $ 843
Income from Continuing Operations Before Income Taxes U.K. Regulated $ 1,479 $ 1,249 $ 1,311 Kentucky Regulated 640 547 501 Pennsylvania Regulated 550 416 423 Corporate and Other (d) (119) (144 ) (106 )
Total $ 2,550 $ 2,068 $ 2,129
Income Taxes (e) U.K. Regulated $ 233 $ 128 $ 329 Kentucky Regulated 242 221 189 Pennsylvania Regulated 212 164 160 Corporate and Other (d) (39) (48 ) 14
Total $ 648 $ 465 $ 692
Deferred income taxes and investment tax credits (f) U.K. Regulated $ 31 $ 45 $ 94 Kentucky Regulated 291 236 449 Pennsylvania Regulated 221 220 87 Corporate and Other (d) 17 (73 ) 36
Total $ 560 $ 428 $ 666
Net Income U.K. Regulated $ 1,246 $ 1,121 $ 982 Kentucky Regulated 398 326 312 Pennsylvania Regulated 338 252 263 Corporate and Other (d) (80) (96 ) (120 ) Discontinued Operations (g) — (921 ) 300
Total $ 1,902 $ 682 $ 1,737 2016 2015 2014 Cash Flow Data Expenditures for long-lived assets
U.K. Regulated $ 1,031 $ 1,242 $ 1,438 Kentucky Regulated 791 1,210 1,262 Pennsylvania Regulated 1,134 1,107 957 Corporate and Other 1 11 66
Total $ 2,957 $ 3,570 $ 3,723

94
As of December 31, 2016 2015
Balance Sheet Data Total Assets
U.K. Regulated (h) $ 14,537 $ 16,669 Kentucky Regulated 14,037 13,756 Pennsylvania Regulated 9,426 8,511 Corporate and Other (i) 315 365
Total $ 38,315 $ 39,301 Geographic data for the years ended December 31 are as follows:
2016 2015 2014 Geographic Data Revenues from external customers
U.K. $ 2,207 $ 2,410 $ 2,621 U.S. 5,310 5,259 5,231
Total $ 7,517 $ 7,669 $ 7,852 As of December 31,
2016 2015 Long-Lived Assets
U.K. (h) $ 11,177 $ 12,487 U.S. 19,595 18,569
Total $ 30,772 $ 31,056 (a) See Note 1 for additional information on Operating Revenues. (b) Represents non-cash expense items that include amortization of regulatory assets, debt discounts and premiums, debt issuance costs, emission allowances
and RECs. (c) Includes unrealized gains and losses from economic activity. See Note 17 for additional information. (d) 2015 and 2014 include certain costs related to the spinoff of PPL Energy Supply, including deferred income tax expense, transition costs and separation
benefits for PPL Services employees. See Note 8 for additional information. (e) Represents both current and deferred income taxes, including investment tax credits. (f) Represents a non-cash expense item that is also included in "Income Taxes." (g) 2015 includes an $879 million loss on the spinoff of PPL Energy Supply and five months of Supply segment earnings. 2014 includes a gain of $237
million ($137 million after-tax) on the sale of the Montana hydroelectric generating facilities. See Note 8 for additional information on these transactions. (h) Includes $10.8 billion and $12.2 billion of net PP&E as of December 31, 2016 and December 31, 2015. WPD is not subject to accounting for the effects
of certain types of regulation as prescribed by GAAP. (i) Primarily consists of unallocated items, including cash, PP&E and the elimination of inter-segment transactions. (PPL Electric, LKE, LG&E and KU) PPL Electric has two operating segments that are aggregated into a single reportable segment. LKE, LG&E and KU are individually single operating and reportable segments. 3. Preferred Securities (PPL) PPL is authorized to issue up to 10 million shares of preferred stock. No PPL preferred stock was issued or outstanding in 2016, 2015 or 2014. (PPL Electric) PPL Electric is authorized to issue up to 20,629,936 shares of preferred stock. No PPL Electric preferred stock was issued or outstanding in 2016, 2015 or 2014.

95
(LG&E) LG&E is authorized to issue up to 1,720,000 shares of preferred stock at a $25 par value and 6,750,000 shares of preferred stock without par value. LG&E had no preferred stock issued or outstanding in 2016, 2015 or 2014. (KU) KU is authorized to issue up to 5,300,000 shares of preferred stock and 2,000,000 shares of preference stock without par value. KU had no preferred or preference stock issued or outstanding in 2016, 2015 or 2014. 4. Earnings Per Share (PPL) Basic EPS is computed by dividing income available to PPL common shareowners by the weighted-average number of common shares outstanding during the applicable period. Diluted EPS is computed by dividing income available to PPL common shareowners by the weighted-average number of common shares outstanding, increased by incremental shares that would be outstanding if potentially dilutive non-participating securities were converted to common shares as calculated using the Treasury Stock Method or If-Converted Method, as applicable. Incremental non-participating securities that have a dilutive impact are detailed in the table below. Reconciliations of the amounts of income and shares of PPL common stock (in thousands) for the periods ended December 31, used in the EPS calculation are:
2016 2015 2014
Income (Numerator) Income from continuing operations after income taxes $ 1,902 $ 1,603 $ 1,437 Less amounts allocated to participating securities 6 6 7 Income from continuing operations after income taxes available to PPL common shareowners - Basic 1,896
1,597
1,430
Plus interest charges (net of tax) related to Equity Units (a) — — 9 Income from continuing operations after income taxes available to PPL common shareowners - Diluted $ 1,896
$ 1,597
$ 1,439
Income (loss) from discontinued operations (net of income taxes) available to PPL common shareowners - Basic and Diluted $ —
$ (921 ) $ 300
Net income $ 1,902 $ 682 $ 1,737 Less amounts allocated to participating securities 6 2 9 Net income available to PPL common shareowners - Basic 1,896 680 1,728 Plus interest charges (net of tax) related to Equity Units (a) — — 9 Net income available to PPL common shareowners - Diluted $ 1,896 $ 680 $ 1,737 Shares of Common Stock (Denominator) Weighted-average shares - Basic EPS 677,592 669,814 653,504 Add incremental non-participating securities:
Share-based payment awards (b) 2,854 2,772 1,910 Equity Units (a) — — 10,559
Weighted-average shares - Diluted EPS 680,446 672,586 665,973 Basic EPS Available to PPL common shareowners:
Income from continuing operations after income taxes $ 2.80 $ 2.38 $ 2.19

96
2016 2015 2014
Income (loss) from discontinued operations (net of income taxes) — (1.37 ) 0.45 Net Income $ 2.80 $ 1.01 $ 2.64
Diluted EPS Available to PPL common shareowners:
Income from continuing operations after income taxes $ 2.79 $ 2.37 $ 2.16 Income (loss) from discontinued operations (net of income taxes) — (1.36 ) 0.45 Net Income $ 2.79 $ 1.01 $ 2.61
(a) In 2014, the If-Converted Method was applied to the Equity Units prior to settlement. See Note 7 for additional information on the Equity Units,
including the issuance of PPL common stock to settle the Purchase contracts. (b) The Treasury Stock Method was applied to non-participating share-based payment awards. For the year ended December 31, PPL issued common stock related to stock-based compensation plans and DRIP as follows (in thousands):
2016
Stock-based compensation plans (a) 3,224 DRIP 1,562
(a) Includes stock options exercised, vesting of performance units, vesting of restricted stock and restricted stock units and conversion of stock units granted
to directors. See Note 7 for additional information on common stock issued under ATM Program. For the years ended December 31, the following shares (in thousands) were excluded from the computations of diluted EPS because the effect would have been antidilutive:
2016 2015 2014
Stock options 696 1,087 1,816 Performance units 176 36 5 Restricted stock units — — 31
5. Income and Other Taxes (PPL) "Income from Continuing Operations Before Income Taxes" included the following:
2016 2015 2014
Domestic income $ 1,463 $ 968 $ 922 Foreign income 1,087 1,100 1,207
Total $ 2,550 $ 2,068 $ 2,129 Deferred income taxes reflect the net tax effects of temporary differences between the carrying amounts of assets and liabilities for accounting purposes and their basis for income tax purposes and the tax effects of net operating loss and tax credit carryforwards. The provision for PPL's deferred income taxes for regulated assets and liabilities is based upon the ratemaking principles of the applicable jurisdiction. See Notes 1 and 6 for additional information. Net deferred tax assets have been recognized based on management's estimates of future taxable income for the U.S. and the U.K. Significant components of PPL's deferred income tax assets and liabilities were as follows:

97
2016 2015
Deferred Tax Assets Deferred investment tax credits $ 51 $ 50 Regulatory liabilities 94 123 Accrued pension costs 250 217 Federal loss carryforwards 565 587 State loss carryforwards 326 319 Federal and state tax credit carryforwards 256 201 Foreign capital loss carryforwards 302 387 Foreign loss carryforwards 3 4 Foreign - pensions 41 171 Foreign - regulatory obligations 6 12 Foreign - other 5 8 Contributions in aid of construction 141 139 Domestic - other 188 209 Unrealized losses on qualifying derivatives 20 15 Valuation allowances (a) (593 ) (662 )
Total deferred tax assets 1,655 1,780 Deferred Tax Liabilities
Domestic plant - net 4,325 3,875 Taxes recoverable through future rates 170 162 Regulatory assets 343 332 Reacquired debt costs 25 28 Foreign plant - net 640 777 Domestic - other 14 24
Total deferred tax liabilities 5,517 5,198 Net deferred tax liability $ 3,862 $ 3,418
(a) Includes $77 million of deferred tax assets related to state loss carryforwards and related valuation allowances previously reflected on the PPL Energy
Supply Segment. The deferred tax assets and related valuation allowance remained with PPL after the spinoff. State deferred taxes are determined on a by entity, by jurisdiction basis. As a result, $27 million and $22 million of net deferred tax assets are shown as "Other noncurrent assets" on the Balance Sheets for 2016 and 2015. At December 31, 2016, PPL had the following loss and tax credit carryforwards, related deferred tax assets and valuation allowances recorded against the deferred tax assets.
Gross Deferred Tax
Asset Valuation Allowance Expiration
Loss carryforwards Federal net operating losses $ 1,583 $ 554 $ — 2029-2035 Federal charitable contributions 28 11 — 2020-2021 State net operating losses 5,387 325 (269 ) 2017-2036 State charitable contributions 12 1 — 2017-2021 Foreign net operating losses 17 3 (3 ) Indefinite Foreign capital losses 1,783 302 (302 ) Indefinite
Credit carryforwards
Federal investment tax credit 133 — 2025-2036
Federal alternative minimum tax credit 30 — Indefinite
Federal foreign tax credits 62 (3 ) 2024-2025
Federal - other 30 (11 ) 2017-2036
State - other 1 — Indefinite

98
Valuation allowances have been established for the amount that, more likely than not, will not be realized. The changes in deferred tax valuation allowances were as follows: Additions
Balance at Beginning of Period
Charged to Income
Charged to Other
Accounts Deductions
Balance at End
of Period
2016 $ 662 $ 17 $ 2 $ 88 (a) $ 593 2015 622 24 77 (b) 61 (a) 662 2014 585 57 6 26 622
(a) The reductions of the U.K. statutory income tax rates in 2016 and 2015 resulted in $19 million and $44 million in reductions in the deferred tax assets and
corresponding valuation allowances. See "Reconciliation of Income Tax Expense" below for more information on the impact of the U.K. Finance Acts 2016 and 2015. In addition, the deferred tax assets and corresponding valuation allowances were reduced in 2016 by approximately $65 million due to the effect of foreign currency exchange rates.
(b) Valuation allowance related to the deferred tax assets previously reflected on the PPL Energy Supply Segment. The deferred tax assets and related valuation allowance remained with PPL after the spinoff.
PPL Global does not pay or record U.S. income taxes on the undistributed earnings of WPD as management has determined that the earnings are indefinitely reinvested for accounting purposes. Current year distributions from WPD to the U.S. are sourced from a portion of current year's earnings of the WPD group. WPD's long-term working capital forecasts and capital expenditure projections for the foreseeable future require reinvestment of WPD's undistributed earnings. Additionally, U.S. long-term working capital forecasts and capital expenditure projections for the foreseeable future do not require or contemplate annual distributions from WPD in excess of WPD's future annual earnings. The cumulative undistributed earnings are included in "Earnings reinvested" on the Balance Sheets. The amounts considered indefinitely reinvested at December 31, 2016 and 2015 were $5.5 billion and $4.6 billion. It is not practicable to estimate the amount of additional taxes that could be payable on these foreign earnings in the event of repatriation to the U.S. Details of the components of income tax expense, a reconciliation of federal income taxes derived from statutory tax rates applied to "Income from Continuing Operations Before Income Taxes" to income taxes for reporting purposes, and details of "Taxes, other than income" were as follows:
2016 2015 2014
Income Tax Expense (Benefit) Current - Federal $ (14 ) $ (26 ) $ 18 Current - State 21 25 26 Current - Foreign 80 89 152
Total Current Expense 87 88 196 Deferred - Federal 385 699 299 Deferred - State 89 68 120 Deferred - Foreign 86 41 96
Total Deferred Expense, excluding operating loss carryforwards 560 808 515
Amortization of investment tax credit (3) (4 ) (5 ) Tax expense (benefit) of operating loss carryforwards
Deferred - Federal (a) 25 (396 ) 8 Deferred - State (21) (31 ) (22 )
Total Tax Expense (Benefit) of Operating Loss Carryforwards 4 (427 ) (14 ) Total income taxes from continuing operations $ 648 $ 465 $ 692
Total income tax expense - Federal $ 393 $ 273 $ 320 Total income tax expense - State 89 62 124 Total income tax expense - Foreign 166 130 248
Total income taxes from continuing operations $ 648 $ 465 $ 692 (a) Increase in Federal loss carryforwards for 2015 primarily relates to the extension of bonus depreciation and the impact of bonus depreciation related to
provision to return adjustments.

99
In the table above, the following income tax expense (benefits) are excluded from income taxes from continuing operations: 2016 2015 2014
Discontinued operations - PPL Energy Supply Segment $ — $ (30 ) $ 198 Stock-based compensation recorded to Additional Paid-in Capital — — (4 ) Stock-based compensation recorded to Earnings Reinvested (7) — — Other comprehensive income (6) (2 ) (190 ) Valuation allowance on state deferred taxes recorded to other comprehensive income 1 (4 ) —
Total $ (12 ) $ (36 ) $ 4 2016 2015 2014
Reconciliation of Income Tax Expense Federal income tax on Income from Continuing Operations Before Income Taxes at statutory tax rate - 35% $ 893
$ 724
$ 745
Increase (decrease) due to: State income taxes, net of federal income tax benefit 46 31 28 Valuation allowance adjustments (a) 16 24 55 Impact of lower U.K. income tax rates (b) (177) (176 ) (180 ) U.S. income tax on foreign earnings - net of foreign tax credit (c) (42) 8 63 Federal and state tax reserves adjustments (d) — (22 ) (1 ) Impact of the U.K. Finance Acts on deferred tax balances (b) (49) (91 ) (1 ) Depreciation not normalized (10) (5 ) (7 ) Interest benefit on U.K. financing entities (17) (20 ) (5 ) Stock-based compensation (e) (10) — — Other (2) (8 ) (5 )
Total increase (decrease) (245) (259 ) (53 ) Total income taxes from continuing operations $ 648 $ 465 $ 692 Effective income tax rate 25.4% 22.5 % 32.5 %
(a) During 2016, PPL recorded deferred tax expense for valuation allowances primarily related to increased Pennsylvania net operating loss carryforwards
expected to be unutilized. During 2015, PPL recorded $24 million of deferred income tax expense related to deferred tax valuation allowances. PPL recorded state deferred income tax expense of $12 million primarily related to increased Pennsylvania net operating loss carryforwards expected to be unutilized and $12 million of federal deferred income tax expense primarily related to federal tax credit carryforwards that are expected to expire as a result of lower future taxable earnings due to the extension of bonus depreciation.
As a result of the PPL Energy Supply spinoff announcement, PPL recorded $50 million of deferred income tax expense during 2014, to adjust the valuation allowance on deferred tax assets primarily for state net operating loss carryforwards that were previously supported by the future earnings of PPL Energy Supply. See Note 8 for additional information on the spinoff.
(b) The U.K. Finance Act 2016, enacted in September 2016, reduces the U.K. statutory income tax rate effective April 1, 2020 from 18% to 17%. As a result, PPL reduced its net deferred tax liabilities and recognized a deferred tax benefit during 2016. The U.K. Finance Act 2015, enacted in November 2015, reduced the U.K. statutory income tax rate from 20% to 19% effective April 1, 2017 and from 19% to 18% effective April 1, 2020. As a result, PPL reduced its net deferred tax liabilities and recognized a deferred tax benefit during 2015, related to both rate decreases.
(c) During 2016, PPL recorded lower income taxes primarily attributable to foreign tax credit carryforwards, arising from a decision to amend prior year tax returns to claim foreign tax credits rather than deduct foreign taxes. This decision was prompted by changes to the Company's most recent business plan. During 2015, PPL recorded lower income taxes primarily attributable to a decrease in taxable dividends.
During 2014, PPL recorded $47 million of income tax expense primarily attributable to taxable dividends. (d) During 2015, PPL recorded a $12 million tax benefit related to the settlement of the IRS audit for the tax years 1998-2011. (e) During 2016, PPL recorded lower income tax expense related to the application of new stock-based compensation accounting guidance. See Note 1 for
additional information.
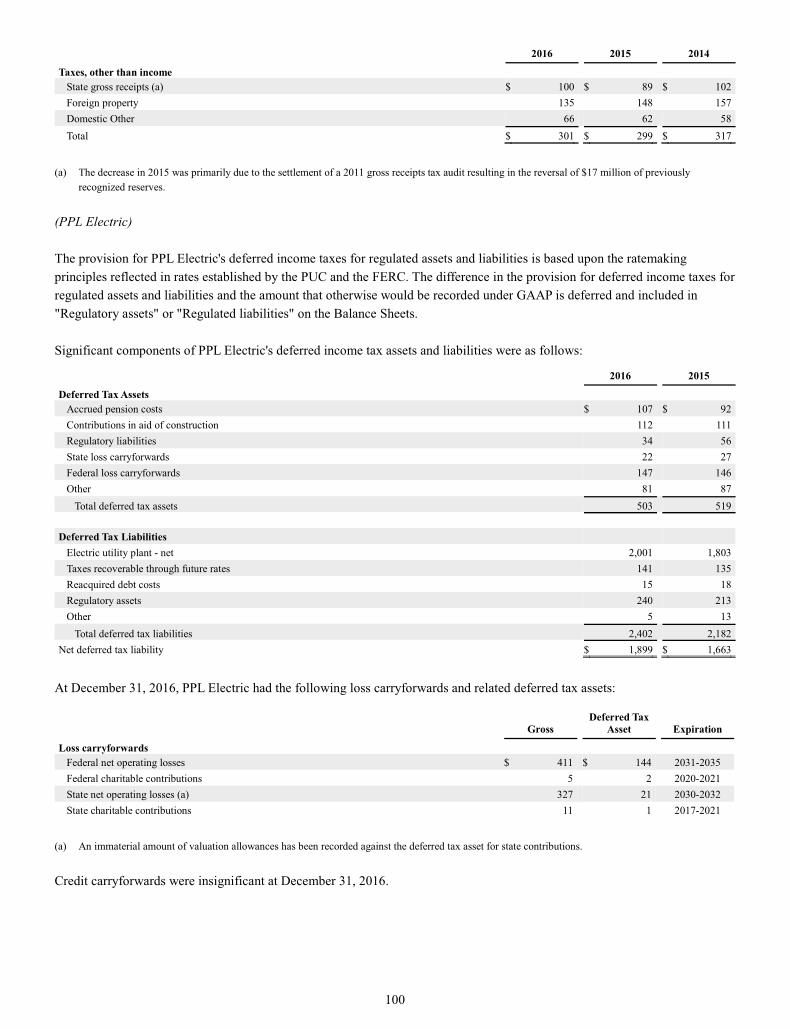
100
2016 2015 2014
Taxes, other than income State gross receipts (a) $ 100 $ 89 $ 102 Foreign property 135 148 157 Domestic Other 66 62 58 Total $ 301 $ 299 $ 317
(a) The decrease in 2015 was primarily due to the settlement of a 2011 gross receipts tax audit resulting in the reversal of $17 million of previously
recognized reserves. (PPL Electric) The provision for PPL Electric's deferred income taxes for regulated assets and liabilities is based upon the ratemaking principles reflected in rates established by the PUC and the FERC. The difference in the provision for deferred income taxes for regulated assets and liabilities and the amount that otherwise would be recorded under GAAP is deferred and included in "Regulatory assets" or "Regulated liabilities" on the Balance Sheets. Significant components of PPL Electric's deferred income tax assets and liabilities were as follows:
2016 2015
Deferred Tax Assets Accrued pension costs $ 107 $ 92 Contributions in aid of construction 112 111 Regulatory liabilities 34 56 State loss carryforwards 22 27 Federal loss carryforwards 147 146 Other 81 87
Total deferred tax assets 503 519 Deferred Tax Liabilities
Electric utility plant - net 2,001 1,803 Taxes recoverable through future rates 141 135 Reacquired debt costs 15 18 Regulatory assets 240 213 Other 5 13
Total deferred tax liabilities 2,402 2,182 Net deferred tax liability $ 1,899 $ 1,663
At December 31, 2016, PPL Electric had the following loss carryforwards and related deferred tax assets:
Gross Deferred Tax
Asset Expiration
Loss carryforwards Federal net operating losses $ 411 $ 144 2031-2035 Federal charitable contributions 5 2 2020-2021 State net operating losses (a) 327 21 2030-2032 State charitable contributions 11 1 2017-2021
(a) An immaterial amount of valuation allowances has been recorded against the deferred tax asset for state contributions. Credit carryforwards were insignificant at December 31, 2016.

101
Details of the components of income tax expense, a reconciliation of federal income taxes derived from statutory tax rates applied to "Income Before Income Taxes" to income taxes for reporting purposes, and details of "Taxes, other than income" were as follows.
2016 2015 2014
Income Tax Expense (Benefit) Current - Federal $ (29 ) $ (80 ) $ 60 Current - State 19 23 15
Total Current Expense (Benefit) (10) (57 ) 75 Deferred - Federal 193 287 70 Deferred - State 29 12 16
Total Deferred Expense, excluding operating loss carryforwards 222 299 86 Amortization of investment tax credit — — (1 ) Tax expense (benefit) of operating loss carryforwards
Deferred - Federal — (75 ) — Deferred - State — (3 ) —
Total Tax Expense (Benefit) of Operating Loss Carryforwards — (78 ) — Total income tax expense $ 212 $ 164 $ 160
Total income tax expense - Federal $ 164 $ 132 $ 129 Total income tax expense - State 48 32 31
Total income tax expense $ 212 $ 164 $ 160 2016 2015 2014
Reconciliation of Income Taxes Federal income tax on Income Before Income Taxes at statutory tax rate - 35% $ 193 $ 146 $ 148
Increase (decrease) due to: State income taxes, net of federal income tax benefit 36 25 22 Depreciation not normalized (8) (4 ) (6 ) Stock-based compensation (a) (6) — — Other (3) (3 ) (4 )
Total increase (decrease) 19 18 12 Total income tax expense $ 212 $ 164 $ 160 Effective income tax rate 38.4% 39.4 % 37.8 %
(a) During 2016, PPL recorded lower income tax expense related to the application of new stock-based compensation accounting guidance. See Note 1 for
additional information.
2016 2015 2014
Taxes, other than income State gross receipts (a) $ 100 $ 89 $ 102 Property and other 5 5 5
Total $ 105 $ 94 $ 107 (a) The decrease in 2015 was primarily due to the settlement of a 2011 gross receipts tax audit resulting in the reversal of $17 million of previously
recognized reserves. (LKE) The provision for LKE's deferred income taxes for regulated assets and liabilities is based upon the ratemaking principles reflected in rates established by the KPSC, VSCC and the FERC. The difference in the provision for deferred income taxes for regulated assets and liabilities and the amount that otherwise would be recorded under GAAP is deferred and included in "Regulatory assets" or "Regulatory liabilities" on the Balance Sheets.
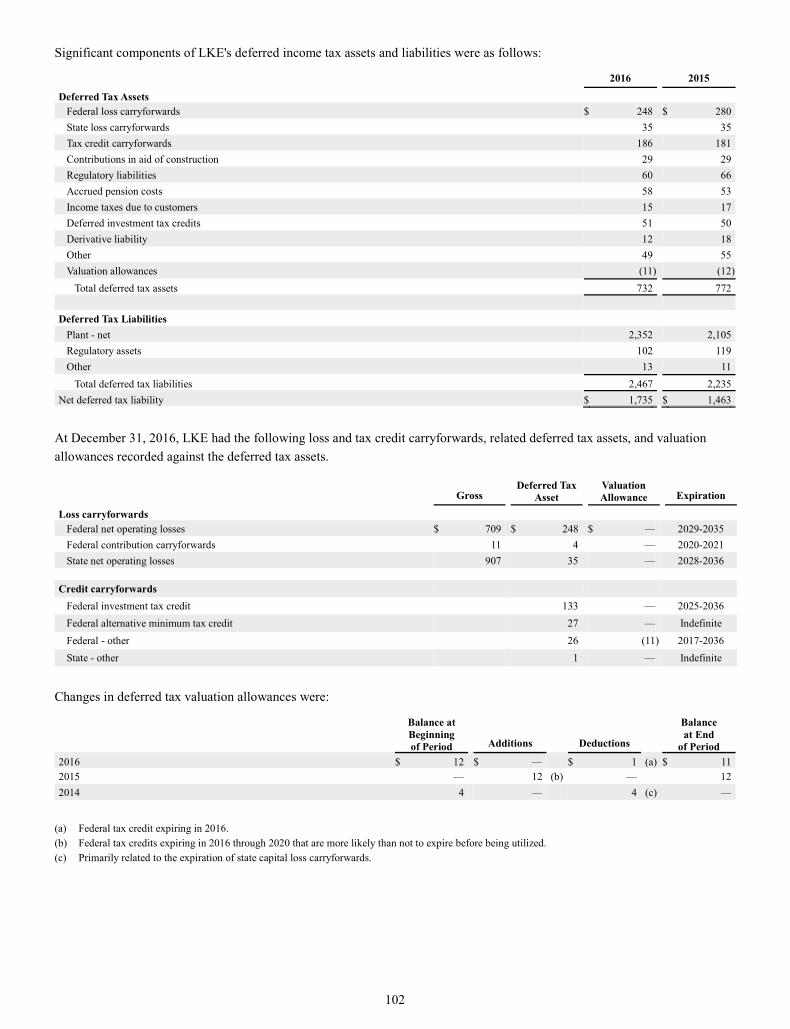
102
Significant components of LKE's deferred income tax assets and liabilities were as follows:
2016 2015
Deferred Tax Assets Federal loss carryforwards $ 248 $ 280 State loss carryforwards 35 35 Tax credit carryforwards 186 181 Contributions in aid of construction 29 29 Regulatory liabilities 60 66 Accrued pension costs 58 53 Income taxes due to customers 15 17 Deferred investment tax credits 51 50 Derivative liability 12 18 Other 49 55 Valuation allowances (11 ) (12 )
Total deferred tax assets 732 772 Deferred Tax Liabilities
Plant - net 2,352 2,105 Regulatory assets 102 119 Other 13 11
Total deferred tax liabilities 2,467 2,235 Net deferred tax liability $ 1,735 $ 1,463
At December 31, 2016, LKE had the following loss and tax credit carryforwards, related deferred tax assets, and valuation allowances recorded against the deferred tax assets.
Gross Deferred Tax
Asset Valuation Allowance Expiration
Loss carryforwards Federal net operating losses $ 709 $ 248 $ — 2029-2035 Federal contribution carryforwards 11 4 — 2020-2021 State net operating losses 907 35 — 2028-2036
Credit carryforwards
Federal investment tax credit 133 — 2025-2036 Federal alternative minimum tax credit 27 — Indefinite Federal - other 26 (11 ) 2017-2036 State - other 1 — Indefinite
Changes in deferred tax valuation allowances were:
Balance at Beginning of Period Additions Deductions
Balance at End
of Period 2016 $ 12 $ — $ 1 (a) $ 11 2015 — 12 (b) — 12 2014 4 — 4 (c) —
(a) Federal tax credit expiring in 2016. (b) Federal tax credits expiring in 2016 through 2020 that are more likely than not to expire before being utilized. (c) Primarily related to the expiration of state capital loss carryforwards.

103
Details of the components of income tax expense, a reconciliation of federal income taxes derived from statutory tax rates applied to "Income from Continuing Operations Before Income Taxes" to income taxes for reporting purposes, and details of "Taxes, other than income" were:
2016 2015 2014
Income Tax Expense (Benefit) Current - Federal $ (36 ) $ 2 $ (247 ) Current - State 1 1 8
Total Current Expense (Benefit) (35) 3 (239 ) Deferred - Federal 248 405 437 Deferred - State 38 32 23
Total Deferred Expense, excluding benefits of operating loss carryforwards 286 437 460 Amortization of investment tax credit - Federal (3) (3 ) (4 ) Tax benefit of operating loss carryforwards
Deferred - Federal 10 (198 ) (8 ) Deferred - State (1) — —
Total Tax Expense (Benefit) of Operating Loss Carryforwards 9 (198 ) (8 ) Total income tax expense from continuing operations (a) $ 257 $ 239 $ 209
Total income tax expense - Federal $ 219 $ 206 $ 178 Total income tax expense - State 38 33 31
Total income tax expense from continuing operations (a) $ 257 $ 239 $ 209 (a) Excludes current and deferred federal and state tax expense (benefit) recorded to Discontinued Operations of less than $1 million in 2016, 2015 and 2014.
Also, excludes deferred federal and state tax expense (benefit) recorded to OCI of $(16) million in 2016, less than $(1) million in 2015 and $(36) million in 2014.
2016 2015 2014
Reconciliation of Income Taxes Federal income tax on Income Before Income Taxes at statutory tax rate - 35% $ 240 $ 211 $ 194
Increase (decrease) due to: State income taxes, net of federal income tax benefit 25 22 20 Amortization of investment tax credit (3) (3 ) (4 ) Valuation allowance adjustment (a) — 12 — Stock-based compensation (b) (3) — — Other (2) (3 ) (1 )
Total increase 17 28 15 Total income tax expense $ 257 $ 239 $ 209 Effective income tax rate 37.5% 39.6 % 37.8 %
(a) Represents a valuation allowance against tax credits expiring through 2020 that are more likely than not to expire before being utilized. (b) During 2016, LKE recorded lower income tax expense related to the application of new stock-based compensation accounting guidance. See Note 1 for
additional information.
2016 2015 2014
Taxes, other than income Property and other $ 62 $ 57 $ 52
Total $ 62 $ 57 $ 52 (LG&E) The provision for LG&E's deferred income taxes for regulated assets and liabilities is based upon the ratemaking principles reflected in rates established by the KPSC and the FERC. The difference in the provision for deferred income taxes for regulated assets and liabilities and the amount that otherwise would be recorded under GAAP is deferred and included in "Regulatory assets" or "Regulatory liabilities" on the Balance Sheets.
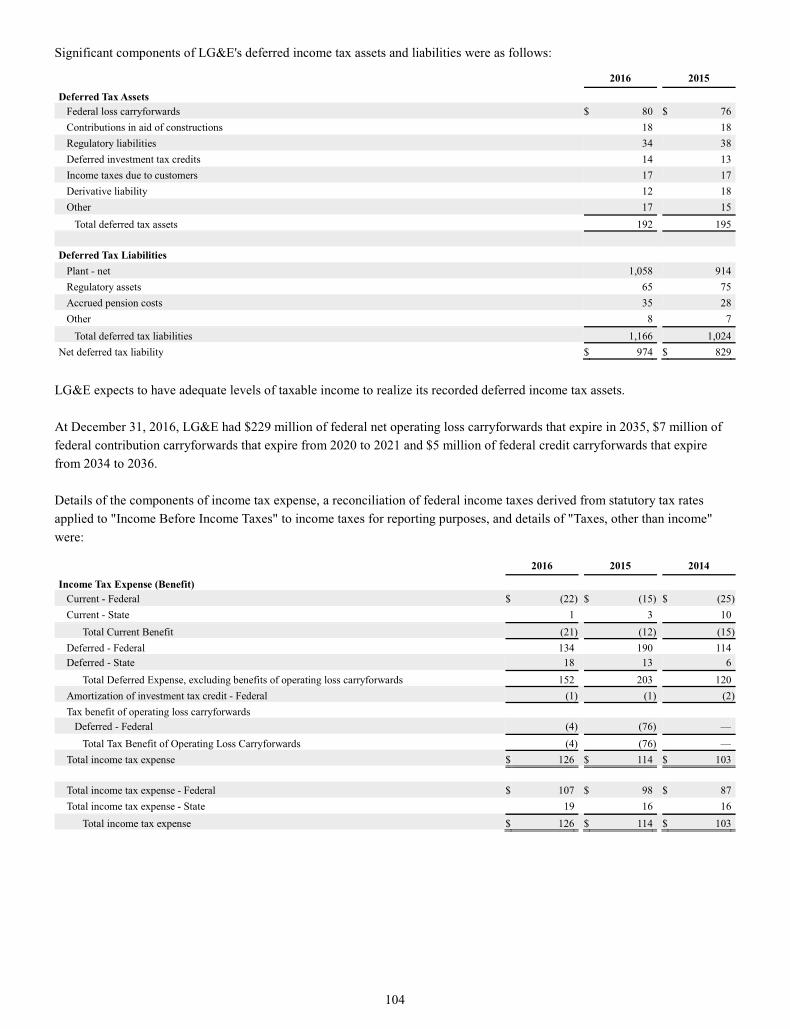
104
Significant components of LG&E's deferred income tax assets and liabilities were as follows:
2016 2015
Deferred Tax Assets Federal loss carryforwards $ 80 $ 76 Contributions in aid of constructions 18 18 Regulatory liabilities 34 38 Deferred investment tax credits 14 13 Income taxes due to customers 17 17 Derivative liability 12 18 Other 17 15
Total deferred tax assets 192 195
Deferred Tax Liabilities Plant - net 1,058 914 Regulatory assets 65 75 Accrued pension costs 35 28 Other 8 7
Total deferred tax liabilities 1,166 1,024 Net deferred tax liability $ 974 $ 829
LG&E expects to have adequate levels of taxable income to realize its recorded deferred income tax assets. At December 31, 2016, LG&E had $229 million of federal net operating loss carryforwards that expire in 2035, $7 million of federal contribution carryforwards that expire from 2020 to 2021 and $5 million of federal credit carryforwards that expire from 2034 to 2036. Details of the components of income tax expense, a reconciliation of federal income taxes derived from statutory tax rates applied to "Income Before Income Taxes" to income taxes for reporting purposes, and details of "Taxes, other than income" were:
2016 2015 2014
Income Tax Expense (Benefit) Current - Federal $ (22 ) $ (15 ) $ (25 ) Current - State 1 3 10
Total Current Benefit (21) (12 ) (15 ) Deferred - Federal 134 190 114 Deferred - State 18 13 6
Total Deferred Expense, excluding benefits of operating loss carryforwards 152 203 120 Amortization of investment tax credit - Federal (1) (1 ) (2 ) Tax benefit of operating loss carryforwards
Deferred - Federal (4) (76 ) — Total Tax Benefit of Operating Loss Carryforwards (4) (76 ) —
Total income tax expense $ 126 $ 114 $ 103
Total income tax expense - Federal $ 107 $ 98 $ 87 Total income tax expense - State 19 16 16
Total income tax expense $ 126 $ 114 $ 103

105
2016 2015 2014
Reconciliation of Income Taxes Federal income tax on Income Before Income Taxes at
statutory tax rate - 35% $ 115 $ 105 $ 95 Increase (decrease) due to:
State income taxes, net of federal income tax benefit 12 11 10 Amortization of investment tax credit (1) (1 ) (2 ) Other — (1 ) —
Total increase 11 9 8 Total income tax expense $ 126 $ 114 $ 103 Effective income tax rate 38.3% 38.1 % 37.9 %
2016 2015 2014
Taxes, other than income Property and other $ 32 $ 28 $ 25
Total $ 32 $ 28 $ 25 (KU) The provision for KU's deferred income taxes for regulated assets and liabilities is based upon the ratemaking principles reflected in rates established by the KPSC, VSCC and the FERC. The difference in the provision for deferred income taxes for regulated assets and liabilities and the amount that otherwise would be recorded under GAAP is deferred and included in "Regulatory assets" or "Regulatory liabilities" on the Balance Sheets. Significant components of KU's deferred income tax assets and liabilities were as follows:
2016 2015
Deferred Tax Assets Federal loss carryforwards $ 79 $ 97 Contributions in aid of construction 11 11 Regulatory liabilities 26 28 Deferred investment tax credits 37 36 Other 11 7
Total deferred tax assets 164 179 Deferred Tax Liabilities
Plant - net 1,280 1,175 Regulatory assets 37 44 Accrued pension costs 12 4 Other 5 2
Total deferred tax liabilities 1,334 1,225 Net deferred tax liability $ 1,170 $ 1,046
KU expects to have adequate levels of taxable income to realize its recorded deferred income tax assets. At December 31, 2016, KU had $227 million of federal net operating loss carryforwards that expire in 2035 and $5 million of federal credit carryforwards that expire from 2034 to 2036.
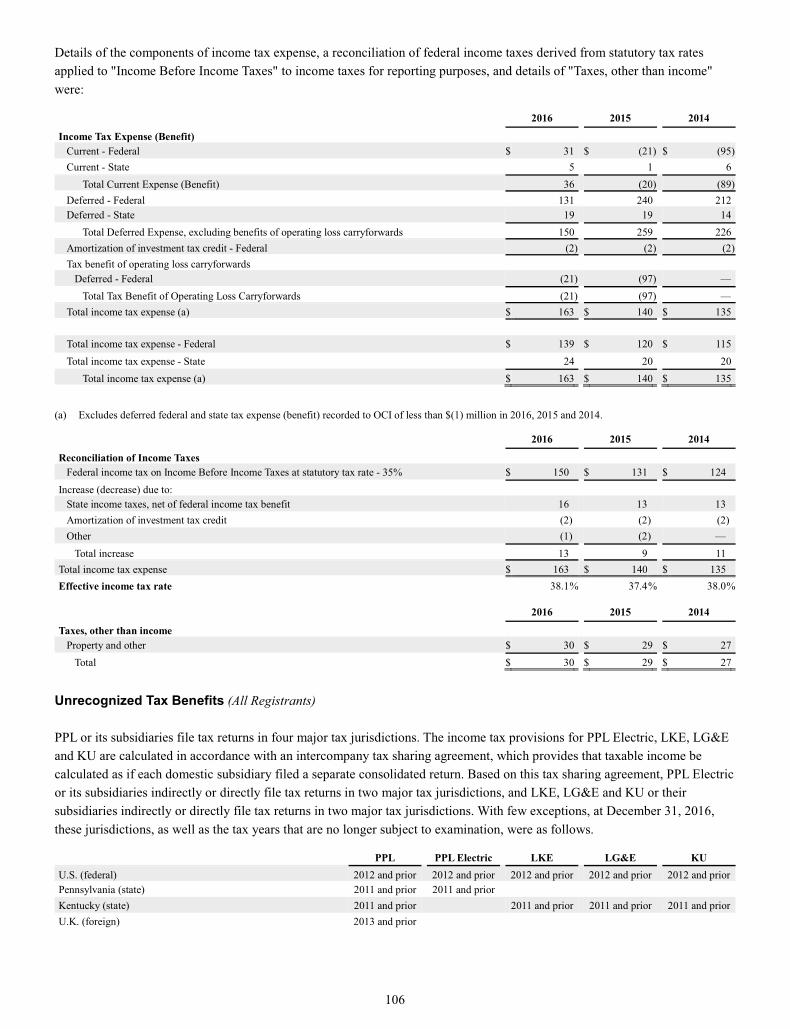
106
Details of the components of income tax expense, a reconciliation of federal income taxes derived from statutory tax rates applied to "Income Before Income Taxes" to income taxes for reporting purposes, and details of "Taxes, other than income" were:
2016 2015 2014
Income Tax Expense (Benefit) Current - Federal $ 31 $ (21 ) $ (95 ) Current - State 5 1 6
Total Current Expense (Benefit) 36 (20 ) (89 ) Deferred - Federal 131 240 212 Deferred - State 19 19 14
Total Deferred Expense, excluding benefits of operating loss carryforwards 150 259 226 Amortization of investment tax credit - Federal (2) (2 ) (2 ) Tax benefit of operating loss carryforwards
Deferred - Federal (21) (97 ) — Total Tax Benefit of Operating Loss Carryforwards (21) (97 ) —
Total income tax expense (a) $ 163 $ 140 $ 135 Total income tax expense - Federal $ 139 $ 120 $ 115 Total income tax expense - State 24 20 20
Total income tax expense (a) $ 163 $ 140 $ 135 (a) Excludes deferred federal and state tax expense (benefit) recorded to OCI of less than $(1) million in 2016, 2015 and 2014.
2016 2015 2014
Reconciliation of Income Taxes Federal income tax on Income Before Income Taxes at statutory tax rate - 35% $ 150 $ 131 $ 124
Increase (decrease) due to: State income taxes, net of federal income tax benefit 16 13 13 Amortization of investment tax credit (2) (2 ) (2 ) Other (1) (2 ) —
Total increase 13 9 11 Total income tax expense $ 163 $ 140 $ 135 Effective income tax rate 38.1% 37.4 % 38.0 %
2016 2015 2014
Taxes, other than income Property and other $ 30 $ 29 $ 27
Total $ 30 $ 29 $ 27 Unrecognized Tax Benefits (All Registrants) PPL or its subsidiaries file tax returns in four major tax jurisdictions. The income tax provisions for PPL Electric, LKE, LG&E and KU are calculated in accordance with an intercompany tax sharing agreement, which provides that taxable income be calculated as if each domestic subsidiary filed a separate consolidated return. Based on this tax sharing agreement, PPL Electric or its subsidiaries indirectly or directly file tax returns in two major tax jurisdictions, and LKE, LG&E and KU or their subsidiaries indirectly or directly file tax returns in two major tax jurisdictions. With few exceptions, at December 31, 2016, these jurisdictions, as well as the tax years that are no longer subject to examination, were as follows.
PPL PPL Electric LKE LG&E KU U.S. (federal) 2012 and prior 2012 and prior 2012 and prior 2012 and prior 2012 and prior Pennsylvania (state) 2011 and prior 2011 and prior Kentucky (state) 2011 and prior 2011 and prior 2011 and prior 2011 and prior U.K. (foreign) 2013 and prior

107
Other (PPL) In 2015, PPL recorded a tax benefit of $24 million, related to the settlement of the IRS audit for tax years 1998-2011. Of this amount, $12 million is reflected in continuing operations. PPL finalized the settlement of interest in 2016 and recorded an additional $3 million tax benefit. 6. Utility Rate Regulation Regulatory Assets and Liabilities (All Registrants) PPL, PPL Electric, LKE, LG&E and KU reflect the effects of regulatory actions in the financial statements for their cost-based rate-regulated utility operations. Regulatory assets and liabilities are classified as current if, upon initial recognition, the entire amount related to that item will be recovered or refunded within a year of the balance sheet date. WPD is not subject to accounting for the effects of certain types of regulation as prescribed by GAAP and does not record regulatory assets and liabilities. See Note 1 for additional information. (PPL, LKE, LG&E and KU) LG&E is subject to the jurisdiction of the KPSC and FERC, and KU is subject to the jurisdiction of the KPSC, FERC and VSCC. LG&E's and KU's Kentucky base rates are calculated based on a return on capitalization (common equity, long-term debt and short-term debt) including adjustments for certain net investments and costs recovered separately through other means. As such, LG&E and KU generally earn a return on regulatory assets. As a result of purchase accounting requirements, certain fair value amounts related to contracts that had favorable or unfavorable terms relative to market were recorded on the Balance Sheets with an offsetting regulatory asset or liability. LG&E and KU recover in customer rates the cost of coal contracts, power purchases and emission allowances. As a result, management believes the regulatory assets and liabilities created to offset the fair value amounts at LKE's acquisition date meet the recognition criteria established by existing accounting guidance and eliminate any rate-making impact of the fair value adjustments. LG&E's and KU's customer rates continue to reflect the original contracted prices for remaining contracts. (PPL, LKE and KU) KU's Virginia base rates are calculated based on a return on rate base (net utility plant plus working capital less deferred taxes and miscellaneous deductions). All regulatory assets and liabilities, except the levelized fuel factor, are excluded from the return on rate base utilized in the calculation of Virginia base rates. Therefore, no return is earned on the related assets. KU's rates to municipal customers for wholesale requirements are calculated based on annual updates to a rate formula that utilizes a return on rate base (net utility plant plus working capital less deferred taxes and miscellaneous deductions). All regulatory assets and liabilities are excluded from the return on rate base utilized in the development of municipal rates. Therefore, no return is earned on the related assets. (PPL and PPL Electric) PPL Electric's distribution base rates are calculated based on recovery of costs as well as a return on distribution rate base (net utility plant plus a working capital allowance less plant-related deferred taxes and other miscellaneous additions and deductions). PPL Electric's transmission revenues are billed in accordance with a FERC tariff that allows for recovery of

108
transmission costs incurred, a return on transmission-related rate base (net utility plant plus a working capital allowance less plant-related deferred taxes and other miscellaneous additions and deductions) and an automatic annual update. See "Transmission Formula Rate" below for additional information on this tariff. All regulatory assets and liabilities are excluded from distribution and transmission return on investment calculations; therefore, generally no return is earned on PPL Electric's regulatory assets. (All Registrants) The following table provides information about the regulatory assets and liabilities of cost-based rate-regulated utility operations at December 31,:
PPL PPL Electric
2016 2015 2016 2015 Current Regulatory Assets:
Environmental cost recovery $ 6 $ 24 $ — $ — Generation formula rate 11 7 — — Transmission service charge 7 10 7 10 Smart meter rider 6 2 6 2 Storm costs 5 — 5 — Other 4 5 1 1
Total current regulatory assets (a) $ 39 $ 48 $ 19 $ 13
Noncurrent Regulatory Assets: Defined benefit plans $ 947 $ 809 $ 549 $ 469 Taxes recoverable through future rates 340 326 340 326 Storm costs 57 93 9 30 Unamortized loss on debt 61 68 36 42 Interest rate swaps 129 141 — — Accumulated cost of removal of utility plant 159 137 159 137 AROs 211 143 — — Other 14 16 1 2
Total noncurrent regulatory assets $ 1,918 $ 1,733 $ 1,094 $ 1,006 Current Regulatory Liabilities:
Generation supply charge $ 23 $ 41 $ 23 $ 41 Demand side management 3 8 — — Gas supply clause — 6 — — Universal service rider 14 5 14 5 Transmission formula rate 15 48 15 48 Fuel adjustment clause 11 14 — — Act 129 compliance rider 17 — 17 — Storm damage expense 13 16 13 16 Other 5 7 1 3
Total current regulatory liabilities $ 101 $ 145 $ 83 $ 113 Noncurrent Regulatory Liabilities:
Accumulated cost of removal of utility plant $ 700 $ 691 $ — $ — Coal contracts (b) — 17 — — Power purchase agreement - OVEC (b) 75 83 — — Net deferred tax assets 23 23 — — Act 129 compliance rider — 22 — 22 Defined benefit plans 23 24 — — Interest rate swaps 78 82 — — Other — 3 — —
Total noncurrent regulatory liabilities $ 899 $ 945 $ — $ 22

109
LKE LG&E KU
2016 2015 2016 2015 2016 2015 Current Regulatory Assets:
Environmental cost recovery $ 6 $ 24 $ 6 $ 13 $ — $ 11 Generation formula rate 11 7 — — 11 7 Other 3 4 3 3 — 1
Total current regulatory assets $ 20 $ 35 $ 9 $ 16 $ 11 $ 19
Noncurrent Regulatory Assets: Defined benefit plans $ 398 $ 340 $ 246 $ 215 $ 152 $ 125 Storm costs 48 63 26 35 22 28 Unamortized loss on debt 25 26 16 17 9 9 Interest rate swaps 129 141 88 98 41 43 AROs 211 143 70 57 141 86 Plant retirement costs 4 6 — — 4 6 Other 9 8 4 2 5 6
Total noncurrent regulatory assets $ 824 $ 727 $ 450 $ 424 $ 374 $ 303 Current Regulatory Liabilities:
Demand side management $ 3 $ 8 $ 2 $ 4 $ 1 $ 4 Gas supply clause — 6 — 6 — — Fuel adjustment clause 11 14 2 2 9 12 Other 4 4 1 1 3 3
Total current regulatory liabilities $ 18 $ 32 $ 5 $ 13 $ 13 $ 19 Noncurrent Regulatory Liabilities:
Accumulated cost of removal of utility plant $ 700 $ 691 $ 305 $ 301 $ 395 $ 390
Coal contracts (b) — 17 — 7 — 10 Power purchase agreement - OVEC (b) 75 83 52 57 23 26 Net deferred tax assets 23 23 23 23 — — Defined benefit plans 23 24 — — 23 24 Interest rate swaps 78 82 39 41 39 41 Other — 3 — 2 — 1
Total noncurrent regulatory liabilities $ 899 $ 923 $ 419 $ 431 $ 480 $ 492 (a) For PPL, these amounts are included in "Other current assets" on the Balance Sheets. (b) These liabilities were recorded as offsets to certain intangible assets that were recorded at fair value upon the acquisition of LKE by PPL. Following is an overview of selected regulatory assets and liabilities detailed in the preceding tables. Specific developments with respect to certain of these regulatory assets and liabilities are discussed in "Regulatory Matters." Defined Benefit Plans (All Registrants) Defined benefit plan regulatory assets and liabilities represent the portion of unrecognized transition obligation, prior service cost and net actuarial gains and losses that will be recovered in defined benefit plans expense through future base rates based upon established regulatory practices and, generally, are amortized over the average remaining service lives of plan participants. These regulatory assets and liabilities are adjusted at least annually or whenever the funded status of defined benefit plans is re-measured. Of the regulatory asset and liability balances recorded, costs of $58 million for PPL, $25 million for PPL Electric, $33 million for LKE, $22 million for LG&E and $11 million for KU, are expected to be amortized into net periodic defined benefit costs in 2017 in accordance with PPL's, PPL Electric's, LKE's, LG&E's and KU's pension accounting policy.

110
(PPL, LKE, LG&E and KU) As a result of the 2014 Kentucky rate case settlement that became effective July 1, 2015, the difference between pension cost calculated in accordance with LG&E's and KU's pension accounting policy and pension cost calculated using a 15-year amortization period for actuarial gains and losses is recorded as a regulatory asset. As of December 31, 2016, the balances were $20 million for PPL and LKE, $11 million for LG&E and $9 million for KU. Of the costs expected to be amortized into net periodic defined benefit costs in 2017, $14 million for PPL and LKE, $8 million for LG&E and $6 million for KU, are expected to be recorded as a regulatory asset in 2017. (All Registrants) Storm Costs PPL Electric, LG&E and KU have the ability to request from the PUC, KPSC and VSCC, as applicable, the authority to treat expenses related to specific extraordinary storms as a regulatory asset and defer such costs for regulatory accounting and reporting purposes. Once such authority is granted, LG&E and KU can request recovery of those expenses in a base rate case and begin amortizing the costs when recovery starts. PPL Electric can recover qualifying expenses caused by major storm events, as defined in its retail tariff, over three years through the Storm Damage Expense Rider commencing in the application year after the storm occurred. PPL Electric's, LG&E's and KU's regulatory assets for storm costs are being amortized through various dates ending in 2020. Unamortized Loss on Debt Unamortized loss on reacquired debt represents losses on long-term debt reacquired or redeemed that have been deferred and will be amortized and recovered over either the original life of the extinguished debt or the life of the replacement debt (in the case of refinancing). Such costs are being amortized through 2029 for PPL Electric, through 2042 for KU, and through 2044 for PPL, LKE and LG&E. Accumulated Cost of Removal of Utility Plant LG&E and KU charge costs of removal through depreciation expense with an offsetting credit to a regulatory liability. The regulatory liability is relieved as costs are incurred. PPL Electric does not accrue for costs of removal. When costs of removal are incurred, PPL Electric records the costs as a regulatory asset. Such deferral is included in rates and amortized over the subsequent five-year period. (PPL and PPL Electric) Generation Supply Charge (GSC) The GSC is a cost recovery mechanism that permits PPL Electric to recover costs incurred to provide generation supply to PLR customers who receive basic generation supply service. The recovery includes charges for generation supply (energy and capacity and ancillary services), as well as administration of the acquisition process. In addition, the GSC contains a reconciliation mechanism whereby any over- or under-recovery from prior quarters is refunded to, or recovered from, customers through the adjustment factor determined for the subsequent rate filing period. Transmission Service Charge (TSC) PPL Electric is charged by PJM for transmission service-related costs applicable to its PLR customers. PPL Electric passes these costs on to customers, who receive basic generation supply service through the PUC-approved TSC cost recovery
111
mechanism. The TSC contains a reconciliation mechanism whereby any over- or under-recovery from customers is either refunded to, or recovered from, customers through the adjustment factor determined for the subsequent year. Transmission Formula Rate PPL Electric's transmission revenues are billed in accordance with a FERC-approved Open Access Transmission Tariff that utilizes a formula-based rate recovery mechanism. Under this formula, rates are put into effect in June of each year based upon prior year actual expenditures and current year forecasted capital additions. Rates are then adjusted the following year to reflect actual annual expenses and capital additions, as reported in PPL Electric's annual FERC Form 1, filed under the FERC's Uniform System of Accounts. Any difference between the revenue requirement in effect for the prior year and actual expenditures incurred for that year is recorded as a regulatory asset or regulatory liability. Storm Damage Expense Rider (SDER) The SDER is a reconcilable automatic adjustment clause under which PPL Electric annually will compare actual storm costs to storm costs allowed in base rates and refund or recover any differences from customers. In the 2015 rate case settlement approved by the PUC in November 2015, it was determined that reportable storm damage expenses to be recovered annually through base rates will be set at $15 million. The SDER will recover from or refund to customers, as appropriate, only applicable expenses from reportable storms that are greater than or less than $15 million recovered annually through base rates. Beginning January 1, 2018, the amortized 2011 storm expense of $5 million will be included in the base rate component of the SDER. Taxes Recoverable through Future Rates Taxes recoverable through future rates represent the portion of future income taxes that will be recovered through future rates based upon established regulatory practices. Accordingly, this regulatory asset is recognized when the offsetting deferred tax liability is recognized. For general-purpose financial reporting, this regulatory asset and the deferred tax liability are not offset; rather, each is displayed separately. This regulatory asset is expected to be recovered over the period that the underlying book-tax timing differences reverse and the actual cash taxes are incurred. Act 129 Compliance Rider In compliance with Pennsylvania's Act 129 of 2008 and implementing regulations, Phase I of PPL Electric's energy efficiency and conservation plan was approved by a PUC order in October 2009. The order allowed PPL Electric to recover the maximum $250 million cost of the program ratably over the life of the plan, from January 1, 2010 through May 31, 2013. Phase II of PPL's energy efficiency and conservation plan allowed PPL Electric to recover the maximum $185 million cost of the program over the three year period June 1, 2013 through May 31, 2016. Phase III of PPL's energy efficiency and conservation plan allows PPL Electric to recover the maximum $313 million over the next five year period, June 1, 2016 through May 31, 2021. The plan includes programs intended to reduce electricity consumption. The recoverable costs include direct and indirect charges, including design and development costs, general and administrative costs and applicable state evaluator costs. The rates are applied to customers who receive distribution service through the Act 129 Compliance Rider. The Phase II program costs were reconciled at the end of the program and any remaining over- or under-recovery was rolled into Phase III. The actual Phase III program costs are reconcilable after each 12 month period, and any over- or under-recovery from customers will be refunded or recovered over the next rate filing period. See below under "Regulatory Matters - Pennsylvania Activities" for additional information on Act 129. Smart Meter Rider (SMR) Act 129 also requires installation of smart meters for new construction, upon the request of consumers and at their cost, or on a depreciation schedule not exceeding 15 years. Under Act 129, EDCs are able to recover the costs of providing smart metering technology. All of PPL Electric's metered customers currently have advanced meters installed at their service locations capable

112
of many of the functions required under Act 129. PPL Electric conducted pilot projects and technical evaluations of its current advanced metering technology and concluded that the current technology does not meet all of the requirements of Act 129. In June 2014, PPL Electric filed a plan with the PUC to replace its current meters with new meters that meet the Act 129 requirements by the end of 2019. The SMR contains a reconciliation mechanism whereby any over- or under-recovery from prior years is refunded to, or recovered from, customers through the adjustment factor determined for the subsequent quarters. Universal Service Rider (USR) The USR provides for recovery of costs associated with universal service programs, OnTrack and Winter Relief Assistance Program (WRAP), provided by PPL Electric to residential customers. OnTrack is a special payment program for low-income households and WRAP provides low-income customers a means to reduce electric bills through energy saving methods. The USR rate is applied to residential customers who receive distribution service. The actual program costs are reconcilable, and any over- or under-recovery from customers will be refunded or recovered annually in the subsequent year. (PPL, LKE, LG&E and KU) Environmental Cost Recovery Kentucky law permits LG&E and KU to recover the costs, including a return of operating expenses and a return of and on capital invested, of complying with the Clean Air Act and those federal, state or local environmental requirements, which apply to coal combustion wastes and by-products from coal-fired electricity generating facilities. The KPSC requires reviews of the past operations of the environmental surcharge for six-month and two-year billing periods to evaluate the related charges, credits and rates of return, as well as to provide for the roll-in of ECR amounts to base rates each two-year period. As a result of the 2014 Kentucky rate case settlement that became effective July 1, 2015, LG&E and KU were authorized to earn a 10% return on equity for all existing ECR plans. On August 8, 2016, the KPSC issued an order establishing a 9.8% authorized return on equity for the 2016 plan projects that pertain to the handling of coal combustion byproducts and MATS. The ECR regulatory asset or liability represents the amount that has been under- or over-recovered due to timing or adjustments to the mechanism and is typically recovered within 12 months. Fuel Adjustment Clauses LG&E's and KU's retail electric rates contain a fuel adjustment clause, whereby variances in the cost of fuel to generate electricity, including transportation costs, from the costs embedded in base rates are adjusted in LG&E's and KU's rates. The KPSC requires public hearings at six-month intervals to examine past fuel adjustments and at two-year intervals to review past operations of the fuel adjustment clause and, to the extent appropriate, reestablish the fuel charge included in base rates. The regulatory assets or liabilities represent the amounts that have been under- or over-recovered due to timing or adjustments to the mechanism and are typically recovered within 12 months. KU also employs a levelized fuel factor mechanism for Virginia customers using an average fuel cost factor based primarily on projected fuel costs. The Virginia levelized fuel factor allows fuel recovery based on projected fuel costs for the coming year plus an adjustment for any under- or over-recovery of fuel expenses from the prior year. The regulatory assets or liabilities represent the amounts that have been under- or over-recovered due to timing or adjustments to the mechanism and are typically recovered within 12 months. Demand Side Management LG&E's and KU's DSM programs consist of energy efficiency programs, intended to reduce peak demand and delay investment in additional power plant construction, provide customers with tools and information to become better managers of their energy usage and prepare for potential future legislation governing energy efficiency. LG&E's and KU's rates contain a DSM provision, which includes a rate recovery mechanism that provides for concurrent recovery of DSM costs and incentives, and allows for the recovery of DSM revenues from lost sales associated with the DSM programs. Additionally, LG&E and KU earn

113
an approved return on equity for capital expenditures associated with the residential and commercial load management and demand conservation programs. The cost of DSM programs is assigned only to the class or classes of customers that benefit from the programs. AROs As discussed in Note 1, for LKE, LG&E and KU, all ARO accretion and depreciation expenses are reclassified as a regulatory asset. ARO regulatory assets associated with approved ECR projects for CCRs are amortized to expense over a period of 10 to 25 years based on retirement expenditures made related to the obligation. For other AROs, at the time of retirement, the related ARO regulatory asset is offset against the associated cost of removal regulatory liability, PP&E and ARO liability. Coal Contracts As a result of purchase accounting associated with PPL's acquisition of LKE, LG&E's and KU's coal contracts were recorded at fair value on the Balance Sheets with offsets to regulatory assets for those contracts with unfavorable terms relative to current market prices and offsets to regulatory liabilities for those contracts with favorable terms relative to current market prices. These regulatory assets and liabilities were amortized over the same terms as the related contracts, which expired at various times through 2016. Power Purchase Agreement - OVEC As a result of purchase accounting associated with PPL's acquisition of LKE, the fair values of the OVEC power purchase agreement were recorded on the balance sheets of LKE, LG&E and KU with offsets to regulatory liabilities. The regulatory liabilities are being amortized using the units-of-production method until March 2026, the expiration date of the agreement at the date of the acquisition. See Notes 1, 13 and 18 for additional discussion of the power purchase agreement. Regulatory Liability Associated with Net Deferred Tax Assets LG&E's and KU's regulatory liabilities associated with net deferred tax assets represent the future revenue impact from the reversal of deferred income taxes required primarily for unamortized investment tax credits. These regulatory liabilities are recognized when the offsetting deferred tax assets are recognized. Interest Rate Swaps Periodically, LG&E and KU enter into forward-starting interest rate swaps with PPL that have terms identical to forward-starting swaps entered into by PPL with third parties. Net realized gains and losses on all of these swaps are probable of recovery through regulated rates; as such, any gains and losses on these derivatives are included in regulatory assets or liabilities and will be recognized in "Interest Expense" on the Statements of Income over the life of the underlying debt at the time the underlying hedged interest expense is recorded. In September 2015, first mortgage bonds totaling $1.05 billion were issued (LG&E issued $550 million and KU issued $500 million) and all outstanding forward-starting interest rate swaps were terminated. Net cash settlements of $88 million were paid on the swaps that were terminated (LG&E and KU each paid $44 million). Net realized losses on these terminated swaps will be recovered through regulated rates. As such, the net settlements were recorded in regulatory assets and are being recognized in "Interest Expense" on the Statements of Income over the life of the new debt that matures in 2025 and 2045. There were no forward starting interest rate swaps outstanding at December 31, 2016. See Note 17 for additional information related to the forward-starting interest rate swaps. Net cash settlements of $86 million were received on forward starting interest rate swaps that were terminated in 2013 (LG&E and KU each received $43 million). Net realized gains on these terminated swaps will be returned through regulated rates. As such, the net settlements were recorded as regulatory liabilities and are being recognized in "Interest Expense" on the Statements of Income over the life of the associated debt that matures in 2043.

114
(PPL, LKE and LG&E) A net cash settlement of $9 million paid on a swap that was terminated by LG&E in December 2016 is included in “Cash Flows from Operating Activities” on the Statements of Cash Flows. The KPSC authorized the recording of a regulatory asset and the recovery of such costs is being sought in the current rate case filed in November 2016. In addition to the terminated interest rate swaps, realized amounts associated with LG&E's other interest rate swaps, including a swap contract terminated in 2008, are recoverable through rates based on an order from the KPSC. LG&E's unrealized losses and gains are recorded as a regulatory asset or liability until they are realized as interest expense. Interest expense from existing swaps is realized and recovered over the terms of the associated debt, which matures through 2033. Amortization of the loss related to the 2008 terminated swap contract, which is expensed to "Other operation and maintenance", is to be recovered through 2035. Gas Line Tracker The GLT authorizes LG&E to recover its incremental operating expenses, depreciation, property taxes and cost of capital, including a return on equity, for capital associated with the five year gas service riser, leak mitigation and customer service line ownership programs. As a result of the 2014 Kentucky rate case settlement, effective July 1, 2015, LG&E is authorized to earn a 10% return on equity for the GLT mechanism. As part of this program, LG&E makes necessary repairs to the gas distribution system and assumes ownership of service lines when replaced. In the 2016 rate case, LG&E has requested additional projects for recovery through the GLT mechanism related to further gas line replacements and transmission pipeline modernizations. LG&E annually files revised rates based on projected costs in October with rates effective on the first billing cycle in January. After the completion of a plan year, LG&E submits a balancing adjustment filing to the KPSC to amend rates charged for the differences between the actual costs and actual GLT charges for the preceding year. The regulatory assets or liabilities represent the amounts that have been under- or over-recovered due to these cost differences. Gas Supply Clause LG&E's natural gas rates contain a gas supply clause, whereby the expected cost of natural gas supply and variances between actual and expected costs from prior periods are adjusted quarterly in LG&E's rates, subject to approval by the KPSC. The gas supply clause also includes a separate natural gas procurement incentive mechanism, which allows LG&E's rates to be adjusted annually to share savings between the actual cost of gas purchases and market indices with the shareholders and the customers during each performance-based rate year (12 months ending October 31). The regulatory assets or liabilities represent the total amounts that have been under- or over-recovered due to timing or adjustments to the mechanisms and are typically recovered within 18 months. (PPL, LKE and KU) Plant Retirement Costs The 2014 Kentucky rate case settlement that became effective July 1, 2015, provided for deferred recovery of costs associated with Green River's remaining coal-fired generating units through their retirement date, which occurred in September 2015. These costs include inventory write-downs and separation benefits and are being amortized over three years.
115
Regulatory Matters (PPL) U.K. Activities RIIO-ED1 On April 1, 2015, the RIIO-ED1 eight-year price control period commenced for WPD's four DNOs. Ofgem Review of Line Loss Calculation In 2014, Ofgem issued its final decision on the DPCR4 line loss incentives and penalties mechanism. As a result, during 2014 WPD increased its liability by $65 million for over-recovery of line losses with a reduction to "Operating Revenues" on the Statement of Income. Other activity impacting the liability included reductions in the liability that has been included in tariffs and foreign exchange movements. WPD began refunding the liability to customers on April 1, 2015 and will continue through March 31, 2019. The liability at December 31, 2016 and 2015 was $26 million and $61 million. (PPL, LKE, LG&E and KU) Kentucky Activities Rate Case Proceedings On November 23, 2016, LG&E and KU filed requests with the KPSC for increases in annual base electricity rates of approximately $103 million at KU and an increase in annual base electricity and gas rates of approximately $94 million and $14 million at LG&E. The proposed base rate increases would result in an electricity rate increase of 6.4% at KU and electricity and gas rate increases of 8.5% and 4.2% at LG&E. New rates are expected to become effective on July 1, 2017. LG&E's and KU's applications include requests for CPCNs for implementing an Advanced Metering System and a Distribution Automation program. The applications are based on a forecasted test year of July 1, 2017 through June 30, 2018 and a requested return on equity of 10.23%. A number of parties have been granted intervention requests in the proceedings. Data discovery and the filing of written testimony will continue through April 2017. A public hearing on the applications is scheduled to commence on May 2, 2017. LG&E and KU cannot predict the outcome of these proceedings. CPCN and ECR Filings On August 8, 2016, the KPSC issued an order approving CPCNs and ECR rate treatment regarding environmental construction projects relating to the EPA's regulations addressing the handling of coal combustion by-products and MATS. The construction projects began in 2016 and are expected to continue through 2023. The KPSC order established a 9.8% authorized return on equity for these projects. Recovery of costs commenced with bills rendered on and after August 31, 2016. (LKE and LG&E) Gas Franchise LG&E’s gas franchise agreement for the Louisville/Jefferson County service area expired in March 2016. In August 2016, LG&E and Louisville/Jefferson County entered into a revised franchise agreement with a 5-year term (with renewal options). The franchise fee may be modified at Louisville/Jefferson County's election upon 60 days' notice. However, any franchise fee is capped at 3% of gross receipts for natural gas service within the franchise area. The agreement further provides that if the KPSC determines that the franchise fee should be recovered from LG&E's customers, the franchise fee shall revert to zero. In August 2016, LG&E filed an application in a KPSC proceeding to review and rule upon the recoverability of the franchise fee.

116
In August 2016, Louisville/Jefferson County submitted a motion to dismiss the proceeding filed by LG&E, and, in November 2016, filed an amended complaint against LG&E relating to these issues. LG&E submitted KPSC filings to respond to, request dismissal of and consolidate certain claims or aspects of the proceedings. In January 2017, the KPSC issued an order denying Louisville/Jefferson County's motion to dismiss, consolidating the matter with LG&E's filed application and establishing a procedural schedule for the case. Until the KPSC issues a final order in this proceeding, LG&E cannot predict the ultimate outcome of this matter but does not anticipate that it will have a material effect on its financial condition or results of operation. LG&E continues to provide gas service to customers in this franchise area at existing rates, but without collecting or remitting a franchise fee. (PPL and PPL Electric) Pennsylvania Activities Rate Case Proceeding On March 31, 2015, PPL Electric filed a request with the PUC for an increase in its annual distribution revenue requirement of approximately $168 million. The application was based on a fully projected future test year of January 1, 2016 through December 31, 2016. On September 3, 2015, PPL Electric filed with the PUC Administrative Law Judge a petition for approval of a settlement agreement under which PPL Electric would be permitted to increase its annual distribution rates by $124 million, effective January 1, 2016. On November 19, 2015, the PUC entered a final order adopting the Administrative Law Judge's recommended decision. The new rates became effective January 1, 2016. Act 129 Act 129 requires Pennsylvania Electric Distribution Companies (EDCs) to meet, by specified dates, specified goals for reduction in customer electricity usage and peak demand. EDCs not meeting the requirements of Act 129 are subject to significant penalties. In November 2015, PPL Electric filed with the PUC its Act 129 Phase III Energy Efficiency and Conservation Plan for the period June 1, 2016 through May 31, 2021. In June 2016, the PUC approved PPL Electric's Phase III Plan, allowing PPL Electric to implement its energy efficiency and demand response programs and recover, through the Act 129 compliance rider, the $313 million cost of the programs over the five-year period June 1, 2016 through May 31, 2021. Act 129 also requires Default Service Providers (DSP) to provide electricity generation supply service to customers pursuant to a PUC-approved default service procurement plan through auctions, requests for proposal and bilateral contracts at the sole discretion of the DSP. Act 129 requires a mix of spot market purchases, short-term contracts and long-term contracts (4 to 20 years), with long-term contracts limited to 25% of load unless otherwise approved by the PUC. A DSP is able to recover the costs associated with its default service procurement plan. PPL Electric has received PUC approval of its biannual DSP procurement plans for all prior periods required under Act 129. In January 2016, PPL Electric filed a Petition for Approval of a new DSP procurement plan with the PUC for the period June 1, 2017 through May 31, 2021. The parties to the proceeding reached a settlement on all but one issue, and a partial settlement agreement and briefs on the open issue were submitted to the Administrative Law Judge (ALJ) in July 2016. In August 2016, the ALJ issued an initial decision, and certain parties filed exceptions and reply exceptions. In October 2016, the PUC issued an order approving the partial settlement agreement and adopting the initial decision with minor modifications. In November 2016, Retail Electric Supply Association (RESA) filed a Petition for Reconsideration of the portion of the October 2016 order that approved the Customer Assistance Program Standard Offer Referral Program. In January 2017, the PUC issued an order denying RESA's Petition for Reconsideration and closing the record.
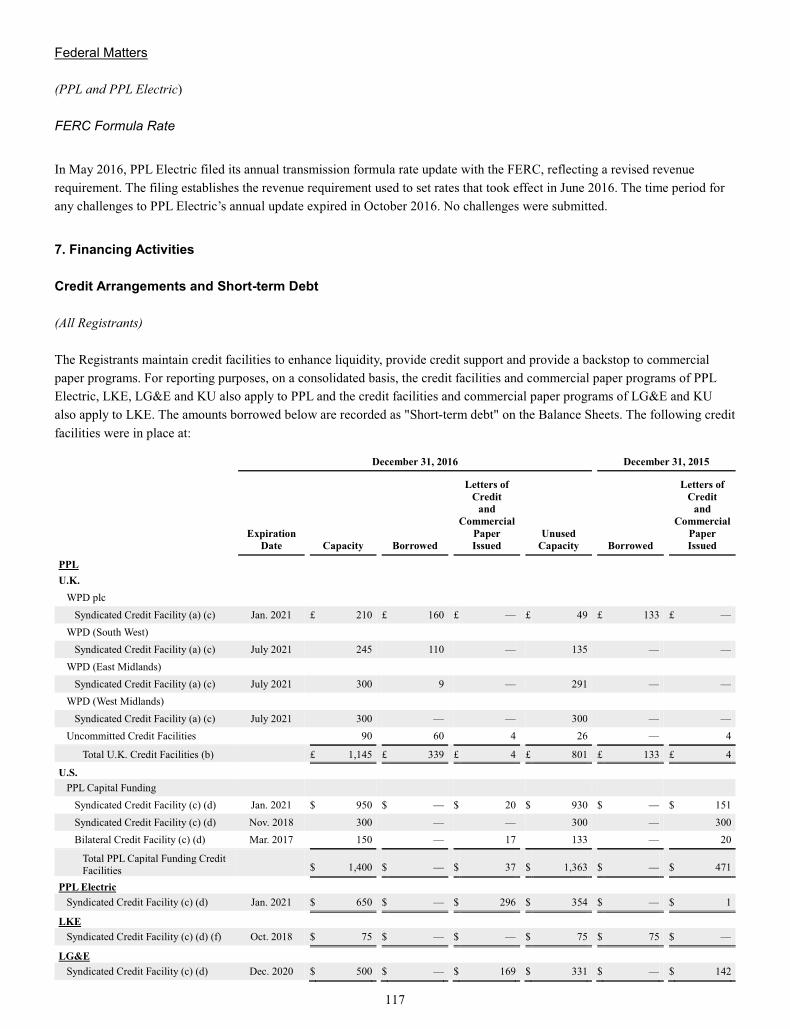
117
Federal Matters (PPL and PPL Electric) FERC Formula Rate
In May 2016, PPL Electric filed its annual transmission formula rate update with the FERC, reflecting a revised revenue requirement. The filing establishes the revenue requirement used to set rates that took effect in June 2016. The time period for any challenges to PPL Electric’s annual update expired in October 2016. No challenges were submitted.
7. Financing Activities Credit Arrangements and Short-term Debt (All Registrants) The Registrants maintain credit facilities to enhance liquidity, provide credit support and provide a backstop to commercial paper programs. For reporting purposes, on a consolidated basis, the credit facilities and commercial paper programs of PPL Electric, LKE, LG&E and KU also apply to PPL and the credit facilities and commercial paper programs of LG&E and KU also apply to LKE. The amounts borrowed below are recorded as "Short-term debt" on the Balance Sheets. The following credit facilities were in place at:
December 31, 2016 December 31, 2015
Expiration
Date Capacity Borrowed
Letters of Credit
and Commercial
Paper Issued
Unused Capacity Borrowed
Letters of Credit
and Commercial
Paper Issued
PPL U.K.
WPD plc Syndicated Credit Facility (a) (c) Jan. 2021 £ 210 £ 160 £ — £ 49 £ 133 £ —
WPD (South West) Syndicated Credit Facility (a) (c) July 2021 245 110 — 135 — —
WPD (East Midlands) Syndicated Credit Facility (a) (c) July 2021 300 9 — 291 — —
WPD (West Midlands) Syndicated Credit Facility (a) (c) July 2021 300 — — 300 — —
Uncommitted Credit Facilities 90 60 4 26 — 4 Total U.K. Credit Facilities (b) £ 1,145 £ 339 £ 4 £ 801 £ 133 £ 4
U.S. PPL Capital Funding
Syndicated Credit Facility (c) (d) Jan. 2021 $ 950 $ — $ 20 $ 930 $ — $ 151 Syndicated Credit Facility (c) (d) Nov. 2018 300 — — 300 — 300 Bilateral Credit Facility (c) (d) Mar. 2017 150 — 17 133 — 20
Total PPL Capital Funding Credit Facilities $ 1,400
$ — $ 37
$ 1,363 $ —
$ 471
PPL Electric Syndicated Credit Facility (c) (d) Jan. 2021 $ 650 $ — $ 296 $ 354 $ — $ 1
LKE Syndicated Credit Facility (c) (d) (f) Oct. 2018 $ 75 $ — $ — $ 75 $ 75 $ —
LG&E Syndicated Credit Facility (c) (d) Dec. 2020 $ 500 $ — $ 169 $ 331 $ — $ 142

118
December 31, 2016 December 31, 2015
Expiration
Date Capacity Borrowed
Letters of Credit
and Commercial
Paper Issued
Unused Capacity Borrowed
Letters of Credit
and Commercial
Paper Issued
KU Syndicated Credit Facility (c) (d) Dec. 2020 $ 400 $ — $ 16 $ 384 $ — $ 48 Letter of Credit Facility (c) (d) (e) Oct. 2017 198 — 198 — — 198
Total KU Credit Facilities $ 598 $ — $ 214 $ 384 $ — $ 246
(a) The facilities contain financial covenants to maintain an interest coverage ratio of not less than 3.0 times consolidated earnings before income taxes,
depreciation and amortization and total net debt not in excess of 85% of its RAV, calculated in accordance with the credit facility. (b) The WPD plc amounts borrowed at December 31, 2016 and 2015 included USD-denominated borrowings of $200 million for both periods, which bore
interest at 1.43% and 1.83%. The unused capacity reflects the amount borrowed in GBP of £161 million as of the date borrowed. The WPD (South West) amount borrowed at December 31, 2016 was a GBP-denominated borrowing, which equated to $137 million and bore interest at 0.66%. The WPD (East Midlands) amount borrowed at December 31, 2016 was a GBP-denominated borrowing, which equated to $11 million and bore interest at 0.66%. The WPD Uncommitted Credit Facilities amounts borrowed at December 31, 2016 were GBP-denominated borrowings which equated to $75 million and bore interest at 1.26%. At December 31, 2016, the unused capacity under the U.K. credit facilities was approximately $1 billion.
(c) Each company pays customary fees under its respective facility and borrowings generally bear interest at LIBOR-based rates plus an applicable margin. (d) The facilities contain a financial covenant requiring debt to total capitalization not to exceed 70% for PPL Capital Funding, PPL Electric, LKE, LG&E
and KU, as calculated in accordance with the facilities and other customary covenants. Additionally, as it relates to the syndicated and bilateral credit facilities and subject to certain conditions, PPL Capital Funding may request that the capacity of its facilities expiring in November 2018 and March 2017 be increased by up to $30 million, LG&E and KU each may request up to a $100 million increase in its facility's capacity and LKE may request up to a $25 million increase in its facility's capacity.
(e) KU's letter of credit facility agreement allows for certain payments under the letter of credit facility to be converted to loans rather than requiring immediate payment.
(f) At December 31, 2015, LKE's interest rate on outstanding borrowings was 1.68%. In January 2017, the expiration dates for PPL Capital Funding and PPL Electric syndicated credit facilities expiring in January 2021, and the LG&E and KU syndicated credit facilities expiring in December 2020, were extended to January 2022. PPL, PPL Electric, LG&E and KU maintain commercial paper programs to provide an additional financing source to fund short-term liquidity needs, as necessary. Commercial paper issuances, included in "Short-term debt" on the Balance Sheets, are supported by the respective Registrant's Syndicated Credit Facility. The following commercial paper programs were in place at:
December 31, 2016 December 31, 2015
Weighted -
Average Interest Rate Capacity
Commercial Paper
Issuances Unused
Capacity Weighted -
Average Interest Rate
Commercial Paper
Issuances PPL Capital Funding 1.10% $ 1,000 $ 20 $ 980 0.78% $ 451 PPL Electric 1.05% 400 295 105 — LG&E 0.94% 350 169 181 0.71% 142 KU 0.87% 350 16 334 0.72% 48
Total $ 2,100 $ 500 $ 1,600 $ 641
In January 2017, PPL Electric's commercial paper program capacity was increased to $650 million. (PPL and LKE) See Note 14 for discussion of intercompany borrowings.

119
Long-term Debt (All Registrants)
December 31,
Weighted-Average Rate (g) Maturities (g) 2016 2015
PPL U.S.
Senior Unsecured Notes 3.75 % 2018 - 2044 $ 4,075 $ 3,425 Senior Secured Notes/First Mortgage Bonds (a) (b) (c) 3.88 % 2017 - 2045 6,849 6,874 Junior Subordinated Notes 6.31 % 2067 - 2073 930 930
Total U.S. Long-term Debt 11,854 11,229 U.K.
Senior Unsecured Notes (d) 5.44 % 2017 - 2040 5,707 7,170 Index-linked Senior Unsecured Notes (e) 1.67 % 2026 - 2056 838 772
Total U.K. Long-term Debt (f) 6,545 7,942 Total Long-term Debt Before Adjustments 18,399 19,171
Fair market value adjustments 22 30 Unamortized premium and (discount), net (e) 20 (28 ) Unamortized debt issuance costs (115 ) (125 )
Total Long-term Debt 18,326 19,048 Less current portion of Long-term Debt 518 485
Total Long-term Debt, noncurrent $ 17,808 $ 18,563 PPL Electric
Senior Secured Notes/First Mortgage Bonds (a) (b) 4.20 % 2017 - 2045 $ 2,864 $ 2,864 Total Long-term Debt Before Adjustments 2,864 2,864
Unamortized discount (12 ) (13 ) Unamortized debt issuance costs (21 ) (23 )
Total Long-term Debt 2,831 2,828 Less current portion of Long-term Debt 224 —
Total Long-term Debt, noncurrent $ 2,607 $ 2,828 LKE
Senior Unsecured Notes 3.97 % 2020 - 2021 $ 725 $ 725 First Mortgage Bonds (a) (c) 3.67 % 2017 - 2045 3,985 4,010 Long-term debt to affiliate 3.50 % 2025 400 400
Total Long-term Debt Before Adjustments 5,110 5,135 Fair market value adjustments (1 ) (1 ) Unamortized discount (15 ) (16 ) Unamortized debt issuance costs (29 ) (30 )
Total Long-term Debt 5,065 5,088 Less current portion of Long-term Debt 194 25
Total Long-term Debt, noncurrent $ 4,871 $ 5,063
LG&E First Mortgage Bonds (a) (c) 3.45 % 2017 - 2045 $ 1,634 $ 1,659
Total Long-term Debt Before Adjustments 1,634 1,659

120
December 31,
Weighted-Average Rate (g) Maturities (g) 2016 2015
Fair market value adjustments (1 ) (1 ) Unamortized discount (4 ) (4 ) Unamortized debt issuance costs (12 ) (12 )
Total Long-term Debt 1,617 1,642 Less current portion of Long-term Debt 194 25
Total Long-term Debt, noncurrent $ 1,423 $ 1,617 KU
First Mortgage Bonds (a) (c) 3.82 % 2019 - 2045 $ 2,351 $ 2,351 Total Long-term Debt Before Adjustments 2,351 2,351
Unamortized discount (9 ) (10 ) Unamortized debt issuance costs (15 ) (15 )
Total Long-term Debt 2,327 2,326 Less current portion of Long-term Debt — —
Total Long-term Debt, noncurrent $ 2,327 $ 2,326 (a) Includes PPL Electric's senior secured and first mortgage bonds that are secured by the lien of PPL Electric's 2001 Mortgage Indenture, which covers
substantially all electric distribution plant and certain transmission plant owned by PPL Electric. The carrying value of PPL Electric's property, plant and equipment was approximately $7.6 billion and $6.7 billion at December 31, 2016 and 2015.
Includes LG&E's first mortgage bonds that are secured by the lien of the LG&E 2010 Mortgage Indenture which creates a lien, subject to certain exceptions and exclusions, on substantially all of LG&E's real and tangible personal property located in Kentucky and used or to be used in connection with the generation, transmission and distribution of electricity and the storage and distribution of natural gas. The aggregate carrying value of the property subject to the lien was $4.4 billion and $4.2 billion at December 31, 2016 and 2015.
Includes KU's first mortgage bonds that are secured by the lien of the KU 2010 Mortgage Indenture which creates a lien, subject to certain exceptions and exclusions, on substantially all of KU's real and tangible personal property located in Kentucky and used or to be used in connection with the generation, transmission and distribution of electricity. The aggregate carrying value of the property subject to the lien was $5.8 billion and $5.7 billion at December 31, 2016 and 2015.
(b) Includes PPL Electric's series of senior secured bonds that secure its obligations to make payments with respect to each series of Pollution Control Bonds that were issued by the LCIDA and the PEDFA on behalf of PPL Electric. These senior secured bonds were issued in the same principal amount, contain payment and redemption provisions that correspond to and bear the same interest rate as such Pollution Control Bonds. These senior secured bonds were issued under PPL Electric's 2001 Mortgage Indenture and are secured as noted in (a) above. This amount includes $224 million of which PPL Electric is allowed to convert the interest rate mode on the bonds from time to time to a commercial paper rate, daily rate, weekly rate, or term rate of at least one year and $90 million that may be redeemed, in whole or in part, at par beginning in October 2020, and are subject to mandatory redemption upon determination that the interest rate on the bonds would be included in the holders' gross income for federal tax purposes.
(c) Includes LG&E's and KU's series of first mortgage bonds that were issued to the respective trustees of tax-exempt revenue bonds to secure its respective obligations to make payments with respect to each series of bonds. The first mortgage bonds were issued in the same principal amounts, contain payment and redemption provisions that correspond to and bear the same interest rate as such tax-exempt revenue bonds. These first mortgage bonds were issued under the LG&E 2010 Mortgage Indenture and the KU 2010 Mortgage Indenture and are secured as noted in (a) above. The related tax-exempt revenue bonds were issued by various governmental entities, principally counties in Kentucky, on behalf of LG&E and KU. The related revenue bond documents allow LG&E and KU to convert the interest rate mode on the bonds from time to time to a commercial paper rate, daily rate, weekly rate, term rate of at least one year or, in some cases, an auction rate or a LIBOR index rate. At December 31, 2016, the aggregate tax-exempt revenue bonds issued on behalf of LG&E and KU that were in a term rate mode totaled $514 million for LKE, comprised of $391 million and $123 million for LG&E and KU, respectively. At December 31, 2016, the aggregate tax-exempt revenue bonds issued on behalf of LG&E and KU that were in a variable rate mode totaled $386 million for LKE, comprised of $158 million and $228 million for LG&E and KU, respectively. Certain of the variable rate tax-exempt revenue bonds totaling $375 million at December 31, 2016 ($147 million for LG&E and $228 million for KU), are subject to tender for purchase by LG&E and KU at the option of the holder and to mandatory tender for purchase by LG&E and KU upon the occurrence of certain events.
(d) Includes £225 million ($281 million at December 31, 2016) of notes that may be redeemed, in total but not in part, on December 21, 2026, at the greater of the principal value or a value determined by reference to the gross redemption yield on a nominated U.K. Government bond.
(e) The principal amount of the notes issued by WPD (South West) and WPD (East Midlands) is adjusted based on changes in a specified index, as detailed in the terms of the related indentures. The adjustment to the principal amounts from 2015 to 2016 was an increase of approximately £10 million ($13

121
million) resulting from inflation. In addition, this amount includes £225 million ($281 million at December 31, 2016) of notes issued by WPD (South West) that may be redeemed, in total by series, on December 1, 2026, at the greater of the adjusted principal value and a make-whole value determined by reference to the gross real yield on a nominated U.K. government bond.
(f) Includes £4.4 billion ($5.5 billion at December 31, 2016) of notes that may be put by the holders to the issuer for redemption if the long-term credit ratings assigned to the notes are withdrawn by any of the rating agencies (Moody's or S&P) or reduced to a non-investment grade rating of Ba1 or BB+ or lower in connection with a restructuring event, which includes the loss of, or a material adverse change to, the distribution licenses under which the issuer operates.
(g) The table reflects principal maturities only, based on stated maturities or earlier put dates, and the weighted-average rates as of December 31, 2016. None of the outstanding debt securities noted above have sinking fund requirements. The aggregate maturities of long-term debt, based on stated maturities or earlier put dates, for the periods 2017 through 2021 and thereafter are as follows:
PPL PPL Electric LKE LG&E KU
2017 $ 518 $ 224 $ 194 $ 194 $ — 2018 348 — 98 98 — 2019 136 — 136 40 96 2020 1,262 100 975 — 500 2021 1,150 400 250 — — Thereafter 14,985 2,140 3,457 1,302 1,755 Total $ 18,399 $ 2,864 $ 5,110 $ 1,634 $ 2,351
(PPL) In March 2014, PPL Capital Funding remarketed $978 million of 4.32% Junior Subordinated Notes due 2019 that were originally issued in April 2011 as a component of PPL's 2011 Equity Units. In connection with the remarketing, PPL Capital Funding retired $228 million of the 4.32% Junior Subordinated Notes due 2019 and issued $350 million of 2.189% Junior Subordinated Notes due 2017 and $400 million of 3.184% Junior Subordinated Notes due 2019. Simultaneously, the newly issued Junior Subordinated Notes were exchanged for $350 million of 3.95% Senior Notes due 2024 and $400 million of 5.00% Senior Notes due 2044. The transaction was accounted for as a debt extinguishment, resulting in a $9 million loss on extinguishment of the Junior Subordinated Notes, recorded to "Interest Expense" on the Statement of Income. Except for the $228 million retirement of the 4.32% Junior Subordinated Notes and fees related to the transactions, the activity was non-cash and excluded from the Statement of Cash Flows for the year ended December 31, 2014. Additionally, in May 2014, PPL issued 31.7 million shares of common stock at $30.86 per share to settle the 2011 Purchase Contracts. PPL received net cash proceeds of $978 million, which were used to repay short-term debt and for general corporate purposes. In May 2016, PPL Capital Funding issued $650 million of 3.10% Senior Notes due 2026. PPL Capital Funding received proceeds of $645 million, net of a discount and underwriting fees, which will be used to invest in or make loans to subsidiaries of PPL, to repay short-term debt and for general corporate purposes. In May 2016, WPD (East Midlands) borrowed £100 million at 0.4975% under a new 10-year index linked term loan agreement, which will be used for general corporate purposes. In May 2016, WPD plc repaid the entire $460 million principal amount of its 3.90% Senior Notes upon maturity. In October 2016, WPD (East Midlands) issued an additional £40 million of its 2.671% Index-linked Senior Notes due 2043. WPD (East Midlands) received proceeds of £83 million, which equated to $101 million at the time of issuance, net of fees and including a premium. The principal amount of the notes is adjusted based on changes in a specified index, as detailed in the terms of the related indentures. The proceeds will be used for general corporate purposes. (PPL and PPL Electric) In March 2016, the LCIDA issued $116 million of Pollution Control Revenue Refunding Bonds, Series 2016A due 2029 and $108 million of Pollution Control Revenue Refunding Bonds, Series 2016B due 2027 on behalf of PPL Electric. The bonds

122
were issued bearing interest at an initial term rate of 0.90% through their mandatory purchase dates of September 1, 2017 and August 15, 2017. Thereafter, the method of determining the interest rate on the bonds may be converted from time to time at PPL Electric's option. The proceeds of the bonds were used to redeem $116 million of 4.70% Pollution Control Revenue Refunding Bonds, 2005 Series A due 2029 and $108 million of 4.75%% Pollution Control Revenue Refunding Bonds, 2005 Series B due 2027 previously issued by the LCIDA on behalf of PPL Electric. In connection with the issuance of each of these new series of LCIDA bonds, PPL Electric entered into a loan agreement with the LCIDA pursuant to which the LCIDA has loaned to PPL Electric the proceeds of the LCIDA bonds on payment terms that correspond to the LCIDA bonds. In order to secure its obligations under the loan agreement, PPL Electric issued $224 million of First Mortgage Bonds under its 2001 Mortgage Indenture, which also have payment terms that correspond to the LCIDA bonds. (PPL, LKE and LG&E) In September 2016, the County of Trimble, Kentucky issued $125 million of Pollution Control Revenue Refunding Bonds, 2016 Series A (Louisville Gas and Electric Company Project) due 2044 on behalf of LG&E. The bonds were issued with a floating interest rate that initially will reset weekly. The method of determining the interest rate on the bonds may be converted from time to time at LG&E’s option. The proceeds of the bonds were used to redeem $83 million of Pollution Control Revenue Refunding Bonds, 2000 Series A (Louisville Gas and Electric Company Project) due 2030 and $42 million of Pollution Control Revenue Refunding Bonds, 2002 Series A (Louisville Gas and Electric Company Project) due 2032 previously issued by the County of Trimble, Kentucky on behalf of LG&E. In December 2016, LG&E redeemed, at par, its $25 million Jefferson County Pollution Control Revenue Refunding Bonds, 2000 Series A (Louisville Gas and Electric Company Project) due 2027. (PPL, LKE and KU) In August 2016, the County of Carroll, Kentucky issued $96 million of Pollution Control Revenue Refunding Bonds, 2016 Series A (Kentucky Utilities Company Project) due 2042 on behalf of KU. The bonds were issued bearing interest at an initial term rate of 1.05% through their mandatory purchase date of September 1, 2019. Thereafter, the method of determining the interest rate on the bonds may be converted from time to time at KU’s option. The proceeds of the bonds were used to redeem $96 million of Pollution Control Revenue Refunding Bonds, 2002 Series C (Kentucky Utilities Company Project) due 2032 previously issued by the County of Carroll, Kentucky on behalf of KU. Legal Separateness (All Registrants) The subsidiaries of PPL are separate legal entities. PPL's subsidiaries are not liable for the debts of PPL. Accordingly, creditors of PPL may not satisfy their debts from the assets of PPL's subsidiaries absent a specific contractual undertaking by a subsidiary to pay PPL's creditors or as required by applicable law or regulation. Similarly, PPL is not liable for the debts of its subsidiaries, nor are its subsidiaries liable for the debts of one another. Accordingly, creditors of PPL's subsidiaries may not satisfy their debts from the assets of PPL or its other subsidiaries absent a specific contractual undertaking by PPL or its other subsidiaries to pay the creditors or as required by applicable law or regulation. Similarly, the subsidiaries of PPL Electric and LKE are each separate legal entities. These subsidiaries are not liable for the debts of PPL Electric and LKE. Accordingly, creditors of PPL Electric and LKE may not satisfy their debts from the assets of their subsidiaries absent a specific contractual undertaking by a subsidiary to pay the creditors or as required by applicable law or regulation. Similarly, PPL Electric and LKE are not liable for the debts of their subsidiaries, nor are their subsidiaries liable for the debts of one another. Accordingly, creditors of these subsidiaries may not satisfy their debts from the assets of PPL Electric and LKE (or their other subsidiaries) absent a specific contractual undertaking by that parent or other subsidiary to pay such creditors or as required by applicable law or regulation.

123
(PPL) ATM Program In February 2015, PPL entered into two separate equity distribution agreements, pursuant to which PPL may sell, from time to time, up to an aggregate of $500 million of its common stock. PPL issued the following for the years ended December 31:
2016 2015
Number of shares (in thousands) 710 1,477 Average share price $ 35.23 $ 33.41
Net Proceeds $ 25 $ 49
Distributions and Related Restrictions In November 2016, PPL declared its quarterly common stock dividend, payable January 3, 2017, at 38 cents per share (equivalent to $1.52 per annum). On February 1, 2017, PPL announced that the company is increasing its common stock dividend to 39.5 cents per share on a quarterly basis (equivalent to $1.58 per annum). Future dividends, declared at the discretion of the Board of Directors, will depend upon future earnings, cash flows, financial and legal requirements and other factors. See Note 8 for information regarding the June 1, 2015 distribution to PPL's shareowners of a newly formed entity, Holdco, which at closing owned all of the membership interests of PPL Energy Supply and all of the common stock of Talen Energy. Neither PPL Capital Funding nor PPL may declare or pay any cash dividend or distribution on its capital stock during any period in which PPL Capital Funding defers interest payments on its 2007 Series A Junior Subordinated Notes due 2067 or 2013 Series B Junior Subordinated Notes due 2073. At December 31, 2016, no interest payments were deferred. WPD subsidiaries have financing arrangements that limit their ability to pay dividends. However, PPL does not, at this time, expect that any of such limitations would significantly impact PPL's ability to meet its cash obligations. (All Registrants) PPL relies on dividends or loans from its subsidiaries to fund PPL's dividends to its common shareholders. The net assets of certain PPL subsidiaries are subject to legal restrictions. LKE primarily relies on dividends from its subsidiaries to fund its distributions to PPL. LG&E, KU and PPL Electric are subject to Section 305(a) of the Federal Power Act, which makes it unlawful for a public utility to make or pay a dividend from any funds "properly included in capital account." The meaning of this limitation has never been clarified under the Federal Power Act. LG&E, KU and PPL Electric believe, however, that this statutory restriction, as applied to their circumstances, would not be construed or applied by the FERC to prohibit the payment from retained earnings of dividends that are not excessive and are for lawful and legitimate business purposes. In February 2012, LG&E and KU petitioned the FERC requesting authorization to pay dividends in the future based on retained earnings balances calculated without giving effect to the impact of purchase accounting adjustments for the acquisition of LKE by PPL. In May 2012, the FERC approved the petitions with the further condition that each utility may not pay dividends if such payment would cause its adjusted equity ratio to fall below 30% of total capitalization. Accordingly, at December 31, 2016, net assets of $2.7 billion ($1.1 billion for LG&E and $1.6 billion for KU) were restricted for purposes of paying dividends to LKE, and net assets of $3.1 billion ($1.4 billion for LG&E and $1.7 billion for KU) were available for payment of dividends to LKE. LG&E and KU believe they will not be required to change their current dividend practices as a result of the foregoing requirement. In addition, under Virginia law, KU is prohibited from making loans to affiliates without the prior approval of the VSCC. There are no comparable statutes under Kentucky law applicable to LG&E and KU, or under Pennsylvania law applicable to PPL Electric. However, orders from the KPSC require LG&E and KU to obtain prior consent or approval before lending amounts to PPL.

124
8. Acquisitions, Development and Divestitures (All Registrants) The Registrants from time to time evaluate opportunities for potential acquisitions, divestitures and development projects. Development projects are reexamined based on market conditions and other factors to determine whether to proceed with, modify or terminate the projects. Any resulting transactions may impact future financial results. (PPL) Discontinued Operations Spinoff of PPL Energy Supply In June 2014, PPL and PPL Energy Supply executed definitive agreements with affiliates of Riverstone to spin off PPL Energy Supply and immediately combine it with Riverstone's competitive power generation businesses to form a new, stand-alone, publicly traded company named Talen Energy. The transaction was subject to customary closing conditions, including receipt of regulatory approvals from the NRC, FERC, DOJ and PUC, all of which were received by mid-April 2015. On April 29, 2015, PPL's Board of Directors declared the June 1, 2015 distribution to PPL's shareowners of record on May 20, 2015 of a newly formed entity, Holdco, which at closing owned all of the membership interests of PPL Energy Supply and all of the common stock of Talen Energy. Immediately following the spinoff on June 1, 2015, Holdco merged with a special purpose subsidiary of Talen Energy, with Holdco continuing as the surviving company to the merger and as a wholly owned subsidiary of Talen Energy and the sole owner of PPL Energy Supply. Substantially contemporaneous with the spinoff and merger, RJS Power was contributed by its owners to become a subsidiary of Talen Energy. PPL shareowners received approximately 0.1249 shares of Talen Energy common stock for each share of PPL common stock they owned on May 20, 2015. Following completion of these transactions, PPL shareowners owned 65% of Talen Energy and affiliates of Riverstone owned 35%. The spinoff had no effect on the number of PPL common shares owned by PPL shareowners or the number of shares of PPL common stock outstanding. The transaction is intended to be tax-free to PPL and its shareowners for U.S. federal income tax purposes. PPL has no continuing ownership interest in or control of Talen Energy and Talen Energy Supply (formerly PPL Energy Supply). Loss on Spinoff In June 2015, in conjunction with the accounting for the spinoff, PPL evaluated whether the fair value of the Supply segment's net assets was less than the carrying value as of the June 1, 2015 spinoff date. PPL considered several valuation methodologies to derive a fair value estimate of its Supply segment at the spinoff date. These methodologies included considering the closing "when-issued" Talen Energy market value on June 1, 2015 (the spinoff date), adjusted for the proportional share of the equity value attributable to the Supply segment, as well as, the valuation methods consistently used in PPL's quantitative goodwill impairment assessments - an income approach using a discounted cash flow analysis of the Supply segment and an alternative market approach considering market multiples of comparable companies. Although the Talen Energy market value approach utilized the most observable inputs of the three approaches, PPL considered certain limitations of the "when-issued" trading market for the spinoff transaction including the short trading duration, lack of liquidity in the market and anticipated initial Talen Energy stock ownership base selling pressure, among other factors, and concluded that these factors limited this input being solely determinative of the fair value of the Supply segment. As such, PPL also considered the other valuation approaches in estimating the overall fair value, but ultimately assigned the highest weighting to the Talen Energy market value approach.
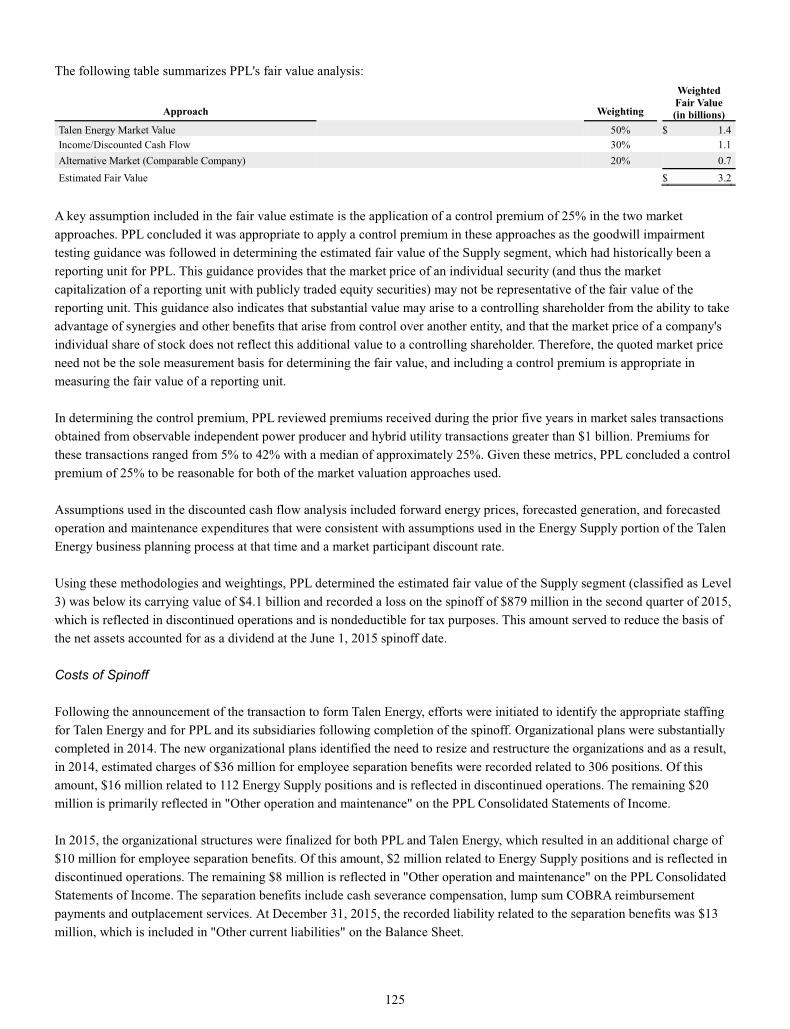
125
The following table summarizes PPL's fair value analysis:
Approach Weighting Weighted Fair Value (in billions)
Talen Energy Market Value 50% $ 1.4 Income/Discounted Cash Flow 30% 1.1 Alternative Market (Comparable Company) 20% 0.7 Estimated Fair Value $ 3.2
A key assumption included in the fair value estimate is the application of a control premium of 25% in the two market approaches. PPL concluded it was appropriate to apply a control premium in these approaches as the goodwill impairment testing guidance was followed in determining the estimated fair value of the Supply segment, which had historically been a reporting unit for PPL. This guidance provides that the market price of an individual security (and thus the market capitalization of a reporting unit with publicly traded equity securities) may not be representative of the fair value of the reporting unit. This guidance also indicates that substantial value may arise to a controlling shareholder from the ability to take advantage of synergies and other benefits that arise from control over another entity, and that the market price of a company's individual share of stock does not reflect this additional value to a controlling shareholder. Therefore, the quoted market price need not be the sole measurement basis for determining the fair value, and including a control premium is appropriate in measuring the fair value of a reporting unit. In determining the control premium, PPL reviewed premiums received during the prior five years in market sales transactions obtained from observable independent power producer and hybrid utility transactions greater than $1 billion. Premiums for these transactions ranged from 5% to 42% with a median of approximately 25%. Given these metrics, PPL concluded a control premium of 25% to be reasonable for both of the market valuation approaches used. Assumptions used in the discounted cash flow analysis included forward energy prices, forecasted generation, and forecasted operation and maintenance expenditures that were consistent with assumptions used in the Energy Supply portion of the Talen Energy business planning process at that time and a market participant discount rate. Using these methodologies and weightings, PPL determined the estimated fair value of the Supply segment (classified as Level 3) was below its carrying value of $4.1 billion and recorded a loss on the spinoff of $879 million in the second quarter of 2015, which is reflected in discontinued operations and is nondeductible for tax purposes. This amount served to reduce the basis of the net assets accounted for as a dividend at the June 1, 2015 spinoff date. Costs of Spinoff Following the announcement of the transaction to form Talen Energy, efforts were initiated to identify the appropriate staffing for Talen Energy and for PPL and its subsidiaries following completion of the spinoff. Organizational plans were substantially completed in 2014. The new organizational plans identified the need to resize and restructure the organizations and as a result, in 2014, estimated charges of $36 million for employee separation benefits were recorded related to 306 positions. Of this amount, $16 million related to 112 Energy Supply positions and is reflected in discontinued operations. The remaining $20 million is primarily reflected in "Other operation and maintenance" on the PPL Consolidated Statements of Income. In 2015, the organizational structures were finalized for both PPL and Talen Energy, which resulted in an additional charge of $10 million for employee separation benefits. Of this amount, $2 million related to Energy Supply positions and is reflected in discontinued operations. The remaining $8 million is reflected in "Other operation and maintenance" on the PPL Consolidated Statements of Income. The separation benefits include cash severance compensation, lump sum COBRA reimbursement payments and outplacement services. At December 31, 2015, the recorded liability related to the separation benefits was $13 million, which is included in "Other current liabilities" on the Balance Sheet.

126
Additional employee-related costs incurred primarily included accelerated stock-based compensation and prorated performance-based cash incentive and stock-based compensation awards, primarily for PPL Energy Supply employees and for PPL Services employees who became PPL Energy Supply employees in connection with the transaction. PPL Energy Supply recognized $24 million of these costs at the spinoff closing date in 2015, which are reflected in discontinued operations. PPL recorded $45 million and $27 million of third-party costs related to this transaction in 2015 and 2014. Of these costs, $32 million and $19 million were primarily for bank advisory, legal and accounting fees to facilitate the transaction, and are reflected in discontinued operations. An additional $13 million and $8 million of consulting and other costs were incurred in 2015 and 2014, related to the formation of the Talen Energy organization and to reconfigure the remaining PPL service functions. These costs are recorded primarily in "Other operation and maintenance" on the Statements of Income. At the close of the transaction in 2015, $72 million ($42 million after-tax) of cash flow hedges, primarily unamortized losses on PPL interest rate swaps recorded in AOCI and designated as cash flow hedges of PPL Energy Supply's future interest payments, were reclassified into earnings and reflected in discontinued operations. As a result of the June 2014 spinoff announcement, PPL recorded $50 million of deferred income tax expense in 2014, to adjust valuation allowances on deferred tax assets primarily for state net operating loss carryforwards that were previously supported by the future earnings of PPL Energy Supply. Continuing Involvement (PPL and PPL Electric) As a result of the spinoff, PPL and PPL Energy Supply entered into a Transition Services Agreement (TSA) that terminates no later than two years from the spinoff date. The TSA sets forth the terms and conditions for PPL and Talen Energy to provide certain transition services to one another. PPL is providing Talen Energy certain information technology, financial and accounting, human resource and other specified services. PPL billed Talen Energy $35 million and $25 million for these services in 2016 and 2015. In general, the fees for the transition services allow the provider to recover its cost of the services, including overheads, but without margin or profit. Additionally, prior to the spinoff, through the annual competitive solicitation process, PPL EnergyPlus was awarded supply contracts for a portion of the PLR generation supply for PPL Electric, which were retained by Talen Energy Marketing as part of the spinoff transaction. PPL Electric's supply contracts with Talen Energy Marketing extended through November 2016. Energy purchases from PPL EnergyPlus were previously included in PPL Electric's Statements of Income as "Energy purchases from affiliate" but were eliminated in PPL's Consolidated Statements of Income. Subsequent to the spinoff, PPL Electric's energy purchases from Talen Energy Marketing were $106 million and $27 million for 2016 and 2015. These energy purchases are no longer considered affiliate transactions. (PPL) Summarized Results of Discontinued Operations The operations of the Supply segment are included in "Income (Loss) from Discontinued Operations (net of income taxes)" on the Statements of Income. Following are the components of Discontinued Operations in the Statements of Income for the periods ended December 31:

127
2015 2014
Operating revenues $ 1,427 $ 3,848 Operating expenses 1,328 3,410 Other Income (Expense) - net (21 ) 13 Interest expense (a) 150 190 Gain on sale of Montana Hydro Sale — 237 Income tax expense (benefit) (30 ) 198 Loss on spinoff (879 ) — Income (Loss) from Discontinued Operations (net of income taxes) $ (921 ) $ 300
(a) Includes interest associated with the Supply segment with no additional allocation as the Supply segment was sufficiently capitalized. Net assets, after recognition of the loss on the spinoff, of $3.2 billion were distributed to PPL shareowners in the June 1, 2015, spinoff of PPL Energy Supply. Montana Hydro Sale In November 2014, PPL Montana completed the sale to NorthWestern Corporation of 633 MW of hydroelectric generating facilities located in Montana for approximately $900 million in cash. The proceeds from the sale remained with PPL and did not transfer to Talen Energy as a result of the spinoff of PPL Energy Supply. The sale included 11 hydroelectric power facilities and related assets, included in the Supply segment. A gain of $237 million ($137 million after-tax) was recorded on the sale of the hydroelectric power facilities. As the Montana hydroelectric power facilities were previously reported as a component of PPL Energy Supply and the Supply segment, the components of discontinued operations for these facilities contained in the Statements of Income are included in the disclosure above. Development Regional Transmission Line Expansion Plan (PPL and PPL Electric) Susquehanna-Roseland In 2007, PJM directed the construction of a new 150-mile, 500-kV transmission line between the Susquehanna substation in Pennsylvania and the Roseland substation in New Jersey that it identified as essential to long-term reliability of the Mid-Atlantic electricity grid. PJM determined that the line was needed to prevent potential overloads that could occur on several existing transmission lines in the interconnected PJM system. PJM directed PPL Electric to construct the Pennsylvania portion of the Susquehanna-Roseland line and Public Service Electric & Gas Company to construct the New Jersey portion of the line. The line was energized in May 2015, completing the approximately $648 million project. Costs related to the project are included on the Balance Sheets, primarily in "Regulated utility plant." Northeast/Pocono In October 2012, the FERC issued an order in response to PPL Electric's December 2011 request for ratemaking incentives for the Northeast/Pocono Reliability project (a new 58-mile, 230 kV transmission line that includes three new substations and upgrades to adjacent facilities). The FERC granted the incentive for inclusion in rate base of all prudently incurred construction work in progress costs but denied the requested incentive for a 100 basis point adder to the return on equity. In December 2012, PPL Electric submitted an application to the PUC requesting permission to site and construct the project. In January 2014, the PUC issued a final order approving the application. The line was energized in April 2016, completing the approximately $350 million project, which includes additional substation security enhancements. Costs related to the project are included on the Balance Sheets, primarily in "Regulated utility plant."

128
Capacity Needs (PPL, LKE, LG&E and KU) The Cane Run Unit 7 NGCC was put into commercial operation in June 2015. As a result and to meet more stringent EPA regulations, LG&E retired one coal-fired generating unit at the Cane Run plant in March 2015 and retired the remaining two coal-fired generating units at the plant in June 2015. KU retired the two remaining coal-fired generating units at the Green River plant in September 2015. LG&E and KU incurred costs of $11 million and $6 million directly related to these retirements including inventory write-downs and separation benefits. There were no gains or losses on the retirement of these units. See Note 6 for more information related to the regulatory recovery of the costs associated with the retirement of the Green River units. In December 2014, a final order was issued by the KPSC approving the request to construct a solar generation facility at the E.W. Brown facility. LG&E and KU completed construction activities and placed a 10 MW facility into commercial operation in June 2016 at a cost of $25 million. 9. Leases (PPL, LKE, LG&E and KU) PPL and its subsidiaries have entered into various agreements for the lease of office space, vehicles, land, gas storage and other equipment. Rent - Operating Leases Rent expense for the years ended December 31 for operating leases was as follows: 2016 2015 2014
PPL $ 50 $ 49 $ 51 LKE 26 24 18 LG&E 15 12 7 KU 11 11 10
Total future minimum rental payments for all operating leases are estimated to be:
PPL LKE LG&E KU 2017 $ 31 $ 24 $ 15 $ 9 2018 26 22 14 8 2019 16 13 7 6 2020 11 9 4 5 2021 8 6 2 4 Thereafter 26 19 8 10 Total $ 118 $ 93 $ 50 $ 42
10. Stock-Based Compensation (PPL, PPL Electric and LKE) Under the ICP, SIP and the ICPKE (together, the Plans), restricted shares of PPL common stock, restricted stock units, performance units and stock options may be granted to officers and other key employees of PPL, PPL Electric, LKE and other affiliated companies. Awards under the Plans are made by the Compensation, Governance and Nominating Committee (CGNC) of the PPL Board of Directors, in the case of the ICP and SIP, and by the PPL Corporate Leadership Council (CLC), in the case of the ICPKE. The following table details the award limits under each of the Plans.
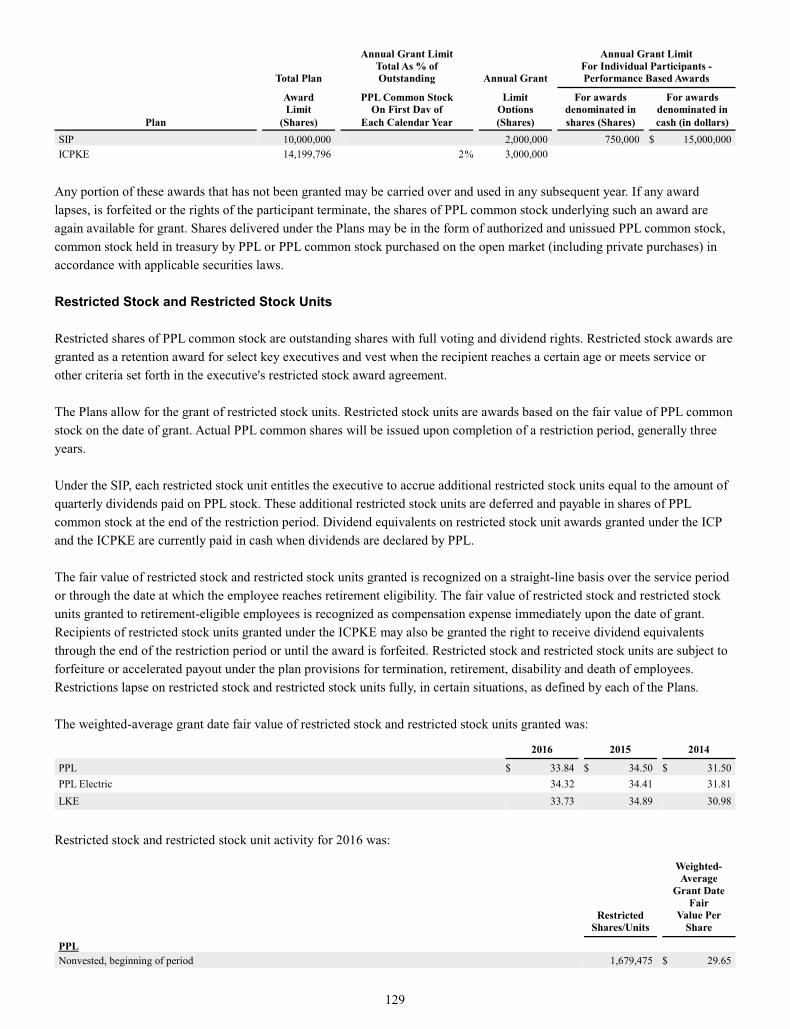
129
Total Plan
Annual Grant Limit Total As % of Outstanding Annual Grant
Annual Grant Limit For Individual Participants - Performance Based Awards
Award Limit PPL Common Stock
On First Day of Limit Options For awards
denominated in For awards denominated in
Plan (Shares) Each Calendar Year (Shares) shares (Shares) cash (in dollars) SIP 10,000,000 2,000,000 750,000 $ 15,000,000 ICPKE 14,199,796 2 % 3,000,000
Any portion of these awards that has not been granted may be carried over and used in any subsequent year. If any award lapses, is forfeited or the rights of the participant terminate, the shares of PPL common stock underlying such an award are again available for grant. Shares delivered under the Plans may be in the form of authorized and unissued PPL common stock, common stock held in treasury by PPL or PPL common stock purchased on the open market (including private purchases) in accordance with applicable securities laws. Restricted Stock and Restricted Stock Units Restricted shares of PPL common stock are outstanding shares with full voting and dividend rights. Restricted stock awards are granted as a retention award for select key executives and vest when the recipient reaches a certain age or meets service or other criteria set forth in the executive's restricted stock award agreement. The Plans allow for the grant of restricted stock units. Restricted stock units are awards based on the fair value of PPL common stock on the date of grant. Actual PPL common shares will be issued upon completion of a restriction period, generally three years. Under the SIP, each restricted stock unit entitles the executive to accrue additional restricted stock units equal to the amount of quarterly dividends paid on PPL stock. These additional restricted stock units are deferred and payable in shares of PPL common stock at the end of the restriction period. Dividend equivalents on restricted stock unit awards granted under the ICP and the ICPKE are currently paid in cash when dividends are declared by PPL. The fair value of restricted stock and restricted stock units granted is recognized on a straight-line basis over the service period or through the date at which the employee reaches retirement eligibility. The fair value of restricted stock and restricted stock units granted to retirement-eligible employees is recognized as compensation expense immediately upon the date of grant. Recipients of restricted stock units granted under the ICPKE may also be granted the right to receive dividend equivalents through the end of the restriction period or until the award is forfeited. Restricted stock and restricted stock units are subject to forfeiture or accelerated payout under the plan provisions for termination, retirement, disability and death of employees. Restrictions lapse on restricted stock and restricted stock units fully, in certain situations, as defined by each of the Plans. The weighted-average grant date fair value of restricted stock and restricted stock units granted was:
2016 2015 2014
PPL $ 33.84 $ 34.50 $ 31.50 PPL Electric 34.32 34.41 31.81 LKE 33.73 34.89 30.98
Restricted stock and restricted stock unit activity for 2016 was:
Restricted
Shares/Units
Weighted- Average
Grant Date Fair
Value Per Share
PPL Nonvested, beginning of period 1,679,475 $ 29.65

130
Restricted
Shares/Units
Weighted- Average
Grant Date Fair
Value Per Share
Granted 536,208 33.84 Vested (869,932 ) 29.30 Forfeited (8,726 ) 32.59 Nonvested, end of period (a) 1,337,025 31.57
PPL Electric Nonvested, beginning of period 221,085 $ 29.48 Transfer between registrants (10,405 ) 30.98 Granted 70,486 34.32 Vested (73,488 ) 28.91 Forfeited (3,108 ) 32.81 Nonvested, end of period 204,570 31.27
LKE Nonvested, beginning of period 318,963 $ 29.65 Transfer between registrants (24,993 ) 30.52 Granted 86,987 33.73 Vested (137,676 ) 28.76 Nonvested, end of period 243,281 31.53
(a) Excludes 862,337 restricted stock units for which restrictions lapsed for former PPL Energy Supply employees as a result of the spinoff, but for which
distribution will not occur until the end of the original restriction period of the awards. Substantially all restricted stock and restricted stock unit awards are expected to vest. The total fair value of restricted stock and restricted stock units vesting for the years ended December 31 was:
2016 2015 2014
PPL $ 30 $ 28 $ 11 PPL Electric 3 4 2 LKE 5 4 —
Performance Units Performance units are intended to encourage and reward future corporate performance. Performance units represent a target number of shares (Target Award) of PPL's common stock that the recipient would receive upon PPL's attainment of the applicable performance goal. Performance is determined based on total shareowner return during a three-year performance period. At the end of the period, payout is determined by comparing PPL's performance to the total shareowner return of the companies included in the Philadelphia Stock Exchange Utility Index. Awards are payable on a graduated basis based on thresholds that measure PPL's performance relative to peers that comprise the applicable index on which each years' awards are measured. Awards can be paid up to 200% of the Target Award or forfeited with no payout if performance is below a minimum established performance threshold. Dividends payable during the performance cycle accumulate and are converted into additional performance units and are payable in shares of PPL common stock upon completion of the performance period based on the determination of the CGNC of whether the performance goals have been achieved. Under the plan provisions, performance units are subject to forfeiture upon termination of employment except for retirement, disability or death of an employee. For performance units granted prior to 2014, the performance units are eligible for pro-rata vesting at the end of the performance period for retirement, disability or death of an employee. Beginning in 2014, the fair value of performance units granted to retirement-eligible employees is recognized as compensation expense on a straight-line basis over a one-year period, the minimum vesting period required for an employee to be entitled to

131
payout of the awards with no proration. For employees who are not retirement-eligible, compensation expense is recognized over the shorter of the three-year performance period or the period until the employee is retirement-eligible, with a minimum vesting and recognition period of one-year. If an employee retires before the one-year vesting period, the performance units are forfeited. The fair value of performance units granted in 2013 and prior years was recognized as compensation expense on a straight-line basis over the three-year performance period. Performance units vest on a pro rata basis, in certain situations, as defined by each of the Plans. The fair value of each performance unit granted was estimated using a Monte Carlo pricing model that considers stock beta, a risk-free interest rate, expected stock volatility and expected life. The stock beta was calculated comparing the risk of the individual securities to the average risk of the companies in the index group. The risk-free interest rate reflects the yield on a U.S. Treasury bond commensurate with the expected life of the performance unit. Volatility over the expected term of the performance unit is calculated using daily stock price observations for PPL and all companies in the index group and is evaluated with consideration given to prior periods that may need to be excluded based on events not likely to recur that had impacted PPL and the companies in the index group. PPL uses a mix of historic and implied volatility to value awards. The weighted-average assumptions used in the model were:
2016 2015 2014
Expected stock volatility 19.60% 15.90 % 15.80 % Expected life 3 years 3 years 3 years
The weighted-average grant date fair value of performance units granted was:
2016 2015 2014
PPL $ 35.74 $ 36.76 $ 34.55 PPL Electric 35.68 37.93 34.43 LKE 35.28 37.10 34.12
Performance unit activity for 2016 was:
Performance
Units
Weighted- Average Grant
Date Fair Value
Per Share
PPL Nonvested, beginning of period 993,540 $ 33.09
Granted 471,401 35.74 Vested (375,668 ) 31.96 Forfeited (18,737 ) 33.22
Nonvested, end of period (a) 1,070,536 34.65
PPL Electric Nonvested, beginning of period 67,671 $ 33.05
Granted 35,694 35.68 Vested (23,880 ) 31.89 Forfeited (2,759 ) 31.74
Nonvested, end of period 76,726 34.68
LKE Nonvested, beginning of period 193,164 $ 32.96
Transfer between registrants (4,432 ) 35.07 Granted 84,298 35.28 Vested (70,048 ) 31.74 Forfeited (11,381 ) 33.61
Nonvested, end of period 191,601 34.34
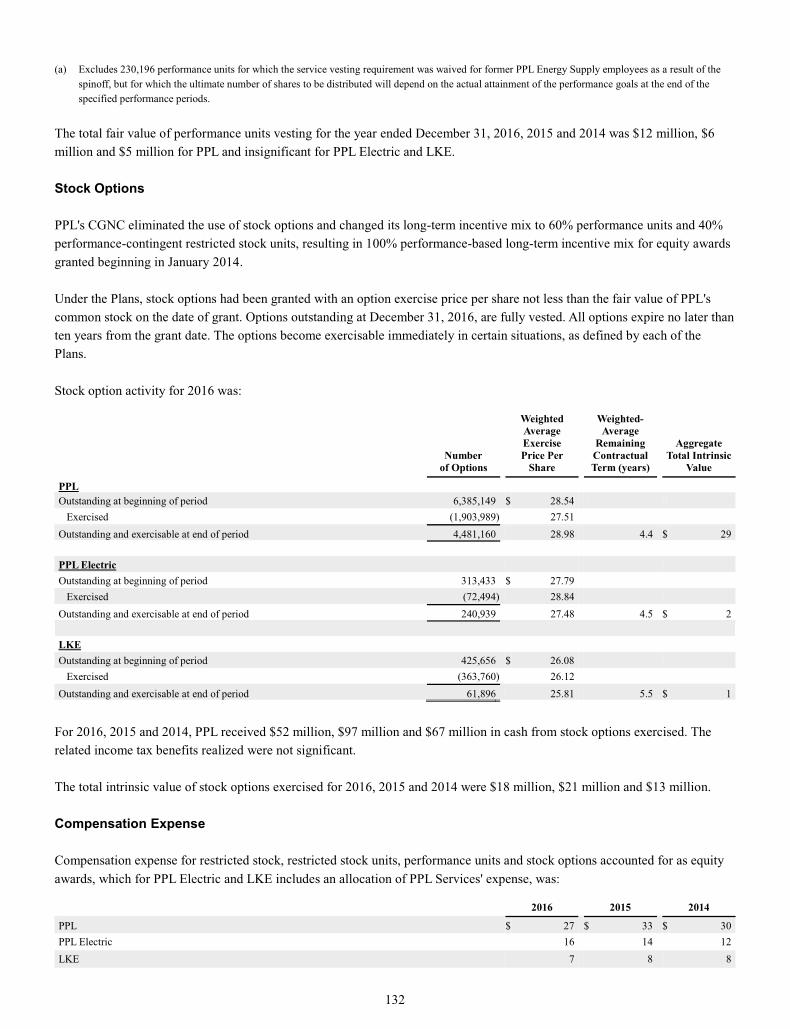
132
(a) Excludes 230,196 performance units for which the service vesting requirement was waived for former PPL Energy Supply employees as a result of the
spinoff, but for which the ultimate number of shares to be distributed will depend on the actual attainment of the performance goals at the end of the specified performance periods.
The total fair value of performance units vesting for the year ended December 31, 2016, 2015 and 2014 was $12 million, $6 million and $5 million for PPL and insignificant for PPL Electric and LKE. Stock Options PPL's CGNC eliminated the use of stock options and changed its long-term incentive mix to 60% performance units and 40% performance-contingent restricted stock units, resulting in 100% performance-based long-term incentive mix for equity awards granted beginning in January 2014. Under the Plans, stock options had been granted with an option exercise price per share not less than the fair value of PPL's common stock on the date of grant. Options outstanding at December 31, 2016, are fully vested. All options expire no later than ten years from the grant date. The options become exercisable immediately in certain situations, as defined by each of the Plans. Stock option activity for 2016 was:
Number
of Options
Weighted Average Exercise Price Per
Share
Weighted- Average
Remaining Contractual Term (years)
Aggregate Total Intrinsic
Value
PPL Outstanding at beginning of period 6,385,149 $ 28.54
Exercised (1,903,989 ) 27.51 Outstanding and exercisable at end of period 4,481,160 28.98 4.4 $ 29
PPL Electric Outstanding at beginning of period 313,433 $ 27.79
Exercised (72,494 ) 28.84 Outstanding and exercisable at end of period 240,939 27.48 4.5 $ 2
LKE Outstanding at beginning of period 425,656 $ 26.08
Exercised (363,760 ) 26.12 Outstanding and exercisable at end of period 61,896 25.81 5.5 $ 1
For 2016, 2015 and 2014, PPL received $52 million, $97 million and $67 million in cash from stock options exercised. The related income tax benefits realized were not significant. The total intrinsic value of stock options exercised for 2016, 2015 and 2014 were $18 million, $21 million and $13 million. Compensation Expense Compensation expense for restricted stock, restricted stock units, performance units and stock options accounted for as equity awards, which for PPL Electric and LKE includes an allocation of PPL Services' expense, was:
2016 2015 2014
PPL $ 27 $ 33 $ 30 PPL Electric 16 14 12 LKE 7 8 8

133
See Note 8 for details of the costs recognized in discontinued operations related to the accelerated vesting of awards for former PPL Energy Supply employees. The income tax benefit related to above compensation expense was as follows:
2016 2015 2014
PPL $ 12 $ 14 $ 12 PPL Electric 7 6 5 LKE 3 3 3
At December 31, 2016, unrecognized compensation expense related to nonvested restricted stock, restricted stock units, and performance units was:
Unrecognized Compensation
Expense
Weighted- Average
Period for Recognition
PPL $ 8 1.8 PPL Electric 1 1.8 LKE 1 1.6
11. Retirement and Postemployment Benefits (All Registrants) Defined Benefits The majority of PPL's subsidiaries domestic employees are eligible for pension benefits under non-contributory defined benefit pension plans with benefits based on length of service and final average pay, as defined by the plans. Effective January 1, 2012, PPL's primary defined benefit pension plan was closed to all newly hired salaried employees. Effective July 1, 2014, PPL's primary defined benefit pension plan was closed to all newly hired bargaining unit employees. Newly hired employees are eligible to participate in the PPL Retirement Savings Plan, a 401(k) savings plan with enhanced employer contributions. The defined benefit pension plans of LKE and its subsidiaries were closed to new salaried and bargaining unit employees hired after December 31, 2005. Employees hired after December 31, 2005 receive additional company contributions above the standard matching contributions to their savings plans. Effective April 1, 2010, the principal defined benefit pension plan applicable to WPD (South West) and WPD (South Wales) was closed to most new employees, except for those meeting specific grandfathered participation rights. WPD Midlands' defined benefit plan had been closed to new members, except for those meeting specific grandfathered participation rights, prior to acquisition. New employees not eligible to participate in the plans are offered benefits under a defined contribution plan. PPL and certain of its subsidiaries also provide supplemental retirement benefits to executives and other key management employees through unfunded nonqualified retirement plans. The majority of employees of PPL's domestic subsidiaries are eligible for certain health care and life insurance benefits upon retirement through contributory plans. Effective January 1, 2014, the PPL Postretirement Medical Plan was closed to all newly hired salaried employees. Effective July 1, 2014, the PPL Postretirement Medical Plan was closed to all newly hired bargaining unit employees. Postretirement health benefits may be paid from 401(h) accounts established as part of the PPL Retirement Plan and the LG&E and KU Retirement Plan within the PPL Services Corporation Master Trust, funded VEBA trusts and company funds. WPD does not sponsor any postretirement benefit plans other than pensions.

134
(PPL) The following table provides the components of net periodic defined benefit costs for PPL's domestic (U.S.) and WPD's (U.K.) pension and other postretirement benefit plans for the years ended December 31.
Pension Benefits U.S. U.K. Other Postretirement Benefits
2016 2015 2014 2016 2015 2014 2016 2015 2014 Net periodic defined benefit costs (credits): Service cost $ 66 $ 96 $ 97 $ 69 $ 79 $ 71 $ 7 $ 11 $ 12 Interest cost 174 194 224 235 314 354 26 26 31 Expected return on plan assets (228 ) (258 ) (287) (504 ) (523 ) (521) (22 ) (26 ) (26) Amortization of:
Prior service cost (credit) 8 7 20 — — — — 1 — Actuarial (gain) loss 50 84 28 138 158 132 1 — 1
Net periodic defined benefit costs (credits) prior to settlements and termination benefits 70
123
82
(62 ) 28
36
12
12
18
Settlements 3 — — — — — — — — Termination benefits — — 13 — — — — — — Net periodic defined benefit costs (credits) $ 73
$ 123
$ 95
$ (62 ) $ 28
$ 36
$ 12
$ 12
$ 18
Other Changes in Plan Assets and Benefit Obligations Recognized in OCI and Regulatory Assets/Liabilities - Gross: Divestiture (a) $ — $ (353 ) $ — $ — $ — $ — $ — $ (6 ) $ — Settlement (3 ) — — — — — — — — Net (gain) loss 253 63 574 7 508 354 9 (9 ) 22 Prior service cost (credit) 15
18
(8) —
—
—
—
—
7
Amortization of: Prior service (cost) credit (8 ) (7 ) (20) — — — (1 ) (1 ) — Actuarial gain (loss) (50 ) (85 ) (28) (138 ) (158 ) (132) (1 ) — (1)
Total recognized in OCI and regulatory assets/liabilities (b) 207
(364 ) 518 (131 ) 350
222 7
(16 ) 28
Total recognized in net periodic defined benefit costs, OCI and regulatory assets/liabilities (b) $ 280
$ (241 ) $ 613
$ (193 ) $ 378
$ 258
$ 19
$ (4 ) $ 46
(a) As a result of the spinoff of PPL Energy Supply, amounts in AOCI were allocated to certain former active and inactive employees of PPL Energy Supply
and included in the distribution. See Note 8 for additional details. (b) WPD is not subject to accounting for the effects of certain types of regulation as prescribed by GAAP. As a result, WPD does not record regulatory
assets/liabilities. For PPL's U.S. pension benefits and for other postretirement benefits, the amounts recognized in OCI and regulatory assets/liabilities for the years ended December 31 were as follows:
U.S. Pension Benefits Other Postretirement Benefits
2016 2015 2014 2016 2015 2014 OCI $ 236 $ (269 ) $ 319 $ 7 $ 12 $ 7 Regulatory assets/liabilities (29) (95 ) 199 — (28 ) 21 Total recognized in OCI and regulatory assets/liabilities $ 207
$ (364 ) $ 518
$ 7
$ (16 ) $ 28
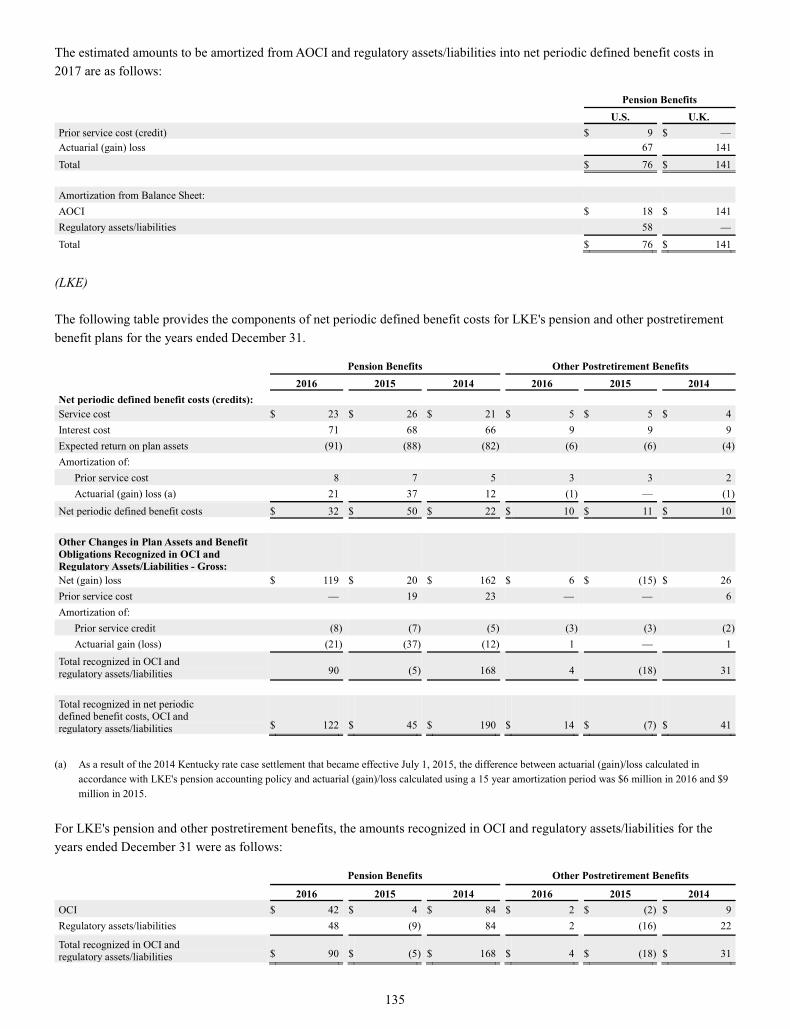
135
The estimated amounts to be amortized from AOCI and regulatory assets/liabilities into net periodic defined benefit costs in 2017 are as follows:
Pension Benefits
U.S. U.K. Prior service cost (credit) $ 9 $ — Actuarial (gain) loss 67 141 Total $ 76 $ 141
Amortization from Balance Sheet: AOCI $ 18 $ 141 Regulatory assets/liabilities 58 — Total $ 76 $ 141
(LKE) The following table provides the components of net periodic defined benefit costs for LKE's pension and other postretirement benefit plans for the years ended December 31.
Pension Benefits Other Postretirement Benefits 2016 2015 2014 2016 2015 2014
Net periodic defined benefit costs (credits): Service cost $ 23 $ 26 $ 21 $ 5 $ 5 $ 4 Interest cost 71 68 66 9 9 9 Expected return on plan assets (91) (88 ) (82 ) (6) (6 ) (4 ) Amortization of:
Prior service cost 8 7 5 3 3 2 Actuarial (gain) loss (a) 21 37 12 (1) — (1 )
Net periodic defined benefit costs $ 32 $ 50 $ 22 $ 10 $ 11 $ 10
Other Changes in Plan Assets and Benefit Obligations Recognized in OCI and Regulatory Assets/Liabilities - Gross: Net (gain) loss $ 119 $ 20 $ 162 $ 6 $ (15 ) $ 26 Prior service cost — 19 23 — — 6 Amortization of:
Prior service credit (8) (7 ) (5 ) (3) (3 ) (2 ) Actuarial gain (loss) (21) (37 ) (12 ) 1 — 1
Total recognized in OCI and regulatory assets/liabilities 90
(5 ) 168
4
(18 ) 31
Total recognized in net periodic defined benefit costs, OCI and regulatory assets/liabilities $ 122
$ 45
$ 190
$ 14
$ (7 ) $ 41
(a) As a result of the 2014 Kentucky rate case settlement that became effective July 1, 2015, the difference between actuarial (gain)/loss calculated in
accordance with LKE's pension accounting policy and actuarial (gain)/loss calculated using a 15 year amortization period was $6 million in 2016 and $9 million in 2015.
For LKE's pension and other postretirement benefits, the amounts recognized in OCI and regulatory assets/liabilities for the years ended December 31 were as follows:
Pension Benefits Other Postretirement Benefits
2016 2015 2014 2016 2015 2014 OCI $ 42 $ 4 $ 84 $ 2 $ (2 ) $ 9 Regulatory assets/liabilities 48 (9 ) 84 2 (16 ) 22 Total recognized in OCI and regulatory assets/liabilities $ 90
$ (5 ) $ 168 $ 4
$ (18 ) $ 31

136
The estimated amounts to be amortized from AOCI and regulatory assets/liabilities into net periodic defined benefit costs for LKE in 2017 are as follows.
Pension Benefits
Other Postretirement
Benefits
Prior service cost $ 8 $ 1 Actuarial Loss 30 — Total $ 38 $ 1
Amortization from Balance Sheet: AOCI $ 5 $ — Regulatory assets/liabilities 33 1 Total $ 38 $ 1
(LG&E) The following table provides the components of net periodic defined benefit costs for LG&E's pension benefit plan for the years ended December 31.
Pension Benefits
2016 2015 2014 Net periodic defined benefit costs (credits): Service cost $ 1 $ 1 $ 1 Interest cost 15 14 15 Expected return on plan assets (21) (20 ) (19 ) Amortization of:
Prior service cost 4 3 2 Actuarial loss (a) 7 11 6
Net periodic defined benefit costs $ 6 $ 9 $ 5
Other Changes in Plan Assets and Benefit Obligations Recognized in Regulatory Assets - Gross: Net loss $ 22 $ 8 $ 14 Prior service cost — 10 9 Amortization of:
Prior service credit (4) (3 ) (2 ) Actuarial gain (7) (11 ) (6 )
Total recognized in regulatory assets/liabilities 11 4 15 Total recognized in net periodic defined benefit costs and regulatory assets $ 17 $ 13 $ 20
(a) As a result of the 2014 Kentucky rate case settlement that became effective July 1, 2015, the difference between actuarial (gain)/loss calculated in
accordance with LG&E's pension accounting policy and actuarial (gain)/loss calculated using a 15 year amortization period was $5 million in 2016 and $3 million in 2015.
The estimated amounts to be amortized from regulatory assets into net periodic defined benefit costs for LG&E in 2017 are as follows.
Pension Benefits
Prior service cost $ 4 Actuarial loss 9 Total $ 13

137
(All Registrants) The following net periodic defined benefit costs (credits) were charged to operating expense or regulatory assets, excluding amounts charged to construction and other non-expense accounts. The U.K. pension benefits apply to PPL only.
Pension Benefits U.S. U.K. Other Postretirement Benefits
2016 2015 2014 2016 2015 2014 2016 2015 2014 PPL $ 53 $ 71 $ 45 $ (95 ) $ (21 ) $ (9 ) $ 7 $ 8 $ 10 PPL Electric (a) 10 15 12 1 — 2 LKE (b) 24 37 17 6 8 7 LG&E (b) 8 12 5 3 4 4 KU (a) (b) 5 9 3 2 2 2
(a) PPL Electric and KU do not directly sponsor any defined benefit plans. PPL Electric and KU were allocated these costs of defined benefit plans
sponsored by PPL Services (for PPL Electric) and by LKE (for KU), based on their participation in those plans, which management believes are reasonable.
(b) As a result of the 2014 Kentucky rate case settlement that became effective July 1, 2015, the difference between net periodic defined benefit costs calculated in accordance with LKE's, LG&E's and KU's pension accounting policy and the net periodic defined benefit costs calculated using a 15 year amortization period for gains and losses is recorded as a regulatory asset. Of the costs charged to operating expense or regulatory assets, excluding amounts charged to construction and other non-expense accounts, $3 million for LG&E and $2 million for KU were recorded as regulatory assets in 2016 and $4 million for LG&E and $1 million for KU were recorded as regulatory assets in 2015.
In the table above, LG&E amounts include costs for the specific plans it sponsors and the following allocated costs of defined benefit plans sponsored by LKE, based on its participation in those plans, which management believes are reasonable:
Pension Benefits Other Postretirement Benefits
2016 2015 2014 2016 2015 2014 LG&E Non-Union Only $ 4 $ 5 $ 2 $ 3 $ 4 $ 4
(PPL, LKE and LG&E) PPL, LKE and LG&E adopted the new mortality tables issued by the Society of Actuaries in October 2014 (RP-2014 base tables) for all U.S. defined benefit pension and other postretirement benefit plans. In addition, PPL, LKE and LG&E updated the basis for estimating projected mortality improvements and selected the IRS BB-2D two-dimensional improvement scale on a generational basis for all U.S. defined benefit pension and other postretirement benefit plans. These new mortality assumptions reflect the recognition of both improved life expectancies and the expectation of continuing improvements in life expectancies. The following weighted-average assumptions were used in the valuation of the benefit obligations at December 31. The U.K. pension benefits apply to PPL only.
Pension Benefits U.S. U.K. Other Postretirement Benefits
2016 2015 2016 2015 2016 2015 PPL
Discount rate 4.21 % 4.59 % 2.87% 3.68% 4.11 % 4.48 % Rate of compensation increase 3.95 % 3.93 % 3.50% 4.00% 3.92 % 3.91 %
LKE
Discount rate 4.19 % 4.56 % 4.12 % 4.49 % Rate of compensation increase 3.50 % 3.50 % 3.50 % 3.50 %
LG&E
Discount rate 4.13 % 4.49 %

138
The following weighted-average assumptions were used to determine the net periodic defined benefit costs for the years ended December 31. The U.K. pension benefits apply to PPL only.
Pension Benefits U.S. U.K. Other Postretirement Benefits
2016 2015 2014 2016 2015 2014 2016 2015 2014 PPL
Discount rate service cost (b) 4.59% 4.25% 5.12% 3.90% 3.85% 4.41% 4.48% 4.09% 4.91% Discount rate interest cost (b) 4.59% 4.25% 5.12% 3.14% 3.85% 4.41% 4.48% 4.09% 4.91% Rate of compensation increase 3.93% 3.91% 3.97% 4.00% 4.00% 4.00% 3.91% 3.86% 3.96% Expected return on plan assets (a) 7.00% 7.00% 7.00% 7.20% 7.19% 7.19% 6.11% 6.06% 5.96%
LKE
Discount rate 4.56% 4.25% 5.18% 4.49% 4.06% 4.91% Rate of compensation increase 3.50% 3.50% 4.00% 3.50% 3.50% 4.00% Expected return on plan assets (a) 7.00% 7.00% 7.00% 6.82% 6.82% 6.75%
LG&E
Discount rate 4.49% 4.20% 5.13% Expected return on plan assets (a) 7.00% 7.00% 7.00%
(a) The expected long-term rates of return for pension and other postretirement benefits are based on management's projections using a best-estimate of
expected returns, volatilities and correlations for each asset class. Each plan's specific current and expected asset allocations are also considered in developing a reasonable return assumption.
(b) As of January 1, 2016, WPD began using individual spot rates from the yield curve used to discount the benefit obligation to measure service cost and interest cost. PPL's U.S. plans use a single discount rate derived from an individual bond matching model to measure the benefit obligation, service cost and interest cost. See Note 1 for additional details.
(PPL and LKE) The following table provides the assumed health care cost trend rates for the years ended December 31:
2016 2015 2014 PPL and LKE
Health care cost trend rate assumed for next year – obligations 7.0% 6.8 % 7.2 % – cost 6.8% 7.2 % 7.6 %
Rate to which the cost trend rate is assumed to decline (the ultimate trend rate) – obligations 5.0% 5.0 % 5.0 % – cost 5.0% 5.0 % 5.0 %
Year that the rate reaches the ultimate trend rate – obligations 2022 2020 2020 – cost 2020 2020 2020
A one percentage point change in the assumed health care costs trend rate assumption would have had the following effects on the other postretirement benefit plans in 2016:
One Percentage Point
Increase Decrease Effect on accumulated postretirement benefit obligation
PPL $ 5 $ (5 ) LKE 4 (4 )

139
(PPL) The funded status of PPL's plans at December 31 was as follows:
Pension Benefits U.S. U.K. Other Postretirement Benefits
2016 2015 2016 2015 2016 2015 Change in Benefit Obligation Benefit Obligation, beginning of period $ 3,863 $ 5,399 $ 8,404 $ 8,523 $ 596 $ 716
Service cost 66 96 69 79 7 11 Interest cost 174 194 235 314 26 26 Participant contributions — — 14 15 14 13 Plan amendments 14 19 — — — — Actuarial (gain) loss 214 (193 ) 484 200 11 (37 ) Divestiture (a) — (1,416 ) — — — (76 ) Settlements (9) — — — — — Gross benefits paid (243) (236 ) (357 ) (391) (64 ) (58 ) Federal subsidy — — — — 1 1 Currency conversion — — (1,466 ) (336) — —
Benefit Obligation, end of period 4,079 3,863 7,383 8,404 591 596
Change in Plan Assets Plan assets at fair value, beginning of period 3,227 4,462 7,625 7,734 379 484
Actual return on plan assets 189 2 979 205 25 (2 ) Employer contributions 79 158 330 366 19 17 Participant contributions — — 14 15 14 13 Divestiture (a) — (1,159 ) — — — (80 ) Settlements (9) — — — — — Gross benefits paid (243) (236 ) (357 ) (391) (59 ) (53 ) Currency conversion — — (1,380 ) (304) — —
Plan assets at fair value, end of period 3,243 3,227 7,211 7,625 378 379
Funded Status, end of period $ (836 ) $ (636 ) $ (172 ) $ (779 ) $ (213 ) $ (217 )
Amounts recognized in the Balance Sheets consist of:
Noncurrent asset $ — $ — $ 10 $ — $ 2 $ 2 Current liability (17) (10 ) — — (3 ) (3 ) Noncurrent liability (819) (626 ) (182 ) (779) (212 ) (216 )
Net amount recognized, end of period $ (836 ) $ (636 ) $ (172 ) $ (779 ) $ (213 ) $ (217 )
Amounts recognized in AOCI and regulatory assets/liabilities (pre-tax) consist of: Prior service cost (credit) $ 59 $ 53 $ — $ — $ — $ 1 Net actuarial (gain) loss 1,178 977 2,553 2,684 45 37 Total (b) $ 1,237 $ 1,030 $ 2,553 $ 2,684 $ 45 $ 38
Total accumulated benefit obligation for defined benefit pension plans $ 3,807
$ 3,590
$ 6,780
$ 7,747
(a) As a result of the spinoff of PPL Energy Supply, obligations and assets attributable to certain former active and inactive employees of PPL Energy Supply
were transferred to Talen Energy plans. (b) WPD is not subject to accounting for the effects of certain types of regulation as prescribed by GAAP and as a result, does not record regulatory
assets/liabilities.

140
For PPL's U.S. pension and other postretirement benefit plans, the amounts recognized in AOCI and regulatory assets/liabilities at December 31 were as follows:
U.S. Pension Benefits Other Postretirement Benefits
2016 2015 2016 2015 AOCI $ 357 $ 275 $ 20 $ 18 Regulatory assets/liabilities 880 755 25 20 Total $ 1,237 $ 1,030 $ 45 $ 38
The following tables provide information on pension plans where the projected benefit obligation (PBO) or accumulated benefit obligation (ABO) exceed the fair value of plan assets:
U.S. U.K. PBO in excess of plan assets PBO in excess of plan assets
2016 2015 2016 2015 Projected benefit obligation $ 4,079 $ 3,863 $ 3,403 $ 8,404 Fair value of plan assets 3,243 3,227 3,221 7,625 U.S. U.K.
ABO in excess of plan assets ABO in excess of plan assets 2016 2015 2016 2015
Accumulated benefit obligation $ 3,807 $ 3,590 $ 657 $ 3,532 Fair value of plan assets 3,243 3,227 643 3,287
(LKE) The funded status of LKE's plans at December 31 was as follows:
Pension Benefits Other Postretirement Benefits
2016 2015 2016 2015 Change in Benefit Obligation Benefit Obligation, beginning of period $ 1,588 $ 1,608 $ 216 $ 234
Service cost 23 26 5 5 Interest cost 71 68 9 9 Participant contributions — — 7 7 Plan amendments (a) — 19 — — Actuarial (gain) loss 96 (74) 4 (22 ) Gross benefits paid (a) (109 ) (59) (21 ) (18 ) Federal subsidy — — — 1
Benefit Obligation, end of period 1,669 1,588 220 216 Change in Plan Assets Plan assets at fair value, beginning of period 1,289 1,301 88 82
Actual return on plan assets 69 (7) 4 — Employer contributions 66 54 20 17 Participant contributions — — 7 7 Gross benefits paid (109 ) (59) (21 ) (18 )
Plan assets at fair value, end of period 1,315 1,289 98 88 Funded Status, end of period $ (354 ) $ (299 ) $ (122 ) $ (128 )
Amounts recognized in the Balance Sheets consist of: Noncurrent asset $ — $ — $ 2 $ 2 Current liability (4 ) (3) (3 ) (3 ) Noncurrent liability (350 ) (296) (121 ) (127 )
Net amount recognized, end of period $ (354 ) $ (299 ) $ (122 ) $ (128 )

141
Pension Benefits Other Postretirement Benefits 2016 2015 2016 2015
Amounts recognized in AOCI and regulatory assets/liabilities (pre-tax) consist of: Prior service cost $ 45 $ 54 $ 6 $ 9 Net actuarial (gain) loss 436 338 (13 ) (19 ) Total $ 481 $ 392 $ (7 ) $ (10 )
Total accumulated benefit obligation for defined benefit pension plans $ 1,531
$ 1,452
(a) The pension plans were amended in December 2015 to allow active participants and terminated vested participants who had not previously elected a form
of payment of their benefit to elect to receive their accrued pension benefit as a one-time lump-sum payment effective January 1, 2016. The projected benefit obligation at December 31, 2015 increased by $19 million as a result of the amendment. Gross benefits paid by the plans include $53 million of lump-sum cash payments made to participants during 2016 in connection with these offerings.
The amounts recognized in AOCI and regulatory assets/liabilities at December 31 were as follows:
Pension Benefits Other Postretirement Benefits
2016 2015 2016 2015 AOCI $ 111 $ 70 $ 8 $ 7 Regulatory assets/liabilities 370 322 (15 ) (17 ) Total $ 481 $ 392 $ (7 ) $ (10 )
The following tables provide information on pension plans where the projected benefit obligation (PBO) or accumulated benefit obligations (ABO) exceed the fair value of plan assets:
PBO in excess of plan assets
2016 2015 Projected benefit obligation $ 1,669 $ 1,588 Fair value of plan assets 1,315 1,289 ABO in excess of plan assets
2016 2015 Accumulated benefit obligation $ 1,531 $ 1,452 Fair value of plan assets 1,315 1,289
(LG&E) The funded status of LG&E's plan at December 31, was as follows:
Pension Benefits
2016 2015 Change in Benefit Obligation Benefit Obligation, beginning of period $ 326 $ 331
Service cost 1 1 Interest cost 15 14 Plan amendments (a) — 10 Actuarial (gain) loss 15 (15 ) Gross benefits paid (a) (28 ) (15 )
Benefit Obligation, end of period 329 326 Change in Plan Assets Plan assets at fair value, beginning of period 297 301
Actual return on plan assets 14 (2 ) Employer contributions 35 13 Gross benefits paid (28 ) (15 )
Plan assets at fair value, end of period 318 297

142
Pension Benefits 2016 2015
Funded Status, end of period $ (11 ) $ (29 )
Amounts recognized in the Balance Sheets consist of: Noncurrent liability $ (11 ) $ (29 )
Net amount recognized, end of period $ (11 ) $ (29 )
Amounts recognized in regulatory assets (pre-tax) consist of: Prior service cost $ 25 $ 29 Net actuarial loss 110 95 Total $ 135 $ 124
Total accumulated benefit obligation for defined benefit pension plan $ 329 $ 326 (a) The pension plan was amended in December 2015 to allow active participants and terminated vested participants who had not previously elected a form
of payment of their benefit to elect to receive their accrued pension benefit as a one-time lump-sum payment effective January 1, 2016. The projected benefit obligation at December 31, 2015 increased by $10 million as a result of the amendment. Gross benefits paid by the plan include $14 million of lump-sum cash payments made to the participants during 2016 in connection with this offering.
LG&E's pension plan had projected and accumulated benefit obligations in excess of plan assets at December 31, 2016 and 2015. In addition to the plan it sponsors, LG&E is allocated a portion of the funded status and costs of certain defined benefit plans sponsored by LKE based on its participation in those plans, which management believes are reasonable. The actuarially determined obligations of current active employees and retired employees are used as a basis to allocate total plan activity, including active and retiree costs and obligations. Allocations to LG&E resulted in liabilities at December 31 as follows:
2016 2015 Pension $ 42 $ 26 Other postretirement benefits 76 77
(PPL Electric) Although PPL Electric does not directly sponsor any defined benefit plans, it is allocated a portion of the funded status and costs of plans sponsored by PPL Services based on its participation in those plans, which management believes are reasonable. As a result of the spinoff of PPL Energy Supply in 2015, pension and other postretirement plans were remeasured resulting in adjustments to PPL Electric's allocated balances of $56 million, reflected as a non-cash contribution on the Statement of Equity. The actuarially determined obligations of current active employees and retirees are used as a basis to allocate total plan activity, including active and retiree costs and obligations. Allocations to PPL Electric resulted in liabilities at December 31 as follows:
2016 2015 Pension $ 281 $ 183 Other postretirement benefits 72 67
(KU) Although KU does not directly sponsor any defined benefit plans, it is allocated a portion of the funded status and costs of plans sponsored by LKE based on its participation in those plans, which management believes are reasonable. The actuarially determined obligations of current active employees and retired employees of KU are used as a basis to allocate total plan activity, including active and retiree costs and obligations. Allocations to KU resulted in liabilities at December 31 as follows. 2016 2015 Pension $ 62 $ 46 Other postretirement benefits 40 42
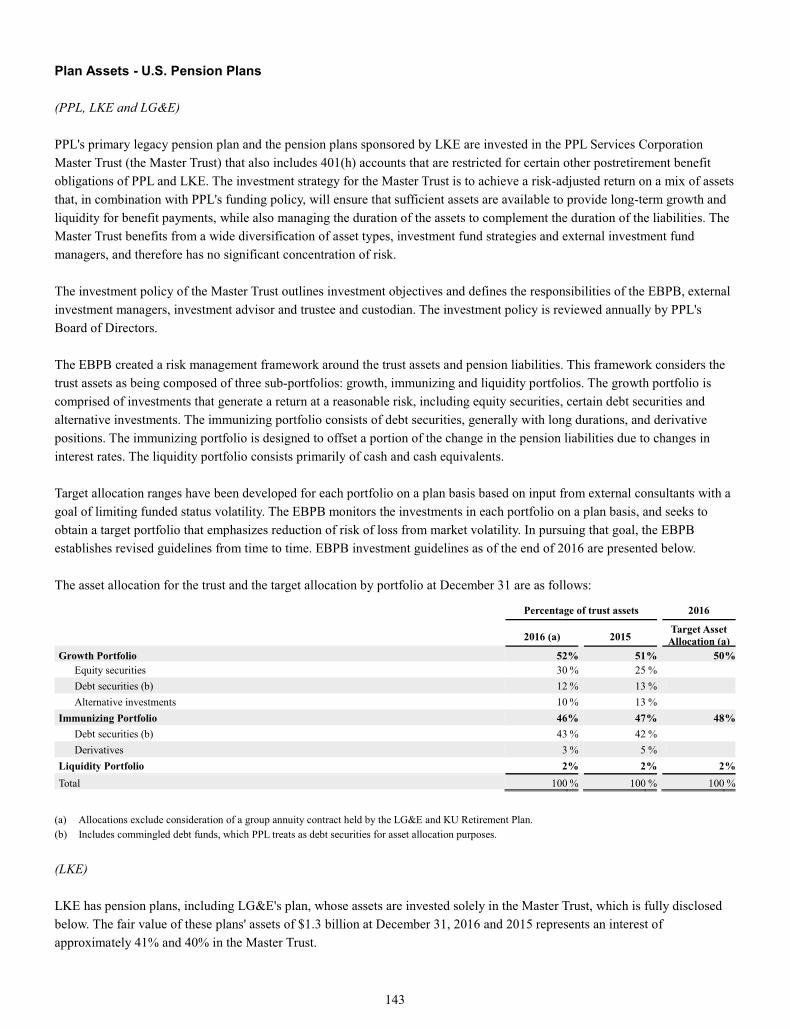
143
Plan Assets - U.S. Pension Plans (PPL, LKE and LG&E) PPL's primary legacy pension plan and the pension plans sponsored by LKE are invested in the PPL Services Corporation Master Trust (the Master Trust) that also includes 401(h) accounts that are restricted for certain other postretirement benefit obligations of PPL and LKE. The investment strategy for the Master Trust is to achieve a risk-adjusted return on a mix of assets that, in combination with PPL's funding policy, will ensure that sufficient assets are available to provide long-term growth and liquidity for benefit payments, while also managing the duration of the assets to complement the duration of the liabilities. The Master Trust benefits from a wide diversification of asset types, investment fund strategies and external investment fund managers, and therefore has no significant concentration of risk. The investment policy of the Master Trust outlines investment objectives and defines the responsibilities of the EBPB, external investment managers, investment advisor and trustee and custodian. The investment policy is reviewed annually by PPL's Board of Directors. The EBPB created a risk management framework around the trust assets and pension liabilities. This framework considers the trust assets as being composed of three sub-portfolios: growth, immunizing and liquidity portfolios. The growth portfolio is comprised of investments that generate a return at a reasonable risk, including equity securities, certain debt securities and alternative investments. The immunizing portfolio consists of debt securities, generally with long durations, and derivative positions. The immunizing portfolio is designed to offset a portion of the change in the pension liabilities due to changes in interest rates. The liquidity portfolio consists primarily of cash and cash equivalents. Target allocation ranges have been developed for each portfolio on a plan basis based on input from external consultants with a goal of limiting funded status volatility. The EBPB monitors the investments in each portfolio on a plan basis, and seeks to obtain a target portfolio that emphasizes reduction of risk of loss from market volatility. In pursuing that goal, the EBPB establishes revised guidelines from time to time. EBPB investment guidelines as of the end of 2016 are presented below. The asset allocation for the trust and the target allocation by portfolio at December 31 are as follows:
Percentage of trust assets 2016
2016 (a) 2015 Target Asset Allocation (a)
Growth Portfolio 52% 51 % 50 %Equity securities 30 % 25 % Debt securities (b) 12 % 13 % Alternative investments 10 % 13 %
Immunizing Portfolio 46% 47 % 48 %Debt securities (b) 43 % 42 % Derivatives 3 % 5 %
Liquidity Portfolio 2% 2 % 2 %Total 100 % 100 % 100 %
(a) Allocations exclude consideration of a group annuity contract held by the LG&E and KU Retirement Plan. (b) Includes commingled debt funds, which PPL treats as debt securities for asset allocation purposes. (LKE) LKE has pension plans, including LG&E's plan, whose assets are invested solely in the Master Trust, which is fully disclosed below. The fair value of these plans' assets of $1.3 billion at December 31, 2016 and 2015 represents an interest of approximately 41% and 40% in the Master Trust.

144
(LG&E) LG&E has a pension plan whose assets are invested solely in the Master Trust, which is fully disclosed below. The fair value of this plan's assets of $318 million and $297 million at December 31, 2016 and 2015 represents an interest of approximately 10% and 9% in the Master Trust. (PPL, LKE and LG&E) The fair value of net assets in the Master Trust by asset class and level within the fair value hierarchy was:
December 31, 2016 December 31, 2015 Fair Value Measurements Using Fair Value Measurements Using
Total Level 1 Level 2 Level 3 Total Level 1 Level 2 Level 3 PPL Services Corporation Master Trust Cash and cash equivalents $ 181 $ 181 $ — $ — $ 225 $ 225 $ — $ — Equity securities:
U.S. Equity 152 152 — — 172 172 — — U.S. Equity fund measured at NAV (a) 272 — — — 197 — — — International equity fund at NAV (a) 551 — — — 454 — — — Commingled debt measured at NAV (a) 546 — — — 514 — — —
Debt securities: U.S. Treasury and U.S. government sponsored agency 381
381
—
—
501
492
9
—
Corporate 850 — 837 13 747 — 737 10 Other 8 — 8 — 14 — 14 —
Alternative investments: Commodities measured at NAV (a) — — — — 70 — — — Real estate measured at NAV (a) 102 — — — 118 — — — Private equity measured at NAV (a) 80 — — — 81 — — — Hedge funds measured at NAV (a) 167 — 171 — — —
Derivatives: Interest rate swaps and swaptions 61 — 61 — 80 — 80 — Other 3 — 3 — 11 — 11 —
Insurance contracts 27 — — 27 32 — — 32 PPL Services Corporation Master Trust assets, at fair value 3,381
$ 714
$ 909
$ 40
3,387
$ 889
$ 851
$ 42
Receivables and payables, net (b) (15 ) (49) 401(h) accounts restricted for other postretirement benefit obligations (123 ) (111)
Total PPL Services Corporation Master Trust pension assets $ 3,243
$ 3,227
(a) In accordance with accounting guidance certain investments that are measured at fair value using the net asset value per share (NAV), or its equivalent,
practical expedient have not been classified in the fair value hierarchy. The fair value amounts presented in the table are intended to permit reconciliation of the fair value hierarchy to the amounts presented in the statement of financial position.
(b) Receivables and payables represent amounts for investments sold/purchased but not yet settled along with interest and dividends earned but not yet received.
A reconciliation of the Master Trust assets classified as Level 3 at December 31, 2016 is as follows:
Corporate debt Insurance
contracts Total
Balance at beginning of period $ 10 $ 32 $ 42 Actual return on plan assets
Relating to assets still held at the reporting date — 1 1 Purchases, sales and settlements 3 (6 ) (3 )
Balance at end of period $ 13 $ 27 $ 40
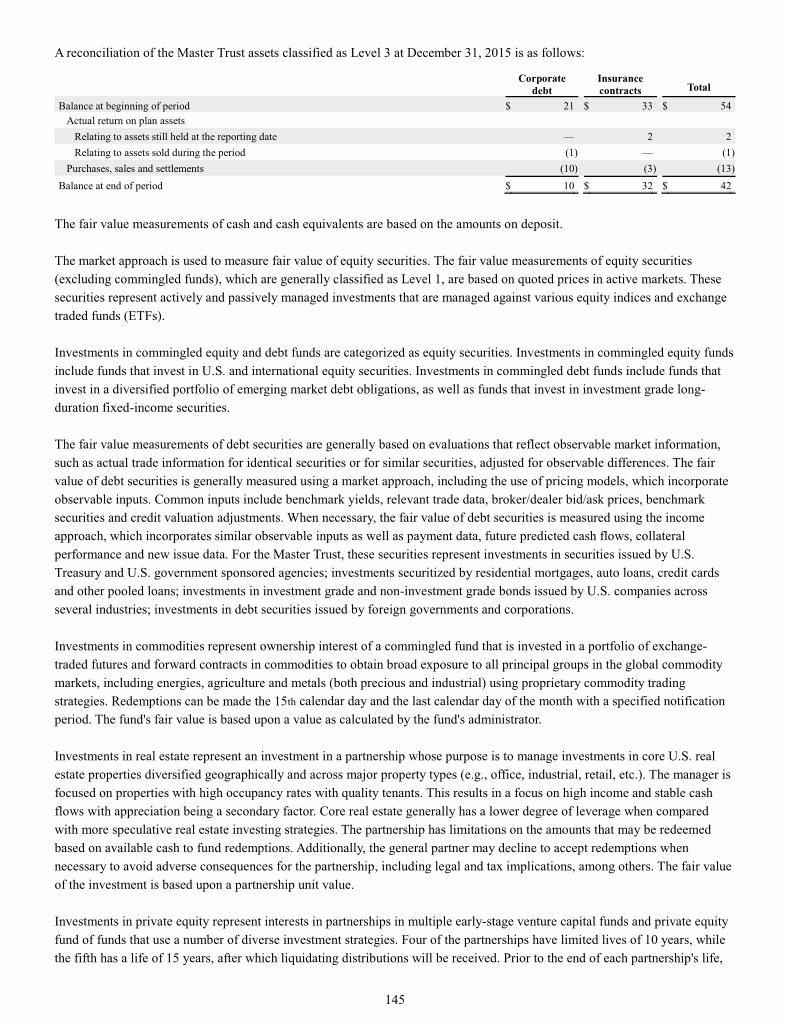
145
A reconciliation of the Master Trust assets classified as Level 3 at December 31, 2015 is as follows:
Corporate debt Insurance
contracts Total
Balance at beginning of period $ 21 $ 33 $ 54 Actual return on plan assets
Relating to assets still held at the reporting date — 2 2 Relating to assets sold during the period (1) — (1 )
Purchases, sales and settlements (10) (3 ) (13 ) Balance at end of period $ 10 $ 32 $ 42
The fair value measurements of cash and cash equivalents are based on the amounts on deposit. The market approach is used to measure fair value of equity securities. The fair value measurements of equity securities (excluding commingled funds), which are generally classified as Level 1, are based on quoted prices in active markets. These securities represent actively and passively managed investments that are managed against various equity indices and exchange traded funds (ETFs). Investments in commingled equity and debt funds are categorized as equity securities. Investments in commingled equity funds include funds that invest in U.S. and international equity securities. Investments in commingled debt funds include funds that invest in a diversified portfolio of emerging market debt obligations, as well as funds that invest in investment grade long-duration fixed-income securities. The fair value measurements of debt securities are generally based on evaluations that reflect observable market information, such as actual trade information for identical securities or for similar securities, adjusted for observable differences. The fair value of debt securities is generally measured using a market approach, including the use of pricing models, which incorporate observable inputs. Common inputs include benchmark yields, relevant trade data, broker/dealer bid/ask prices, benchmark securities and credit valuation adjustments. When necessary, the fair value of debt securities is measured using the income approach, which incorporates similar observable inputs as well as payment data, future predicted cash flows, collateral performance and new issue data. For the Master Trust, these securities represent investments in securities issued by U.S. Treasury and U.S. government sponsored agencies; investments securitized by residential mortgages, auto loans, credit cards and other pooled loans; investments in investment grade and non-investment grade bonds issued by U.S. companies across several industries; investments in debt securities issued by foreign governments and corporations. Investments in commodities represent ownership interest of a commingled fund that is invested in a portfolio of exchange-traded futures and forward contracts in commodities to obtain broad exposure to all principal groups in the global commodity markets, including energies, agriculture and metals (both precious and industrial) using proprietary commodity trading strategies. Redemptions can be made the 15th calendar day and the last calendar day of the month with a specified notification period. The fund's fair value is based upon a value as calculated by the fund's administrator. Investments in real estate represent an investment in a partnership whose purpose is to manage investments in core U.S. real estate properties diversified geographically and across major property types (e.g., office, industrial, retail, etc.). The manager is focused on properties with high occupancy rates with quality tenants. This results in a focus on high income and stable cash flows with appreciation being a secondary factor. Core real estate generally has a lower degree of leverage when compared with more speculative real estate investing strategies. The partnership has limitations on the amounts that may be redeemed based on available cash to fund redemptions. Additionally, the general partner may decline to accept redemptions when necessary to avoid adverse consequences for the partnership, including legal and tax implications, among others. The fair value of the investment is based upon a partnership unit value. Investments in private equity represent interests in partnerships in multiple early-stage venture capital funds and private equity fund of funds that use a number of diverse investment strategies. Four of the partnerships have limited lives of 10 years, while the fifth has a life of 15 years, after which liquidating distributions will be received. Prior to the end of each partnership's life,

146
the investment cannot be redeemed with the partnership; however, the interest may be sold to other parties, subject to the general partner's approval. The Master Trust has unfunded commitments of $22 million that may be required during the lives of the partnerships. Fair value is based on an ownership interest in partners' capital to which a proportionate share of net assets is attributed. Investments in hedge funds represent investments in a fund of hedge funds. Hedge funds seek a return utilizing a number of diverse investment strategies. The strategies, when combined aim to reduce volatility and risk while attempting to deliver positive returns under most market conditions. Major investment strategies for the fund of hedge funds include long/short equity, tactical trading, event driven, and relative value. Shares may be redeemed within 45 days prior written notice. The fund is subject to short term lockups and other restrictions. The fair value for the fund has been estimated using the net asset value per share. The fair value measurements of derivative instruments utilize various inputs that include quoted prices for similar contracts or market-corroborated inputs. In certain instances, these instruments may be valued using models, including standard option valuation models and standard industry models. These securities primarily represent investments in interest rate swaps and swaptions (the option to enter into an interest rate swap), which are valued based on the swap details, such as swap curves, notional amount, index and term of index, reset frequency, volatility and payer/receiver credit ratings. Insurance contracts, classified as Level 3, represent an investment in an immediate participation guaranteed group annuity contract. The fair value is based on contract value, which represents cost plus interest income less distributions for benefit payments and administrative expenses. Plan Assets - U.S. Other Postretirement Benefit Plans The investment strategy with respect to other postretirement benefit obligations is to fund VEBA trusts and/or 401(h) accounts with voluntary contributions and to invest in a tax efficient manner. Excluding the 401(h) accounts included in the Master Trust, other postretirement benefit plans are invested in a mix of assets for long-term growth with an objective of earning returns that provide liquidity as required for benefit payments. These plans benefit from diversification of asset types, investment fund strategies and investment fund managers, and therefore, have no significant concentration of risk. Equity securities include investments in domestic large-cap commingled funds. Ownership interests in commingled funds that invest entirely in debt securities are classified as equity securities, but treated as debt securities for asset allocation and target allocation purposes. Ownership interests in money market funds are treated as cash and cash equivalents for asset allocation and target allocation purposes. The asset allocation for the PPL VEBA trusts, excluding LKE, and the target allocation, by asset class, at December 31 are detailed below.
Percentage of plan assets Target Asset Allocation
2016 2015 2016 Asset Class U.S. Equity securities 48% 48 % 45 % Debt securities (a) 50% 50 % 50 % Cash and cash equivalents (b) 2% 2 % 5 %
Total 100% 100 % 100 %
(a) Includes commingled debt funds and debt securities. (b) Includes money market funds. LKE's other postretirement benefit plan is invested primarily in a 401(h) account, as disclosed in the PPL Services Corporation Master Trust, with insignificant amounts invested in money market funds within VEBA trusts for liquidity.

147
The fair value of assets in the U.S. other postretirement benefit plans by asset class and level within the fair value hierarchy was:
December 31, 2016 December 31, 2015
Fair Value Measurement Using Fair Value Measurement Using
Total Level 1 Level 2 Level 3 Total Level 1 Level 2 Level 3 Money market funds $ 5 $ 5 $ — $ — $ 6 $ 6 $ — $ — U.S. Equity securities:
Large-cap equity fund measure at NAV (a) 123 — — — 129 — — — Commingled debt fund measured at NAV (a) 114 — — — 109 — — —
Debt securities: Municipalities 12 — 12 — 23 — 23 —
Total VEBA trust assets, at fair value 254 $ 5 $ 12 $ — 267 $ 6 $ 23 $ — Receivables and payables, net (b) 1 1 401(h) account assets 123 111 Total other postretirement benefit plan assets $ 378 $ 379
(a) In accordance with accounting guidance certain investments that are measured at fair value using the net asset value per share (NAV), or its equivalent,
practical expedient have not been classified in the fair value hierarchy. The fair value amounts presented in the table are intended to permit reconciliation of the fair value hierarchy to the amounts presented in the statement of financial position.
(b) Receivables and payables represent amounts for investments sold/purchased but not yet settled along with interest and dividends earned but not yet received.
Investments in money market funds represent investments in funds that invest primarily in a diversified portfolio of investment grade money market instruments, including, but not limited to, commercial paper, notes, repurchase agreements and other evidences of indebtedness with a maturity not exceeding 13 months from the date of purchase. The primary objective of the fund is a level of current income consistent with stability of principal and liquidity. Redemptions can be made daily on this fund. Investments in large-cap equity securities represent investments in a passively managed equity index fund that invests in securities and a combination of other collective funds. Fair value measurements are not obtained from a quoted price in an active market but are based on firm quotes of net asset values per share as provided by the trustee of the fund. Redemptions can be made daily on this fund. Investments in commingled debt securities represent investments in a fund that invests in a diversified portfolio of investment grade long-duration fixed income securities. Redemptions can be made daily on these funds. Investments in municipalities represent investments in a diverse mix of tax-exempt municipal securities. The fair value measurements for these securities are based on recently executed transactions for identical securities or for similar securities. Plan Assets - U.K. Pension Plans (PPL) The overall investment strategy of WPD's pension plans is developed by each plan's independent trustees in its Statement of Investment Principles in compliance with the U.K. Pensions Act of 1995 and other U.K. legislation. The trustees' primary focus is to ensure that assets are sufficient to meet members' benefits as they fall due with a longer term objective to reduce investment risk. The investment strategy is intended to maximize investment returns while not incurring excessive volatility in the funding position. WPD's plans are invested in a wide diversification of asset types, fund strategies and fund managers; and therefore, have no significant concentration of risk. Commingled funds that consist entirely of debt securities are traded as equity units, but treated by WPD as debt securities for asset allocation and target allocation purposes. These include investments in U.K. corporate bonds and U.K. gilts.

148
The asset allocation and target allocation at December 31 of WPD's pension plans are detailed below.
Target Asset
Percentage of plan assets Allocation 2016 2015 2016
Asset Class Cash and cash equivalents 1% 1 % 1 % Equity securities
U.K. 3% 3 % 3 % European (excluding the U.K.) 2% 2 % 2 % Asian-Pacific 2% 2 % 2 % North American 3% 3 % 3 % Emerging markets 3% 4 % 1 % Global equities 6% 6 % 3 % Currency —% 1 % — % Global Tactical Asset Allocation 33% 31 % 40 %
Debt securities (a) 41% 40 % 39 % Alternative investments 6% 7 % 6 %
Total 100% 100 % 100 %
(a) Includes commingled debt funds.
The fair value of assets in the U.K. pension plans by asset class and level within the fair value hierarchy was:
December 31, 2016 December 31, 2015
Fair Value Measurement Using Fair Value Measurement Using Total Level 1 Level 2 Level 3 Total Level 1 Level 2 Level 3
Cash and cash equivalents $ 42 $ 42 $ — $ — $ 55 $ 55 $ — $ — Equity securities measured at NAV (a) :
U.K. companies 210 — — — 274 — — — European companies (excluding the U.K.) 177 — — — 190 — — — Asian-Pacific companies 140 — — — 132 — — — North American companies 227 — — — 220 — — — Emerging markets companies 209 — — — 284 — — — Global Equities 466 — — — 500 — — — Currency — — — — 39 — — — Other 2,363 — — — 2,384 — — Commingled debt:
U.K. corporate bonds — — — — 2 — — — U.K. gilts — — — — 3 — — —
Debt Securities: U.K. corporate bonds 2 — 2 — 364 — 364 — U.K. gilts 2,940 — 2,940 — 2,645 — 2,645 —
Alternative investments: Real estate measured at NAV (a) 435 — — — 533 — — —
Fair value - U.K. pension plans $ 7,211 $ 42 $ 2,942 $ — $ 7,625 $ 55 $ 3,009 $ — (a) In accordance with accounting guidance certain investments that are measured at fair value using the net asset value per share (NAV), or its equivalent,
practical expedient have not been classified in the fair value hierarchy. The fair value amounts presented in the table are intended to permit reconciliation of the fair value hierarchy to the amounts presented in the statement of financial position.
Except for investments in real estate, the fair value measurements of WPD's pension plan assets are based on the same inputs and measurement techniques used to measure the U.S. pension plan assets described above. Investments in equity securities represent actively and passively managed funds that are measured against various equity indices.
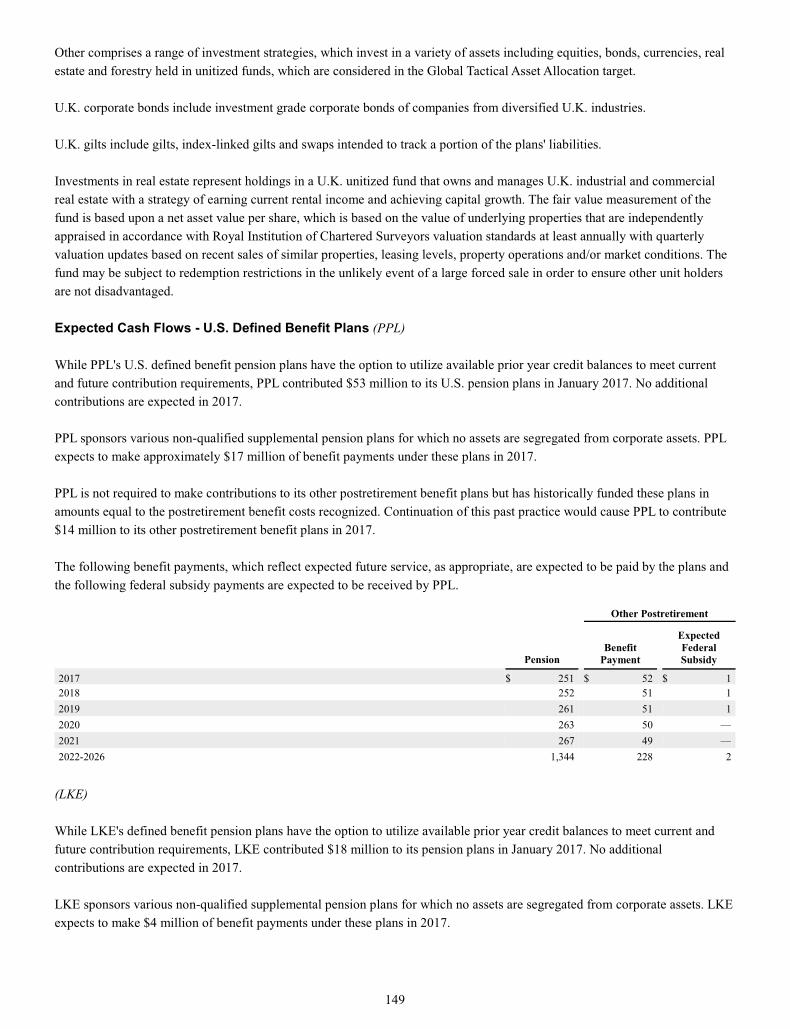
149
Other comprises a range of investment strategies, which invest in a variety of assets including equities, bonds, currencies, real estate and forestry held in unitized funds, which are considered in the Global Tactical Asset Allocation target. U.K. corporate bonds include investment grade corporate bonds of companies from diversified U.K. industries. U.K. gilts include gilts, index-linked gilts and swaps intended to track a portion of the plans' liabilities. Investments in real estate represent holdings in a U.K. unitized fund that owns and manages U.K. industrial and commercial real estate with a strategy of earning current rental income and achieving capital growth. The fair value measurement of the fund is based upon a net asset value per share, which is based on the value of underlying properties that are independently appraised in accordance with Royal Institution of Chartered Surveyors valuation standards at least annually with quarterly valuation updates based on recent sales of similar properties, leasing levels, property operations and/or market conditions. The fund may be subject to redemption restrictions in the unlikely event of a large forced sale in order to ensure other unit holders are not disadvantaged. Expected Cash Flows - U.S. Defined Benefit Plans (PPL) While PPL's U.S. defined benefit pension plans have the option to utilize available prior year credit balances to meet current and future contribution requirements, PPL contributed $53 million to its U.S. pension plans in January 2017. No additional contributions are expected in 2017. PPL sponsors various non-qualified supplemental pension plans for which no assets are segregated from corporate assets. PPL expects to make approximately $17 million of benefit payments under these plans in 2017. PPL is not required to make contributions to its other postretirement benefit plans but has historically funded these plans in amounts equal to the postretirement benefit costs recognized. Continuation of this past practice would cause PPL to contribute $14 million to its other postretirement benefit plans in 2017. The following benefit payments, which reflect expected future service, as appropriate, are expected to be paid by the plans and the following federal subsidy payments are expected to be received by PPL.
Other Postretirement
Pension Benefit
Payment
Expected Federal Subsidy
2017 $ 251 $ 52 $ 1 2018 252 51 1 2019 261 51 1 2020 263 50 — 2021 267 49 — 2022-2026 1,344 228 2
(LKE) While LKE's defined benefit pension plans have the option to utilize available prior year credit balances to meet current and future contribution requirements, LKE contributed $18 million to its pension plans in January 2017. No additional contributions are expected in 2017. LKE sponsors various non-qualified supplemental pension plans for which no assets are segregated from corporate assets. LKE expects to make $4 million of benefit payments under these plans in 2017.

150
LKE is not required to make contributions to its other postretirement benefit plan but has historically funded this plan in amounts equal to the postretirement benefit costs recognized. Continuation of this past practice would cause LKE to contribute a projected $14 million to its other postretirement benefit plan in 2017. The following benefit payments, which reflect expected future service, as appropriate, are expected to be paid by the plans and the following federal subsidy payments are expected to be received by LKE.
Other Postretirement
Pension Benefit
Payment
Expected Federal Subsidy
2017 $ 105 $ 14 $ — 2018 108 14 — 2019 110 15 1 2020 111 16 — 2021 113 16 — 2022-2026 569 82 2
(LG&E) LG&E's defined benefit pension plan has the option to utilize available prior year credit balances to meet current and future contribution requirements. There are no contributions expected to be made in 2017. The following benefit payments, which reflect expected future service, as appropriate, are expected to be paid by the plan.
Pension 2017 $ 25 2018 25 2019 25 2020 25 2021 24 2022-2026 110
Expected Cash Flows - U.K. Pension Plans (PPL) The pension plans of WPD are subject to formal actuarial valuations every three years, which are used to determine funding requirements. Contribution requirements were evaluated in accordance with the valuations performed as of March 31, 2013 and March 31, 2016. WPD expects to make contributions of approximately $389 million in 2017, including $98 million WPD contributed to its U.K. pension plans in January 2017. WPD is currently permitted to recover in current revenues approximately 78% of its pension funding requirements for its primary pension plans. The following benefit payments, which reflect expected future service, as appropriate, are expected to be paid by the plans.
Pension 2017 $ 314 2018 317 2019 322 2020 326 2021 329 2022-2026 1,693
Savings Plans (All Registrants) Substantially all employees of PPL's subsidiaries are eligible to participate in deferred savings plans (401(k)s). Employer contributions to the plans were:

151
2016 2015 2014
PPL $ 35 $ 34 $ 33 PPL Electric 6 6 6 LKE 17 16 15 LG&E 5 5 5 KU 4 4 4
Separation Benefits Certain PPL subsidiaries provide separation benefits to eligible employees. These benefits may be provided in the case of separations due to performance issues, loss of job-related qualifications or organizational changes. Until December 1, 2012, certain employees separated were eligible for cash severance payments, outplacement services, accelerated stock award vesting, continuation of group health and welfare coverage, and enhanced pension and postretirement medical benefits. As of December 1, 2012, separation benefits for certain employees were changed to eliminate accelerated stock award vesting and enhanced pension and postretirement medical benefits. Also, the continuation of group health and welfare coverage was replaced with a single sum payment approximating the dollar amount of premium payments that would be incurred for continuation of group health and welfare coverage. Separation benefits are recorded when such amounts are probable and estimable. See Note 8 for a discussion of separation benefits recognized in 2015 and 2014 related to the spinoff of PPL Energy Supply. Separation benefits were not significant in 2016. 12. Jointly Owned Facilities (PPL, LKE, LG&E and KU) At December 31, 2016 and 2015, the Balance Sheets reflect the owned interests in the facilities listed below.
Ownership
Interest Electric Plant Accumulated Depreciation
Construction Work
in Progress
PPL and LKE December 31, 2016 Generating Plants Trimble County Unit 1 75.00% $ 407 $ 55 $ 1 Trimble County Unit 2 75.00% 1,026 161 83 December 31, 2015 Generating Plants Trimble County Unit 1 75.00% $ 399 $ 44 $ 6 Trimble County Unit 2 75.00% 1,013 141 27 LG&E December 31, 2016 Generating Plants E.W. Brown Units 6-7 38.00% $ 40 $ 15 $ — Paddy's Run Unit 13 & E.W. Brown Unit 5 53.00% 55 12 1 Trimble County Unit 1 75.00% 407 55 1 Trimble County Unit 2 14.25% 214 32 43 Trimble County Units 5-6 29.00% 30 8 1 Trimble County Units 7-10 37.00% 71 17 1 Cane Run Unit 7 22.00% 114 5 2 E.W. Brown Solar Unit 39.00% 10 — —
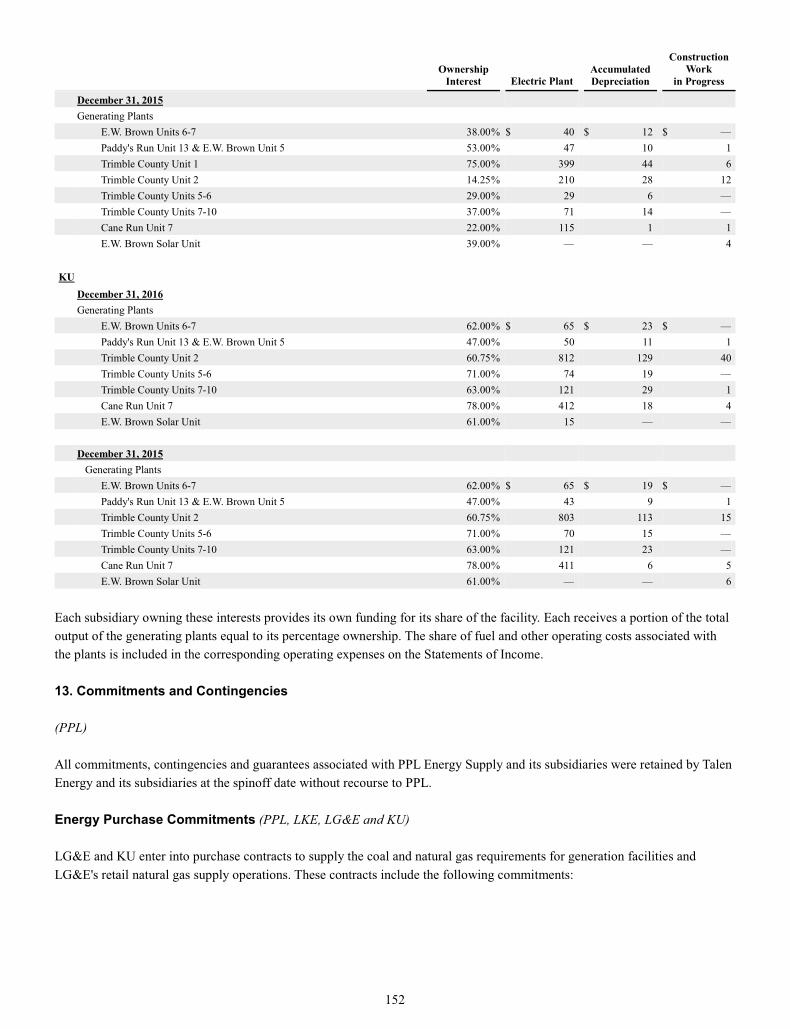
152
Ownership
Interest Electric Plant Accumulated Depreciation
Construction Work
in Progress
December 31, 2015 Generating Plants E.W. Brown Units 6-7 38.00% $ 40 $ 12 $ — Paddy's Run Unit 13 & E.W. Brown Unit 5 53.00% 47 10 1 Trimble County Unit 1 75.00% 399 44 6 Trimble County Unit 2 14.25% 210 28 12 Trimble County Units 5-6 29.00% 29 6 — Trimble County Units 7-10 37.00% 71 14 — Cane Run Unit 7 22.00% 115 1 1 E.W. Brown Solar Unit 39.00% — — 4 KU December 31, 2016 Generating Plants E.W. Brown Units 6-7 62.00% $ 65 $ 23 $ — Paddy's Run Unit 13 & E.W. Brown Unit 5 47.00% 50 11 1 Trimble County Unit 2 60.75% 812 129 40 Trimble County Units 5-6 71.00% 74 19 — Trimble County Units 7-10 63.00% 121 29 1 Cane Run Unit 7 78.00% 412 18 4 E.W. Brown Solar Unit 61.00% 15 — — December 31, 2015 Generating Plants E.W. Brown Units 6-7 62.00% $ 65 $ 19 $ — Paddy's Run Unit 13 & E.W. Brown Unit 5 47.00% 43 9 1 Trimble County Unit 2 60.75% 803 113 15 Trimble County Units 5-6 71.00% 70 15 — Trimble County Units 7-10 63.00% 121 23 — Cane Run Unit 7 78.00% 411 6 5 E.W. Brown Solar Unit 61.00% — — 6
Each subsidiary owning these interests provides its own funding for its share of the facility. Each receives a portion of the total output of the generating plants equal to its percentage ownership. The share of fuel and other operating costs associated with the plants is included in the corresponding operating expenses on the Statements of Income. 13. Commitments and Contingencies (PPL) All commitments, contingencies and guarantees associated with PPL Energy Supply and its subsidiaries were retained by Talen Energy and its subsidiaries at the spinoff date without recourse to PPL. Energy Purchase Commitments (PPL, LKE, LG&E and KU) LG&E and KU enter into purchase contracts to supply the coal and natural gas requirements for generation facilities and LG&E's retail natural gas supply operations. These contracts include the following commitments:
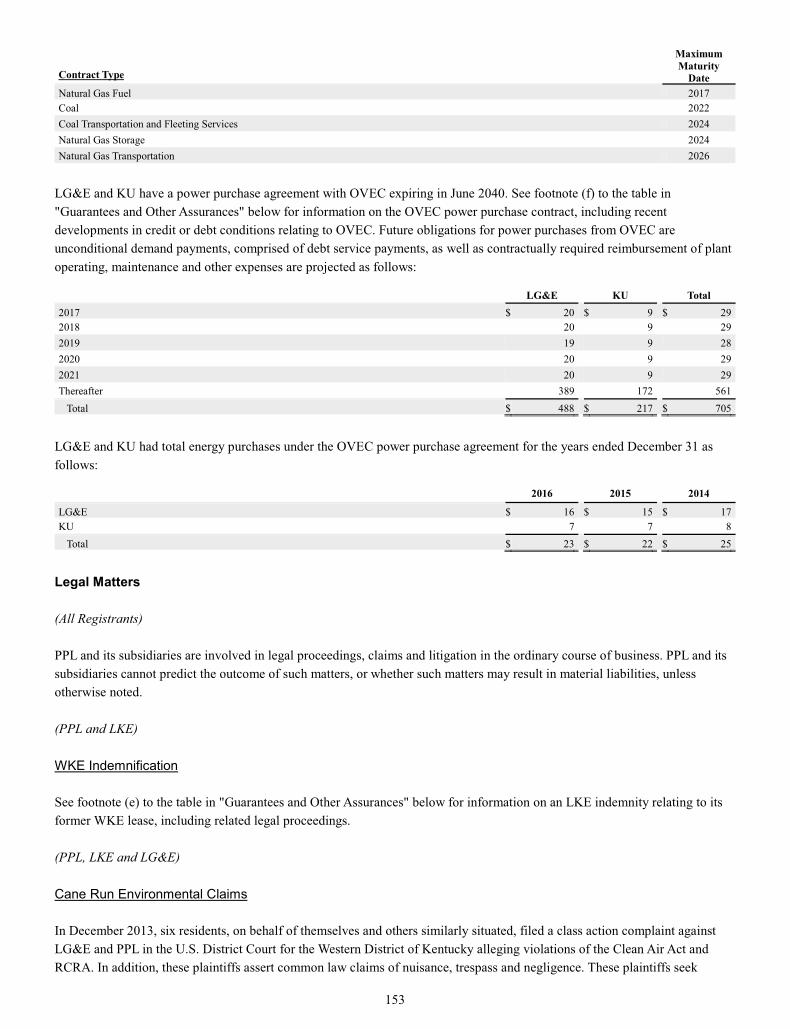
153
Contract Type
Maximum Maturity
Date Natural Gas Fuel 2017 Coal 2022 Coal Transportation and Fleeting Services 2024 Natural Gas Storage 2024 Natural Gas Transportation 2026
LG&E and KU have a power purchase agreement with OVEC expiring in June 2040. See footnote (f) to the table in "Guarantees and Other Assurances" below for information on the OVEC power purchase contract, including recent developments in credit or debt conditions relating to OVEC. Future obligations for power purchases from OVEC are unconditional demand payments, comprised of debt service payments, as well as contractually required reimbursement of plant operating, maintenance and other expenses are projected as follows:
LG&E KU Total 2017 $ 20 $ 9 $ 29 2018 20 9 29 2019 19 9 28 2020 20 9 29 2021 20 9 29 Thereafter 389 172 561
Total $ 488 $ 217 $ 705 LG&E and KU had total energy purchases under the OVEC power purchase agreement for the years ended December 31 as follows:
2016 2015 2014
LG&E $ 16 $ 15 $ 17 KU 7 7 8
Total $ 23 $ 22 $ 25 Legal Matters (All Registrants) PPL and its subsidiaries are involved in legal proceedings, claims and litigation in the ordinary course of business. PPL and its subsidiaries cannot predict the outcome of such matters, or whether such matters may result in material liabilities, unless otherwise noted. (PPL and LKE) WKE Indemnification See footnote (e) to the table in "Guarantees and Other Assurances" below for information on an LKE indemnity relating to its former WKE lease, including related legal proceedings. (PPL, LKE and LG&E) Cane Run Environmental Claims In December 2013, six residents, on behalf of themselves and others similarly situated, filed a class action complaint against LG&E and PPL in the U.S. District Court for the Western District of Kentucky alleging violations of the Clean Air Act and RCRA. In addition, these plaintiffs assert common law claims of nuisance, trespass and negligence. These plaintiffs seek

154
injunctive relief and civil penalties, plus costs and attorney fees, for the alleged statutory violations. Under the common law claims, these plaintiffs seek monetary compensation and punitive damages for property damage and diminished property values for a class consisting of residents within four miles of the Cane Run plant. In their individual capacities, these plaintiffs sought compensation for alleged adverse health effects. In response to a motion to dismiss filed by PPL and LG&E, in July 2014, the court dismissed the plaintiffs' RCRA claims and all but one Clean Air Act claim, but declined to dismiss their common law tort claims. In November 2016, plaintiffs filed an amended complaint removing the personal injury claims and removing certain previously named plaintiffs. In February 2017, the District Court issued an order dismissing PPL as a defendant and dismissing the final federal claim against LG&E, under the Clean Air Act, and directed the parties to submit briefs regarding whether the court should continue to exercise supplemental jurisdiction regarding the remaining state law-only claims. PPL, LKE and LG&E cannot predict the outcome of this matter. LG&E retired one coal-fired unit at the Cane Run plant in March 2015 and the remaining two coal-fired units at the plant in June 2015. Mill Creek Environmental Claims In May 2014, the Sierra Club filed a citizen suit against LG&E in the U.S. District Court for the Western District of Kentucky for alleged violations of the Clean Water Act. The Sierra Club alleged that various discharges at the Mill Creek plant constituted violations of the plant's water discharge permit. The Sierra Club sought civil penalties, injunctive relief, costs and attorney's fees. The parties reached a proposed settlement in the matter in September 2016. LG&E has agreed to limited alterations to outfall facilities and discharge practices and to fund $1 million in environmental enhancement projects focused on tree planting and water quality in Kentucky. The settlement includes no finding or agreement of any violation of law by LG&E and does not involve fines or civil penalties. In December 2016, the court approved the proposed settlement which resolves the pending litigation. (PPL, LKE and KU) E.W. Brown Environmental Claims In October 2015, KU received a notice of intent from Earthjustice and the Sierra Club informing certain federal and state agencies of the Sierra Club's intent to file a citizen suit, following expiration of the mandatory 60-day notification period, for alleged violations of the Clean Water Act. The claimants allege discharges at the E.W. Brown plant in violation of applicable rules and the plant's water discharge permit. The claimants assert that, unless the alleged discharges are promptly brought into compliance, it intends to seek civil penalties, injunctive relief and attorney's fees. In November 2015, the claimants submitted an amended notice of intent to add the Kentucky Waterways Alliance as a claimant. On October 26, 2016, the claimants submitted an additional notice of intent alleging management of waste in a manner that may present an imminent and substantial endangerment under the RCRA. PPL, LKE and KU cannot predict the outcome of this matter or the potential impact on the operations of the E. W. Brown plant, including increased capital or operating costs, if any. (PPL, LKE, LG&E and KU) Trimble County Unit 2 Air Permit The Sierra Club and other environmental groups petitioned the Kentucky Environmental and Public Protection Cabinet to overturn the air permit issued for the Trimble County Unit 2 baseload coal-fired generating unit, but the agency upheld the permit in an order issued in September 2007. In response to subsequent petitions by environmental groups, the EPA ordered certain non-material changes to the permit, which in January 2010, were incorporated into a final revised permit issued by the Kentucky Division for Air Quality. In March 2010, the environmental groups petitioned the EPA to object to the revised state permit. Until the EPA issues a final ruling on the pending petition and all available appeals are exhausted, PPL, LKE, LG&E and KU cannot predict the outcome of this matter or the potential impact on the operations of the Trimble County plant, including increased capital or operating costs, if any.

155
Trimble County Water Discharge Permit In May 2010, the Kentucky Waterways Alliance and other environmental groups filed a petition with the Kentucky Energy and Environment Cabinet (KEEC) challenging the Kentucky Pollutant Discharge Elimination System permit issued in April 2010, which covers water discharges from the Trimble County plant. In November 2010, the KEEC issued a final order upholding the permit, which was subsequently appealed by the environmental groups. In September 2013, the Franklin Circuit Court reversed the KEEC order upholding the permit and remanded the permit to the agency for further proceedings. LG&E and the KEEC appealed the order to the Kentucky Court of Appeals. In July 2015, the Court of Appeals upheld the lower court ruling. LG&E and the KEEC moved for discretionary review by the Kentucky Supreme Court. In February 2016, the Kentucky Supreme Court issued an order granting discretionary review and oral arguments were held in September 2016. PPL, LKE, LG&E and KU are unable to predict the outcome of this matter or the potential impact on the operations of the Trimble County plant, including increased capital or operating costs, if any. (All Registrants) Regulatory Issues See Note 6 for information on regulatory matters related to utility rate regulation. Electricity - Reliability Standards The NERC is responsible for establishing and enforcing mandatory reliability standards (Reliability Standards) regarding the bulk electric system in North America. The FERC oversees this process and independently enforces the Reliability Standards. The Reliability Standards have the force and effect of law and apply to certain users of the bulk electric system, including electric utility companies, generators and marketers. Under the Federal Power Act, the FERC may assess civil penalties for certain violations. LG&E, KU and PPL Electric monitor their compliance with the Reliability Standards and self-report or self-log potential violations of applicable reliability requirements whenever identified, and submit accompanying mitigation plans, as required. The resolution of a small number of potential violations is pending. Penalties incurred to date have not been significant. Any Regional Reliability Entity (including RFC or SERC) determination concerning the resolution of violations of the Reliability Standards remains subject to the approval of the NERC and the FERC. In the course of implementing their programs to ensure compliance with the Reliability Standards by those PPL affiliates subject to the standards, certain other instances of potential non-compliance may be identified from time to time. The Registrants cannot predict the outcome of these matters, and cannot estimate a range of reasonably possible losses, if any. Environmental Matters (All Registrants) Due to the environmental issues discussed below or other environmental matters, it may be necessary for the Registrants to modify, curtail, replace or cease operation of certain facilities or performance of certain operations to comply with statutes, regulations and other requirements of regulatory bodies or courts. In addition, legal challenges to new environmental permits or rules add to the uncertainty of estimating the future cost of these permits and rules. WPD's distribution businesses are subject to certain statutory and regulatory environmental requirements. In connection with the matters discussed below, it may be necessary for WPD to incur significant compliance costs, which costs may be recoverable through rates subject to the approval of Ofgem. PPL believes that WPD has taken and continues to take measures to comply with all applicable environmental laws and regulations.

156
LG&E and KU are entitled to recover, through the ECR mechanism, certain costs of complying with the Clean Air Act, as amended, and those federal, state or local environmental requirements applicable to coal combustion wastes and by-products from facilities that generate electricity from coal in accordance with approved compliance plans. Costs not covered by the ECR mechanism for LG&E and KU and all such costs for PPL Electric are subject to rate recovery before the companies' respective state regulatory authorities, or the FERC, if applicable. Because neither WPD nor PPL Electric owns any generating plants, their exposure to related environmental compliance costs is reduced. PPL, PPL Electric, LKE, LG&E and KU can provide no assurances as to the ultimate outcome of future environmental or rate proceedings before regulatory authorities. Air (PPL, LKE, LG&E and KU) The Clean Air Act, which regulates air pollutants from mobile and stationary sources in the United States, has a significant impact on the operation of fossil fuel plants. The Clean Air Act requires the EPA periodically to review and establish concentration levels in the ambient air for six criteria pollutants to protect public health and welfare. These concentration levels are known as NAAQS. The six criteria pollutants are carbon monoxide, lead, nitrogen dioxide, ozone, particulate matter and sulfur dioxide. Federal environmental regulations of these criteria pollutants require states to adopt implementation plans, known as state implementation plans, for certain pollutants, which detail how the state will attain the standards that are mandated by the relevant law or regulation. Each state identifies the areas within its boundaries that meet the NAAQS (attainment areas) and those that do not (non-attainment areas), and must develop a state implementation plan both to bring non-attainment areas into compliance with the NAAQS and to maintain good air quality in attainment areas. In addition, for attainment of ozone and fine particulates standards, states in the eastern portion of the country, including Kentucky, are subject to a regional program developed by the EPA known as the Cross-State Air Pollution Rule. The NAAQS, future revisions to the NAAQS and state implementation plans, or future revisions to regional programs, may require installation of additional pollution controls, the costs of which PPL, LKE, LG&E and KU believe are subject to cost recovery. Although PPL, LKE, LG&E and KU do not anticipate significant costs to comply with these programs, changes in market or operating conditions could result in different costs than anticipated. National Ambient Air Quality Standards (NAAQS) Under the Clean Air Act, the EPA is required to reassess the NAAQS for certain air pollutants on a five-year schedule. In 2008, the EPA revised the NAAQS for ozone and proposed to further strengthen the standard in November 2014. The EPA released a new ozone standard on October 1, 2015. The states and the EPA will determine attainment with the new ozone standard through review of relevant ambient air monitoring data, with attainment or nonattainment designations scheduled no later than October 2017. States are also obligated to address interstate transport issues associated with new ozone standards through the establishment of "good neighbor" state implementation plans for those states that are found to contribute significantly to another state's non-attainment. States that are not in the ozone transport region, including Kentucky, worked together to evaluate the need for further nitrogen oxide reductions from fossil-fueled plants with SCRs. Based on regulatory developments to date, PPL, LKE, LG&E, and KU do not anticipate requirements for nitrogen oxide reductions beyond those currently required under the Cross State Air Pollution Rule. In 2010, the EPA finalized revised NAAQS for sulfur dioxide and required states to identify areas that meet those standards and areas that are in "non-attainment". In July 2013, the EPA finalized non-attainment designations for parts of the country, including part of Jefferson County in Kentucky. Attainment must be achieved by 2018. Based on regulatory developments to date, PPL, LKE, LG&E and KU expect that certain previously required compliance measures, such as upgraded or new sulfur dioxide Scrubbers and additional sulfur dioxide limits at certain plants and the retirement of coal-fired generating units at

157
LG&E's Cane Run plant and KU's Green River plant, are sufficient to achieve compliance with the new sulfur dioxide and ozone standards. Mercury and Air Toxics Standards (MATS) In February 2012, the EPA finalized the MATS rule requiring reductions of mercury and other hazardous air pollutants from fossil-fuel fired power plants, with an effective date of April 16, 2012. In a subsequent judicial challenge, the U.S. Supreme Court (Supreme Court) held that the EPA failed to properly consider costs when deciding to regulate hazardous air emissions from power plants under MATS. The Supreme Court remanded the matter to the D.C. Circuit Court which, in December 2015, remanded the rule to the EPA without vacating it. The EPA has proposed a supplemental finding regarding costs of the rule. The EPA's MATS rule remains in effect during the pendency of the ongoing proceedings. LG&E and KU have installed significant controls in response to the MATS rule and in conjunction with compliance with other environmental requirements, including fabric-filter baghouses, upgraded Scrubbers or chemical additive systems for which appropriate KPSC authorization and/or ECR treatment has been received. LG&E and KU have received KPSC approval for a compliance plan providing for installation of additional MATS-related controls; however, the estimated cost of these controls is not expected to be significant for either LG&E or KU. See Note 6 for additional information. New Source Review (NSR) The NSR litigation brought by the EPA, states and environmental groups against coal-fired generating plants in past years continues to proceed through the courts. Although none of this litigation directly involves PPL, LKE, LG&E or KU, it can influence the permitting of large capital projects at LG&E's and KU's power plants, the costs of which cannot presently be determined but could be significant. Climate Change There is continuing world-wide attention focused on issues related to climate change. In June 2016, the President announced that the United States, Canada and Mexico have established the North American Climate, Clean Energy, and Environment Partnership Plan, which specifies actions to promote clean energy, address climate change and protect the environment. The plan includes a goal to provide 50% of the energy used in North America from clean energy sources by 2025. The plan does not impose any nation-specific requirements. In December 2015, 195 nations, including the U.S., signed the Paris Agreement on Climate, which establishes a comprehensive framework for the reduction of greenhouse gas (GHG) emissions from both developed and developing nations. Although the agreement does not establish binding reduction requirements, it requires each nation to prepare, communicate, and maintain GHG reduction commitments. Reductions can be achieved in a variety of ways, including energy conservation, power plant efficiency improvements, reduced utilization of coal-fired generation or replacing coal-fired generation with natural gas or renewable generation. Based on the EPA's Clean Power Plan described below, the U.S. has committed to an initial reduction target of 26% to 28% below 2005 levels by 2025. However, the new U.S. presidential administration has expressed an intention to review existing Climate Change commitments to determine if changes are warranted. PPL, LKE, LG&E, and KU cannot predict the outcome of such review or the impact, if any, on plant operations, rate treatment or future capital or operating needs. The U.K. has enacted binding carbon reduction requirements that are applicable to WPD. Under the U.K. law, WPD must purchase carbon allowances to offset emissions associated with WPD's operations. The cost of these allowances is included in WPD's current operating expenses. The EPA's Rules under Section 111 of the Clean Air Act As further described below, the EPA finalized rules imposing GHG emission standards for both new and existing power plants. The EPA has also issued a proposed federal implementation plan that would apply to any states that fail to submit an acceptable

158
state implementation plan under these rules. The EPA's authority to promulgate these regulations under Section 111 of the Clean Air Act has been challenged in the D.C. Circuit Court by several states and industry groups. On February 9, 2016, the Supreme Court stayed the rule for existing plants (the Clean Power Plan) pending the D.C. Circuit Court's review and subsequent review by the Supreme Court if a writ of certiorari is filed and granted. The EPA's rule for new power plants imposes separate emission standards for coal and natural gas units based on the application of different technologies. The coal standard is based on the application of partial carbon capture and sequestration technology, but because this technology is not presently commercially viable, the rule effectively precludes the construction of new coal-fired plants. The standard for NGCC power plants is the same as the EPA proposed in 2012 and is not continuously achievable. The preclusion of new coal-fired plants and the compliance difficulties posed for new natural gas-fired plants could have a significant industry-wide impact. The EPA's Clean Power Plan The EPA's rule for existing power plants, referred to as the Clean Power Plan, was published in the Federal Register in October 2015. The Clean Power Plan contains state-specific rate-based and mass-based reduction goals and guidelines for the development, submission and implementation of state implementation plans to achieve the state goals. State-specific goals were calculated from 2012 data by applying the EPA's broad interpretation and definition of the BSER, resulting in the most stringent targets to be met in 2030, with interim targets to be met beginning in 2022. The EPA believes it has offered some flexibility to the states as to how their compliance plans can be crafted, including the option to use a rate-based approach (limit emissions per megawatt hour) or a mass-based approach (limit total tons of emissions per year), and the option to demonstrate compliance through emissions trading and multi-state collaborations. Under the rate-based approach, Kentucky would need to make a 41% reduction from its 2012 emissions rate and under a mass-based approach it would need to make a 36% reduction. These reductions are significantly greater than initially proposed and present significant challenges to the state. If the Clean Power Plan is ultimately upheld and Kentucky fails to develop an approvable implementation plan by the applicable deadline, the EPA may impose a federal implementation plan that could be more stringent than what the state plan might provide. Depending on the provisions of the Kentucky implementation plan, LG&E and KU may need to modify their current portfolio of generating assets during the next decade and/or participate in an allowance trading program. LG&E and KU are monitoring developments at the state and federal level. Various states, industry groups and individual companies including LKE have filed petitions for reconsideration with EPA and petitions for review with the D.C. Circuit Court challenging the Clean Power Plan. In February 2016, the U.S. Supreme Court stayed the rule pending the D.C. Circuit Court's review. A ruling from the D.C. Circuit Court is expected in 2017. The new U.S. presidential administration has expressed an intention to review the Clean Power Plan and related regulatory developments to determine if changes are warranted. PPL, LKE, LG&E and KU cannot predict the outcome of the pending litigation, any changes in regulations, interpretations, or litigation positions that may be implemented by the new U.S. presidential administration or the potential impact, if any, on plant operations, or future capital or operating costs. PPL, LKE, LG&E and KU believe that the costs, which could be significant, would be subject to cost recovery. In April 2014, the Kentucky General Assembly passed legislation limiting the measures that the Kentucky Energy and Environment Cabinet may consider in setting performance standards to comply with the EPA's regulations governing GHG emissions from existing sources, if enacted. The legislation provides that such state GHG performance standards shall be based on emission reductions, efficiency measures and other improvements available at each power plant, rather than renewable energy, end-use energy efficiency, fuel switching and re-dispatch. These statutory restrictions may make it more difficult for Kentucky to achieve the GHG reduction levels that the EPA has established for Kentucky, if enacted. Sulfuric Acid Mist Emissions (PPL, LKE and LG&E) In June 2016, the EPA issued a notice of violation under the Clean Air Act alleging that LG&E violated applicable rules relating to sulfuric acid mist emissions at its Mill Creek plant. The notice alleges failure to install proper controls, failure to operate the facility consistent with good air pollution control practice, and causing emissions exceeding applicable requirements or
159
constituting a nuisance or endangerment. LG&E believes it has complied with applicable regulations during the relevant time period. Discussion between the EPA and LG&E are ongoing. PPL, LKE and LG&E are unable to predict the outcome of this matter or the potential impact on operations of the Mill Creek plant, including increased capital or operating costs, and potential civil penalties or remedial measures, if any. Water/Waste (PPL, LKE, LG&E and KU) Coal Combustion Residuals (CCRs) In April 2015, the EPA published its final rule regulating CCRs. CCRs include fly ash, bottom ash and sulfur dioxide scrubber wastes. The rule became effective in October 2015. It imposes extensive new requirements, including location restrictions, design and operating standards, groundwater monitoring and corrective action requirements, and closure and post-closure care requirements on CCR impoundments and landfills that are located on active power plants in the United States and not closed. Under the rule, CCRs are regulated as non-hazardous under Subtitle D of RCRA and beneficial use of CCRs is allowed, with some restrictions. The rule's requirements for covered CCR impoundments and landfills include implementation of groundwater monitoring and commencement or completion of closure activities generally between three and ten years from certain triggering events. The rule requires posting of compliance documentation on a publicly accessible website. Industry groups, environmental groups, individual companies and others have filed legal challenges to the final rule, which are pending before the D.C. Circuit Court of Appeals. Recently enacted federal legislation has authorized the EPA to approve equally protective state programs that would operate in lieu of the CCR Rule. Kentucky has proposed a state rule aimed at reflecting the requirements of the federal rule. LG&E and KU have received KPSC approval for a compliance plan providing for construction of additional landfill capacity at the E.W. Brown station, closure of impoundments at the Mill Creek, Trimble County, E.W. Brown, and Ghent stations, and construction of process water management facilities at those plants. In addition to the foregoing measures required for compliance with federal CCR rule requirements, LG&E and KU also received KPSC approval for their plans to close impoundments at the retired Green River, Pineville and Tyrone plants to comply with applicable state law requirements. See Note 6 for additional information. In connection with the final CCR rule, LG&E and KU recorded adjustments to existing AROs during 2015 and 2016. See Note 19 for additional information. Further changes to AROs, current capital plans or operating costs may be required as estimates are refined based on closure developments, groundwater monitoring results, and regulatory or legal proceedings. Costs relating to this rule are subject to rate recovery. Clean Water Act Regulations under the federal Clean Water Act dictate permitting and mitigation requirements for facilities and construction projects in the United States. Many of those requirements relate to power plant operations, including requirements related to the treatment of pollutants in effluents prior to discharge, the temperature of effluent discharges and the location, design and construction of cooling water intake structures at generating facilities, standards intended to protect aquatic organisms that become trapped at or pulled through cooling water intake structures at generating facilities. The requirements could impose significant costs for LG&E and KU, which are subject to rate recovery. Effluent Limitations Guidelines (ELGs) In September 2015, the EPA released its final ELGs for wastewater discharge permits for new and existing steam electric generating facilities. The rule provides strict technology-based discharge limitations for control of pollutants in scrubber wastewater, fly ash and bottom ash transport water, mercury control wastewater, gasification wastewater and combustion
160
residual leachate. The new guidelines require deployment of additional control technologies providing physical, chemical and biological treatment of wastewaters. The guidelines also mandate operational changes including "no discharge" requirements for fly ash and bottom ash transport waters and mercury control wastewaters. The implementation date for individual generating stations will be determined by the states on a case-by-case basis according to criteria provided by the EPA, but the requirements of the rule must be fully implemented no later than 2023. Industry groups, environmental groups, individual companies and others have filed legal challenges to the final rule, which have been consolidated before the U.S. Court of Appeals for the Fifth Circuit. LG&E and KU are developing compliance strategies and schedules. PPL, LKE, LG&E and KU are unable to fully estimate compliance costs or timing at this time, although certain preliminary estimates are included in current capital forecasts for applicable periods. Costs to comply with ELGs or other discharge limits, which are expected to be significant, are subject to rate recovery. Clean Water Act Section 316(b) The EPA's final 316(b) rule for existing facilities became effective in October 2014, and regulates cooling water intake structures and their impact on aquatic organisms. The rule requires existing facilities to choose among several options to reduce the impact on aquatic organisms that become trapped against water intake screens (impingement) and to determine the intake structure's impact on aquatic organisms pulled through a plant's cooling water system (entrainment). Based on studies conducted by LG&E and KU to date, all plants will incur only insignificant operational costs. In addition, LG&E's Mill Creek Unit 1 is expected to incur capital costs. PPL, LKE, LG&E and KU do not expect compliance costs, which are subject to rate recovery, to be significant. Seepages and Groundwater Infiltration Seepages or groundwater infiltration have been detected at active and retired wastewater basins and landfills at various LG&E or KU plants. LG&E and KU have completed, or are completing, assessments of seepages or groundwater infiltration at various facilities and have completed, or are working with agencies to implement, further testing, monitoring or abatement measures, where applicable. A range of reasonable possible losses cannot currently be estimated. Depending on the circumstances in each case, certain costs, which may be subject to rate recovery, could be significant. (All Registrants) Waters of the United States (WOTUS) The U.S. Court of Appeals for the Sixth Circuit has issued a stay of the EPA's rule on the definition of WOTUS pending the court's review of the rule. The effect of the stay is that the WOTUS rule is not in effect anywhere. The ultimate outcome of the court's review of the rule remains uncertain. Because of the strict permitting programs already in place in Kentucky and Pennsylvania, the Registrants do not expect the rule to have a significant impact on their operations. Other Issues On June 22, 2016, the "Frank Lautenberg Chemical Safety Act" took effect as an amendment to the Toxic Substance Control Act (TSCA). The Act made no changes to the pre-existing TSCA rules as it pertains to polychlorinated biphenyls (PCB). The EPA continues to reassess its PCB regulations as part of the 2010 Advanced Notice of Proposed Rulemaking (ANPRM). The EPA's ANPRM rulemaking is to occur in two phases. The first, scheduled for March 2017, relates to the use of PCBs in small capacitors and fluorescent ballasts in schools and day care centers. The second, scheduled for October 2017, relates to the use of PCBs in electrical equipment and natural gas pipelines, as well as continued use of PCB-contaminated porous surfaces. Although the first rulemaking will not directly affect the Registrants' operations, it may indicate certain approaches or principles to occur in the later rulemaking which may affect Registrants' facilities in the United States, including phase-out of some or all equipment containing PCBs. Should such a phase-out be required, the costs, which are subject to rate recovery, could be significant.
161
Superfund and Other Remediation PPL Electric is potentially responsible for a share of the costs at several sites listed by the EPA under the federal Superfund program, including the Columbia Gas Plant site and the Brodhead site. Clean-up actions have been or are being undertaken at all of these sites, the costs of which have not been, and are not expected to be, significant to PPL Electric. PPL Electric, LG&E and KU are investigating, responding to agency inquiries, remediating, or have completed the remediation of, several sites that were not addressed under a regulatory program such as Superfund, but for which PPL Electric, LG&E and KU may be liable for remediation. These include a number of former coal gas manufacturing plants in Pennsylvania and Kentucky previously owned or operated or currently owned by predecessors or affiliates of PPL Electric, LG&E and KU. To date, the costs of these sites have not been significant. There are additional sites, formerly owned or operated by PPL Electric, LG&E and KU predecessors or affiliates. PPL Electric, LG&E and KU lack information on the condition of such additional sites and are therefore unable to estimate any potential liability they may have or a range of reasonably possible losses, if any, related to these matters. At December 31, 2016, PPL Electric had a recorded liability of $10 million representing its best estimate of the probable loss incurred to remediate the sites noted above. Depending on the outcome of investigations at sites where investigations have not begun or been completed, or developments at sites for which information is incomplete, additional costs of remediation could be incurred; however, such costs are not expected to be significant. The EPA is evaluating the risks associated with polycyclic aromatic hydrocarbons and naphthalene, chemical by-products of coal gas manufacturing. As a result of the EPA's evaluation, individual states may establish stricter standards for water quality and soil cleanup. This could require several PPL subsidiaries to take more extensive assessment and remedial actions at former coal gas manufacturing plants. PPL, PPL Electric, LKE, LG&E and KU cannot estimate a range of reasonably possible losses, if any, related to these matters. From time to time, PPL's subsidiaries in the United States undertake testing, monitoring or remedial action in response to notices of violations, spills or other releases at various on-site and off-site locations, negotiate with the EPA and state and local agencies regarding actions necessary for compliance with applicable requirements, negotiate with property owners and other third parties alleging impacts from PPL's operations and undertake similar actions necessary to resolve environmental matters that arise in the course of normal operations. Based on analyses to date, resolution of these environmental matters is not expected to have a significant adverse impact on the operations of PPL Electric, LG&E and KU. Future cleanup or remediation work at sites under review, or at sites not yet identified, may result in significant additional costs for PPL, PPL Electric, LKE, LG&E and KU. Insurance policies maintained by LKE, LG&E and KU may be applicable to certain of the costs or other obligations related to these matters but the amount of insurance coverage or reimbursement cannot be estimated or assured. European Union Creosote Ban (PPL) In 2011, the European Commission amended the European Union Biocides Directive to ban the use of creosote in contact with soil. Creosote is a wood preservative used to extend the life of wooden poles that support power lines. Although European Union member countries were required to pass implementing laws by 2012, the U.K. has not passed an implementing law and there are no legal penalties for failing to do so. The recent U.K. referendum in favor of the U.K.'s departure from the European Union further reduces the likelihood that the U.K. will implement the European Union directive. In the unlikely event that the U.K. were to ban the use of creosote, WPD's creosote-treated wood poles would need to be replaced with an acceptable alternative at the time of routine replacement. Although the aggregate cost to replace poles could be significant, it would be incurred as poles are replaced in the ordinary course and would be subject to rate recovery. WPD has 1.4 million wood poles in its system. There are currently no alternative wood preservatives available that are acceptable to the industry and/or regulators.

162
Other (All Registrants) Labor Union Agreements For PPL and PPL Electric, labor agreement negotiations with the IBEW commenced in February 2017. The current three-year agreement expires in May 2017. LG&E and KU have three-year labor agreements with the IBEW, which expire in November 2017 and August 2018. The KU IBEW agreement includes a wage reopener in 2017. KU has 54 employees that are represented by a USWA labor union, under an agreement that expires in August 2017. At December 31, 2016, the expiring labor agreements covered the following.
Number of Union
Employees Percentage of Total
Workforce PPL 2,173 17 % PPL Electric 1,150 63 % LKE 819 23 % LG&E 696 68 % KU 123 13 %
The Registrants cannot predict the outcome of the union labor negotiations. Guarantees and Other Assurances (All Registrants) In the normal course of business, the Registrants enter into agreements that provide financial performance assurance to third parties on behalf of certain subsidiaries. Such agreements include, for example, guarantees, stand-by letters of credit issued by financial institutions and surety bonds issued by insurance companies. These agreements are entered into primarily to support or enhance the creditworthiness attributed to a subsidiary on a stand-alone basis or to facilitate the commercial activities in which these subsidiaries engage. (PPL) PPL fully and unconditionally guarantees all of the debt securities of PPL Capital Funding. (All Registrants) The table below details guarantees provided as of December 31, 2016. "Exposure" represents the estimated maximum potential amount of future payments that could be required to be made under the guarantee. The probability of expected payment/performance under each of these guarantees is remote except for "WPD guarantee of pension and other obligations of unconsolidated entities" and "Indemnification of lease termination and other divestitures." The total recorded liability at December 31, 2016 was $22 million for PPL and $17 million for LKE. The total recorded liability at December 31, 2015 was $25 million for PPL and $18 million for LKE. For reporting purposes, on a consolidated basis, all guarantees of PPL Electric, LKE, LG&E and KU also apply to PPL, and all guarantees of LG&E and KU also apply to LKE.

163
Exposure at
December 31, 2016
Expiration Date
PPL Indemnifications related to the WPD Midlands acquisition (a) WPD indemnifications for entities in liquidation and sales of assets $ 10 (b) 2019 WPD guarantee of pension and other obligations of unconsolidated entities 104 (c) PPL Electric Guarantee of inventory value 14 (d) 2018 LKE Indemnification of lease termination and other divestitures 301 (e) 2021 - 2023 LG&E and KU LG&E and KU guarantee of shortfall related to OVEC (f)
(a) Indemnifications related to certain liabilities, including a specific unresolved tax issue and those relating to properties and assets owned by the seller that
were transferred to WPD Midlands in connection with the acquisition. A cross indemnity has been received from the seller on the tax issue. The maximum exposure and expiration of these indemnifications cannot be estimated because the maximum potential liability is not capped and the expiration date is not specified in the transaction documents.
(b) Indemnification to the liquidators and certain others for existing liabilities or expenses or liabilities arising during the liquidation process. The indemnifications are limited to distributions made from the subsidiary to its parent either prior or subsequent to liquidation or are not explicitly stated in the agreements. The indemnifications generally expire two to seven years subsequent to the date of dissolution of the entities. The exposure noted only includes those cases where the agreements provide for specific limits. In connection with their sales of various businesses, WPD and its affiliates have provided the purchasers with indemnifications that are standard for such transactions, including indemnifications for certain pre-existing liabilities and environmental and tax matters or have agreed to continue their obligations under existing third-party guarantees, either for a set period of time following the transactions or upon the condition that the purchasers make reasonable efforts to terminate the guarantees. Additionally, WPD and its affiliates remain secondarily responsible for lease payments under certain leases that they have assigned to third parties.
(c) Relates to certain obligations of discontinued or modified electric associations that were guaranteed at the time of privatization by the participating members. Costs are allocated to the members and can be reallocated if an existing member becomes insolvent. At December 31, 2016, WPD has recorded an estimated discounted liability for which the expected payment/performance is probable. Neither the expiration date nor the maximum amount of potential payments for certain obligations is explicitly stated in the related agreements, and as a result, the exposure has been estimated.
(d) A third party logistics firm provides inventory procurement and fulfillment services. The logistics firm has title to the inventory, however, upon termination of the contracts, PPL Electric has guaranteed to purchase any remaining inventory that has not been used or sold.
(e) LKE provides certain indemnifications covering the due and punctual payment, performance and discharge by each party of its respective obligations. The most comprehensive of these guarantees is the LKE guarantee covering operational, regulatory and environmental commitments and indemnifications made by WKE under a 2009 Transaction Termination Agreement. This guarantee has a term of 12 years ending July 2021, and a maximum exposure of $200 million, exclusive of certain items such as government fines and penalties that may exceed the maximum. Another WKE-related LKE guarantee covers other indemnifications related to the purchase price of excess power, has a term expiring in 2023, and a maximum exposure of $100 million. In May 2012, LKE's indemnitee received an unfavorable arbitration panel's decision interpreting this matter. In October 2014, LKE's indemnitee filed a motion for discretionary review with the Kentucky Supreme Court seeking to overturn the arbitration decision, and such motion was denied by the court in September 2015. In September 2015, the counterparty issued a demand letter to LKE's indemnitee. In February 2016, the counterparty filed a complaint in Henderson, Kentucky Circuit Court, seeking an award of damages in the matter. The proceeding is currently in the discovery phase. LKE does not believe appropriate contractual, legal or commercial grounds exist for the claim made. LKE believes its indemnification obligations in the WKE matter remain subject to various uncertainties, including additional legal and contractual developments, as well as future prices, availability and demand for the subject excess power. Although the parties have also conducted certain settlement discussions, the ultimate outcomes of the WKE termination-related indemnifications cannot be predicted at this time. Additionally, LKE has indemnified various third parties related to historical obligations for other divested subsidiaries and affiliates. The indemnifications vary by entity and the maximum exposures range from being capped at the sale price to no specified maximum. LKE could be required to perform on these indemnifications in the event of covered losses or liabilities being claimed by an indemnified party. LKE cannot predict the ultimate outcomes of the various indemnification scenarios, but does not expect such outcomes to result in significant losses above the amounts recorded.
(f) Pursuant to the OVEC power purchase contract, LG&E and KU are obligated to pay for their share of OVEC's excess debt service, post-retirement and decommissioning costs, as well as any shortfall from amounts included within a demand charge designed and expected to cover these costs over the term of the contract. LKE's proportionate share of OVEC's outstanding debt was $123 million at December 31, 2016, consisting of LG&E's share of $85 million and KU's share of $38 million. The maximum exposure and the expiration date of these potential obligations are not presently determinable. See "Energy Purchase Commitments" above for additional information on the OVEC power purchase contract. In connection with recent credit market related developments at OVEC or certain of its sponsors, such parties, including LG&E and KU, are analyzing certain potential additional credit support actions to preserve OVEC's access to credit markets or mitigate risks or adverse impacts relating thereto, including increased interest costs and accelerated maturities of OVEC's existing short and long-term debt. The ultimate outcome of these matters, including any potential impact on LG&E's and KU's obligations relating to OVEC debt under the power purchase contract cannot be predicted.
164
The Registrants provide other miscellaneous guarantees through contracts entered into in the normal course of business. These guarantees are primarily in the form of indemnification or warranties related to services or equipment and vary in duration. The amounts of these guarantees often are not explicitly stated, and the overall maximum amount of the obligation under such guarantees cannot be reasonably estimated. Historically, no significant payments have been made with respect to these types of guarantees and the probability of payment/performance under these guarantees is remote. PPL, on behalf of itself and certain of its subsidiaries, maintains insurance that covers liability assumed under contract for bodily injury and property damage. The coverage provides maximum aggregate coverage of $225 million. This insurance may be applicable to obligations under certain of these contractual arrangements. 14. Related Party Transactions PLR Contracts/Purchases of Accounts Receivable (PPL Electric) PPL Electric holds competitive solicitations for PLR generation supply. PPL EnergyPlus was awarded a portion of the PLR generation supply through these competitive solicitations. The purchases from PPL EnergyPlus are included in PPL Electric's Statements of Income as "Energy purchases from affiliate" through May 31, 2015, the period through which PPL Electric and PPL EnergyPlus were affiliated entities. As a result of the June 1, 2015 spinoff of PPL Energy Supply and creation of Talen Energy, PPL EnergyPlus (renamed Talen Energy Marketing) is no longer an affiliate of PPL Electric. PPL Electric's purchases from Talen Energy Marketing subsequent to May 31, 2015 are included as purchases from an unaffiliated third party. PPL Electric's customers may choose an alternative supplier for their generation supply. See Note 1 for additional information regarding PPL Electric's purchases of accounts receivable from alternative suppliers, including Talen Energy Marketing. See Note 8 for additional information regarding the spinoff of PPL Energy Supply. Wholesale Sales and Purchases (LG&E and KU) LG&E and KU jointly dispatch their generation units with the lowest cost generation used to serve their retail customers. When LG&E has excess generation capacity after serving its own retail customers and its generation cost is lower than that of KU, KU purchases electricity from LG&E. When KU has excess generation capacity after serving its own retail customers and its generation cost is lower than that of LG&E, LG&E purchases electricity from KU. These transactions are reflected in the Statements of Income as "Electric revenue from affiliate" and "Energy purchases from affiliate" and are recorded at a price equal to the seller's fuel cost plus any split savings. Savings realized from such intercompany transactions are shared equally between both companies. The volume of energy each company has to sell to the other is dependent on its retail customers' needs and its available generation. Support Costs (PPL Electric, LKE, LG&E and KU) PPL Services, PPL EU Services and LKS provide their respective PPL, PPL Electric and LKE subsidiaries and each other with administrative, management and support services. For all service companies, the costs of these services are charged to the respective recipients as direct support costs. General costs that cannot be directly attributed to a specific entity are allocated and charged to the respective recipients as indirect support costs. PPL Services and PPL EU Services use a three-factor methodology that includes the applicable recipients' invested capital, operation and maintenance expenses and number of employees to allocate indirect costs. LKS bases its indirect allocations on the subsidiaries' number of employees, total assets, revenues, number of customers and/or other statistical information. PPL Services, PPL EU Services and LKS charged the following amounts for the years ended December 31, including amounts applied to accounts that are further distributed between capital and expense on the books of the recipients, based on methods that are believed to be reasonable.

165
2016 2015 2014
PPL Electric from PPL Services $ 132 $ 125 $ 151 LKE from PPL Services 18 16 15 PPL Electric from PPL EU Services 69 60 — LG&E from LKS 178 155 140 KU from LKS 194 185 165
In addition to the charges for services noted above, LKS makes payments on behalf of LG&E and KU for fuel purchases and other costs for products or services provided by third parties. LG&E and KU also provide services to each other and to LKS. Billings between LG&E and KU relate to labor and overheads associated with union and hourly employees performing work for the other company, charges related to jointly-owned generating units and other miscellaneous charges. Tax settlements between LKE and LG&E and KU are reimbursed through LKS. Intercompany Borrowings (LKE) LKE maintains a $225 million revolving line of credit with a PPL Energy Funding subsidiary whereby LKE can borrow funds on a short-term basis at market-based rates. The interest rates on borrowings are equal to one-month LIBOR plus a spread. At December 31, 2016 and 2015, $163 million and $54 million, respectively, were outstanding and reflected in "Notes payable with affiliates" on the Balance Sheets. The interest rate on the outstanding borrowings at December 31, 2016 and 2015 was 2.12% and 1.74%. Interest expense on the revolving line of credit was not significant for 2016, 2015 or 2014. LKE maintains an agreement with a PPL affiliate that has a $300 million borrowing limit whereby LKE can loan funds on a short-term basis at market-based rates. No balance was outstanding at December 31, 2016 and 2015. The interest rate on the loan based on the PPL affiliate's credit rating is currently equal to one-month LIBOR plus a spread. Interest income on this note was not significant for 2016, 2015 or 2014. In November 2015, LKE entered into a $400 million ten-year-note with a PPL affiliate with an interest rate of 3.5%. The proceeds were used to repay the entire $400 million principal amount of its 2.125% Senior Unsecured Notes which matured in November 2015. At December 31, 2016 and 2015, the note was reflected in "Long-term debt to affiliate" on the Balance Sheets. Interest expense on this note was $14 million for 2016. Interest expense on this note was not significant for 2015. Intercompany Derivatives (LKE, LG&E and KU) Periodically, LG&E and KU enter into forward-starting interest rate swaps with PPL. These hedging instruments have terms identical to forward-starting swaps entered into by PPL with third parties. See Note 17 for additional information on intercompany derivatives. Other (PPL Electric, LKE, LG&E and KU) See Note 1 for discussions regarding the intercompany tax sharing agreement (for PPL Electric, LKE, LG&E and KU) and intercompany allocations of stock-based compensation expense (for PPL Electric and LKE). For PPL Electric, LG&E and KU, see Note 11 for discussions regarding intercompany allocations associated with defined benefits. 15. Other Income (Expense) - net (PPL) The breakdown of "Other Income (Expense) - net" for the years ended December 31, was:
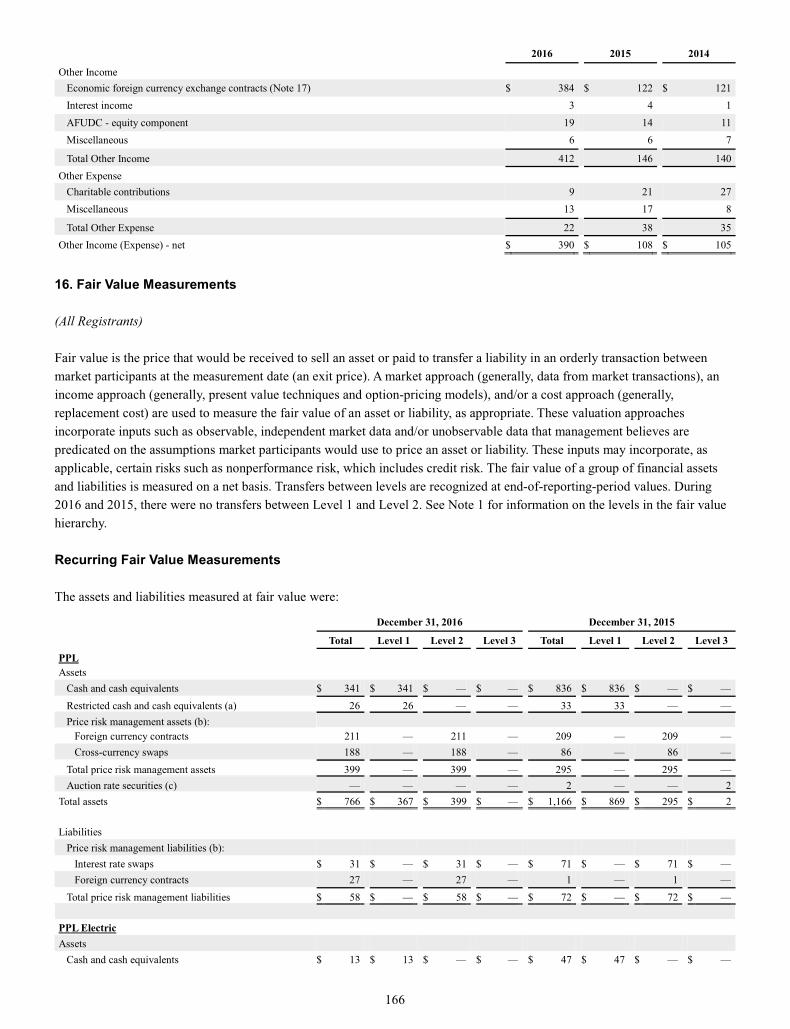
166
2016 2015 2014
Other Income Economic foreign currency exchange contracts (Note 17) $ 384 $ 122 $ 121 Interest income 3 4 1 AFUDC - equity component 19 14 11 Miscellaneous 6 6 7 Total Other Income 412 146 140
Other Expense Charitable contributions 9 21 27 Miscellaneous 13 17 8 Total Other Expense 22 38 35
Other Income (Expense) - net $ 390 $ 108 $ 105
16. Fair Value Measurements (All Registrants) Fair value is the price that would be received to sell an asset or paid to transfer a liability in an orderly transaction between market participants at the measurement date (an exit price). A market approach (generally, data from market transactions), an income approach (generally, present value techniques and option-pricing models), and/or a cost approach (generally, replacement cost) are used to measure the fair value of an asset or liability, as appropriate. These valuation approaches incorporate inputs such as observable, independent market data and/or unobservable data that management believes are predicated on the assumptions market participants would use to price an asset or liability. These inputs may incorporate, as applicable, certain risks such as nonperformance risk, which includes credit risk. The fair value of a group of financial assets and liabilities is measured on a net basis. Transfers between levels are recognized at end-of-reporting-period values. During 2016 and 2015, there were no transfers between Level 1 and Level 2. See Note 1 for information on the levels in the fair value hierarchy. Recurring Fair Value Measurements The assets and liabilities measured at fair value were:
December 31, 2016 December 31, 2015
Total Level 1 Level 2 Level 3 Total Level 1 Level 2 Level 3 PPL Assets
Cash and cash equivalents $ 341 $ 341 $ — $ — $ 836 $ 836 $ — $ — Restricted cash and cash equivalents (a) 26 26 — — 33 33 — — Price risk management assets (b):
Foreign currency contracts 211 — 211 — 209 — 209 — Cross-currency swaps 188 — 188 — 86 — 86 —
Total price risk management assets 399 — 399 — 295 — 295 — Auction rate securities (c) — — — — 2 — — 2
Total assets $ 766 $ 367 $ 399 $ — $ 1,166 $ 869 $ 295 $ 2
Liabilities Price risk management liabilities (b):
Interest rate swaps $ 31 $ — $ 31 $ — $ 71 $ — $ 71 $ — Foreign currency contracts 27 — 27 — 1 — 1 —
Total price risk management liabilities $ 58 $ — $ 58 $ — $ 72 $ — $ 72 $ —
PPL Electric Assets
Cash and cash equivalents $ 13 $ 13 $ — $ — $ 47 $ 47 $ — $ —

167
December 31, 2016 December 31, 2015
Total Level 1 Level 2 Level 3 Total Level 1 Level 2 Level 3 Restricted cash and cash equivalents (a) 2 2 — — 2 2 — —
Total assets $ 15 $ 15 $ — $ — $ 49 $ 49 $ — $ —
LKE Assets
Cash and cash equivalents $ 13 $ 13 $ — $ — $ 30 $ 30 $ — $ — Cash collateral posted to counterparties (d) 3 3 — — 9 9 — —
Total assets $ 16 $ 16 $ — $ — $ 39 $ 39 $ — $ —
Liabilities Price risk management liabilities:
Interest rate swaps $ 31 $ — $ 31 $ — $ 47 $ — $ 47 $ — Total price risk management liabilities $ 31 $ — $ 31 $ — $ 47 $ — $ 47 $ —
LG&E Assets
Cash and cash equivalents $ 5 $ 5 $ — $ — $ 19 $ 19 $ — $ — Cash collateral posted to counterparties (d) 3 3 — — 9 9 — —
Total assets $ 8 $ 8 $ — $ — $ 28 $ 28 $ — $ —
Liabilities Price risk management liabilities:
Interest rate swaps $ 31 $ — $ 31 $ — $ 47 $ — $ 47 $ — Total price risk management liabilities $ 31 $ — $ 31 $ — $ 47 $ — $ 47 $ —
KU Assets
Cash and cash equivalents $ 7 $ 7 $ — $ — $ 11 $ 11 $ — $ — Total assets $ 7 $ 7 $ — $ — $ 11 $ 11 $ — $ —
(a) Current portion is included in "Other current assets" and long-term portion is included in "Other noncurrent assets" on the Balance Sheets. (b) Current portion is included in "Price risk management assets" and "Other current liabilities" and noncurrent portion is included in "Price risk management
assets" and "Other deferred credits and noncurrent liabilities" on the Balance Sheets. (c) Included in "Other current assets" on the Balance Sheets. (d) Included in "Other noncurrent assets" on the Balance Sheets. Represents cash collateral posted to offset the exposure with counterparties related to certain
interest rate swaps under master netting arrangements that are not offset. Price Risk Management Assets/Liabilities - Interest Rate Swaps/Foreign Currency Contracts/Cross-Currency Swaps (PPL, LKE, LG&E and KU) To manage interest rate risk, PPL, LKE, LG&E and KU use interest rate contracts such as forward-starting swaps, floating-to-fixed swaps and fixed-to-floating swaps. To manage foreign currency exchange risk, PPL uses foreign currency contracts such as forwards, options, and cross-currency swaps that contain characteristics of both interest rate and foreign currency contracts. An income approach is used to measure the fair value of these contracts, utilizing readily observable inputs, such as forward interest rates (e.g., LIBOR and government security rates) and forward foreign currency exchange rates (e.g., GBP), as well as inputs that may not be observable, such as credit valuation adjustments. In certain cases, market information cannot practicably be obtained to value credit risk and therefore internal models are relied upon. These models use projected probabilities of default and estimated recovery rates based on historical observances. When the credit valuation adjustment is significant to the overall valuation, the contracts are classified as Level 3. Nonrecurring Fair Value Measurements (PPL) See Note 8 for information regarding the estimated fair value of the Supply segment's net assets as of the June 1, 2015 spinoff date.

168
Financial Instruments Not Recorded at Fair Value (All Registrants) The carrying amounts of long-term debt on the Balance Sheets and their estimated fair values are set forth below. The fair values were estimated using an income approach by discounting future cash flows at estimated current cost of funding rates, which incorporate the credit risk of the Registrants. Long-term debt is classified as Level 2. The effect of third-party credit enhancements is not included in the fair value measurement.
December 31, 2016 December 31, 2015
Carrying Amount Fair Value Carrying
Amount Fair Value
PPL $ 18,326 $ 21,355 $ 19,048 $ 21,218 PPL Electric 2,831 3,148 2,828 3,088 LKE 5,065 5,439 5,088 5,384 LG&E 1,617 1,710 1,642 1,704 KU 2,327 2,514 2,326 2,467
The carrying amounts of other current financial instruments (except for long-term debt due within one year) approximate their fair values because of their short-term nature. 17. Derivative Instruments and Hedging Activities Risk Management Objectives (All Registrants) PPL has a risk management policy approved by the Board of Directors to manage market risk associated with commodities, interest rates on debt issuances and foreign exchange (including price, liquidity and volumetric risk) and credit risk (including non-performance risk and payment default risk). The Risk Management Committee, comprised of senior management and chaired by the Director-Risk Management, oversees the risk management function. Key risk control activities designed to ensure compliance with the risk policy and detailed programs include, but are not limited to, credit review and approval, validation of transactions, verification of risk and transaction limits, value-at-risk analyses (VaR, a statistical model that attempts to estimate the value of potential loss over a given holding period under normal market conditions at a given confidence level) and the coordination and reporting of the Enterprise Risk Management program. Market Risk Market risk includes the potential loss that may be incurred as a result of price changes associated with a particular financial or commodity instrument as well as market liquidity and volumetric risks. Forward contracts, futures contracts, options, swaps and structured transactions are utilized as part of risk management strategies to minimize unanticipated fluctuations in earnings caused by changes in commodity prices, interest rates and foreign currency exchange rates. Many of the contracts meet the definition of a derivative. All derivatives are recognized on the Balance Sheets at their fair value, unless NPNS is elected. The following summarizes the market risks that affect PPL and its subsidiaries. Interest rate risk • PPL and its subsidiaries are exposed to interest rate risk associated with forecasted fixed-rate and existing floating-rate
debt issuances. PPL and WPD hold over-the-counter cross currency swaps to limit exposure to market fluctuations on interest and principal payments from changes in foreign currency exchange rates and interest rates. LKE and LG&E utilize over-the-counter interest rate swaps to limit exposure to market fluctuations on floating-rate debt. PPL, LKE, LG&E and

169
KU utilize forward starting interest rate swaps to hedge changes in benchmark interest rates, when appropriate, in connection with future debt issuances.
• PPL and its subsidiaries are exposed to interest rate risk associated with debt securities and derivatives held by defined benefit plans. This risk is significantly mitigated to the extent that the plans are sponsored at, or sponsored on behalf of, the regulated domestic utilities and for certain plans at WPD due to the recovery mechanisms in place.
Foreign currency risk • PPL is exposed to foreign currency exchange risk primarily associated with its investments in and earnings of U.K.
affiliates. Commodity price risk PPL is exposed to commodity price risk through its domestic subsidiaries as described below. • PPL Electric is exposed to commodity price risk from its obligation as PLR; however, its PUC-approved cost recovery
mechanism substantially eliminates its exposure to this risk. PPL Electric also mitigates its exposure to commodity price risk by entering into full-requirement supply agreements to serve its PLR customers. These supply agreements transfer the commodity price risk associated with the PLR obligation to the energy suppliers.
• LG&E's and KU's rates include certain mechanisms for fuel and fuel-related expenses. In addition, LG&E's rates include a mechanism for natural gas supply expenses. These mechanisms generally provide for timely recovery of market price fluctuations associated with these expenses.
Volumetric risk PPL is exposed to volumetric risk through its subsidiaries as described below. • WPD is exposed to volumetric risk which, is significantly mitigated as a result of the method of regulation in the U.K.
Under the RIIO-ED1 price control period, recovery of such exposure occurs on a two year lag. See Note 1 for additional information on revenue recognition under RIIO-ED1.
• PPL Electric, LG&E and KU are exposed to volumetric risk on retail sales, mainly due to weather and other economic conditions for which there is limited mitigation between rate cases.
Equity securities price risk • PPL and its subsidiaries are exposed to equity securities price risk associated with defined benefit plans. This risk is
significantly mitigated at the regulated domestic utilities and for certain plans at WPD due to the recovery mechanisms in place.
• PPL is exposed to equity securities price risk from future stock sales and/or purchases. Credit Risk Credit risk is the potential loss that may be incurred due to a counterparty's non-performance. PPL is exposed to credit risk from "in-the-money" interest rate and foreign currency derivatives with financial institutions, as well as additional credit risk through certain of its subsidiaries, as discussed below. In the event a supplier of LKE (through its subsidiaries LG&E and KU) or PPL Electric defaults on its obligation, those entities would be required to seek replacement power or replacement fuel in the market. In general, subject to regulatory review or other processes, appropriate incremental costs incurred by these entities would be recoverable from customers through applicable rate mechanisms, thus mitigating the financial risk for these entities.

170
PPL and its subsidiaries have credit policies in place to manage credit risk, including the use of an established credit approval process, daily monitoring of counterparty positions and the use of master netting agreements or provisions. These agreements generally include credit mitigation provisions, such as margin, prepayment or collateral requirements. PPL and its subsidiaries may request additional credit assurance, in certain circumstances, in the event that the counterparties' credit ratings fall below investment grade, their tangible net worth falls below specified percentages or their exposures exceed an established credit limit. Master Netting Arrangements Net derivative positions on the balance sheets are not offset against the right to reclaim cash collateral (a receivable) or the obligation to return cash collateral (a payable) under master netting arrangements. PPL had a $19 million obligation to return cash collateral under master netting arrangements at December 31, 2016 and no obligation to return cash collateral at December 31, 2015. LKE, LG&E and KU had no obligation to return cash collateral under master netting arrangements at December 31, 2016 and 2015. PPL, LKE and LG&E posted $3 million and $9 million of cash collateral under master netting arrangements at December 31, 2016 and 2015. KU did not post any cash collateral under master netting arrangements at December 31, 2016 and 2015. See "Offsetting Derivative Instruments" below for a summary of derivative positions presented in the balance sheets where a right of setoff exists under these arrangements. Interest Rate Risk (All Registrants) PPL and its subsidiaries issue debt to finance their operations, which exposes them to interest rate risk. Various financial derivative instruments are utilized to adjust the mix of fixed and floating interest rates in their debt portfolio, adjust the duration of the debt portfolio and lock in benchmark interest rates in anticipation of future financing, when appropriate. Risk limits under PPL's risk management program are designed to balance risk exposure to volatility in interest expense and changes in the fair value of the debt portfolio due to changes in benchmark interest rates. In addition, the interest rate risk of certain subsidiaries is potentially mitigated as a result of the existing regulatory framework or the timing of rate cases. Cash Flow Hedges (PPL) Interest rate risks include exposure to adverse interest rate movements for outstanding variable rate debt and for future anticipated financings. Financial interest rate swap contracts that qualify as cash flow hedges may be entered into to hedge floating interest rate risk associated with both existing and anticipated debt issuances. PPL held no such contracts at December 31, 2016. For 2016, 2015 and 2014, hedge ineffectiveness associated with interest rate derivatives was insignificant. At December 31, 2016, PPL held an aggregate notional value in cross-currency interest rate swap contracts of $802 million that range in maturity from 2017 through 2028 to hedge the interest payments and principal of WPD's U.S. dollar-denominated

171
senior notes. In May 2016, $460 million of WPD's U.S. dollar-denominated senior notes were repaid upon maturity and $460 million notional value of cross-currency interest rate swap contracts matured. PPL recorded a $46 million gain upon settlement of the cross-currency interest rate swap contracts, which largely offset a loss recorded on the revaluation of U.S. dollar-denominated senior notes. Cash flow hedges are discontinued if it is no longer probable that the original forecasted transaction will occur by the end of the originally specified time period and any amounts previously recorded in AOCI are reclassified into earnings once it is determined that the hedged transaction is not probable of occurring. PPL had no cash flow hedges reclassified into earnings associated with discontinued cash flow hedges in 2016 and an insignificant amount in 2014. As a result of the June 1, 2015 spinoff of PPL Energy Supply, all PPL cash flow hedges associated with PPL Energy Supply were ineffective and discontinued and therefore, reclassified into earnings during the second quarter of 2015 and reflected in discontinued operations for 2015. See Note 8 for additional information. PPL had no other cash flow hedges reclassified into earnings associated with discontinued cash flow hedges in 2015. At December 31, 2016, the accumulated net unrecognized after-tax gains (losses) on qualifying derivatives expected to be reclassified into earnings during the next 12 months is $53 million. Amounts are reclassified as the hedged interest expense is recorded. Economic Activity (PPL, LKE and LG&E) LG&E enters into interest rate swap contracts that economically hedge interest payments on variable rate debt. Because realized gains and losses from the swaps, including terminated swap contracts, are recoverable through regulated rates, any subsequent changes in fair value of these derivatives are included in regulatory assets or liabilities until they are realized as interest expense. Realized gains and losses are recognized in "Interest Expense" on the Statements of Income at the time the underlying hedged interest expense is recorded. In December 2016, a swap with a notional amount of $32 million was terminated. A cash settlement of $9 million was paid on the terminated swap. The settlement is included in noncurrent regulatory assets on the Balance Sheet and in "Cash Flows from Operating Activities" on the Statement of Cash Flows. At December 31, 2016, LG&E held contracts with a notional amount of $147 million that range in maturity through 2033. Foreign Currency Risk (PPL) PPL is exposed to foreign currency risk, primarily through investments in and earnings of U.K. affiliates. PPL has adopted a foreign currency risk management program designed to hedge certain foreign currency exposures, including firm commitments, recognized assets or liabilities, anticipated transactions and net investments. In addition, PPL enters into financial instruments to protect against foreign currency translation risk of expected GBP earnings. Net Investment Hedges PPL enters into foreign currency contracts on behalf of a subsidiary to protect the value of a portion of its net investment in WPD. There were no such contracts outstanding at December 31, 2016. At December 31, 2016 and 2015, PPL had $21 million and $19 million of accumulated net investment hedge after tax gains (losses) that were included in the foreign currency translation adjustment component of AOCI.
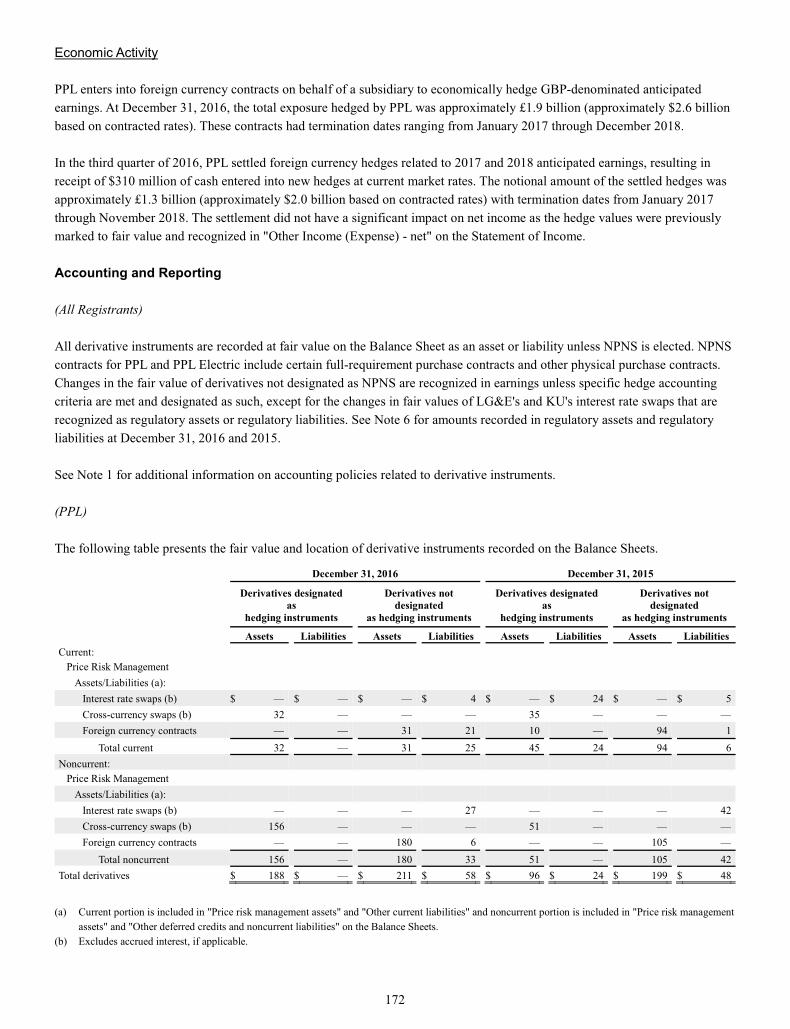
172
Economic Activity PPL enters into foreign currency contracts on behalf of a subsidiary to economically hedge GBP-denominated anticipated earnings. At December 31, 2016, the total exposure hedged by PPL was approximately £1.9 billion (approximately $2.6 billion based on contracted rates). These contracts had termination dates ranging from January 2017 through December 2018. In the third quarter of 2016, PPL settled foreign currency hedges related to 2017 and 2018 anticipated earnings, resulting in receipt of $310 million of cash entered into new hedges at current market rates. The notional amount of the settled hedges was approximately £1.3 billion (approximately $2.0 billion based on contracted rates) with termination dates from January 2017 through November 2018. The settlement did not have a significant impact on net income as the hedge values were previously marked to fair value and recognized in "Other Income (Expense) - net" on the Statement of Income. Accounting and Reporting (All Registrants) All derivative instruments are recorded at fair value on the Balance Sheet as an asset or liability unless NPNS is elected. NPNS contracts for PPL and PPL Electric include certain full-requirement purchase contracts and other physical purchase contracts. Changes in the fair value of derivatives not designated as NPNS are recognized in earnings unless specific hedge accounting criteria are met and designated as such, except for the changes in fair values of LG&E's and KU's interest rate swaps that are recognized as regulatory assets or regulatory liabilities. See Note 6 for amounts recorded in regulatory assets and regulatory liabilities at December 31, 2016 and 2015. See Note 1 for additional information on accounting policies related to derivative instruments. (PPL) The following table presents the fair value and location of derivative instruments recorded on the Balance Sheets.
December 31, 2016 December 31, 2015
Derivatives designated as
hedging instruments
Derivatives not designated
as hedging instruments
Derivatives designated as
hedging instruments
Derivatives not designated
as hedging instruments
Assets Liabilities Assets Liabilities Assets Liabilities Assets Liabilities Current:
Price Risk Management Assets/Liabilities (a):
Interest rate swaps (b) $ — $ — $ — $ 4 $ — $ 24 $ — $ 5 Cross-currency swaps (b) 32 — — — 35 — — — Foreign currency contracts — — 31 21 10 — 94 1
Total current 32 — 31 25 45 24 94 6 Noncurrent:
Price Risk Management Assets/Liabilities (a):
Interest rate swaps (b) — — — 27 — — — 42 Cross-currency swaps (b) 156 — — — 51 — — — Foreign currency contracts — — 180 6 — — 105 —
Total noncurrent 156 — 180 33 51 — 105 42 Total derivatives $ 188 $ — $ 211 $ 58 $ 96 $ 24 $ 199 $ 48
(a) Current portion is included in "Price risk management assets" and "Other current liabilities" and noncurrent portion is included in "Price risk management
assets" and "Other deferred credits and noncurrent liabilities" on the Balance Sheets. (b) Excludes accrued interest, if applicable.

173
The following tables present the pre-tax effect of derivative instruments recognized in income, OCI or regulatory assets and regulatory liabilities.
Derivative Relationships
Derivative Gain (Loss) Recognized in
OCI (Effective Portion)
Location of Gain (Loss) Recognized in Income
on Derivative
Gain (Loss) Reclassified from AOCI into Income
(Effective Portion)
Gain (Loss) Recognized in Income on Derivative (Ineffective Portion and Amount Excluded from Effectiveness Testing)
2016 Cash Flow Hedges:
Interest rate swaps $ (21 ) Interest Expense $ (7) $ — Cross-currency swaps 130 Other Income (Expense) - net 116 — Interest Expense 3 —
Total $ 109 $ 112 $ — Net Investment Hedges:
Foreign currency contracts $ 2
2015 Cash Flow Hedges:
Interest rate swaps $ (34 ) Interest Expense $ (11) $ — Discontinued operations — (77 ) Cross-currency swaps 60 Other Income (Expense) - net 49 — Interest Expense 2 — Commodity contracts Discontinued operations 13 7
Total $ 26 $ 53 $ (70) Net Investment Hedges:
Foreign currency contracts $ 9
2014 Cash Flow Hedges:
Interest rate swaps $ (91 ) Interest Expense $ (18) $ 2 Cross-currency swaps 58 Other Income (Expense) - net 57 — Interest Expense 4 — Commodity contracts Discontinued operations 42 —
Total $ (33 ) $ 85 $ 2 Net Investment Hedges:
Foreign currency contracts $ 23 Derivatives Not Designated as
Hedging Instruments Location of Gain (Loss) Recognized in
Income on Derivative 2016 2015 2014
Foreign currency contracts Other Income (Expense) - net $ 384 $ 122 $ 121 Interest rate swaps Interest Expense (7 ) (8 ) (8 )
Total $ 377 $ 114 $ 113
Derivatives Designated as Hedging Instruments
Location of Gain (Loss) Recognized as Regulatory Liabilities/Assets 2016 2015 2014
Interest rate swaps Regulatory assets - noncurrent $ — $ (22) $ (66)
Derivatives Not Designated as Hedging Instruments
Location of Gain (Loss) Recognized as Regulatory Liabilities/Assets 2016 2015 2014
Interest rate swaps Regulatory assets - noncurrent $ 7 $ 1 $ (12)
(LKE) The following table presents the pre-tax effect of derivative instruments designated as cash flow hedges that are recognized in regulatory assets. All derivative instruments designated as cash flow hedges were terminated in 2015 and there is no activity in the current period.

174
Derivative Instruments Location of Gain (Loss) 2016 2015 2014 Interest rate swaps Regulatory assets - noncurrent $ — $ (22 ) $ (66 )
(LG&E) The following table presents the pre-tax effect of derivative instruments designated as cash flow hedges that are recognized in regulatory assets. All derivative instruments designated as cash flow hedges were terminated in 2015 and there is no activity in the current period.
Derivative Instruments Location of Gain (Loss) 2016 2015 2014 Interest rate swaps Regulatory asset - noncurrent $ — $ (11 ) $ (33 )
(KU) The following table presents the pre-tax effect of derivative instruments designated as cash flow hedges that are recognized in regulatory assets. All derivative instruments designated as cash flow hedges were terminated in 2015 and there is no activity in the current period.
Derivative Instruments Location of Gain (Loss) 2016 2015 2014 Interest rate swaps Regulatory assets - noncurrent $ — $ (11 ) $ (33 )
(LKE and LG&E) The following table presents the fair value and the location on the Balance Sheets of derivatives not designated as hedging instruments.
December 31, 2016 December 31, 2015 Assets Liabilities Assets Liabilities
Current: Price Risk Management
Assets/Liabilities (a): Interest rate swaps $ — $ 4 $ — $ 5
Total current — 4 — 5 Noncurrent:
Price Risk Management Assets/Liabilities (a):
Interest rate swaps — 27 — 42 Total noncurrent — 27 — 42
Total derivatives $ — $ 31 $ — $ 47 (a) Represents the location on the Balance Sheets.
The following tables present the pre-tax effect of derivatives not designated as cash flow hedges that are recognized in income or regulatory assets.
Derivative Instruments Location of Gain (Loss) 2016 2015 2014 Interest rate swaps Interest Expense $ (7 ) $ (8 ) $ (8 )
Derivative Instruments Location of Gain (Loss) 2016 2015 2014
Interest rate swaps Regulatory assets - noncurrent $ 7 $ 1 $ (12 )

175
(PPL, LKE, LG&E and KU) Offsetting Derivative Instruments PPL, LKE, LG&E and KU or certain of their subsidiaries have master netting arrangements in place and also enter into agreements pursuant to which they purchase or sell certain energy and other products. Under the agreements, upon termination of the agreement as a result of a default or other termination event, the non-defaulting party typically would have a right to set off amounts owed under the agreement against any other obligations arising between the two parties (whether under the agreement or not), whether matured or contingent and irrespective of the currency, place of payment or place of booking of the obligation. PPL, LKE, LG&E and KU have elected not to offset derivative assets and liabilities and not to offset net derivative positions against the right to reclaim cash collateral pledged (an asset) or the obligation to return cash collateral received (a liability) under derivatives agreements. The table below summarizes the derivative positions presented in the balance sheets where a right of setoff exists under these arrangements and related cash collateral received or pledged.
Assets Liabilities
Eligible for Offset Eligible for Offset
Gross Derivative
Instruments
Cash Collateral Received Net Gross
Derivative Instruments
Cash Collateral Pledged Net
December 31, 2016 Treasury Derivatives
PPL $ 399 $ 27 19 $ 353 $ 58 $ 27 $ 3 $ 28 LKE — — — — 31 — 3 28 LG&E — — — — 31 — 3 28
December 31, 2015 Treasury Derivatives
PPL $ 295 $ 25 $ — $ 270 $ 72 $ 25 $ 9 $ 38 LKE — — — — 47 — 9 38 LG&E — — — — 47 — 9 38
Credit Risk-Related Contingent Features Certain derivative contracts contain credit risk-related contingent features, which when in a net liability position, would permit the counterparties to require the transfer of additional collateral upon a decrease in the credit ratings of PPL, LKE, LG&E and KU or certain of their subsidiaries. Most of these features would require the transfer of additional collateral or permit the counterparty to terminate the contract if the applicable credit rating were to fall below investment grade. Some of these features also would allow the counterparty to require additional collateral upon each downgrade in credit rating at levels that remain above investment grade. In either case, if the applicable credit rating were to fall below investment grade, and assuming no assignment to an investment grade affiliate were allowed, most of these credit contingent features require either immediate payment of the net liability as a termination payment or immediate and ongoing full collateralization on derivative instruments in net liability positions. Additionally, certain derivative contracts contain credit risk-related contingent features that require adequate assurance of performance be provided if the other party has reasonable concerns regarding the performance of PPL's, LKE's, LG&E's and KU's obligations under the contracts. A counterparty demanding adequate assurance could require a transfer of additional collateral or other security, including letters of credit, cash and guarantees from a creditworthy entity. This would typically involve negotiations among the parties. However, amounts disclosed below represent assumed immediate payment or immediate and ongoing full collateralization for derivative instruments in net liability positions with "adequate assurance" features.
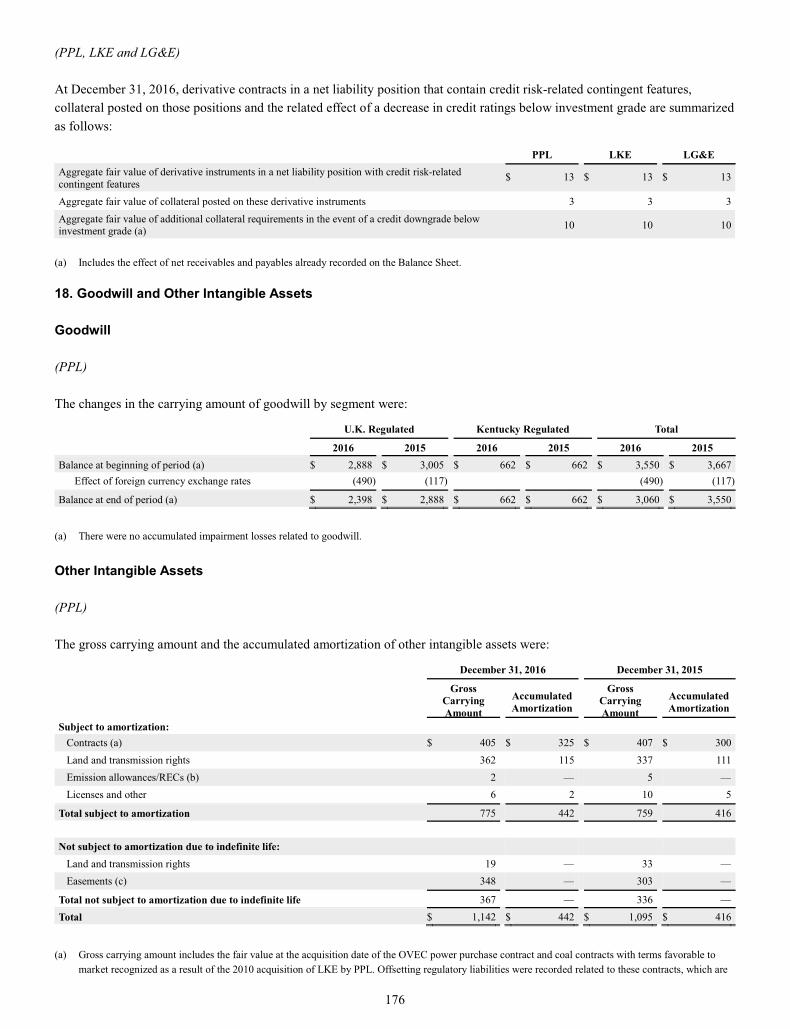
176
(PPL, LKE and LG&E) At December 31, 2016, derivative contracts in a net liability position that contain credit risk-related contingent features, collateral posted on those positions and the related effect of a decrease in credit ratings below investment grade are summarized as follows:
PPL LKE LG&E Aggregate fair value of derivative instruments in a net liability position with credit risk-related contingent features
$ 13 $ 13 $ 13
Aggregate fair value of collateral posted on these derivative instruments 3 3 3 Aggregate fair value of additional collateral requirements in the event of a credit downgrade below investment grade (a) 10 10 10
(a) Includes the effect of net receivables and payables already recorded on the Balance Sheet.
18. Goodwill and Other Intangible Assets Goodwill (PPL) The changes in the carrying amount of goodwill by segment were:
U.K. Regulated Kentucky Regulated Total
2016 2015 2016 2015 2016 2015 Balance at beginning of period (a) $ 2,888 $ 3,005 $ 662 $ 662 $ 3,550 $ 3,667
Effect of foreign currency exchange rates (490 ) (117 ) (490 ) (117 )
Balance at end of period (a) $ 2,398 $ 2,888 $ 662 $ 662 $ 3,060 $ 3,550 (a) There were no accumulated impairment losses related to goodwill. Other Intangible Assets (PPL) The gross carrying amount and the accumulated amortization of other intangible assets were:
December 31, 2016 December 31, 2015
Gross
Carrying Amount
Accumulated Amortization
Gross Carrying Amount
Accumulated Amortization
Subject to amortization: Contracts (a) $ 405 $ 325 $ 407 $ 300 Land and transmission rights 362 115 337 111 Emission allowances/RECs (b) 2 — 5 — Licenses and other 6 2 10 5
Total subject to amortization 775 442 759 416 Not subject to amortization due to indefinite life:
Land and transmission rights 19 — 33 — Easements (c) 348 — 303 —
Total not subject to amortization due to indefinite life 367 — 336 — Total $ 1,142 $ 442 $ 1,095 $ 416
(a) Gross carrying amount includes the fair value at the acquisition date of the OVEC power purchase contract and coal contracts with terms favorable to
market recognized as a result of the 2010 acquisition of LKE by PPL. Offsetting regulatory liabilities were recorded related to these contracts, which are

177
being amortized over the same period as the intangible assets, eliminating any income statement impact. This is referred to as "regulatory offset" in the tables below. See Note 6 for additional information.
(b) Emission allowances/RECs are expensed when consumed or sold; therefore, there is no accumulated amortization. (c) The increase during 2016 was primarily from increases at WPD. Current intangible assets are included in "Other current assets" and long-term intangible assets are included in "Other intangibles" on the Balance Sheets.
Amortization Expense was as follows: 2016 2015 2014 Intangible assets with no regulatory offset $ 6 $ 6 $ 6 Intangible assets with regulatory offset 24 51 47 Total $ 30 $ 57 $ 53
Amortization expense for each of the next five years, excluding insignificant amounts for consumption of emission allowances/RECs, is estimated to be:
2017 2018 2019 2020 2021 Intangible assets with no regulatory offset $ 6 $ 6 $ 6 $ 6 $ 6 Intangible assets with regulatory offset 9 9 9 8 8 Total $ 15 $ 15 $ 15 $ 14 $ 14
(PPL Electric) The gross carrying amount and the accumulated amortization of other intangible assets were:
December 31, 2016 December 31, 2015
Gross
Carrying Amount
Accumulated Amortization
Gross Carrying Amount
Accumulated Amortization
Subject to amortization: Land and transmission rights $ 341 $ 112 $ 316 $ 108 Licenses and other 3 1 4 1
Total subject to amortization 344 113 320 109 Not subject to amortization due to indefinite life:
Land and transmission rights 20 — 33 — Total $ 364 $ 113 $ 353 $ 109
Intangible assets are shown as "Intangibles" on the Balance Sheets. Amortization expense was insignificant in 2016, 2015 and 2014 and is expected to be insignificant in future years. (LKE) The gross carrying amount and the accumulated amortization of other intangible assets were:
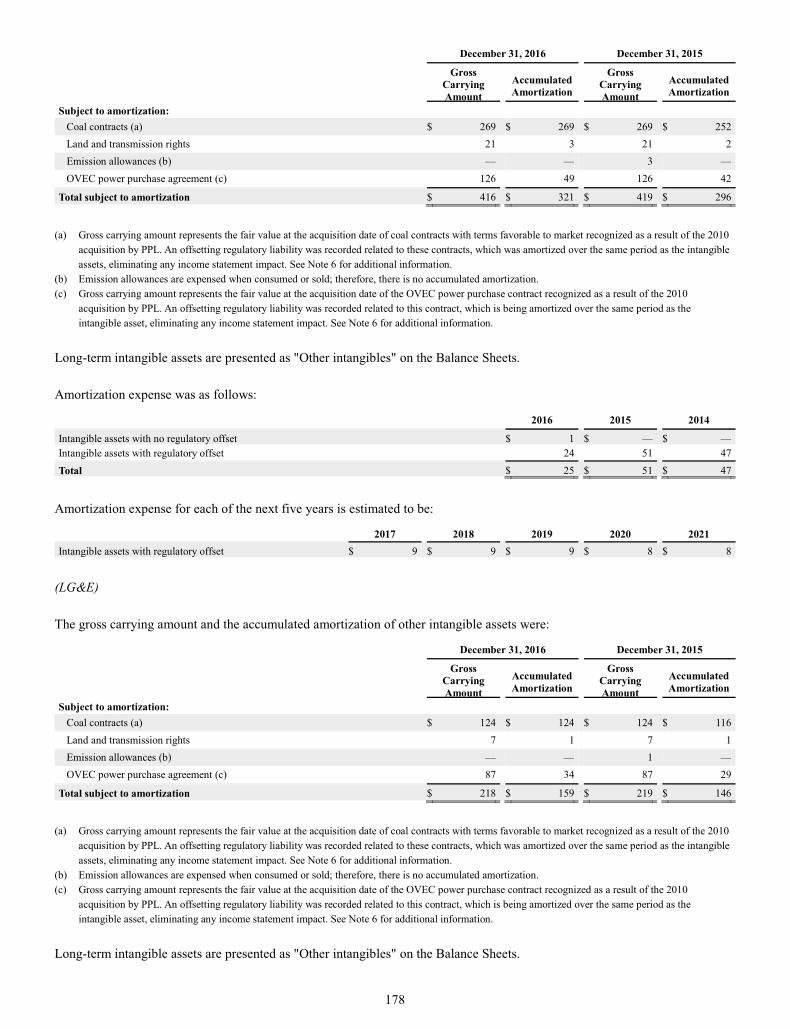
178
December 31, 2016 December 31, 2015
Gross
Carrying Amount
Accumulated Amortization
Gross Carrying Amount
Accumulated Amortization
Subject to amortization: Coal contracts (a) $ 269 $ 269 $ 269 $ 252 Land and transmission rights 21 3 21 2 Emission allowances (b) — — 3 — OVEC power purchase agreement (c) 126 49 126 42
Total subject to amortization $ 416 $ 321 $ 419 $ 296
(a) Gross carrying amount represents the fair value at the acquisition date of coal contracts with terms favorable to market recognized as a result of the 2010
acquisition by PPL. An offsetting regulatory liability was recorded related to these contracts, which was amortized over the same period as the intangible assets, eliminating any income statement impact. See Note 6 for additional information.
(b) Emission allowances are expensed when consumed or sold; therefore, there is no accumulated amortization. (c) Gross carrying amount represents the fair value at the acquisition date of the OVEC power purchase contract recognized as a result of the 2010
acquisition by PPL. An offsetting regulatory liability was recorded related to this contract, which is being amortized over the same period as the intangible asset, eliminating any income statement impact. See Note 6 for additional information.
Long-term intangible assets are presented as "Other intangibles" on the Balance Sheets. Amortization expense was as follows:
2016 2015 2014
Intangible assets with no regulatory offset $ 1 $ — $ — Intangible assets with regulatory offset 24 51 47 Total $ 25 $ 51 $ 47
Amortization expense for each of the next five years is estimated to be:
2017 2018 2019 2020 2021 Intangible assets with regulatory offset $ 9 $ 9 $ 9 $ 8 $ 8
(LG&E) The gross carrying amount and the accumulated amortization of other intangible assets were:
December 31, 2016 December 31, 2015
Gross
Carrying Amount
Accumulated Amortization
Gross Carrying Amount
Accumulated Amortization
Subject to amortization: Coal contracts (a) $ 124 $ 124 $ 124 $ 116 Land and transmission rights 7 1 7 1 Emission allowances (b) — — 1 — OVEC power purchase agreement (c) 87 34 87 29
Total subject to amortization $ 218 $ 159 $ 219 $ 146
(a) Gross carrying amount represents the fair value at the acquisition date of coal contracts with terms favorable to market recognized as a result of the 2010
acquisition by PPL. An offsetting regulatory liability was recorded related to these contracts, which was amortized over the same period as the intangible assets, eliminating any income statement impact. See Note 6 for additional information.
(b) Emission allowances are expensed when consumed or sold; therefore, there is no accumulated amortization. (c) Gross carrying amount represents the fair value at the acquisition date of the OVEC power purchase contract recognized as a result of the 2010
acquisition by PPL. An offsetting regulatory liability was recorded related to this contract, which is being amortized over the same period as the intangible asset, eliminating any income statement impact. See Note 6 for additional information.
Long-term intangible assets are presented as "Other intangibles" on the Balance Sheets.

179
Amortization expense was as follows:
2016 2015 2014 Intangible assets with regulatory offset $ 13 $ 24 $ 23
Amortization expense for each of the next five years is estimated to be:
2017 2018 2019 2020 2021 Intangible assets with regulatory offset $ 6 $ 6 $ 6 $ 6 $ 6
(KU) The gross carrying amount and the accumulated amortization of other intangible assets were:
December 31, 2016 December 31, 2015
Gross
Carrying Amount
Accumulated Amortization
Gross Carrying Amount
Accumulated Amortization
Subject to amortization: Coal contracts (a) $ 145 $ 145 $ 145 $ 136 Land and transmission rights 14 2 14 1 Emission allowances (b) — — 2 — OVEC power purchase agreement (c) 39 15 39 13
Total subject to amortization $ 198 $ 162 $ 200 $ 150
(a) Gross carrying amount represents the fair value at the acquisition date of coal contracts with terms favorable to market recognized as a result of the 2010
acquisition by PPL. An offsetting regulatory liability was recorded related to these contracts, which was amortized over the same period as the intangible assets, eliminating any income statement impact. See Note 6 for additional information.
(b) Emission allowances are expensed when consumed or sold; therefore, there is no accumulated amortization. (c) Gross carrying amount represents the fair value at the acquisition date of the OVEC power purchase contract recognized as a result of the 2010
acquisition by PPL. An offsetting regulatory liability was recorded related to this contract, which is being amortized over the same period as the intangible asset, eliminating any income statement impact. See Note 6 for additional information.
Long-term intangible assets are presented as "Other intangibles" on the Balance Sheets. Amortization expense was as follows:
2016 2015 2014 Intangible assets with no regulatory offset $ 1 $ — $ — Intangible assets with regulatory offset 11 27 24 Total $ 12 $ 27 $ 24
Amortization expense for each of the next five years is estimated to be:
2017 2018 2019 2020 2021 Intangible assets with regulatory offset $ 3 $ 3 $ 3 $ 2 $ 2
19. Asset Retirement Obligations (PPL) WPD has recorded conditional AROs required by U.K. law related to treated wood poles, gas-filled switchgear and fluid-filled cables.

180
(PPL and PPL Electric) PPL Electric has identified legal retirement obligations for the retirement of certain transmission assets that could not be reasonably estimated due to indeterminable settlement dates. These assets are located on rights-of-way that allow the grantor to require PPL Electric to relocate or remove the assets. Since this option is at the discretion of the grantor of the right-of-way, PPL Electric is unable to determine when these events may occur. (PPL, LKE, LG&E and KU) LG&E's and KU's AROs are primarily related to the final retirement of assets associated with generating units. LG&E also has AROs related to natural gas mains and wells. LG&E's and KU's transmission and distribution lines largely operate under perpetual property easement agreements, which do not generally require restoration upon removal of the property. Therefore, no material AROs are recorded for transmission and distribution assets. As described in Notes 1 and 6, for LKE, LG&E and KU, all ARO accretion and depreciation expenses are reclassified as a regulatory asset. ARO regulatory assets associated with approved ECR projects for CCRs are amortized to expense over a period of 10 to 25 years based on retirement expenditures made related to the obligation. For other AROs, at the time of retirement, the related ARO regulatory asset is offset against the associated cost of removal regulatory liability, PP&E and ARO liability. The changes in the carrying amounts of AROs were as follows.
PPL LKE LG&E KU
2016 2015 2016 2015 2016 2015 2016 2015 ARO at beginning of period $ 586 $ 336 $ 535 $ 285 $ 175 $ 74 $ 360 $ 211
Accretion 24 19 22 18 7 5 15 13 Obligations incurred — 5 — 5 — 3 — 2 Changes in estimated timing or cost (84) 235 (95) 234 (19 ) 98 (76 ) 136 Effect of foreign currency exchange rates (9) (2 ) — — — — — — Obligations settled (29) (7 ) (29) (7 ) (18 ) (5) (11 ) (2)
ARO at end of period $ 488 $ 586 $ 433 $ 535 $ 145 $ 175 $ 288 $ 360 LKE recorded decreases of $114 million ($90 million at KU and $24 million at LG&E) to the existing AROs during 2016 related to the closure of CCR impoundments. These revisions are the result of changes in closure plans related to expected costs and timing of closures. Further changes to AROs, capital plans or operating costs may be required as estimates of future cash flows are refined based on closure developments and regulatory or legal proceedings.
LKE recorded increases of $228 million ($139 million at KU and $89 million at LG&E) to the existing AROs during 2015 as a result of an engineering study that was performed, in connection with the final CCR rule, providing clarity on projected CCR closure costs and revisions in the timing and amounts of future expected cash flows. Further increases to AROs or changes to current capital plans or to operating costs may be required as estimates of future cash flows are refined based on closure developments, groundwater monitoring results and regulatory or legal proceedings. See Note 13 for information on the final CCR rule and Note 6 for information on the rate recovery applications with the KPSC.

181
20. Accumulated Other Comprehensive Income (Loss) (PPL and LKE) The after-tax changes in AOCI by component for the years ended December 31 were as follows.
Unrealized gains (losses) Defined benefit plans
Foreign currency
translation adjustments
Available- for-sale
securities Qualifying derivatives
Equity investees'
AOCI
Prior service costs
Actuarial gain (loss) Total
PPL December 31, 2013 $ (11 ) $ 172 $ 94 $ 1 $ (6 ) $ (1,815 ) $ (1,565 ) Amounts arising during the year (275 ) 35 (10 ) — 5 (509 ) (754) Reclassifications from AOCI — (6) (64 ) — 4 111 45 Net OCI during the year (275 ) 29 (74 ) — 9 (398 ) (709) December 31, 2014 $ (286 ) $ 201 $ 20 $ 1 $ 3 $ (2,213 ) $ (2,274 )
Amounts arising during the year (234 ) 8 26 — (9) (366 ) (575) Reclassifications from AOCI — (2) 2 (1 ) — 146 145 Net OCI during the year (234 ) 6 28 (1 ) (9) (220 ) (430) Distribution of PPL Energy Supply (See Note 8) —
(207) (55 ) $ —
—
238
(24)
December 31, 2015 $ (520 ) $ — $ (7 ) $ — $ (6 ) $ (2,195 ) $ (2,728 )
Amounts arising during the year (1,107 ) — 91 — (3) (61 ) (1,080) Reclassifications from AOCI — — (91 ) (1 ) 1 121 30 Net OCI during the year (1,107 ) — — (1 ) (2) 60 (1,050) December 31, 2016 $ (1,627 ) $ — $ (7 ) $ (1 ) $ (8 ) $ (2,135 ) $ (3,778 )
LKE December 31, 2013 $ 1 $ (2 ) $ 14 $ 13 Amounts arising during the year — (7) (50 ) (57)
Reclassifications from AOCI (1 ) 1 (1 ) (1)
Net OCI during the year (1 ) (6) (51 ) (58)
December 31, 2014 $ — $ (8 ) $ (37 ) $ (45 )
Amounts arising during the year — (3) (4 ) (7)
Reclassifications from AOCI — 1 5 6 Net OCI during the year — (2) 1 (1)
December 31, 2015 $ — $ (10 ) $ (36 ) $ (46 )
Amounts arising during the year — — (27 ) (27)
Reclassifications from AOCI (1 ) 2 2 3 Net OCI during the year (1 ) 2 (25 ) (24)
December 31, 2016 $ (1 ) $ (8 ) $ (61 ) $ (70 )
The following table presents PPL's gains (losses) and related income taxes for reclassifications from AOCI for the years ended December 31, 2016 and 2015. LKE amounts are insignificant for the years ended December 31, 2016 and 2015. The defined benefit plan components of AOCI are not reflected in their entirety in the statement of income; rather, they are included in the computation of net periodic defined benefit costs (credits) and subject to capitalization. See Note 11 for additional information.

182
PPL
Details about AOCI 2016 2015 Affected Line Item on the Statements of Income
Available-for-sale securities $ — $ 4 Other Income (Expense) - net Total Pre-tax — 4 Income Taxes — (2) Total After-tax — 2 Qualifying derivatives
Interest rate swaps (7 ) (11) Interest Expense
— (77) Discontinued operations Cross-currency swaps 116 49 Other Income (Expense) - net
3 2 Interest Expense Commodity contracts — 20 Discontinued operations
Total Pre-tax 112 (17) Income Taxes (21 ) 15 Total After-tax 91 (2)
Equity Investees' AOCI 1 1 Other Income (Expense) - net Total Pre-tax 1 1 Income Taxes — — Total After-tax 1 1
Defined benefit plans Prior service costs (2 ) — Net actuarial loss (156 ) (192)
Total Pre-tax (158 ) (192) Income Taxes 36 46 Total After-tax (122 ) (146)
Total reclassifications during the year $ (30 ) $ (145 ) 21. New Accounting Guidance Pending Adoption (All Registrants) Accounting for Revenue from Contracts with Customers In May 2014, the Financial Accounting Standards Board (FASB) issued accounting guidance that establishes a comprehensive new model for the recognition of revenue from contracts with customers. This model is based on the core principle that revenue should be recognized to depict the transfer of promised goods or services to customers in an amount that reflects the consideration to which the entity expects to be entitled in exchange for those goods or services. For public business entities, this guidance can be applied using either a full retrospective or modified retrospective transition method, beginning in annual reporting periods after December 15, 2017 and interim periods within those years. Public business entities may early adopt this guidance in annual reporting periods beginning after December 15, 2016. The Registrants will adopt this guidance effective January 1, 2018. The Registrants have performed an assessment of a significant portion of their revenue under this new guidance to determine its effect on their current revenue recognition policies, and at this time they do not believe it will have a material impact. However, the Registrants will continue to monitor the development of industry specific application guidance which could have an impact on their assessments. The Registrants will determine the transition method they will apply after the industry specific application guidance is final and the implications of using either the full retrospective or modified retrospective transition methods are known.
183
Accounting for Leases In February 2016, the FASB issued accounting guidance for leases. This new guidance requires lessees to recognize a right-of-use asset and a lease liability for virtually all of their leases (other than leases that meet the definition of a short-term lease). For income statement purposes, the FASB retained a dual model for lessees, requiring leases to be classified as either operating or finance. Operating leases will result in straight-line expense (similar to current operating leases) while finance leases will result in a front-loaded expense pattern (similar to current capital leases). Classification will be based on criteria that are largely similar to those applied in current lease accounting, but without explicit bright lines. Lessor accounting under the new guidance is similar to the current model, but updated to align with certain changes to the lessee model and the new revenue recognition standard. Similar to current practice, lessors will classify leases as operating, direct financing, or sales-type. The standard is effective for public companies for fiscal years, and interim periods within those fiscal years, beginning after December 15, 2018. Early adoption is permitted. The new standard must be adopted using a modified retrospective transition, and provides for certain practical expedients. Transition will require application of the new guidance at the beginning of the earliest comparative period presented. The Registrants are currently assessing the impact of adopting this guidance. Accounting for Financial Instrument Credit Losses In June 2016, the FASB issued accounting guidance that requires the use of a current expected credit loss (CECL) model for the measurement of credit losses on financial instruments within the scope of this guidance, which includes accounts receivable. The CECL model requires an entity to measure credit losses using historical information, current information and reasonable and supportable forecasts of future events, rather than the incurred loss impairment model required under current GAAP. For public business entities, this guidance will be applied using a modified retrospective approach and is effective for fiscal years beginning after December 15, 2019, and interim periods within those years. All entities may early adopt this guidance beginning after December 15, 2018, including interim periods within those years. The Registrants are currently assessing the impact of adopting this guidance and the period they will adopt it. Simplifying the Test for Goodwill Impairment In January 2017, the FASB issued accounting guidance that simplifies the test for goodwill impairment by eliminating the second step of the quantitative test. The second step of the quantitative test requires a calculation of the implied fair value of goodwill, which is determined in the same manner as the amount of goodwill in a business combination. Under this new guidance, an entity will now compare the estimated fair value of a reporting unit with its carrying value and recognize an impairment charge for the amount the carrying amount exceeds the fair value of the reporting unit. For public business entities, this guidance will be applied prospectively and is effective for annual or any interim goodwill impairment tests for fiscal years beginning after December 15, 2019. All entities may early adopt this guidance for interim or annual goodwill impairment tests performed on testing dates after January 1, 2017. The Registrants are currently assessing the impact of adopting this guidance and the period they will adopt it.
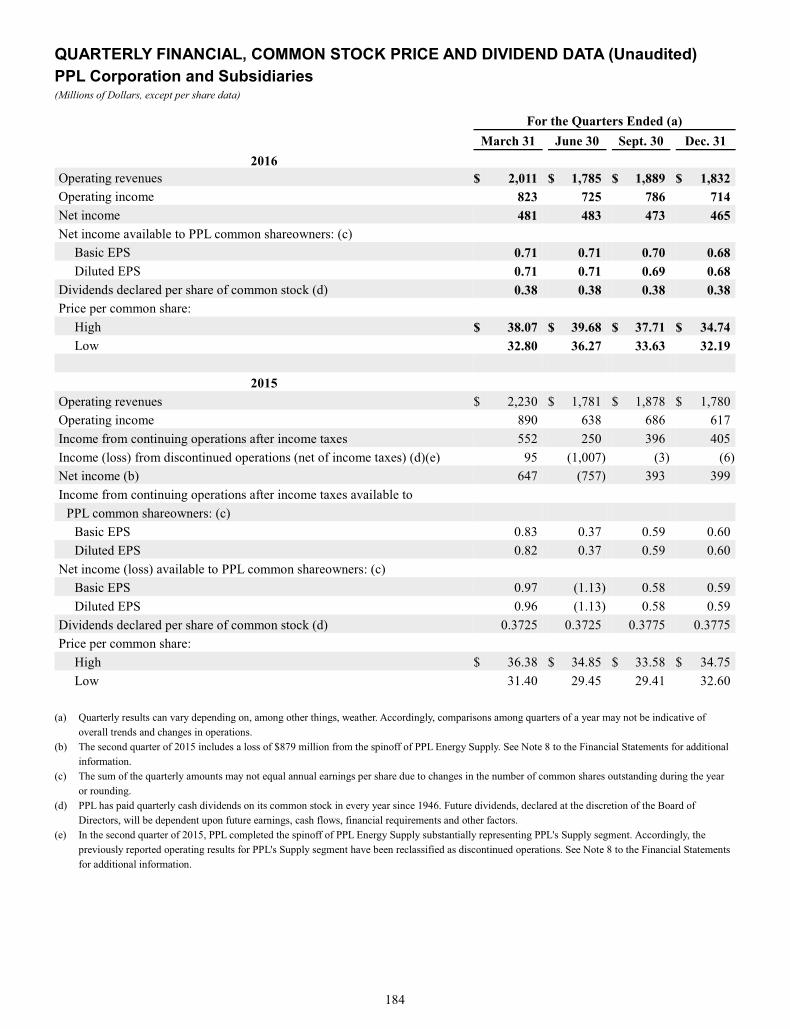
184
QUARTERLY FINANCIAL, COMMON STOCK PRICE AND DIVIDEND DATA (Unaudited) PPL Corporation and Subsidiaries (Millions of Dollars, except per share data)
For the Quarters Ended (a) March 31 June 30 Sept. 30 Dec. 31
2016 Operating revenues $ 2,011 $ 1,785 $ 1,889 $ 1,832 Operating income 823 725 786 714 Net income 481 483 473 465 Net income available to PPL common shareowners: (c)
Basic EPS 0.71 0.71 0.70 0.68 Diluted EPS 0.71 0.71 0.69 0.68
Dividends declared per share of common stock (d) 0.38 0.38 0.38 0.38 Price per common share:
High $ 38.07 $ 39.68 $ 37.71 $ 34.74 Low 32.80 36.27 33.63 32.19
2015
Operating revenues $ 2,230 $ 1,781 $ 1,878 $ 1,780 Operating income 890 638 686 617 Income from continuing operations after income taxes 552 250 396 405 Income (loss) from discontinued operations (net of income taxes) (d)(e) 95 (1,007 ) (3) (6 ) Net income (b) 647 (757 ) 393 399 Income from continuing operations after income taxes available to
PPL common shareowners: (c) Basic EPS 0.83 0.37 0.59 0.60 Diluted EPS 0.82 0.37 0.59 0.60
Net income (loss) available to PPL common shareowners: (c) Basic EPS 0.97 (1.13 ) 0.58 0.59 Diluted EPS 0.96 (1.13 ) 0.58 0.59
Dividends declared per share of common stock (d) 0.3725 0.3725 0.3775 0.3775 Price per common share:
High $ 36.38 $ 34.85 $ 33.58 $ 34.75 Low 31.40 29.45 29.41 32.60
(a) Quarterly results can vary depending on, among other things, weather. Accordingly, comparisons among quarters of a year may not be indicative of
overall trends and changes in operations. (b) The second quarter of 2015 includes a loss of $879 million from the spinoff of PPL Energy Supply. See Note 8 to the Financial Statements for additional
information. (c) The sum of the quarterly amounts may not equal annual earnings per share due to changes in the number of common shares outstanding during the year
or rounding. (d) PPL has paid quarterly cash dividends on its common stock in every year since 1946. Future dividends, declared at the discretion of the Board of
Directors, will be dependent upon future earnings, cash flows, financial requirements and other factors. (e) In the second quarter of 2015, PPL completed the spinoff of PPL Energy Supply substantially representing PPL's Supply segment. Accordingly, the
previously reported operating results for PPL's Supply segment have been reclassified as discontinued operations. See Note 8 to the Financial Statements for additional information.

185
Management's Report on Internal Control over Financial Reporting
PPL's management is responsible for establishing and maintaining adequate internal control over financial reporting, as such term is defined in Exchange Act Rule 13a-15(f) or 15d-15(f). PPL's internal control over financial reporting is a process designed to provide reasonable assurance to PPL's management and Board of Directors regarding the reliability of financial reporting and the preparation of financial statements for external purposes in accordance with generally accepted accounting principles. Because of its inherent limitations, internal control over financial reporting may not prevent or detect misstatements. Under the supervision and with the participation of our management, including our principal executive officer and principal financial officer, we conducted an evaluation of the effectiveness of our internal control over financial reporting based on the framework in "Internal Control - Integrated Framework" (2013) issued by the Committee of Sponsoring Organizations of the Treadway Commission. Based on our evaluation under the framework in "Internal Control - Integrated Framework" (2013), our management concluded that our internal control over financial reporting was effective December 31, 2016. The effectiveness of our internal control over financial reporting has been audited by Deloitte & Touche LLP, an independent registered public accounting firm.

186
GLOSSARY OF TERMS AND ABBREVIATIONS
PPL Corporation and its subsidiaries
KU - Kentucky Utilities Company, a public utility subsidiary of LKE engaged in the regulated generation, transmission, distribution and sale of electricity, primarily in Kentucky. LG&E - Louisville Gas and Electric Company, a public utility subsidiary of LKE engaged in the regulated generation, transmission, distribution and sale of electricity and the distribution and sale of natural gas in Kentucky. LKE - LG&E and KU Energy LLC, a subsidiary of PPL and the parent of LG&E, KU and other subsidiaries. LKS - LG&E and KU Services Company, a subsidiary of LKE that provides administrative, management and support services primarily to LKE and its subsidiaries. PPL - PPL Corporation, the parent holding company of PPL Electric, PPL Energy Funding, PPL Capital Funding, LKE and other subsidiaries. PPL Capital Funding - PPL Capital Funding, Inc., a financing subsidiary of PPL that provides financing for the operations of PPL and certain subsidiaries. Debt issued by PPL Capital Funding is guaranteed as to payment by PPL. PPL Electric - PPL Electric Utilities Corporation, a public utility subsidiary of PPL engaged in the regulated transmission and distribution of electricity in its Pennsylvania service area and that provides electricity supply to its retail customers in this area as a PLR. PPL Energy Funding - PPL Energy Funding Corporation, a subsidiary of PPL and the parent holding company of PPL Global and other subsidiaries. PPL EU Services - PPL EU Services Corporation, a subsidiary of PPL that provides administrative, management and support services primarily to PPL Electric. PPL Global - PPL Global, LLC, a subsidiary of PPL Energy Funding that primarily through its subsidiaries, owns and operates WPD, PPL's regulated electricity distribution businesses in the U.K. PPL Services - PPL Services Corporation, a subsidiary of PPL that provides administrative, management and support services to PPL and its subsidiaries. PPL WPD Limited - an indirect U.K. subsidiary of PPL Global, which holds a liability for a closed defined benefit pension plan and a receivable from WPD plc. Following a reorganization in October 2015, PPL WPD Limited is now parent to WPD plc having previously been a sister company. WPD - refers to PPL WPD Limited and its subsidiaries. WPD (East Midlands) - Western Power Distribution (East Midlands) plc, a British regional electricity distribution utility company. WPD plc - Western Power Distribution plc, a direct U.K. subsidiary of PPL WPD Limited. Its principal indirectly owned subsidiaries are WPD (East Midlands), WPD (South Wales), WPD (South West) and WPD (West Midlands). WPD Midlands - refers to WPD (East Midlands) and WPD (West Midlands), collectively.
187
WPD (South Wales) - Western Power Distribution (South Wales) plc, a British regional electricity distribution utility company. WPD (South West) - Western Power Distribution (South West) plc, a British regional electricity distribution utility company. WPD (West Midlands) - Western Power Distribution (West Midlands) plc, a British regional electricity distribution utility company. WKE - Western Kentucky Energy Corp., a subsidiary of LKE that leased certain non-utility generating plants in western Kentucky until July 2009.
Other terms and abbreviations
£ - British pound sterling. 2001 Mortgage Indenture - PPL Electric's Indenture, dated as of August 1, 2001, to the Bank of New York Mellon (as successor to JPMorgan Chase Bank), as trustee, as supplemented. 2011 Equity Unit(s) - a PPL equity unit, issued in April 2011, consisting of a 2011 Purchase Contract and, initially, a 5.0% undivided beneficial ownership interest in $1,000 principal amount of PPL Capital Funding 4.32% Junior Subordinated Notes due 2019. 2011 Purchase Contract(s) - a contract that is a component of a 2011 Equity Unit requiring holders to purchase shares of PPL common stock on or prior to May 1, 2014. 401(h) account(s) - A sub-account established within a qualified pension trust to provide for the payment of retiree medical costs. Act 11 - Act 11 of 2012 that became effective on April 16, 2012. The Pennsylvania legislation authorized the PUC to approve two specific ratemaking mechanisms: the use of a fully projected future test year in base rate proceedings and, subject to certain conditions, a DSIC. Act 129 - Act 129 of 2008 that became effective in October 2008. The law amended the Pennsylvania Public Utility Code and created an energy efficiency and conservation program and smart metering technology requirements, adopted new PLR electricity supply procurement rules, provided remedies for market misconduct and changed the Alternative Energy Portfolio Standard (AEPS). Advanced Metering System - meters and meter reading systems that provide two-way communication capabilities, which communicate usage and other relevant data to LG&E and KU at regular intervals, and are also able to receive information from LG&E and KU, such as software upgrades and requests to provide meter readings in real time. AFUDC - Allowance for Funds Used During Construction. The cost of equity and debt funds used to finance construction projects of regulated businesses, which is capitalized as part of construction costs. AOCI - accumulated other comprehensive income or loss. ARO - asset retirement obligation. ATM Program - At-the-Market stock offering program.

188
BSER - Best System of Emission Reduction. The degree of emission reduction that the EPA determines has been adequately demonstrated when taking into account the cost of achieving such reduction and any non-air quality health and environmental impact and energy requirements. Cane Run Unit 7 - a natural gas combined-cycle generating unit in Kentucky, jointly owned by LG&E and KU, with a capacity of 642 MW (141 MW and 501 MW to LG&E and KU). CCR(s) - Coal Combustion Residual(s). CCRs include fly ash, bottom ash and sulfur dioxide scrubber wastes. Clean Air Act - federal legislation enacted to address certain environmental issues related to air emissions, including acid rain, ozone and toxic air emissions. Clean Water Act - federal legislation enacted to address certain environmental issues relating to water quality including effluent discharges, cooling water intake, and dredge and fill activities. COBRA - Consolidated Omnibus Budget Reconciliation Act, which provides individuals the option to temporarily continue employer group health insurance coverage after termination of employment. CPCN - Certificate of Public Convenience and Necessity. Authority granted by the KPSC pursuant to Kentucky Revised Statute 278.020 to provide utility service to or for the public or the construction of certain plant, equipment, property or facility for furnishing of utility service to the public. Customer Choice Act - the Pennsylvania Electricity Generation Customer Choice and Competition Act, legislation enacted to restructure the state's electric utility industry to create retail access to a competitive market for generation of electricity. DDCP - Directors Deferred Compensation Plan. Depreciation not normalized - the flow-through income tax impact related to the state regulatory treatment of depreciation-related timing differences. Distribution Automation - advanced grid intelligence enabling LG&E and KU to perform remote monitoring and control, circuit segmentation and "self-healing" of select distribution system circuits, improving grid reliability and efficiency. DNO - Distribution Network Operator in the U.K. DOJ - U.S. Department of Justice. DPCR4 - Distribution Price Control Review 4, the U.K. five-year rate review period applicable to WPD that commenced April 1, 2005. DPCR5 - Distribution Price Control Review 5, the U.K. five-year rate review period applicable to WPD that commenced April 1, 2010. DRIP - PPL Amended and Restated Dividend Reinvestment and Direct Stock Purchase Plan. DSIC - the Distribution System Improvement Charge authorized under Act 11, which is an alternative ratemaking mechanism providing more-timely cost recovery of qualifying distribution system capital expenditures.

189
DSM - Demand Side Management. DSM programs consist of energy efficiency programs intended to reduce peak demand and delay the investment in additional power plant construction, provide customers with tools and information regarding their energy usage and support energy efficiency. Pursuant to Kentucky Revised Statute 278.285, the KPSC may determine the reasonableness of DSM plans proposed by any utility under its jurisdiction. Proposed DSM mechanisms may seek full recovery of costs and revenues lost by implementing DSM programs and/or incentives designed to provide financial rewards to the utility for implementing cost-effective DSM programs. The cost of such programs shall be assigned only to the class or classes of customers that benefit from the programs. DUoS - Distribution Use of System. This forms the majority of WPD's revenues and is the charge to electricity suppliers who are WPD's customers and use WPD's network to distribute electricity. Earnings from Ongoing Operations - A non-GAAP financial measure of earnings adjusted for the impact of special items and used in "Combined Management's Discussion and Analysis of Financial Condition and Results of Operations" (MD&A). EBPB - Employee Benefit Plan Board. The administrator of PPL's U.S. qualified retirement plans, which is charged with the fiduciary responsibility to oversee and manage those plans and the investments associated with those plans. ECR - Environmental Cost Recovery. Pursuant to Kentucky Revised Statute 278.183, Kentucky electric utilities are entitled to the current recovery of costs of complying with the Clean Air Act, as amended, and those federal, state or local environmental requirements that apply to coal combustion wastes and by-products from the production of energy from coal. ELG(s) - Effluent Limitation Guidelines, regulations promulgated by the EPA. EPA - Environmental Protection Agency, a U.S. government agency. EPS - earnings per share. Equity Unit(s) - refers to the 2011 Equity Units. FERC - Federal Energy Regulatory Commission, the U.S. federal agency that regulates, among other things, interstate transmission and wholesale sales of electricity, hydroelectric power projects and related matters. GAAP - Generally Accepted Accounting Principles in the U.S. GBP - British pound sterling. GHG - greenhouse gas(es). GLT - Gas Line Tracker. The KPSC - approved mechanism for LG&E's recovery of costs associated with gas service lines, gas risers, leak mitigation, and gas main replacements. GWh - gigawatt-hour, one million kilowatt hours. Holdco - Talen Energy Holdings, Inc., a Delaware corporation, which was formed for the purposes of the June 1, 2015 spinoff of PPL Energy Supply, LLC. IBEW - International Brotherhood of Electrical Workers.

190
ICP - The PPL Incentive Compensation Plan. This plan provides for incentive compensation to PPL's executive officers and certain other senior executives. New awards under the ICP were suspended in 2012 upon adoption of PPL's 2012 Stock Incentive Plan. ICPKE - The PPL Incentive Compensation Plan for Key Employees. The ICPKE provides for incentive compensation to certain employees below the level of senior executive. If-Converted Method - A method applied to calculate diluted EPS for a company with outstanding convertible debt. The method is applied as follows: Interest charges (after-tax) applicable to the convertible debt are added back to net income and the convertible debt is assumed to have been converted to equity at the beginning of the period, and the resulting common shares are treated as outstanding shares. Both adjustments are made only for purposes of calculating diluted EPS. This method was applied to PPL's Equity Units prior to settlement. IRS - Internal Revenue Service, a U.S. government agency. KPSC - Kentucky Public Service Commission, the state agency that has jurisdiction over the regulation of rates and service of utilities in Kentucky. KU 2010 Mortgage Indenture - KU's Indenture, dated as of October 1, 2010, to The Bank of New York Mellon, as supplemented. kV - kilovolt. kVA - kilovolt ampere. kWh - kilowatt hour, basic unit of electrical energy. LCIDA - Lehigh County Industrial Development Authority. LG&E 2010 Mortgage Indenture - LG&E's Indenture, dated as of October 1, 2010, to The Bank of New York Mellon, as supplemented. LIBOR - London Interbank Offered Rate. Margins - A non-GAAP financial measure of performance used in "Combined Management's Discussion and Analysis of Financial Condition and Results of Operations" (MD&A). MATS - Mercury and Air Toxics Standards, regulations promulgated by the EPA. MMBtu - One million British Thermal Units. MOD - A mechanism applied in the U.K. to adjust allowed base demand revenue in future periods for differences in prior periods between actual values and those in the agreed business plan. Moody's - Moody's Investors Service, Inc., a credit rating agency. MW - megawatt, one thousand kilowatts. NAAQS - National Ambient Air Quality Standards periodically adopted pursuant to the Clean Air Act. NERC - North American Electric Reliability Corporation.

191
NGCC - Natural gas-fired combined-cycle generating plant. NPNS - the normal purchases and normal sales exception as permitted by derivative accounting rules. Derivatives that qualify for this exception may receive accrual accounting treatment. NRC - Nuclear Regulatory Commission, the U.S. federal agency that regulates nuclear power facilities. NSR - The new source review provisions of the Clean Air Act that impose stringent emission control requirements on new and modified sources of air emissions that result in emission increases beyond thresholds allowed by the Clean Air Act. OCI - other comprehensive income or loss. Ofgem - Office of Gas and Electricity Markets, the British agency that regulates transmission, distribution and wholesale sales of electricity and related matters. OVEC - Ohio Valley Electric Corporation, located in Piketon, Ohio, an entity in which LKE indirectly owns an 8.13% interest (consists of LG&E's 5.63% and KU's 2.50% interests), which is accounted for as a cost-method investment. OVEC owns and operates two coal-fired power plants, the Kyger Creek plant in Ohio and the Clifty Creek plant in Indiana, with combined capacities of 2,120 MW. PEDFA - Pennsylvania Economic Development Financing Authority. PJM - PJM Interconnection, L.L.C., operator of the electricity transmission network and electricity energy market in all or parts of Delaware, Illinois, Indiana, Kentucky, Maryland, Michigan, New Jersey, North Carolina, Ohio, Pennsylvania, Tennessee, Virginia, West Virginia and the District of Columbia. PLR - Provider of Last Resort, the role of PPL Electric in providing default electricity supply within its delivery area to retail customers who have not chosen to select an alternative electricity supplier under the Customer Choice Act. PP&E - property, plant and equipment. PPL EnergyPlus - prior to the June 1, 2015 spinoff of PPL Energy Supply, PPL EnergyPlus, LLC, a subsidiary of PPL Energy Supply that marketed and traded wholesale and retail electricity and gas, and supplied energy and energy services in competitive markets. PPL Energy Supply - prior to the June 1, 2015 spinoff, PPL Energy Supply, LLC, a subsidiary of PPL Energy Funding and the parent company of PPL EnergyPlus and other subsidiaries. PPL Montana - prior to the June 1, 2015 spinoff of PPL Energy Supply, PPL Montana, LLC, an indirect subsidiary of PPL Energy Supply, LLC that generated electricity for wholesale sales in Montana and the Pacific Northwest. PUC - Pennsylvania Public Utility Commission, the state agency that regulates certain ratemaking, services, accounting and operations of Pennsylvania utilities. Purchase Contract(s) - refers collectively to the 2010 and 2011 Purchase Contracts, which are components of the 2010 and 2011 Equity Units.

192
RAV - regulatory asset value. This term, used within the U.K. regulatory environment, is also commonly known as RAB or regulatory asset base. RAV is based on historical investment costs at time of privatization, plus subsequent allowed additions less annual regulatory depreciation, and represents the value on which DNOs earn a return in accordance with the regulatory cost of capital. RAV is indexed to Retail Price Index (RPI) in order to allow for the effects of inflation. Since the beginning of DPCR5 in April 2010, RAV additions have been based on a percentage of annual total expenditures which have continued from April 2015 under RIIO-ED1. RAV is intended to represent expenditures that have a long-term benefit to WPD (similar to capital projects for the U.S. regulated businesses that are generally included in rate base). RCRA - Resource Conservation and Recovery Act of 1976. RECs - Renewable Energy Credits. Regional Transmission Expansion Plan - PJM conducts a long-range Regional Transmission Expansion Planning process that identifies changes and additions to the PJM grid necessary to ensure future needs are met for both the reliability and the economic performance of the grid. Under PJM agreements, transmission owners are obligated to build transmission projects assigned to them by the PJM Board. Registrant(s) - refers to the Registrants named on the cover of this Report (each a "Registrant" and collectively, the "Registrants"). Regulation S-X - SEC regulation governing the form and content of and requirements for financial statements required to be filed pursuant to the federal securities laws. RFC - ReliabilityFirst Corporation, one of eight regional entities with delegated authority from NERC that work to safeguard the reliability of the bulk power systems throughout North America. RIIO-ED1 - RIIO represents "Revenues = Incentive + Innovation + Outputs." RIIO-ED1 refers to the initial eight-year rate review period applicable to WPD which commenced April 1, 2015. Riverstone - Riverstone Holdings LLC, a Delaware limited liability company and, as of December 6, 2016, ultimate parent company of the entities that own the competitive power generation business contributed to Talen Energy. RJS Power - RJS Generation Holdings LLC, a Delaware limited liability company controlled by Riverstone, that owns the competitive power generation business contributed by its owners to Talen Energy. RPI - Retail Price Index, is a measure of inflation in the United Kingdom published monthly by the Office for National Statistics. SCRs - selective catalytic reduction, a pollution control process for the removal of nitrogen oxide from exhaust gas. SIP - PPL Corporation's 2012 Stock Incentive Plan. S&P - Standard & Poor's Ratings Services, a credit rating agency. Sarbanes-Oxley - Sarbanes-Oxley Act of 2002, which sets requirements for management's assessment of internal controls for financial reporting. It also requires an independent auditor to make its own assessment. Scrubber - an air pollution control device that can remove particulates and/or gases (primarily sulfur dioxide) from exhaust gases.

193
SEC - the U.S. Securities and Exchange Commission, a U.S. government agency primarily responsible to protect investors and maintain the integrity of the securities markets. SERC - SERC Reliability Corporation, one of eight regional entities with delegated authority from NERC that work to safeguard the reliability of the bulk power systems throughout North America. Smart meter - an electric meter that utilizes smart metering technology. Smart metering technology - technology that can measure, among other things, time of electricity consumption to permit offering rate incentives for usage during lower cost or demand intervals. The use of this technology also has the potential to strengthen network reliability. Superfund - federal environmental statute that addresses remediation of contaminated sites; states also have similar statutes. Talen Energy - Talen Energy Corporation, the Delaware corporation formed to be the publicly traded company and owner of the competitive generation assets of PPL Energy Supply and certain affiliates of Riverstone. Talen Energy Marketing - Talen Energy Marketing, LLC, the new name of PPL EnergyPlus subsequent to the spinoff of PPL Energy Supply. Total shareowner return - the change in market value of a share of the Company's common stock plus the value of all dividends paid on a share of the common stock during the applicable performance period, divided by the price of the common stock as of the beginning of the performance period. The price used for purposes of this calculation is the average share price for the 20 trading days at the beginning and end of the applicable period. Totex (total expenditures) - Totex generally consists of all the expenditures relating to WPD's regulated activities with the exception of certain specified expenditure items (Ofgem fees, National Grid transmission charges, property and corporate income taxes, pension deficit funding and cost of capital). The annual net additions to RAV are calculated as a percentage of Totex. Totex can be viewed as the aggregate net network investment, net network operating costs and indirect costs, less any cash proceeds from the sale of assets and scrap. Treasury Stock Method - a method applied to calculate diluted EPS that assumes any proceeds that could be obtained upon exercise of options and warrants (and their equivalents) would be used to purchase common stock at the average market price during the relevant period. TRU - a mechanism applied in the U.K. to true-up inflation estimates used in determining base demand revenue. VEBA - Voluntary Employee Benefit Association Trust, accounts for health and welfare plans for future benefit payments for employees, retirees or their beneficiaries. Volumetric risk - the risk that the actual load volumes provided under full-requirement sales contracts could vary significantly from forecasted volumes. VSCC - Virginia State Corporation Commission, the state agency that has jurisdiction over the regulation of Virginia corporations, including utilities.

The 2017 forecast range for earnings is $2.05 to $2.25 per share, with a midpoint of $2.15 per share. PPL’s lower earnings guidance in 2017 compared to 2016 results primarily from a lower assumed British pound sterling to U.S. dollar exchange rate in 2017, dilution from the issuance of additional equity and 2016 tax benefits that are not expected to repeat in 2017.
Per share2017 Earnings
Forecast Midpoint
2016 Earnings from Ongoing
Operations
U.K. Regulated $ 1.18 $ 1.49
Kentucky Regulated 0.58 0.58
Pennsylvania Regulated 0.50 0.50
Corporate and Other1 (0.11) (0.12)
Total $ 2.15 $ 2.45 1This category primarily includes unallocated corporate-level financing and other costs.
U.K. Regulated Segment PPL projects lower segment earnings in 2017 compared with 2016, due to a lower assumed British pound sterling to U.S. dollar exchange rate in
2017, lower incentive revenues, higher interest expense, higher depreciation expense and higher income taxes, partially offset by lower operation and maintenance expense, including pension expense. The remaining 2017 foreign currency exposure for this segment (as of February 24, 2017) is 96 percent hedged at an average rate of $1.21 per pound, compared to an average rate of $1.45 per pound in 2016.
Kentucky Regulated Segment PPL projects relatively flat segment earnings in 2017 compared with 2016, primarily driven by electricity and gas base rate increases, offset by higher operation and maintenance expense and higher depreciation expense.
Pennsylvania Regulated Segment PPL projects relatively flat segment earnings in 2017 compared with 2016, primarily driven by higher transmission earnings and lower operation and maintenance expense, offset by higher depreciation expense, higher interest expense and higher income taxes.
Corporate and Other PPL projects costs to be relatively flat in this category in 2017 compared with 2016.
RECONCILIATION OF FINANCIAL MEASURES (UNAUDITED) AND 2017 EARNINGS FORECAST
PPL Corporation 2016 Annual Report v
2017 Earnings Forecast by Segment
Reconciliation of Net Income to Earnings from Ongoing Operations
(Per Share - Diluted)
U.K. Reg.
KYReg.
PAReg.
Corp. &Other
Total2016
Total2015
Net Income $ 1.83 $ 0.58 $ 0.50 $ (0.12) $ 2.79 $ 1.01
Less: Special Items (expense) benefit:*
Foreign currency-related economic hedges (0.01) - - - (0.01) 0.08
Spinoff of the Supply segment - - - - - (1.39)
Settlement of foreign currency contracts 0.30 - - - 0.30 -
Change in U.K. tax rate 0.05 - - - 0.05 0.11
Settlement of certain income tax positions - - - - - 0.03
Certain income tax valuation allowances - - - - - (0.02)
LKE acquisition-related adjustment - - - - - (0.01)
Total Special Items 0.34 - - - 0.34 (1.20)
Earnings from Ongoing Operations $ 1.49 $ 0.58 $ 0.50 $ (0.12) $ 2.45 $ 2.21
* See Combined Management’s Discussion and Analysis of Financial Condition and Results of Operations for additional information on special items.

DIRECTORS & OFFICERS
VI PPL Corporation 2016 Annual Report
DIRECTORS
Rodney C. Adkins, 58, President of 3RAM Group, LLC, an investment, consulting and property management firm. He retired as a Senior Vice President of International Business Machines Corporation, a globally integrated technology and consulting company.
John W. Conway, 71, retired as Chief Executive Officer of Crown Holdings, Inc., an international manufacturer of packaging products for consumer goods. He continues to serve as Chairman of the Board of Crown Holdings.
Steven G. Elliott, 70, retired as Senior Vice Chairman of The Bank of New York Mellon Corporation, an investment management and investment servicing company.
Raja Rajamannar, 55, Chief Marketing & Communications Officer, and President, Healthcare, of MasterCard International Incorporated, a technology company in the global payments industry.
Craig A. Rogerson, 60, Chairman, President and Chief Executive Officer of Chemtura Corporation, a global manufacturer and marketer of specialty chemicals, serving a broad spectrum of industrial markets.
William H. Spence, 60, Chairman, President and Chief Executive Officer of PPL Corporation.
Natica von Althann, 66, a founding partner of C&A Advisors, a consulting firm in the financial services and risk management areas, from 2009 until 2013. She retired in 2008 as the Senior Credit Risk Management Executive for Bank of America and Chief Credit Officer of U.S. Trust, an investment management company.
Keith H. Williamson, 64, Executive Vice President, Secretary and General Counsel of Centene Corporation, a provider of Medicaid-managed care and specialty healthcare services for under-insured and uninsured individuals.
Armando Zagalo de Lima, 58, retired as Executive Vice President of Xerox Corporation, a multi-national enterprise for business process and document management.
BOARD COMMITTEES
Executive Committee William H. Spence, Chair John W. Conway Steven G. Elliott Craig A. Rogerson Natica von Althann
Audit Committee Steven G. Elliott, Chair Rodney C. Adkins Raja Rajamannar Craig A. Rogerson Keith H. Williamson Armando Zagalo de Lima
Compensation, Governance and Nominating Committee Craig A. Rogerson, Chair John W. Conway Raja Rajamannar Natica von Althann
Finance Committee Natica von Althann, Chair Rodney C. Adkins John W. Conway Steven G. Elliott Keith H. Williamson Armando Zagalo de Lima
EXECUTIVE OFFICERS
William H. Spence, Chairman, President and Chief Executive Officer, PPL Corporation Joanne H. Raphael, Senior Vice President, General Counsel and Corporate Secretary, PPL Corporation Vincent Sorgi, Senior Vice President and Chief Financial Officer, PPL Corporation Gregory N. Dudkin, President, PPL Electric Utilities Corporation Victor A. Staffieri, Chairman and Chief Executive Officer, LG&E and KU Energy LLC Robert A. Symons, Chief Executive, Western Power Distribution Paul W. Thompson, President and Chief Operating Officer, LG&E and KU Energy LLC Joseph P. Bergstein, Jr., Vice President-Investor Relations and Treasurer, PPL Corporation Stephen K. Breininger, Vice President and Controller, PPL Corporation

SHAREOWNER INFORMATION
PPL Corporation 2016 Annual Report VII
Annual Meeting Shareowners are invited to attend PPL Corporation’s Annual Meeting on Wednesday, May 17, 2017, at the Kentucky Center for the Performing Arts, Bomhard Theater, 501 West Main Street, Louisville, Kentucky. The meeting will begin at 9 a.m. Eastern Time.
Stock Exchange Listing PPL Corporation common stock is listed on the New York Stock Exchange (NYSE). The symbol is PPL. On March 15, 2017, the closing price per share was $36.90, and there were 57,960 shareowners of record.
2016
High Low Dividends Declared
1st quarter $38.09 $32.18 $0.38
2nd quarter 39.92 36.14 0.38
3rd quarter 37.88 33.52 0.38
4th quarter 34.98 32.08 0.38
2015
High Low Dividends Declared
1st quarter $36.74 $31.31 $0.3725
2nd quarter 35.09 29.33 0.3725
3rd quarter 33.83 29.18 0.3775
4th quarter 35.00 32.22 0.3775
The company has paid cash dividends on its common stock in every quarter since 1946. The annualized dividend was $1.52 per share in 2016 and $1.50 per share in 2015. On February 1, 2017, PPL declared a quarterly dividend of $0.395 per share (equivalent to $1.58 annualized), effective with the dividend paid April 3, 2017, to shareowners of record on March 10, 2017.
Dividend Calendar Subject to the declaration of dividends on PPL Common Stock by the PPL Board of Directors or its Executive Committee, dividends are paid on the first business day of April, July, October and January. The record dates for dividends for the balance of 2017 are expected to be June 9, September 8 and December 8.
PPL’s Website: www.pplweb.com Shareowners can access PPL publications such as annual and quarterly reports to the Securities and Exchange Commission (SEC Forms 10-K and 10-Q), other PPL filings, corporate governance materials, news releases, stock quotes and historical performance. Visitors to our website may subscribe to receive automated email alerts for SEC filings, earnings news releases, daily stock prices and other financial news.
Financial reports, which are available at www.pplweb.com, will be mailed without charge upon request by contacting:
PPL Treasury Department Two North Ninth Street, Allentown, PA 18101 Email: [email protected] Telephone: PPL Corporate Offices, 610-774-5151
Lost Dividend Checks Dividend checks lost by investors, or those that may be lost in the mail, will be replaced if the check has not been located by the 10th business day following the payment date.
Dividend Reinvestment & Direct Stock Purchase Plan (Plan) PPL offers investors the opportunity to acquire shares of PPL common stock through its Plan. Through the Plan, participants are eligible to invest up to $25,000 per calendar month in PPL common stock. Shareowners may choose to have dividends on their PPL Corporation common stock fully or partially reinvested in PPL common stock, or can receive full payment of cash dividends by check or EFT. Participants in the Plan may choose to have their common stock certificates deposited into their Plan account.
Direct Registration System PPL participates in the Direct Registration System (DRS). Shareowners may choose to have their common stock certificates converted to book entry form within the DRS by submitting their certificates to PPL’s transfer agent.
Online Account Access Registered shareowners can activate their account for online access by visiting shareowneronline.com.
Shareowner Inquiries, Transfer Agent and Registrar; Dividend Disbursing Agent; Plan Administrator Wells Fargo Bank, N.A. Shareowner Services 1110 Centre Pointe Curve, Suite 101 Mendota Heights, MN 55120 Toll-free: 1-800-345-3085 Outside U.S.: 1-651-450-4064 Website: shareowneronline.com
Corporate Offices PPL Corporation Two North Ninth Street Allentown, PA 18101 610-774-5151
PPL and the PPL logo are trademarks of PPL Corporation or an affiliate. S&P 500 is a registered trademark of McGraw-Hill, Inc.
© 2017 PPL Corporation. All rights reserved.

PPL Corporation | Two North Ninth Street, Allentown PA 18101-1179 | www.pplweb.com
PP
L CO
RP
OR
AT
ION
AN
NU
AL R
EP
OR
T 20
16