Embed Size (px)
Citation preview

Deliverable 8.1 Best practice white paper on use of EVs
for UN programs
Creator Petros Patias (Aristotle University of Thessaloniki, Greece)
Creation date May 06, 2018
Due date August 30, 2018
Last revision date November 10, 2018
Status Final
Type Report
Description Presents the role that the Essential Variables (EVs) play in development and assessment of UN programs and more specifically the Sustainable Development Goals (SDGs). The connection of Earth Observation data to EVs and SDGs is specifically stressed through a portfolio of best practices.
Right Public
Language English
Citation
Patias P., Verde N., Mallinis G., Georgiadis C., Giuliani G., Serral I., McCallum I., Kussul N., Lehmann A., Masò J., Best practice white paper on use of EVs for UN programs. GEOEssential Deliverable 8.1

2
Grant agreement ERA-PLANET No 689443
Table of contents
1 FROM EO DATA TO SDGS: AN INTRODUCTORY NOTE ................................................................. 3
1.1 ESSENTIAL VARIABLES AND COMPLEX SYSTEMS................................................................................... 3 1.2 ASSIGNING EVS TO SDGS .............................................................................................................. 4 1.3 MONITORING SDGS WITH EO ........................................................................................................ 5
2 THE CURRENT STATUS OF EVS – INDICATORS – SDGS ................................................................. 8
2.1 CLIMATE – ECVS .......................................................................................................................... 8 2.2 BIODIVERSITY – EBVS ................................................................................................................. 11 2.3 WATER – EWVS ........................................................................................................................ 12 2.4 OCEAN – EOVS .......................................................................................................................... 13 2.5 AGRICULTURE – AGWS ............................................................................................................... 15 2.6 RENEWABLE ENERGY – EREVS ...................................................................................................... 16 2.7 URBAN – UEVS .......................................................................................................................... 17
3 EO IN SUPPORT TO SDGS: A PORTFOLIO OF BEST PRACTICES .................................................... 19
3.1 PREAMBLE ................................................................................................................................ 19 3.2 GEO EXAMPLES.......................................................................................................................... 20 3.3 GEO-UN_GGIM EXAMPLES ........................................................................................................ 23 3.4 UNOOSA EXAMPLES .................................................................................................................. 25 3.5 CEOS/ESA EXAMPLES................................................................................................................. 27 3.6 GLOBAL PARTNERSHIP EXAMPLES .................................................................................................. 29 3.7 CONNECTINGEO EXAMPLES .......................................................................................................... 30 3.8 MISC EXAMPLES ......................................................................................................................... 32
4 LESSONS LEARNT – ON-GOING PROCESS ................................................................................... 34

3
1 From EO data to SDGs: An introductory Note
1.1 Essential Variables and Complex systems To address global sustainability challenges, timely and reliable access to environmental data and information is necessary. Data provide the foundation for reliable and accountable scientific understanding and knowledge to support informed decisions and evidence based policy advices (Giuliani, Nativi, et al. 2017). Consequently, achieving the objective of a sustainable development requires the integration of various data sets describing physical, chemical, biological and socio-economic conditions (Lehmann et al. 2017). All together, these different data allow characterizing a given location on Earth. When combined, environmental data allow monitoring and assessing the status of the environment at various scales (e.g., national, regional, global), understanding interactions between different systems (e.g., atmosphere, hydrosphere, biosphere), and model future changes (Costanza et al. 2016). Earth Observations (EO) data, acquired remotely by satellite or in-situ by sensors, is a valid and globally consistent source of information for monitoring the state of the planet and increasing our understanding of Earth processes (Giuliani, Dao, et al. 2017). The Group on Earth Observations (GEO) has been established in 2005 in response to the need for coordinated, comprehensive, and sustained observations related to the state of the Earth (Anderson et al. 2017). GEO’s global engagement priorities include supporting the UN 2030 Agenda for Sustainable Development , the Paris Agreement on Climate, and the Sendai Framework for Disaster Risk Reduction (CEOS 2018; GEO secretariat 2015). To adequately describe the various sub-systems (e.g., atmosphere, biosphere, land, ocean) that constitute the Earth system and to ensure that observational data can be delivered to all potential users, the concept of Essential Variables has emerged in the recent years in various communities (Reyers et al. 2017). Essential Variables (EV) can be broadly defined as “a minimal set of variables that determine the system’s state and developments, are crucial for predicting system developments, and allow us to define metrics that measure the trajectory of the system” (ConnectinGEO 2016a). In most GEO Societal Benefits Areas (SBA) and thematic areas, the development of a specific set of EV’s is a community process leading to an agreement on an essential set of parameters to meet the objectives of a given community and to support national to global monitoring, reporting, research, and forecasting (Reyers et al. 2017). The concept of Essential Variables emerged from the climate community through the effort of the Global Climate Observing System (GCOS) who defined a set of 50 Essential Climate Variables (ECV) as a response for more coordinated and consistent approach to climate observations (Ostensen, O’Brien, and Cooper 2008). Theses variables are required to support the work on the United Nations Framework Convention on Climate Change (UNFCC) and the Intergovernmental Panel on Climate Change (IPCC) (Bojinski et al. 2014). ECV’s are selected based on their relevance for characterizing Earth’s climate system as well as their technical and economic feasibility for systematic observations (Giuliani, Nativi, et al. 2017; Reyers et al. 2017). These parameters are now widely used in both science and policy

4
domains and are regularly reviewed to adapt to the need of new priorities, knowledge and innovation. Similar approaches have been followed in different scientific communities. The more mature development of EV’s are in Climate, Ocean, and Biodiversity domains (Lindstrom et al. 2012; Pereira et al. 2013). Other communities are currently working on defining a common set of Essential Variables such as Water, Agriculture, Ecosystems (GEO 2014; ConnectinGEO 2016a). In particular, the Essential Biodiversity Variables further clarifies the role of EV’s lying between primary observations and indicators (Geijzendorffer et al. 2015). Such definition allows accommodating both the diversity of data providers and the changing demand for indicators across regions and different policy needs (Reyers et al. 2017). While the environmental dimension of sustainability is decently characterized by the EV approach, the social and economic dimensions are not yet adequately addressed. This currently impede effectively tracking progresses towards sustainable development targets (ConnectinGEO 2016b). Different approaches have been recently proposed for better understanding complex interactions between social and biophysical systems. Planetary boundaries, footprints, or socio-ecological metabolism approaches are aiming to explicitly link environmental, social and economic dimensions (Reyers et al. 2017; Rockstrom et al. 2009; Fang, Heijungs, and De Snoo 2015; Giampietro 2016). These approaches have the potential to pave the way to the definition of a set of Essential Socio-Economic Variables (ESEV). All these efforts in systems and sustainability research allow advancing and identifying essential dimensions of social, economic and environmental systems change and evolution. The EV concept represents a significant opportunity to strengthen monitoring systems by providing more efficient observations and seize fundamental system dimensions. Finally, one EV can potentially contribute to multiple indicators, and a given observation can be linked to more than one EV. This can enable a potential reduction of the number of observations required to deliver indicators (Reyers et al. 2017).
1.2 Assigning EVs to SDGs The UN approved 17 SDGs that have been articulated in 169 targets and 240 indicators to measure progress towards these targets. The UN has also release 17 documents (referred to as metadata documents; one for each SGD) that detail the reports of international agencies consulted by the UN on how the indicators will be measured in practice1. However, out of the all SDG indicators, only a small fraction has a direct dependency on, or benefit of, EOs in the classical sense. The SDG indicator framework is to a large extent focusing on statistical variables related to human activities and human conditions. These variables are inherently social or economic in their nature. A number of scientific communities have raised concerns about the environment not sufficiently represented in both the SDGs and the indicators proposed to monitor progress towards the targets. For example, Griggs et al. (2013) put a strong emphasis on safeguarding the Earth’s life-support system, on which present and future generations depend. Lu et al. (2015) point out that a review of the proposed SDGs conducted by International Council for Science, ICSU, showed that
1 http://unstats.un.org/sdgs/iaeg-sdgs/metadata-compilation

5
addressing climate change, food and water security, and health requires coordinated global monitoring and modeling of many factors. The currently proposed indicator framework has not sufficiently integrated the environmental aspects of sustainable development. After carefully examination of these 17 documents, ConnectinGEO (2016) concluded that 231 of the 240 indicators can be calculated with socio-economic data, only 30 can be extracted with the combination of socio-economic data and Earth observation (in-situ, airborne or remote sensing) and only 9 indicators from Earth observation alone. The Goals 12, 13, 14, and 15 all address environmental aspects of sustainable development, but the current indicators do not fully utilize the available EOs. There is an important role for EO in complementing the current indicators with comprehensive data and products, including geospatial products directly relevant for the monitoring of the targets for these goals. Based on the notion that sustainable development requires the functioning Earth’s life support system (Griggs et al., 2013), GeoEssential could propose to develop a set of complementary indicators that bring environmental aspects to the monitoring of SDG targets through the inclusion of some linkable EVs. Within GeoEssential the linkage between SDGs indicators and EVs will be deepened and introduced into the dashboard.
1.3 Monitoring SDGs with EO The 2030 Agenda for Sustainable Development provides a pathway to a sustainable future for the planet. The seventeen Sustainable Development Goals (SDGs) encompass a range of global challenges including poverty, hunger, disease, climate change and the environment, complemented by their associated targets and a global indicator framework. Monitoring, data gathering, and evaluation processes are vital for the successful implementation of the SDGs (Lu et al., 2015). Hence, tracking progress towards the SDGs requires high-quality, timely and accessible data, often in areas or for sectors where very little data exists today (West and Pateman, 2017). Traditional means to gather such data (in particular for SDGs 1 and 2) has been the use of household surveys. However, the data required to track progress towards the SDG targets cannot come solely from governments or intergovernmental organizations or institutions (Hsu et al., 2014; Flueckiger and Seth, 2016). The requirements of the SDGs are now too large and complex, with ever increasing levels of detail required, translating into a growing burden on governments and agencies tasked with monitoring and implementation. Hence, implementation of the SDGs will also require novel, scalable and cost-efficient approaches to ensure that the SDGs are met. New innovative approaches to data collection make use of various forms of Earth observation (EO) to address some of the data needs and increasing examples demonstrate this (e.g. tracking deforestation, early warning systems for natural disasters, global agricultural monitoring and more). Efforts are underway on multiple fronts (e.g. GEO, CEOS, ESA and others) to outline a conceptual framework and demonstrate the important role that EO can play in tracking many of the indicators that will otherwise be extremely challenging to obtain via traditional

6
methods only. The intent is to outline a framework on how an integrated and innovative approach can complement and strengthen data collection needs. Perhaps more importantly, EO in conjunction with Citizen Science could prove to be one of the most realistic options we have to implement the SDGs, as it has the potential to support societal transformation to sustainable development by creating empowerment among citizens. What is needed is a roadmap to address the surmountable data challenges that the SDGs are facing, and offer a realistic solution for implementing the SDGs by involving all stakeholders, namely citizens together with satellite-based EO and traditional approaches in the entire SDG cycle, thus enhancing public awareness and action for SDG achievement. References Anderson, Katherine, Barbara Ryan, William Sonntag, Argyro Kavvada, and Lawrence Friedl. 2017. “Earth
Observation in Service of the 2030 Agenda for Sustainable Development.” Geo-Spatial Information Science 0 (0): 1–20. https://doi.org/10.1080/10095020.2017.1333230.
Bojinski, Stephan, Michel Verstraete, Thomas C. Peterson, Carolin Richter, Adrian Simmons, and Michael Zemp. 2014. “The Concept of Essential Climate Variables in Support of Climate Research, Applications, and Policy.” Bulletin of the American Meteorological Society 95 (9): 1431–43. https://doi.org/10.1175/BAMS-D-13-00047.1.
CEOS. 2018. “Satellite Earth Observations in Support of the Sustainable Developement Goals.” European Space Agency.
ConnectinGEO. 2016a. “EVs Current Status in Different Communities and Way to Move Forward.” ConnectinGEO 2016b. “Navigating Sustainability on a Changing Planet.” ConnectinGEO, D2.3. Proposal of EVs for selected themes. 2016. 66 pg. https://ddd.uab.cat/record/163483. Costanza, Robert, Lew Daly, Lorenzo Fioramonti, Enrico Giovannini, Ida Kubiszewski, Lars Fogh Mortensen,
Kate E. Pickett, Kristin Vala Ragnarsdottir, Roberto De Vogli, and Richard Wilkinson. 2016. “Modelling and Measuring Sustainable Wellbeing in Connection with the UN Sustainable Development Goals.” Ecological Economics 130 (October): 350–55. https://doi.org/10.1016/j.ecolecon.2016.07.009.
Fang, K., R. Heijungs, and G. R. De Snoo. 2015. “Understanding the Complementary Linkages between Environmental Footprints and Planetary Boundaries in a Footprint-Boundary Environmental Sustainability Assessment Framework.” Ecological Economics 114 (June): 218–26. https://doi.org/10.1016/j.ecolecon.2015.04.008.
Flueckiger and Seth, 2016. SDG indicators need crowdsourcing. Nature 531. 448. Geijzendorffer, Ilse R., Eugenie C. Regan, Henrique M. Pereira, Lluis Brotons, Neil Brummitt, Yoni Gavish,
Peter Haase, et al. 2015. “Bridging the Gap between Biodiversity Data and Policy Reporting Needs: An Essential Biodiversity Variables Perspective.” Journal of Applied Ecology, n/a-n/a. https://doi.org/10.1111/1365-2664.12417.
GEO. 2014. “The GEOSS Water Strategy: From Obervations to Decisions.” GEO secretariat. 2015. “The Contributions of Earth Observations in Achieving the Post-2015 Development
Agenda,” 3. Giampietro, Mario. 2016. “The Relational Analysis of the Metabolic Pattern of Social-Ecological Systems:
Introducing MuSIASEM 2.0,” 44. Giuliani, Gregory, Hy Dao, Andrea De Bono, Bruno Chatenoux, Karin Allenbach, Pierric De Laborie, Denisa
Rodila, Nikos Alexandris, and Pascal Peduzzi. 2017. “Live Monitoring of Earth Surface (LiMES): A Framework for Monitoring Environmental Changes from Earth Observations.” Remote Sensing of Environment. https://doi.org/10.1016/j.rse.2017.05.040.
Giuliani, Gregory, Stefano Nativi, Andre Obregon, Martin Beniston, and Anthony Lehmann. 2017. “Spatially Enabling the Global Framework for Climate Services: Reviewing Geospatial Solutions to Efficiently Share and Integrate Climate Data & Information.” Climate Services 8: 44–58. https://doi.org/10.1016/j.cliser.2017.08.003.

7
Griggs, D., Stafford-Smith, M., Gaffney, O., Rockström, J., Öhman, M. C., Shyamsundar, P., Steffen, W., Glaser, G., Kanie, N., & Noble, I., 2013. Sustainable development goals for people and planet, Nature, 495, 305–307.
Hsu et al., 2014. Mobilize citizens to track sustainability. Nature. 508: 33-35 Lehmann, Anthony, Rebecca Chaplin-Kramer, Martin Lacayo, Grégory Giuliani, David Thau, Kevin Koy,
Grace Goldberg, and Richard Sharp Jr. 2017. “Lifting the Information Barriers to Address Sustainability Challenges with Data from Physical Geography and Earth Observation.” Sustainability 9 (5): 858. https://doi.org/10.3390/su9050858.
Lindstrom, Eric, John Gunn, Albert Fischer, Andrea McCurdy, LK Glover, Keith Alverson, Bee Berx, Peter Burkill, Francisco Chavez, and Dave Checkley. 2012. “A Framework for Ocean Observing.”
Lu, Y., Nakicenovic, N., Visbeck, M., Stevance, A.-S., 2015. Five priorities for the UN Sustainable Development Goals. Nature, 520, 432-433.
Lu et al., 2015. Policy: Five priorities for the UN SDGs. Nature 520, 432-433. Ostensen, Olaf, Douglas O’Brien, and Antony Cooper. 2008. “Measurements to Know and Understand Our
World.” ISO Focus, no. February: 35–37. Pereira, H. M., S. Ferrier, M. Walters, G. N. Geller, R. H. G. Jongman, R. J. Scholes, M. W. Bruford, et al.
2013. “Essential Biodiversity Variables.” Science 339 (6117): 277–78. https://doi.org/10.1126/Science.1229931.
Reyers, Belinda, Mark Stafford-Smith, Karl-Heinz Erb, Robert J Scholes, and Odirilwe Selomane. 2017. “Essential Variables Help to Focus Sustainable Development Goals Monitoring.” Current Opinion in Environmental Sustainability, Open issue, part II, 26–27 (June): 97–105. https://doi.org/10.1016/j.cosust.2017.05.003.
Rockstrom, J., W. Steffen, K. Noone, A. Persson, F. S. Chapin, E. F. Lambin, T. M. Lenton, et al. 2009. “A Safe Operating Space for Humanity.” Nature 461 (7263): 472–75. https://doi.org/10.1038/461472a.
West and Pateman, 2017. How could citizen science support the SDGs? SEI, Sweden.

8
2 The current status of EVs – Indicators – SDGs
In the following pages, the current state of EVs and their connection to SDGs and their Indicators is presented briefly, exploiting the material found in the deliverables of the H2020 project ConnectinGEO: D2.2 “EVs current status in different communities and way to move forward”, D2.3 “Proposal of EVs for selected themes”, and of the H2020 project ECOPOTENTIAL D2.1 “Review of existing Essential Variables (EVs) relevant to PAs studies”. As the recent expand in the EV concept started from their definition and linkage to SDGs and Indicators by ConnectingGEO, the list of EVs is still growing and only few scientific communities have defined an adequate set of EVs. The community that has defined the highest number of EVs is currently the Climate one, covering – with its ECVs (Essential Climate Variables) – one third of the total number. The Ocean community, is also already working on a mature set of EVs. The Biodiversity, Water, and Energy communities, likewise, populated their lists to a considerable extent, while in the Agriculture community the EVs are still few in number and in a developing stage. In other areas, like Disasters, Ecosystems, Health, and Urban Development, the work on specific EVs is still in the initial stage. Fortunately, they can rely also on several EVs already identified in some areas that are relevant also to others. Out of the 240 SDG indicators, only 30 with the combination of socio-economic and Earth observation data and only 9 indicators can be extracted by Earth observation alone. The Indicators which can be calculated from existing EVs will be mentioned herein, in connection to each EV category respectively, (ConnectinGEO 2016)
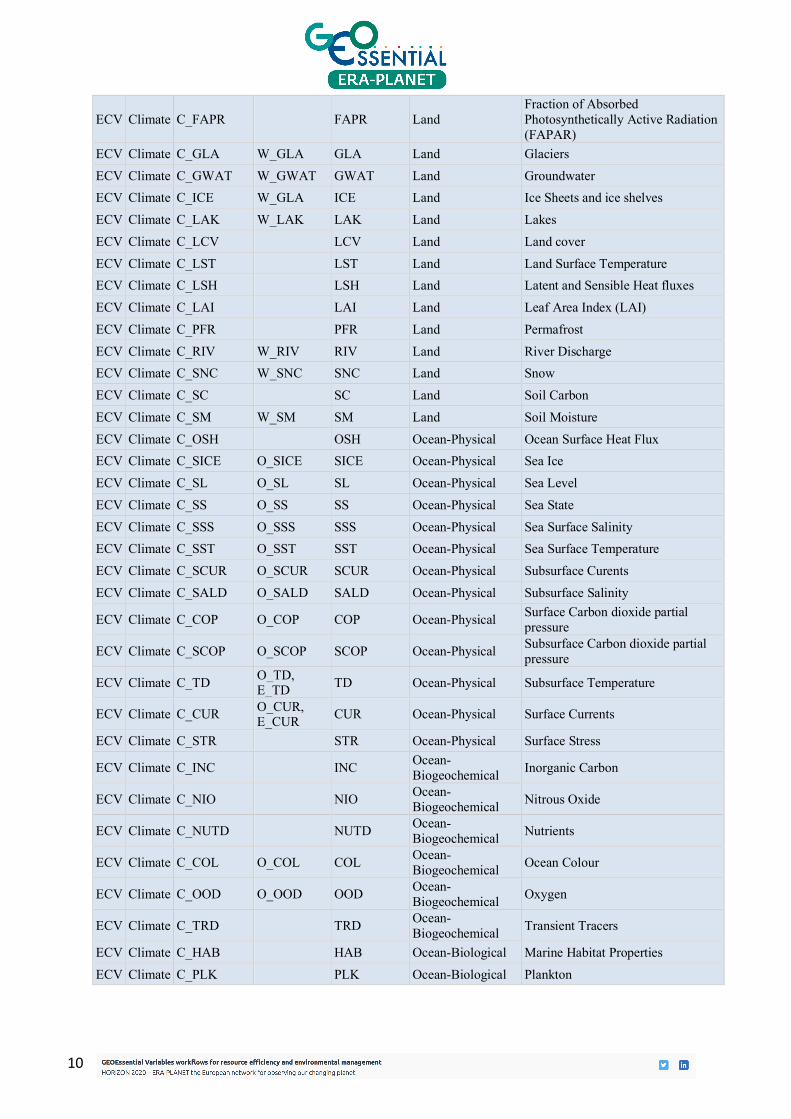
2.1 Climate – ECVs The community that first defined the term of EVs, more than 10 years ago, was the Climate one (Bojinski et. al 2014), led by the Global Climate Observing System (GCOS)2. The Essential Climate Variables (ECVs) were proposed as a response to the need for a more coordinated approach to global climate observations and still hold the highest number of EVs until now (Reyers et. al 2017). The SDGs and Indicators ECVs can contribute to, are: Goal 3: Ensure healthy lives and promote well-being for all at all ages
• Indicator 3.3.3: Malaria incidence per 1,000 population. • Indicator 3.9.1: Mortality rate attributed to household and ambient air pollution
2 https://www.ncdc.noaa.gov/gosic/global-climate-observing-system-gcos

9
Goal 9: Build resilient infrastructure, promote inclusive and sustainable industrialization and foster innovation
• Indicator 9.4.1 CO2 emission per unit of value added
Goal 11: Make cities and human settlements inclusive, safe, resilient and sustainable
• Indicator 11.6.2 Annual mean levels of fine particulate matter (e.g. PM2.5 and PM10) in cities (population weighted)
Goal 15: Protect, restore and promote sustainable use of terrestrial ecosystems, sustainably manage forests, combat desertification, and halt and reverse land degradation and halt biodiversity loss
• Indicator 15.1.1 Forest area as a proportion of total land area • Indicator 15.2.1 Progress towards sustainable forest management • Indicator 15.4.2 Mountain Green Cover Index
EV TYPE EV-CODE Similar EVs EV-SHORT CATEGORY NAME
ECV Climate C_PRC O_PRC, E_PRC PRC Atmosphere Precipitation
ECV Climate C_PAS O_PAS, E_PAS PAS Atmosphere Pressure (surface)
ECV Climate C_SRB SRB Atmosphere Surface Radiation Budget
ECV Climate C_WAS E_WAS WAS Atmosphere Surface Wind Speed and direction
ECV Climate C_TAS E_TAS TAS Atmosphere Temperature (surface)
ECV Climate C_WVAS WVAS Atmosphere Water Vapour (surface) ECV Climate C_ERB ERB Upper Atmosphere Earth Radiation Budget
ECV Climate C_LIG LIG Upper Atmosphere Lightning
ECV Climate C_TU TU Upper Atmosphere Temperature (upper-air)
ECV Climate C_WVU WVU Upper Atmosphere Water Vapour (upper air)
ECV Climate C_WNU WNU Upper Atmosphere Wind speed and direction (upper-air)
ECV Climate C_AER AER Atmospheric Composition Aerosols properties
ECV Climate C_CO2 CO2 Atmospheric Composition
Carbon Dioxide, Methane and other Greenhouse gases
ECV Climate C_CLD E_CLD CLD Atmospheric Composition Cloud Properties
ECV Climate C_O3A O3A Atmospheric Composition Ozone
ECV Climate C_PRE PRE Atmospheric Composition
Precursors (supporting the Aerosol and Ozone ECVs)
ECV Climate C_AGB AGB Land Above-ground biomass
ECV Climate C_ALB ALB Land Albedo
ECV Climate C_GHG GHG Land Anthropogenic Greenhouse Gas Fluxes
ECV Climate C_WTS W_WTS WTS Land Anthropogenic Water Use ECV Climate C_FIRE FIRE Land Fire
10
ECV Climate C_FAPR FAPR Land Fraction of Absorbed Photosynthetically Active Radiation (FAPAR)
ECV Climate C_GLA W_GLA GLA Land Glaciers
ECV Climate C_GWAT W_GWAT GWAT Land Groundwater ECV Climate C_ICE W_GLA ICE Land Ice Sheets and ice shelves
ECV Climate C_LAK W_LAK LAK Land Lakes
ECV Climate C_LCV LCV Land Land cover
ECV Climate C_LST LST Land Land Surface Temperature ECV Climate C_LSH LSH Land Latent and Sensible Heat fluxes
ECV Climate C_LAI LAI Land Leaf Area Index (LAI)
ECV Climate C_PFR PFR Land Permafrost
ECV Climate C_RIV W_RIV RIV Land River Discharge ECV Climate C_SNC W_SNC SNC Land Snow
ECV Climate C_SC SC Land Soil Carbon
ECV Climate C_SM W_SM SM Land Soil Moisture
ECV Climate C_OSH OSH Ocean-Physical Ocean Surface Heat Flux ECV Climate C_SICE O_SICE SICE Ocean-Physical Sea Ice
ECV Climate C_SL O_SL SL Ocean-Physical Sea Level
ECV Climate C_SS O_SS SS Ocean-Physical Sea State
ECV Climate C_SSS O_SSS SSS Ocean-Physical Sea Surface Salinity ECV Climate C_SST O_SST SST Ocean-Physical Sea Surface Temperature
ECV Climate C_SCUR O_SCUR SCUR Ocean-Physical Subsurface Curents
ECV Climate C_SALD O_SALD SALD Ocean-Physical Subsurface Salinity
ECV Climate C_COP O_COP COP Ocean-Physical Surface Carbon dioxide partial pressure
ECV Climate C_SCOP O_SCOP SCOP Ocean-Physical Subsurface Carbon dioxide partial pressure
ECV Climate C_TD O_TD, E_TD TD Ocean-Physical Subsurface Temperature
ECV Climate C_CUR O_CUR, E_CUR CUR Ocean-Physical Surface Currents
ECV Climate C_STR STR Ocean-Physical Surface Stress
ECV Climate C_INC INC Ocean-Biogeochemical Inorganic Carbon
ECV Climate C_NIO NIO Ocean-Biogeochemical Nitrous Oxide
ECV Climate C_NUTD NUTD Ocean-Biogeochemical Nutrients
ECV Climate C_COL O_COL COL Ocean-Biogeochemical Ocean Colour
ECV Climate C_OOD O_OOD OOD Ocean-Biogeochemical Oxygen
ECV Climate C_TRD TRD Ocean-Biogeochemical Transient Tracers
ECV Climate C_HAB HAB Ocean-Biological Marine Habitat Properties
ECV Climate C_PLK PLK Ocean-Biological Plankton

11
2.2 Biodiversity – EBVs The Essential Biodiversity Variables (EBVs) (Pereira et. al 2013), inspired by the ECVs, were clearly defined to “lie between primary observations and indicators” (Reyers et. al 2017), and were defined in a top-down approach based on the Aichi Targets for 2020. They are led by the Group on Earth Observations Biodiversity Observation Network (GEO_BON)3. The SDGs and Indicators EBVs can contribute to, are: Goal 6: Ensure availability and sustainable management of water and sanitation for all
• Indicator 6.6.1 Change in the extent of water-related ecosystems over time
Goal 14: Conserve and sustainably use the oceans, seas and marine resources for sustainable development
• Indicator 14.1.1 Index of Coastal Eutrophication (ICEP) and Floating Plastic debris Density
• Indicator 14.4.1 Proportion of fish stocks within biologically sustainable levels
Goal 15: Protect, restore and promote sustainable use of terrestrial ecosystems, sustainably manage forests, combat desertification, and halt and reverse land degradation and halt biodiversity loss
• Indicator 15.1.1 Forest area as a proportion of total land area • Indicator 15.1.2 Proportion of important sites for terrestrial and freshwater
biodiversity that are covered by protected areas, by ecosystem type • Indicator 15.2.1 Progress towards sustainable forest management • Indicator 15.3.1 Proportion of land that is degraded over total land Area • Indicator 15.5.1 Red List Index • Indicator 15.9.1 Progress towards national targets established in accordance with
Aichi Biodiversity Target 2 of the Strategic Plan for Biodiversity 2011-2020
EV TYPE EV-CODE Similar EVs EV-SHORT CATEGORY NAME EBV Biodiversity B_GCC GCC Genetic composition Co-ancestry
EBV Biodiversity B_GCA GCA Genetic composition Allelic diversity
EBV Biodiversity B_GCP GCP Genetic composition Population genetic differentiation
EBV Biodiversity B_GCB GCB Genetic composition Breed and variety diversity
EBV Biodiversity B_SPD SPD Species populations Species distribution
EBV Biodiversity B_SPA SPA Species populations Population abundance
EBV Biodiversity B_SPS SPS Species populations Population structure by age/size class
3 https://geobon.org/

12
EBV Biodiversity B_STPH STPH Species traits Phenology
EBV Biodiversity B_STB STB Species traits Body mass
EBV Biodiversity B_STN STN Species traits Natal dispersion distance
EBV Biodiversity B_STM STM Species traits Migratory behavior
EBV Biodiversity B_STD STD Species traits Demographic traits
EBV Biodiversity B_STP STP Species traits Physiological traits
EBV Biodiversity B_CCT CCT Community composition Taxonomic diversity
EBV Biodiversity B_CCS CCS Community composition Species interactions
EBV Biodiversity B_EFNP EFNP Ecosystem function Net primary productivity
EBV Biodiversity B_EFSP EFSP Ecosystem function Secondary productivity
EBV Biodiversity B_EFNR EFNR Ecosystem function Nutrient retention
EBV Biodiversity B_EFDR EFDR Ecosystem function Disturbance regime
EBV Biodiversity B_ESH ESH Ecosystem structure Habitat structure
EBV Biodiversity B_ESE ESE Ecosystem structure Ecosystem extent and fragmentation
EBV Biodiversity B_ESC ESC Ecosystem structure Ecosystem composition by functional type
2.3 Water – EWVs Led by the Integrated Global Water Cycle Observations Community of Practice (IGWCO), the water community, in the GEOSS Water Strategy Report, defined the concept of Essential Water Variables (EWVs). A number of EWVs are also ECVs (Lawford 2014). Unlike several other communities, the methodology to identify EWVs starts at applications and identified user needs (ConnectinGEO 2015). The SDGs and Indicators EWVs can contribute to, are: Goal 3: Ensure healthy lives and promote well-being for all at all ages
• Indicator 3.9.1: Mortality rate attributed to household and ambient air pollution Goal 6: Ensure availability and sustainable management of water and sanitation for all
• Indicator 6.3.2 Proportion of bodies of water with good ambient water quality • Indicator 6.4.1 Change in water use efficiency over time • Indicator 6.4.2 Level of water stress: freshwater withdrawal as a proportion of
available freshwater resources • Indicator 6.6.1 Change in the extent of water-related ecosystems over time
EV TYPE EV-CODE Similar EVs EV-SHORT CATEGORY NAME
EWV Water W_PRC C_PRC, E_PRC PRC Primary Precipitation
EWV Water W_EVA EVA Primary Evaporation and evapotranspiration
EWV Water W_SNC C_SNC SNC Primary Snow cover (including snow water equivalent, depth, freeze thaw margins)

13
EWV Water W_SM C_SM SM Primary Soil moisture/temperature
EWV Water W_GWAT C_GWAT GWAT Primary Groundwater
EWV Water W_RIV C_RIV RIV Primary Runoff/streamflow/river discharge
EWV Water W_LAK C_LAK LAK Primary Lakes/reservoir levels and aquifer volumetric change
EWV Water W_GLA C_GLA, C_ICE GLA Primary Glaciers/ice sheets
EWV Water W_WQ WQ Primary Water quality
EWV Water W_WTS C_WTS WTS Primary Water use/demand (agriculture, hydrology, energy, urbanization)
EWV Water WS_MET WS_MET Supplemental Surface meteorology
EWV Water WS_RAD WS_RAD Supplemental Surface and atmospheric radiation budgets
EWV Water WS_CLD WS_CLD Supplemental Clouds
EWV Water WS_PERM WS_PERM Supplemental Permafrost
EWV Water WS_LC WS_LC Supplemental Land cover, vegetation, and land use
EWV Water WS_ELV
WS_ELV Supplemental Elevation/topography and geological stratification
EWV Water WS_ALTI WS_ALTI Supplemental Surface altimetry
EWV Water WS_SRB WS_SRB Supplemental Surface radiation budgets
EWV Water WS_AER WS_AER Supplemental Aerosols
EWV Water WS_ARB WS_ARB Supplemental Atmospheric radiation budgets
2.4 Ocean – EOVs Regarding the Essential Ocean Variables (EOVs), the definition and identification process was coordinated by the Intergovernmental Oceanographic Commission (IOC)4 led by the Global Ocean Observing System (GOOS)5 in 2010, for three different ocean subthemes: ocean physics, marine biology and ecosystems, and marine biogeochemistry (ConnectinGEO 2015). The methodology to identify the EOVs is described in Lindstrom et al (2012). In general, it’s a well-developed and reasonably completed methodology, through a simultaneous top-down and bottom-up approach, trying to address both scientific questions and tackle societal benefit areas. The SDG and Indicators EOVs can contribute to, are: Goal 14: Conserve and sustainably use the oceans, seas and marine resources for sustainable development
• Indicator 14.1.1 Index of Coastal Eutrophication (ICEP) and Floating Plastic debris Density
• Indicator 14.3.1 Average marine acidity (pH) measured at agreed suite of representative sampling stations
4 http://www.ioc-unesco.org/ 5 http://www.goosocean.org/

14
EV TYPE EV-CODE Similar EVs EV-SHORT CATEGORY NAME EOV Ocean O_AIR AIR Physical surface Upper-Air
EOV Ocean O_O O Physical surface Oxygen
EOV Ocean O_TRD C_TRD TRD Physical surface Tracers
EOV Ocean O_ACI ACI Physical surface Ocean acidity EOV Ocean O_COL C_COL COL Physical surface Ocean Color EOV Ocean O_COP C_COP COP Physical surface Carbon Dioxide Partial Pressure EOV Ocean O_SICE C_SICE SICE Physical surface Sea Ice EOV Ocean O_SL C_SL SL Physical surface Sea Level
EOV Ocean O_PAS C_PAS, E_PAS PAS Physical surface
Sea Level Pressure EOV Ocean O_SS C_SS SS Physical surface Sea State EOV Ocean O_SSS C_SSS SSS Physical surface Sea Surface Salinity EOV Ocean O_SST C_SST SST Physical surface Sea Surface Temperature
EOV Ocean O_CUR C_CUR, E_CUR CUR Physical surface
Surface Current EOV Ocean O_WND WND Physical surface Surface Wind
EOV Ocean O_GHC GHC Physical sub-surface Global Ocean Heat Content
EOV Ocean O_TD C_TD, E_TD TD Physical sub-
surface Temperature
EOV Ocean O_SCOP C_SCOP SCOP Physical sub-surface Carbon Dioxide partial pressure
EOV Ocean O_SCUR C_SCUR SCUR Physical sub-surface Current
EOV Ocean O_SACI SACI Physical sub-surface Ocean Acidity
EOV Ocean O_OOD C_OOD OOD Physical sub-surface Oxygen
EOV Ocean O_STRA STRA Physical sub-surface Tracers
EOV Ocean O_SALD C_SALD SALD Physical sub-surface Salinity
EOV Ocean O_OBIO OBIO Biogeochemical Oxygen
EOV Ocean O_NUT NUT Biogeochemical Macro Nutrients: NO3, PO4, Si, NH4, NO2
EOV Ocean O_CAR CAR Biogeochemical Carbonate System: DIC, Total Alkalinity, pCO2 and ph, at least 2 of 4
EOV Ocean O_TRTR TRTR Biogeochemical Trascient Tracers: CFC-12, CFC-11, SF6, tritium, 3He, 14C, 39Ar
EOV Ocean O_SUSP SUSP Biogeochemical Suspended particulates (POC, PON or POM) and PIC ++ laboratory, beam attenuation, backscatter, acidiflabile, beam attenuation
EOV Ocean O_PMAT PMAT Biogeochemical Particulate Matter Export: POC export, CaCO3 export, BSi export
EOV Ocean O_NITO NITO Biogeochemical Nitrous Oxide
EOV Ocean O_C13 C13 Biogeochemical Carbon-13: 13C/12C of dissolved inorganic carbon
EOV Ocean O_DOM DOM Biogeochemical DOM: Dissolved organic matter, DOC, DON, DOP
EOV Ocean O_CHL CHL Biology and Ecosystems Chlorophyll

15
EOV Ocean O_CRL CRL Biology and Ecosystems Coral Cover
EOV Ocean O_MGV MGV Biology and Ecosystems Mangrove Area
EOV Ocean O_HAB HAB Biology and Ecosystems Harmful Algal Blooms HABs
EOV Ocean O_ZPLK ZPLK Biology and Ecosystems Zooplankton:biomass/abundance
EOV Ocean O_SMA SMA Biology and Ecosystems Salt Marsh Area
EOV Ocean O_LMV LMV Biology and Ecosystems
Large marine vertebrates: abundance/distribution
EOV Ocean O_SGRA SGRA Biology and Ecosystems Seagrass Area
EOV Ocean O_LMVT LMVT Biology and Ecosystems
Tags and Tracking of species of value/large marine vertebrates
EOV Ocean O_ZPKK ZPKK Biology and Ecosystems Zooplankton, Krill
2.5 Agriculture – AGVs The agriculture theme is defining and perusing EVs even if experts in field do not use the term yet. In GEOGLAM (the Group on Earth Observations Global Agricultural Monitoring Initiative)6, EVs were defined based on monitoring needs to support policy and program development at the local, regional, national and global scales. AGVs are linked to EBVs and ECVs (ConnectinGEO 2015). The SDGs and Indicators AGVs can contribute to, are: Goal 2: End hunger, achieve food security and improved nutrition and promote sustainable agriculture
• Indicator 2.3.1 (Volume of production per labour unit by classes of farming/pastoral/forestry enterprise size)
Goal 12: Ensure sustainable consumption and production patterns
• Indicator 12.2.1 Material footprint (MF) and MF per capita, per GDP • Indicator 12.3.1 Global food loss index
EV TYPE EV-CODE Similar EVs EV-SHORT CATEGORY NAME AGV Agriculture A_CA CA Crop Crop Area
AGV Agriculture A_CT CT Crop Crop Type
AGV Agriculture A_CC CC Crop Crop Condition
AGV Agriculture A_CPH CPH Crop Crop Phenology
AGV Agriculture A_CY CY Crop Crop Yield (current and forecast)
AGV Agriculture A_CM CM Crop Crop Management and agricultural practices
6 http://www.geoglam.org

16
2.6 Renewable Energy – EREVs The approach used for defining the Essential Renewable Energy Variables (EREVs) is a bottom-up, system-based approach. It starts from the stakeholders needs expressed since 2000 in collaborative projects. They were first defined in 2015, in the ConnectinGEO D2.2 “EVs current status in different communities and way to move forward”. The international bodies fully or partly involved in the identification and collection of ER-EVs are GEO, IRENA (International Renewable Energy Agency)7 and IEA (International Energy Agency)8. The SDGs and Indicators EREVs can contribute to, are: Goal 7: Ensure access to affordable, reliable, sustainable and modern energy for all
• Indicator 7.2.1 Renewable energy share in the total final energy Consumption Goal 11: Make cities and human settlements inclusive, safe, resilient and sustainable
• Indicator 11.3.1 Ratio of land consumption rate to population growth rate • Indicator 11.7.1 Average share of the built-up area of cities that is open space for
public use for all, by sex, age and persons with disabilities Goal 12: Ensure sustainable consumption and production patterns
• Indicator 12.2.1 Material footprint (MF) and MF per capita, per GDP EV TYPE EV-CODE Similar EVs EV-SHORT CATEGORY NAME
EREV Renewable Energy E_SSI SSI Solar Solar Surface Irradiance and its
components (global, direct, diffuse)
EREV Renewable Energy E_SUN SUN Solar Sunshine duration (demand in
energy)
EREV Renewable Energy E_LULC LULC Solar
Land use, Land cover, including urbanization, hydrology, grid description
EREV Renewable Energy E_ELEV ELEV Solar Elevation, Orography
EREV Renewable Energy E_LST LST Solar Land surface temperature
EREV Renewable Energy E_WAVE WAVE Ocean Wave, height, direction, period
EREV Renewable Energy E_TDL TDL Ocean Tidal (min, max, sea surface
elevation)
EREV Renewable Energy E_CUR O_CUR,
C_CUR CUR Ocean See current, speed, direction
EREV Renewable Energy E_BAT BAT Ocean Ocean bathymetry
EREV Renewable Energy E_OFL OFL Ocean Ocean floor type
EREV Renewable Energy E_TD C_TD,
O_TD TD Ocean Temperature, sea-surface, sub-surface and deep-sea
7 http://www.irena.org/ 8 https://www.iea.org/

17
EREV Renewable Energy E_OW OW Ocean Ocean, fixed and floating offshore
wind, wave, tidal, currents, OTEC
EREV Renewable Energy E_URB URB Terrestrial Urbanization
EREV Renewable Energy E_WAS C_WAS,
O_WAS WAS Terrestrial Wind speed and direction
EREV Renewable Energy E_CLD C_CLD CLD Terrestrial
Cloud cover (demand in energy)
EREV Renewable Energy E_PRC C_PRC,
W_PRC PRC Terrestrial Precipitation
EREV Renewable Energy E_TAS C_TAS,
O_TAS TAS Terrestrial Surface air temperature
EREV Renewable Energy E_SH C_WVAS SH Terrestrial
Surface humidity
EREV Renewable Energy E_PAS C_PAS,
O_PAS PAS Terrestrial Surface athmospheric Pressure
2.7 Urban – UEVs Urban Essential Variables are currently under development stage, mostly in the ERA-PLANET project SMURBS (SMart URBan Solutions for air quality, disasters and city growth)9. Recently, in the “National Methodological Framework for the mapping and biophysical valuation of the ecosystems in Bulgaria”, Part D (Chipev et. al 2018), UEVs were defined among others, as indicator parameters (indicator inputs) for urban ecosystems. These parameters derived from a top-down approach based on the urban system’s Drivers-Pressures-State-Impacts-Responses (DPSIR). The SDGs and Indicators UEVs can contribute to, are: Goal 9: Build resilient infrastructure, promote inclusive and sustainable industrialization and foster innovation
• Indicator 9.4.1 CO2 emission per unit of value added
Goal 11: Make cities and human settlements inclusive, safe, resilient and sustainable
• 11.1.1 Proportion of urban population living in slums, informal settlements or inadequate housing.
• 11.2.1 Proportion of population that has convenient access to public transport, by sex, age and persons with disabilities.
• 11.3.1 Ratio of land consumption rate to population growth rate. • 11.6.2 Annual mean levels of fine particulate matter (e.g. PM2.5 and PM10) in cities. • 11.7.1 Average share of the built-up area of cities that is open space for public use for
all, by sex, age and persons with disabilities.
EV TYPE EV-CODE Similar EVs EV-SHORT CATEGORY NAME
9 http://smurbs.eu/

18
UEV Urban - - Vegetation canopy cover
UEV Urban - - Soil sealing
UEV Urban - - Area of natural habitats
UEV Urban - - Reclaimed waste deposits areas
UEV Urban - - Air quality
UEV Urban - - Actual evapotranspiration
UEV Urban - E_URB - Spatial structure of urban areas
UEV Urban - C_CO2 - Trend of total CO2 emissions
UEV Urban - C_TAS, E_TAS, C_LST
- Temperature sum totals (for the active growing period)
UEV Urban - E_SSI - Solar-energy potential
UEV Urban - - Urban runoff coefficient
UEV Urban - C_RIV, W_RIV Natural ground water discharge
UEV Urban - - Risk to soil and atmospheric drought
References Bojinski, S., Verstraete, M., Peterson, T. C., Richter, C., Simmons, A., & Zemp, M. (2014). The concept of
essential climate variables in support of climate research, applications, and policy. Bulletin of the American Meteorological Society, 95(9), 1431-1443.
Chipev, Nesho, Svetla Bratanova-Doncheva, Kremena Gocheva, Miglena Zhiyanski, Margarita Mondeshka, Yavor Yordanov, Iva Apostolova, et al. 2018. “METHODOLOGICAL FRAMEWORK FOR ASSESSMENT AND MAPPING OF ECOSYSTEM CONDITION AND ECOSYSTEM SERVICES IN BULGARIA. PART D Guide for Monitoring of Trends in Ecosystem Condition and Ecosystem Services.”
ConnectinGEO, D2.2. EVs current status in different communities and way to move forward. 2015. https://ddd.uab.cat/record/146882.
ConnectinGEO, D2.3. Proposal of EVs for selected themes. 2016. https://ddd.uab.cat/record/163483. ECOPOTENTIAL, D2.1. Review of existing Essential Variables (EVs) relevant to PA studies . 2014.
https://ec.europa.eu/research/participants/documents/downloadPublic?documentIds=080166e5b116ffc7&appId=PPGMS
Lawford, R. (2014). The GEOSS Water Strategy: From Observations to Decisions. Retrieved from: ftp://ftp.earthobservations.org/TEMP/Water/GEOSS_WSR_Full_Report.pdf
Lindstrom, E., Gunn, J., Fischer, A., McCurdy, A., Glover, L. K., Alverson, K., ... & Clark, C. (2012). A framework for ocean observing. Proceedings of the Ocean Information for Society: Sustaining the Benefits, Realizing the Potential, Venice, Italy, 2125.
Pereira, H. M., Ferrier, S., Walters, M., Geller, G. N., Jongman, R. H. G., Scholes, R. J., ... & Coops, N. C. (2013). Essential biodiversity variables. Science, 339(6117), 277-278.
Reyers, B., Stafford-Smith, M., Erb, K. H., Scholes, R. J., & Selomane, O. (2017). Essential Variables help to focus Sustainable Development Goals monitoring. Current Opinion in Environmental Sustainability, 26, 97-105.

19
3 EO in support to SDGs: A portfolio of Best practices
3.1 Preamble The Global Indicator Framework of the SDGs requires integrating multiple types of data. These data range from traditional national accounts, household surveys and routine administrative data, to new sources of data, like EO, geospatial information, citizen science, and Big Data. EO and geospatial information will play a significant role in meeting the SDGs in a global level as they are often continuous in their spatial and temporal resolutions, thus significantly expanding monitoring capabilities at local, national, regional and global levels, and across sectors10. EO has already been linked to multiple SDG Indicators by GEO in the framework of EO4SDG (Table 1). In the following section, various actions originating from different worldwide or national organizations and institutes, are presented, to demonstrate the use of EO in support of the SDGs. These actions are introduced as examples by GEO, the United Nations Global Geospatial Information Management (UN-GGIM), the United Nations Office for Outer Space Affairs (UNOOSA), the Committee on Earth Observation Satellites (CEOS), the European Space Agency (ESA), the Global Partnership for Sustainable Development Data and the ConnectinGEO Project.
10 https://www.earthobservations.org/documents/publications/201704_geo_unggim_4pager.pdf

20
Table 1: SDG Targets and Indicators that can be supported by Earth observations. Credit: EO4SDGs / CEOS.
3.2 GEO examples Title of action GSMaP: Global Satellite Mapping of Precipitation
SDG Target: 6.5 By 2030, implement integrated water resources management at all levels, including through transboundary cooperation as appropriate
SDG Indicator: 6.5.1 Degree of integrated water resources management implementation (0-100) Essential Variables Precipitation The Global Satellite Mapping of Precipitation (GSMaP)11 Project started in 2002 and is led by JAXA (the Japanese national aerospace and space agency). The aims of the GSMaP Project are the development of an advanced microwave radiometer algorithm and the production of precise high-resolution global precipitation maps, in order to obtain the basic information for the 11 http://sharaku.eorc.jaxa.jp/GSMaP_crest/index.html

21
research of global precipitation variation and for the long term water resource management (Kubota et. al 2007; Ushio et. al 2003). GSMaP uses EO data from the Global Precipitation Measurement (GPM) satellite and provides hourly estimates of precipitation in a global level, offering the ability of transboundary cooperation, which is crucial in the event of floods caused by typhoons, or heavy rains. Furthermore, GSMaP contributes to flood prediction and early warnings broadcast that have already been implemented as pilots in Bangladesh, the Philippines, Vietnam and in Pakistan12. For all these reasons, it is clear that the GSMaP Project contributes to the SDG Indicator 6.5.1: Degree of integrated water resources management implementation (0-100), to meet Target 6.5: By 2030, implement integrated water resources management at all levels, including through transboundary cooperation as appropriate. The EV that GSMaP Project is directly associated to is Precipitation. References Kubota, T., Shige, S., Hashizume, H., Aonashi, K., Takahashi, N., Seto, S., ... & Kachi, M. (2007). Global
precipitation map using satellite-borne microwave radiometers by the GSMaP project: Production and validation. IEEE Transactions on Geoscience and Remote Sensing, 45(7), 2259-2275.
Ushio, T., Okamoto, K. I., Iguchi, T., Takahashi, N., Iwanami, K., Aonashi, K., ... & Inoue, T. (2003). The global satellite mapping of precipitation (GSMaP) project. Aqua (AMSR-E), 2004.
Title of action Algal Early Warning System (AEWS)
SDG Target: 6.3
By 2030, improve water quality by reducing pollution, eliminating dumping and minimizing release of hazardous chemicals and materials, halving the proportion of untreated wastewater and substantially increasing recycling and safe reuse globally
SDG Indicator: 6.3.2 Proportion of bodies of water with good ambient water quality Essential Variables Chlorophyll, Harmful Algal Blooms HABs
One of the threats of inland waters that is of increasing concern is the rise of cyanobacterial (blue-green algal) blooms13. Causing extensive problems in lakes worldwide (including human and ecological health risks, anoxia and fish kills, and taste and odor problems), cyanobacterial blooms are a particular concern in both recreational waters and drinking water sources because of
12 https://www.earthobservations.org/documents/publications/201703_geo_eo_for_2030_agenda.pdf 13 https://www.earthobservations.org/documents/publications/201703_geo_eo_for_2030_agenda.pdf
22
their dense biomass and the risk of exposure to toxins, (Clark et. al 2017). The Algal Early Warning System (AEWS) Project14, is a collaboration between the Commonwealth Scientific and Industrial Research Organisation (CSIRO) and the New South Wales (NSW) Department of Primary Industries - Office of Water, to develop a remote sensing approach to monitoring algal blooms in inland waters across large spatial scales, thus avoiding the limited spatial extent and time consumption of traditional field monitoring. The EO data that will be used within the project are Landsat and Sentinel data. The products of AEWS will have a direct input to SDG Indicator 6.3.2: Proportion of bodies of water with good ambient water quality, to meet Target 6.3: By 2030, improve water quality by reducing pollution, eliminating dumping and minimizing release of hazardous chemicals and materials, halving the proportion of untreated wastewater and substantially increasing recycling and safe reuse globally. References Clark, J. M., Schaeffer, B. A., Darling, J. A., Urquhart, E. A., Johnston, J. M., Ignatius, A. R., ... & Stumpf, R.
P. (2017). Satellite monitoring of cyanobacterial harmful algal bloom frequency in recreational waters and drinking water sources. Ecological indicators, 80, 84-95.
14http://www.water.nsw.gov.au/water-management/water-quality/algal-information/algal-early-warning-system

23
3.3 GEO-UN_GGIM examples Title of action GEOGLAM Crop Monitor for the AMIS
SDG Target: 2.c Adopt measures to ensure the proper functioning of food commodity markets and their derivatives and facilitate timely access to market information, including on food reserves, in order to help limit extreme food price volatility.
SDG Indicator: 2.c.1 Indicator of food price anomalies
Essential Variables Crop Area, Crop Type, Crop Management and agricultural practices, Soil moisture/temperature, Precipitation, Evaporation and evapotranspiration
Food price spikes can lead to significant increases in hunger and disruption, (Mitchell 2015). After the 2008 food price spike, the G20 established the Agricultural Market Information System (AMIS), in order to increase market information and transparency and to help prevent abnormal international market conditions. The Group on Earth Observations Global Agricultural Monitoring Initiative (GEOGLAM) Crop Monitor for the AMIS, is a monthly bulletin on current growing conditions for the four major crops (wheat, maize, soybean and rice) 15 in 51 countries, representing 80-90 percent of the global production of the four commodities16. It provides accurate consensus reporting on crop conditions based on reports by national, regional and international partners, with the aim to understand how food prices change. These actions seek to meet the SDG Target 2.c: Adopt measures to ensure the proper functioning of food commodity markets and their derivatives and facilitate timely access to market information, including on food reserves, in order to help limit extreme food price volatility. The data used within the framework are from a wide range of commercial and non-commercial satellites from which various EVs derive such as: Crop Management and agricultural practices, Soil moisture/temperature, Precipitation and Evaporation and evapotranspiration17.
References Mitchell, I. (2015). Grey Swans–Agricultural Price Spikes Are Not a Thing of the Past. EuroChoices, 14(3), 40-
46.
15 http://www.geoglam.org 16 https://www.earthobservations.org/documents/publications/201704_geo_unggim_4pager.pdf 17 https://cropmonitor.org/index.php/data-and-tools/data/

24
Title of action Air Polution Monitoring using Himawari-8
SDG Target: 11.6 By 2030, reduce the adverse per capita environmental impact of cities, including by paying special attention to air quality and municipal and other waste management
SDG Indicator: 11.6.2 Annual mean levels of fine particulate matter (eg. PM2.5 and PM10) in cities (population weighted)
Essential Variables Elevation/topography and geological stratification, Surface humidity, Aerosols properties
The world’s largest environmental health risk, according to the World Health Organization (WHO), is air pollution, responsible for 3.2 million deaths in 201218. As an effort to meet Target 11.6 of the SDGs: By 2030, reduce the adverse per capita environmental impact of cities, including by paying special attention to air quality and municipal and other waste management, Indicator 11.6.2 must be monitored. Himawari-8, a geostationary satellite by JAXA, delivers aerosol data every 10 minutes with 5km resolution. Hot spot detection and forest fire monitoring are conducted using other low Earth orbiting satellites, together contributing to estimates of particulate matter. For Indicator 11.6.2 estimation, some of the EVs required are: Elevation/topography and geological stratification, Surface humidity and Aerosols properties, (Wang et. al 2017) References Wang, W., Mao, F., Du, L., Pan, Z., Gong, W., & Fang, S. (2017). Deriving Hourly PM2. 5 Concentrations
from Himawari-8 AODs over Beijing–Tianjin–Hebei in China. Remote Sensing, 9(8), 858.
18 https://www.earthobservations.org/documents/publications/201704_geo_unggim_4pager.pdf

25
3.4 UNOOSA examples Title of action Mapping habitats for vectors of infectious disease: VECMAP
SDG Target: 3.3 By 2030, end the epidemics of AIDS, tuberculosis, malaria and neglected tropical diseases and combat hepatitis, water-borne diseases and other communicable diseases
SDG Indicator: 3.3.3 Malaria incidence per 1,000 population Essential Variables Soil Moisture, Land Surface temperature, Land Cover, Land Use
Vector-borne diseases such as Malaria, Chikungunya, Dengue and West Nile are a persistent public health concern, (Kruijff et. al 2011). Prediction of vector distributions and associated risks is a challenge, but is of significant importance in order to achieve end of tropical disease epidemics and meet the SDG Target 3.3: By 2030, end the epidemics of AIDS, tuberculosis, malaria and neglected tropical diseases and combat hepatitis, water-borne diseases and other communicable diseases. EO provides data on the environmental factors that influence the emergence or the spread of the vectors or diseases (e.g. soil moisture, surface temperature, vegetation, land use) to be used in distribution models.
A consortium led by Avia-GIS developed a software called “VECMAP”19, in the framework of the European Space Agency’s Integrated Application Promotion program (IAP), which uses satellite imagery and GNSS for mapping vector diseases. VECMAP is able to automate and optimize complex tasks related to the mapping of disease vector presences and the tracking of their progress, making it possible to design strategies to contain them and manage the risks they pose20. The EVs that are required to make predictions in VECMAP (such as Soil moisture, Land Surface temperature, Land Cover, Land Use) consist of data that derive from EO. References Kruijff, M., Hendrickx, G., Wint, W., & Ginati, A. (2011). Mapping habitats for vectors of infectious disease:
VECMAP. October, 16, 2014.
19 http://www.vecmap.com/ 20 http://www.unoosa.org/res/oosadoc/data/documents/2018/stspace/stspace71_0_html/st_space_71E.pdf

26
Title of action Soleka: Solar energy forecasting tool
SDG Target: 7.2 By 2030, increase substantially the share of renewable energy in the global energy mix
SDG Indicator: 7.2.1 Renewable energy share in the total final energy consumption Essential Variables Solar Surface Irradiance and its components (global, direct, diffuse), The Soleka Project21 was co-financed by the European Union and supported by the European Regional Development Fund (ERDF) and the Reunion Region. Soleka is an innovative decision-making tool developed by Reuniwatt, a French company that uses EO data to monitor the productivity of solar panels. Reuniwatt affirms that, thanks to Copernicus, it is possible to improve the quality of forecasts by 30 per cent while reducing costs by up to 50 per cent for one-day forecasts and up to 15 per cent for six-hour and 30-min forecasts, thanks to time saved in data processing22. The innovation that the Soleka project provides will help overcome one of the major drawbacks that grid-connected solar farms have: intermittency of the produced energy, thus improving their efficiency and use to meet Target 7.2: By 2030, increase substantially the share of renewable energy in the global energy mix. EVs that are needed for the forecasting of Soleka include: Solar Surface Irradiance and its components (global, direct, and diffuse), Aerosols properties, and Albedo, (Cros et. al).
References Cros, S., Turpin, M., Verspieren, Q., Lallemand, C., Schmutz, N., & Pignolet, G. Mapping surface solar
irradiance over Japan and Australia using MTSAT-2 and MODIS.
21 http://reuniwatt.com/en/soleka-solar-power-forecasting-tool/ 22 http://www.unoosa.org/res/oosadoc/data/documents/2018/stspace/stspace71_0_html/st_space_71E.pdf

27
3.5 CEOS/ESA examples Title of action eReefs Marine Water Quality Dashboard
SDG Target: 14.1 By 2025, prevent and significantly reduce marine pollution of all kinds, in particular from land-based activities, including marine debris and nutrient pollution
SDG Indicator: 14.1.1 Index of Coastal Eutrophication and Floating Plastic Debris Density Essential Variables Chlorophyll, Harmful Algal Blooms HABs The eReefs Marine Water Quality Dashboard23 is a tool to access and visualise a range of water quality Indicators for the Great Barrier Reef. It is a collaborative project between the Australian Institute of Marine Science, Bureau of Meteorology, CSIRO, Great Barrier Reef Foundation and the Queensland Government, (Marine Water Quality Dashboard). Apart from others, the information provided in the dashboard is chlorophyll-a levels24. Chlorophyll-a is the main indicator of algal blooms and its concentrations are used as indicators of the scale of excessive algal growth, known as eutrophication, (Bachir 2015). Chlorophyll, as an EV, contributes to the estimation of the SDG Indicator 14.1.1: Index of Coastal Eutrophication and Floating Plastic Debris Density, to meet Target 14.1: By 2025, prevent and significantly reduce marine pollution of all kinds, in particular from land-based activities, including marine debris and nutrient pollution. The dashboard provides access to over ten years of water quality information and is updated daily with data from NASA’s Aqua satellite. References Bachir, A. R. (2015). Modeling of Chlorophyll-a and Eutrophication Indicators in the Dubai Creek Area using
Remote Sensing (Doctoral dissertation).
23 http://www.bom.gov.au/marinewaterquality/ 24 http://eohandbook.com/sdg/files/CEOS_EOHB_2018_SDG.pdf

28
Title of action Global Forest Watch (GFW)
SDG Target: 15.2 By 2020, promote the implementation of sustainable management of all types of forests, halt deforestation, restore degraded forests and substantially increase afforestation and reforestation globally
SDG Indicator: 15.2.1 Progress towards sustainable forest management Essential Variables Net primary productivity, Above-ground biomass, Land Use, Land Cover The World Resources Institute’s Global Forest Watch (GFW)25 uses Landsat and MODIS data to provide spatially explicit information at a 30m resolution. Information is presented via a dynamic online forest monitoring and alert system empowering forest management stakeholders to create custom maps, analyze forest trends, subscribe to alerts or download data for their local area or the entire world26. The tropical zones of the platform’s map are refreshed every 16 days, frequently enough to track deforestation in places like Indonesia and Brazil, (Strickland 2014). Within the online platform, several EVs have been mapped globally such as Above-ground biomass, Land Use, Land Cover etc., contributing to the estimation of Indicator 15.2.1: Progress towards sustainable forest management and meeting Target 15.2: By 2020, promote the implementation of sustainable management of all types of forests, halt deforestation, restore degraded forests and substantially increase afforestation and reforestation globally.
References Strickland, E. (2014). Big data comes to the forest [News]. IEEE Spectrum, 51(6), 11-12.
25 https://www.globalforestwatch.org/ 26 http://eohandbook.com/sdg/files/CEOS_EOHB_2018_SDG.pdf

29
3.6 Global Partnership examples Title of action The Colombia Multi-Stakeholder Workshop on Data for the SDGs Roadmap
SDG Target: 11.3 By 2030, enhance inclusive and sustainable urbanization and capacity for participatory, integrated and sustainable human settlement planning and management in all countries
SDG Indicator: 11.3.1 Ratio of land consumption rate and population growth rate Essential Variables Spatial structure of urban areas, Land Use, Land Cover DANE (The Colombia National Statistics Office) conducted a pilot project in the Barranquilla metropolitan area, with contribution from the Global Partnership for Sustainable Development Data (GPSDD), to develop a method for calculating the SDG Indicator "Ratio of land consumption rate and population growth rate"27. The method uses Landsat data with a five-year time interval along with projected census population data, carrying out a Geographic Object-based Image Analysis (GEOBIA) and a semantic network classification scheme. The EVs which are mapped and are needed for the Indicator calculation are Spatial structure of urban areas, Land Use and Land Cover. GPSDD recommended the use of Google Earth Engine to scale the algorithms used in the pilot project to the whole country. The use of the Google Earth Engine platform automated the processing and classification resulting to the calculation of Indicator 11.3.1 for the six metropolitan areas of Colombia28.
27http://www.data4sdgs.org/sites/default/files/services_files/CS1_Applying%20Earth%20Observation%20Data%20to%20Monitor%20SDGs%20in%20Colombia_Final2.pdf 28 http://www.cepei.org/wp-content/uploads/2016/08/report-pilot-project-colombia-v3.pdf

30
3.7 ConnectinGEO examples Title of action The Global Human Settlement Layer (GHSL) framework
SDG Target: 11.3 By 2030, enhance inclusive and sustainable urbanization and capacity for participatory, integrated and sustainable human settlement planning and management in all countries
SDG Indicator: 11.3.1 Ratio of land consumption rate to population growth rate Essential Variables Spatial structure of urban areas, Area of natural habitats, Land Use, Land Cover
The Global Human Settlement Layer (GHSL)29 was developed and first released in 2014 in order to develop indicators and model (i) the access to services, market, industrial infrastructure, food, water, and land; (ii) the exposure to natural/human hazards, disasters, and pollution and (iii) the impact of the human footprint to land, water, and ecosystems, (Pesaresi et. al 2016). The GHSL framework provides valuable information to various international organizations to support global policy processes, among others, to the SDGs, with particular focus on Goal 11: make cities and human settlements inclusive, safe, resilient, and sustainable. More specifically, the GHSL contributes directly to the SDGs Targets: 11.1: By 2030, ensure access for all to adequate, safe and affordable housing and basic services and upgrade slums; 11.3: By 2030, enhance inclusive and sustainable urbanization and capacity for participatory, integrated and sustainable human settlement planning and management in all countries and Indicators: 11.1.1: Proportion of urban population living in slums, informal settlements or inadequate housing; 11.3.1 Ratio of land consumption rate to population growth rate. The GHSL is more than just build-up areas. It consists of built-up areas (EV: Spatial structure of urban areas), derived from the MODIS global urban extents (Schneider et. al 2010) and the Meris Globcover (Bontemps et. al 2011), along with the population density grid Landscan (Dobson et. al 2000). In
addition, within the GHSL framework, by inverting built-up areas, open urban spaces can be calculated as well (EV: Area of natural habitats)30. References Bontemps, S., Defourny, P., Bogaert, E. V., Arino, O., Kalogirou, V., & Perez, J. R. (2011). GLOBCOVER
2009-Products description and validation report. Dobson, J. E., Bright, E. A., Coleman, P. R., Durfee, R. C., & Worley, B. A. (2000). LandScan: a global
population database for estimating populations at risk. Photogrammetric engineering and remote sensing, 66(7), 849-857.
Pesaresi, M., Ehrlich, D., Ferri, S., Florczyk, A., Freire, S., Halkia, M., ... & Syrris, V. (2016). Operating procedure for the production of the Global Human Settlement Layer from Landsat data of the epochs 1975, 1990, 2000, and 2014. Luxembourg: Publications Office of the European Union.
29 http://ghsl.jrc.ec.europa.eu/ 30 http://www.gstss.org/2016_Laxenburg_Gaps/presentations/Ehrlich_Laxenburg_reduced_4.pptx

31
Schneider, A., Friedl, M. A., & Potere, D. (2010). Mapping global urban areas using MODIS 500-m data: New methods and datasets based on ‘urban ecoregions’. Remote Sensing of Environment, 114(8), 1733-1746.

32
3.8 Misc examples Title of action United Nations Convention to Combat Desertification (UNCCD)
SDG Target: 15.3 By 2030, combat desertification, restore degraded land and soil, including land affected by desertification, drought and floods, and strive to achieve a land degradation-neutral world
SDG Indicator: 15.3.1 Proportion of land that is degraded over total land area Essential Variables Crop Area, Crop Type, Land Use, Land Cover
Within Global Support Programme and Land Degradation Neutrality (LDN) Target Setting Programme of UNCCD (UNCCD 2015) several proxies of assessing state of land according to Sustainable Development Goals (SDG) of Sendai Framework for Disaster
Risk Reduction 2015–2030 are considered: (i) trends in land cover (vegetative land cover); (ii) trends in land productivity or functioning of the land (land productivity dynamics); (iii) carbon stock dynamics31. The LDN target setting processes are contributing to achieving the Sustainable Development Goal (SDG) 15, Life on Land, and in particular its target 15.3 and respectively Indicator 15.3.1. To address analysis of land use changes as well as cropland productivity assessment land cover (Kussul et. al 2015) maps are essential as a proxy for understanding the processes in ecosystems and solving many applied problems of satellite monitoring, in particular Land Degradation Problem. UNCCD secretariat provided to national authorities global datasets - in particular ESA CCI landcover for 2000-201532, land productivity map developed by JRC on 1999-2013 time series of NDVI (Ivits et. al 2016) for validation. Performed validation (Kussul et. al 2017) shows that global land cover maps overestimate cropland areas in Ukraine – thus use of national datasets is preferable. To address the problem at national level Ukraine proposed to use own developed datasets - in particular national land cover, 30 m for 1990, 2000 and 2010, 10 m for 2016 and 2017 (Lavreniuk et. al 2017; Waldner et. al 2016) could be used instead to global land cover. Total above-ground net primary production developed by JRC was used as inputs as well for preliminary results calculation. References Eva Ivits, Michael Cherlet (2016). Land-Productivity Dynamics Towards integrated assessment of land
degradation at global scales. European Union. Retrieved from: http://publications.jrc.ec.europa.eu/repository/bitstream/JRC80541/lb-na-26052-en-n%20.pdf
Kussul, N., Kolotii, A., Shelestov, A., Yailymov, B., & Lavreniuk, M. (2017, September). Land degradation estimation from global and national satellite based datasets within UN program. In Intelligent Data
31 https://www.unccd.int/actions/ldn-target-setting-programme/ldn-methodological-note 32 https://www.esa-landcover-cci.org/

33
Acquisition and Advanced Computing Systems: Technology and Applications (IDAACS), 2017 9th IEEE International Conference on (Vol. 1, pp. 383-386). IEEE.
Kussul, N., Skakun, S., Shelestov, A., Lavreniuk, M., Yailymov, B., & Kussul, O. (2015). Regional scale crop mapping using multi-temporal satellite imagery. The International Archives of Photogrammetry, Remote Sensing and Spatial Information Sciences, 40(7), 45. DOI:10.5194/isprsarchives-XL-7-W3-45-2015
Lavreniuk, M. S., Skakun, S. V., Shelestov, A. J., Yalimov, B. Y., Yanchevskii, S. L., Yaschuk, D. J., & Kosteckiy, A. I. (2016). Large-scale classification of land cover using retrospective satellite data. Cybernetics and Systems Analysis, 52(1), 127-138.
UNCCD. 2015. Report of the Conference of the Parties on its twelfth session, held in Ankara from 12 to 23 October 2015. Part two: Actions. ICCD/COP(12)/20/Add.1. United Nations Convention to Combat Desertification (UNCCD), Bonn. See Decision3/COP.12: http://www.unccd.int/Lists/OfficialDocuments/cop12/20add1eng.pdf
Waldner, F., De Abelleyra, D., Verón, S. R., Zhang, M., Wu, B., Plotnikov, D., ... & Le Maire, G. (2016). Towards a set of agrosystem-specific cropland mapping methods to address the global cropland diversity. International Journal of Remote Sensing, 37(14), 3196-3231.

34
4 Lessons learnt – On-going process In the previous pages, the current status of the EVs and their link to Indicators and Targets of the SDGs was presented, followed by examples of best practices of the use of EO data and EVs that derive from them, in support to the SDGs. Each example was linked to the SDG Indicator and Target it seeks to meet and a connection was also made to the EVs that are required and need to be calculated in each case. EVs are defined by the H2020 Project ConnectinGEO in different thematics like Climate, Biodiversity, Water, Ocean, Agriculture and Renewable Energy but herein, Urban EVs are also presented in connection to the ERA-PLANET SMURBS Project. Moreover, ConnectinGEO revealed that there are different levels of maturity and a considerable overlap between EVs identified by different communities. New dashboards that show the connection between EVs in these communities need to be created. In all actions, this deliverable highlights that most EVs derived from EO data. EO data is becoming easily and freely available to all, in a global coverage and needs to be fully exploited. Access and usability of these data and their derived products however is often a limiting factor to utilization, particularly in low-income and lower-middle-income countries. Through GeoEssential, the necessary workflows to overcome these issues need to be demonstrated in order to show the way for EO use in meeting the Targets of the SDGs. A careful examination of the presented actions reveals that a number of projects share the same need in EVs, though contributing to different indicators (i.e. “GEOGLAM Crop Monitor for the AMIS” and “United Nations Convention to Combat Desertification (UNCCD)”). In most actions though, EVs are estimated independently despite having the same scale and location, indicating that different areas of concerns of the environment are working in isolation. Therefore, there is a need for sharing large and complex data, standardizing them and improving the capacity to access them. Despite the large number of actions sharing the same EVs, it was noted that these EVs where in many cases the same ones (i.e. Land Cover, Chlorophyll), leaving a large number of EVs unlinked to SDGs. Hence, there is a need to demonstrate the use of these EVs’ use in support to other SDGs.