Embed Size (px)
Citation preview
Degradation and Restoration of
Land and Ecosystems
A Global Overview
By WRI commissioned by the SCBD
Lisa Janishevski, SCBD

Objectives
For ecosystems and landscapes …
Provide a clear conceptual framework
Review global and selected sub-global estimatesReview global and selected sub-global estimates
Assess global area of degradation and restoration
potential (“reasonable estimates”)
Identify and quantify expected benefits of
restoration
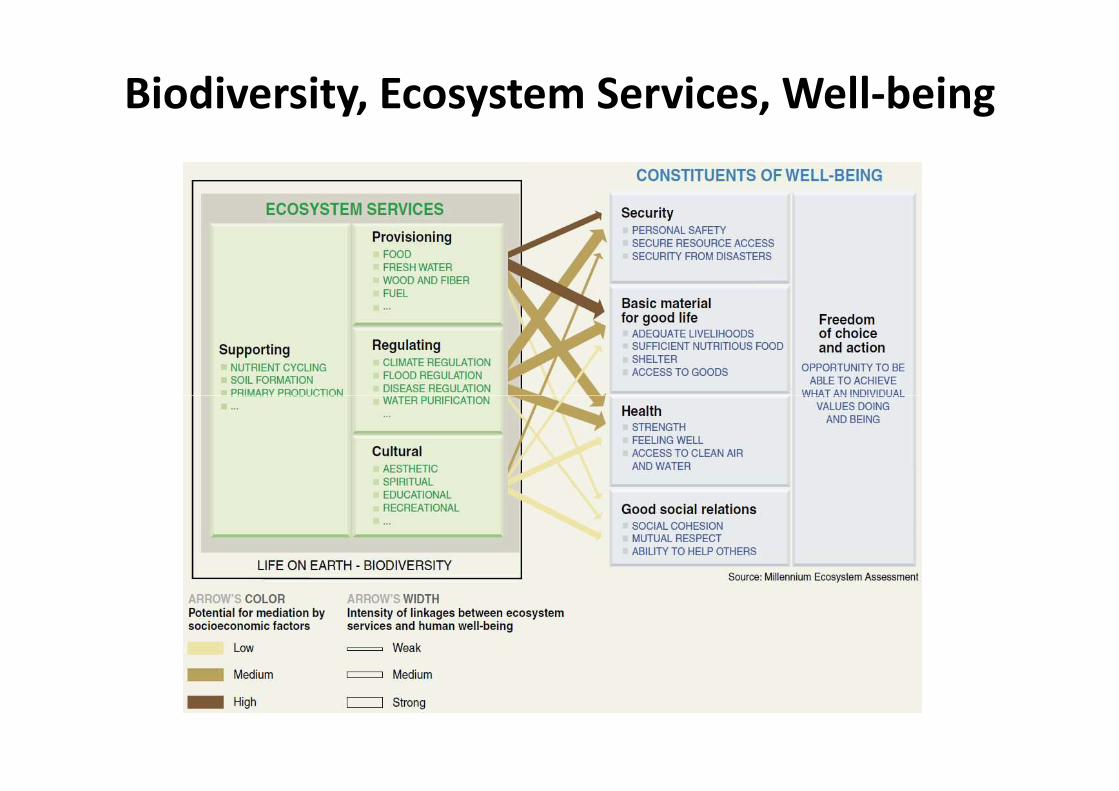
Biodiversity, Ecosystem Services, Well-being

The Potential ForestWhere forests and woodlands would be if only climate and soils decided

Today’s ForestWhere forests and woodlands are today

Degradation
• A loss or reduction in ecological or economic productivity
• Has several dimensions– a persistent reduction in the productive capacity of land (e.g.
loss of soil nutrients, vegetative cover, and productivity),
– a loss of biodiversity (e.g. species or ecosystem complexity), and
– decreased resilience (e.g. increased vulnerability of ecosystems – decreased resilience (e.g. increased vulnerability of ecosystems and communities).
• Can refer to– An on-going process of loss
– A state of accumulated loss
• Is value-laden. Degradation for one stakeholder may be a source of income or livelihood for another.
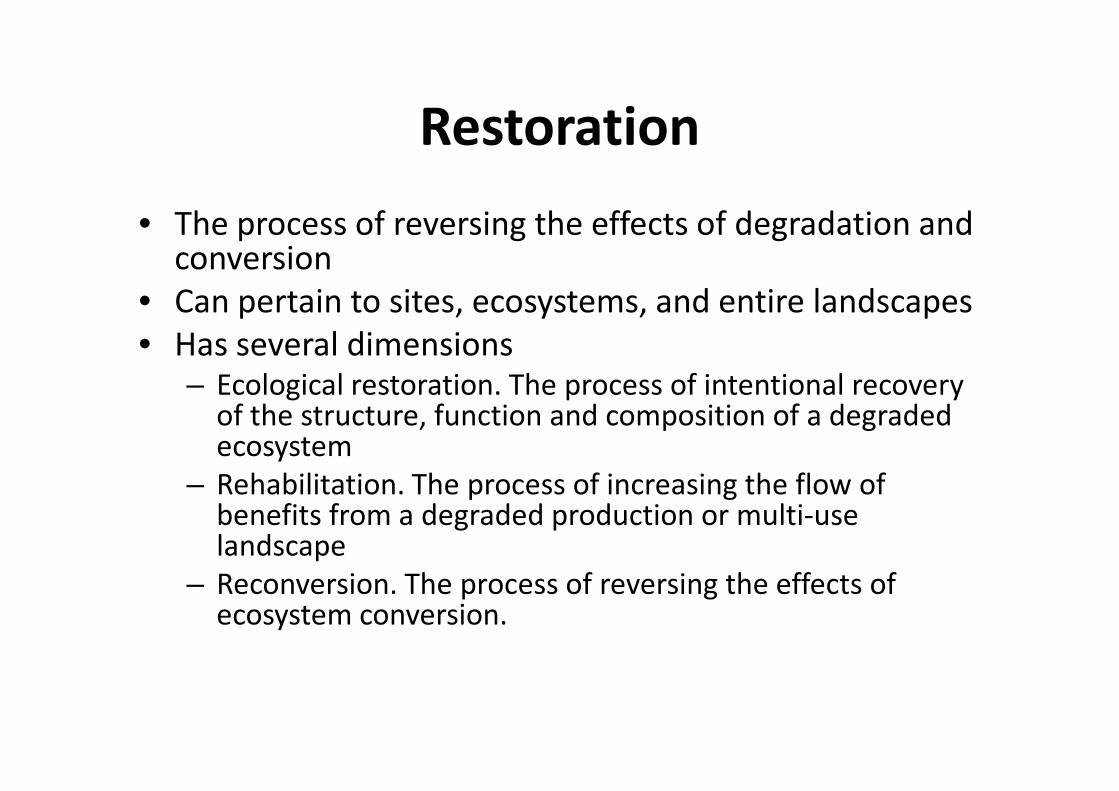
Restoration
• The process of reversing the effects of degradation and conversion
• Can pertain to sites, ecosystems, and entire landscapes
• Has several dimensions– Ecological restoration. The process of intentional recovery
of the structure, function and composition of a degraded – Ecological restoration. The process of intentional recovery
of the structure, function and composition of a degraded ecosystem
– Rehabilitation. The process of increasing the flow of benefits from a degraded production or multi-use landscape
– Reconversion. The process of reversing the effects of ecosystem conversion.

Production
Ecosystems
Primary
Ecosystems
Conceptual model
high
Benefits for
humans
TRADE
- OFFS
gone Biodiversity intactlow
Degraded
Ecosystems
- OFFS

Six global ecosystems were assessed
Agroecosystems: irrigated and rainfed cropland; pasture
Grasslands ecosystems: natural grasslands incl. savannah, shrubland, and tundra; pasture
Forest ecosystems: all ecosystems with a tree crown cover of >10%Forest ecosystems: all ecosystems with a tree crown cover of >10%
Dryland ecosystems: all areas under water stress, partly also deserts
Wetland ecosystems: inland freshwater habitats, including peatlands
Coastal ecosystems: terrestrial fraction only, mainly mangroves.
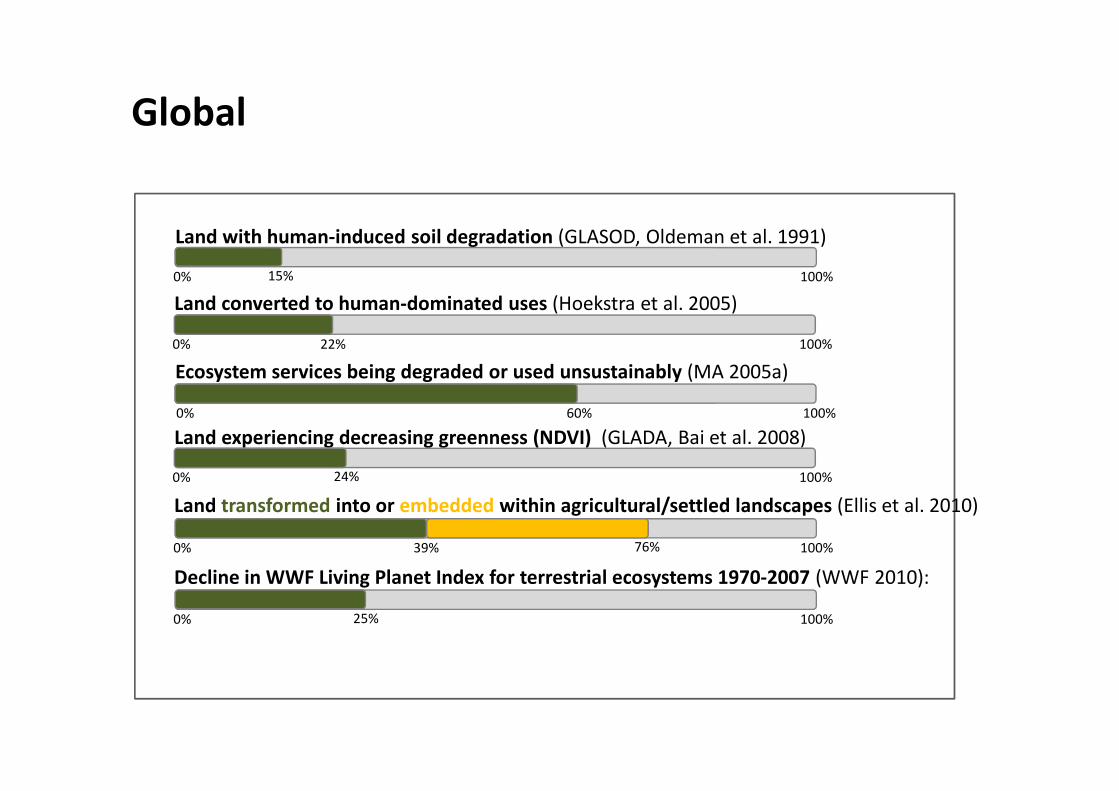
Land converted to human-dominated uses (Hoekstra et al. 2005)
0% 100%22%
Ecosystem services being degraded or used unsustainably (MA 2005a)
Land with human-induced soil degradation (GLASOD, Oldeman et al. 1991)
0% 100%15%
Global
0% 100%60%
Land transformed into or embedded within agricultural/settled landscapes (Ellis et al. 2010)
0% 100%39%
Land experiencing decreasing greenness (NDVI) (GLADA, Bai et al. 2008)
0% 100%24%
76%
Decline in WWF Living Planet Index for terrestrial ecosystems 1970-2007 (WWF 2010):
0% 100%25%

Ex
ten
t
13 September 2013
Land converted to or embedded within agricultural land/settlements (Ellis et al. 2010)
0% 100%39%
Agricultural land, cropland plus permanent pasture (FAOSTAT 2011)
0% 100%38%
Degraded agricultural soils (GLASOD, Oldeman et al. 1991)
76%
13%
AgroecosystemsD
eg
rad
ati
on
Agricultural land with decreasing greenness (NDVI) (GLADA, Bai et al. 2008)
0% 100%22%
Degraded agricultural soils (GLASOD, Oldeman et al. 1991)
0% 100%15%
0% 100%50%
Natural habitats remaining on agriculturally usable land (Balmford et al. 2005)
On-farm productivity loss since World War II (Crosson 1997)
0% 100%9%

Dryland rangelands affected by desertification: severely, to some degree (Mabbutt 1984)
Ex
ten
t
Grasslands of total land area: savannah, shrub, non-woody, tundra (White et al. 2000)
0% 100%40%
13 September 2013
Grasslands converted to cultivated crops (Lal et al. 2012)
0% 100%20%
Grasslands that are being grazed (Lal et al. 2012)
0% 100%67%
Grassland EcosystemsD
eg
rad
ati
on
0% 100%5%
Degraded drasslands: strongly-extremely, lightly-moderately (White et al. 2000)
49%
0% 100%35%
Herbaceous area losing greenness (NDVI) (GLADA, Bai et al. 2008)
0% 100%16%
Grassland soils affected by overgrazing (GLASOD, Oldeman et al. 1991)
0% 100%20%
0% 100%20%
Degraded pastures and rangelands (FAO 2009b)
80%

0% 100%20%
Forest area loss since pre-agricultural times (Matthews et al. 2000)
50%
Degraded tropical forest (FAO 1993)
Ex
ten
t
Current forest of ice-free land area (FAOSTAT (2011)
0% 100%31%
16 September 2013
Current forest of ice-free land area (Hansen et al. 2010)
0% 100%25%
Potential forest of ice-free terrestrial land area (PBL 2010)
0% 100%41%
Forest EcosystemsD
eg
rad
ati
on
0% 100%29%
Forest losing greenness (NDVI) (GLADA, Bai et al. 2008)
0% 100%29%
0% 100%15%
Status of potential forest land: intact, fragmented, degraded, deforested (Laestadius et al. 2012)
52%
Soils affected by deforestation, of 1997 FAOSTAT forest cover (GLASOD, Oldeman et al. 1991)
0% 100%14%
Degraded tropical forest: degraded primary/secondary, cleared (ITTO 2002)
0% 100%35% 60%
0% 100%41%
Mean species abundance (MSA) of potential: boreal, tropical, temperate forest (PBL 2010)
71% 82%
72%

Dryland EcosystemsD
eg
rad
ati
on
0% 100%75%
Threat of desertification: very severe, severe, moderate (UNCOD 1977)
Degraded drylands (Dregne & Chou 1992)
0% 100%70%
Ex
ten
t Drylands of total land base (Deichmann & Eklundh 1991)
0% 100%41%
9% 46%
Drylands with degraded soils (GLASOD, Oldeman et al. 1991)
0% 100%20%
Drylands with degraded soil and vegetation (UNEP 1991)
16 September 2013
0% 100%71%
De
gra
da
tio
n
Drylands losing greenness (NDVI) (GLADA, Bai et al. 2008)
0% 100%22%
Drylands with degraded soil and vegetation (UNEP 1991)
0% 100%20%
Degraded drylands, medium certainty (MA 2005c)
Degraded drylands (Lepers et al. 2005)
0% 100%10%
Drylands with at least light degradation (COMSDAD, Zika & Erb 2009)
0% 100%23%

Peatlands of total wetlands (Dugan 1993, Parish et al. 2008, UNEP 2012)
0% 100%31%
Ex
ten
t Wetlands of total land base (Finlayson et al. 1999)
0% 100%10%
RAMSAR wetlands with de facto or threat of ecological change (Finlayson & Davidson 1999)
Wetlands converted 1900-2000 (Dugan 1993, OECD 1996)
0% 100%50%
13 September 2013
Wetland Ecosystems
0% 100%84%
De
gra
da
tio
n
Decline in global freshwater index 1970-2008 (Revenga et al. 2000)
0% 100%37%
Peatland area still pristine, and actively accumulating peat (mires) (Parish et al. 2008)
0% 100%60%
Mires destroyed by agriculture, forestry, peat extraction, infrastructure (Parish et al. 2008)
0% 100%25%
80%
Wetlands losing greenness (NDVI) (GLADA, Bai et al. 2008)
0% 100%25%

Population living within 100 km of a coast (MA 2005a)
0% 100%31%
Ex
ten
t
Mangrove portion currently of world’s coastline (Spalding et al. 1997)
0% 100%8%
Lands within 100 km of a coast altered, semi-altered (Burke et al. 2000)
0% 100%19%
13 September 2013
29%
Mangroves , converted (FAO 2007, Butchart et al. 2010, Valiela et al. 2001)
Coastal EcosystemsD
eg
rad
ati
on
Seagrass habitats lost since 19th century (CBD Secretariat 2010)
0% 100%29%
Mangroves losing greenness (NDVI) (GLADA, Bai et al. 2008):
0% 100%21%
Mangroves , converted (FAO 2007, Butchart et al. 2010, Valiela et al. 2001)
0% 100%20% 35%
Salt marshes lost (CBD Secretariat 2010)
0% 100%25%
Issues
• Conceptual framework– Great complexity
– Many possible ways but no agreement
– Partly a political issue
• Data Sources• Data Sources– Satellites give different perspective than ground
observations
• Data quality– General lack of data. Many datasets do not exist.
– Many existing datasets are of poor quality
– Most assessments therefore focus on ecosystem extent rather than on ecosystem quaility

”Best guess” global estimates
For each ecosystem except agroecosystems1. Establish a reference area (”former” or ”original” extent)
2. Remove the converted portion (”loss”)2. Remove the converted portion (”loss”)
3. Remove the intact (”primary type”) portion
4. The balance is the degraded portion
For agroecosystems1. Establish a reference area
2. Determine the degraded portion

Ag
roe
cosy
ste
ms
6,200
5,5005,100
2,600
Converted
Degraded
Natural
Global ecosystem status (million ha)
Dry
lan
ds
We
tla
nd
s
Ma
ng
rov
es
Fore
sts
Gra
ssla
nd
s
Ag
roe
cosy
ste
ms
24
4,900

1,600
Degraded area
Modified Original
2,900 4,1001,2002500
Converted
to grassland
Converted to
cropland
1,300
Scenario A: Restoring 15% of degraded forests
5,500 Mha
Assumptions:
1. Current forest cover: 3,900 Mha
2. Fraction of historic forest cover converted: 30%
3. � Total historic forest cover: 5,500 Mha
4. Fraction of primary forest: one third of current forest cover
5. Forest conversion ratio into cropland/grassland: 3/1
6. Fraction of cropland degraded: 20%
7. Fraction of grasslands degraded: 25%
03 Oct 2013
Forest restoration potential (example)
Scenario A: Restoring 15% of degraded forests
Scenario B: Restoring 15% of degraded forests PLUS 15% of degraded converted forest land
Scenario C: Restoring 15% of converted former forest land (agriculture + pasture)
Scenario D: Restoring 15% of converted former forest land PLUS 15% of degraded forest
15% * 1,300 Mha ≈ 195 MhaArea to be restored
195 Mha + 15% * 240 Mha + 15% * 100 Mha ≈ 246 Mha
15% * 1,600 Mha ≈ 240 Mha
240 Mha + 195 Mha ≈ 435 Mha

Forest and Landscape Restoration Opportunity