Embed Size (px)
Citation preview

New York University Salomon Center
Stern School of Business
Report on
Defaults and Returns on High Yield Bonds: The Year 2002 in Review and the Market Outlook
By
Edward I. Altman with
Gaurav Bana
February 2003 Dr. Altman is the Max L. Heine Professor of Finance and Vice Director of the NYU Salomon Center, Leonard N. Stern School of Business. Mr. Bana is a Research Associate at the NYU Salomon Center. We wish to thank Chris McHugh and Christopher Stuttard of New Generation Research, Wilson Miranda, Sau Man Kam and Gabriella Petrucci of Salomon Smith Barney Inc., Brooks Brady from S&P, David Hamilton from Moody’s and Maria Rosa Verde from Fitch for their data assistance and also the many securities dealers for their price quotations. Finally, this report benefits from the assistance of Amit Arora, Shubin Jha, Deepak-Iyer Ramamurthy and Lourdes Tanglao of the NYU Salomon Center.

2
Defaults and Returns on High Yield Bonds: The Year 2002 in Review and the Market Outlook
Edward I. Altman
with Gaurav Bana
• In 2002, the high yield bond market experienced record corporate bond
defaults and corporate bankruptcies and the default rate in the high yield bond market easily topped the previously high record year of 1991.
• A record $96.9 billion of US straight corporate high yield bonds defaulted
resulting in a 12.8% dollar denominated default rate – considerably greater than 1991’s 10.3%. The fourth quarter’s default rate of 1.82% was, however, a noticeable reduction.
• Large corporate bankruptcies with liabilities greater than $100 million
dropped in number from 2001’s record year but the total liabilities of those 122 filings were $337 billion – more than $100 billion greater than last year; 38 filings topped $1 billion in 2002, bringing the last two years total to 77.
• Telecom and other communications companies led the way in both defaults
and bankruptcies with more than 52% of defaulted dollars and 36% of the bankruptcies emanating from this still troubled sector. Without WorldCom, telecom’s accounted for 31% of remaining defaulted dollar amounts.
• Fallen Angels defaults accounted for 44% of the total dollar defaults with 13
defaulting issuers having been accorded investment grade upon issuance. $158.5 billion investment grade bonds were downgraded to non-investment grade status in 2002.
• Default recoveries continued at persistently low average levels, weighed down
by the enormous supply of new defaults and communication firms’ 16.6% average recovery.
• The size of the Defaulted and Distressed Public and Private debt markets
zoomed to record levels of $942 billion (face value) and $512 billion (market value) as of year-end 2002.
• High Yield Bond returns also suffered in 2002, with absolute returns slightly
negative –1.43% and the return spread vs. 10-year Treasuries lower at –16.19%.
• The outlook for 2003 is considerably brighter with reduced default rates,
perhaps to about 7.5%, which should help to propel returns to above average annual levels. Indeed, the return spread for January 2003 was +4.61%.

3
Executive Summary
The year 2002 was remarkably difficult on many fronts for most financial markets. For the high yield bond market, it was again a year of record amounts of defaults which contributed to low recovery rates and slightly negative absolute returns. The default rate registered a massive 12.8%, based on $757 billion outstanding. Despite these record default totals and rates, the market’s decline was orderly with little panic and actually ended the year with reduced defaults and highly positive returns in the fourth quarter. Default amounts registered its fourth consecutive record year and almost topped $100 billion ($97.9 billion) for the first time. This total was more than 52% higher than last year’s record. Combined with a near record low recovery rate of 25 cents on the dollar, weighed down by Telecom’s average recovery rate of 16%, loss rates from defaults reached record levels of about 10% -- even adjusted for fallen angel default recoveries. The pervasive influence of WorldCom’s massive default had a profound effect on both the default and recovery rates. Without WorldCom, the year’s default rate would have been 9.27% -- a differential of about 3.5%. This report documents and comments upon the high yield bond market’s risk and return performance over the period 1971-2002. We will present traditional, dollar-denominated default rates as well as our own mortality rate statistics. Default rate analysis will be complemented by discussion on corporate bankruptcies and the immense impact of fallen angels on the high yield market. We conclude with our annual estimate of the size of the distressed debt market and our forecast for defaults in 2003. Our analysis will include an update on our default recovery forecasting model which was extremely accurate in estimating 2002’s recovery rate of about 25%. Based on the fourth quarter’s reduction in default rate to 1.82% and our aging-mortality conceptual framework, we are predicting a reduction in the dollar denominated default rate to 7.5-8.0%, as much as 5% less than 2002 (but still far above the average rate). This should help provide a more attractive environment for high yield debt new issues and returns in 2003. In 2002, there was $65.6 billion in new high yield bond issuance, down from 2001’s $88.2 billion. We expect new issuance in 2003 to escalate unless the economic/political scene motivates another flight to quality in our financial markets.

4
Default Levels and Rates
In 2002, a record $96.86 billion of U.S. and Canadian high yield bonds defaulted
or restructured under distressed conditions. This amount comprised a record 344 issues
from 112 defaulting companies and resulted in a record default rate of 12.80%. This
compares to $63.61 billion on 335 issues from 156 companies in 2001. A list of 2002
defaults appears in Appendix A.1 The 2002 default rate is considerably higher than last
year’s rate (9.80%), above the historic weighted average annual rate from 1971-2002 of
5.45% per year (3.2% arithmetic average rate), and is also far above the median annual
rate (1.80%) over the same 31-year period - (Figure 1). It should be noted that the
weighted average annual default rate jumped by 113 basis points in 2002 due to the
record high default rate and current size of the high yield market. The face value of
defaults reached record levels, more than 52% greater than the previous record of 2001.
In addition, the default rate was about 3% greater than last year’s rate and 2.5% greater
than the previous record set in 1991. Of course, the high yield market is now about four
times larger than it was in 1991. The default rate calculation is based on a mid-year
population of high yield bonds, estimated to be $757.0 billion. The default rate in 2002
provides a four-year string of record defaults each year, which followed a six-year period
of below average rates. We are fairly confident, however, that this consecutive default
rate trend will not continue in 2003.
1 We do not include emerging market defaults in these calculations. All defaults were U.S., Canada, Australia, or offshore U.S. dollar denominated issues from domestic companies. European company defaults totaling 17.7 billion euros (based on 43.7 billion euros outstanding at the start of the year, a 40.5% default rate) are not included. Telecom defaults accounted for well over 90% of these defaults. In addition, consistent with our past approach, we do not include those issues that missed interest payments in 2002 but cured their delinquencies within the typical 30-day grace period.

5
Quarterly Defaults
In Appendix B and Figure 2, we present default rates on a quarterly basis from
1990 to 2002. It can be observed that the quarterly default levels and rates in 2002 were
relatively high but with a noticeable decline in the fourth quarter to $13.77 billion and a
1.82% rate. As noted in our earlier reports, quarterly rates are usually not indicative of
trends except possibly back in the 1990-1991 period when default rates skyrocketed to
record levels over several consecutive quarters. Yet in 2001 and 2002, each quarter’s
default rate was at least 2.0% until the fourth quarter of 2002.
Comparing Default Rates
There has been some discussion in recent years about how the Altman-NYU
Salomon Center default rate calculations differ from Moody’s (New York) results.
Analysts point out that the Moody’s Speculative grade, issuer denominated rate has been
consistently higher. This comparison can be seen in the last two columns of Appendix B.
These results represent our 12-month moving average (or to be precise, last-four-quarter)
default rates compared with Moody’s 12-month moving average rate. One can observe
that Moody’s rate is, for the most part, higher since 1992, until the second quarter of
2002.2 Our calculation is essentially a domestic default rate calculation. This differential
changed directions in Q2-2002 with Moody’s 10.3% 12-month moving average rate
compared to our rate of 11.7%. The differential was even greater by the end of 2002. It
should be noted that Moody’s comparable dollar denominated 12-month rate ended the
year at a near record 16.0% as a result of the spate of large dollar amount defaults.
2 There are some differences in the two calculations, e.g., we do not include cured defaults, and Moody’s rated population is somewhat different, but these are minor compared to the issuer vs. dollar denominated methodology.

6
Moody’s is now (January 2003) predicting a 6.9% global speculative default rate by the
end of 2003.
In order to analyze the differences in these two calculations, we constructed a
moving four-quarter Altman/SC rate and compared it to Moody’s 12-month moving
averages, at the relevant quarterly dates. As noted above, Moody’s rates are, for the most
part higher. But, when we ran a correlation of these absolute quarterly rates over the
sample period (49 observations), we find that the correlation is extremely high (0.93). In
other words, both default rate measures are depicting very similar trends and directions of
default rates.
Default Rates and Macroeconomic Activity
Most high yield bond market observers expect that the nation’s economic
performance impacts defaults considerably, especially in recessions. Figure 3 shows the
relationship between default rates and the five economic recessions since 1972. Note
that, in all cases, the default rate peaked at or soon after the recession ended and, in most
instances, began to rise at the start of the recession. While we are not certain that the
current default rate has peaked, our fourth quarter results indicate that it has and, if so,
that peaking in 2002-Q3 is consistent with past experience. In the last two recessions,
however, the default rate actually started to increase prior to the onset of the recession,
especially in the most recent one when we observed that the default rate began its ascent
in 1999, about two years before the recession started.
As we have noted before, the increased default rate in 1999 followed the benign
credit cycle of 1993-1998, when default rates were extremely low and credit quality of

7
new issues was lax, especially in 1996-1998. This manifested in higher and earlier
defaults in 1999.
Can we conclude that the default rate in the high yield market is no longer a
coincident or lagging indicator, but a leading indicator of economic activity? Do higher
risk companies now experience pain more quickly than the overall economy? Perhaps so,
but in any event it is clear that we cannot expect too much of a decline in default rates as
long as the economy is mired in an economic recession or even a soft recovery. The year
2002 corroborated this relationship as we officially emerged from the short recession of
2001, but default rates continued to surge.
Bankruptcies
Consistent with record levels of defaults, 2002 also experienced an incredible
level of Chapter 11 bankruptcy filings. Figure 4 shows that the number of filings with
liabilities greater than $100 million was 122 in 2002, with total liabilities reaching an
incredible $337.5 billion. And, the number of filings in excess of $1 billion in liabilities
was 38 -- about the same as in 2001, which was a record year. Indeed, since January
2001 there have been 77 bankruptcies with liabilities greater than $1 billion! (see
Appendix C for a complete list). The “class of 2002” was topped by two companies
whose enormous liability size swelled the total by $123 billion (Conseco and
WorldCom). In 2002, 36% of bankrupt liabilities were Telecom related and at least 24%
from alleged fraud related debacles (WorldCom, Adelphia and Global Crossing).
One interesting question that we are often asked about is the relationship between
the timing of a default on a bond issue and the actual bankruptcy filing date (if any).
Figure 5 shows this timing based on 339 bankruptcies over the period 1987-2002. Note

8
that the majority of companies (62%) defaulted at the same time as their Chapter 11
filing. Still, the average lag between default and bankruptcy was about 2.7 months with
75% of the firms defaulting/filing within 2.5 months and a few others defaulting in over
one year. Of course, there are many companies that default on their obligations and
subsequently restructure outside of the bankruptcy courts. This seems to be less frequent
of late with the advent of “prepackaged” Chapter 11’s in recent years.
Industry Defaults
We continue to observe pockets of defaults in either chronically or newly ailing
industrial sectors. Figure 6 list defaults by major industrial sector since 1970 and
Appendix D lists the 2002 defaults by primary business activity. In 2002, in addition to
general manufacturing and miscellaneous industries (22 and 25 defaulting issuers),
defaulting companies were dominated by telecom/communication firms (26); as noted
earlier, telecoms alone accounted for 52% of all defaulting dollars in 2002, about the
same as in 2001. Other hard-hit major sectors were energy (8); transportation (7); and
leisure/entertainment, financial services and retailing (all 5). Some particularly hard hit
categories within the major sectors were textiles (5), cable TV and services (4), glass,
steel and airlines (3 each).
Timing of Defaults
We have always emphasized the importance of defaults on the high yield debt
markets and added the associative variable of the timing of default. This has been
particularly useful in our mortality rate statistics report (see our discussion at a latter
point) and in our analysis of the impact of the benign credit cycle, particularly new
issuance in 1995-1998. Since 1999, we noted an explosion of defaults particularly in the

9
earlier years after issuance, i.e., years 1-3. In 2001, we noticed a slight diminution in the
1-3 year from issuance cumulative rate (59% compared to 1999 (68%) and 2000 (69%) --
see Figure 7.
In 2002, we observe an even more dramatic drop in this cumulative, first three-
year proportion to 41%. Indeed, this proportion is about equal to the average over the
historical period 1989-2002, so we conclude that the timing of defaults has returned to a
more normal chronology and the bad cohort from the benign credit cycle has probably
run its course.
Some of the main companies contributing to defaults in 2002 in years one and two
after issuance are Adelphia, Conseco, Global Crossing, Kmart, NTL, United
International, US Airlines, Williams Communications and WorldCom -- many of which
were fallen angel defaults.
Fallen Angels and Defaults
The most recent surge in defaults has been punctuated by a resurgence in interest
and concern about the fallen angel phenomena -- downgrades from investment grade to
speculative grade and the attendant drop in bond prices – many times preceding the actual
downgrade. What is even more disturbing is the amount and perhaps the proportion of
these fallen angels that then go on to default – some of them very quickly. The dollar
amounts of these recent downgrades and defaults have been staggering, causing an
unprecedented interest in default and credit analysis among investment grade investors
and analysts.
Over the past two years, a massive amount of $61 billion in 2001 and $158.5
billion in 2002 of investment grade bonds have lost their prized rating and have plunged
10
to “junk” status and, in some cases, continued rapidly to default. Indeed, the prominent
WorldCom debacle saw its bonds go from A- to BBB (Baa) and then to Ba in May 2002.
Within just two months of the decline to junk status, this huge bond issuing company
defaulted on about $30 billion of bonds, catching investors in investment grade, high
yield and distressed debt wondering how so many seemingly sophisticated investors
could have been mistaken.
As we have tried to demonstrate in a recent paper (Corporate Distress Prediction
Models in a Basel II Environment,” Salomon Smith Barney High Yield Report
(September 24, 2002), even with the fraudulent earnings (but not free cash flow)
revelations, WorldCom did not “look like” a failing company, although it looked
distinctly non-investment grade long before its downgrades. We believe it went bankrupt
despite its huge size because it lost its credibility and ability to refinance its enormous
debt load. This is little solace to those investors who experienced a recovery amount of
$12-14 per bond, even if they purchased these bonds at $40 just a few months earlier.
Figure 8 shows that 39% of defaulting issues in 2002 were investment grade when
they were originally issued, comprising 43% of defaulted dollars over this part year.
Figure 9 lists the 13 fallen angel defaulting companies (we have combined the two
Conseco issuers) and their associated bond amounts at face value. The dollar value
default rate in 2002 on fallen angel bonds was a huge 20.3% (see Figure 13), with
WorldCom leading the way. The base for this calculation is the total amount of fallen
angel bonds outstanding as of the beginning of the year, corrected for WorldCom’s debt
which “arrived” in May. Without WorldCom, the fallen angel default rate in 2002 would
have been about 8.5%.

11
These aggregate fallen angel default statistics are indeed impressive but do they
address an even more important question for high yield investors? Are fallen angels less
than, equal to or more risky as to possible default than are high yield bonds in general and
original issue non-investment grade issuers in particular? To be sure, fallen angel
companies are typically larger and more prominent corporations. But, are they more or
less at risk of default? And, since fallen angels enter the high yield market at a discount
from par price levels, what is the expected net recovery rate for high yield investors?
These and related questions will now be addressed.
Figure 10 shows the annual default rate calculations for fallen angel issuers from
1985-2002. Note that we concentrate here on issuers, rather than our usual dollar
denominated default calculations, since our data source is Standard & Poor’s CreditPro
database which only analyzes the rating history of bond issuers. The aggregate amounts
of bonds outstanding, stratified by ratings at various points in time, were not available
(except in our 2002 calculation, as discussed). We will therefore compare the fallen
angel statistics with default rates on original issue high yield bond issuers as well as on
the entire high yield population. The issuer vs. dollar denominated rate for the entire
market is also shown.
We observe in Figure 10 that the weighted (by number of issuers outstanding)
average annual fallen angel default rate over the period 1985-2002 is 4.19% per year,
somewhat lower than the rate on original issue speculative grade bonds (5.15%) and all
speculative grade bonds (4.90%). The dollar denominated average annual default rate,
heavily weighted by 2002’s record rate, is the highest at 5.60% (from Figure 1). We
should note that the calculation of the fallen angel default rate for each year was
12
complicated by the fact that it is possible for a bond issuer to be investment grade at the
start of the year, fall to non-investment grade sometime during the year and then tumble
to default less than 12 months after becoming a fallen angel. To adjust for this
possibility, our calculation for each year is the average of the next 12 months default rates
calculated from the beginning of each month. Hence, an issuer like WorldCom, which
went from investment grade to default within one year, will be counted. This technique
is slightly different from S&P’s technique which observes the one-year rate based on the
base of bond issuers outstanding at the start of each year (see S&P’s new study on fallen
angels, by B. Brady, “Fallen Angels: To Rise No More?” January 24, 2003 and Moody’s
annual default report (February 2003).
From Figures 10 and 11, we can observe that fallen angel (FA) annual default
rates tend to mirror the default rate on original issue high yield bonds quite closely with a
correlation coefficient of 0.79. In some years, e.g., 1992, 1993, 1997, and 2000, the
comparative rates are extremely close. Note also, that the original issue speculative grade
rate is, in most years, extremely close to that of the “all” speculative grade rate. And,
when the all speculative grade rate (both issuer and dollar denominated) is relatively high
in some years (e.g., 1990, 1991, 2001), the fallen angel issuer rate is comparatively
lower. For 2002, however, we were able to calculate a dollar denominated fallen angel
(FA) default rate based on the amount of FA debt outstanding as of 12/31/01 and the
subsequent dollar FA defaults (including WorldCom). This rate was indeed quite a bit
higher than the issuer rate (20.2% vs. 6.59%) and greater than the original issuer high
yield bond rate (8.55%). So, it is apparent that the fallen angel risk escalated
dramatically in 2002.

13
Since all fallen angels do not have the same rating and the rating composition of
fallen angel issuers may be different from that of original issue high yield issuers in any
given period, we compared the 12-month default rates of double-B, single B and triple C
FAs vs. their original issuer counterparts. Figure 12 breaks down the fallen angel default
rate each year and for the entire sample period, by the major rating categories. Not
surprisingly, we find that the expected hierarchical default rate increases as the rating
class lowers from BB (1.23% per year) to B (7.01% per year) to CCC (10.22% per year).
These fallen angel average annual rates are actually slightly larger (although not
statistically significantly larger) than their original issuer speculative grade counterparts
(comparison in last two rows), except for the CCC rating. So, we can conclude with even
more certainty, that the expected fallen angel default rate is quite similar to that of
original issuer speculative grade bond issuers.
Default Losses and Recoveries at Default
Default losses (Figure 13) also rose dramatically in 2002 to 10.16% (unadjusted
for fallen angels) and were substantially greater than the arithmetic annual average
(2.51%) and the weighted average (4.10%) over the period 1978-2002 (Figure 14). The
2002 loss rate is more than double the historic weighted average annual loss rate. The
large difference in arithmetic vs. weighted average rates is primarily a result of the last
two years’ much above average default rates and much below average recovery rates.
The 2002 compilation of the weighted average rate is now almost one percent (94 bp)
greater than it was just one year ago. We will return to this benchmark loss rate when we
discuss returns on high yield bonds, net of defaults, later in this report.

14
Figure 13 shows the 2002 loss rate, which includes the loss of one-half of the
annual coupon, as well as the weighted average (by amount of the defaulted bond)
recovery rate. The latter is based on the average prices just after default from a number
of dealer quotes. In 2002, the average recovery rate (25.3%) was again below the historic
averages or median (39.40%). The enormous new supply of defaulting securities and the
continued influence of below average recoveries from Telecom defaults (see Figures 18
and 19 below) were the primary factors causing below average recoveries. More on the
supply/demand equation for defaulted debt at a later point.
Before leaving our default loss calculations, we again must comment upon and
analyze the importance of fallen angel defaults. While the recovery rate indicated in the
“unadjusted” column is the actual recovery for those investors who purchased at par
value, it is certain that high yield investors purchased fallen angel bonds at a significant
discount from par and the effective recovery is probably much greater than on original
issue high yield bonds. Indeed, as indicated in the “only fallen angel” column of Figure
13, we see that the fallen angel average price at default in 2002 was $20.17 and the
weighted average price at downgrade was just $59.29. This results in an average
effective recovery for high yield investors in 2002 on fallen angel defaults of 37.91%.
Including a FA default rate of 20.2%, we conclude that the loss rate for fallen angels was
13.4% in 2002.
Figure 15 shows that the historic fallen angel weighted average price at
downgrade ($75.67) was much higher than the 2002 figure and the average effective
recovery was also much greater at 72%. Hence, the fallen angel loss rate in 2002 was
much greater than fallen angel defaults in the past. This reflects the enormous price

15
declines of original issue investment grade defaults in the last year and also the influence
of one large defaulting fallen angel issuer, i.e., WorldCom. Most fallen angel defaults
sold at prices after default above the weighted average ($20.19) price in 2002, but
WorldCom’s lower recovery reduced the overall average.
When we adjust for the influence of fallen angel defaults and their higher net
recovery for high yield investors, the adjusted loss rate in 2002 was 9.26% - about 90 bp
below the unadjusted rate.
Figure 16 shows our usual table of recovery rates by seniority. We observe that
the senior secured median recovery ($52.81), based on 37 issues in 2002, has returned to
close to the historic average. The senior unsecured 2002 average ($21.82) however, was
again well below average ($41.99 median). No doubt, WorldCom’s influence was
present in this category. We again observed the total disappearance of what used to be
known as “subordinated” bonds.
Recovery Rate Model
We now return to the supply/demand equation on defaulted public bonds. As we
discussed in last year’s annual report, we postulate that the relatively low recovery rate in
2002 is primarily a function of the huge supply of new defaults relative to the much
smaller (but growing) amount of dedicated funds under management by distressed debt
investors. Another clear factor is the enormous amount (more than $50 billion) of
Telecom defaulted bonds in 2002.
We can now update our database on default rates and recovery rates in order to
observe their correlation and to enhance our econometric model to explain recovery

16
rates.3 Figure 17 shows the bivariate relationship between the supply of defaults and the
recovery based on prices just after default. We specify four functional relationships
(linear, log-linear, quadratic, and power function) between the two variables. With the
addition of 2001-2002 data, the linear model’s R2 increases materially to 0.55 (from 0.45)
and the log-linear (our favorite) increases from 0.58 to 0.67. The latter is an impressive
explanatory power result.
If we plug-in the actual 12.8% 2002 default rate, the estimated recovery varies
from 20.0% (linear) to 29.5% (quadratic), with the log-linear and power functions’
estimates extremely close to the actual recovery rate. We would expect average recovery
rates to climb to about 30% in 2003 if default rates drop to the 7-8% level range.
Telecom Defaults and Recoveries
Just as in 2001, telecommunication and other communication firms (e.g., cable
TV) were very large contributors to our default statistics in 2002. In 2001, telecom
defaults contributed 55% of the defaults and in 2002 the proportion was also above half
at 52%. Figure 18 lists the communication industry defaults from 1996-2002 with
recovery rates on each issue in the last column. Figure 19 summarizes the average
recovery rates on these defaults from 1998-2002. Note that the weighted average
recovery rate in both 2001 and 2002 were 16-16.5% and the weighted average for the
entire five-year sample period is 17.6%.
Other Default Statistics
In Figure 20, we list the average price just after default stratified by original
rating. Earlier we observed that fallen angel defaults tend to sell at significantly higher
3 E. Altman, B. Brady, A. Resti and A. Sironi, “The Link Between Default and Recovery Rates: Implications for Credit Risk Models and Procyclicality,” NYU Salomon Center Working Paper, S-02-9 and the International Swaps & Derivatives Association, January 2002

17
recovery rates than do their original issue high yield counterparts. This is substantiated in
Figure 20 where we observe that for the three A-rated categories, the arithmetic and
weighted average prices at default are all significantly higher than the various B-rated
categories. We do observe, however, a noticeable drop in the average prices of the A
category from $66.70/$71.46 in last year’s 2001 compilation to $55.37/$48.93 in 2002.
In addition, there was an enormous decline in the average recovery for original issue
triple B bonds from $47.36/$48.92 in 2001 to $41.39/$27.38 in 2002. The pervasive
impact of WorldCom again is clear, although the declines in general reflect lower recent
recoveries across the entire rating spectrum. It is interesting to note that our latest
statistics show very little difference between average recoveries for ratings from triple B
to triple C.
Figure 21 depicts the average price at default stratified by the number of years
after issuance that the default takes place. Once again, we notice there is absolutely no
significant difference in recoveries based on how quickly or delayed the default takes
place after the year of issuance. This is perhaps surprising since the intuition might be
that if a default occurs quickly, there would be only a short time for the firm’s asset
values to decline in value.
Figure 22 shows the rating distribution of defaults in our database from 1978-
2002 at various points in time prior to default. In particular we observe the rating
distributions at original issuance, one year prior and six months prior to default. The
metric we use is number of issues.
We observe that 22.9% of the defaulting issues were investment grade at birth, a
fairly large increase over the 19.3% in our compilation last year. This reflects that 125 of

18
the 321 issues (39%) defaulting in 2002, for which we were able to ascertain original
ratings), were originally rated investment grade. The proportion of bond issues rated
investment grade at one year and six months prior also rose to 11 percent and 10.5% at
these junctures. We are sure that the proportion of issuers that were investment grade at
these relatively near points to default were smaller since fallen angel defaults tend to be
larger companies with numerous issues outstanding (e.g., Kmart, WorldCom). Still,
these are the largest proportions within one year of default that we have ever observed.
Mortality Rates and Losses
Updated mortality rates and losses for 1971-2002 are reported in Figures 23 and
24. This default analytical methodology was first developed in 19894 and has been
widely used by academics as well as practitioners, because it includes the impact of bond
aging and is based on original issue cohorts stratified by bond rating at birth. In addition
to defaults, our mortality data is adjusted for other “disappearances,” like calls, merger
redemptions, etc. In addition to the cumulative mortality rate over the first ten years after
issuance, our data provides the marginal default experience in each of the ten years. It
should be clearly noted that our perspective is based on the original issuance date and, as
such, the marginal rates should not be interpreted as a contingent probability of default
from a specific year after issuance to the next year. Still, the aging effect is clearly
apparent as to the probability of default for each year as estimated from the original
issuance date. Since our data is based on defaulting dollars, we can expect profound
effects from 2002’s extraordinary year.
4 E. Altman, “Measuring Corporate Bond Mortality and Performance,” The Journal of Finance, September 1989, pp. 909-922.
19
The most important result of this year’s compilation is the significant increases in
mortality rates for almost all rating categories, with particular relevance for the triple-B
rating class. Note that the five-year cumulative mortality rate for BBBs surged from
2.50% from 1971-2001 to 7.35% when we include 2002. For the same five-year horizon,
A-rated bonds increased from 0.20% to 0.26%, BB rated bonds from 9.27% to 12.39%
and B-rated bonds from 24.04% to 29.10%.
We still observe a profound aging effect, especially in the first three to four years
for original issue high yield bonds. For example, BB bonds’ marginal mortality rates are
1.23%, 2.62% and 4.53% in the first three years while B-rated bonds advance from
3.19% to 7.14%, 7.85%, and 8.74% in years 1-4, before leveling off and then declining.
Although the mortality percentages are clearly higher this year than ever before, the
marginal rates continue to be lower in the first and second years after issuance than in
years three and four, in some cases, especially for non-investment grade bonds.
Finally, we note a type of aging anomaly for our BBB cohort, with the second
year’s marginal rate (3.42%) higher than years three and four and even higher than BBs
second year marginal rate (2.62%). This is, once again, primarily the impact of the
enormous WorldCom defaults emanating from its BBB original rating.
Mortality losses, presented in Figure 24, portray a similar story to that of the
mortality rate update. In addition to the impact of record defaults in 2002, continued
relatively low recoveries resulted in even higher mortality loss differences from prior
year compilations.

20
Returns and Spreads
The other main measures for analyzing high yield bond performance are returns
(and spreads) as well as the promised yields to maturity. We have observed an extremely
volatile return and yield picture throughout 2002 in this very challenging period. Total
returns ended the year at a modest negative level (at –1.53%) after being as low as
–9.30% as of September 30. At that time, the return spread was an all time low at
–24.70% and the promised yield was almost an all time high at 1,010 bp above ten-year
U.S. Treasuries. As of year-end, the return spread “dropped” to a negative –16.19% and
the yield spread to 856 bp (Figure 25). Clearly, in the face of record defaults, a flight to
quality and continued corporate credibility lapses, high yield investors suffered along
with investors in equities and other risky asset classes. Still, a slight negative absolute
annual return and a fourth quarter comeback, along with a noticeable drop in the default
rate, are promising signs going into 2003. Indeed, the absolute return for January 2003
was +3.72% resulting in a 4.61% spread over ten-year Treasuries. The yield spread
dropped to 7.84%.
The large negative return spread in 2002 resulted in the historical arithmetic and
compound annual averages both falling to a 114 b.p. spread over 10-year Treasuries.
This is consistent with an average yield spread of 501 bp and an average loss from
defaults of –4.10% (Figure 14) over the period 1978-2002. We are impressed with this
logical, but still remarkable, relationship between promised yield spreads minus observed
losses from defaults coming very close to observed return spreads.
A relevant question from these important statistics, listed in Figure 25, is whether
a 114 bp spread is an appropriate equilibrium level or is it too low for our high yield bond

21
market. We believe that the equilibrium level return spread should be closer to 2% than
1% considering the fact that high yield bond investors must be compensated for the
unexpected losses from defaults and downgrades, as well as the expected default levels.
The year 2002 is an excellent example of when actual defaults are much greater than
expected (since all analysts that we are familiar with, including our own estimates,
forecasted default rates for 2002 of less than 10%).
Finally, high yield bonds are certainly less liquid than US Treasuries, especially
as they migrate toward default. This is clearly the case for investment grade bonds as
well. Perhaps this is the reason that bonds rated AA, A, and BBB as of year-end 2002
were yielding the highest spread vs. Treasuries that we have ever observed at 1.20%,
1.66% and 3.05%, respectively (from the S&P Bond Guide, January 2003).
If we are correct that a 114 bp return spread is unusually low, then we can expect
a correction in the coming year or so to a more rational level. This bodes well for
expected returns for high yield investors.
Figure 26 shows that an investment of $1,000 in 1977 in high yield bonds would
be worth $10,824 as of the end of 2002, compared to $8,349 for a $1,000 investment in
10-year Treasuries.
Size of the Distressed and Defaulted Public and Private Debt Markets
The distressed and defaulted public debt proportion of the straight (non-
convertible) high yield and defaulted corporate debt markets in the United States
comprised about 40% of the total market (Figure 27). To repeat, the total market for this
computation includes all bonds outstanding, that is, performing bonds as well as the
cumulative par value of defaults. We estimate this total market size to be $975 billion as

22
of December 31, 2002. Distressed debt is again defined as those issues selling at 1,000
bp or more over ten-year US Treasuries – greater than 13.82% yield-to-maturity as of
December 31, 2002. The proportion of distressed debt was 21% of the total market and
about 25% of the performing (non-defaulted high yield market). This proportion is
slightly below last year’s percentage and considerably lower than year-end 2000. Still, a
distressed ratio of above 20% is indicative of a relatively high subsequent default rate.
Although with risk-free interest rates at the lowest level (3.82%) for the entire history
(1977-present) of our time series (Figure 25), a distressed ratio based on a 13.8%
criterion is perhaps less reason for concern than is typically the case.
From Figure 28, we estimate the size of the defaulted and distressed public and
private debt markets as of year-end 2002 as well as year-end 2001 and over the entire
period 1990-2002, as shown in Figure 29. The enormous new supply of public bond
defaults in 2002, less emergences from Chapter 11 of $26 billion, results in the highest on
record dollar amount of defaulted debt still outstanding at $187.7 billion as of year-end
2002. Combined with over $200 billion of distressed debt, the face value of public
distressed and defaulted debt swelled to a record $392.5 billion (and $140 billion
estimated market value).
We utilized a private/public debt ratio of 1.40 to estimate the size of the private
defaulted and distressed population as of year-end 2002. This is down from a 1.65 ratio
as of year-end 2001. We have made this adjustment to reflect the results of an updated
sample of balance sheet analysis, which indicates that U.S. firms tapped the public bond
markets relatively more than loans and other private placements in the late 1990’s and in
2000. This was especially true of investment grade issuers. The resulting size of the

23
private debt markets shown in Figure 28 was also at a record level despite the drop in the
public/private debt ratio ($550 billion face value).
In total, the public and private, defaulted and distressed debt markets reached an
enormous estimated level of $942 billion (face value) and $513 billion market value.
One can quibble about our precise estimating procedure, but it is undeniable that the
distressed debt “vulture investing” market, broadly defined, is at an all time high level.
Indeed, the face value of this market in the United States is larger than all but seven
countries’ annual GDP!
Default Forecast for 2003
We believe the dollar denominated default rate peaked in the third quarter of 2002
and we have already commented upon the drop in the fourth quarter’s rate to 1.82% (see
Appendix B). Combining our mortality rate expectations with the size of the distressed
debt market as of year-end, results in an estimated 7.50%-8.00% default rate in 2003.
This is considerably below last year’s record rate but still quite a bit above the historic
average for high yield bonds. Our forecast is certainly subject to error, especially with an
uncertain, vulnerable economy in an environment as well as with several potentially
destabilizing political and other non-economic factors.

FIGURE 1
HISTORICAL DEFAULT RATES - STRAIGHT BONDS ONLY EXCLUDING DEFAULTED ISSUES FROM PAR VALUE OUTSTANDING
1971 - 2002 ($ MILLIONS)
PAR VALUE PAR VALUE DEFAULTYEAR OUTSTANDING (a) DEFAULTS RATES2002 $757,000 $96,858 12.795%2001 $649,000 $63,609 9.801%2000 $597,200 $30,295 5.073%1999 $567,400 $23,532 4.147%1998 $465,500 $7,464 1.603%1997 $335,400 $4,200 1.252%1996 $271,000 $3,336 1.231%1995 $240,000 $4,551 1.896%1994 $235,000 $3,418 1.454%1993 $206,907 $2,287 1.105%1992 $163,000 $5,545 3.402%1991 $183,600 $18,862 10.273%1990 $181,000 $18,354 10.140%1989 $189,258 $8,110 4.285%1988 $148,187 $3,944 2.662%1987 $129,557 $7,486 5.778%1986 $90,243 $3,156 3.497%1985 $58,088 $992 1.708%1984 $40,939 $344 0.840%1983 $27,492 $301 1.095%1982 $18,109 $577 3.186%1981 $17,115 $27 0.158%1980 $14,935 $224 1.500%1979 $10,356 $20 0.193%1978 $8,946 $119 1.330%1977 $8,157 $381 4.671%1976 $7,735 $30 0.388%1975 $7,471 $204 2.731%1974 $10,894 $123 1.129%1973 $7,824 $49 0.626%1972 $6,928 $193 2.786%1971 $6,602 $82 1.242% Standard
DeviationARITHMETIC AVERAGE DEFAULT RATE 1971 TO 2002 3.249% 3.201%
1978 TO 2002 3.616% 3.455%1985 TO 2002 4.561% 3.611%
WEIGHTED AVERAGE DEFAULT RATE (b) 1971 TO 2002 5.453%1978 TO 2002 5.488%
1985 TO 2002 5.597%
MEDIAN ANNUAL DEFAULT RATE 1971 TO 2002 1.802%
Notes(a) As of mid-year.(b) Weighted by par value of amount outstanding for each year.
Source: Authors' Compilations and Salomon Smith Barney Estimate

FIGURE 2
QUARTERLY DEFAULT RATE AND 12-MONTH MOVING AVERAGE1991-2002
Source: Authors' Compilations and Salomon Smith Barney Estimates
0.0%
1.0%
2.0%
3.0%
4.0%
5.0%
6.0%
1Q911Q921Q931Q941Q951Q961Q971Q981Q991Q001Q011Q02
Qua
rter
ly D
efau
lt R
ate
0.0%
2.0%
4.0%
6.0%
8.0%
10.0%
12.0%
14.0%
16.0%
12 M
onth
Mov
ing
Ave
rage
QuarterlyMoving
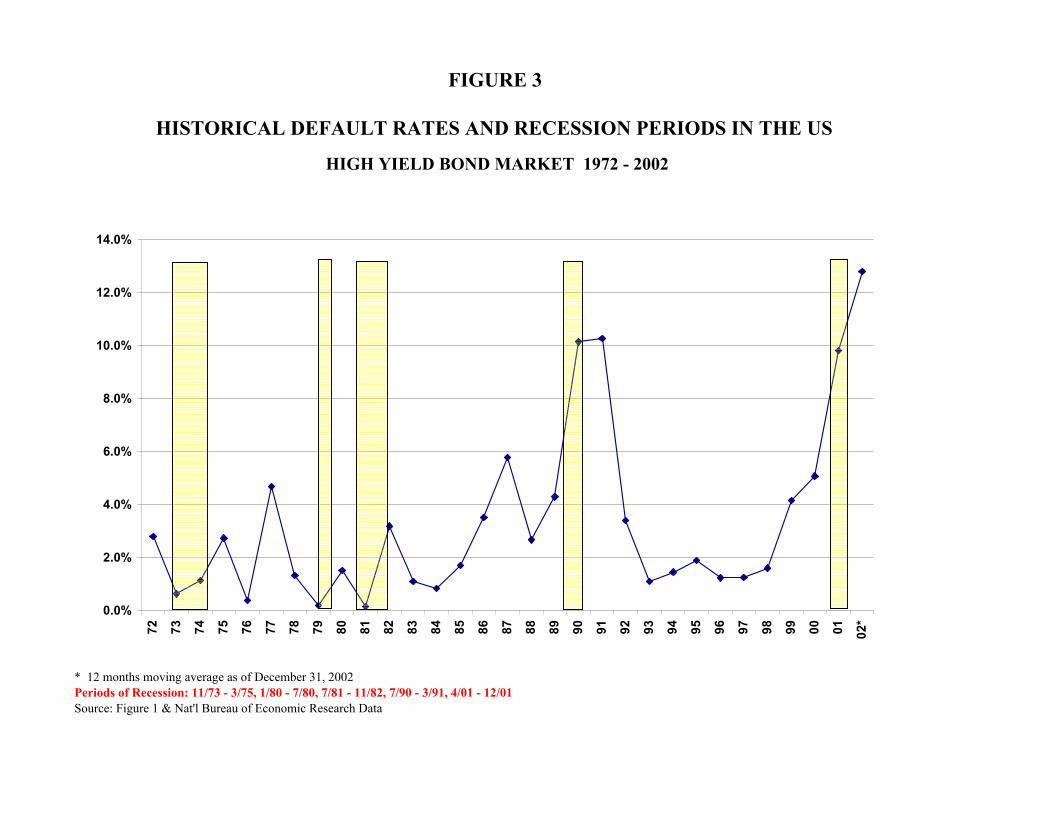
FIGURE 3
* 12 months moving average as of December 31, 2002Periods of Recession: 11/73 - 3/75, 1/80 - 7/80, 7/81 - 11/82, 7/90 - 3/91, 4/01 - 12/01Source: Figure 1 & Nat'l Bureau of Economic Research Data
HISTORICAL DEFAULT RATES AND RECESSION PERIODS IN THE US
0.0%
2.0%
4.0%
6.0%
8.0%
10.0%
12.0%
14.0%
72 73 74 75 76 77 78 79 80 81 82 83 84 85 86 87 88 89 90 91 92 93 94 95 96 97 98 99 00 01 02*
HIGH YIELD BOND MARKET 1972 - 2002
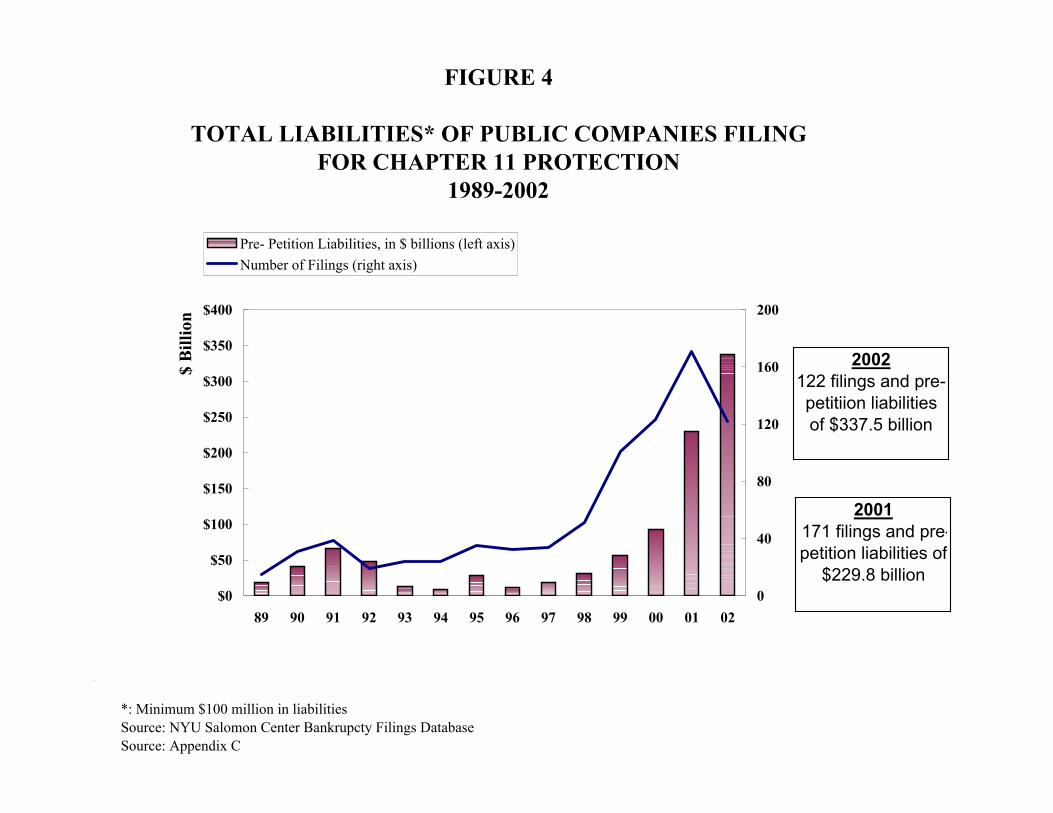
FIGURE 4
TOTAL LIABILITIES* OF PUBLIC COMPANIES FILINGFOR CHAPTER 11 PROTECTION
1989-2002
*: Minimum $100 million in liabilities Source: NYU Salomon Center Bankrupcty Filings Database Source: Appendix C
$0
$50
$100
$150
$200
$250
$300
$350
$400
89 90 91 92 93 94 95 96 97 98 99 00 01 02
$ B
illio
n
0
40
80
120
160
200
Pre- Petition Liabilities, in $ billions (left axis)Number of Filings (right axis)
2002122 filings and pre-petitiion liabilities of $337.5 billion
2001171 filings and pre-petition liabilities of
$229.8 billion

SUMMARY STATISTICSObservations: 339 companiesMean Lag 2.68 monthsStd. Deviation 7.33 monthsPercentile 25 0 monthsPercentile 75 2.5 monthsPercentile 95 11.2 months
1987-2002
FIGURE 5DEFAULT-BANKRUPTCY LAG
(IN MONTHS)
0
50
100
150
200
250
0 2 4 6 8 10 12 14 16 18 20 22 24 26 28 30 32 34 36
Months from Bond's Default to Bankrupcty
Num
ber
of c
ompa
nies
209 companies

INDUSTRY 1970-82 1983 1984 1985 1986 1987 1988 1989 1990 1991 1992 1993 1994 1995 1996 1997 1998 1999 2000 2001 2002 Total
Auto/Motor Carrier 3 3 3 1 1 1 12Conglomerates 0 1 3 1 1 3 3 1 - 13Energy 3 3 5 7 12 2 4 4 2 3 1 1 13 1 8 69Financial Services 4 1 1 1 4 11 7 14 3 2 1 2 1 2 6 1 6 4 5 76Leisure/Entertainment 0 2 4 4 8 2 4 3 4 3 1 5 5 8 9 6 5 73General Manufacturing 9 1 1 2 6 3 3 1 5 8 8 7 3 8 6 7 6 16 23 43 22 188Health Care 0 1 2 2 1 1 1 2 2 8 6 3 4 33Miscellaneous Industries 3 1 2 6 3 1 4 4 3 1 1 1 3 3 16 34 38 25 149Real Estate/Construction 7 1 1 1 1 3 7 5 1 2 1 2 1 4 6 4 3 50REIT 11 1 1 1 14Retailing 6 1 1 2 6 15 6 4 5 6 3 6 6 12 7 12 5 103Communications 7 2 2 1 1 3 1 3 4 1 1 3 2 2 1 6 11 8 39 26 124Transportation (non auto) 4 2 1 1 1 1 2 2 2 1 8 5 7 7 44Utilities 1 1 1 1 1 1 - 6
Total 57 12 12 19 23 15 24 26 47 62 34 22 19 28 15 29 37 98 107 156 112 954
Source: Author's compilations
FIGURE 6CORPORATE BOND DEFAULTS BY INDUSTRY
(NUMBER OF COMPANIES)

Years to Default No. of % of No. of % of No. of % of No. of % of No. of % of No. of % of No. of % of
Issues Total Issues Total Issues Total Issues Total Issues Total Issues Total Issues Total
1 4 6 3 3 0 0 0 0 3 8 1 3 2 82 12 18 25 23 18 13 0 0 6 16 9 28 3 133 15 23 23 21 26 19 7 13 5 14 7 22 3 134 13 20 18 17 29 21 10 19 2 5 3 9 8 335 1 2 23 21 35 26 8 15 4 11 1 3 1 46 7 11 5 5 10 7 12 22 8 22 2 6 5 217 7 11 5 5 4 3 5 9 7 19 2 6 0 08 2 3 4 4 10 7 4 7 0 0 2 6 0 09 1 2 1 1 3 2 0 0 0 0 4 13 0 0
10 3 5 1 1 2 1 8 15 2 5 1 3 2 8Total 65 100 108 100 137 100 54 100 37 100 32 100 24 100
Years to Default No. of % of No. of % of No. of % of No. of % of No. of % of No. of % of No. of % of
Issues Total Issues Total Issues Total Issues Total Issues Total Issues Total Issues Total
1 5 20 2 6 32 26 19 10 40 12 29 8 140 92 4 16 5 15 37 30 51 28 69 21 51 15 290 193 4 16 10 30 15 12 56 31 87 26 61 18 319 214 9 36 3 9 14 11 14 8 65 19 56 16 244 165 3 12 10 30 7 6 13 7 27 8 45 13 178 126 0 0 2 6 8 6 5 3 14 4 21 6 99 77 0 0 1 3 10 8 12 7 21 6 8 2 82 58 0 0 0 0 2 2 4 2 5 1 7 2 40 39 0 0 0 0 0 0 3 2 4 1 12 3 28 2
10 0 0 0 0 0 0 6 3 3 1 54 16 82 5Total 25 100 33 100 125 100 183 100 335 100 344 100 1502 100
Source: Authors' Compilations
1996
1999
1995
2001 2002
1993/19941991
1989-2002
FIGURE 7
DISTRIBUTION OF YEARS TO DEFAULT FROM ORIGINAL ISSUANCE DATE(By Year of Default)
(1989 - 2002)
19921989 1990
20001997 1998

Defaulted Issues*
% Originally Rated Investment Grade
% Originally Rated Non-Investment Grade
2002 321 39% 61%2001 258 14% 86%2000 142 16% 84%1999 87 13% 87%1998 39 31% 69%1997 20 0% 100%1996 24 13% 88%1995 29 10% 90%1994 16 0% 100%1993 24 0% 100%1992 59 25% 75%1991 163 27% 73%1990 117 16% 84%1989 66 18% 82%1988 64 42% 58%1987 31 39% 61%1986 55 15% 85%1985 26 4% 96%1984 14 21% 79%1983 7 43% 57%1982 20 55% 45%1981 1 0% 100%1980 4 25% 75%1979 1 0% 100%1978 1 100% 0%1977 2 100% 0%
Total 1591 23% 77%
* Where we could find an original rating from either S&P or Moody's.Source: Authors' Compilations from S&P and Moody's records.
FIGURE 8
DEFAULTS BY ORIGINAL RATING(INVESTMENT GRADE VS. NON-INVESTMENT GRADE)
By Year

Company with issues that were downgraded from Investment Grade
Outstanding Amount ($ MM)
WorldCom 25,549.0Conseco Inc. 3,240.6Kmart, Corp. 2,844.6NRG Energy 2,200.0US Airlines 2,087.0UAL Group (United) 1,873.0AT&T Canada Inc. 1,344.6PG&E National Energy Group 1,000.0Teleglobe Holdings(US) Corp 1,000.0Global Crossing, Ltd. 620.0Oakwood Homes 310.0Covanta Energy Corp./Ogden 260.0Amerco / Uhaul 100.0Total: 42,428.9
* Only those issues of the issuer that were rated BBB- or above on issuance have been considered
Source: Appendix A and rating agency records
FIGURE 9
FALLEN ANGEL DEFAULTS 2002

Year
Fallen Angel Average 12
Month Default Rate*
Original Issue Speculative
Grade Default Rates*
All Speculative Grade Bond
Default Rates*
Altman Dollar Weighted
Average Default Rates
2002 6.59% 8.55% 8.32% 12.79%2001 8.46% 10.14% 10.99% 9.81%2000 7.01% 7.10% 7.03% 5.07%1999 4.01% 5.10% 4.62% 4.15%1998 3.31% 2.75% 2.23% 1.60%1997 2.04% 2.10% 1.71% 1.25%1996 1.38% 2.00% 1.71% 1.23%1995 0.25% 3.90% 3.07% 1.90%1994 0.00% 2.31% 1.70% 1.45%1993 1.72% 1.99% 1.79% 1.10%1992 4.50% 5.48% 5.45% 3.40%1991 7.53% 10.86% 11.66% 10.27%1990 5.77% 8.30% 8.20% 10.14%1989 3.74% 4.93% 5.33% 4.29%1988 4.25% 3.39% 3.95% 2.66%1987 4.36% 2.92% 2.41% 5.78%1986 2.46% 6.29% 4.78% 3.50%1985 6.77% 4.06% 3.24% 1.71%
Arithmetic Average 4.12% 5.12% 4.90% 4.56%Weighted Average(By number of issuers) 4.19% 5.15% 5.10% 5.60%
Standard Deviation 2.55% 3.40% 3.06% 3.61%
*Each year's figure is based on the one year average of the 12 months for that year.Source: Author Compilation from Standard &Poor's "Credit Pro" Database
FALLEN ANGEL(FA) VS ORIGINAL ISSUE & ALL HIGH YIELD DEFAULT RATES
(Issuer Based)
FIGURE 10
1985-2002

FIGURE 11Fallen Angel(FA) vs Original Issue(OI) & All High Yield Default Rates
1985-2002
-2.00%
0.00%
2.00%
4.00%
6.00%
8.00%
10.00%
12.00%
14.00%
1982 1986 1990 1994 1998 2002
Year
Ave
rage
Def
ault
Rat
es
Fallen Angel Average 12 Month Default Rate* Original Issue Speculative Grade Default Rates*All Speculative Grade Bond Default Rates*

Year BB B CCC2002 3.08% 16.67% 23.53%2001 4.24% 14.29% 0.00%2000 1.85% 9.09% 16.67%1999 1.11% 7.69% 0.00%1998 0.00% 14.29% 0.00%1997 1.19% 6.45% 0.00%1996 0.00% 3.13% 0.00%1995 1.10% 0.00% 0.00%1994 0.00% 0.00% 0.00%1993 1.12% 0.00% 20.00%1992 0.00% 11.54% 45.45%1991 1.41% 18.18% 0.00%1990 0.00% 0.00% 0.00%1989 0.00% 6.06% 25.00%1988 1.75% 15.15% 20.00%1987 0.00% 3.57% 0.00%1986 0.00% 0.00% 33.33%1985 5.26% 0.00% 0.00%
Average Annual(FA) One Year Default Rates 1.23% 7.01% 10.22%Average Annual(OI) One Year Default Rates 1.13% 5.70% 24.02%
*Each year's figure is based on the one year average of the 12 months for that year. **0I = original issue high yield bonds.
Source: Author Compilation from Standard &Poor's "Credit Pro" Database
FIGURE 12
Annual Fallen Angel(FA) One Year Default Rates By Rating* : 1985-2002 (As a % of All Fallen Angel Issuers of the Same Rating)

Unadjusted for Only Fallen All except Price Adjusted for Fallen Angels Angels Fallen Angels Fallen Angels
BACKGROUND DATAAVERAGE DEFAULT RATE, 2002 12.795% 20.284% 9.936% 12.795%AVERAGE PRICE AT DEFAULT (a) 25.317% 20.172% 28.446% 32.450%AVERAGE PRICE AT DOWNGRADE 59.792%AVERAGE RECOVERY 25.317% 37.908% 28.446% 32.450%AVERAGE LOSS OF PRINCIPAL 74.683% 62.092% 71.554% 67.550%AVERAGE COUPON PAYMENT 9.369% 8.261% 10.564% 9.589%
DEFAULT LOSS COMPUTATIONDEFAULT RATE 12.795% 20.284% 9.936% 12.795%X LOSS OF PRINCIPAL 74.683% 62.092% 71.554% 67.550%DEFAULT LOSS OF PRINCIPAL 9.556% 12.594% 7.109% 8.643%
DEFAULT RATE 12.795% 20.284% 9.936% 12.795%X LOSS OF 1/2 COUPON 4.684% 4.130% 5.282% 4.794%DEFAULT LOSS OF COUPON 0.599% 0.838% 0.525% 0.613%
DEFAULT LOSS OF PRINCIPAL AND COUPON 10.155% 13.432% 7.634% 9.256%
(a) If default date price is not available, end-of-month price is used.
Source: Author's Compilations and various dealer quotes.
2002 DEFAULT LOSS RATE FIGURE 13

FIGURE 14DEFAULT RATES AND LOSSES (a)
(1978 - 2002)
PAR VALUE PAR VALUEOUTSTANDING (a) OF DEFAULT DEFAULT WEIGHTED PRICE WEIGHTED DEFAULT
YEAR ($ MMs) ($ MMs) RATE (%) AFTER DEFAULT ($) COUPON (%) LOSS (%)2002 $757,000 $96,858 12.79% 25.3 9.37% 10.15% (b)2001 $649,000 $63,609 9.80% 25.5 9.18% 7.76%2000 $597,200 $30,295 5.07% 26.4 8.54% 3.95%1999 $567,400 $23,532 4.15% 27.9 10.55% 3.21%1998 $465,500 $7,464 1.60% 35.9 9.46% 1.10%1997 $335,400 $4,200 1.25% 54.2 11.87% 0.65%1996 $271,000 $3,336 1.23% 51.9 8.92% 0.65%1995 $240,000 $4,551 1.90% 40.6 11.83% 1.24%1994 $235,000 $3,418 1.45% 39.4 10.25% 0.96%1993 $206,907 $2,287 1.11% 56.6 12.98% 0.56%1992 $163,000 $5,545 3.40% 50.1 12.32% 1.91%1991 $183,600 $18,862 10.27% 36.0 11.59% 7.16%1990 $181,000 $18,354 10.14% 23.4 12.94% 8.42%1989 $189,258 $8,110 4.29% 38.3 13.40% 2.93%1988 $148,187 $3,944 2.66% 43.6 11.91% 1.66%1987 $129,557 $7,486 5.78% 75.9 12.07% 1.74%1986 $90,243 $3,156 3.50% 34.5 10.61% 2.48%1985 $58,088 $992 1.71% 45.9 13.69% 1.04%1984 $40,939 $344 0.84% 48.6 12.23% 0.48%1983 $27,492 $301 1.09% 55.7 10.11% 0.54%1982 $18,109 $577 3.19% 38.6 9.61% 2.11%1981 $17,115 $27 0.16% 72.0 15.75% 0.15%1980 $14,935 $224 1.50% 21.1 8.43% 1.25%1979 $10,356 $20 0.19% 31.0 10.63% 0.14%1978 $8,946 $119 1.33% 60.0 8.38% 0.59%
ARITHMETIC AVERAGE 1978-2002: 3.62% $42.3 11.06% 2.51%WEIGHTED AVERAGE 1978-2002: 5.49% 4.10%
Notes(a) Excludes defaulted issues(b) Default loss rate adjusted for fallen angels is 9.256% in 2002
Source: Authors' CompilationsSource: Figure 1 and 9

SUMMARY STATISTICS
Price at Default Price at Downgrade % Recovery Years to defaultMean 54.43 75.67 0.72 2.00Median 53.44 76.94 0.75 1.79Standard Deviation 19.1% 11.7% 25.6% 1.64%
Analysis by Year of Default
Price at Default Price at Downgrade % Recovery Years to default# of Data
points Fallen Angels ($
MM)1982 Average 38.59 52.94 72.9% 0.54 10 498 1983 Average 71.17 89.08 79.9% 6.11 3 47 1984 Average 70.54 85.25 82.7% 1.79 3 47 1985 Average 36.63 67.75 54.1% 1.25 1 21 1986 Average 44.78 77.40 57.9% 3.54 10 317 1987 Average 71.85 82.77 86.8% 1.80 11 2,905 1988 Average 53.49 75.95 70.4% 3.77 22 741 1989 Average 53.39 66.75 80.0% 0.07 10 1,155 1990 Average 35.70 76.48 46.7% 2.41 17 1,516 1991 Average 67.28 86.92 77.4% 1.16 37 1,902 1992 Average 79.13 94.45 83.8% 3.04 7 133 1995 Average 69.00 67.06 102.9% 0.00 2 125 1999 Average 30.43 84.64 35.9% 2.56 7 1,013 2000 Average 29.46 80.76 36.5% 0.80 13 2,300 2001 Average 1 86.00 62.72 137.1% 0.33 17 3,825 2002 Average 33.38 59.79 55.8% 2.90 113 42,429 Arithmetic Average 54.43 75.67 71.9% 2.00 170 57531.4Weighted Average 2 40.81 64.29 63.5% 2.45 Median 53.44 76.94 75.2% 1.79SD 19.1% 11.7% 25.6% 1.64%1- Includes FINOVA as a fallen angel2 - Weighted by $ outstanding
Analysis by Seniority
Price at Default Price at Downgrade % Recovery Years to default Default Loss # of Data points Senior Secured Average 44.23 63.57 70.9% 2.45 34.5% 63Senior Unsecured 49.59 72.68 69.5% 2.19 35.1% 209Subordinate (Sr. and Jr.) 30.34 68.85 55.1% 1.93 49.9% 11Weighted Average 40.81 64.29 63.5% 2.45 35.5% 283
Fallen Angels: An Analysis Of Recovery Rates And Loss Rates On DefaultFIGURE 15
Source: Author's compilation from NYU Salomon Center database.

FIGURE 16
WEIGHTED AVERAGE RECOVERY RATES ON DEFAULTED DEBTBY SENIORITY PER $100 FACE AMOUNT (1978-2002)
Default Senior Secured Senior Unsecured Senior Subordinated Subordinated Discount and All SenioritiesYear Zero Coupon
No. $ No. $ No. $ No. $ No. $ No. $
2002 37 $52.81 254 $21.82 21 $32.79 0 $0.00 28 $26.47 340 $25.322001 9 $40.95 187 $28.84 48 $18.37 0 $0.00 37 $15.05 281 $25.482000 13 $39.58 47 $25.40 61 $25.96 26 $26.62 17 $23.61 164 $25.831999 14 $26.90 60 $42.54 40 $23.56 2 $13.88 11 $17.30 127 $31.141998 6 $70.38 21 $39.57 6 $17.54 0 0.00 1 $17.00 34 $37.271997 4 $74.90 12 $70.94 6 $31.89 1 $60.00 2 $19.00 25 $53.891996 4 $59.08 4 $50.11 9 $48.99 4 $44.23 3 $11.99 24 $51.911995 5 $44.64 9 $50.50 17 $39.01 1 $20.00 1 $17.50 33 $41.771994 5 $48.66 8 $51.14 5 $19.81 3 $37.04 1 $5.00 22 $39.441993 2 $55.75 7 $33.38 10 $51.50 9 $28.38 4 $31.75 32 $38.831992 15 $59.85 8 $35.61 17 $58.20 22 $49.13 5 $19.82 67 $50.031991 4 $44.12 69 $55.84 37 $31.91 38 $24.30 9 $27.89 157 $40.671990 12 $32.18 31 $29.02 38 $25.01 24 $18.83 11 $15.63 116 $24.661989 9 $82.69 16 $53.70 21 $19.60 30 $23.95 76 $35.971988 13 $67.96 19 $41.99 10 $30.70 20 $35.27 62 $43.451987 4 $90.68 17 $72.02 6 $56.24 4 $35.25 31 $66.631986 8 $48.32 11 $37.72 7 $35.20 30 $33.39 56 $36.601985 2 $74.25 3 $34.81 7 $36.18 15 $41.45 27 $41.781984 4 $53.42 1 $50.50 2 $65.88 7 $44.68 14 $50.621983 1 $71.00 3 $67.72 4 $41.79 8 $55.171982 16 $39.31 4 $32.91 20 $38.031981 1 $72.00 1 $72.001980 2 $26.71 2 $16.63 4 $21.671979 1 $31.00 1 $31.001978 1 $60.00 1 $60.00
Total/Average 172 $52.86 806 $33.62 368 $29.67 247 $31.03 130 $20.40 1723 $32.93
Median 55.75$ $41.99 $31.91 $31.00 $17.50 $39.44
Source: Authors' Compilations from Various Dealer Quotes

Source: Altman, Brady, Resti and Sironi (2002), and NYU Salomon Ceter Default database.
FIGURE 17RECOVERY RATE/DEFAULT RATE ASSOCIATION
Dollar Weighted Average Recoery Rates to Dollar Weighted Average Default Rates
1991
1992
1993
19941995
1996
1997
1998
19992000
2001 2002
1982
1983
1984
1985
1986
1987
1988
1989
1990
y = -0.1114Ln(x) + 0.0101R2 = 0.6646
y = -2.3461x + 0.5022R2 = 0.5459
y = 38.47x2 - 7.1387x + 0.5831R2 = 0.662
y = 0.1382x-0.2917
R2 = 0.6948
20%
25%
30%
35%
40%
45%
50%
55%
60%
65%
0% 2% 4% 6% 8% 10% 12% 14%
Default Rate
Rec
over
y R
ate

Issue Default DefaultIssuer Bond Coupon Size Date Price ($)@Track Communications SrSubNts '11/07 9.375 250.00 11/1/1996 54.20360Networks, Inc. SrSubNts '12/03 10.250 210.00 11/1/1996 44.19360Networks, Inc. Senior Discount Notes 14.000 285.80 1/24/1997 4.50360Networks, Inc. Senior Notes 4/15/03 13.000 100.00 4/15/1998 30.00Advanced Radio Telecomm Senior Notes 10/15/04 14.000 125.00 4/15/1998 28.50Arch Wireless, Inc. Senior Discount Notes NA 207.00 6/30/1998 17.00Arch Wireless, Inc. Senior Notes 12.000 12.00 7/30/1998 24.00Arch Wireless, Inc. Senior Notes 12.250 275.00 7/30/1998 24.00Arch Wireless, Inc. Senior Secured Discount Notes NA 139.00 9/3/1998 10.00Arch Wireless, Inc. Senior Notes 13.500 150.00 9/28/1998 30.00AT&T Canada Inc. Senior Discount Notes NA 250.00 9/28/1998 3.00AT&T Canada Inc. Guaranteed Senior Notes 12.000 125.00 1/15/1999 35.00AT&T Canada Inc. Senior Dicount Notes NA 85.60 2/10/1999 34.00BTI Telecom, Corp. Senior Notes 13.000 150.00 2/11/1999 10.00CAI Wireless Systems, Inc. Senior Discount Notes NA 175.10 2/11/1999 9.57CAI Wireless Systems, Inc. Senior Discount Notes NA 123.70 2/18/1999 9.00Call - Net Enterprises, Inc. Senior Subordinated Notes 9.875 105.00 4/16/1999 7.00Call - Net Enterprises, Inc. Senior Subordinated Notes 14.000 98.40 6/9/1999 25.00Call - Net Enterprises, Inc. Eurobonds 15.250 107.10 7/1/1999 47.00Call - Net Enterprises, Inc. Senior Notes 15.000 460.00 7/1/1999 44.00Call - Net Enterprises, Inc. Senior Notes 13.000 0.30 7/15/1999 19.00CellNet Data Systems Senior Notes 10.875 350.00 7/15/1999 19.00CellNet Data Systems Senior Notes 11.250 5.60 7/15/1999 19.00Classic Cable, Inc. Senior Notes 14.000 500.00 7/15/1999 19.00Classic Cable, Inc. Senior Unsecured Discount Notes 13.875 79.10 10/27/1999 13.00Classic Cable, Inc. Senior Notes 11.500 200.00 10/28/1999 33.00Convergent Communications, Inc. Senior Notes 13.000 225.00 10/28/1999 33.00Covad Communications Group, Inc. Senior Subordinated Notes 10.125 400.00 2/1/2000 39.70Covad Communications Group, Inc. Senior Subordinated Notes 8.875 300.00 2/1/2000 39.70Covad Communications Group, Inc. Senior Subordinated Notes 10.000 500.00 2/1/2000 39.70Dolphin Telecom, PLC Senior Discount Notes NA 452.60 2/4/2000 17.34Dolphin Telecom, PLC Senior Discount Notes NA 223.30 2/4/2000 12.63e.spire Communications, Inc. Senior Discount Notes NA 370.40 5/17/2000 56.70e.spire Communications, Inc. Senior Secured Notes 13.250 265.00 5/17/2000 45.00e.spire Communications, Inc. Senior Discount Notes NA 289.80 5/17/2000 24.80e.spire Communications, Inc. Senior Subordinated Accrual Notes 12.750 165.30 5/17/2000 6.75Energis PLC Senior Notes 14.000 170.00 8/15/2000 15.00Exodus Communications, Inc. Senior Subordinated Notes 12.375 120.00 9/28/2000 64.75Exodus Communications, Inc. Senior Discount Notes 13.500 584.30 11/14/2000 12.00Exodus Communications, Inc. Senior Discount Notes NA 521.61 11/14/2000 12.00Exodus Communications, Inc. Senior Discount Notes NA 151.72 11/14/2000 8.00Flag Telecom Holdings, Ltd. Senior Discount Notes NA 393.97 11/14/2000 8.00Flag Telecom Holdings, Ltd. Senior Discount Notes NA 320.04 11/14/2000 8.00Flag Telecom Holdings, Ltd. Senior Notes 10.875 150.00 12/15/2000 28.00Focal Communication Corp Senior Notes 11.000 68.60 12/15/2000 3.00Focal Communication Corp Senior Notes 10.750 325.00 1/16/2001 13.00Focal Communication Corp Senior Notes 11.500 300.00 1/16/2001 12.50Focal Communication Corp Senior Notes 11.375 500.00 1/16/2001 12.50Focal Communications, Corp. Senior Notes 11.250 325.00 1/16/2001 8.00Focal Communications, Corp. Senior Notes 12.875 400.00 1/16/2001 14.00FWT, Inc. Senior Notes - Yankee 8.000 175.00 2/8/2001 38.00Galaxy Telecomm L.P. Senior Notes - Yankee 9.375 450.00 2/8/2001 36.00Geotek Communications, Inc. Senior Discount Notes - Yankee NA 244.60 2/8/2001 32.60Global Crossing, Ltd. Senior Discount Notes - Yankee NA 358.60 2/8/2001 31.61Global Crossing, Ltd. Senior Discount Notes - Yankee NA 282.40 2/8/2001 31.36Global Crossing, Ltd. Guaranteed Senior Notes 13.750 125.00 2/15/2001 38.00Global Crossing, Ltd. Senior Notes, Ser. D 11.625 75.00 3/1/2001 13.00Global Crossing, Ltd. Senior Notes, Ser. B 11.625 150.00 3/1/2001 13.00Global Crossing, Ltd. Guaranteed Senior Notes 9.125 200.00 3/1/2001 3.25Global Crossing, Ltd. Guaranteed Senior Notes 12.875 100.00 3/1/2001 2.00Global Crossing, Ltd. Senior Subordinated Notes 11.000 227.35 3/15/2001 17.00Global Crossing, Ltd. Senior Subordinated Notes 10.375 134.97 3/15/2001 17.00Global Crossing, Ltd. Senior Subordinated Notes 9.750 171.34 3/15/2001 17.00Global Telesystems, Inc. Guaranteed Senior Notes - Yankee 12.250 300.00 3/16/2001 8.00Global Telesystems, Inc. Guaranteed Senior Notes - Yankee 10.500 200.00 3/16/2001 8.00Global Telesystems, Inc. Guaranteed Senior Notes - Yankee NA 278.00 3/16/2001 1.00Global Telesystems, Inc. Guaranteed Senior Notes - Yankee 12.000 100.00 3/16/2001 1.00
FIGURE 18
RECOVERY RATES FOR TELECOMMUNICATIONS AND E-COMMERCE INDUSTRIES*1996 - 2002

Issue Default DefaultIssuer Bond Coupon Size Date Price ($)
FIGURE 18
RECOVERY RATES FOR TELECOMMUNICATIONS AND E-COMMERCE INDUSTRIES*1996 - 2002
Globalstar LP Guaranteed Senior Notes - Yankee 9.875 175.00 3/16/2001 1.00Globalstar LP Senior Notes 11.000 1050.00 3/21/2001 10.00Globalstar LP Senior Notes 11.500 350.00 3/21/2001 9.00Globalstar LP Senior Subordinated Notes 10.500 600.00 3/21/2001 9.00GST Telecommunications, Inc. Senior Subordinated Notes 10.000 600.00 3/21/2001 9.00GST Telecommunications, Inc. Senior Notes 13.750 220.00 3/22/2001 30.00GST Telecommunications, Inc. Senior Discount Notes 13.000 190.00 3/22/2001 25.00GST Telecommunications, Inc. Senior Discount Notes NA 119.70 3/22/2001 24.00Heartland Wireless Communications, Inc Senior Discount Notes NA 305.80 3/22/2001 15.94Heartland Wireless Communications, Inc Senior Notes 14.000 135.00 3/30/2001 15.00ICG Communications Corp. Senior Notes 12.250 350.00 4/2/2001 5.00ICG Communications Corp. Senior Notes 13.250 300.00 4/4/2001 5.00ICG Communications Corp. Senior Discount Notes 14.000 8.73 4/15/2001 102.50ICG Communications Corp. Senior Notes 12.750 639.75 4/15/2001 1.38ICG Communications Corp. Senior Notes 12.500 325.00 4/15/2001 1.38ICO Global Comm. Services, Inc. Senior Discount Notes NA 551.40 4/15/2001 0.42ICO Global Comm. Services, Inc. Senior Subordinated Notes 10.000 7.13 4/18/2001 92.00Impsat Fiber Networks, Corp. Senior Notes 13.000 160.00 4/19/2001 10.00Impsat Fiber Networks, Corp. Senior Secured Notes 12.000 91.65 5/1/2001 25.00Impsat Fiber Networks, Corp. Senior Discount Notes 12.500 410.20 5/2/2001 12.19In-Flight Phone Corp. Senior Notes 11.500 200.00 5/2/2001 11.00International Wireless Communications Senior Notes 11.500 269.45 5/2/2001 11.00Ionica Group PLC Senior Notes 11.250 400.00 5/2/2001 11.00Ionica Group PLC Senior Notes 13.500 150.00 5/2/2001 2.00Iridium LLC/Capital Corp. Senior Notes 11.500 300.00 5/21/2001 2.00Iridium LLC/Capital Corp. Senior Discount Notes NA 372.66 5/21/2001 0.59Iridium LLC/Capital Corp. Senior Notes 9.500 125.00 5/23/2001 35.00Iridium LLC/Capital Corp. Senior Notes 14.000 100.00 5/23/2001 35.00ITC DeltaCom, Inc. Senior Notes 13.000 130.00 5/23/2001 21.00ITC DeltaCom, Inc. Senior Notes 13.750 147.00 5/23/2001 21.00ITC DeltaCom, Inc. Senior Discount Notes 10.875 164.16 5/23/2001 20.00Knology Holdings Senior Discount Notes 15.000 207.27 5/23/2001 20.00KPN Qwest Senior Discount Notes NA 271.01 5/23/2001 5.83McLeodUSA, Inc. Senior Notes 12.500 175.00 6/15/2001 3.00McLeodUSA, Inc. Senior Subordinated Notes 11.875 92.97 6/15/2001 17.00McLeodUSA, Inc. Senior Notes 12.000 500.00 6/28/2001 2.50McLeodUSA, Inc. Senior Notes 13.000 600.00 6/28/2001 2.00McLeodUSA, Inc. Guaranteed Senior Notes 13.000 300.00 7/2/2001 20.00McLeodUSA, Inc. Senior Discount Notes NA 149.31 7/6/2001 39.15McLeodUSA, Inc. Senior Discount Notes NA 340.64 7/6/2001 39.04McLeodUSA, Inc. Senior Discount Notes NA 215.30 7/27/2001 2.00Metricom, Inc. Senior Discount Notes NA 221.50 7/27/2001 1.00Metrocall, Inc. Guaranteed Senior Notes 9.375 150.00 8/1/2001 46.00Metrocall, Inc. Guaranteed Senior Notes 9.875 91.50 8/1/2001 45.00Metrocall, Inc. Senior Notes 12.750 325.00 8/2/2001 11.00Metrocall, Inc. - Pronet Senior Subordinated Notes 14.000 300.00 8/2/2001 3.00Metromedia Fiber Network, Inc. Senior Discount Notes NA 240.50 8/2/2001 7.21Metromedia Fiber Network, Inc. Senior Notes 12.500 215.00 8/7/2001 24.00Metromedia International Senior Subordinated Notes 12.000 425.00 8/7/2001 19.00Microcell Telecommunications Senior Discount Notes NA 218.22 8/7/2001 16.37Microcell Telecommunications Senior Notes 9.875 105.00 8/15/2001 20.00Mobilemedia Communications Senior Notes 11.500 264.60 8/15/2001 20.00Mobilemedia Communications Senior Notes 10.000 650.00 8/15/2001 26.50Motient, Corp. (American Mobile Satellite) Senior Notes 10.000 750.00 8/15/2001 26.00Mpower Holding, Corp. Guaranteed Senior Notes 10.500 225.00 9/1/2001 52.00Mpower Holding, Corp. Guaranteed Senior Subordinated 10.500 125.00 9/17/2001 26.00Netia Holdings + Senior Notes 10.750 375.00 9/26/2001 13.00Netia Holdings + Senior Notes 11.250 275.00 9/26/2001 13.00Netia Holdings + Senior Notes 11.625 998.70 9/26/2001 13.00Nextel International, Inc. Senior Notes 11.625 1.30 9/26/2001 13.00Nextel Intl Inc Guaranteed Senior Notes 12.250 334.75 10/1/2001 30.33Nextel Intl Inc Senior Notes 13.250 225.00 10/10/2001 34.36Nextel Intl Inc Senior Notes 13.250 150.00 10/10/2001 34.36Nextel Intl Inc Senior Notes 11.875 180.00 10/10/2001 33.35Nextel Intl Inc Senior Notes 10.500 250.00 10/12/2001 25.50NorthPoint Communications, Inc. Senior Notes 11.875 275.00 10/31/2001 30.33NTL, Inc. Senior Discount Notes NA 235.20 10/31/2001 25.30

Issue Default DefaultIssuer Bond Coupon Size Date Price ($)
FIGURE 18
RECOVERY RATES FOR TELECOMMUNICATIONS AND E-COMMERCE INDUSTRIES*1996 - 2002
NTL, Inc. Senior Notes 12.000 160.00 11/15/2001 28.75NTL, Inc. Senior Discount Notes 14.000 45.45 11/15/2001 16.00NTL, Inc. Senior Discount Notes 14.000 447.42 11/15/2001 16.00NTL, Inc. Senior Discount Notes NA 1220.99 11/15/2001 16.00NTL, Inc. Senior Notes 9.000 335.00 12/1/2001 17.00NTL, Inc. Senior Notes 9.625 400.00 12/1/2001 17.00Optel, Inc. Senior Notes 10.500 1.83 12/1/2001 17.00Optel, Inc. Senior Notes 10.500 398.17 12/1/2001 17.00Orbcomm Global LP Senior Notes 10.750 675.00 12/1/2001 17.00Orbital Imaging Corp. Senior Notes 10.750 500.00 12/1/2001 17.00Orbital Imaging Corp. Senior Notes 12.500 350.00 12/1/2001 17.00Paging Network, Inc. Senior Notes 12.750 150.00 12/1/2001 17.00Paging Network, Inc. Senior Discount Notes NA 334.02 12/1/2001 11.50Paging Network, Inc. Senior Discount Notes NA 572.58 12/1/2001 11.50Pathnet Telecommunications, Inc. Senior Discount Notes NA 457.18 12/1/2001 11.50PhoneTel Tech Senior Notes 8.125 500.00 12/4/2001 24.00PSINet, Inc. Senior Notes 8.375 300.00 12/4/2001 24.00PSINet, Inc. Senior Notes 9.250 225.00 12/4/2001 24.00PSINet, Inc. Senior Notes 9.500 300.00 12/4/2001 24.00PSINet, Inc. Senior Notes 11.375 750.00 12/4/2001 24.00Rhythms NetConnections, Inc. Senior Notes 11.500 210.00 12/4/2001 22.00Rhythms NetConnections, Inc. Senior Notes 12.000 150.00 12/4/2001 22.00Rhythms NetConnections, Inc. Senior Discount Notes NA 491.06 12/4/2001 21.00RSL Communications PLC Guaranteed Senior Notes 12.125 123.44 12/15/2001 7.25RSL Communications PLC Senior Notes 12.275 195.00 12/15/2001 7.25RSL Communications PLC Senior Notes 13.750 298.28 12/15/2001 7.25RSL Communications PLC Guaranteed Senior Notes 10.250 199.50 12/15/2001 17.19RSL Communications PLC Guaranteed Senior Notes 11.250 192.05 12/15/2001 17.19RSL Communications PLC Guaranteed Senior Notes 13.125 94.90 12/15/2001 17.19RSL Communications PLC Notes 6.000 200.00 1/28/2002 15.00Source Media, Inc. Guaranteed Senior Notes 8.700 998.12 1/28/2002 15.00Spectrasite Holdings Senior Notes 8.700 1.88 1/28/2002 15.00Startec Global Communications Corp. Notes 9.000 100.00 1/28/2002 15.00Talton Holdings Guaranteed Senior Notes 9.125 900.00 1/28/2002 15.00Teleglobe Holdings(US) Corp Notes 9.300 20.00 1/28/2002 15.00Teleglobe Holdings(US) Corp Senior Notes 9.500 0.60 1/28/2002 15.00Telegroup, Inc. Guaranteed Senior Notes 9.625 800.00 1/28/2002 15.00TeleHub Network Services Corp. Notes 7.250 300.00 1/28/2002 11.00Telesystem International Wireless, Inc. Guaranteed Senior Notes 9.500 1099.40 1/28/2002 9.25Telesystem International Wireless, Inc. Senior Notes 12.750 650.00 2/1/2002 7.00Teletrac, Inc. Senior unsecured notes 9.75% 200.00 3/15/2002 NATelex Communications, Inc. Senior Notes 9.750 1300.00 4/1/2002 41.00Teligent, Inc. Senior Notes 10.000 400.00 4/1/2002 41.00Teligent, Inc. Senior Notes 11.500 625.00 4/1/2002 41.00United International Holdings, Inc. Senior Notes 11.500 1050.00 4/1/2002 41.00United International Holdings, Inc. Senior Notes 11.875 500.00 4/1/2002 41.00United International Holdings, Inc. Senior Notes 12.375 450.00 4/1/2002 41.00USN Communications Senior Notes 12.750 277.80 4/1/2002 41.00Velocita Corp/PF Net Communications Limited Senior Notes 13.000 380.56 4/8/2002 NAVelocita Corp/PF Net Communications Limited Senior Notes 13.000 56.12 4/8/2002 NAVersatel Telecom NV Senior Notes 8.250 426.60 4/12/2002 28.58Versatel Telecom NV Senior Notes 8.250 3.40 4/12/2002 28.58Versatel Telecom NV Senior Notes 11.675 300.00 4/12/2002 28.58Viatel, Inc. Senior Notes 10.700 500.00 4/22/2002 16.00Viatel, Inc. Senior Notes 10.875 1500.00 4/22/2002 16.00Viatel, Inc. Senior Notes 11.700 575.00 4/22/2002 16.00Viatel, Inc. Senior Notes 11.875 5.09 4/22/2002 16.00Viatel, Inc. - Econophone Senior Notes 11.875 419.91 4/22/2002 16.00WebLink Wireless Senior unsecured notes 11.000 115.00 4/24/2002 NAWebLink Wireless Senior Notes 9.750 125.00 5/14/2002 NAWilliams Communications Group, Inc. Guaranteed Senior Notes 7.200 600.00 5/15/2002 32.00Williams Communications Group, Inc. Guaranteed Senior Notes 7.700 400.00 5/15/2002 32.00Williams Communications Group, Inc. Senior Notes 8.125 450.00 5/23/2002 2.06Williams Communications Group, Inc. Senior Discount Notes 12.125 729.67 5/24/2002 33.00Williams Communications Group, Inc. Senior Discount Notes 12.125 0.33 5/24/2002 33.00Winstar Communications, Inc. Senior Discount Notes 12.125 0.33 5/24/2002 33.00Winstar Communications, Inc. Senior Discount Notes 12.125 0.33 5/24/2002 33.00Winstar Communications, Inc. Guaranteed Senior Notes 14.000 147.50 5/30/2002 33.00Winstar Communications, Inc. Senior Notes 8.875 160.00 6/25/2002 NAWinstar Communications, Inc. Senior Notes 11.000 130.00 6/25/2002 NAWireless One, Inc. Senior Notes 13.750 56.60 7/20/2002 NAWireless One, Inc. Senior Notes 13.750 168.40 7/20/2002 NAWorld Access, Inc. Bonds 8.250 4600.00 7/21/2002 14.00WorldCom Notes 7.500 4000.00 7/21/2002 14.00WorldCom Senior Notes 6.400 2250.00 7/21/2002 14.00WorldCom Notes 6.950 1750.00 7/21/2002 14.00

Issue Default DefaultIssuer Bond Coupon Size Date Price ($)
FIGURE 18
RECOVERY RATES FOR TELECOMMUNICATIONS AND E-COMMERCE INDUSTRIES*1996 - 2002
WorldCom Notes 6.500 1500.00 7/21/2002 14.00WorldCom Notes 6.750 1250.00 7/21/2002 14.00WorldCom Notes 8.000 1250.00 7/21/2002 14.00WorldCom Notes 8.250 1250.00 7/21/2002 14.00WorldCom Senior Notes 7.750 1100.00 7/21/2002 14.00WorldCom Notes 7.375 1000.00 7/21/2002 14.00WorldCom Notes 7.375 1000.00 7/21/2002 14.00WorldCom Notes 7.875 1000.00 7/21/2002 14.00WorldCom Senior Notes 6.250 600.00 7/21/2002 14.00WorldCom Senior Notes 7.550 600.00 7/21/2002 14.00WorldCom Senior Notes 6.500 500.00 7/21/2002 14.00WorldCom Debentures 7.125 500.00 7/21/2002 14.00WorldCom Senior Notes 7.250 500.00 7/21/2002 14.00WorldCom Senior Notes 7.750 300.00 7/21/2002 14.00WorldCom Debentures 7.750 240.00 7/21/2002 14.00WorldCom Notes 18.500 1512.00 7/21/2002 14.00WorldCom Senior Notes 10.000 9.00 7/21/2002 14.00WorldCom/Brooks Fiber Senior Discount Notes 11.250 319.94 7/21/2002 14.00WorldCom/Intermedia Senior Discount Notes 11.250 319.94 7/21/2002 14.00WorldCom/Intermedia Senior Discount Notes 11.250 319.94 7/21/2002 14.00WorldCom/Intermedia Senior Sub Notes 12.250 246.22 7/21/2002 14.00WorldCom/Intermedia Senior Notes 8.600 198.58 7/21/2002 14.00WorldCom/Intermedia Senior Notes 8.500 123.89 7/21/2002 14.00WorldCom/Intermedia Senior Notes 9.500 122.58 7/21/2002 14.00WorldCom/Intermedia Senior Notes 8.875 116.81 7/21/2002 14.00WorldCom/Intermedia Debentures 7.750 450.00 7/21/2002 14.00WorldCom/MCI Debentures 7.500 400.00 7/21/2002 14.00WorldCom/MCI Senior Notes 6.950 300.00 7/21/2002 14.00WorldCom/MCI Debentures 8.250 200.00 7/21/2002 14.00WorldCom/MCI Senior unsecured notes 7.650 998.64 9/15/2002 $16.00XO Communications, Inc. Senior unsecured notes 7.625 250.00 9/15/2002 $16.00XO Communications, Inc. Senior unsecured notes 7.150 96.00 9/15/2002 $16.00XO Communications, Inc. Senior Discount Notes 12.000 200.00 9/15/2002 18.00XO Communications, Inc. Senior Discount Notes 11.875 379.90 9/19/2002 36.25XO Communications, Inc. Senior Discount Notes 10.500 210.63 9/30/2002 NAXO Communications, Inc. Senior Notes 11.875 114.5 12/19/2002 NAXO Communications, Inc. Senior Notes 11.875 114.5 12/19/2002 NAXO Communications, Inc. Senior Notes 11.875 114.5 12/19/2002 NAXO Communications, Inc. Senior Discount Notes 12.125 269.6 12/19/2002 NAXO Communications, Inc. Senior Discount Notes 14.000 418.0 12/30/2002 NAXO Communications, Inc. Senior Discount Notes 12.000 270.0 12/30/2002 NA
8242
4081 Firms 95532.65 Average Price 18.67$
251 IssuesWeighted Average Price 17.26$
Standard Deviation 14.03$
50387.78 52.0%

YEAR1998 8 $20.81 $18.841999 16 $23.47 $25.582000 18 $24.50 $24.692001 118 $18.69 $16.072002 88 $19.38 $16.56
248 $19.73 $17.57
* Includes Wireless Equipment and Satellite Telecommunication Companies in addition to Telecommunication Service Companies.
Source: Authors' compilation from various Dealer Quotes.
FIGURE 19
AVERAGE RECOVERY PRICE
WEIGHTED AVERAGENUMBER OF ISSUES
AVERAGE RECOVERY RATES FOR TELECOM FIRMS: 1998 - 2002 BY YEAR

FIGURE 20
AVERAGE PRICE AFTER DEFAULT BY ORIGINAL BOND RATING(1971 - 2002)
Rating No. of Average Weighted Median Std. Minimum MaximumObservations Price Average Price Price Dev. Price PriceNo. of Obs. Average Price Wgtd. Avg. Price Median Price Std. Dev. Min. Price Max. Price
AAA 7 $68.34 $76.99 $71.88 $20.82 $32.00 $97.00AA 22 $57.01 $75.01 $54.00 $25.12 $17.80 $99.88A 102 $55.37 $48.93 $55.32 $26.77 $5.25 $100.00BBB 219 $41.39 $27.38 $39.00 $22.65 $3.00 $103.00BB 156 $34.57 $29.99 $32.30 $21.95 $2.06 $107.75B 842 $30.90 $27.02 $25.30 $22.51 $0.42 $112.00CCC 165 $36.62 $32.50 $29.63 $27.58 $0.59 $103.25
Total/Avg. 1513a $35.65 $29.57 $31.74 $24.53 $0.42 $112.00
*Total amount defaulted: $264.5 billionSource: Authors' Compilation

Years To No. of AverageDefault Observations Price
1 137 $29.662 295 $30.183 330 $27.394 260 $33.745 190 $33.316 127 $43.997 87 $34.438 51 $30.439 35 $36.97
10 82 $35.73
All 1594 $32.29
Source: Authors' Compilation
FIGURE 21
AVERAGE PRICE AT DEFAULTBY NUMBER OF YEARS AFTER ISSUANCE
(1971 - 2002)

Number % Number % Number %
AAA 5 0% 0 0% 0 0%
AA 27 1.7% 0 0.0% 0 0.0%
A 115 7.1% 12 0.9% 14 1.1%
BBB 228 14.1% 127 9.6% 120 9.9%
Total Investment Grade 375 22.9% 139 10.5% 134 11.0%
BB 174 10.8% 190 14.4% 184 15.1%
B 882 54.5% 630 47.7% 566 46.5%
CCC 176 10.9% 320 24.2% 278 22.8%
CC 10 0.6% 31 2.3% 45 3.7%
C 1 0.1% 8 0.6% 7 0.6%
D 0 0.0% 4 0.3% 4 0.3%
Total Non Investment Grade 1243 77.1% 1183 89.5% 1084 89.0%
Total 1618 100% 1322 100% 1218 100%
(a) Based on S&P Bond Ratings
Source: Author's Compilation
RATING 12 m BEFORE DEFAULT
FIGURE 22
RATING DISTRIBUTION OF DEFAULTED ISSUES (a)AT VARIOUS POINTS PRIOR TO DEFAULT
(1971-2002)
ORIGINAL RATING RATING 6m BEFORE DEFAULT

1 2 3 4 5 6 7 8 9 10
AAA Marginal 0.00% 0.00% 0.00% 0.00% 0.03% 0.00% 0.00% 0.00% 0.00% 0.00%Cumulative 0.00% 0.00% 0.00% 0.00% 0.03% 0.03% 0.03% 0.03% 0.03% 0.03%
AA Marginal 0.00% 0.00% 0.33% 0.17% 0.00% 0.00% 0.00% 0.00% 0.03% 0.02%Cumulative 0.00% 0.00% 0.33% 0.50% 0.50% 0.50% 0.50% 0.50% 0.53% 0.55%
A Marginal 0.01% 0.10% 0.02% 0.09% 0.04% 0.10% 0.05% 0.20% 0.11% 0.06%Cumulative 0.01% 0.11% 0.13% 0.22% 0.26% 0.36% 0.41% 0.61% 0.72% 0.78%
BBB Marginal 0.25% 3.42% 1.52% 1.44% 0.92% 0.57% 0.80% 0.26% 0.17% 0.35%Cumulative 0.25% 3.66% 5.13% 6.49% 7.35% 7.88% 8.62% 8.85% 9.01% 9.33%
BB Marginal 1.23% 2.62% 4.53% 2.15% 2.49% 1.14% 1.67% 0.67% 1.76% 3.78%Cumulative 1.23% 3.82% 8.17% 10.15% 12.39% 13.39% 14.83% 15.40% 16.89% 20.03%
B Marginal 3.19% 7.14% 7.85% 8.74% 6.22% 4.28% 3.88% 2.39% 2.07% 0.87%Cumulative 3.19% 10.10% 17.16% 24.40% 29.10% 32.14% 34.77% 36.33% 37.65% 38.19%
CCC Marginal 6.70% 14.57% 16.16% 11.28% 3.36% 10.26% 5.35% 3.25% 0.00% 4.18%Cumulative 6.70% 20.29% 33.17% 40.71% 42.70% 48.58% 51.33% 52.92% 52.92% 54.88%
(a) Rated by S&P at IssuanceBased on 1,513 issuesSource: Standard & Poor's (New York) and Author's Compilation
Figure 23
MORTALITY RATES BY ORIGINAL RATING - ALL RATED CORPORATE BONDS (a)
(1971 - 2002)
Years after issuance
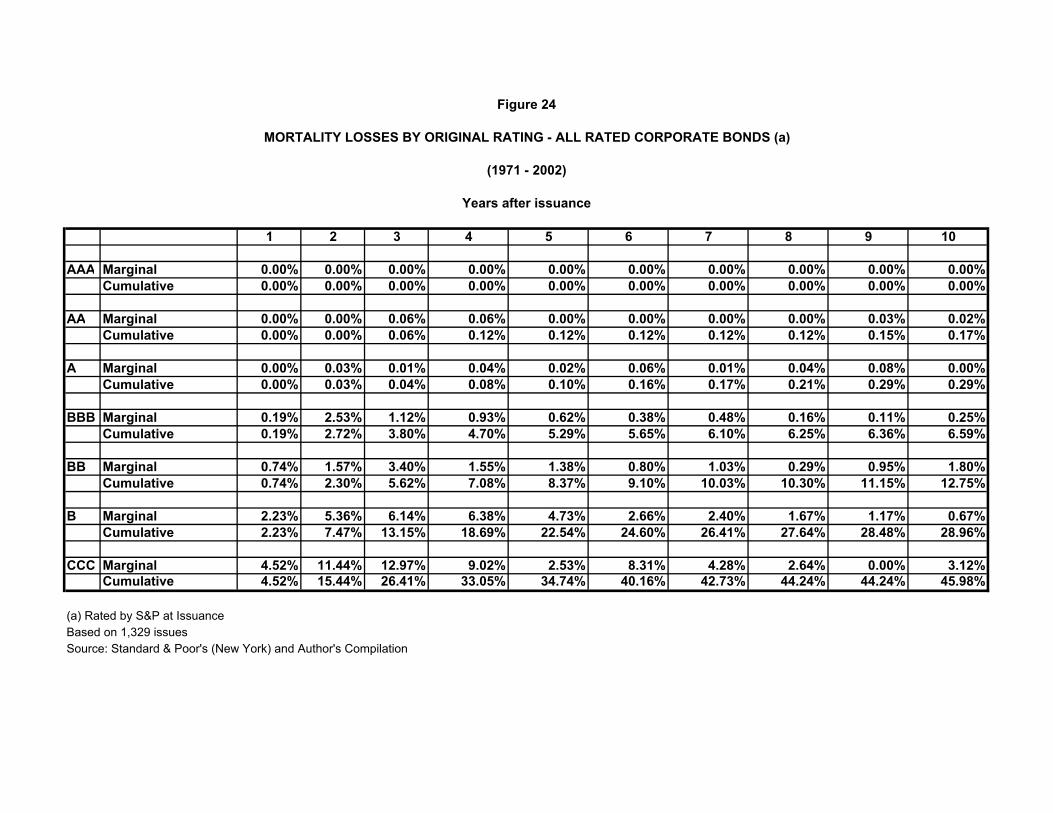
1 2 3 4 5 6 7 8 9 10
AAA Marginal 0.00% 0.00% 0.00% 0.00% 0.00% 0.00% 0.00% 0.00% 0.00% 0.00%Cumulative 0.00% 0.00% 0.00% 0.00% 0.00% 0.00% 0.00% 0.00% 0.00% 0.00%
AA Marginal 0.00% 0.00% 0.06% 0.06% 0.00% 0.00% 0.00% 0.00% 0.03% 0.02%Cumulative 0.00% 0.00% 0.06% 0.12% 0.12% 0.12% 0.12% 0.12% 0.15% 0.17%
A Marginal 0.00% 0.03% 0.01% 0.04% 0.02% 0.06% 0.01% 0.04% 0.08% 0.00%Cumulative 0.00% 0.03% 0.04% 0.08% 0.10% 0.16% 0.17% 0.21% 0.29% 0.29%
BBB Marginal 0.19% 2.53% 1.12% 0.93% 0.62% 0.38% 0.48% 0.16% 0.11% 0.25%Cumulative 0.19% 2.72% 3.80% 4.70% 5.29% 5.65% 6.10% 6.25% 6.36% 6.59%
BB Marginal 0.74% 1.57% 3.40% 1.55% 1.38% 0.80% 1.03% 0.29% 0.95% 1.80%Cumulative 0.74% 2.30% 5.62% 7.08% 8.37% 9.10% 10.03% 10.30% 11.15% 12.75%
B Marginal 2.23% 5.36% 6.14% 6.38% 4.73% 2.66% 2.40% 1.67% 1.17% 0.67%Cumulative 2.23% 7.47% 13.15% 18.69% 22.54% 24.60% 26.41% 27.64% 28.48% 28.96%
CCC Marginal 4.52% 11.44% 12.97% 9.02% 2.53% 8.31% 4.28% 2.64% 0.00% 3.12%Cumulative 4.52% 15.44% 26.41% 33.05% 34.74% 40.16% 42.73% 44.24% 44.24% 45.98%
(a) Rated by S&P at IssuanceBased on 1,329 issuesSource: Standard & Poor's (New York) and Author's Compilation
Figure 24
MORTALITY LOSSES BY ORIGINAL RATING - ALL RATED CORPORATE BONDS (a)
(1971 - 2002)
Years after issuance

RETURN(%) PROMISED YIELD(%)YEAR HY TREAS SPREAD HY TREAS SPREAD2002 (1.53) 14.66 (16.19) 12.38 3.82 8.562001 5.44 4.01 1.43 12.31 5.04 7.272000 (5.68) 14.45 (20.13) 14.56 5.12 9.441999 1.73 (8.41) 10.14 11.41 6.44 4.971998 4.04 12.77 (8.73) 10.04 4.65 5.391997 14.27 11.16 3.11 9.20 5.75 3.451996 11.24 0.04 11.20 9.58 6.42 3.161995 22.40 23.58 (1.18) 9.76 5.58 4.181994 (2.55) (8.29) 5.74 11.50 7.83 3.671993 18.33 12.08 6.25 9.08 5.80 3.281992 18.29 6.50 11.79 10.44 6.69 3.751991 43.23 17.18 26.05 12.56 6.70 5.861990 (8.46) 6.88 (15.34) 18.57 8.07 10.501989 1.98 16.72 (14.74) 15.17 7.93 7.241988 15.25 6.34 8.91 13.70 9.15 4.551987 4.57 (2.67) 7.24 13.89 8.83 5.061986 16.50 24.08 (7.58) 12.67 7.21 5.461985 26.08 31.54 (5.46) 13.50 8.99 4.511984 8.50 14.82 (6.32) 14.97 11.87 3.101983 21.80 2.23 19.57 15.74 10.70 5.041982 32.45 42.08 (9.63) 17.84 13.86 3.981981 7.56 0.48 7.08 15.97 12.08 3.891980 (1.00) (2.96) 1.96 13.46 10.23 3.231979 3.69 (0.86) 4.55 12.07 9.13 2.941978 7.57 (1.11) 8.68 10.92 8.11 2.81
ARITHMETIC ANNUAL AVERAGE:1978-2002 10.63 9.49 1.14 12.85 7.84 5.01
COMPOUND ANNUAL AVERAGE:1978-2002 10.00 8.86 1.14
(a) End of year yields.
Source: Salomon Smith Barney Inc.'s High Yield Composite Index
(1978 - 2002)
FIGURE 25
ANNUAL RETURNS, YIELDS AND SPREADSON TEN-YEAR TREASURY (TREAS)AND HIGH YIELD (HY) BONDS (a)

High Yield Bonds vs. 10 Year US T Bonds
FIGURE 26
CUMULATIVE VALUE OF $1000 INVESTMENT: 1978-2002
$0
$2,000
$4,000
$6,000
$8,000
$10,000
$12,000
1977 1980 1983 1986 1989 1992 1995 1998 2001
End of Year
$ V
alue
High YieldBonds
10-Year U.S. T-Bond
Source: Exhibits 27
$8,349
$10,824

1990-2002 (b)
(a) Defined as yield-to-maturity spread greater than or equal to 1000bp over comparable Treasuries(b) Some years not available as no survey results availableSource: Salomon Smith Barney and NYU Salomon Center
FIGURE 27
DISTRESSED (a) AND DEFAULTED DEBT AS APERCENTAGE OF TOTAL HIGH YIELD DEBT MARKET
14%
26%
15%
7% 5% 7%13%
19%
28%
17%
8%
6% 9%
31% 22%
21%
2%3%
0%5%10%15%20%25%30%35%40%45%50%
1990 1992 1993 1995 1998 1999 2000 2001 2002
Defaulted Distressed

Face Value Market Value12/31/2001 12/31/2002 12/31/2001 xFace Value 12/31/2002 xFace Value
Public DebtDefaulted 96.3$ 187.7$ (1) 24.1$ 0.25 37.5$ 0.20
Distressed 160.6$ 204.7$ 80.3$ 0.50 102.4$ 0.50
Total Public 256.9$ 392.5$ 104.4$ 139.9$
Private DebtDefaulted 158.9$ 262.8$ 95.3$ 0.60 157.7$ 0.60
Distressed 265.0$ 286.6$ 198.8$ 0.75 215.0$ 0.75
Total Public 423.9$ 549.5$ 294.1$ 372.7$
Total Public and Private 680.8$ 941.9$ 398.5$ 512.6$
(1) Calculated using: (2001 defaulted population) + (2002 defaults) - (2002 Emergences)(2) For 12/31/01, we use a private/public ratio of 1.65.(3) For 12/31/02, we use a private/public ratio of 1.40.
Sources: Estimated by Professor Edward Altman, NYU Stern School of Business from Salomon Smith Barney’s High Yield Bond Database, NYU Salomon Center Defaulted Bond and Bank Loan Databases.
2001-2002 ($ billion)ESTIMATED FACE AND MARKET VALUES OF DEFAULTED AND DISTRESSED DEBT
FIGURE 28

SIZE OF THE DEFAULTED AND DISTRESSED DEBT MARKET ($ Billions)
$-
$100
$200
$300
$400
$500
$600
$700
$800
$900
$1,000
1990 1992 1993 1995 1998 1999 2000 2001 2002
Face ValueMarket Value
FIGURE 29
Source: Author's compilation

APPENDIX A
2002 DEFAULTED CORPORATE STRAIGHT DEBT
OutstandingCoupon Maturity Amount Default
Company Bond Issue (%) Date ($ MM) DateAAI.Fostergrant Inc. Guaranteed Senior Notes 10.750 7/15/2006 51.9 1/15/2002Adelphia Business Solutions, Inc. Senior Notes 12.250 9/1/2004 250.0 3/1/2002Adelphia Business Solutions, Inc. Senior Subordinated Notes 12.000 11/1/2007 300.0 3/27/2002Adelphia Business Solutions, Inc. Senior Discount Notes 13.000 4/15/2003 326.9 3/27/2002Adelphia Communications Corp. Senior Notes 8.875 1/15/2007 250.0 5/15/2002Adelphia Communications Corp. Senior Notes 10.250 11/1/2006 500.0 6/25/2002Adelphia Communications Corp. Senior Notes 10.250 6/15/2011 1000.0 6/25/2002Adelphia Communications Corp. Senior Notes 9.375 11/15/2009 496.0 5/15/2002Adelphia Communications Corp. Senior Notes 7.875 5/1/2009 300.0 6/25/2002Adelphia Communications Corp. Senior Notes 7.500 1/15/2004 100.0 6/25/2002Adelphia Communications Corp. Senior Notes 7.750 1/15/2009 300.0 6/25/2002Adelphia Communications Corp. Senior Notes 8.125 7/15/2003 150.0 6/25/2002Adelphia Communications Corp. Senior Notes 8.375 2/1/2008 299.4 6/25/2002Adelphia Communications Corp. Senior Notes 8.375 12/15/2004 100.0 5/15/2002Adelphia Communications Corp. Senior Notes 9.250 10/1/2002 325.0 6/25/2002Adelphia Communications Corp. Senior Notes 10.500 7/15/2004 150.0 6/25/2002Adelphia Communications Corp. Senior Notes 9.500 2/15/2004 31.8 6/25/2002Adelphia Communications Corp. Notes 9.875 3/1/2005 130.0 6/25/2002Adelphia Communications Corp. Senior Notes 10.875 10/1/2010 750.0 6/25/2002Adelphia Communications Corp. Senior Notes 9.875 3/1/2007 350.0 6/25/2002Advanced Glassfiber Yarns LLC Senior subordinated notes 9.875 1/15/2009 150.0 7/15/2002Advanced Lighting Technologies Senior Notes 8.000 3/15/2008 100.0 9/15/2002Advantica Restaurant Group, Inc. Senior Notes 11.250 1/15/2008 529.6 3/1/2002AEI Resources, Inc. Senior Subordinated Notes 11.500 12/15/2006 150.0 2/28/2002AEI Resources, Inc. Guaranteed Senior Notes 10.500 12/15/2005 200.0 2/28/2002Aetna Industries, Inc. Senior Notes 11.875 10/1/2006 85.0 2/11/2002Amerco / Uhaul Bonds 7.135 10/15/1949 100.0 10/15/2002AmeriKing/National Restaurant Senior Notes 13.000 5/15/2008 50.0 12/4/2003AmeriKing/National Restaurant Senior Notes 10.750 11/15/2007 50.0 12/4/2003Anchor Glass Container Corp. Senior Notes 11.250 4/1/2005 150.0 4/15/2002Anchor Glass Container Corp. Senior Notes 9.875 3/15/2008 50.0 3/15/2002Anker Coal Group Inc. Senior secured secon priority notes series B 14.250 9/1/2007 92.5 4/1/2002Archibald Candy, Corp. Guaranteed Senior Notes 10.250 7/1/2004 170.0 1/1/2002Asia Global Crossing Senior Notes 13.375 10/15/2010 408.0 11/17/2002AT&T Canada Inc. Senior unsecured notes 7.150 9/23/2004 96.0 9/15/2002AT&T Canada Inc. Senior unsecured notes 7.625 3/15/2005 250.0 9/15/2002AT&T Canada Inc. Senior unsecured notes 7.650 9/15/2006 998.6 9/15/2002Atlantic Express Transportation Corp. Company Guarantee 10.750 2/1/2004 120.0 8/1/2002Atlantic Express Transportation Corp. Company Guarantee 10.750 2/1/2004 120.0 8/1/2002Atlantic Express Transportation Corp. Company Guarantee 10.750 2/1/2004 120.0 8/1/2002Avado Brands Inc. Senior Subordinate Notes 11.750 6/15/2009 100.0 6/4/2002Avado Brands Inc./ Apple South Senior Notes 9.750 6/1/2006 125.0 6/1/2002Bayou Steel Corp Secured Notes 9.500 5/15/2008 120.0 11/15/2002BGF Industries Senior Subordinated Notes 10.250 1/15/2009 100.0 7/16/2002Big City Radio Company Guarantee 11.250 3/15/2005 175.0 9/15/2002Budget Group, Inc. Senior Notes 9.125 4/1/2006 400.0 4/1/2002Carrier1 International S.A. Senior unsecured notes 13.250 2/15/2009 160.0 2/12/2002Carrier1 International S.A. Senior unsecured notes 13.250 2/15/2009 160.0 2/12/2002Century Communications Senior Discount Notes 0.000 1/15/2008 605.0 6/10/2002Century Communications Senior Discount Notes 0.000 1/15/2008 605.0 6/10/2002Century Communications Senior Notes 8.375 12/15/2007 100.0 6/10/2002Century Communications Senior Notes 8.375 11/15/2017 100.0 5/15/2002Century Communications Senior Notes 8.750 10/1/2007 225.0 6/10/2002Century Communications Senior Notes 8.875 1/15/2007 250.0 5/15/2002Century Communications Senior Notes 9.500 3/1/2005 250.0 6/10/2002Century Communications Senior Discount Notes 0.000 3/15/2003 444.0 6/10/2002Completel Europe, NV Guaranteed Senior Notes 14.000 2/15/2009 147.5 5/30/2002Condor Systems Ltd. Company Guarantee 11.875 5/1/2009 99.9 7/29/2002Conseco Inc Company Guarantee 10.750 6/15/2009 362.4 12/17/2002Conseco Inc Company Guarantee 9.000 4/15/2008 400.1 12/17/2002Conseco Inc Company Guarantee 9.000 4/15/2008 399.2 12/17/2002Conseco Inc Company Guarantee 10.750 6/15/2009 362.4 12/17/2002Conseco Inc. Notes 9.000 10/15/2006 150.8 10/15/2002Conseco Inc. Company Guarantee 8.750 8/9/2006 366.3 9/12/2002Conseco Inc. Notes 8.500 10/15/1949 301.3 10/15/2002Conseco Inc. Notes 6.400 2/10/2003 235.1 9/12/2002Conseco Inc. Senior Notes 8.125 2/15/2003 142.3 9/12/2002Conseco Inc. Company Guarantee 6.400 2/10/2004 44.8 9/12/2002Conseco Inc. Company Guarantee 8.750 8/9/2006 366.3 10/15/2002Conseco Inc. Notes 8.750 2/9/2004 421.7 9/12/2002Contour Energy (Kelley) Company Guarantee 10.300 4/15/2003 100.0 7/15/2002Contour Energy (Kelley) Company Guarantee 14.000 10/15/2006 30.0 7/15/2002Contour Energy (Kelley) Senior Subordinated Notes 10.375 10/15/2006 125.0 7/15/2002Contour Energy (Kelley) Company Guarantee 10.375 4/15/2003 125.0 7/15/2002Contour Energy Company Senior Subordinated Notes 10.375 10/15/2006 125.0 4/15/2002Covanta Energy Corp./Ogden Senior unsecured debentures 5.750 3/1/2022 75.0 3/1/2002Covanta Energy Corp./Ogden Senior unsecured debentures 6.000 3/1/2022 85.0 3/1/2002Covanta Energy Corp./Ogden Senior unsecured debentures 9.250 3/1/2022 100.0 3/1/2002Desa International, Inc. Guaranteed Senior Notes 9.875 12/15/2007 130.0 1/8/2002Diva Systems Senior Discount Notes 12.625 3/1/2008 448.7 5/29/2002Diva Systems Senior Discount Notes 13.000 5/15/2006 0.0 5/29/2002Diva Systems Senior Discount Notes 13.000 5/15/2006 47.0 5/29/2002

APPENDIX A
2002 DEFAULTED CORPORATE STRAIGHT DEBTOutstanding
Coupon Maturity Amount DefaultCompany Bond Issue (%) Date ($ MM) DateDiva Systems Senior Discount Notes 13.000 5/15/2006 47.0 5/29/2002Doe Run Resources Corp. Guaranteed Senior Notes 11.250 3/15/2005 200.0 3/15/2002Doe Run Resources Corp. Guaranteed Senior Notes 11.250 3/15/2005 50.0 3/15/2002Doe Run Resources Corp. Guaranteed Senior Notes float 3/15/2003 55.0 3/15/2002Doman Industries, Ltd.a Senior Notes 12.000 7/1/2004 160.0 9/15/2002Doman Industries, Ltd.a Senior Notes 8.750 3/15/2004 388.0 9/15/2002Doman Industries, Ltd.a Senior Notes 8.750 3/15/2004 388.0 3/15/2002Encompass Services Corp. Company Guarantee 10.500 5/1/2009 335.0 11/19/2002Energis PLC Senior unsecured notes 9.750 6/15/2009 200.0 3/15/2002Eott Energy Partners Company Guarantee 11.000 10/1/2009 235.0 10/1/2002Evenflo, Co. Senior Notes 11.750 8/15/2006 110.0 2/15/2002Exide Technologies, Inc. Senior Notes 10.000 4/15/2005 300.0 4/14/2002Flag Telecom Holdings, Ltd. Senior Notes 11.675 3/30/2010 300.0 4/12/2002Flag Telecom Holdings, Ltd. Senior Notes 8.250 1/30/1998 3.4 4/12/2002Flag Telecom Holdings, Ltd. Senior Notes 8.250 1/30/2008 426.6 4/12/2002Florsheim Group, Inc. Senior Notes 12.750 9/1/2002 18.5 3/1/2002Focal Communication Corp Senior Notes 11.875 1/15/2010 114.5 12/19/2002Focal Communication Corp Senior Notes 11.875 1/15/2010 114.5 12/19/2002Focal Communication Corp Senior Notes 11.875 1/15/2010 114.5 12/19/2002Focal Communication Corp Senior Discount Notes 12.125 2/15/2008 269.6 12/19/2002Formica, Corp. Senior Subordinated Notes 10.875 3/1/2009 215.0 3/5/2002Frontiervision/ Adelphia Comunications Senior Discount Notes 11.875 9/15/2007 89.2 6/25/2002Frontiervision/ Adelphia Comunications Senior Discount Notes 11.875 9/15/2007 231.5 6/25/2002Frontiervision/ Adelphia Comunications Senior Subordinated Notes 11.000 10/15/2006 200.0 6/25/2002Galey & Lord, Inc. Senior Subordinated Notes 9.125 3/1/2008 0.5 2/19/2002Galey & Lord, Inc. Guaranteed Senior Notes 9.125 3/1/2008 299.5 2/19/2002Galey & Lord, Inc. Senior Subordinated Notes 9.125 3/1/2008 0.5 2/19/2002Gaylord Container Corp. Senior subordinated notes 9.875 2/15/2008 40.9 3/4/2002Gaylord Container Corp. Senior unsecured subordinated notes 9.875 2/15/2008 40.9 3/4/2002Gaylord Container Corp. Senior unsecured subordinated notes 9.750 6/15/2007 3.4 3/4/2002GenTek Inc Company Guarantee 11.000 8/1/2009 200.0 8/1/2002Glasstech Holding Company Senior Notes 12.750 7/1/2004 70.0 1/30/2002Global Crossing, Ltd. Senior Notes 8.700 8/1/2007 1.9 1/28/2002Global Crossing, Ltd. Guaranteed Senior Notes 8.700 8/1/2007 998.1 1/28/2002Global Crossing, Ltd. Guaranteed Senior Notes 9.125 11/15/2006 900.0 1/28/2002Global Crossing, Ltd. Guaranteed Senior Notes 9.500 11/15/2009 1099.4 1/28/2002Global Crossing, Ltd. Senior Notes 9.500 11/15/2009 0.6 1/28/2002Global Crossing, Ltd. Guaranteed Senior Notes 9.625 5/15/2008 800.0 1/28/2002Global Crossing, Ltd. Notes 9.000 8/15/2021 100.0 1/28/2002Global Crossing, Ltd. Notes 9.300 6/1/2004 20.0 1/28/2002Global Crossing, Ltd. / Frontier Corp Notes 6.000 10/15/2003 200.0 1/28/2002Global Crossing, Ltd. / Frontier Corp Notes 7.250 5/15/2004 300.0 1/28/2002Globix, Corp. Senior Notes 12.500 2/1/2010 600.0 2/1/2002Globix, Corp. Senior Notes 13.000 5/1/2005 1.0 3/1/2002Golden Northwest Aluminum Inc. Company Guarantee 12.000 12/15/2006 150.0 12/15/2002Grant Geophysical Inc Company Guarantee 9.750 2/15/2008 43.6 8/15/2002Heafner Tire Group, Inc. Guaranteed Senior Notes 10.000 5/15/2008 150.0 3/26/2002Holley Pref Prod Company Guarantee 12.250 9/15/2007 150.0 9/23/2002HQ Global Holdings, Inc. Senior Notes 13.500 8/15/2007 0.1 3/13/2002HQ Global Holdings, Inc. Senior Notes 13.500 8/15/2007 125.0 3/13/2002Hudson Respiratory Care, Inc. Senior subordinated notes 9.125 4/15/2008 115.0 4/15/2002Insilco Holding, Co. Guaranteed Senior Notes 12.000 8/15/2007 120.0 2/15/2002IT Group, Inc. Guaranteed Senior Notes 11.250 4/1/2009 225.0 1/16/2002ITC DeltaCom, Inc. Senior Notes 9.500 11/15/2006 100.0 5/14/2002ITC DeltaCom, Inc. Senior Notes 9.750 11/15/2008 125.0 5/14/2002ITC DeltaCom, Inc. Senior Notes 8.875 3/1/2008 160.0 6/25/2002ITC DeltaCom, Inc. Senior Notes 11.000 6/1/2007 130.0 6/25/2002Kaiser Aluminum Corp. Senior Notes 10.875 10/15/2006 50.0 2/12/2002Kaiser Aluminum Corp. Senior Notes 10.875 10/15/2006 175.0 2/12/2002Kaiser Aluminum Corp. Senior Notes 9.875 2/15/1949 177.0 2/12/2002Kaiser Aluminum Corp. Senior Subordinated Notes 12.750 2/1/2003 400.0 2/1/2002Kasper ASL, Ltd. Senior Notes 13.000 3/31/2004 110.0 2/5/2002Key3Media Group Inc Company Guarantee 11.250 6/15/2011 290.0 12/17/2002Kmart, Corp. Notes 9.440 7/1/2018 20.9 1/22/2002Kmart, Corp. Senior Secured Notes 8.800 7/1/2010 96.6 1/22/2002Kmart, Corp. Notes 7.390 7/30/2003 2.0 1/22/2002Kmart, Corp. Notes 7.330 7/31/2002 9.9 1/22/2002Kmart, Corp. Notes 7.470 7/31/2002 3.0 1/22/2002Kmart, Corp. Notes 7.540 7/28/2004 5.0 1/22/2002Kmart, Corp. Notes 7.490 7/29/2002 1.0 1/22/2002Kmart, Corp. Notes 7.550 7/27/2004 11.0 1/22/2002Kmart, Corp. Notes 7.500 7/24/2002 3.0 1/22/2002Kmart, Corp. Notes 7.500 7/16/2002 1.0 1/22/2002Kmart, Corp. Notes 7.490 7/16/2002 7.0 1/22/2002Kmart, Corp. Notes 7.750 7/8/2003 1.0 1/22/2002Kmart, Corp. Notes 7.720 7/8/2002 5.0 1/22/2002Kmart, Corp. Notes 7.770 7/2/2002 20.0 1/22/2002Kmart, Corp. Notes 7.760 7/2/2002 3.0 1/22/2002Kmart, Corp. Notes 7.750 7/1/2002 2.0 1/22/2002Kmart, Corp. Notes 7.790 7/8/2004 2.0 1/22/2002Kmart, Corp. Notes 7.760 7/1/2002 2.0 1/22/2002Kmart, Corp. Notes 7.720 6/25/2002 7.5 1/22/2002Kmart, Corp. Notes 7.740 6/25/2002 6.0 1/22/2002

APPENDIX A
2002 DEFAULTED CORPORATE STRAIGHT DEBTOutstanding
Coupon Maturity Amount DefaultCompany Bond Issue (%) Date ($ MM) DateKmart, Corp. Notes 7.910 12/30/2003 1.5 1/22/2002Kmart, Corp. Notes 8.130 12/16/2003 5.0 1/22/2002Kmart, Corp. Notes 8.100 12/16/2002 10.0 1/22/2002Kmart, Corp. Notes 8.850 12/15/2011 22.0 1/22/2002Kmart, Corp. Notes 8.960 12/10/2019 22.0 1/22/2002Kmart, Corp. Notes 8.930 11/29/2016 1.0 1/22/2002Kmart, Corp. Notes 8.920 11/1/2013 10.0 1/22/2002Kmart, Corp. Notes 9.000 12/1/2020 10.0 1/22/2002Kmart, Corp. Notes 8.170 11/26/2004 5.0 1/22/2002Kmart, Corp. Notes 8.180 11/24/2003 4.0 1/22/2002Kmart, Corp. Notes 9.000 12/1/2003 6.0 1/22/2002Kmart, Corp. Notes 8.190 11/24/2003 16.0 1/22/2002Kmart, Corp. Notes 8.200 11/24/2003 6.0 1/22/2002Kmart, Corp. Notes 8.250 11/21/2006 2.0 1/22/2002Kmart, Corp. Notes 8.260 11/20/2006 1.5 1/22/2002Kmart, Corp. Notes 8.250 11/20/2006 5.0 1/22/2002Kmart, Corp. Notes 8.280 11/15/2006 5.0 1/22/2002Kmart, Corp. Pass Thru Certificates 9.350 12/20/2002 68.4 1/22/2002Kmart, Corp. Pass Thru Certificates 8.540 1/2/2015 128.1 1/22/2002Kmart, Corp. Pass Thru Certificates 8.990 7/5/2010 65.3 1/22/2002Kmart, Corp. Pass Thru Certificates 9.780 1/5/2020 82.0 1/22/2002Kmart, Corp. Senior Notes 9.875 6/15/2008 430.0 1/22/2002Kmart, Corp. Senior Notes 9.375 2/1/2006 400.0 1/22/2002Kmart, Corp. Senior Notes 8.375 12/1/2004 300.0 1/22/2002Kmart, Corp. Lease Certificates 6.000 1/1/2008 28.6 1/22/2002Kmart, Corp. Notes 12.550 7/1/2010 1.3 1/22/2002Kmart, Corp. Senior Notes 12.500 3/1/2005 100.0 1/22/2002Kmart, Corp. Senior Notes 7.950 2/1/2023 300.0 1/22/2002Kmart, Corp. Senior Notes 7.750 10/1/2012 200.0 1/22/2002Kmart, Corp. Senior Notes 8.375 7/1/2022 100.0 1/22/2002Kmart, Corp. Senior Notes 8.250 1/1/2022 100.0 1/22/2002Kmart, Corp. Notes 8.125 12/1/2006 200.0 1/22/2002Knology Holdings Senior Discount Notes 11.875 10/15/2007 379.9 9/19/2002KPN Qwest Senior Notes 8.125 6/1/2009 450.0 5/23/2002Logix Communications Enterprises, Inc. Senior Notes 12.250 6/15/2008 86.9 2/28/2002Mattress Discounters Corp. Senior unsecured notes 12.625 7/15/2007 140.0 7/15/2002Metromedia International Senior Discount Notes 10.500 9/30/2007 210.6 9/30/2002Microcell Telecommunications Senior Discount Notes 14.000 6/1/2006 418.0 12/30/2002Microcell Telecommunications Senior Discount Notes 12.000 6/1/2009 270.0 12/30/2002Millenium Seacarriers, Inc. Guaranteed Senior Notes 12.000 7/15/2005 100.0 1/15/2002Mpower Holding, Corp. Senior Notes 13.000 4/1/2010 380.6 4/8/2002Mpower Holding, Corp. Senior Notes 13.000 10/1/2004 56.1 4/8/2002National Steel Corp. 1st. Mortgage 9.875 3/1/2009 300.0 3/6/2002National Steel Corp. 1st. Mortgage 8.375 8/1/2006 64.5 3/6/2002Neon Communications, Inc. Senior Notes 12.750 8/15/2008 180.0 2/15/2002Nextel International, Inc. Senior Notes 12.750 8/1/2010 456.0 2/1/2002Nextel Intl Inc Senior Discount Notes 12.125 4/15/2008 696.8 5/24/2002Nextel Intl Inc Senior Discount Notes 12.125 4/15/2008 0.3 5/24/2002Nextel Intl Inc Senior Discount Notes 12.125 4/15/2008 0.3 5/24/2002Nextel Intl Inc Senior Discount Notes 12.125 4/15/2008 0.3 5/24/2002NRG Energy Inc. Senior Notes 7.750 4/1/2011 350.0 11/1/2002NRG Energy Inc. Senior Notes 8.625 4/1/1931 500.0 11/1/2002NRG Energy Inc. Senior unsecured notes 8.250 9/15/2010 350.0 9/15/2002NRG Energy Inc. Senior Notes 8.700 3/15/2005 250.0 11/22/2002NRG Energy Inc. - NRG South Central Generating LLC Senior secured bonds series A 8.962 3/15/2016 450.8 9/15/2002NRG Energy Inc. - NRG South Central Generating LLC Senior secured bonds series B 9.479 9/15/2024 300.0 9/15/2002NTL Inc / Diamond Cable Communications PLC Senior unsecured notes 9.125 2/1/2008 109.9 4/1/2002NTL Inc / Diamond Cable Communications PLC Senior unsecured discount notes 10.750 2/15/2007 404.4 4/1/2002NTL Inc / Diamond Cable Communications PLC Senior unsecured discount notes 11.750 12/15/2005 518.6 4/1/2002NTL Inc / Diamond Cable Communications PLC Senior unsecured discount notes 13.250 9/30/2004 267.5 4/1/2002NTL, Inc. Senior Notes 12.375 10/1/2008 450.0 4/1/2002NTL, Inc. Senior Notes 11.500 10/1/2008 625.0 4/1/2002NTL, Inc. Senior Notes 9.750 4/1/2008 1299.0 4/1/2002NTL, Inc. Senior Notes 11.875 10/1/2010 500.0 4/1/2002NTL, Inc. Senior Notes 10.000 2/15/2007 400.0 4/1/2002NTL, Inc. Senior Notes 11.500 2/1/2006 1050.0 4/1/2002NTL, Inc. / Intl Cable Tel Senior Notes 12.750 4/15/2005 277.8 4/1/2002Oakwood Homes Senior Notes 7.875 3/1/2004 130.0 11/15/2002Oakwood Homes Senior Notes 8.125 3/1/2009 183.0 11/15/2002Olympus Communications/ Adelphia Comm Senior Notes 10.625 11/15/2006 200.0 5/15/2002Orius, Corp. Guaranteed Senior Notes 12.750 2/1/2010 150.0 2/1/2002Outsourcing Solutions Senior Subordinated Notes 11.000 11/1/2006 100.0 11/1/2002Panaco Inc, Senior Notes 10.625 10/1/2004 99.5 7/16/2002Pentacon, Inc Guaranteed Senior Notes 12.250 4/1/2009 100.0 4/1/2002PG&E National Energy Group Senior Notes 10.375 5/16/2011 1000.0 11/14/2002Pinnacle Holdings Senior Discount Notes 10.000 3/15/2008 315.4 5/21/2002Polymer Group, Inc. Guaranteed Senior Notes 8.750 3/1/2008 200.0 1/2/2002Polymer Group, Inc. Guaranteed Senior Notes 9.000 7/1/2007 400.0 1/2/2002Pueblo Xtra International Inc. Senior unsecured notes series B 9.500 8/1/2003 55.4 8/1/2002Pueblo Xtra International Inc. Senior unsecured notes 9.500 8/1/2003 121.9 8/1/2002Reunion Industries Senior Notes 13.000 5/1/2003 25.0 11/18/2002Roma Restaurant Holdings Inc. Company Guarantee 12.000 7/1/2006 57.0 7/1/2002Seven Seas Petroleum Inc. Senior Notes 12.000 11/7/2004 22.5 12/27/2002

APPENDIX A
2002 DEFAULTED CORPORATE STRAIGHT DEBTOutstanding
Coupon Maturity Amount DefaultCompany Bond Issue (%) Date ($ MM) DateSeven Seas Petroleum Inc. Senior Notes 12.500 5/15/2005 110.0 12/27/2002SF Holdings Group Inc. Senior secured notes 12.75% 3/15/2008 144.0 3/1/2002Simonds Industries, Inc. Guaranteed Senior Notes 10.250 7/1/2008 100.0 1/1/2002Spectrasite Holdings Senior Notes 12.500 11/15/2010 200.0 9/15/2002Spectrasite Holdings Senior Discount Notes 12.875 3/15/2010 559.8 9/15/2002Spectrasite Holdings Senior Discount Notes 11.250 4/15/2009 586.8 9/15/2002Spectrasite Holdings Senior Discount Notes 12.000 7/15/2008 200.0 9/15/2002Talton Holdings Senior unsecured notes 11.000 6/30/2007 115.0 7/1/2002Teleglobe Holdings(US) Corp Guaranteed Senior Notes 7.200 7/20/2009 600.0 5/15/2002Teleglobe Holdings(US) Corp Guaranteed Senior Notes 7.700 7/20/2029 400.0 5/15/2002TransTexas Company Guarantee 15.000 3/15/2005 200.0 11/14/2002Tri-Union Company Guarantee 12.500 6/1/2006 110.0 6/1/2002Tri-Union Company Guarantee 12.500 6/1/2006 110.0 6/1/2002Tri-Union Company Guarantee 12.500 6/1/2006 110.0 6/1/2002UAL Group Debentures 9.750 8/15/2021 250.0 12/9/2002UAL Group Pass thru certificates 7.730 7/1/2010 325.3 12/9/2002UAL Group Pass thru certificates 6.201 9/1/2008 263.6 12/9/2002UAL Group Pass thru certificates 6.932 9/1/2011 150.2 12/9/2002UAL Group Pass thru certificates 6.071 3/1/2013 261.6 12/9/2002UAL Group Pass thru certificates 7.032 10/1/2010 274.3 12/9/2002UAL Group Pass thru certificates 7.811 10/1/2009 266.7 12/9/2002UAL Group Pass thru certificates 7.762 10/1/2005 148.6 12/9/2002UAL Group Pass thru certificates 8.030 7/1/2011 186.4 12/9/2002UAL Group Debentures 11.210 5/1/2014 371.0 12/9/2002United Intl Holdings, Inc. Senior Notes 11.500 2/1/2010 300.0 2/1/2002United Intl Holdings, Inc. Senior Notes 11.250 2/1/2010 600.0 2/1/2002United Intl Holdings, Inc. Senior Notes 10.875 8/1/2009 800.0 2/1/2002United Intl Holdings, Inc. Senior Discount Notes 10.750 2/15/2008 1375.0 2/1/2002United Pan-Europe Communications NV Discount Debentures 13.75 2/1/2010 1000.0 2/1/2002United Pan-Europe Communications NV Discount Debentures 13.375 8/1/2009 478.0 2/1/2002United Pan-Europe Communications NV Discount Debentures 12.5 8/1/2009 735.0 2/1/2002US Airlines Debentures 10.670 5/1/2004 370.2 12/9/2002US Airways Group Inc. - ETC Repackaging Trust, SeriesEquipment trust certificates series NA 7/18/2010 14.3 8/11/2002US Airways Group Inc. Pass thru certificates 7.890 3/1/2019 466.4 8/11/2002US Airways Group Inc. Pass thru certificates 7.076 3/20/2021 443.2 8/11/2002US Airways Group Inc. - ETC Repackaging Trust, SeriesEquipment trust certificates series C 9.503 7/18/2010 6.6 8/11/2002US Airways Group Inc. - Piedmont Aviation Inc. Equipment trust certificates series ABC 12.000 7/15/2010 29.1 7/15/2002US Airways Group Inc. - US Airways Inc. Equipment trust certificates series 1987 D 10.450 1/15/2011 10.7 8/11/2002US Airways Group Inc. - US Airways Inc. Equipment trust certificates series 1987 C 10.450 1/15/2011 10.8 8/11/2002US Airways Group Inc. - US Airways Inc. Equipment trust certificates series 1989 A 9.330 1/1/2006 168.8 8/11/2002US Airways Group Inc. - US Airways Inc. Equipment trust certificates series 1987 A 10.450 1/15/2011 10.8 8/11/2002US Airways Group Inc. - US Airways Inc. Equipment trust certificates series 1987 E 10.450 1/15/2011 10.9 8/11/2002US Airways Group Inc. - US Airways Inc. Equipment trust certificates series 1988 A - D 10.050 7/15/2010 7.8 8/11/2002US Airways Group Inc. - US Airways Inc. Equipment trust certificates series 1987 B 10.450 1/15/2011 10.0 8/11/2002US Airways Group Inc. - US Airways Inc. Equipment trust certificates series 1987 F 10.450 1/15/2011 10.8 8/11/2002Velocita Corp/PF Net Communications Limited Senior Notes 13.750 5/15/2010 56.6 7/20/2002Velocita Corp/PF Net Communications Limited Senior Notes 13.750 5/15/2010 168.4 7/20/2002Venture Holdings Trust Senior subordinated notes 12.000 6/1/2009 125.0 12/1/2002Venture Holdings Trust Company Guarantee 11.000 6/1/2007 125.0 12/1/2002Verado Holdings, Inc. Senior Discount Notes 13.000 4/15/2008 364.5 2/15/2002Viasystems Group Inc. Senior subordinated notes series B 9.750 6/1/2007 100.0 6/1/2002Viasystems Group Inc. Senior subordinated notes 9.750 6/1/2007 400.0 6/1/2002Vicwest Corp Senior Sub Notes 12.500 3/10/2007 84.0 9/10/2002Weirton Steel, Corp. Senior Notes 11.375 7/1/2004 125.0 1/2/2002Williams Communications Group, Inc. Senior Notes 10.700 10/1/2007 500.0 4/22/2002Williams Communications Group, Inc. Senior Notes 10.875 10/1/2009 1500.0 4/22/2002Williams Communications Group, Inc. Senior Notes 11.875 8/1/2010 5.1 4/22/2002Williams Communications Group, Inc. Senior Notes 11.875 8/1/2010 419.9 4/22/2002Williams Communications Group, Inc. Senior Notes 11.700 8/1/2008 575.0 4/22/2002Windsor Woodmont Black Hawk Resort Corp. Senior secured first mortgage notes 13.000 3/15/2005 100.0 9/15/2002WKI Holdings Senior Subordinated Notes 9.625 5/1/2008 200.0 5/1/2002WorldCom Senior Notes 7.250 5/15/2008 500.0 7/21/2002WorldCom Notes 6.750 5/15/2008 1250.0 7/21/2002WorldCom Notes 6.500 5/15/2004 1500.0 7/21/2002WorldCom Notes 7.500 5/15/2011 4000.0 7/21/2002WorldCom Bonds 8.250 5/15/1931 4600.0 7/21/2002WorldCom Notes 7.375 1/15/2003 1000.0 7/21/2002WorldCom Notes 7.875 5/15/2003 1000.0 7/21/2002WorldCom Notes 8.000 5/15/2006 1250.0 7/21/2002WorldCom Notes 8.250 5/15/2010 1250.0 7/21/2002WorldCom Senior Notes 6.250 8/15/2003 600.0 7/21/2002WorldCom Notes 6.950 8/15/2028 1750.0 7/21/2002WorldCom Senior Notes 6.400 8/15/2005 2250.0 7/21/2002WorldCom Senior Notes 7.750 4/1/2027 300.0 7/21/2002WorldCom Senior Notes 7.550 4/1/2004 600.0 7/21/2002WorldCom Senior Notes 7.750 4/1/2007 1100.0 7/21/2002WorldCom Debentures 7.750 3/15/2024 240.0 7/21/2002WorldCom Notes 7.375 1/15/2006 1000.0 7/21/2002WorldCom Senior Notes 6.500 4/15/2010 500.0 7/21/2002WorldCom Debentures 7.125 6/15/2027 500.0 7/21/2002WorldCom/Brooks Fiber Senior Notes 10.000 6/1/2007 9.0 7/21/2002WorldCom/Intermedia Senior Sub Notes 12.250 3/1/2009 246.2 7/21/2002WorldCom/Intermedia Senior Notes 9.500 3/1/2009 122.6 7/21/2002

APPENDIX A
2002 DEFAULTED CORPORATE STRAIGHT DEBTOutstanding
Coupon Maturity Amount DefaultCompany Bond Issue (%) Date ($ MM) DateWorldCom/Intermedia Senior Notes 8.600 6/1/2008 198.6 7/21/2002WorldCom/Intermedia Senior Notes 8.500 1/15/2008 123.9 7/21/2002WorldCom/Intermedia Senior Notes 8.875 11/1/2007 116.8 7/21/2002WorldCom/Intermedia Senior Discount Notes 11.250 7/15/2007 319.9 7/21/2002WorldCom/Intermedia Senior Discount Notes 11.250 7/15/2007 319.9 7/21/2002WorldCom/Intermedia Senior Discount Notes 11.250 7/15/2007 319.9 7/21/2002WorldCom/MCI Debentures 8.250 1/20/2023 200.0 7/21/2002WorldCom/MCI Debentures 7.500 8/20/2004 400.0 7/21/2002WorldCom/MCI Debentures 7.750 3/23/2025 450.0 7/21/2002WorldCom/MCI Senior Notes 6.950 8/15/2006 300.0 7/21/2002York Research Corp Senior Secured Notes 12.000 10/30/2007 150.0 6/7/2002Ziff Davis Media Company Guarantee 12.000 7/15/2010 250.0 7/15/2002
Less: a Outstanding Amounts in Grace Period -388.0
Total 96,857.8Total Number of Issues 344Total Number of Companies 112
* Coupon is in grace period.

APPENDIX B
QUARTERLY HIGH YIELD DEBT MARKET DEFAULT RATE COMPARISON: ALTMAN AND MOODY'S 1990-2002
PAR VALUE DEBT DEBT DEFAULTED QUARTERLY ALTMAN/NYU-SC MOODY'SOUTSTANDING BY QUARTER DEFAULT 12M MOVING 12M MOVING
QUARTER ($BILLIONS) ($BILLIONS) RATES (%) AVERAGE AVERAGE
1990 1Q $185.00 $4.16 2.25% 6.51%2Q $185.00 2.51 1.36% 7.93%3Q $181.00 6.01 3.32% 8.99%4Q $181.00 5.67 3.13% 10.14% 9.74%
$18.35
1991 1Q $182.00 $8.74 4.80% 12.67% 12.28%2Q $182.00 2.75 1.51% 12.73% 13.00%3Q $183.00 5.01 2.74% 12.18% 11.97%4Q $183.00 2.36 1.29% 10.31% 10.42%
$18.86
1992 1Q $183.20 $3.33 1.82% 7.35% 7.76%2Q 151.10 1.26 0.83% 6.52% 6.19%3Q 163.00 0.37 0.23% 4.84% 5.58%4Q 151.89 0.59 0.39% 3.40% 5.16%
$5.55
1993 1Q $193.23 $0.38 0.20% 1.71% 4.98%2Q 193.23 1.33 0.69% 1.39% 4.59%3Q 206.91 0.05 0.03% 1.22% 4.23%4Q 190.42 0.52 0.27% 1.10% 3.84%
$2.29
1994 1Q $232.60 $0.67 0.29% 1.35% 3.14%2Q 230.00 0.16 0.07% 0.60% 2.02%3Q 235.00 0.41 0.17% 0.76% 2.33%4Q 235.00 2.18 0.93% 1.45% 2.07%
$3.42
1995 1Q $240.00 $0.17 0.07% 1.24% 1.40%2Q 240.00 1.68 0.70% 1.85% 2.39%3Q 240.00 0.98 0.41% 2.09% 2.70%4Q 240.00 1.72 0.72% 1.90% 3.65%
$4.55
1996 1Q $255.00 $0.44 0.17% 2.01% 3.80%2Q $255.00 $0.89 0.35% 1.58% 3.08%3Q $271.00 $0.41 0.15% 1.36% 2.29%4Q $271.00 $1.59 0.59% 1.23% 1.93%
$3.34
1997 1Q $296.00 $1.85 0.63% 1.75% 1.85%2Q $318.40 $0.60 0.19% 1.51% 1.89%3Q $335.40 $1.48 0.44% 1.74% 2.40%4Q $335.40 $0.27 0.08% 1.25% 2.17%
$4.20
1998 1Q $379.00 $2.37 0.63% 1.41% 2.66%2Q $425.70 $1.22 0.29% 1.41% 2.99%3Q $465.50 $1.62 0.35% 1.29% 2.75%4Q $481.60 $2.26 0.47% 1.60% 3.81%
$7.46
1999 1Q $515.00 $4.76 0.92% 2.05% 3.87%2Q $537.20 $8.42 1.57% 3.31% 5.12%3Q $567.40 $5.24 0.92% 3.85% 5.91%4Q $580.00 $5.11 0.88% 4.15% 5.77%
$23.53
2000 1Q $584.00 $6.06 1.04% 4.28% 5.69%2Q $595.60 $9.97 1.67% 4.52% 5.52%3Q $597.50 $4.32 0.72% 4.27% 5.23%4Q $608.15 $9.95 1.64% 5.07% 5.65%
$30.29
2001 1Q $613.20 $18.07 2.95% 6.96% 7.42%2Q $648.60 $12.82 1.98% 7.37% 7.92%3Q $649.00 $14.65 2.26% 8.56% 9.17%4Q $647.70 $18.07 2.79% 9.80% 11.11%
$63.61
2002 1Q $669.00 $18.54 2.77% 9.89% 11.24%2Q $674.00 $27.07 4.02% 11.71% 10.29%3Q $757.00 $37.48 4.95% 15.01% 9.01%4Q $756.30 $13.77 1.82% 12.79% 7.22%
$96.86
Source: Altman (1990 - 2002), Salomon Smith Barney and Moody's (New York).

CONSECO INC. Dec-02 $56,639T WORLDCOM INC. Jul-02 $45,984
UAL CORPORATION Dec-02 $22,164CONSECO FINANCE CORP. Dec-02 $20,279ADELPHIA COMMUNIATIONS CORP. Jun-02 $17,349
T GLOBAL CROSSING, LTD. Jan-02 $14,639T NTL, INC. May-02 $14,134
NRG ENERGY Nov-02 $10,657US AIRWAYS GROUP Aug-02 $10,640KMART, CORP. Jan-02 $10,263UNITED PAN-EUROPE COMMUNICATIONS NV Dec-02 $10,086
T WILLIAMS COMMUNICATIONS GROUP, INC. Apr-02 $7,154T XO COMMUNICATIONS, INC. Jun-02 $5,851T MCLEOD USA, INC. Jan-02 $4,419
BUDGET GROUP Aug-02 $4,334T METROMEDIA FIBER NETWORK,INC May-02 $4,007T GLOBALSTAR, LP Feb-02 $3,328
KAISER ALUMINUM, CORP. Feb-02 $3,129GENUITY INC. Nov-02 $3,102
T FLAG TELECOM HOLDINGS, LTD. Apr-02 $3,047COVANTA ENERGY, CORP. Apr-02 $3,031
T NEXTEL INTERNATIONAL Inc. May-02 $3,000AEI RESOURCES, INC. Feb-02 $2,746EXIDE TECHNOLOGIES, INC. Apr-02 $2,524
T SPECTRASITE HOLDINGS, INC. Nov-02 $2,482FARMLAND INDUSTIES May-02 $2,352
T CENTURY COMMUNICATIONS CORP Jun-02 $2,230NATIONAL STEEL CORP. Mar-02 $2,119HIGHLANDS INSURANCE GROUP, INC. Nov-02 $1,979
T ASIA GLOBAL CROSSING LTD. Nov-02 $1,869DADE BEHRING HOLDINGS INC Aug-02 $1,809ENCOMPASS SERVICES CORPORATION Nov-02 $1,725ADELPHIA BUSINESS SOLUTIONS, INC. Mar-02 $1,654GENTEK Oct-02 $1,307
T IMPSAT FIBER NETWORKS, INC. Jun-02 $1,216IT GROUP, INC. Jan-02 $1,087EOTT ENERGY PARTNERS Oct-02 $1,062WKI HOLDING COMPANY, INC May-02 $1,002PINNACLE HOLDINGS May-02 $951
T METROCALL Jun-02 $937STOCKWALK GROUP, INC. Feb-02 $903FORMICAM, CORP. Mar-02 $817OXFORD AUTOMOTIVE, INC. Jan-02 $771FRONTLINE CAPITAL GROUP Jun-02 $760GALEY & LORD, INC. Feb-02 $755CONSOLIDATED FREIGHTWAYS CORPORATION Sep-02 $733SLI INC. Sep-02 $726
T GLOBIX, CORP. Mar-02 $717ORIUS CORPORATION Nov-02 $705OAKWOOD HOMES CORPORATION Nov-02 $684
T GILAT SATELLITE NETWORKS LTD. Nov-02 $681SPECIAL METALS, CORP. Mar-02 $667BIRMINGHAM STEEL CORP Jun-02 $654PEREGRINE SYSTEMS INC Sep-02 $614
T MOTIENT, CORP. Jan-02 $610T FOCAL COMMUNICATIONS CORPORATION Dec-02 $606
APW LTD May-02 $588ANCHOR GLASS CONTAINER, CORP. Apr-02 $578GENEVA STEEL HOLDINGS Sep-02 $571
T MPOWER HOLDING, CORP. Apr-02 $518T BENEDEK COMMUNICATIONS, CORP. Mar-02 $515
LEINER HEALTH PRODUCTS, INC. Feb-02 $497TOKHEIM CORPORATION Nov-02 $465
T KNOLOGY BROADBAND Sep-02 $455KELLSTROM INDUSTRIES, INC. Feb-02 $444INSILCO TECHNOLOGIES INC. Dec-02 $418
APPENDIX C
Chapter 11 filings in 2002 (YTD) List by liability size - liabilities greater than $100 million

APPENDIX C
Chapter 11 filings in 2002 (YTD) List by liability size - liabilities greater than $100 million
GUILFORD MILLS, INC. Mar-02 $410ADVANCED GLASSFIBER YARNS, LLC Dec-02 $408PHYCOR, INC. Jan-02 $407MED DIVERSIFIED INC. Nov-02 $407ZILOG, INC. Feb-02 $382VISKASE COMPANIES, INC. Nov-02 $372DESA HOLDINGS CORP Jun-02 $361DIVA SYSTEMS May-02 $338PRANDIUM, INC May-02 $337
T VERADO HOLDINGS, INC. Feb-02 $335TRANSTEXAS GAS CORPORATION Nov-02 $329AMERICAN HOME PATIENT Aug-02 $322
T VELOCITA Jul-02 $313COHO ENEREGY, INC. Feb-02 $305
T COMPLETEL EUROPE,NV May-02 $298T USINTERNETWORKING, INC. Jan-02 $291
US AGGREGATES, INC. Mar-02 $290AMERIKING INC. Dec-02 $275CONTOUR ENERGY CO. Jul-02 $272UNION ACCEPTANCE CORPORATION Nov-02 $263KASPER ASL, LTD. Feb-02 $255
T NETWORK PLUS, CORP. Feb-02 $251T NEON COMMUNICATIONS INC. Jun-02 $246T LOGIX COMMUNICATIONS ENTERPRISES, INC. Feb-02 $238
HARVARD INDUSTRIES, INC. Jan-02 $234PHYAMERICA PHYSICIAN GROUP, INC. Nov-02 $231JACOBSON STORES, INC. Jan-02 $225YORK RESEARCH CORP Jun-02 $217
T BIRCH TELECOM Aug-02 $215ARCHIBALD CANDY CORP Jun-02 $213MATTRESS DISCOUNTERS CORPORATION Oct-02 $204SEVEN SEAS PETROLEUM INC. Dec-02 $199PENTACON May-02 $191NEWCOR, INC. Feb-02 $187HCI DIRECT, INC. Apr-02 $180PANACO INC. Jul-02 $170INTERNATIONAL FIBERCOM, INC. Feb-02 $169PSC INC. Nov-02 $163PROVELL, INC May-02 $162WINDSOR WOODMONT BLACK HAWK RESORT CORP. Nov-02 $160FLORSHEIM GROUP, INC. Mar-02 $157INTERLIANT Aug-02 $146PRESIDENT CASINOS, INC. Jun-02 $142ICH CORP. Feb-02 $137NEXTCARD INC. Nov-02 $134QUESTRON TECHNOLOGY, INC. Feb-02 $131NEW POWER HOLDINGS, INC. Jun-02 $117EARTHCARE, CO. Apr-02 $105
T TELEGLOBE HOLDINGS(US) CORP. May-02 $100AETNA INDUSTRIES, CORP. Feb-02 $100HOULIHAN'S RESTAURANTS, INC. Jan-02 $100NAPSTER, INC Jun-02 $100VANGUARD AIRLINES INC. Aug-02 $100
$337,370
Telecoms $120,685% Telecom 36%# Telecom 31
Note: Financial Insititutions are not included in this list.Source: Authors' Compilations

COMPANY INDUSTRY COMPANY INDUSTRY
AAI.Fostergrant, Inc. Wholesale Commercial Supplies Insilco Holding, Co. Electronic ComponentsAdelphia Business Solutions, Inc. Cable TV Interliant Managed infrastructure solutionsAdvanced Glassfiber Yarns LLC Textile IT Group, Inc. Waste ManagementAdvantica Restaurant Group, Inc. Retail - Restaurants ITC DeltaCom, Inc. Telecom ServicesAEI Resources, Inc. Mining Kaiser Aluminium, Corp. Aluminum ProductsAetna Industries, Inc. Automotive - Parts Kasper ASL, Ltd. Textiles - ProductsAmerican Home Patient Diagnostic equipment Kmart, Corp. Retail - Variety StoresAmeriKing Retail eating place Knology Broadband Telecom ServicesAnchor Glass Container, Corp. Glass - Products Logix Communications Enterprises, Inc. Telecom ServicesAnker Coal Group Inc. Mining Mattress Discounters Corp. Home furnishingsArchibald Candy, Corp. Confectionery Products Med Diversified Inc. Computer programing & data processingAsia Global Crossing Telecom Millenium Seacarriers, Inc. Deep Sea TransportationAT&T Canada Inc. Telecom Mpower Holding, Corp. Telecomm ServicesAtlantic Express Transportation Corp. Transport Services National Steel, Corp. Steel - ProducersAvado Brands Inc. Retail - Restaurants Neon Communications, Inc. Telecomm EquipmentBGF Industries Textile Fabrics NextCard Inc. Personal Credit InstitutionBirch telecom Telecomm Services Nextel International, Inc. Telecomm ServicesBudget Group Auto rental and leasing NRG Energy EnergyBudget Group, Inc. Services - Auto Rental & Leasing NTL, Inc. Cable TVCarrier1 International S.A. Telecomm Services Oakwood Homes Corporation Mobile HomesCompletel Europe, NV Telecomm Services Orius, Corp. Electrical ServicesCondor Systems Navigation, Guidance, Aeronautical Systems Panaco Oil & Natural GasConseco Finance Corporation Asset Backed Securities Pentacon, Inc Wholesale HardwareConseco Inc Insurance Peregrine Systems Supply Chain Management SoftwareConsolidated Freightways Corp. Road transportation Phyamerica Physician Group, Inc. Healthcare: Specialty Outpatient ServicesContour Energy Company Natural Gas Transmission Pinnacle Holdings REITCovanta Energy Corp./Ogden Power Generation & Producer Polymer Group, Inc. Textiles - ProductsDade Behring Holdings Inc. IV fluid manufacturer / Health Care Prandium Retail - RestaurantsDesa International, Inc. Heating Equipment PSC INC. Computer peripheral equipmentDiva Systems Cable TV Pueblo Xtra International Inc. Food - RetailDoe Run Resources, Corp. Metal Mining Seven Seas Petroleum Inc. Oil & Gas ExplorationDoman Industries, Ltd. Paper Products SF Holdings Group Inc. Paperboard containers & BoxesEnergis PLC Telecomm Services Sheldahl, Inc Technology - PCBsEncompass Services Corporation Construction special Trade Contractors Simonds Industries, Inc. Metalworking Machinery & Equip.EOTT Energy Partners Wholesale Oil transport SLI Inc. Lighting Systems Evenflo, Co. Miscellaneous Manufacturer Spectrasite Communication servicesExide Technologies, Inc. Electrical Storage Taltomn Holdings TelecomFlag Telecom Holdings, Ltd. Telecomm Services Teleglobe Holdings(US) Corp Telecomm ServicesFlorsheim Group, Inc. Retailer - Footwear Tokheim Corporation Refrigeration and Service Industry MachineryFocal Communications Corp. Communication Transtexas Gas Corporation Crude Petroleum and Natural GasFormica, Corp. Plastic Products United Pan-Europe Communications NV Cable ServicesGaley & Lord, Inc. Textiles - Mills Union Acceptance Corporation Personal Credit InstitutionsGaylord Container Corp. Paperboard containers & Boxes US Airways Group AirlinesGeneva Steel Holdings Steel - Producers UAL Corporation AirlinesGentek Inc Auto Parts Vanguard Airlines AirlinesGenuity Inc. Computer programing & data processing Velocita Telecomm ServicesGILAT Satellite Networks Ltd. Communications Equipment Verado Holdings, Inc. Internet ServicesGlasstech Holding Company Glass - Products Viasystems Group Inc. Technology - PCBsGlobal Crossing, Ltd. Telecomm Services Weirton Steel, Corp. Steel - ProducersGlobix Corp. Internet Services Williams Communications Group, Inc. Telecomm ServicesGrant Geophysical Inc Seismic measurement Windsor Woodmont Black Hawk Resort Corp. CasinoHeafner Tire Group, Inc. Tires Manufacturer WKI Holdings Glass ProductsHighlands Insurance Group Insurance WorldCom / MCI Telecomm ServicesHolley Pref Prod Miscellaneous Manufacturer Viskase Companies Inc. PlasticsHQ Global Holdings, Inc. Operator Non-residential Buildings York Research Corp Power Generation & ProducerHudson Respiratory Care, Inc. Surgical and Medical Instruments Ziff Davis Media Publishing
# of Firms 112
# of Communications Firms 26
Source: Author's Compilations
APPENDIX D DEFAULTS BY INDUSTRY
2002