Embed Size (px)
Citation preview

Deep Sequencing Using an Ultra High Resolution Column and Mass Spectrometer for Isomer Separation and Structural Identification of GlycansJulian Saba,1 Udayanath Aich,2 Rosa Viner,1 Xiaodong Liu,2 Srinivasa Rao,2 Jeff Rohrer,2 Andreas Huhmer,1 Chris Pohl2 1Thermo Fisher Scientific, San Jose, CA; 2Thermo Fisher Scientific, Sunnyvale, CA
2 Deep Sequencing Using an Ultra High Resolution Column and Mass Spectrometer for Isomer Separation and Structural Identification of Glycans
Deep Sequencing Using an Ultra High Resolution Column and Mass Spectrometer for Isomer Separation and Structural Identification of Glycans Julian Saba1, Udayanath Aich2, Rosa Viner1, Xiaodong Liu2, Srinivasa Rao2, Jeff Rohrer2, Andreas Huhmer1, Chris Pohl2 1Thermo Fisher Scientific, San Jose, CA; 2Thermo Fisher Scientific, Sunnyvale, CA
Conclusion The GlycanPac AXR-1 column separates glycans based on charge, isomeric
structure, size, and polarity, providing a greater number of resolved peaks compared to existing commercial amide HILIC columns for 2AB-labeled N-linked glycans released from bovine fetuin.
Faster Orbitrap enables higher scan rates at higher resolution. This translates to increased sensitivity and better quality MS/MS data for both abundant and low abundance glycans. Overall, 135 unique glycan structures were identified when the Glycan Pac AXR-1 column was coupled to a Orbitrap Fusion MS.
References 1. Chester, T. L. Anal. Chem. 2013, 85 (2), 579–589.
2. Ruhaak, L. R. et al. Anal. Bioanal. Chem. 2010, 397, 3457–3481.
3. Chen, X. et al. Anal. Biochem. 2007, 370, 147–161.
4. Wheeler et al. Anal. Chem. 2000, 72, 5027–5039.
Overview Purpose: Separation and identification of N-linked glycans using a novel high resolution mixed-mode column and a high resolution mass spectrometer. Methods: Fluorescently labeled glycans from various proteins were separated and analyzed on a Thermo Scientific™ GlycanPac™ AXR-1 column coupled to a Thermo Scientific™ Orbitrap Fusion™ Tribrid™ mass spectrometer. Data analysis was performed using SimGlycan® 4.5 software. Results: Overall, 73 resolved peaks and 135 unique bovine fetuin glycan structures were identified using a combination of a GlycanPac AXR-1 column and an Orbitrap Fusion MS. These numbers exceed what is currently possible with commercially available column technologies.
Introduction Various modes of HPLC separation have been developed for the analysis of glycans1–3. One common separation mode utilizes amide HILIC columns, which separates glycans based on hydrogen bonding, resulting in a size and composition-based separation. Amide HILIC columns are useful for the separation of N-linked glycans released from antibodies, such as mAbs, where the majority of the glycans are neutral. However, these columns do not provide a good separation when glycans are highly charged (charge ≥ 2) such as sialylated N-linked glycans. Here we describe the new mixed-mode column (GlycanPac AXR-1), which provides separation based on isomeric structure along with separation based on charge, size, and polarity. This column is based on mixed-mode column chemistry, combining both weak-anion exchange (WAX) and reversed-phase (RP) retention mechanisms. The WAX functionality provides retention and selectivity for negatively charged glycans, while the RP mode facilitates the separation of glycans of the same charge according to their isomeric structure, polarity, and size. As a result, the GlycanPac AXR-1 column provides greater resolution with more glycan structures identified when coupled to an Orbitrap Fusion MS compared to existing commercial columns for 2AB-labeled N-linked glycans released from bovine fetuin.
Methods Glycans were released from glycoproteins with PNGaseF enzyme (New England BioLabs). The released glycans were labeled with 2AB and 2AA. All glycans were separated on the GlycanPac AXR-1 column (1.9 µm, 2.1 × 150 mm) by the Thermo Scientific™ Dionex™ Ultimate™ 3000 UHPLC instrument with either a fluorescence or MS detector. MS analysis was performed using an Orbitrap Fusion MS in negative ion mode. SimGlycan software was used for MS/MS data analysis.
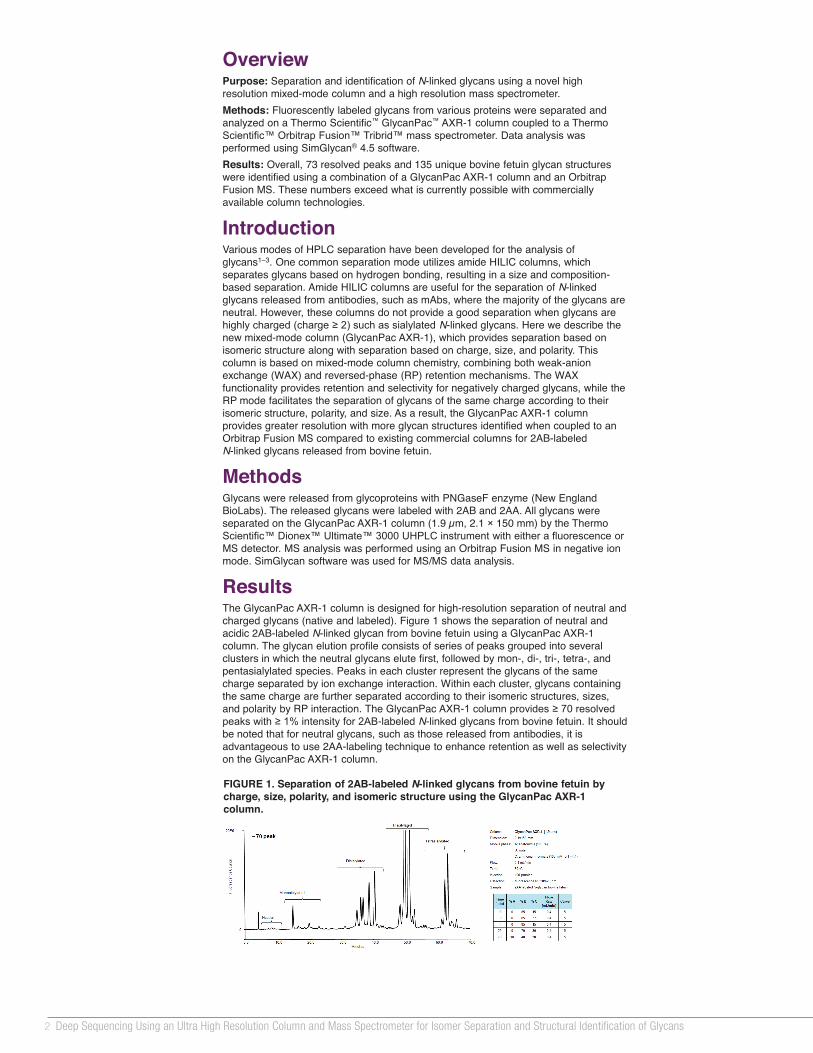
Results The GlycanPac AXR-1 column is designed for high-resolution separation of neutral and charged glycans (native and labeled). Figure 1 shows the separation of neutral and acidic 2AB-labeled N-linked glycan from bovine fetuin using a GlycanPac AXR-1 column. The glycan elution profile consists of series of peaks grouped into several clusters in which the neutral glycans elute first, followed by mon-, di-, tri-, tetra-, and pentasialylated species. Peaks in each cluster represent the glycans of the same charge separated by ion exchange interaction. Within each cluster, glycans containing the same charge are further separated according to their isomeric structures, sizes, and polarity by RP interaction. The GlycanPac AXR-1 column provides ≥ 70 resolved peaks with ≥ 1% intensity for 2AB-labeled N-linked glycans from bovine fetuin. It should be noted that for neutral glycans, such as those released from antibodies, it is advantageous to use 2AA-labeling technique to enhance retention as well as selectivity on the GlycanPac AXR-1 column.
LC-MS/MS Analysis of 2AB-Labeled N-linked Glycans From Bovine Fetuin Using GlycanPac AXR-1 Column
The coupling of the GlycanPac AXR-1 column to MS is particularly attractive because MS enables detailed structural characterization. 2AB-labeled N-linked glycans from bovine fetuin were separated on the GlycanPac AXR-1 column and analyzed on an Orbitrap Fusion MS. The LC-MS profile of the GlycanPac AXR-1 column showed the highest number of resolved peaks (≥ 70) for bovine fetuin glycans ever achieved (Figure 2), exceeding the number the existing commercially available stationary phases can resolve. Most commercial stationary phases are poor for separating glycan structural isomers. A single LC peak using these columns can have many structural isomers. So in most instances, mixed MS2 spectrum are generated that contain fragment ions from multiple glycans making it extremely difficult to assign correct structures. The GlycanPac AXR-1 column can resolve structural isomers (Figure 3). However, the ability to resolve structural isomers introduces complexity to analysis. Namely, far more MS/MS spectra need to be triggered in a single LC-MS2 analysis to identify all the resolved peaks. Additionally, wider dynamic range and sensitivity are needed from MS to detect and generate good quality MS2 spectra not only for the most abundant glycans but the low abundant species as well (Figure 4). Orbitrap Fusion MS with its wide dynamic range and ultrahigh mass resolution makes it the ideal platform for looking deeper into the glycome and confidently identifying low-abundance glycans.
SimGlycan is a registered trademark of PREMIER Biosoft International. All other trademarks are the property of Thermo Fisher Scientific and its subsidiaries.
This information is not intended to encourage use of these products in any manners that might infringe the intellectual property rights of others.
PO64115-EN 0614S
FIGURE 2. LC-MS analysis of 2AB-labeled N-linked glycans from bovine fetuin by the GlycanPac AXR-1 column with MS detection.
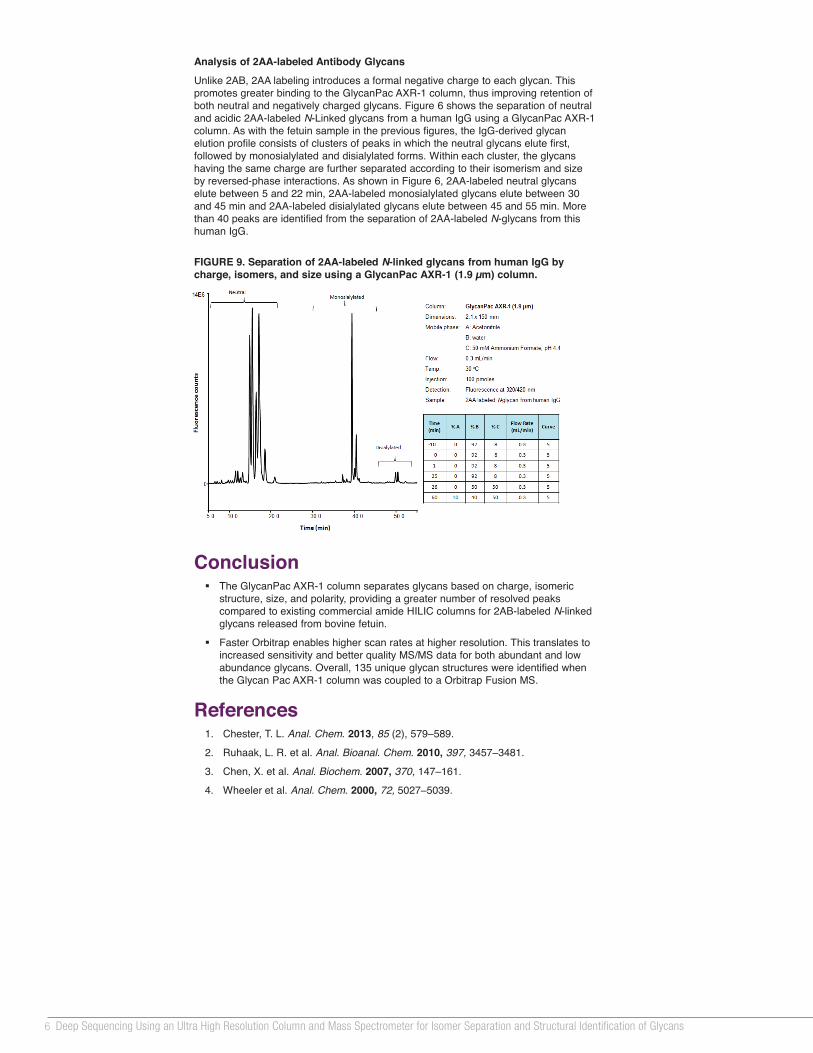
Analysis of 2AA-labeled Antibody Glycans
Unlike 2AB, 2AA labeling introduces a formal negative charge to each glycan. This promotes greater binding to the GlycanPac AXR-1 column, thus improving retention of both neutral and negatively charged glycans. Figure 6 shows the separation of neutral and acidic 2AA-labeled N-Linked glycans from a human IgG using a GlycanPac AXR-1 column. As with the fetuin sample in the previous figures, the IgG-derived glycan elution profile consists of clusters of peaks in which the neutral glycans elute first, followed by monosialylated and disialylated forms. Within each cluster, the glycans having the same charge are further separated according to their isomerism and size by reversed-phase interactions. As shown in Figure 6, 2AA-labeled neutral glycans elute between 5 and 22 min, 2AA-labeled monosialylated glycans elute between 30 and 45 min and 2AA-labeled disialylated glycans elute between 45 and 55 min. More than 40 peaks are identified from the separation of 2AA-labeled N-glycans from this human IgG.
FIGURE 3. Separation of disialylated biantennary glycans from bovine fetuin based on α2-3 and α2-6 sialic acid linkage by the GlycanPac AXR-1 column.
FIGURE 1. Separation of 2AB-labeled N-linked glycans from bovine fetuin by charge, size, polarity, and isomeric structure using the GlycanPac AXR-1 column.
FIGURE 4. LC-MS/MS (HCD) spectra of 2AB-labeled N-linked glycans from bovine fetuin.
Due to the Orbitrap Fusion mass spectrometer’s unique configuration, the Orbitrap mass analysis can be extensively parallelized with operation of the mass selecting quadrupole, the ion routing multipole (IRM, used for both accumulating ions and for HCD fragmentation), and the ion trap. This allows for maximal concurrent ion manipulations and mass analyses, increasing both scan rates and duty cycle of the instrument. Having fast high resolution accurate mass (HR/AM) full scans along with fast MS/MS detection are essential for achieving enough scans across the LC peak widths for full scan quantitation and MS/MS for confirmation. Figure 5 shows the separation and identification of 2 glycan structural isomers. The Orbitrap Fusion MS is fast enough to maintain more than enough full scans (>16 scans) across the peak for precursor quantitation, thereby ensuring that both qualitative and quantitative information can be obtained within a single analysis.
FIGURE 5. The Orbitrap Fusion MS performs fast MS and concurrent MS/MS for optimal qualitative/quantitative workflow. Shown here are extracted ion chromatograms for two glycans separated by LC‐MS. More than enough scans (> 16 scans) across the peak are performed for quantitation. MS spectra were acquired at a resolution of 120,000 (at m/z 200) and MS/MS at a resolution of 30,000 (at m/z 200).
FIGURE 7. LC-MS/MS (HCD) enables linkage and antennae assignment to sialic acid.4
FIGURE 6. LC-MS/MS (HCD) of A) monosialylated biantennary and B) trisialylated triantennary fetuin glycan.
FIGURE 8. A) A glycan that has α2‐6 linked NeuAc and α2‐6 linked NeuGc. The α2‐6 linked NeuAc produces diagnostic fragment ion 0,4A2 – CO2 at m/z 306.119 while α2‐6 linked NeuGc produces diagnostic fragment ion 0,4A2 – CO2 at m/z 322.114. These can be used as signatures to figure out the type of sialic acid linkages that are occurring.4 B) Zoomed in region of the MS/MS spectrum acquired under different resolutions where the diagnostic ions appear. In this Example, α2‐6 linked NeuAc produces diagnostic fragment ion 0,2A4 – CO2 at m/z 306.119. But from the same glycan, the loss of NeuGc results in an ion 306.083. In the zoomed region for MS/MS spectra, notice that at 17.5 K, resolution does not fully resolve these two ions, while 30 K does. C) For the same glycan, NeuGc produces diagnostic fragment ion 0,2A4 – CO2 at m/z 322.114, while the Z1 ion (loss of GlcNAc‐2‐AB) produces fragment at 322.141. Similar to the previous example, it took a resolution of 30 K to fully resolve the ions.
A B
α2 6
α2 6
306.119
- CO2
322.114
- CO2
α2 6
α2 6
α2 6
α2 6
A B
C
FIGURE 9. Separation of 2AA-labeled N-linked glycans from human IgG by charge, isomers, and size using a GlycanPac AXR-1 (1.9 µm) column.
Higher-energy collisional dissociation (HCD) fragmentation was selected for structural elucidation due to the production of both glycosidic and cross-ring fragment ions in the MS2 spectrum. The ability to generate these types of ions at the MS2 level provides sufficient information in a lot of cases to successfully elucidate glycan structures (Figures 6–7). Additionally, these ions are detected within the Orbitrap mass analyzer providing HR/AM fragment ions. This allows for differentiation of near mass fragment ions, which we observed to be useful for correctly assigning branching and linkage (Figure 8). SimGlycan software was used for structural elucidation. Overall, 135 unique glycan structures were identified using a combination of GlycanPac AXR-1 column and Orbitrap Fusion mass spectrometer. A list of the 135 identified glycan structures can be found at http://www.dionex.com/en-us/webdocs/115138-PS-GlycanPac-AXR1-Column-PS20907_E.pdf.

3Thermo Scientific Poster Note • PN-64115-ASMS-EN-0614S
Deep Sequencing Using an Ultra High Resolution Column and Mass Spectrometer for Isomer Separation and Structural Identification of Glycans Julian Saba1, Udayanath Aich2, Rosa Viner1, Xiaodong Liu2, Srinivasa Rao2, Jeff Rohrer2, Andreas Huhmer1, Chris Pohl2 1Thermo Fisher Scientific, San Jose, CA; 2Thermo Fisher Scientific, Sunnyvale, CA
Conclusion The GlycanPac AXR-1 column separates glycans based on charge, isomeric
structure, size, and polarity, providing a greater number of resolved peaks compared to existing commercial amide HILIC columns for 2AB-labeled N-linked glycans released from bovine fetuin.
Faster Orbitrap enables higher scan rates at higher resolution. This translates to increased sensitivity and better quality MS/MS data for both abundant and low abundance glycans. Overall, 135 unique glycan structures were identified when the Glycan Pac AXR-1 column was coupled to a Orbitrap Fusion MS.
References 1. Chester, T. L. Anal. Chem. 2013, 85 (2), 579–589.
2. Ruhaak, L. R. et al. Anal. Bioanal. Chem. 2010, 397, 3457–3481.
3. Chen, X. et al. Anal. Biochem. 2007, 370, 147–161.
4. Wheeler et al. Anal. Chem. 2000, 72, 5027–5039.
Overview Purpose: Separation and identification of N-linked glycans using a novel high resolution mixed-mode column and a high resolution mass spectrometer. Methods: Fluorescently labeled glycans from various proteins were separated and analyzed on a Thermo Scientific™ GlycanPac™ AXR-1 column coupled to a Thermo Scientific™ Orbitrap Fusion™ Tribrid™ mass spectrometer. Data analysis was performed using SimGlycan® 4.5 software. Results: Overall, 73 resolved peaks and 135 unique bovine fetuin glycan structures were identified using a combination of a GlycanPac AXR-1 column and an Orbitrap Fusion MS. These numbers exceed what is currently possible with commercially available column technologies.
Introduction Various modes of HPLC separation have been developed for the analysis of glycans1–3. One common separation mode utilizes amide HILIC columns, which separates glycans based on hydrogen bonding, resulting in a size and composition-based separation. Amide HILIC columns are useful for the separation of N-linked glycans released from antibodies, such as mAbs, where the majority of the glycans are neutral. However, these columns do not provide a good separation when glycans are highly charged (charge ≥ 2) such as sialylated N-linked glycans. Here we describe the new mixed-mode column (GlycanPac AXR-1), which provides separation based on isomeric structure along with separation based on charge, size, and polarity. This column is based on mixed-mode column chemistry, combining both weak-anion exchange (WAX) and reversed-phase (RP) retention mechanisms. The WAX functionality provides retention and selectivity for negatively charged glycans, while the RP mode facilitates the separation of glycans of the same charge according to their isomeric structure, polarity, and size. As a result, the GlycanPac AXR-1 column provides greater resolution with more glycan structures identified when coupled to an Orbitrap Fusion MS compared to existing commercial columns for 2AB-labeled N-linked glycans released from bovine fetuin.
Methods Glycans were released from glycoproteins with PNGaseF enzyme (New England BioLabs). The released glycans were labeled with 2AB and 2AA. All glycans were separated on the GlycanPac AXR-1 column (1.9 µm, 2.1 × 150 mm) by the Thermo Scientific™ Dionex™ Ultimate™ 3000 UHPLC instrument with either a fluorescence or MS detector. MS analysis was performed using an Orbitrap Fusion MS in negative ion mode. SimGlycan software was used for MS/MS data analysis.
Results The GlycanPac AXR-1 column is designed for high-resolution separation of neutral and charged glycans (native and labeled). Figure 1 shows the separation of neutral and acidic 2AB-labeled N-linked glycan from bovine fetuin using a GlycanPac AXR-1 column. The glycan elution profile consists of series of peaks grouped into several clusters in which the neutral glycans elute first, followed by mon-, di-, tri-, tetra-, and pentasialylated species. Peaks in each cluster represent the glycans of the same charge separated by ion exchange interaction. Within each cluster, glycans containing the same charge are further separated according to their isomeric structures, sizes, and polarity by RP interaction. The GlycanPac AXR-1 column provides ≥ 70 resolved peaks with ≥ 1% intensity for 2AB-labeled N-linked glycans from bovine fetuin. It should be noted that for neutral glycans, such as those released from antibodies, it is advantageous to use 2AA-labeling technique to enhance retention as well as selectivity on the GlycanPac AXR-1 column.
LC-MS/MS Analysis of 2AB-Labeled N-linked Glycans From Bovine Fetuin Using GlycanPac AXR-1 Column
The coupling of the GlycanPac AXR-1 column to MS is particularly attractive because MS enables detailed structural characterization. 2AB-labeled N-linked glycans from bovine fetuin were separated on the GlycanPac AXR-1 column and analyzed on an Orbitrap Fusion MS. The LC-MS profile of the GlycanPac AXR-1 column showed the highest number of resolved peaks (≥ 70) for bovine fetuin glycans ever achieved (Figure 2), exceeding the number the existing commercially available stationary phases can resolve. Most commercial stationary phases are poor for separating glycan structural isomers. A single LC peak using these columns can have many structural isomers. So in most instances, mixed MS2 spectrum are generated that contain fragment ions from multiple glycans making it extremely difficult to assign correct structures. The GlycanPac AXR-1 column can resolve structural isomers (Figure 3). However, the ability to resolve structural isomers introduces complexity to analysis. Namely, far more MS/MS spectra need to be triggered in a single LC-MS2 analysis to identify all the resolved peaks. Additionally, wider dynamic range and sensitivity are needed from MS to detect and generate good quality MS2 spectra not only for the most abundant glycans but the low abundant species as well (Figure 4). Orbitrap Fusion MS with its wide dynamic range and ultrahigh mass resolution makes it the ideal platform for looking deeper into the glycome and confidently identifying low-abundance glycans.
SimGlycan is a registered trademark of PREMIER Biosoft International. All other trademarks are the property of Thermo Fisher Scientific and its subsidiaries.
This information is not intended to encourage use of these products in any manners that might infringe the intellectual property rights of others.
PO64115-EN 0614S
FIGURE 2. LC-MS analysis of 2AB-labeled N-linked glycans from bovine fetuin by the GlycanPac AXR-1 column with MS detection.
Analysis of 2AA-labeled Antibody Glycans
Unlike 2AB, 2AA labeling introduces a formal negative charge to each glycan. This promotes greater binding to the GlycanPac AXR-1 column, thus improving retention of both neutral and negatively charged glycans. Figure 6 shows the separation of neutral and acidic 2AA-labeled N-Linked glycans from a human IgG using a GlycanPac AXR-1 column. As with the fetuin sample in the previous figures, the IgG-derived glycan elution profile consists of clusters of peaks in which the neutral glycans elute first, followed by monosialylated and disialylated forms. Within each cluster, the glycans having the same charge are further separated according to their isomerism and size by reversed-phase interactions. As shown in Figure 6, 2AA-labeled neutral glycans elute between 5 and 22 min, 2AA-labeled monosialylated glycans elute between 30 and 45 min and 2AA-labeled disialylated glycans elute between 45 and 55 min. More than 40 peaks are identified from the separation of 2AA-labeled N-glycans from this human IgG.
FIGURE 3. Separation of disialylated biantennary glycans from bovine fetuin based on α2-3 and α2-6 sialic acid linkage by the GlycanPac AXR-1 column.
FIGURE 1. Separation of 2AB-labeled N-linked glycans from bovine fetuin by charge, size, polarity, and isomeric structure using the GlycanPac AXR-1 column.
FIGURE 4. LC-MS/MS (HCD) spectra of 2AB-labeled N-linked glycans from bovine fetuin.
Due to the Orbitrap Fusion mass spectrometer’s unique configuration, the Orbitrap mass analysis can be extensively parallelized with operation of the mass selecting quadrupole, the ion routing multipole (IRM, used for both accumulating ions and for HCD fragmentation), and the ion trap. This allows for maximal concurrent ion manipulations and mass analyses, increasing both scan rates and duty cycle of the instrument. Having fast high resolution accurate mass (HR/AM) full scans along with fast MS/MS detection are essential for achieving enough scans across the LC peak widths for full scan quantitation and MS/MS for confirmation. Figure 5 shows the separation and identification of 2 glycan structural isomers. The Orbitrap Fusion MS is fast enough to maintain more than enough full scans (>16 scans) across the peak for precursor quantitation, thereby ensuring that both qualitative and quantitative information can be obtained within a single analysis.
FIGURE 5. The Orbitrap Fusion MS performs fast MS and concurrent MS/MS for optimal qualitative/quantitative workflow. Shown here are extracted ion chromatograms for two glycans separated by LC‐MS. More than enough scans (> 16 scans) across the peak are performed for quantitation. MS spectra were acquired at a resolution of 120,000 (at m/z 200) and MS/MS at a resolution of 30,000 (at m/z 200).
FIGURE 7. LC-MS/MS (HCD) enables linkage and antennae assignment to sialic acid.4
FIGURE 6. LC-MS/MS (HCD) of A) monosialylated biantennary and B) trisialylated triantennary fetuin glycan.
FIGURE 8. A) A glycan that has α2‐6 linked NeuAc and α2‐6 linked NeuGc. The α2‐6 linked NeuAc produces diagnostic fragment ion 0,4A2 – CO2 at m/z 306.119 while α2‐6 linked NeuGc produces diagnostic fragment ion 0,4A2 – CO2 at m/z 322.114. These can be used as signatures to figure out the type of sialic acid linkages that are occurring.4 B) Zoomed in region of the MS/MS spectrum acquired under different resolutions where the diagnostic ions appear. In this Example, α2‐6 linked NeuAc produces diagnostic fragment ion 0,2A4 – CO2 at m/z 306.119. But from the same glycan, the loss of NeuGc results in an ion 306.083. In the zoomed region for MS/MS spectra, notice that at 17.5 K, resolution does not fully resolve these two ions, while 30 K does. C) For the same glycan, NeuGc produces diagnostic fragment ion 0,2A4 – CO2 at m/z 322.114, while the Z1 ion (loss of GlcNAc‐2‐AB) produces fragment at 322.141. Similar to the previous example, it took a resolution of 30 K to fully resolve the ions.
A B
α2 6
α2 6
306.119
- CO2
322.114
- CO2
α2 6
α2 6
α2 6
α2 6
A B
C
FIGURE 9. Separation of 2AA-labeled N-linked glycans from human IgG by charge, isomers, and size using a GlycanPac AXR-1 (1.9 µm) column.
Higher-energy collisional dissociation (HCD) fragmentation was selected for structural elucidation due to the production of both glycosidic and cross-ring fragment ions in the MS2 spectrum. The ability to generate these types of ions at the MS2 level provides sufficient information in a lot of cases to successfully elucidate glycan structures (Figures 6–7). Additionally, these ions are detected within the Orbitrap mass analyzer providing HR/AM fragment ions. This allows for differentiation of near mass fragment ions, which we observed to be useful for correctly assigning branching and linkage (Figure 8). SimGlycan software was used for structural elucidation. Overall, 135 unique glycan structures were identified using a combination of GlycanPac AXR-1 column and Orbitrap Fusion mass spectrometer. A list of the 135 identified glycan structures can be found at http://www.dionex.com/en-us/webdocs/115138-PS-GlycanPac-AXR1-Column-PS20907_E.pdf.

4 Deep Sequencing Using an Ultra High Resolution Column and Mass Spectrometer for Isomer Separation and Structural Identification of Glycans
Deep Sequencing Using an Ultra High Resolution Column and Mass Spectrometer for Isomer Separation and Structural Identification of Glycans Julian Saba1, Udayanath Aich2, Rosa Viner1, Xiaodong Liu2, Srinivasa Rao2, Jeff Rohrer2, Andreas Huhmer1, Chris Pohl2 1Thermo Fisher Scientific, San Jose, CA; 2Thermo Fisher Scientific, Sunnyvale, CA
Conclusion The GlycanPac AXR-1 column separates glycans based on charge, isomeric
structure, size, and polarity, providing a greater number of resolved peaks compared to existing commercial amide HILIC columns for 2AB-labeled N-linked glycans released from bovine fetuin.
Faster Orbitrap enables higher scan rates at higher resolution. This translates to increased sensitivity and better quality MS/MS data for both abundant and low abundance glycans. Overall, 135 unique glycan structures were identified when the Glycan Pac AXR-1 column was coupled to a Orbitrap Fusion MS.
References 1. Chester, T. L. Anal. Chem. 2013, 85 (2), 579–589.
2. Ruhaak, L. R. et al. Anal. Bioanal. Chem. 2010, 397, 3457–3481.
3. Chen, X. et al. Anal. Biochem. 2007, 370, 147–161.
4. Wheeler et al. Anal. Chem. 2000, 72, 5027–5039.
Overview Purpose: Separation and identification of N-linked glycans using a novel high resolution mixed-mode column and a high resolution mass spectrometer. Methods: Fluorescently labeled glycans from various proteins were separated and analyzed on a Thermo Scientific™ GlycanPac™ AXR-1 column coupled to a Thermo Scientific™ Orbitrap Fusion™ Tribrid™ mass spectrometer. Data analysis was performed using SimGlycan® 4.5 software. Results: Overall, 73 resolved peaks and 135 unique bovine fetuin glycan structures were identified using a combination of a GlycanPac AXR-1 column and an Orbitrap Fusion MS. These numbers exceed what is currently possible with commercially available column technologies.
Introduction Various modes of HPLC separation have been developed for the analysis of glycans1–3. One common separation mode utilizes amide HILIC columns, which separates glycans based on hydrogen bonding, resulting in a size and composition-based separation. Amide HILIC columns are useful for the separation of N-linked glycans released from antibodies, such as mAbs, where the majority of the glycans are neutral. However, these columns do not provide a good separation when glycans are highly charged (charge ≥ 2) such as sialylated N-linked glycans. Here we describe the new mixed-mode column (GlycanPac AXR-1), which provides separation based on isomeric structure along with separation based on charge, size, and polarity. This column is based on mixed-mode column chemistry, combining both weak-anion exchange (WAX) and reversed-phase (RP) retention mechanisms. The WAX functionality provides retention and selectivity for negatively charged glycans, while the RP mode facilitates the separation of glycans of the same charge according to their isomeric structure, polarity, and size. As a result, the GlycanPac AXR-1 column provides greater resolution with more glycan structures identified when coupled to an Orbitrap Fusion MS compared to existing commercial columns for 2AB-labeled N-linked glycans released from bovine fetuin.
Methods Glycans were released from glycoproteins with PNGaseF enzyme (New England BioLabs). The released glycans were labeled with 2AB and 2AA. All glycans were separated on the GlycanPac AXR-1 column (1.9 µm, 2.1 × 150 mm) by the Thermo Scientific™ Dionex™ Ultimate™ 3000 UHPLC instrument with either a fluorescence or MS detector. MS analysis was performed using an Orbitrap Fusion MS in negative ion mode. SimGlycan software was used for MS/MS data analysis.
Results The GlycanPac AXR-1 column is designed for high-resolution separation of neutral and charged glycans (native and labeled). Figure 1 shows the separation of neutral and acidic 2AB-labeled N-linked glycan from bovine fetuin using a GlycanPac AXR-1 column. The glycan elution profile consists of series of peaks grouped into several clusters in which the neutral glycans elute first, followed by mon-, di-, tri-, tetra-, and pentasialylated species. Peaks in each cluster represent the glycans of the same charge separated by ion exchange interaction. Within each cluster, glycans containing the same charge are further separated according to their isomeric structures, sizes, and polarity by RP interaction. The GlycanPac AXR-1 column provides ≥ 70 resolved peaks with ≥ 1% intensity for 2AB-labeled N-linked glycans from bovine fetuin. It should be noted that for neutral glycans, such as those released from antibodies, it is advantageous to use 2AA-labeling technique to enhance retention as well as selectivity on the GlycanPac AXR-1 column.
LC-MS/MS Analysis of 2AB-Labeled N-linked Glycans From Bovine Fetuin Using GlycanPac AXR-1 Column
The coupling of the GlycanPac AXR-1 column to MS is particularly attractive because MS enables detailed structural characterization. 2AB-labeled N-linked glycans from bovine fetuin were separated on the GlycanPac AXR-1 column and analyzed on an Orbitrap Fusion MS. The LC-MS profile of the GlycanPac AXR-1 column showed the highest number of resolved peaks (≥ 70) for bovine fetuin glycans ever achieved (Figure 2), exceeding the number the existing commercially available stationary phases can resolve. Most commercial stationary phases are poor for separating glycan structural isomers. A single LC peak using these columns can have many structural isomers. So in most instances, mixed MS2 spectrum are generated that contain fragment ions from multiple glycans making it extremely difficult to assign correct structures. The GlycanPac AXR-1 column can resolve structural isomers (Figure 3). However, the ability to resolve structural isomers introduces complexity to analysis. Namely, far more MS/MS spectra need to be triggered in a single LC-MS2 analysis to identify all the resolved peaks. Additionally, wider dynamic range and sensitivity are needed from MS to detect and generate good quality MS2 spectra not only for the most abundant glycans but the low abundant species as well (Figure 4). Orbitrap Fusion MS with its wide dynamic range and ultrahigh mass resolution makes it the ideal platform for looking deeper into the glycome and confidently identifying low-abundance glycans.
SimGlycan is a registered trademark of PREMIER Biosoft International. All other trademarks are the property of Thermo Fisher Scientific and its subsidiaries.
This information is not intended to encourage use of these products in any manners that might infringe the intellectual property rights of others.
PO64115-EN 0614S
FIGURE 2. LC-MS analysis of 2AB-labeled N-linked glycans from bovine fetuin by the GlycanPac AXR-1 column with MS detection.
Analysis of 2AA-labeled Antibody Glycans
Unlike 2AB, 2AA labeling introduces a formal negative charge to each glycan. This promotes greater binding to the GlycanPac AXR-1 column, thus improving retention of both neutral and negatively charged glycans. Figure 6 shows the separation of neutral and acidic 2AA-labeled N-Linked glycans from a human IgG using a GlycanPac AXR-1 column. As with the fetuin sample in the previous figures, the IgG-derived glycan elution profile consists of clusters of peaks in which the neutral glycans elute first, followed by monosialylated and disialylated forms. Within each cluster, the glycans having the same charge are further separated according to their isomerism and size by reversed-phase interactions. As shown in Figure 6, 2AA-labeled neutral glycans elute between 5 and 22 min, 2AA-labeled monosialylated glycans elute between 30 and 45 min and 2AA-labeled disialylated glycans elute between 45 and 55 min. More than 40 peaks are identified from the separation of 2AA-labeled N-glycans from this human IgG.
FIGURE 3. Separation of disialylated biantennary glycans from bovine fetuin based on α2-3 and α2-6 sialic acid linkage by the GlycanPac AXR-1 column.
FIGURE 1. Separation of 2AB-labeled N-linked glycans from bovine fetuin by charge, size, polarity, and isomeric structure using the GlycanPac AXR-1 column.
FIGURE 4. LC-MS/MS (HCD) spectra of 2AB-labeled N-linked glycans from bovine fetuin.
Due to the Orbitrap Fusion mass spectrometer’s unique configuration, the Orbitrap mass analysis can be extensively parallelized with operation of the mass selecting quadrupole, the ion routing multipole (IRM, used for both accumulating ions and for HCD fragmentation), and the ion trap. This allows for maximal concurrent ion manipulations and mass analyses, increasing both scan rates and duty cycle of the instrument. Having fast high resolution accurate mass (HR/AM) full scans along with fast MS/MS detection are essential for achieving enough scans across the LC peak widths for full scan quantitation and MS/MS for confirmation. Figure 5 shows the separation and identification of 2 glycan structural isomers. The Orbitrap Fusion MS is fast enough to maintain more than enough full scans (>16 scans) across the peak for precursor quantitation, thereby ensuring that both qualitative and quantitative information can be obtained within a single analysis.
FIGURE 5. The Orbitrap Fusion MS performs fast MS and concurrent MS/MS for optimal qualitative/quantitative workflow. Shown here are extracted ion chromatograms for two glycans separated by LC‐MS. More than enough scans (> 16 scans) across the peak are performed for quantitation. MS spectra were acquired at a resolution of 120,000 (at m/z 200) and MS/MS at a resolution of 30,000 (at m/z 200).
FIGURE 7. LC-MS/MS (HCD) enables linkage and antennae assignment to sialic acid.4
FIGURE 6. LC-MS/MS (HCD) of A) monosialylated biantennary and B) trisialylated triantennary fetuin glycan.
FIGURE 8. A) A glycan that has α2‐6 linked NeuAc and α2‐6 linked NeuGc. The α2‐6 linked NeuAc produces diagnostic fragment ion 0,4A2 – CO2 at m/z 306.119 while α2‐6 linked NeuGc produces diagnostic fragment ion 0,4A2 – CO2 at m/z 322.114. These can be used as signatures to figure out the type of sialic acid linkages that are occurring.4 B) Zoomed in region of the MS/MS spectrum acquired under different resolutions where the diagnostic ions appear. In this Example, α2‐6 linked NeuAc produces diagnostic fragment ion 0,2A4 – CO2 at m/z 306.119. But from the same glycan, the loss of NeuGc results in an ion 306.083. In the zoomed region for MS/MS spectra, notice that at 17.5 K, resolution does not fully resolve these two ions, while 30 K does. C) For the same glycan, NeuGc produces diagnostic fragment ion 0,2A4 – CO2 at m/z 322.114, while the Z1 ion (loss of GlcNAc‐2‐AB) produces fragment at 322.141. Similar to the previous example, it took a resolution of 30 K to fully resolve the ions.
A B
α2 6
α2 6
306.119
- CO2
322.114
- CO2
α2 6
α2 6
α2 6
α2 6
A B
C
FIGURE 9. Separation of 2AA-labeled N-linked glycans from human IgG by charge, isomers, and size using a GlycanPac AXR-1 (1.9 µm) column.
Higher-energy collisional dissociation (HCD) fragmentation was selected for structural elucidation due to the production of both glycosidic and cross-ring fragment ions in the MS2 spectrum. The ability to generate these types of ions at the MS2 level provides sufficient information in a lot of cases to successfully elucidate glycan structures (Figures 6–7). Additionally, these ions are detected within the Orbitrap mass analyzer providing HR/AM fragment ions. This allows for differentiation of near mass fragment ions, which we observed to be useful for correctly assigning branching and linkage (Figure 8). SimGlycan software was used for structural elucidation. Overall, 135 unique glycan structures were identified using a combination of GlycanPac AXR-1 column and Orbitrap Fusion mass spectrometer. A list of the 135 identified glycan structures can be found at http://www.dionex.com/en-us/webdocs/115138-PS-GlycanPac-AXR1-Column-PS20907_E.pdf.

5Thermo Scientific Poster Note • PN-64115-ASMS-EN-0614S
Deep Sequencing Using an Ultra High Resolution Column and Mass Spectrometer for Isomer Separation and Structural Identification of Glycans Julian Saba1, Udayanath Aich2, Rosa Viner1, Xiaodong Liu2, Srinivasa Rao2, Jeff Rohrer2, Andreas Huhmer1, Chris Pohl2 1Thermo Fisher Scientific, San Jose, CA; 2Thermo Fisher Scientific, Sunnyvale, CA
Conclusion The GlycanPac AXR-1 column separates glycans based on charge, isomeric
structure, size, and polarity, providing a greater number of resolved peaks compared to existing commercial amide HILIC columns for 2AB-labeled N-linked glycans released from bovine fetuin.
Faster Orbitrap enables higher scan rates at higher resolution. This translates to increased sensitivity and better quality MS/MS data for both abundant and low abundance glycans. Overall, 135 unique glycan structures were identified when the Glycan Pac AXR-1 column was coupled to a Orbitrap Fusion MS.
References 1. Chester, T. L. Anal. Chem. 2013, 85 (2), 579–589.
2. Ruhaak, L. R. et al. Anal. Bioanal. Chem. 2010, 397, 3457–3481.
3. Chen, X. et al. Anal. Biochem. 2007, 370, 147–161.
4. Wheeler et al. Anal. Chem. 2000, 72, 5027–5039.
Overview Purpose: Separation and identification of N-linked glycans using a novel high resolution mixed-mode column and a high resolution mass spectrometer. Methods: Fluorescently labeled glycans from various proteins were separated and analyzed on a Thermo Scientific™ GlycanPac™ AXR-1 column coupled to a Thermo Scientific™ Orbitrap Fusion™ Tribrid™ mass spectrometer. Data analysis was performed using SimGlycan® 4.5 software. Results: Overall, 73 resolved peaks and 135 unique bovine fetuin glycan structures were identified using a combination of a GlycanPac AXR-1 column and an Orbitrap Fusion MS. These numbers exceed what is currently possible with commercially available column technologies.
Introduction Various modes of HPLC separation have been developed for the analysis of glycans1–3. One common separation mode utilizes amide HILIC columns, which separates glycans based on hydrogen bonding, resulting in a size and composition-based separation. Amide HILIC columns are useful for the separation of N-linked glycans released from antibodies, such as mAbs, where the majority of the glycans are neutral. However, these columns do not provide a good separation when glycans are highly charged (charge ≥ 2) such as sialylated N-linked glycans. Here we describe the new mixed-mode column (GlycanPac AXR-1), which provides separation based on isomeric structure along with separation based on charge, size, and polarity. This column is based on mixed-mode column chemistry, combining both weak-anion exchange (WAX) and reversed-phase (RP) retention mechanisms. The WAX functionality provides retention and selectivity for negatively charged glycans, while the RP mode facilitates the separation of glycans of the same charge according to their isomeric structure, polarity, and size. As a result, the GlycanPac AXR-1 column provides greater resolution with more glycan structures identified when coupled to an Orbitrap Fusion MS compared to existing commercial columns for 2AB-labeled N-linked glycans released from bovine fetuin.
Methods Glycans were released from glycoproteins with PNGaseF enzyme (New England BioLabs). The released glycans were labeled with 2AB and 2AA. All glycans were separated on the GlycanPac AXR-1 column (1.9 µm, 2.1 × 150 mm) by the Thermo Scientific™ Dionex™ Ultimate™ 3000 UHPLC instrument with either a fluorescence or MS detector. MS analysis was performed using an Orbitrap Fusion MS in negative ion mode. SimGlycan software was used for MS/MS data analysis.
Results The GlycanPac AXR-1 column is designed for high-resolution separation of neutral and charged glycans (native and labeled). Figure 1 shows the separation of neutral and acidic 2AB-labeled N-linked glycan from bovine fetuin using a GlycanPac AXR-1 column. The glycan elution profile consists of series of peaks grouped into several clusters in which the neutral glycans elute first, followed by mon-, di-, tri-, tetra-, and pentasialylated species. Peaks in each cluster represent the glycans of the same charge separated by ion exchange interaction. Within each cluster, glycans containing the same charge are further separated according to their isomeric structures, sizes, and polarity by RP interaction. The GlycanPac AXR-1 column provides ≥ 70 resolved peaks with ≥ 1% intensity for 2AB-labeled N-linked glycans from bovine fetuin. It should be noted that for neutral glycans, such as those released from antibodies, it is advantageous to use 2AA-labeling technique to enhance retention as well as selectivity on the GlycanPac AXR-1 column.
LC-MS/MS Analysis of 2AB-Labeled N-linked Glycans From Bovine Fetuin Using GlycanPac AXR-1 Column
The coupling of the GlycanPac AXR-1 column to MS is particularly attractive because MS enables detailed structural characterization. 2AB-labeled N-linked glycans from bovine fetuin were separated on the GlycanPac AXR-1 column and analyzed on an Orbitrap Fusion MS. The LC-MS profile of the GlycanPac AXR-1 column showed the highest number of resolved peaks (≥ 70) for bovine fetuin glycans ever achieved (Figure 2), exceeding the number the existing commercially available stationary phases can resolve. Most commercial stationary phases are poor for separating glycan structural isomers. A single LC peak using these columns can have many structural isomers. So in most instances, mixed MS2 spectrum are generated that contain fragment ions from multiple glycans making it extremely difficult to assign correct structures. The GlycanPac AXR-1 column can resolve structural isomers (Figure 3). However, the ability to resolve structural isomers introduces complexity to analysis. Namely, far more MS/MS spectra need to be triggered in a single LC-MS2 analysis to identify all the resolved peaks. Additionally, wider dynamic range and sensitivity are needed from MS to detect and generate good quality MS2 spectra not only for the most abundant glycans but the low abundant species as well (Figure 4). Orbitrap Fusion MS with its wide dynamic range and ultrahigh mass resolution makes it the ideal platform for looking deeper into the glycome and confidently identifying low-abundance glycans.
SimGlycan is a registered trademark of PREMIER Biosoft International. All other trademarks are the property of Thermo Fisher Scientific and its subsidiaries.
This information is not intended to encourage use of these products in any manners that might infringe the intellectual property rights of others.
PO64115-EN 0614S
FIGURE 2. LC-MS analysis of 2AB-labeled N-linked glycans from bovine fetuin by the GlycanPac AXR-1 column with MS detection.
Analysis of 2AA-labeled Antibody Glycans
Unlike 2AB, 2AA labeling introduces a formal negative charge to each glycan. This promotes greater binding to the GlycanPac AXR-1 column, thus improving retention of both neutral and negatively charged glycans. Figure 6 shows the separation of neutral and acidic 2AA-labeled N-Linked glycans from a human IgG using a GlycanPac AXR-1 column. As with the fetuin sample in the previous figures, the IgG-derived glycan elution profile consists of clusters of peaks in which the neutral glycans elute first, followed by monosialylated and disialylated forms. Within each cluster, the glycans having the same charge are further separated according to their isomerism and size by reversed-phase interactions. As shown in Figure 6, 2AA-labeled neutral glycans elute between 5 and 22 min, 2AA-labeled monosialylated glycans elute between 30 and 45 min and 2AA-labeled disialylated glycans elute between 45 and 55 min. More than 40 peaks are identified from the separation of 2AA-labeled N-glycans from this human IgG.
FIGURE 3. Separation of disialylated biantennary glycans from bovine fetuin based on α2-3 and α2-6 sialic acid linkage by the GlycanPac AXR-1 column.
FIGURE 1. Separation of 2AB-labeled N-linked glycans from bovine fetuin by charge, size, polarity, and isomeric structure using the GlycanPac AXR-1 column.
FIGURE 4. LC-MS/MS (HCD) spectra of 2AB-labeled N-linked glycans from bovine fetuin.
Due to the Orbitrap Fusion mass spectrometer’s unique configuration, the Orbitrap mass analysis can be extensively parallelized with operation of the mass selecting quadrupole, the ion routing multipole (IRM, used for both accumulating ions and for HCD fragmentation), and the ion trap. This allows for maximal concurrent ion manipulations and mass analyses, increasing both scan rates and duty cycle of the instrument. Having fast high resolution accurate mass (HR/AM) full scans along with fast MS/MS detection are essential for achieving enough scans across the LC peak widths for full scan quantitation and MS/MS for confirmation. Figure 5 shows the separation and identification of 2 glycan structural isomers. The Orbitrap Fusion MS is fast enough to maintain more than enough full scans (>16 scans) across the peak for precursor quantitation, thereby ensuring that both qualitative and quantitative information can be obtained within a single analysis.
FIGURE 5. The Orbitrap Fusion MS performs fast MS and concurrent MS/MS for optimal qualitative/quantitative workflow. Shown here are extracted ion chromatograms for two glycans separated by LC‐MS. More than enough scans (> 16 scans) across the peak are performed for quantitation. MS spectra were acquired at a resolution of 120,000 (at m/z 200) and MS/MS at a resolution of 30,000 (at m/z 200).
FIGURE 7. LC-MS/MS (HCD) enables linkage and antennae assignment to sialic acid.4
FIGURE 6. LC-MS/MS (HCD) of A) monosialylated biantennary and B) trisialylated triantennary fetuin glycan.
FIGURE 8. A) A glycan that has α2‐6 linked NeuAc and α2‐6 linked NeuGc. The α2‐6 linked NeuAc produces diagnostic fragment ion 0,4A2 – CO2 at m/z 306.119 while α2‐6 linked NeuGc produces diagnostic fragment ion 0,4A2 – CO2 at m/z 322.114. These can be used as signatures to figure out the type of sialic acid linkages that are occurring.4 B) Zoomed in region of the MS/MS spectrum acquired under different resolutions where the diagnostic ions appear. In this Example, α2‐6 linked NeuAc produces diagnostic fragment ion 0,2A4 – CO2 at m/z 306.119. But from the same glycan, the loss of NeuGc results in an ion 306.083. In the zoomed region for MS/MS spectra, notice that at 17.5 K, resolution does not fully resolve these two ions, while 30 K does. C) For the same glycan, NeuGc produces diagnostic fragment ion 0,2A4 – CO2 at m/z 322.114, while the Z1 ion (loss of GlcNAc‐2‐AB) produces fragment at 322.141. Similar to the previous example, it took a resolution of 30 K to fully resolve the ions.
A B
α2 6
α2 6
306.119
- CO2
322.114
- CO2
α2 6
α2 6
α2 6
α2 6
A B
C
FIGURE 9. Separation of 2AA-labeled N-linked glycans from human IgG by charge, isomers, and size using a GlycanPac AXR-1 (1.9 µm) column.
Higher-energy collisional dissociation (HCD) fragmentation was selected for structural elucidation due to the production of both glycosidic and cross-ring fragment ions in the MS2 spectrum. The ability to generate these types of ions at the MS2 level provides sufficient information in a lot of cases to successfully elucidate glycan structures (Figures 6–7). Additionally, these ions are detected within the Orbitrap mass analyzer providing HR/AM fragment ions. This allows for differentiation of near mass fragment ions, which we observed to be useful for correctly assigning branching and linkage (Figure 8). SimGlycan software was used for structural elucidation. Overall, 135 unique glycan structures were identified using a combination of GlycanPac AXR-1 column and Orbitrap Fusion mass spectrometer. A list of the 135 identified glycan structures can be found at http://www.dionex.com/en-us/webdocs/115138-PS-GlycanPac-AXR1-Column-PS20907_E.pdf.
6 Deep Sequencing Using an Ultra High Resolution Column and Mass Spectrometer for Isomer Separation and Structural Identification of Glycans
Deep Sequencing Using an Ultra High Resolution Column and Mass Spectrometer for Isomer Separation and Structural Identification of Glycans Julian Saba1, Udayanath Aich2, Rosa Viner1, Xiaodong Liu2, Srinivasa Rao2, Jeff Rohrer2, Andreas Huhmer1, Chris Pohl2 1Thermo Fisher Scientific, San Jose, CA; 2Thermo Fisher Scientific, Sunnyvale, CA
Conclusion The GlycanPac AXR-1 column separates glycans based on charge, isomeric
structure, size, and polarity, providing a greater number of resolved peaks compared to existing commercial amide HILIC columns for 2AB-labeled N-linked glycans released from bovine fetuin.
Faster Orbitrap enables higher scan rates at higher resolution. This translates to increased sensitivity and better quality MS/MS data for both abundant and low abundance glycans. Overall, 135 unique glycan structures were identified when the Glycan Pac AXR-1 column was coupled to a Orbitrap Fusion MS.
References 1. Chester, T. L. Anal. Chem. 2013, 85 (2), 579–589.
2. Ruhaak, L. R. et al. Anal. Bioanal. Chem. 2010, 397, 3457–3481.
3. Chen, X. et al. Anal. Biochem. 2007, 370, 147–161.
4. Wheeler et al. Anal. Chem. 2000, 72, 5027–5039.
Overview Purpose: Separation and identification of N-linked glycans using a novel high resolution mixed-mode column and a high resolution mass spectrometer. Methods: Fluorescently labeled glycans from various proteins were separated and analyzed on a Thermo Scientific™ GlycanPac™ AXR-1 column coupled to a Thermo Scientific™ Orbitrap Fusion™ Tribrid™ mass spectrometer. Data analysis was performed using SimGlycan® 4.5 software. Results: Overall, 73 resolved peaks and 135 unique bovine fetuin glycan structures were identified using a combination of a GlycanPac AXR-1 column and an Orbitrap Fusion MS. These numbers exceed what is currently possible with commercially available column technologies.
Introduction Various modes of HPLC separation have been developed for the analysis of glycans1–3. One common separation mode utilizes amide HILIC columns, which separates glycans based on hydrogen bonding, resulting in a size and composition-based separation. Amide HILIC columns are useful for the separation of N-linked glycans released from antibodies, such as mAbs, where the majority of the glycans are neutral. However, these columns do not provide a good separation when glycans are highly charged (charge ≥ 2) such as sialylated N-linked glycans. Here we describe the new mixed-mode column (GlycanPac AXR-1), which provides separation based on isomeric structure along with separation based on charge, size, and polarity. This column is based on mixed-mode column chemistry, combining both weak-anion exchange (WAX) and reversed-phase (RP) retention mechanisms. The WAX functionality provides retention and selectivity for negatively charged glycans, while the RP mode facilitates the separation of glycans of the same charge according to their isomeric structure, polarity, and size. As a result, the GlycanPac AXR-1 column provides greater resolution with more glycan structures identified when coupled to an Orbitrap Fusion MS compared to existing commercial columns for 2AB-labeled N-linked glycans released from bovine fetuin.
Methods Glycans were released from glycoproteins with PNGaseF enzyme (New England BioLabs). The released glycans were labeled with 2AB and 2AA. All glycans were separated on the GlycanPac AXR-1 column (1.9 µm, 2.1 × 150 mm) by the Thermo Scientific™ Dionex™ Ultimate™ 3000 UHPLC instrument with either a fluorescence or MS detector. MS analysis was performed using an Orbitrap Fusion MS in negative ion mode. SimGlycan software was used for MS/MS data analysis.
Results The GlycanPac AXR-1 column is designed for high-resolution separation of neutral and charged glycans (native and labeled). Figure 1 shows the separation of neutral and acidic 2AB-labeled N-linked glycan from bovine fetuin using a GlycanPac AXR-1 column. The glycan elution profile consists of series of peaks grouped into several clusters in which the neutral glycans elute first, followed by mon-, di-, tri-, tetra-, and pentasialylated species. Peaks in each cluster represent the glycans of the same charge separated by ion exchange interaction. Within each cluster, glycans containing the same charge are further separated according to their isomeric structures, sizes, and polarity by RP interaction. The GlycanPac AXR-1 column provides ≥ 70 resolved peaks with ≥ 1% intensity for 2AB-labeled N-linked glycans from bovine fetuin. It should be noted that for neutral glycans, such as those released from antibodies, it is advantageous to use 2AA-labeling technique to enhance retention as well as selectivity on the GlycanPac AXR-1 column.
LC-MS/MS Analysis of 2AB-Labeled N-linked Glycans From Bovine Fetuin Using GlycanPac AXR-1 Column
The coupling of the GlycanPac AXR-1 column to MS is particularly attractive because MS enables detailed structural characterization. 2AB-labeled N-linked glycans from bovine fetuin were separated on the GlycanPac AXR-1 column and analyzed on an Orbitrap Fusion MS. The LC-MS profile of the GlycanPac AXR-1 column showed the highest number of resolved peaks (≥ 70) for bovine fetuin glycans ever achieved (Figure 2), exceeding the number the existing commercially available stationary phases can resolve. Most commercial stationary phases are poor for separating glycan structural isomers. A single LC peak using these columns can have many structural isomers. So in most instances, mixed MS2 spectrum are generated that contain fragment ions from multiple glycans making it extremely difficult to assign correct structures. The GlycanPac AXR-1 column can resolve structural isomers (Figure 3). However, the ability to resolve structural isomers introduces complexity to analysis. Namely, far more MS/MS spectra need to be triggered in a single LC-MS2 analysis to identify all the resolved peaks. Additionally, wider dynamic range and sensitivity are needed from MS to detect and generate good quality MS2 spectra not only for the most abundant glycans but the low abundant species as well (Figure 4). Orbitrap Fusion MS with its wide dynamic range and ultrahigh mass resolution makes it the ideal platform for looking deeper into the glycome and confidently identifying low-abundance glycans.
SimGlycan is a registered trademark of PREMIER Biosoft International. All other trademarks are the property of Thermo Fisher Scientific and its subsidiaries.
This information is not intended to encourage use of these products in any manners that might infringe the intellectual property rights of others.
PO64115-EN 0614S
FIGURE 2. LC-MS analysis of 2AB-labeled N-linked glycans from bovine fetuin by the GlycanPac AXR-1 column with MS detection.
Analysis of 2AA-labeled Antibody Glycans
Unlike 2AB, 2AA labeling introduces a formal negative charge to each glycan. This promotes greater binding to the GlycanPac AXR-1 column, thus improving retention of both neutral and negatively charged glycans. Figure 6 shows the separation of neutral and acidic 2AA-labeled N-Linked glycans from a human IgG using a GlycanPac AXR-1 column. As with the fetuin sample in the previous figures, the IgG-derived glycan elution profile consists of clusters of peaks in which the neutral glycans elute first, followed by monosialylated and disialylated forms. Within each cluster, the glycans having the same charge are further separated according to their isomerism and size by reversed-phase interactions. As shown in Figure 6, 2AA-labeled neutral glycans elute between 5 and 22 min, 2AA-labeled monosialylated glycans elute between 30 and 45 min and 2AA-labeled disialylated glycans elute between 45 and 55 min. More than 40 peaks are identified from the separation of 2AA-labeled N-glycans from this human IgG.
FIGURE 3. Separation of disialylated biantennary glycans from bovine fetuin based on α2-3 and α2-6 sialic acid linkage by the GlycanPac AXR-1 column.
FIGURE 1. Separation of 2AB-labeled N-linked glycans from bovine fetuin by charge, size, polarity, and isomeric structure using the GlycanPac AXR-1 column.
FIGURE 4. LC-MS/MS (HCD) spectra of 2AB-labeled N-linked glycans from bovine fetuin.
Due to the Orbitrap Fusion mass spectrometer’s unique configuration, the Orbitrap mass analysis can be extensively parallelized with operation of the mass selecting quadrupole, the ion routing multipole (IRM, used for both accumulating ions and for HCD fragmentation), and the ion trap. This allows for maximal concurrent ion manipulations and mass analyses, increasing both scan rates and duty cycle of the instrument. Having fast high resolution accurate mass (HR/AM) full scans along with fast MS/MS detection are essential for achieving enough scans across the LC peak widths for full scan quantitation and MS/MS for confirmation. Figure 5 shows the separation and identification of 2 glycan structural isomers. The Orbitrap Fusion MS is fast enough to maintain more than enough full scans (>16 scans) across the peak for precursor quantitation, thereby ensuring that both qualitative and quantitative information can be obtained within a single analysis.
FIGURE 5. The Orbitrap Fusion MS performs fast MS and concurrent MS/MS for optimal qualitative/quantitative workflow. Shown here are extracted ion chromatograms for two glycans separated by LC‐MS. More than enough scans (> 16 scans) across the peak are performed for quantitation. MS spectra were acquired at a resolution of 120,000 (at m/z 200) and MS/MS at a resolution of 30,000 (at m/z 200).
FIGURE 7. LC-MS/MS (HCD) enables linkage and antennae assignment to sialic acid.4
FIGURE 6. LC-MS/MS (HCD) of A) monosialylated biantennary and B) trisialylated triantennary fetuin glycan.
FIGURE 8. A) A glycan that has α2‐6 linked NeuAc and α2‐6 linked NeuGc. The α2‐6 linked NeuAc produces diagnostic fragment ion 0,4A2 – CO2 at m/z 306.119 while α2‐6 linked NeuGc produces diagnostic fragment ion 0,4A2 – CO2 at m/z 322.114. These can be used as signatures to figure out the type of sialic acid linkages that are occurring.4 B) Zoomed in region of the MS/MS spectrum acquired under different resolutions where the diagnostic ions appear. In this Example, α2‐6 linked NeuAc produces diagnostic fragment ion 0,2A4 – CO2 at m/z 306.119. But from the same glycan, the loss of NeuGc results in an ion 306.083. In the zoomed region for MS/MS spectra, notice that at 17.5 K, resolution does not fully resolve these two ions, while 30 K does. C) For the same glycan, NeuGc produces diagnostic fragment ion 0,2A4 – CO2 at m/z 322.114, while the Z1 ion (loss of GlcNAc‐2‐AB) produces fragment at 322.141. Similar to the previous example, it took a resolution of 30 K to fully resolve the ions.
A B
α2 6
α2 6
306.119
- CO2
322.114
- CO2
α2 6
α2 6
α2 6
α2 6
A B
C
FIGURE 9. Separation of 2AA-labeled N-linked glycans from human IgG by charge, isomers, and size using a GlycanPac AXR-1 (1.9 µm) column.
Higher-energy collisional dissociation (HCD) fragmentation was selected for structural elucidation due to the production of both glycosidic and cross-ring fragment ions in the MS2 spectrum. The ability to generate these types of ions at the MS2 level provides sufficient information in a lot of cases to successfully elucidate glycan structures (Figures 6–7). Additionally, these ions are detected within the Orbitrap mass analyzer providing HR/AM fragment ions. This allows for differentiation of near mass fragment ions, which we observed to be useful for correctly assigning branching and linkage (Figure 8). SimGlycan software was used for structural elucidation. Overall, 135 unique glycan structures were identified using a combination of GlycanPac AXR-1 column and Orbitrap Fusion mass spectrometer. A list of the 135 identified glycan structures can be found at http://www.dionex.com/en-us/webdocs/115138-PS-GlycanPac-AXR1-Column-PS20907_E.pdf.

www.thermofisher.com©2016 Thermo Fisher Scientific Inc. All rights reserved. SimGlycan is a registered trademark of PREMIER Biosoft International. All other trademarks are the property of Thermo Fisher Scientific and its subsidiaries. This information is presented as an example of the capabilities of Thermo Fisher Scientific prod-ucts. It is not intended to encourage use of these products in any manners that might infringe the intellectual property rights of others. Specifications, terms and pricing are subject to change. Not all products are available in all countries. Please consult your local sales representative for details.
PN-64115-EN-0716S
Africa +43 1 333 50 34 0Australia +61 3 9757 4300Austria +43 810 282 206Belgium +32 53 73 42 41Canada +1 800 530 8447China 800 810 5118 (free call domestic)
400 650 5118
Denmark +45 70 23 62 60Europe-Other +43 1 333 50 34 0Finland +358 9 3291 0200France +33 1 60 92 48 00Germany +49 6103 408 1014India +91 22 6742 9494Italy +39 02 950 591
Japan +81 45 453 9100Latin America +1 561 688 8700Middle East +43 1 333 50 34 0Netherlands +31 76 579 55 55New Zealand +64 9 980 6700Norway +46 8 556 468 00Russia/CIS +43 1 333 50 34 0
Singapore +65 6289 1190Spain +34 914 845 965Sweden +46 8 556 468 00Switzerland +41 61 716 77 00UK +44 1442 233555USA +1 800 532 4752