Embed Size (px)
Citation preview
Ocean Sci., 11, 343–359, 2015
www.ocean-sci.net/11/343/2015/
doi:10.5194/os-11-343-2015
© Author(s) 2015. CC Attribution 3.0 License.
Deep drivers of mesoscale circulation in the central Rockall Trough
T. J. Sherwin, D. Aleynik, E. Dumont, and M. E. Inall
Scottish Association for Marine Science, Scottish Marine Institute, Oban PA37 1QA, UK
Correspondence to: T. J. Sherwin ([email protected])
Received: 5 September 2014 – Published in Ocean Sci. Discuss.: 25 November 2014
Revised: 25 March 2015 – Accepted: 13 April 2015 – Published: 12 May 2015
Abstract. Mesoscale variability in the central Rockall
Trough, immediately west of the British Isles, has been in-
vestigated using a combination of ship-borne, underwater
glider and gridded satellite altimeter measurements. Altime-
ter observations show that eddies and large-scale circulation
cells are ubiquitous phenomena. They have horizontal length
scales of order 100 km with vertical scales of over 1000 m
and are associated with mean current speeds (over the up-
per 1000 m) of 15±7 cm s−1. Monthly area averaged surface
eddy kinetic energy (EKE) has substantial inter-annual vari-
ability, which at times can dominate a mean seasonal sig-
nal that varies from a maximum in May (74 cm2 s−2) to a
minimum in October (52 cm2 s−2) and has increased gradu-
ally since 1992 at about 1.1 cm2 s−2 per year. This increase
may be related to the retreat of the sub-polar gyre (SPG). A
5 month glider mission in the trough showed that the cyclonic
component of EKE came from cold water features that are
located over 1000 m below the surface. The surface currents
from altimeters had similar magnitude to the drift currents
averaged over 1000 m from the glider in the stratified au-
tumn, but were half the deep water speed during late winter.
Although the mesoscale features move in an apparent ran-
dom manner, they seem to be constrained by submarine to-
pography such as seamounts. Occasionally anti-cyclonic and
cyclonic cells combine to cause a coherent westward deflec-
tion of the European slope current that warms the Rockall
side of the trough. Such deflections contribute to the inter-
annual variability in the observed temperature and salinity
that are monitored in the upper 800 m of the trough. By com-
bining glider and altimeter measurements it is shown that al-
timeter measurements fail to observe a 15 cm s−1 northward
flowing slope current on the eastern side as well as a small
persistent southward current on the western side. There is
much to be gained from the synergy between satellite altime-
try and in situ glider observations.
1 Introduction
The northern end of the Atlantic Ocean (south of the
Greenland–Scotland Ridge) is dominated by a basin-
wide three-dimensional cyclonic interleaving of wind- and
thermohaline-driven water masses known as the sub-polar
gyre (SPG) (e.g. Bacon, 1998; Hakkinen and Rhines, 2009;
Hátún et al., 2005; Pickart et al., 2003). Convective forc-
ing drives its strongest currents in the deeper waters of the
Labrador Sea and Irminger Basin in the west, but the in-
fluence of the gyre stretches across the Iceland Basin and
into the Rockall Trough on its eastern side. Warm, salty
surface water is carried northward through the basin and
trough across the Greenland–Scotland Ridge and into the
Nordic Seas (e.g. Hansen et al., 2010; Hansen and Øster-
hus, 2000). The complexity of the SPG is demonstrated by
Tett et al. (2014), who analysed the transports produced by
six global ocean reanalyses and found that a recent 50 year
increase in the strength of the Atlantic Meridional Overturn-
ing Circulation (AMOC) south of the SPG was uncorrelated
with the relatively steady exchange across the Greenland–
Scotland Ridge. This result would appear to undermine a
basic assumption that convection at high latitudes drives an
Atlantic thermohaline circulation. Understanding all aspects
of the SPG is thus critical to studies of the global and local
climate, and whilst progress has been made in defining the
deep, cold southward flowing boundary currents in the west-
ern part, less is known about the currents and transports in
the generally warmer and saltier water in the east.
Models of the SPG require an accurate representation of
the exchange across their boundaries, which in turn depends
on an accurate parameterisation of mixing and circulation in
its various basins, including the Rockall Trough. In response
to a need to systematically study the SPG, a major inter-
national oceanographic observation programme was estab-
Published by Copernicus Publications on behalf of the European Geosciences Union.
344 T. J. Sherwin et al.: Deep drivers of mesoscale circulation in the central Rockall Trough
ENAWWTOW
NAW
SAIW, MOW & LSW
Malin Shelf
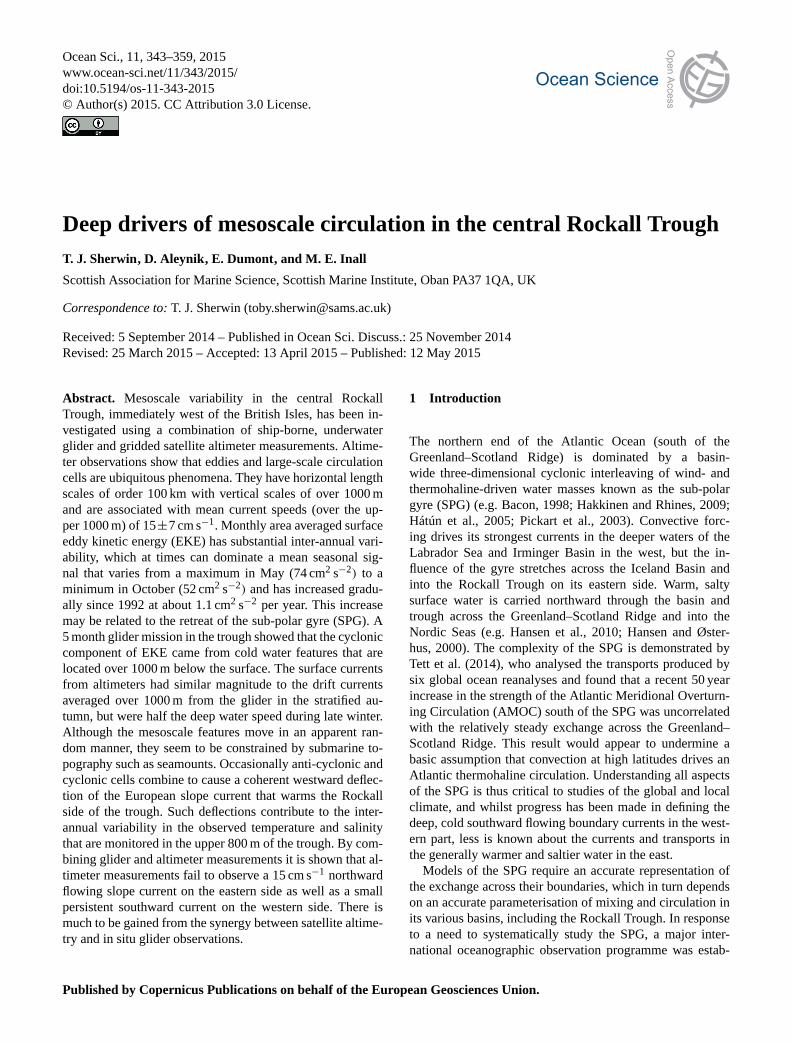
Figure 1. Map of the Rockall Trough with bathymetry (m) and
the major currents. WTR: Wyville Thomson Ridge; RB: Rosemary
Bank; HTS: Hebrides Terrace Seamount. Other acronyms are de-
fined in the text. D340 stations are shown as a series of black dots.
The red “tramway” is the alternative route of ENAW identified in
this paper. The black box outlines the area that EKE is averaged
over in Fig. 9.
lished in 2013 (O-SNAP, www.o-snap.org). One component
of O-SNAP is the Ellett Line, a regular annual conductivity
temperature depth (CTD) section across the Rockall Trough
that has been sustained since 1975.
In the winter of 2009 to 2010 the Scottish Association
for Marine Science increased the sampling frequency by de-
ploying an underwater glider, and the first new data points
for the Ellett Line time series were published in Sherwin et
al. (2012). By combining these glider data with gridded satel-
lite altimetry ship-borne observations, new insights into the
current field of the Rockall Trough have been derived.
2 Background
The Rockall Trough is an 800 km long by 200 km wide
trench that lies to the west of the British Isles (Fig. 1). At its
southern entrance (53◦ N, 17◦W) it is up to 3500 m deep, but
it shallows towards the north to a depth of 1000 m at the foot
of the Wyville Thomson Ridge (8◦ N, 60◦W), itself about
600 m deep. South of 58.5◦ N the western side of the trough
is flanked by the Rockall–Hatton Plateau (minimum depth of
order 100 m), but further north this boundary is populated by
a series of deep channels (to 1000 m) and shallow banks that
ENAWNAW
WTOW
LSW
SAIW MOW
a)
b)
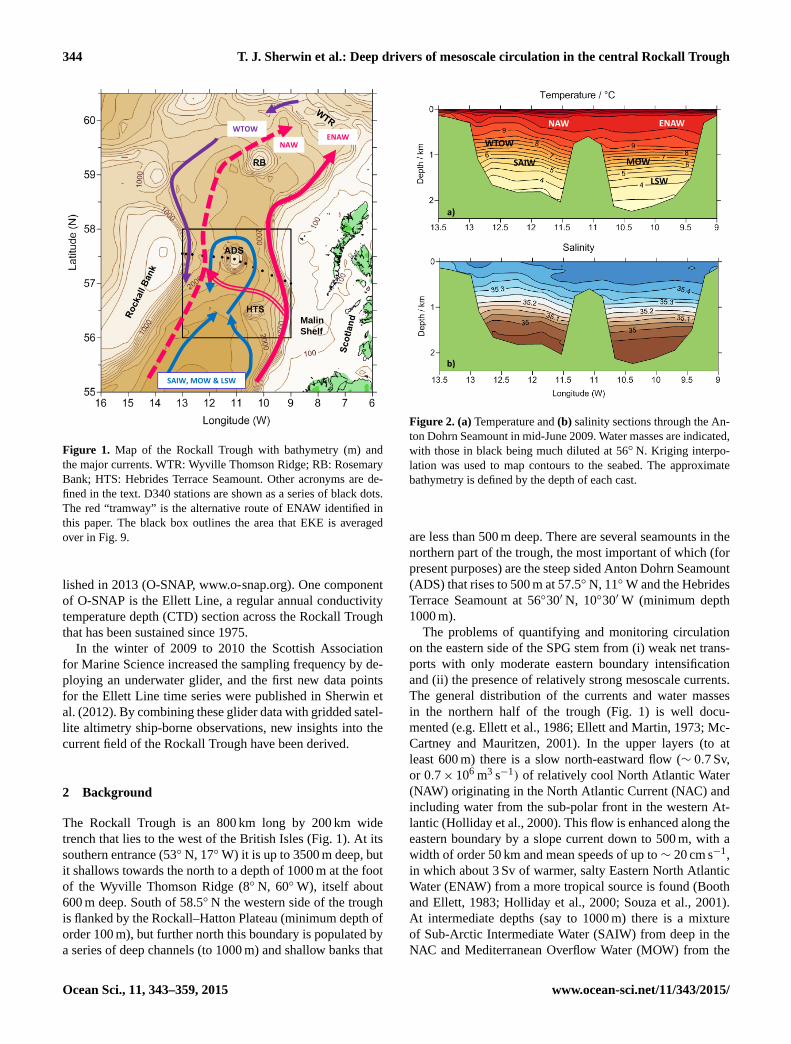
Figure 2. (a) Temperature and (b) salinity sections through the An-
ton Dohrn Seamount in mid-June 2009. Water masses are indicated,
with those in black being much diluted at 56◦ N. Kriging interpo-
lation was used to map contours to the seabed. The approximate
bathymetry is defined by the depth of each cast.
are less than 500 m deep. There are several seamounts in the
northern part of the trough, the most important of which (for
present purposes) are the steep sided Anton Dohrn Seamount
(ADS) that rises to 500 m at 57.5◦ N, 11◦W and the Hebrides
Terrace Seamount at 56◦30′ N, 10◦30′W (minimum depth
1000 m).
The problems of quantifying and monitoring circulation
on the eastern side of the SPG stem from (i) weak net trans-
ports with only moderate eastern boundary intensification
and (ii) the presence of relatively strong mesoscale currents.
The general distribution of the currents and water masses
in the northern half of the trough (Fig. 1) is well docu-
mented (e.g. Ellett et al., 1986; Ellett and Martin, 1973; Mc-
Cartney and Mauritzen, 2001). In the upper layers (to at
least 600 m) there is a slow north-eastward flow (∼ 0.7 Sv,
or 0.7× 10⁶ m3 s−1) of relatively cool North Atlantic Water
(NAW) originating in the North Atlantic Current (NAC) and
including water from the sub-polar front in the western At-
lantic (Holliday et al., 2000). This flow is enhanced along the
eastern boundary by a slope current down to 500 m, with a
width of order 50 km and mean speeds of up to ∼ 20 cm s−1,
in which about 3 Sv of warmer, salty Eastern North Atlantic
Water (ENAW) from a more tropical source is found (Booth
and Ellett, 1983; Holliday et al., 2000; Souza et al., 2001).
At intermediate depths (say to 1000 m) there is a mixture
of Sub-Arctic Intermediate Water (SAIW) from deep in the
NAC and Mediterranean Overflow Water (MOW) from the
Ocean Sci., 11, 343–359, 2015 www.ocean-sci.net/11/343/2015/

T. J. Sherwin et al.: Deep drivers of mesoscale circulation in the central Rockall Trough 345
3 5 7 9 11 13
0
500
1000
1500
2000
Potential Temperature / oC
Pre
ssur
e / d
bar
W of Anton Dohrn
a)
34.9 35.1 35.3 35.5
0
500
1000
1500
2000
Salinity
Pre
ssur
e / d
bar
c)
26.8
2
27
27.2
27.4
27.6
8 2
Salinity
Pot
entia
l Tem
pera
ture
/ o C
NAW .ENAW
. WTOW
e)
35.2 35.3 35.4 35.56
7
8
9
10
11
12
13
3 5 7 9 11 13
0
500
1000
1500
2000
Potential Temperature / oCP
ress
ure
/ dba
r
b)
E of Anton Dohrn
34.9 35.1 35.3 35.5
0
500
1000
1500
2000
Salinity
Pre
ssur
e / d
bar
d)
LSW
26.8
2
27
27.2
27.4
27.6
8 2
Salinity
Pot
entia
l Tem
pera
ture
/ o C
NAW .ENAW
. WTOW
f)
35.2 35.3 35.4 35.56
7
8
9
10
11
12
13
June 2009Oct 2009Feb 2010
Figure 3. Temperature and salinity profiles and θS plots either side
of the Anton Dohrn Seamount from cruise D340 (full depth, black)
and Mission 1 (to 1000 m, red and blue). Glider data are averages
of the up and down casts. For positions, see Fig. 8.
south (e.g. Reid, 1979; Ullgren and White, 2010) that over
decadal timescales interact with each other and with Wyville
Thomson Ridge Overflow Water (WTOW) coming from the
north (e.g. Ellett and Roberts, 1973; Johnson et al., 2010). At
deeper levels (down to about 1800 m) low-salinity Labrador
Sea Water (LSW) intermittently pulses into the trough from
the south-west (Holliday et al., 2000), whilst deeper again is
water with the signature of Antarctic Bottom Water (Figs. 2
and 3). The Ellett Line ship-borne CTD sections reveal that
after 1995 there was a steady rise in temperature and salinity
in the trough that is associated with a retreat of the SPG to
the west (Hátún et al., 2005; Johnson et al., 2013), although
since 2010 this trend appears to have reversed (Holliday et
al., 2015).
Although at times mesoscale activity in the northern part
of the Rockall Trough has been thought to be weak (e.g.
Pollard et al., 1983), hydrographic observations during the
JASIN experiment of the summer of 1979 to the west of
Rosemary Bank showed that this is not the case. A cyclonic
mesoscale eddy with a diameter of ∼ 100 km, and internal
velocities of order 10 cm s−1, propagated westward through
the observation area (at about 59.5◦ N) with a translation
speed of about 1.4 km day−1 (Ellett et al., 1983). It is no-
table that this eddy was coherent to well below 1000 m and
had a weak surface signature. Its direction of propagation and
water composition indicated to the JASIN group that it was
formed by the overflow of WTOW across the ridge.
A synthesis of current meter observations from north of
57◦ N by Dickson et al. (1986) revealed a maximum in eddy
kinetic energy (EKE) levels at all depths (from current me-
ters) in winter to spring that lagged the peak in wind stress.
Subsequent surface drifter studies in the central and northern
parts of the trough by Booth (1988) and Burrows et al. (1999)
revealed clear evidence of mesoscale eddies. Booth (1988)
identified three eddies: a large anti-cyclonic one south of this
study area at 54◦ N, 15.5◦W with a radius of 60 km, a peri-
odic timescale of up to 16 days and an orbital speed of up to
80 cm s−1; and two much smaller cyclonic ones, with periods
of 1 to 2 days and orbital speeds up to 35 cm s−1 that rotated
anti-cyclonically around the ADS. He attributed the source of
these eddies to instability of the slope current near the Porcu-
pine Bank and to Taylor column dynamics over the seamount
respectively. More recently, Ullgren and White (2012) found
35 eddies over a 6 year period from 2001 in the southern part
of the trough between 50◦ and 56◦ N using satellite altime-
try and mid-water ARGOS floats. Cyclonic eddies tended to
enter along the track of the NAC and anti-cyclonic eddies
were found along the path of the slope current and may have
included Mediterranean Overflow Water. The eddies were
typically slow moving and their cores had radii of ∼ 27 km,
and the floats had an orbital speed of 20 cm s−1. The energy
sources of this motion are not certain, but EKE levels in the
trough had a seasonal peak in spring, so they may have been
wind forced.
More generally, there have been several large-scale stud-
ies of circulation of the North Atlantic as a whole based on
archived data sets. Satellite altimetry (Heywood et al., 1994;
Volkov, 2005) indicates enhanced levels of EKE in the Rock-
all Trough (order 100 cm2 s−2) that contrasts with the quies-
cent Rockall–Hatton Plateau. Surface drifter tracks (Fratan-
toni, 2001; Jakobsen et al., 2003) across the North Atlantic
reveal a similar picture, with the latter finding that bound-
ary currents were enhanced by wind stress in winter, which
in turn seemed to lead to enhanced instability and the ap-
pearance of increased mesoscale activity in spring. A study
of intermediate depth drifters (Argo floats, RAFOS drifters,
for example) indicated EKE levels of order 20–40 cm2 s−2 at
depths between 1500 and 1750 m in the southern part of the
Rockall Trough (Lankhorst and Zenk, 2006).
To sum up, historical observations suggest that the Rock-
all Trough has a moderate level of EKE activity which ranges
from a maximum of about 100 cm2 s−2 at the surface to about
25 cm2 s−2 at 1500 m. There is evidence of a seasonal signal
www.ocean-sci.net/11/343/2015/ Ocean Sci., 11, 343–359, 2015
346 T. J. Sherwin et al.: Deep drivers of mesoscale circulation in the central Rockall Trough
-25
00
0
25
13.5 13 12.5 12 11.5 11 10.5 10 9.5 9Longitude (W)
v (northwards) / cm s-1
2
1
0
Dep
th /
km
-10
-5
-5
00
0
0
0
0
5
5
13.5 13 12.5 12 11.5 11 10.5 10 9.5 9
u (eastwards) / cm s-1
2
1
0
Dep
th /
km
< -45
> 50 > 20
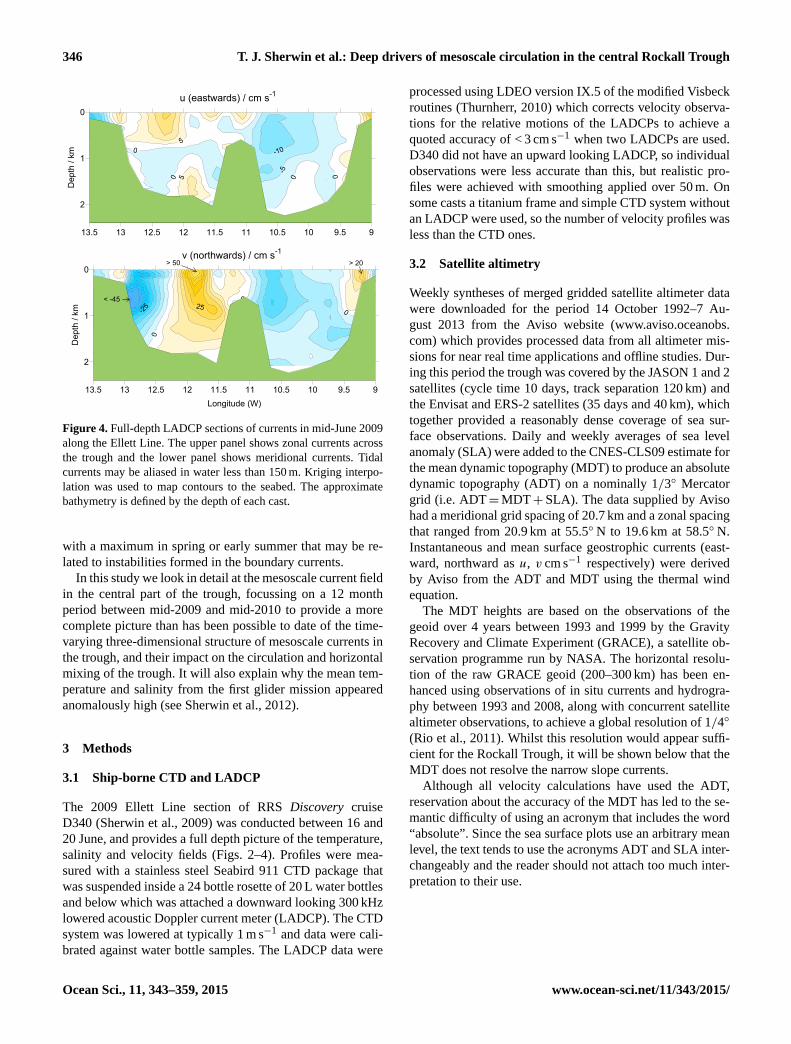
Figure 4. Full-depth LADCP sections of currents in mid-June 2009
along the Ellett Line. The upper panel shows zonal currents across
the trough and the lower panel shows meridional currents. Tidal
currents may be aliased in water less than 150 m. Kriging interpo-
lation was used to map contours to the seabed. The approximate
bathymetry is defined by the depth of each cast.
with a maximum in spring or early summer that may be re-
lated to instabilities formed in the boundary currents.
In this study we look in detail at the mesoscale current field
in the central part of the trough, focussing on a 12 month
period between mid-2009 and mid-2010 to provide a more
complete picture than has been possible to date of the time-
varying three-dimensional structure of mesoscale currents in
the trough, and their impact on the circulation and horizontal
mixing of the trough. It will also explain why the mean tem-
perature and salinity from the first glider mission appeared
anomalously high (see Sherwin et al., 2012).
3 Methods
3.1 Ship-borne CTD and LADCP
The 2009 Ellett Line section of RRS Discovery cruise
D340 (Sherwin et al., 2009) was conducted between 16 and
20 June, and provides a full depth picture of the temperature,
salinity and velocity fields (Figs. 2–4). Profiles were mea-
sured with a stainless steel Seabird 911 CTD package that
was suspended inside a 24 bottle rosette of 20 L water bottles
and below which was attached a downward looking 300 kHz
lowered acoustic Doppler current meter (LADCP). The CTD
system was lowered at typically 1 m s−1 and data were cali-
brated against water bottle samples. The LADCP data were
processed using LDEO version IX.5 of the modified Visbeck
routines (Thurnherr, 2010) which corrects velocity observa-
tions for the relative motions of the LADCPs to achieve a
quoted accuracy of < 3 cm s−1 when two LADCPs are used.
D340 did not have an upward looking LADCP, so individual
observations were less accurate than this, but realistic pro-
files were achieved with smoothing applied over 50 m. On
some casts a titanium frame and simple CTD system without
an LADCP were used, so the number of velocity profiles was
less than the CTD ones.
3.2 Satellite altimetry
Weekly syntheses of merged gridded satellite altimeter data
were downloaded for the period 14 October 1992–7 Au-
gust 2013 from the Aviso website (www.aviso.oceanobs.
com) which provides processed data from all altimeter mis-
sions for near real time applications and offline studies. Dur-
ing this period the trough was covered by the JASON 1 and 2
satellites (cycle time 10 days, track separation 120 km) and
the Envisat and ERS-2 satellites (35 days and 40 km), which
together provided a reasonably dense coverage of sea sur-
face observations. Daily and weekly averages of sea level
anomaly (SLA) were added to the CNES-CLS09 estimate for
the mean dynamic topography (MDT) to produce an absolute
dynamic topography (ADT) on a nominally 1/3◦ Mercator
grid (i.e. ADT=MDT+SLA). The data supplied by Aviso
had a meridional grid spacing of 20.7 km and a zonal spacing
that ranged from 20.9 km at 55.5◦ N to 19.6 km at 58.5◦ N.
Instantaneous and mean surface geostrophic currents (east-
ward, northward as u, v cm s−1 respectively) were derived
by Aviso from the ADT and MDT using the thermal wind
equation.
The MDT heights are based on the observations of the
geoid over 4 years between 1993 and 1999 by the Gravity
Recovery and Climate Experiment (GRACE), a satellite ob-
servation programme run by NASA. The horizontal resolu-
tion of the raw GRACE geoid (200–300 km) has been en-
hanced using observations of in situ currents and hydrogra-
phy between 1993 and 2008, along with concurrent satellite
altimeter observations, to achieve a global resolution of 1/4◦
(Rio et al., 2011). Whilst this resolution would appear suffi-
cient for the Rockall Trough, it will be shown below that the
MDT does not resolve the narrow slope currents.
Although all velocity calculations have used the ADT,
reservation about the accuracy of the MDT has led to the se-
mantic difficulty of using an acronym that includes the word
“absolute”. Since the sea surface plots use an arbitrary mean
level, the text tends to use the acronyms ADT and SLA inter-
changeably and the reader should not attach too much inter-
pretation to their use.
Ocean Sci., 11, 343–359, 2015 www.ocean-sci.net/11/343/2015/
T. J. Sherwin et al.: Deep drivers of mesoscale circulation in the central Rockall Trough 347
Table 1. Summary of the dives used in most of the calculations and transit plots described below and (bottom row) equivalent speeds from
the Ellett Line section during D340. Drift and standard deviation speeds are the scalar mean values per transit. (W) and (E) indicate the
direction of travel.
Transit Dive nos Start End Glider drift Aviso surface
speed (cms−1) speed (cms−1)
1 (W) 235 : 304 18 Oct 31 Oct 16.3± 7.6 14.8± 8.0
2 (E) 304 : 353 31 Oct 12 Nov 15.2± 7.0 13.9± 7.8
3 (W) [353 : 370 500 : 532]a 12 Nov 29 Dec 11.3± 5.8 14.1± 3.6
4 (E) 532 : 592 29 Dec 13 Jan 12.7± 6.3 8.8± 4.4
5 (W) 592 : 636 13 Jan 25 Jan 15.5± 7.3 7.8± 4.3
6 (E) [636 : 647 673 : 708]a 25 Jan 14 Feb 17.3± 6.1 6.8± 3.5
7 (W) 708 : 742 14 Feb 23 Feb 18.0± 8.1 9.9± 4.3
8 (E) 742 : 780 23 Feb 5 Mar 16.0± 7.8 8.4± 3.3
Average 15.3± 7.0 10.6± 4.9
D340 (LADCP) – Jun 2009 17.0 (20.2b) 9.1
a The gaps in transits 3 and 6 are explained in the text; b mean current speed in the top 50 m (other D340 speeds are averaged over
1000 m).
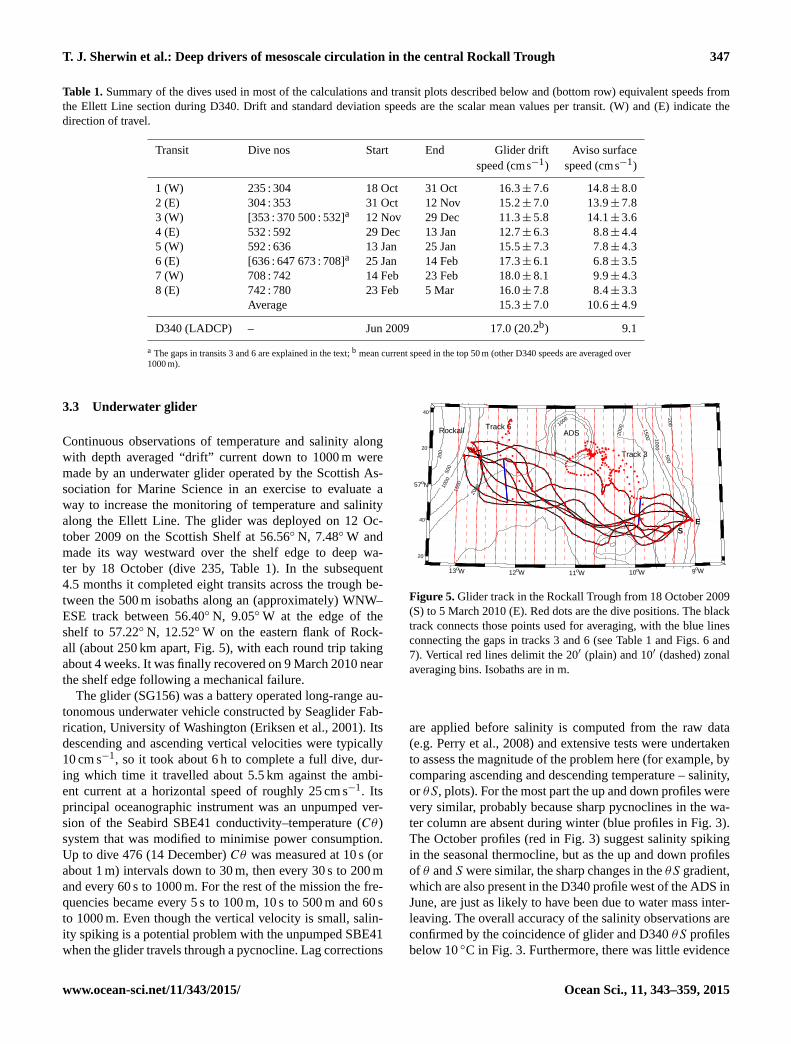
3.3 Underwater glider
Continuous observations of temperature and salinity along
with depth averaged “drift” current down to 1000 m were
made by an underwater glider operated by the Scottish As-
sociation for Marine Science in an exercise to evaluate a
way to increase the monitoring of temperature and salinity
along the Ellett Line. The glider was deployed on 12 Oc-
tober 2009 on the Scottish Shelf at 56.56◦ N, 7.48◦W and
made its way westward over the shelf edge to deep wa-
ter by 18 October (dive 235, Table 1). In the subsequent
4.5 months it completed eight transits across the trough be-
tween the 500 m isobaths along an (approximately) WNW–
ESE track between 56.40◦ N, 9.05◦W at the edge of the
shelf to 57.22◦ N, 12.52◦W on the eastern flank of Rock-
all (about 250 km apart, Fig. 5), with each round trip taking
about 4 weeks. It was finally recovered on 9 March 2010 near
the shelf edge following a mechanical failure.
The glider (SG156) was a battery operated long-range au-
tonomous underwater vehicle constructed by Seaglider Fab-
rication, University of Washington (Eriksen et al., 2001). Its
descending and ascending vertical velocities were typically
10 cm s−1, so it took about 6 h to complete a full dive, dur-
ing which time it travelled about 5.5 km against the ambi-
ent current at a horizontal speed of roughly 25 cm s−1. Its
principal oceanographic instrument was an unpumped ver-
sion of the Seabird SBE41 conductivity–temperature (Cθ )
system that was modified to minimise power consumption.
Up to dive 476 (14 December) Cθ was measured at 10 s (or
about 1 m) intervals down to 30 m, then every 30 s to 200 m
and every 60 s to 1000 m. For the rest of the mission the fre-
quencies became every 5 s to 100 m, 10 s to 500 m and 60 s
to 1000 m. Even though the vertical velocity is small, salin-
ity spiking is a potential problem with the unpumped SBE41
when the glider travels through a pycnocline. Lag corrections
200015
001000
500
200
1000
2000 1500 1000
500200
13oW 12oW 11oW 10oW 9oW
20’
40’
57oN
20’
40’
Rockall ADS
Track 3
Track 6
SE
Figure 5. Glider track in the Rockall Trough from 18 October 2009
(S) to 5 March 2010 (E). Red dots are the dive positions. The black
track connects those points used for averaging, with the blue lines
connecting the gaps in tracks 3 and 6 (see Table 1 and Figs. 6 and
7). Vertical red lines delimit the 20′ (plain) and 10′ (dashed) zonal
averaging bins. Isobaths are in m.
are applied before salinity is computed from the raw data
(e.g. Perry et al., 2008) and extensive tests were undertaken
to assess the magnitude of the problem here (for example, by
comparing ascending and descending temperature – salinity,
or θS, plots). For the most part the up and down profiles were
very similar, probably because sharp pycnoclines in the wa-
ter column are absent during winter (blue profiles in Fig. 3).
The October profiles (red in Fig. 3) suggest salinity spiking
in the seasonal thermocline, but as the up and down profiles
of θ and S were similar, the sharp changes in the θS gradient,
which are also present in the D340 profile west of the ADS in
June, are just as likely to have been due to water mass inter-
leaving. The overall accuracy of the salinity observations are
confirmed by the coincidence of glider and D340 θS profiles
below 10 ◦C in Fig. 3. Furthermore, there was little evidence
www.ocean-sci.net/11/343/2015/ Ocean Sci., 11, 343–359, 2015

348 T. J. Sherwin et al.: Deep drivers of mesoscale circulation in the central Rockall Trough
0
0.2
0.4
0.6
0.8
1
26.8
26.9
26.9
27
27
27.1
27.1
27.2
27.2
27.3
27.3
27.4
27.527.5
Dep
th /
km
235304
13oW 12oW 11oW 10oW 9oW
30'
45'
57oN
15'
30'
20 cm s-1
T1
0
0.2
0.4
0.6
0.8
1
26.92727.1
27.2
27.3
27.4
27.5
Dep
th /
km
304 353
13oW 12oW 11oW 10oW 9oW
30'
45'
57oN
15'
30'
20 cm s-1
T2
0
0.2
0.4
0.6
0.8
1 26.9
27.127.2
27.3
27.427.427.5
Dep
th /
km
353532
13oW 12oW 11oW 10oW 9oW
30'
45'
57oN
15'
30'
20 cm s-1
T3
-13 -12 -11 -10 -9
0
0.2
0.4
0.6
0.8
1
27.2
27.3
27.427.427.5
Dep
th /
km
Longitude (W)
532 592
13oW 12oW 11oW 10oW 9oW
30'
45'
57oN
15'
30'
20 cm s-1
T4
Figure 6a. Summary of observations from each of transits 1 to 4.
LH column: density anomaly sections (kg m−3) to 1000 m along
the dotted track shown in the accompanying map. Also, the SLA
(plain red line) is plotted as cm about 500 m (dotted red line), with
the dashed red lines showing heights of±10 cm. RH column: glider
drift velocity vectors. All dive data (dotted red line) were averaged
into 20′ bins before plotting. The labels “T1”–“T4” over the ADS
in the RH column identify transits 1 to 4; see also Table 1.
of fouling on recovery, and pre- and post-mission CTD cali-
brations by Seabird Electronics indicated that there had been
negligible drift in any of the sensors.
The surface positions of the glider were accurately deter-
mined from GPS fixes. Dive averaged ambient current ve-
locities (or “drift” velocities) were computed using an algo-
rithm based on a theoretical model of the glider’s hydrody-
namic performance through the water, which determines the
difference between the expected and measured surfacing po-
sitions at the end of each dive. However, this calculation is
sensitive to the accuracy of the glider’s internal compass, and
in post-processing it was found that a significant difference
existed in the mean drift velocity measured during the east-
ward and westward transitions of the trough (about 7 and
10 cm s−1 southward respectively). Theoretical tests of pos-
sible error scenarios demonstrated that such a difference can
0
0.2
0.4
0.6
0.8
1 27.3
27.3
27.427.5
Dep
th /
km
592636
13oW 12oW 11oW 10oW 9oW
30'
45'
57oN
15'
30'
20 cm s-1
T5
0
0.2
0.4
0.6
0.8
1 27.3
27.3
27.427.5
Dep
th /
km
636 708
13oW 12oW 11oW 10oW 9oW
30'
45'
57oN
15'
30'
20 cm s-1
T6
0
0.2
0.4
0.6
0.8
1 27.3
27.3
27.4
27.4
27.5
27.5
Dep
th /
km
708741
13oW 12oW 11oW 10oW 9oW
30'
45'
57oN
15'
30'
20 cm s-1
T7
-13 -12 -11 -10 -9
0
0.2
0.4
0.6
0.8
1 27.3
27.3
27.4
27.4
27.527.527.5
Dep
th /
km
Longitude (W)
744 780
13oW 12oW 11oW 10oW 9oW
30'
45'
57oN
15'
30'
20 cm s-1
T8
Figure 6b. Same as Fig. 6a but for tracks 5–8 (“T5”–“T8”).
be explained by a non-linear error in the compass measure-
ments (a similar error has been reported by Merckelbach et
al., 2008, for a different glider system). As a result, it was not
possible to determine basin-wide transport. Other theoretical
tests, however, indicated that the faster local eddy currents
were reasonably well measured.
3.4 Data analysis
The spatial mean EKE in the central Rockall Trough between
latitudes 56◦ and 58◦ N and longitudes 9◦ and 13◦W was
computed from the ADT currents as
EKE=(var u+ var v)
2,
where var is the variance at each grid point. Error in the mean
of N observations of EKE (err) was computed as
err=SD(EKE)√N
,
where SD is the standard deviation of the observations.
For Table 1 and Fig. 6 glider data from a specific transit
of the trough were averaged into 10′ longitude (about 10 km)
Ocean Sci., 11, 343–359, 2015 www.ocean-sci.net/11/343/2015/
T. J. Sherwin et al.: Deep drivers of mesoscale circulation in the central Rockall Trough 349
wide meridional bins (see Fig. 5). The mean positions of the
dives within a bin were then computed and the values of
other data were determined by interpolating horizontally to
the centre positions of the bins. The mean transit speeds and
their standard deviations were derived by averaging individ-
ual speeds from the dives listed in Table 1. Density anoma-
lies, shown as σt in Fig. 6, from each downward and upward
dive were averaged into 5 m vertical bins and then smoothed
in the vertical with a 25 m half-width Hamming filter before
they were averaged into 20′ longitudinal bins for presenta-
tion.
The glider track deviated significantly from the in-
tended transit on two occasions and data collected between
16 November and 20 December (Transit 3, when it had to
be piloted out of a strong opposing current and communica-
tion was then lost for a while) and between 28 January and
4 February (Transit 6, when it was directed to investigate a
potential eddy) have been omitted from the analysis (see Ta-
ble 1). In making the bin averages no allowance was made
for these gaps, even though they were quite extensive. Al-
though the gap in Transit 3 lasted about 5 weeks, both den-
sity sections appear sufficiently continuous (Fig. 6) that the
discontinuity in the data is unlikely to have compromised the
general findings.
It is possible to compare the different Aviso and glider
data sets directly by deriving equivalent time series. This was
achieved by interpolating the 3-D (in space and time) fields
of ADT and surface currents to match the time and position
of individual glider observations. This time series was then
processed and averaged in the same way as the glider data.
3.5 Compatibility issues between glider and altimeter
observations
Mission 1 was conceived before gliders had become proven
platforms in the North Atlantic and its success during a win-
ter deployment was a stimulus for further uptake of gliders
in the UK. There are especial challenges to analysing glider
data, because they are slow moving vehicles and in a strong
mesoscale current field their frame of reference is constantly
moving. At first sight it would appear that data from a ve-
hicle that takes about 2 weeks to cross the Rockall Trough
would be incompatible with those from a satellite that ev-
ery 2 weeks makes a single instantaneous measurement of
SLA along a line that will usually be at least 10 km from the
glider. The problem is further compounded by the fact that
these length scales and timescales are comparable to those
of the mesoscale currents that dominate the central Rockall
Trough.
Hátún et al. (2007) combined glider and altimeter data
to describe the structure of an anti-cyclonic eddy in the
Labrador Sea, and Martin et al. (2009) used altimetry and
repeated glider passes to analyse a long lasting stationary
eddy in the Gulf of Alaska. In Mission 1 the glider tended to
be carried in the faster currents that flowed around cyclones
rather than through them (see Fig. 7 and the video in the Sup-
plement), so a comparison of the structure of different eddies
was not undertaken. Instead we have chosen to look at the
general nature of the mesoscale eddy field. (Incidentally, the
few cloud-free satellite observations of the surface showed
minimal horizontal variation in winter temperatures and did
not reveal the distribution of the deep eddy field.)
4 Background observations
4.1 The evolution of temperature and salinity
During June 2009 the seasonal thermocline was well estab-
lished in the upper 100 m of the water column and there was
clear evidence in the salinity signal of the influence of the
slope current, in the upper 500 m on the eastern side, spread-
ing across to the centre of the trough (Fig. 2). The deep ther-
mocline (about 7.5 ◦C) which was located at about 800 m to
the west of the ADS descended to about 1000 m on its east-
ern side (Figs. 2 and 3). The deep part of the water column
was marked by gradual decreases in temperature and salinity
with depth.
Seasonal warming and freshening of the surface layers on
both sides of the trough persisted until October, but after that
stratification weakened so that by February the upper 500 m
was uniformly mixed. By and large the profiles of θ and S
in the upper 1000 m on the eastern side of the trough were
well behaved and almost equally mixed between NAW in the
centre of the trough and the more saline ENAW. To the west
of the seamount, away from the influence of the shelf edge
current, the changes in the profile appeared more dynamic,
with an apparent interleaving between ENAW and the cooler
and fresher NAW. Between October and February, and below
about 200 m, this side of the trough also experienced remark-
able increases in both θ and S as NAW appeared to be forced
down by as much as 800 m. A reason for these increases is
discussed later.
4.2 The velocity field during Discovery cruise D340
The directly observed full-depth LADCP sections (Fig. 4)
dispel any notion that the currents in waters of the central
trough are either slow or vertically uniform. There was a fast
southward flowing current (up to 45 cm s−1) along the slope
of the Rockall Bank that is much stronger than the Aviso
equivalent. There is a suggestion of an extensive feature that
filled the space west of the ADS, which manifested itself in a
pronounced surface depression of the SLA running down the
western side of the trough. The sea surface had a particularly
steep zonal gradient on the western side of the ADS (Fig. 8),
which complemented the westward uplift of the deep pycno-
cline centred on 900 m (Figs. 2 and 3) and the strong in situ
meridional currents (Fig. 4). The directly observed current
of more than 25 cm s−1 that flowed northward along the up-
per edge of the Malin Shelf appears, surprisingly, as a weak
www.ocean-sci.net/11/343/2015/ Ocean Sci., 11, 343–359, 2015
350 T. J. Sherwin et al.: Deep drivers of mesoscale circulation in the central Rockall Trough
200
200
200
1000
1000
1000
1000
1000
25 cm s-1
14oW 13oW 12oW 11oW 10
oW 9oW
30'
56oN
30'
57oN
30'
58oN
30'
SLA / cm-20 -10 0 10 20
200
200
200
1000
1000
1000
1000
1000
25 cm s-1
14oW 13oW 12oW 11oW 10
oW 9oW
30'
56oN
30'
57oN
30'
58oN
30'
SLA / cm-20 -10 0 10 20
200
200
200
1000
1000
1000
1000
1000
25 cm s-1
14oW 13oW 12oW 11oW 10
oW 9oW
30'
56oN
30'
57oN
30'
58oN
30'
SLA / cm-20 -10 0 10 20
200
200
200
1000
1000
1000
1000
1000
25 cm s-1
14oW 13oW 12oW 11oW 10
oW 9oW
30'
56oN
30'
57oN
30'
58oN
30'
SLA / cm-20 -10 0 10 20
200
200
200
1000
1000
1000
1000
1000
25 cm s-1
14oW 13oW 12oW 11oW 10
oW 9oW
30'
56oN
30'
57oN
30'
58oN
30'
SLA / cm-20 -10 0 10 20
200
200
200
1000
1000
1000
1000
1000
25 cm s-1
14oW 13oW 12oW 11oW 10
oW 9oW
30'
56oN
30'
57oN
30'
58oN
30'
SLA / cm-20 -10 0 10 20
AC
BA
AC
AC
D
BA
CC
D
EA
CC
GC
EA
FC
a)
e) f)
c) d)
b)
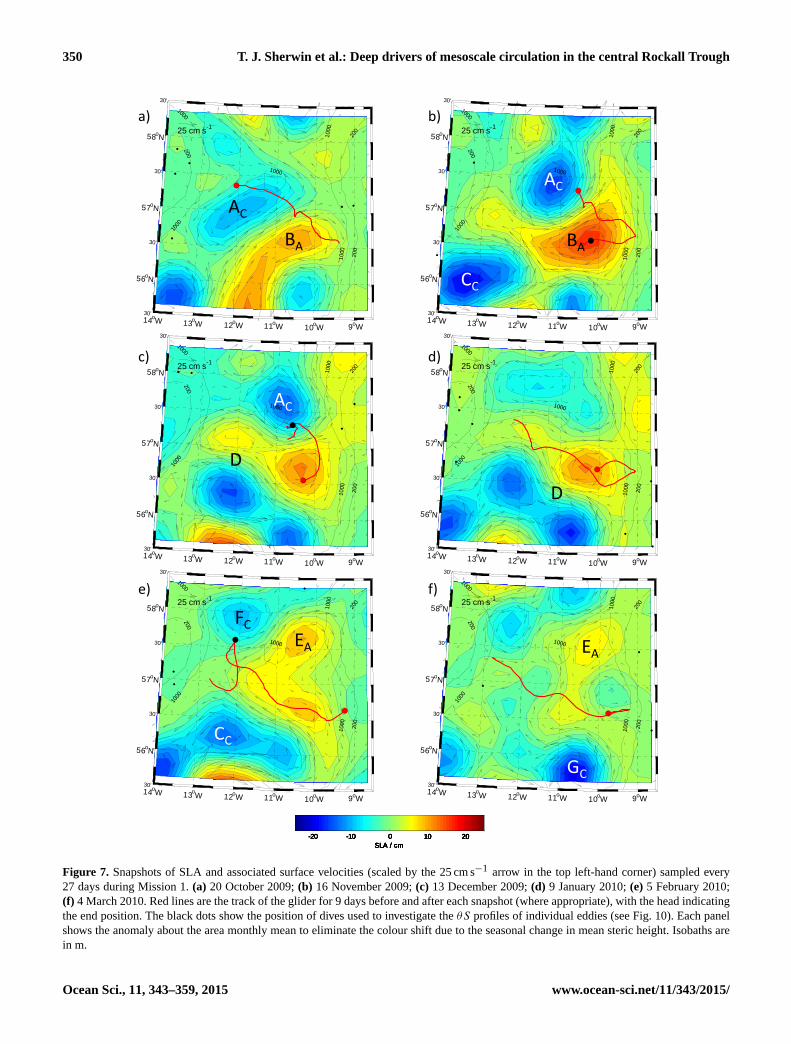
Figure 7. Snapshots of SLA and associated surface velocities (scaled by the 25 cm s−1 arrow in the top left-hand corner) sampled every
27 days during Mission 1. (a) 20 October 2009; (b) 16 November 2009; (c) 13 December 2009; (d) 9 January 2010; (e) 5 February 2010;
(f) 4 March 2010. Red lines are the track of the glider for 9 days before and after each snapshot (where appropriate), with the head indicating
the end position. The black dots show the position of dives used to investigate the θS profiles of individual eddies (see Fig. 10). Each panel
shows the anomaly about the area monthly mean to eliminate the colour shift due to the seasonal change in mean steric height. Isobaths are
in m.
Ocean Sci., 11, 343–359, 2015 www.ocean-sci.net/11/343/2015/
T. J. Sherwin et al.: Deep drivers of mesoscale circulation in the central Rockall Trough 351
200
200
200
200
200
1000
1000
1000
1000
1000 1000
50 cm s-1
14oW 13oW 12oW 11oW 10oW 9oW
30'
56oN
30'
57oN
30'
58oN
30'
SLA / cm-20 -10 0 10 20
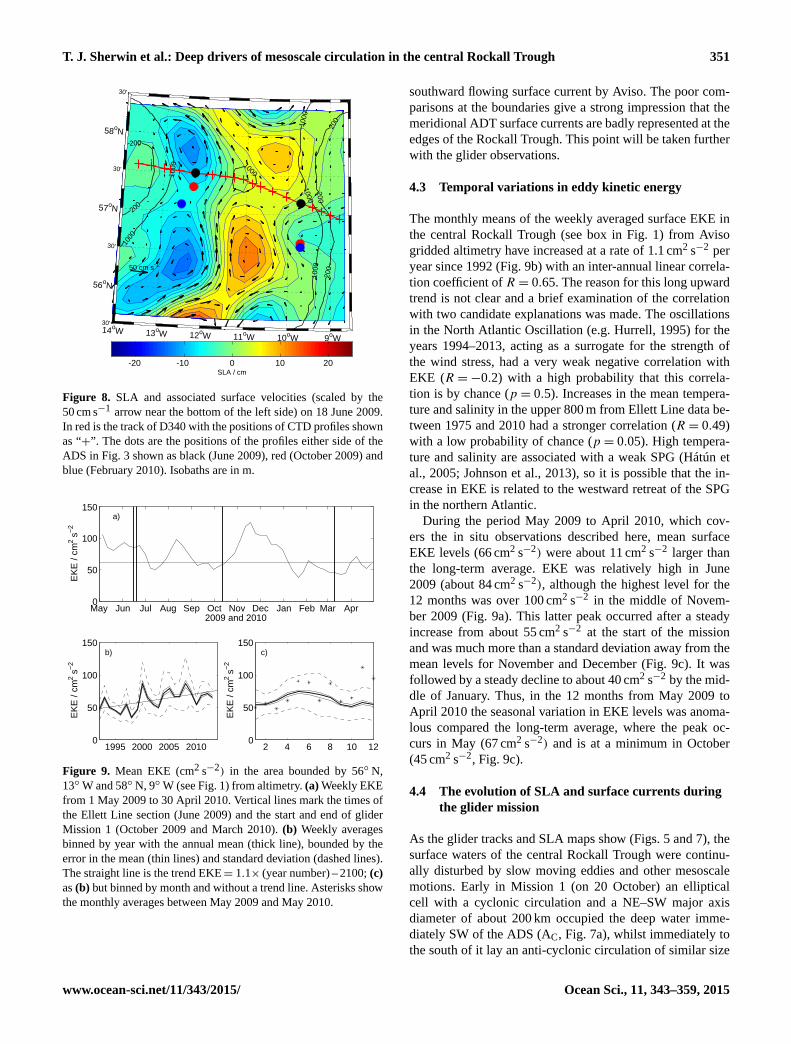
Figure 8. SLA and associated surface velocities (scaled by the
50 cm s−1 arrow near the bottom of the left side) on 18 June 2009.
In red is the track of D340 with the positions of CTD profiles shown
as “+”. The dots are the positions of the profiles either side of the
ADS in Fig. 3 shown as black (June 2009), red (October 2009) and
blue (February 2010). Isobaths are in m.
May Jun Jul Aug Sep Oct Nov Dec Jan Feb Mar Apr0
50
100
150
EK
E /
cm2 s
−2
2009 and 2010
a)
1995 2000 2005 20100
50
100
150
EK
E /
cm2 s
−2
b)
2 4 6 8 10 120
50
100
150
EK
E /
cm2 s
−2
c)
Figure 9. Mean EKE (cm2 s−2) in the area bounded by 56◦ N,
13◦W and 58◦ N, 9◦W (see Fig. 1) from altimetry. (a) Weekly EKE
from 1 May 2009 to 30 April 2010. Vertical lines mark the times of
the Ellett Line section (June 2009) and the start and end of glider
Mission 1 (October 2009 and March 2010). (b) Weekly averages
binned by year with the annual mean (thick line), bounded by the
error in the mean (thin lines) and standard deviation (dashed lines).
The straight line is the trend EKE= 1.1× (year number) – 2100; (c)
as (b) but binned by month and without a trend line. Asterisks show
the monthly averages between May 2009 and May 2010.
southward flowing surface current by Aviso. The poor com-
parisons at the boundaries give a strong impression that the
meridional ADT surface currents are badly represented at the
edges of the Rockall Trough. This point will be taken further
with the glider observations.
4.3 Temporal variations in eddy kinetic energy
The monthly means of the weekly averaged surface EKE in
the central Rockall Trough (see box in Fig. 1) from Aviso
gridded altimetry have increased at a rate of 1.1 cm2 s−2 per
year since 1992 (Fig. 9b) with an inter-annual linear correla-
tion coefficient of R = 0.65. The reason for this long upward
trend is not clear and a brief examination of the correlation
with two candidate explanations was made. The oscillations
in the North Atlantic Oscillation (e.g. Hurrell, 1995) for the
years 1994–2013, acting as a surrogate for the strength of
the wind stress, had a very weak negative correlation with
EKE (R =−0.2) with a high probability that this correla-
tion is by chance (p = 0.5). Increases in the mean tempera-
ture and salinity in the upper 800 m from Ellett Line data be-
tween 1975 and 2010 had a stronger correlation (R = 0.49)
with a low probability of chance (p = 0.05). High tempera-
ture and salinity are associated with a weak SPG (Hátún et
al., 2005; Johnson et al., 2013), so it is possible that the in-
crease in EKE is related to the westward retreat of the SPG
in the northern Atlantic.
During the period May 2009 to April 2010, which cov-
ers the in situ observations described here, mean surface
EKE levels (66 cm2 s−2) were about 11 cm2 s−2 larger than
the long-term average. EKE was relatively high in June
2009 (about 84 cm2 s−2), although the highest level for the
12 months was over 100 cm2 s−2 in the middle of Novem-
ber 2009 (Fig. 9a). This latter peak occurred after a steady
increase from about 55 cm2 s−2 at the start of the mission
and was much more than a standard deviation away from the
mean levels for November and December (Fig. 9c). It was
followed by a steady decline to about 40 cm2 s−2 by the mid-
dle of January. Thus, in the 12 months from May 2009 to
April 2010 the seasonal variation in EKE levels was anoma-
lous compared the long-term average, where the peak oc-
curs in May (67 cm2 s−2) and is at a minimum in October
(45 cm2 s−2, Fig. 9c).
4.4 The evolution of SLA and surface currents during
the glider mission
As the glider tracks and SLA maps show (Figs. 5 and 7), the
surface waters of the central Rockall Trough were continu-
ally disturbed by slow moving eddies and other mesoscale
motions. Early in Mission 1 (on 20 October) an elliptical
cell with a cyclonic circulation and a NE–SW major axis
diameter of about 200 km occupied the deep water imme-
diately SW of the ADS (AC, Fig. 7a), whilst immediately to
the south of it lay an anti-cyclonic circulation of similar size
www.ocean-sci.net/11/343/2015/ Ocean Sci., 11, 343–359, 2015
352 T. J. Sherwin et al.: Deep drivers of mesoscale circulation in the central Rockall Trough
(BA). A strong east to north-eastward current (> 20 cm s−1)
marked the boundary between them. During the first part of
November, AC moved NE onto the seamount, where it in-
tensified and seemed to become anchored until the middle
of December, with a circular diameter of about 100 km and
current speeds in excess of 20 cm s−1 (Fig. 7b and c). Mean-
while, BA drifted eastward to the north of the Hebrides Ter-
race Seamount and a cyclonic cell (or eddy) started to drift
into the picture from the southwestern corner (CC, Fig. 7b).
By the middle part of November a westward flowing cur-
rent with maximum surface speeds in excess of 30 cm s−1
had formed in the southern part of the region (D). From then
on the pattern of alternating cyclonic and anti-cyclonic ed-
dies persisted throughout December (Fig. 7c), whilst they
slowly lost energy until by 9 January average EKE in the
region had weakened to < 50 cm2 s−2 (Figs. 7d and 9a). Nev-
ertheless, these cells were still sufficiently intense to be able
to drive a pronounced anti-cyclonic circulation westward
across the trough between the two seamounts. From then on
mesoscale activity increased a little so that by 5 February
an anti-cyclonic circulation (EA), which may have evolved
from BA, had become trapped on or close to the ADS with
current speeds only little less than the earlier AC. At the same
time the broad cyclonic circulation, CC, had become estab-
lished in the southern part of the region (Fig. 7e) and a new
cyclonic eddy (FC) had appeared to the north-west of the
ADS. Finally, by the start of March, EA had weakened a lit-
tle above the ADS, whilst CC had disappeared and a new cy-
clonic eddy, GC, had appeared close to the Malin Shelf edge
between the ADS and the Hebrides Terrace Seamount.
Overall, the mesoscale motions in the deep water of the
Rockall Trough seemed to be distributed in a fairly arbitrary
pattern, although the circulations were arranged like gears in
a pattern of anti-cyclonic/cyclonic cells. It is intriguing that
both anti-cyclonic and cyclonic cells were able to occupy the
top of the ADS, and it appears that the precise sense of cir-
culation was determined more by the regional arrangement
of the cells than by a local dynamic balance formed by the
seamount itself. The vertical extent of these surface cells is
described below.
A word of caution is necessary here. Later analysis that
questions the validity of the background MDT in the Rock-
all Trough will throw doubt on the intensity on the anti-
cyclonic circulations between the ADS and the Hebrides Ter-
race Seamount.
5 Sub-surface glider observations winter 2009/2010
Satellite altimeter observations of ADT and surface veloc-
ity give valuable information about the spatial and tempo-
ral scales of mesoscale variability in the Rockall Trough, but
they provide a poor representation at boundaries and cannot
reveal detail of the structure below the surface. Ship-borne
sections such as those of D340 help to address these omis-
sions, but are of necessity rare. By contrast, the underwater
glider provides measurements of the density structure and ve-
locity field that through the use of repeated sections help to
construct a more complete picture of the variability below the
surface.
5.1 Glider profiles and drift currents
It is quite difficult to navigate a glider precisely in a field
of apparently random mesoscale currents that have a similar
speed to its forward velocity. During Mission 1 the glider en-
countered ambient current speeds of over 24 cm s−1 in 25 %
of the dives, and at such times it might either be stopped dead,
forced sideways or backwards, or race forward (hence the
uneven spacing of the dive positions in Figs. 5 and 6). As
a precaution (since this was its first mission) the glider was
kept outside the 500 m isobath so that it did not measure the
strength of the slope currents in the shallower water on either
side of the trough. The original plan to pass across the top
of the ADS along the Ellett Line route was abandoned after
Transit 4 because the opposing currents near the seamount
were too strong in the early part of the mission.
5.2 Changes in temperature and salinity profiles across
the trough
At the beginning of Mission 1 the surface temperature and
salinity at the shelf edge were about 12.6 ◦C and 35.45 re-
spectively (Fig. 3), fractionally warmer and fresher than that
observed by D340 on 19 June (12.3 ◦C and 35.47). The tem-
perature and salinity sections of the upper 200 m from Tran-
sit 1 were generally similar to those from D340. Over winter,
between mid-October 2009 and the end of February 2010,
surface stratification was gradually eroded and deepened so
that by March the upper 500 m was almost isothermal and
isohaline (Figs. 3 and 6). By contrast, the θS profiles below
about 600 m (9.5 ◦C and 34) were very similar apart from
vertical displacement due to the mesoscale motions, and are
typical of Ellett Line profiles, which contain WTOW at in-
termediate depths (Johnson et al., 2010). In many transits
the near-surface isopyncals were roughly horizontal, whereas
those deeper in the water column (below about 600 m or
σt ∼ 27.3 kg m−3) had large and uneven variations in depth
(with undulations up to 200 m high and 50 km wide) across
the trough.
Over the course of the mission many of the changes in the
track of the glider visually correlated with the ambient drift
velocities and the undulating depth of the deep isopycnals
(Fig. 6). (These correlations were observed to steadily evolve
in real time as the plots from successive dives were updated
on the mission console.) There also appears to be an inverse
correlation between the depth of the SLA and the height of
the deep isopycnals along the glider track. Mesoscale gradi-
ents of the deeper (rather than shallower) isopycnals of the
trough were associated with depth mean current speeds mea-
Ocean Sci., 11, 343–359, 2015 www.ocean-sci.net/11/343/2015/
T. J. Sherwin et al.: Deep drivers of mesoscale circulation in the central Rockall Trough 353
7 8 9 10 11 12 13
0
200
400
600
800
1000
Potential Temperature / oC
Pre
ssur
e / d
bar
a)
35.2 35.3 35.4 35.5
0
200
400
600
800
1000
Salinity
Pre
ssur
e / d
bar
b)
26.8 27 27.2 27.4 27.6
0
200
400
600
800
1000
Pre
ssur
e / d
bar
Density anomaly / kg m-3
c)
35.2 35.3 35.4 35.56
7
8
9
10
11
12
13
6.8
26.8
27
27
27.2
27.4
27.6
8
2
Salinity
Pot
entia
l Tem
pera
ture
/ o C
6.8
26.8
27
27
27.2
27.4
27.6
8
2
6.8
26.8
27
27
27.2
27.4
27.6
8
2
NAW .ENAW
. WTOW
d)
BA
AC
FC
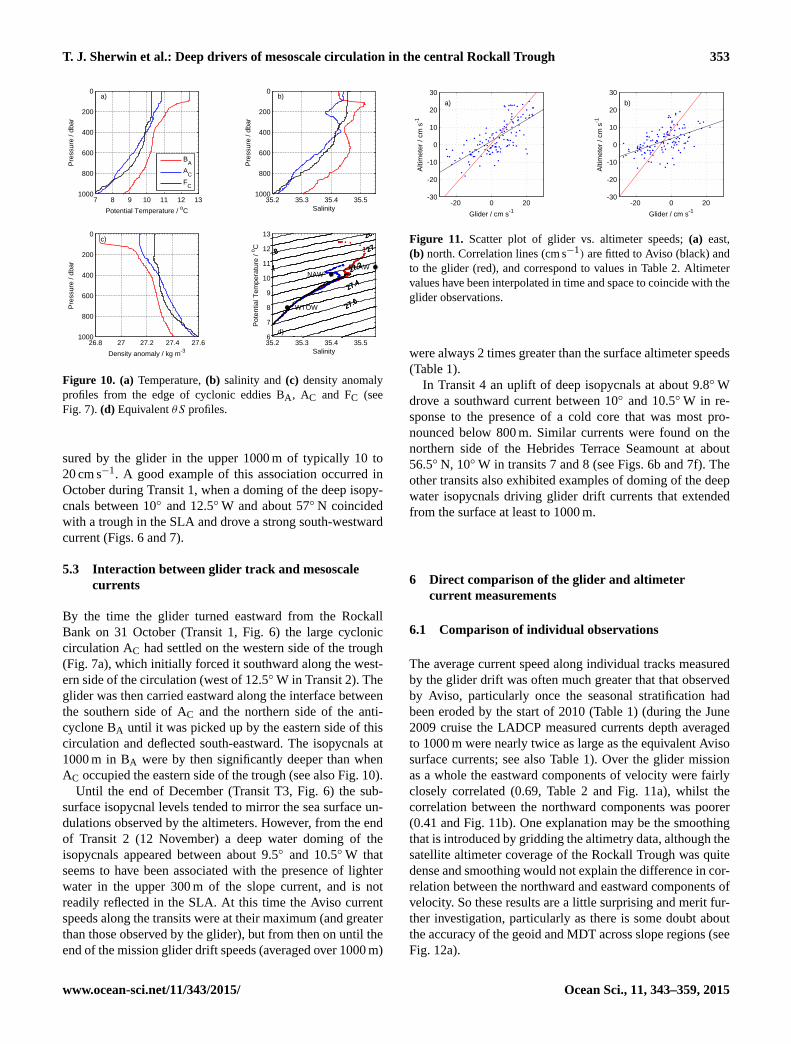
Figure 10. (a) Temperature, (b) salinity and (c) density anomaly
profiles from the edge of cyclonic eddies BA, AC and FC (see
Fig. 7). (d) Equivalent θS profiles.
sured by the glider in the upper 1000 m of typically 10 to
20 cm s−1. A good example of this association occurred in
October during Transit 1, when a doming of the deep isopy-
cnals between 10◦ and 12.5◦W and about 57◦ N coincided
with a trough in the SLA and drove a strong south-westward
current (Figs. 6 and 7).
5.3 Interaction between glider track and mesoscale
currents
By the time the glider turned eastward from the Rockall
Bank on 31 October (Transit 1, Fig. 6) the large cyclonic
circulation AC had settled on the western side of the trough
(Fig. 7a), which initially forced it southward along the west-
ern side of the circulation (west of 12.5◦W in Transit 2). The
glider was then carried eastward along the interface between
the southern side of AC and the northern side of the anti-
cyclone BA until it was picked up by the eastern side of this
circulation and deflected south-eastward. The isopycnals at
1000 m in BA were by then significantly deeper than when
AC occupied the eastern side of the trough (see also Fig. 10).
Until the end of December (Transit T3, Fig. 6) the sub-
surface isopycnal levels tended to mirror the sea surface un-
dulations observed by the altimeters. However, from the end
of Transit 2 (12 November) a deep water doming of the
isopycnals appeared between about 9.5◦ and 10.5◦W that
seems to have been associated with the presence of lighter
water in the upper 300 m of the slope current, and is not
readily reflected in the SLA. At this time the Aviso current
speeds along the transits were at their maximum (and greater
than those observed by the glider), but from then on until the
end of the mission glider drift speeds (averaged over 1000 m)
-20 0 20-30
-20
-10
0
10
20
30
Glider / cm s-1
Alti
met
er /
cm s
-1
a)
-20 0 20-30
-20
-10
0
10
20
30
Glider / cm s-1
Alti
met
er /
cm s
-1
b)
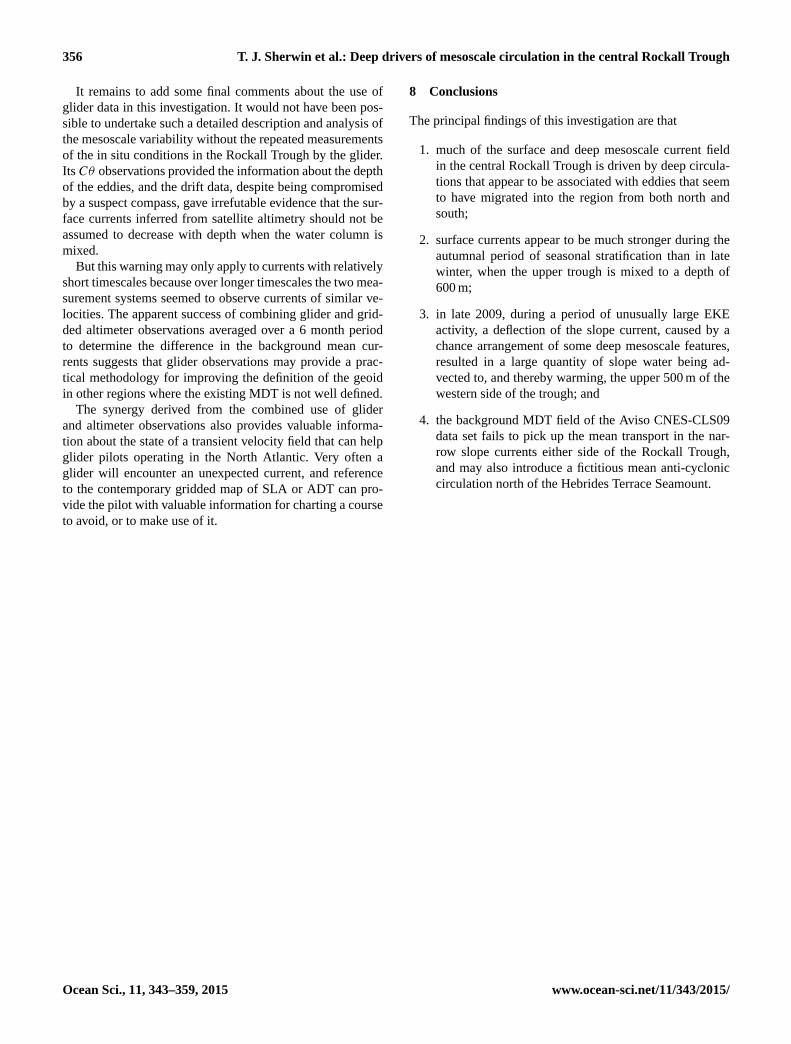
Figure 11. Scatter plot of glider vs. altimeter speeds; (a) east,
(b) north. Correlation lines (cm s−1) are fitted to Aviso (black) and
to the glider (red), and correspond to values in Table 2. Altimeter
values have been interpolated in time and space to coincide with the
glider observations.
were always 2 times greater than the surface altimeter speeds
(Table 1).
In Transit 4 an uplift of deep isopycnals at about 9.8◦W
drove a southward current between 10◦ and 10.5◦W in re-
sponse to the presence of a cold core that was most pro-
nounced below 800 m. Similar currents were found on the
northern side of the Hebrides Terrace Seamount at about
56.5◦ N, 10◦W in transits 7 and 8 (see Figs. 6b and 7f). The
other transits also exhibited examples of doming of the deep
water isopycnals driving glider drift currents that extended
from the surface at least to 1000 m.
6 Direct comparison of the glider and altimeter
current measurements
6.1 Comparison of individual observations
The average current speed along individual tracks measured
by the glider drift was often much greater that that observed
by Aviso, particularly once the seasonal stratification had
been eroded by the start of 2010 (Table 1) (during the June
2009 cruise the LADCP measured currents depth averaged
to 1000 m were nearly twice as large as the equivalent Aviso
surface currents; see also Table 1). Over the glider mission
as a whole the eastward components of velocity were fairly
closely correlated (0.69, Table 2 and Fig. 11a), whilst the
correlation between the northward components was poorer
(0.41 and Fig. 11b). One explanation may be the smoothing
that is introduced by gridding the altimetry data, although the
satellite altimeter coverage of the Rockall Trough was quite
dense and smoothing would not explain the difference in cor-
relation between the northward and eastward components of
velocity. So these results are a little surprising and merit fur-
ther investigation, particularly as there is some doubt about
the accuracy of the geoid and MDT across slope regions (see
Fig. 12a).
www.ocean-sci.net/11/343/2015/ Ocean Sci., 11, 343–359, 2015

354 T. J. Sherwin et al.: Deep drivers of mesoscale circulation in the central Rockall Trough
Table 2. Values of the constants Cv , mv , Cu, mu in the linear rela-
tionships between the glider drift (uG, vG) and Aviso surface (uA,
vA), velocities uA = Cu+muuG (eastward) and vA = Cv +mvvG
(northward) along with the correlation coefficients, Ru and Rv , and
the number of observations, n. The fits to Aviso data (standard font)
and glider data (bold font) are shown. The best fit will be somewhere
between the two. There is a marked improvement in the correlation
of the individual northward currents once Aε is applied. Observa-
tions were smoothed over about 1 day with a four-point Hamming
window and subsampled. The meridional averages are derived from
the red and blue curves in Fig. 12b and c.
Eastward Northward
Transits n Cu mu Ru Cv mv Rv
Meridional 23 1.9 1.2 0.92 1.4 0.11 0.07
averages 1.4 1.4 120 25
Individual 128 3.9 0.70 0.69 3.7 0.36 0.41
observations 1.6 1.5 13 2.2
With Aε 121 3.6 0.65 0.69 2.9 0.50 0.73
correction 1.5 1.3 5.4 1.0
6.2 Correcting for errors in the MDT velocity field
The extent to which the steady MDT velocity field (Fig. 12a)
deviates from the true background velocity field in the Rock-
all Trough has been determined by averaging all the simulta-
neous glider and altimeter currents along all tracks into 10′
of longitude bins along a mean track, including those in tran-
sits 3 and 6 that were previously omitted, but ignoring ve-
locities > 30 cm s−1 (see Fig. 5). The justification is outlined
in Appendix A. It is important to note that the eastward (i.e.
across-trough) components of the temporal mean velocities
from the glider (GM1) and Aviso (AM1) are strongly corre-
lated (R = 0.92, Table 2) with a constant of proportionality
(α, Appendix A) that looks close to 1 in Fig. 12c. (The results
of the correlation analysis in Table 2 suggest that α ∼ 1.3,
but tests showed that the precise value of α is not critical.)
On this basis it is also assumed that the true α equals 1
for northward currents and that the striking difference in the
glider and Aviso measurements in this direction (Fig. 12b)
can be attributed to errors in the MDT current field along
the track (A∈). This error was calculated from Eq. (A5) with
U +Gε set to 0 for convenience and is shown by the black
lines and vectors in Fig. 12. The true background current
(U ) can be estimated by mentally adding the black arrows
to the blue MDT field arrows along the track in Fig. 11a.
The two components ofA∈ were interpolated along the mean
glider track and used to correct individual Aviso measure-
ments (making no allowance for any variation ofA∈ with lat-
itude). This improved the correlation between the corrected
northward Aviso and glider currents from 0.41 to 0.73 (Ta-
ble 2). The equivalent correction for the eastward currents
did not improve the correlation (Fig. 10a and c), which sug-
gests that most of the improvement in the northward compo-
nent is due to the domination of the slope current error (see
Fig. 12). Thus the MDT fails to produce the slope currents
northward along the European edge and southward along the
eastern flank of Rockall. Although the anomalous MDT cur-
rent field to the south of the ADS appears to be robust (since
the standard error in the estimates of the mean background
current are small, Fig. 11), it can be explained when com-
bined with the anomaly in the slope current. Taken together
these anomalies suggest that the extensive anti-cyclonic cell
northward and over the Hebrides Terrace Seamount is also
an artefact of the MDT.
An order of magnitude estimate of U is needed to com-
plete the analysis. The mean northward transport through the
trough is probably between 0.7 and 3.7 Sv (Holliday et al.,
2000) which, with a cross-sectional area 250 km wide and
1000 m deep, implies that U is between 0.3 and 1.5 cm s−1.
A dashed line has been added to Fig. 12b at the mean of these
speeds to show a y coordinate shift of −0.9 cm s−1. With
this adjustment it appears that from its western edge at about
9.7◦W the mean European slope current builds in strength to
about 13.5 cm s−1 above the 500 m isobath at 9.1◦W, which
is comparable to the value quoted in Sect. 2. Westward of this
longitude to a meridian southward of the western edge of the
ADS at 11.4◦W the mean flow is S or SSW with a maximum
of about 6 cm s−1 at 10.5◦W. West again the mean current
flows northward around the western side of the ADS with a
mean speed of 3–4 cm s−1. Finally, at the very western end of
the track, on the eastern flank of Rockall, the mean Equator-
ward slope current is of order 5 cm s−1. The general agree-
ment of this pattern with the schematic mean circulation pat-
tern described in Ellett et al. (1986) provides confidence with
this analysis. We note that this estimate of a mean northward
slope current at 56.75◦ N was derived during a prolonged pe-
riod with a weak current temporarily southward because the
main current had been deflected to the west.
7 Discussion
The central Rockall Trough is populated by mesoscale eddies
or cells that appear trapped in the deep water, where they
push each other randomly around on timescales of months.
They drive currents that extend to the surface, but because
surface temperatures in winter are uniform, the impact of
these eddies is masked from satellite temperature sensors.
During the glider mission they had transient currents that,
integrated over the top 1000 m of the water column, had a
mean speed of about 15 cm s−1 (Table 1). It is clear from the
glider σt profiles and sections (Fig. 6), and from the LADCP
measurement of D340 (Fig. 4), that they also extend well be-
low 1000 m, the maximum depth range of the glider.
The cyclonic eddies seem to be too deep to be formed from
the local wind stress curl or the slope current (which extends
to only about 400 m) and must have originated elsewhere ei-
ther as part of a northern extension of the eddy field at the
Ocean Sci., 11, 343–359, 2015 www.ocean-sci.net/11/343/2015/

T. J. Sherwin et al.: Deep drivers of mesoscale circulation in the central Rockall Trough 355
2000
2000
1000
13 12.5 12 11.5 11 10.5 10 9.5 9 8.5Longitude (W)
56
56.5
57
57.5
58
Latit
ude
(N)
a)
a)
−13 −12.5 −12 −11.5 −11 −10.5 −10 −9.5 −9−20
−10
0
10
20
Spe
ed c
m s
−1
b) Northward
−13 −12.5 −12 −11.5 −11 −10.5 −10 −9.5 −9−20
−10
0
10
20
Spe
ed c
m s
−1
Longitude
c) Eastward
Figure 12. (a) MDT currents from Aviso (thin blue arrows) and
mean absolute current along the glider track derived from (A5)
(thick black arrows). (b) Northward and (c) eastward currents from
simultaneous Aviso (red) and glider (blue) observations averaged
over the whole mission into 10′ longitude bins, with the dashed lines
being the standard error in the mean. The black lines are the differ-
ence between the Aviso currents that are displayed as vectors in (a).
The lower horizontal line in (b) is an estimate of the offset of the
y axis origin to account for the mean current through the trough.
mouth of the trough, described by Ullgren and White (2012),
or from the north (e.g. Ellett et al., 1983). The 1000 m pro-
file dive limit and the fact that the glider did not get to the
centre of a cyclonic eddy renders this discussion somewhat
speculative. Profiles of θS at the edges of cyclonic eddies
AC and FC (Fig. 7), near the ADS, clearly have WTOW to
1000 m and may have been formed from intermittent bursts
of cold water overflow across the Wyville Thomson Ridge
(Ellett et al., 1983; Johnson et al., 2010; Sherwin et al., 2008).
The glider did not pass close to the cyclonic eddies south
of the ADS, and it is not known where they originated, al-
though it is quite likely that they were derived from insta-
bilities of the North Atlantic Current front near the mouth
of the trough. The warm core anti-cyclonic eddy BA com-
prises ENAW (Harvey, 1982), rather than MOW, to at least
800 m, and may have been spun off from the northward flow-
ing slope current somewhere south of the region (see Ullgren
and White, 2010).
The amount and spatial extent of mesoscale variability in
the Rockall Trough seems to have an impact on the stability
of the northward propagating current slope current along the
western edge of the European shelf, which has a mean speed
of comparable magnitude (∼ 15 cm s−1). In some of the sec-
tions reported by Holliday et al. (2000) slope current water
appears to be spread across the trough, and our observations
seem to explain what is going on when that happens. The ver-
tical profile of water west of the ADS, which at 500 m was
much cooler and fresher than that to the east in June 2009,
had become much warmer and saltier and adopted an eastern
looking profile by February 2010 (Fig. 3). During the inter-
vening period, starting around the beginning of December
and continuing through to the end of February, there was a
sustained period of north-westerly geostrophic flow extend-
ing from the Hebrides Terrace Seamount at 10.5◦W, 56.5◦ N
towards the Rockall Bank (Fig. 1 and D in Fig. 7). From the
ADT plots the speed of this current was typically 20 cm s−1,
so it would take of order 1 week to cross the trough. Using
a width of this current from Fig. 7d of 25 km, and an as-
sumed depth of 1000 m, gives its rate of transport as 5 Sv. A
current of this magnitude, which is much larger that the am-
bient currents in the central trough, sustained over a period
of 3 months, would certainly be big enough to explain the
apparent excursion of slope current water away from the Eu-
ropean side onto the Rockall side. This is taken as evidence
that the mesoscale activity in the trough can lead to substan-
tial horizontal exchange in the upper 1000 m. Variable cur-
rents of this nature contribute to the inter-annual variability
reported for the upper 800 m observations of temperature and
salinity along the Ellett Line (Holliday et al., 2000; Sherwin
et al., 2012) and also have sufficient magnitude to reverse the
slope current for several months.
It is noted from the altimeter observations that there was
a tendency for the mesoscale structures to become stuck in
the vicinity of the local seamounts and, in particular, both
anti-cyclonic (in November) and cyclonic (in February) ed-
dies appeared to become trapped on the ADS. This is sur-
prising given that the full vertical extent of these eddies is
much deeper than the top of the seamount (500 m) and was
not anticipated by Booth (1988), who suggested that Taylor
columns form with closed streamlines over the ADS. Whilst
both senses of circulation satisfy this requirement, there is no
evidence that the seamount itself generated these eddies, or
that cyclonic circulation is preferred over anti-cyclonic.
www.ocean-sci.net/11/343/2015/ Ocean Sci., 11, 343–359, 2015
356 T. J. Sherwin et al.: Deep drivers of mesoscale circulation in the central Rockall Trough
It remains to add some final comments about the use of
glider data in this investigation. It would not have been pos-
sible to undertake such a detailed description and analysis of
the mesoscale variability without the repeated measurements
of the in situ conditions in the Rockall Trough by the glider.
Its Cθ observations provided the information about the depth
of the eddies, and the drift data, despite being compromised
by a suspect compass, gave irrefutable evidence that the sur-
face currents inferred from satellite altimetry should not be
assumed to decrease with depth when the water column is
mixed.
But this warning may only apply to currents with relatively
short timescales because over longer timescales the two mea-
surement systems seemed to observe currents of similar ve-
locities. The apparent success of combining glider and grid-
ded altimeter observations averaged over a 6 month period
to determine the difference in the background mean cur-
rents suggests that glider observations may provide a prac-
tical methodology for improving the definition of the geoid
in other regions where the existing MDT is not well defined.
The synergy derived from the combined use of glider
and altimeter observations also provides valuable informa-
tion about the state of a transient velocity field that can help
glider pilots operating in the North Atlantic. Very often a
glider will encounter an unexpected current, and reference
to the contemporary gridded map of SLA or ADT can pro-
vide the pilot with valuable information for charting a course
to avoid, or to make use of it.
8 Conclusions
The principal findings of this investigation are that
1. much of the surface and deep mesoscale current field
in the central Rockall Trough is driven by deep circula-
tions that appear to be associated with eddies that seem
to have migrated into the region from both north and
south;
2. surface currents appear to be much stronger during the
autumnal period of seasonal stratification than in late
winter, when the upper trough is mixed to a depth of
600 m;
3. in late 2009, during a period of unusually large EKE
activity, a deflection of the slope current, caused by a
chance arrangement of some deep mesoscale features,
resulted in a large quantity of slope water being ad-
vected to, and thereby warming, the upper 500 m of the
western side of the trough; and
4. the background MDT field of the Aviso CNES-CLS09
data set fails to pick up the mean transport in the nar-
row slope currents either side of the Rockall Trough,
and may also introduce a fictitious mean anti-cyclonic
circulation north of the Hebrides Terrace Seamount.
Ocean Sci., 11, 343–359, 2015 www.ocean-sci.net/11/343/2015/

T. J. Sherwin et al.: Deep drivers of mesoscale circulation in the central Rockall Trough 357
Appendix A: Deriving background mean currents along
the glider track from altimeter and glider measurements
It is useful to define the true background current field across
the Rockall Trough, U +U(x) defined below, and although
neither the Aviso nor the glider velocity measurements can
do this on their own, they can be combined to provide a cred-
ible result that throws light on the accuracy of the MDT cur-
rent field. In theory Aviso current anomalies should be rela-
tive to U +U(x), but at present this is not possible because
the MDT uses a poorly resolved measurement of the geoid.
This appendix demonstrates that by computing the difference
between the two measurement systems, suitably averaged
over the period of Mission 1, it is possible to determine the
error in the velocities of the MDT along the track and hence
find U(x) (if not U). There are a couple of practical prob-
lems that have to be recognised: (i) Aviso measures surface
currents, whilst the glider measures the mean over 1000 m,
and (ii) there is an unknown compass error in the glider that
leads to a spurious mean current. In practise it turns out that
these problems are not critical.
Assume that the true current normal to the mean glider
track across the Rockall Trough (x) is given by
U(x, t)= U +U(x)+ uS(x, t)+ uT(x, t), (A1)
where U is the mean current averaged across the trough;
U(x) is the steady anomaly to the mean current along the
track; and uS(x, t) and uT(x, t) are respectively short-period
and long-period velocity anomalies. Assume also that over
the 6 month period of Mission 1 uS averages to zero, but that
uT integrates to a finite quantity UM1(x), the anomalous sea-
sonal current during Mission 1. The true mean velocity along
the track for this period, UM1(x), is then given by
UM1(x)= U +U(x)+UM1(x). (A2)
The temporal averaged drift current measured by the glider
is
GM1(x)= UM1(x)+G∈, (A3)
where G∈ is the anomalous current due to the compass er-
ror (assumed uniform across the trough), and for clarity, any
other errors in the glider measurements are small and average
to zero.
The equivalent surface current measured from altimetry is
simply
AM1(x)= αUM1(x)+A(x), (A4)
where αUM1 is derived from the ADT with α the ratio of
Aviso surface velocities to the glider drift current; A(x) is
the mean current derived from the MDT; and other errors are
assumed to be small and random. Note that because of the
errors in the MDT, A(x) 6= U +U(x).
Assuming that α = 1 (see main text for a justification),
then the difference between the two velocity fields is found
by subtracting Eq. (A4) from Eq. (A3) and using Eq. (A2):
GM1(x)−AM1(x)=[U +G∈
]+ [U(x)−A(x)]. (A5)
The first term in square brackets comprises the mean cur-
rent across the Rockall Trough plus the anomalous current
due to the error in the glider compass. Both these currents
are likely to be of similar order (a few cm s−1) and cannot be
separated, so it not possible to determine U directly from the
present set of glider measurements. Other methods are pos-
sible (see main text). The second term in square brackets is
the error in the mean current along the transit of the MDT,
i.e. Aε = U(x)−A(x).
If instead of using the ADT we use the SLA (i.e.
set A(x)= 0) then U(x) can be determined simply from
Eq. (A5) and UM1(x) from Eq. (A4). The choice is arbitrary,
but in the present case the ADT has been used so that the
focus is on the error in the MDT currents along the track.
www.ocean-sci.net/11/343/2015/ Ocean Sci., 11, 343–359, 2015
358 T. J. Sherwin et al.: Deep drivers of mesoscale circulation in the central Rockall Trough
Acknowledgements. The cost of the glider and its operation was
funded by the UK NERC as part of its Oceans2025 programme,
and the Ellett Line cruises are a NERC funded National Capability
activity. This paper was written with support from NERC’s FAST-
NEt research programme and is also an EU Framework 7 grant
no. 308299 (NACLIM) publication. The altimeter products were
produced by Ssalto/Duacs and distributed by Aviso, with support
from CNES. The NAO data were acquired from the Climate
Research Unit. The NLV Pole Star operated by the Northern
Lighthouse Board made a prompt course diversion to recover the
glider when it developed a technical problem in March. We are very
grateful for the helpful support provided by Seaglider Fabrication
before and during what was the first Seaglider mission operated
by SAMS. Discussions with EU colleagues in Everyone’s Gliding
Observatories (EGO) also gave us confidence to undertake the
mission. We are grateful for advice about the eddy water types from
C. Johnson. None of this would have been possible without the
dedicated support from a team of skilled technicians and students
at SAMS. We are very grateful for the valuable comments provided
by two anonymous referees which have resulted in an improved
paper.
Dedication.This paper is dedicated to the memory of Tim Boyd,
former friend, colleague and office mate, who was tragically killed
in a freak accident in January 2013. Tim was fascinated by the
display of Rockall Trough glider data that evolved in real time on
my monitor and was poised to lead glider research at SAMS after I
(T. J. Sherwin) retired.
Disclaimer. All data used here are freely available on the web. The
AVISO products can be found at www.aviso.oceanobs.com/duacs
and the glider and Ellett Line data at the British Oceanographic
Data Centre (www.bodc.ac.uk).
Edited by: J. A. Johnson
References
Bacon, S.: Decadal variability in the outflow from the Nordic seas
to the deep Atlantic Ocean, Nature, 394, 871–874, 1998.
Booth, D. A.: Eddies in the Rockall Trough, Oceanol. Acta, 11,
213–219, 1988.
Booth, D. A. and Ellett, D. J.: The Scottish continental-slope cur-
rent, Cont. Shelf. Res., 2, 127–146, 1983.
Burrows, M., Thorpe, S. A., and Meldrum, D. T.: Dispersion over
the Hebridean and Shetland shelves and slopes, Cont. Shelf. Res.,
19, 49–55, 1999.
Dickson, R. R., Gould, W. J., Griffiths, C., Medler, K. J., and
Gmitrowicz, E. M.: Seasonality in currents of the Rockall Chan-
nel, P. Roy. Soc. Edinb. B, 88, 103–125, 1986.
Ellett, D. J. and Martin, J. H. A.: The physical and chemical
oceanography of the Rockall Channel, Deep-Sea Res., 20, 585–
625, 1973.
Ellett, D. J. and Roberts, D.: The overflow of Norwegian Sea deep
water across the Wyville-Thomson Ridge, Deep-Sea Res., 20,
819–835, 1973.
Ellett, D. J., Edwards, A., and Bowers, R.: The hydrography of the
Rockall Channel – an overview, P. Roy. Soc. Edinb. B, 88, 61–81,
1986.
Ellett, D. J., Kruseman, P., Prangsma, G. J., Pollard, R. T., Van
Aken, H. M., Edwards, A., Dooley, H. D., and Gould, W. J.: Wa-
ter masses and mesoscale circulation of North Rockall Trough
waters during JASIN 1978, Phil. Trans. R. Soc. Lond. A, 308,
213–252, 1983.
Eriksen, C. C., Osse, T. J., Light, R. D., Wen, T., Lehman, T. W.,
Sabin, P. L., Ballard, J. W., and Chiodi, A. M.: Seaglider: a long-
range autonomous underwater vehicle for oceanographic re-
search, IEEE J. Oceanic Eng., 26, 424–436, 2001.
Fratantoni, D. M.: North Atlantic surface circulation during the
1990’s observed with satellite-tracked drifters, J. Geophys. Res.,
106, 22067–22093, 2001.
Hakkinen, S. and Rhines, P.: Shifting surface currents in the north-
ern North Atlantic Ocean, J. Geophys. Res., 114, C04005,
doi:10.1029/2008JC004883, 2009.
Hansen, B. and Østerhus, S.: North Atlantic-Nordic Seas ex-
changes, Progr. Oceanogr., 45, 109–208, 2000.
Hansen, B., Hátún, H., Kristiansen, R., Olsen, S. M., and Øster-
hus, S.: Stability and forcing of the Iceland-Faroe inflow of
water, heat, and salt to the Arctic, Ocean Sci., 6, 1013–1026,
doi:10.5194/os-6-1013-2010, 2010.
Harvey, J.: Theta-S relationships and water masses in the eastern
North Atlantic, Deep-Sea Res., 29, 1021–1033, 1982.
Hátún, H., Sando, A. B., Drange, H., Hansen, B., and Valdimars-
son, H.: Influence of the Atlantic subploar gyre on the thermoha-
line circulation, Science, 309, 1841–1844, 2005.
Hátún, H., Eriksen, C. C., and Rhines, P. B.: Buoyant Eddies En-
tering the Labrador Sea Observed with Gliders and Altimetry, J.
Phys. Oceanogr., 37, 2838–2854, 2007.
Heywood, K. J., McDonagh, E. L., and White, M. A.: Eddy kinetic
energy of the North Atlantic Subpolar Gyre from satellite altime-
try, J. Geophys. Res., 99, 22525–22539, 1994.
Holliday, N. P., Pollard, R. T., Read, J. F., and Leach, H.: Water
mass properties and fluxes in the Rockall Trough, 1975–1998,
Deep-Sea Res. Pt. I, 47, 1303–1332, 2000.
Holliday, N. P., Gary, S., Cunningham, C., Johnson, C., Griffiths, C.,
Read, J. F., and Sherwin, T.: Mulit-decadal varability of potential
temperature, salinity and transport in the eastern Sub-polar Gyre
North Atlantic, J. Geophys. Res., in review, 2015.
Hurrell, J. W.: Decadal trends in the North Atlantic Oscillation: re-
gional temperatures and precipitation, Science, 269, 676–679,
1995.
Jakobsen, P. K., Ribergaard, M. H., Quadfasel, D., Schmith, T.,
and Hughes, C. W.: Near-surface circulation in the northern
North Atlantic as inferred from Lagrangian drifters: variability
from the mesoscale to interannual, J. Geophys. Res., 108, 3251,
doi:10.1029/2002JC001554, 2003.
Johnson, C., Sherwin, T., Smythe-Wright, D., Shimmield, T., and
Turrell, W.: Wyville Thomson Ridge overflow water: spatial and
temporal distribution in the Rockall Trough, Deep-Sea Res. Pt. I,
57, 1153–1162, 2010.
Johnson, C., Inall, M., and Hakkinen, S.: Declining nutrient con-
centrations in the northeast Atlantic as a result of a weakening
Subpolar Gyre, Deep-Sea Res. Pt. I, 82, 95–107, 2013.
Ocean Sci., 11, 343–359, 2015 www.ocean-sci.net/11/343/2015/
T. J. Sherwin et al.: Deep drivers of mesoscale circulation in the central Rockall Trough 359
Lankhorst, M. and Zenk, W.: Lagrangian observations of the mid-
depth and deep velocity fields of the northeastern Atlantic Ocean,
J. Phys. Oceanogr., 36, 43–63, 2006.
Martin, J. P., Lee, C. M., Eriksen, C. C., Ladd, C., and
Kachel, N. B.: Glider observations of kinematics in a Gulf
of Alaska eddy, J. Geophys. Res.-Oceans, 114, C12021,
doi:10.1029/2008JC005231, 2009.
McCartney, M. S. and Mauritzen, C.: On the origin of the warm
inflow to the Nordic Seas, Prog. Oceanogr., 51, 125–214, 2001.
Merckelbach, L. M., Briggs, R. D., Smeed, D. A., and Griffiths, G.:
Current measurements from autonomous underwater gliders, in:
EEE/OES 9th Working Conference on Current Measurement
Technology, Charleston, 17–19 March 2008, 61–67, 2008.
Perry, M. J., Sackmann, B. S., Eriksen, C. C., and Lee, C. M.:
Seaglider observations of blooms and subsurface chlorophyll
maxima off the Washington coast, Limnol. Oceanogr., 53, 2169–
2179, 2008.
Pickart, R. S., Spall, M. A., Ribergaard, M. H., Moore, G. W. K.,
and Milliff, R. F.: Deep convection in the Irminger Sea forced by
the Greenland tip jet, Nature, 424, 152–156, 2003.
Pollard, R. T., Guymer, T. H., and Taylor, P. K.: Summary of the
JASIN 1978 field experiement, Philisophical Transactions of the
Royal Society of London A, 308, 221–230, 1983.
Reid, J. L.: On the contribution of the Mediterranean Sea outflow to
the Norwegian-Greenland Sea, Deep-Sea Res., 26, 1199–1223,
1979.
Rio, M. H., Guinehut, S., and Larnicol, G.: New CNES-CLS09
global mean dynamic topography computed from the combina-
tion of GRACE data, altimetry, and in situ measurements, J. Geo-
phys. Res.-Oceans, 116, C07018, doi:10.1029/2010JC006505,
2011.
Sherwin, T. J., Griffiths, C. R., Inall, M. E., and Turrell, W. R.:
Quantifying the overflow across the Wyville Thomson Ridge into
the Rockall Trough, Deep-Sea Res. Pt. I, 55, 396–404, 2008.
Sherwin, T. J., Aldridge, D., Allen, J., Amin, S., Attard, K., Beaton,
J., Brand, T., Barnard, C., Calderwood, J., Dumont, E., Hebden,
M., Ivanov, V., Macey, A., Marsay, C., McLachlan, R., McRae,
J., Mogg, A., Mohammed, K., Porter, M., Read, J., Rerolle, V.,
Richier, S., Short, J., Steigenberger, S., and Wager, N.: Cruise
D340a: Reykjavik to Dunstaffnage via Rockall and the Wyville
Thomson Ridge, Scottish Association of Marine Science, Oban,
UK, 196 pp., 2009.
Sherwin, T. J., Read, J. F., Holliday, N. P., and Johnson, C.: The
impact of changes in North Atlantic Gyre distribution on water
mass characteristics in the Rockall Trough, ICES J. Mar. Sci., 69,
751–757, 2012.
Souza, A. J., Simpson, J. H., Harikrishnan, M., and Malarkey, J.:
Flow structure and seasonality in the Hebridean slope current,
Oceanol. Acta, 24, S63–S76, 2001.
Tett, S. B. F., Sherwin, T. J., Shravat, A., and Browne, O.: How
much has the North Atlantic Ocean overturning circulation
changed in the last 50 years?, J. Climate, 27, 6325–6342, 2014.
Thurnherr, A.: A practical assessment of the errors associated
with full-depth LADCP profiles obtained using Teledyne RDI
Workhorse acoustic Doppler current profilers, J. Atmos. Ocean.
Tech., 27, 1215–1227, 2010.
Ullgren, J. and White, M.: Water mass interaction at intermediate
depths in the southern Rockall Trough, northeastern North At-
lantic, Deep-Sea Res. Pt. I, 57, 248–257, 2010.
Ullgren, J. and White, M.: Observations of mesoscale variability in
the Rockall Trough, Deep-Sea Res. Pt. I, 64, 1–8, 2012.
Volkov, D. L.: Interannual variability of the altimetry-derived eddy
field and surface circulation in the extratropical North Atlantic
Ocean in 1993–2001, J. Phys. Oceanogr., 35, 405–426, 2005.
www.ocean-sci.net/11/343/2015/ Ocean Sci., 11, 343–359, 2015