Embed Size (px)
Citation preview

JULY 2020
Research Report 448
Decoupling of Labour Productivity Growth from Median Wage Growth in Central and Eastern Europe Joris Schröder
The Vienna Institute for International Economic Studies Wiener Institut für Internationale Wirtschaftsvergleiche


Decoupling of Labour Productivity Growth from Median Wage Growth in Central and Eastern Europe JORIS SCHRÖDER
Joris Schröder has been Researcher at The Vienna Institute for International Economic Studies (wiiw) and is now PhD Candidate at the Faculty of Social Sciences, and Sociology and Civil Society and Philantropy (CSPh), Netherlands.


Abstract
The US-centred debate on the decoupling of productivity from workers’ compensation has given rise to the question whether this decoupling has also taken place in other countries, and if so, to what degree. However, in-depth analyses of the extent and the underlying causes of wage-productivity decoupling within Europe are still sparse. This is particularly the case for the Central and East European members of the EU (EU-CEE11), where trickle down of increased labour productivity to local workers in the form of compensation and wage growth has been questioned. Existing analyses provide little explanation as to why the gains in productivity are (not) fully passed on in the form of higher compensation, and why this is more pronounced in some countries than in others. This study thus provides an overview of the extent and underlying factors of wage-productivity decoupling with a focus on the EU-CEE11 countries. In general, the results reveal strong cross-country variation in the amount and underlying reasons for decoupling. Further, we find that the extent of decoupling within the EU-CEE11 is strongly related to the industry structures of these countries, as it is mostly a phenomenon which occurs in countries that have followed an export- and manufacturing-focused development path, while other countries have experienced “reverse decoupling”. We provide further insights into this finding by contrasting productivity and compensation developments in industry and construction with those in the service sector and by looking at each EU-CEE11 country individually.
Keywords: labour productivity, compensation, wages, economic growth, wage inequality, labour share
JEL classification: E24, J3, D3, J24


CONTENTS
1. Introduction ........................................................................................................................................................................ 9
2. Literature review ............................................................................................................................................................ 10
2.1. What underlies productivity-wage decoupling? ........................................................................................ 10 2.2. Empirical evidence for Europe ................................................................................................................... 13
3. Data sources and analysis .......................................................................................................................................... 15
4. Results .................................................................................................................................................................................... 17
4.1. Total economy decoupling in EU countries .............................................................................................. 17 4.2. Decoupling in the EU-CEE11 .................................................................................................................... 19
5. Conclusions ....................................................................................................................................................................... 37
References ........................................................................................................................................................................................ 41
Appendix ........................................................................................................................................................................................... 45

TABLES AND FIGURES
Table 1 / Underlying factors of total economy decoupling in the EU28 countries in percentage points per year, 2002-2014, sectors B-S excluding O ................................................................................... 18
Figure 1 / Factors underlying the decoupling of productivity growth from median wage growth ....................... 11 Figure 2 / Change of the share of employment in manufacturing (NACE rev. 2 section C) between
2000/2 and 2014/16 .............................................................................................................................. 19 Figure 3 / CE manufacturing core: Productivity and wage decoupling decomposition, 2002 = 100 ................. 21 Figure 4 / CEE11 without countries of the manufacturing core: productivity and wage decoupling
decomposition, 2002 = 100 ................................................................................................................... 22 Figure 5 / Bulgaria: productivity and wage decoupling decomposition, 2002 = 100 ........................................... 23 Figure 6 / Czech Republic: productivity and wage decoupling decomposition, 2002 = 100 .............................. 25 Figure 7 / Estonia: productivity and wage decoupling decomposition, 2002 = 100 ............................................ 26 Figure 8 / Hungary: productivity and wage decoupling decomposition, 2002 = 100 .......................................... 27 Figure 9 / Lithuania: productivity and wage decoupling decomposition, 2002 = 100 ......................................... 28 Figure 10 / Latvia: productivity and wage decoupling decomposition, 2002 = 100 ............................................ 29 Figure 11 / Poland: productivity and wage decoupling decomposition, 2002 = 100 ........................................... 30 Figure 12 / Romania: productivity and wage decoupling decomposition, 2002 = 100 ....................................... 32 Figure 13 / Slovenia: productivity and wage decoupling decomposition, 2002 = 100 ........................................ 33 Figure 14 / Slovakia: productivity and wage decoupling decomposition, 2002 = 100 ........................................ 34 Figure 15 / Germany: productivity and wage decoupling decomposition, 2002 = 100 ....................................... 35 Figure 16 / Austria: productivity and wage decoupling decomposition, 2002 = 100 ........................................... 36 Figure 17 / Changes in industry structure in Europe ............................................................................................. 39
Appendix
Table A.1 / Level 1 NACE Rev. 2 (2008) codes .................................................................................................... 45 Table A.2 / Annual growth rates of productivity and compensation per employed person in EU28 Countries,
2002-2014, sectors B-S excluding O ................................................................................................... 46

INTRODUCTION 9 Research Report 448
1. Introduction
“A rising tide should lift all boats” has been one of the central claims in the extensive debate on the decoupling of productivity growth from wage growth in the US (Economic Policy Institute, 2019). As labour productivity grows, so should the “typical” worker’s compensation. The question regarding the extent to which the growth of labour productivity has “decoupled” from the growth of wages has sparked a lively debate in the media, in policy circles and in the scientific literature (Alexander, 2019; Brynjolfsson and McAfee, 2014; OECD, 2018; Stansbury and Summers, 2018; Theodoropoulou, 2019; Gil-Alana and Skare, 2018; Hall, 2019). In short, the debate has revealed a falling labour share, increasing wage inequality and worsening terms of trade for workers as explanations for productivity gains not being (fully) passed on to the typical worker.
A vivid discussion has emerged on the relation between productivity and wage growth in the economies of Central and Eastern Europe. Most of these countries have experienced strong growth of labour productivity following their integration into the EU and monetary union (Leitner and Stehrer, 2019), but arguably with limited trickle down to the workers in these countries (Bohle, 2018). However, analyses of wage-productivity decoupling for these countries are sparse. Aggregate analysis across European countries reveals that productivity growth did translate into growth of average compensation (Theodoropoulou, 2019). Recent analyses also illustrate that the amount of decoupling strongly varies between countries (Gil-Alana, 2018; Nolan, Roser and Thewissen, 2019; OECD, 2018; Pasimeni, 2018; Prenner, 2018; Theodoropoulou, 2019), but their results provide little explanation as to why the gains in productivity are (not) passed on to compensation growth, and why this applies more to some countries than others (Theodoropoulou, 2019). Some recent analyses (Gil-Alana, 2018; OECD, 2018) disentangle the amounts of decoupling explained by wage inequality, changes in the labour share and wage policy, but they only provide results for OECD countries within Europe. Hence, there is not much analysis available of the underlying factors of decoupling – for example trends in wage inequality and sectoral dimensions of these developments ‒ regarding specifically the EU members of Central and Eastern Europe (EU-CEE11).1 Accordingly, this study analyses recent trends in productivity and compensation/wage decoupling with a focus on the EU-CEE11 countries and provides a first analysis of the factors underlying these developments.
This rest of this paper proceeds as follows: Section 2 reviews the existing literature on conceptual and methodological fundamentals as well as empirical evidence of productivity-wage decoupling for European countries. Section 3 describes the data sources and methods used with a particular focus on indicator selection and deflation approaches used. Section 4 presents the aggregate results for European countries and compares developments in industry and construction with developments in the service sector. Here we also contrast developments of country groups according to the growth path they followed after their integration into the EU and subsequently look at the individual countries in more detail. In Section 5 we discuss these results and implications for policy measures and present our conclusions.
1 Bulgaria, Czech Republic, Estonia, Croatia, Hungary, Lithuania, Latvia, Poland, Romania, Slovenia, Slovakia

10 LITERATURE REVIEW Research Report 448
2. Literature review
In the following section we review the literature on the decoupling of median wage growth from productivity growth with a focus on its underlying factors and the results of previous empirical studies. To make sense of existing empirical studies, a clear understanding of the concepts and measurements used to capture wage-productivity decoupling is necessary. Different measurement choices do not merely reflect methodological issues but also illuminate different developments underlying the changing wage-productivity relationship. These underlying factors and corresponding questions of measurement are reviewed in Section 2.1. In Section 2.2 we summarise the available empirical evidence on wage-productivity decoupling with a focus on results for European countries and the EU-CEE11 countries in particular.
2.1. WHAT UNDERLIES PRODUCTIVITY-WAGE DECOUPLING?
Debates about the “true” extent of decoupling within single countries (mostly the US) have elucidated the importance of measurement choice for the broad debate on productivity-wage decoupling (Bivens, Gould et al., 2014; Bivens and Mishel, 2015; Bosworth and Perry, 1994; Feldstein, 2008; Lawrence, 2016; Pessoa and Van Reenen, 2013; Sharpe, Arsenault and Harrison, 2008; Sherk, 2013; Stansbury and Summers, 2018). While all of these studies are broadly targeted at the analysis of the divergence between productivity growth and wage growth, their conclusions vary widely. As noted by Stansbury and Summers (2018), these diverging results do not merely indicate measurement issues but also reflect the question that is (sometimes implicitly) being asked.
If we look at the divergence between productivity and average compensation, we are interested in the labour share of income. The “baseline” of productivity-wage decoupling is therefore reflected in the divergence between productivity growth and average compensation growth, when both are deflated with the GDP deflator (see Figure 1). In many countries the labour share has fallen since the 1970s, and particularly since 2000 (Karabarbounis and Neiman, 2014). This is also the main observation of studies focusing on the decoupling of productivity from average wages in the US (Lawrence, 2016), but of European countries as well (OECD, 2018; Pessoa and Van Reenen, 2013; Theodoropoulou, 2019). Furthermore, the declining labour share has a strong regional and sectoral component. Globally, the mining, transport and manufacturing sectors have been experiencing the steepest declines in the labour share (Karabarbounis and Neiman, 2014). Accordingly, strong within-industry as well as total declines in the labour share have been found in many EU-CEE11 countries, such as Poland, Slovakia, Slovenia and Estonia, for example (Karabarbounis and Neiman, 2014).
If we want to focus instead on the question of the extent to which productivity has diverged from the typical worker's pay, median compensation is the appropriate indicator (Nolan, Roser and Thewissen, 2019; Pasimeni, 2018; Prenner, 2018; Stansbury and Summers, 2018). Therefore, additional factors underlying the amount of total decoupling between productivity growth and median wage growth emerge. They illuminate different aspects underlying what is here understood as total decoupling, the divergence between productivity growth and median wage (or compensation) growth.

LITERATURE REVIEW 11 Research Report 448
Since our focus in this paper is on the latter question, developments in the labour share as well as changing terms of trade, the development of non-wage components and the development in the personal income distribution are relevant explanatory factors.
Figure 1 / Factors underlying the decoupling of productivity growth from median wage growth
Note: GDPD = GDP deflator; CPI = Consumer price index. Source: Own display adapted from Nolan et al. (2019).
2.1.1. Changing terms of trade
Some authors have argued that compensation and wage measures should be deflated with a producer price index (such as the GDP deflator) instead of the consumer price index (Feldstein, 2008; Lawrence, 2016; Sherk, 2013). This makes sense from the perspective of a firm in a competitive market, where we assume that "it pays a nominal wage equal to the marginal revenue product of labour, i.e., to the marginal product of labour multiplied by the price of the firm's product" (Feldstein, 2008, p. 592). However, with a focus on individuals’ benefit from productivity gains in terms of purchasing power, the consumer price index is the more meaningful deflator (Feldstein, 2008; Nolan, Roser and Thewissen, 2019; Pasimeni, 2018; Stansbury and Summers, 2018; Theodoropoulou, 2019). Differences between the two price indices reflect changes in terms of trade, i.e. changes in export prices vs. changes in import prices, or increases in housing cost, which are a large part of consumption (and therefore the CPI) but are not included in producer price indices (Bosworth and Perry, 1994; Feldstein, 2008; Kügler, Schönberg and Schreiner, 2018; Nolan, Roser and Thewissen, 2019). When focused on individuals’ benefit from productivity gains in terms of purchasing power and therefore using the CPI, these developments are included in the amount of total decoupling. Bivens and Mishel (2015, p.6) call this the "terms of trade wedge, which concerns the faster price growth of things workers buy relative to the price of what they produce". These GDP deflator and CPI series follow very similar

12 LITERATURE REVIEW Research Report 448
trends in most countries, but applying the different deflators in Estonia and Slovakia, for example, results a divergence of as much as 1.5 percentage points per year (Nolan, Roser and Thewissen, 2019).
2.1.2. The development of non-wage components
In existing studies, both compensation and wages have been used in the analysis of decoupling. Wages and salaries include remuneration in cash (direct remuneration, bonuses and allowances, payments into employees’ savings schemes, payments for days not worked) and in kind (company products, staff housing, company cars, stock options and share purchase schemes, and meals and drinks or subsidised commuting). Compensation of employees encompasses wages and salaries and additionally social contributions by employers. When analysing the extent to which workers have benefited from productivity growth, compensation should be preferred to wages because it captures their gains from work more holistically (Feldstein, 2008).
Differentiating these two concepts is particularly interesting when applying a cross-national comparative perspective, because there are remarkable differences in the gap between compensation and wages in different countries (Schröder and Schwarzhappel, 2020). For the US, the literature has shown that the non-wage components of compensation have grown faster than the wage components in recent decades (Lawrence, 2016; Sherk, 2013; Stansbury and Summers, 2018). Accordingly, wages have grown more slowly than compensation, which results in the amount of decoupling being smaller when considering compensation instead of wages. Kügler, Schönberg and Schreiner (2018) find that compensation has also grown slightly faster than wages in eight advanced European economies.2
Displaying both the average compensation and the average wage series shows how the non-wage components developed in comparison with wages.
2.1.3. Wage inequality
For the US, one strand of the literature finds that almost no decoupling (only slight decoupling after 2000) can be observed when analysing decoupling of productivity from average compensation (Feldstein, 2008; Lawrence, 2016). Another strand of the literature has additionally looked at median compensation, arguing that it more accurately reflects a “typical” worker's pay, and finds strong decoupling of median compensation growth from productivity growth, which can be ascribed to the inequality of incomes between workers (Bivens and Mishel, 2015; Nolan, Roser and Thewissen, 2019; Pasimeni, 2018; Pessoa and Van Reenen, 2013). This takes into account that the distribution of compensation and wages between workers affects how much the “typical” worker benefits from productivity growth.3 Changes in the distribution of income have received a lot of attention as explanatory factors for decoupling and play arguably the most important role in explaining the contradicting results between the US-centred studies. With a few notable exceptions (Nolan, Roser and Thewissen, 2019; OECD, 2018), this has received less attention in the analyses of decoupling in European countries, but it emerges as an important factor underlying wage-productivity decoupling.
2 Denmark, France, Germany, Italy, Norway, Spain, Sweden, United Kingdom. 3 Nolan, Roser and Thewissen (2019) additionally focus on the decoupling of household income from GDP and GNI, taking
economies of scale in living together into account and thus arguably providing a more accurate depiction of living standards. Thus, they identify differences between GDP and GNI and changes in average household size as further important explanatory factors of decoupling.

LITERATURE REVIEW 13 Research Report 448
2.2. EMPIRICAL EVIDENCE FOR EUROPE
Most of the empirical studies are concerned with wage-productivity decoupling in the US (Bivens, Gould et al., 2014; Bivens and Mishel, 2015; Bosworth and Perry, 1994; Brynjolfsson and McAfee, 2014; Feldstein, 2008; Lawrence, 2016; Pessoa and Van Reenen, 2013; Sharpe, Arsenault and Harrison, 2008; Stansbury and Summers, 2018). Following the vast literature on decoupling in the US case, a number of studies have analysed decoupling of productivity from compensation in European countries.
Pessoa and van Reenen (2013) closely implement the insights gained from previous studies and transfer the analysis to the case of the UK, including an analysis of the labour share, personal income distribution and dynamics in selected industries. Their analysis of the UK reveals no decoupling of average compensation from productivity, and thus no falling labour shares. However, they observe substantial decoupling of median wages from productivity owing to rising inequality in the distribution of incomes. Subsequently, they analyse decoupling between productivity and average compensation in France, Germany and Italy, confirming the results of previous analyses (Azmat, Manning and Reenen, 2012; Blanchard and Giavazzi, 2003) that falling labour shares might be much more of an explanation of decoupling in continental Europe than in the UK. Additionally, Pessoa and van Reenen (2013) analyse industry-specific divergences between productivity and average compensation ‒ the labour share ‒ in the UK. Unsurprisingly, since the labour share at the level of the total economy has not changed much, they do not find much evidence of a falling labour share in most sectoral aggregates.
Two studies (Pasimeni, 2018 and Theodoropoulou, 2019) analyse the decoupling of productivity from average compensation in the EU28 countries on aggregate. Pasimeni (2018) finds that within the whole of the EU productivity has translated into average wage gains at a rate of about 50%, which is broadly supported by Theodoropoulou (2019). Both studies split their sample into two similar time periods, but their results diverge. Pasimeni (2018) finds a stronger link between productivity and compensation in the period 1970-1998 than in 1999-2017. Theodoropoulou (2019), on the other hand, finds that the period 1970-1994 was characterised by an increasing gap between productivity and wage growth, while the period 1995-2017 was characterised by fair wage growth ‒ a decreasing gap between productivity growth and compensation growth. Neither of the two studies goes into detail about what factors might be underlying this decoupling within the EU/Europe as a whole, or within single countries. However, an important insight from these studies as well as from the broader “decoupling literature” is the (negative) effect of the unemployment rate on compensation growth and its importance as a moderating factor of the productivity-compensation link (e.g. Meager and Speckesser, 2011; Pasimeni, 2018; Stansbury and Summers, 2018; Theodoropoulou, 2019).
Studies by Schwellnus, Kappeler and Pionnier (2017) and OECD (2018) analyse wage-productivity decoupling in OECD countries and thus include analyses for some European countries. The proposed theoretical framework focuses on the effect of developments in the labour shares and compensation/wage inequality, which, as discussed above, have been identified as two major underlying factors of decoupling. Their findings show that the much discussed decoupling of productivity from median wages in the case of the US represents indeed one of the strongest cases of decoupling (with 1.3 percentage points per year), but that decoupling has been equally strong or not far behind in many European countries. For example, Poland (2 percentage points per year) and Hungary (1.3 percentage points per year) are among the four countries with the highest rates of total decoupling of productivity from median wages, owing to falling labour shares as well as increasing wage inequality. Further, Schwellnus, Kappeler and Pionnier (2017) show that within industry changes in the labour share are responsible for most of the changes in the overall labour share. Changes

14 LITERATURE REVIEW Research Report 448
within manufacturing emerge as the bigger contributor to the overall decline in the labour share for all included EU-CEE11 countries (Poland, Hungary, Estonia and Lithuania) except Latvia.
Notably, Astrov et al. (2019), Theodoropoulou (2019) and Prenner (2018)4 provide results on decoupling within the EU-CEE11 countries. However, these are focused on the decoupling of productivity from average compensation (CPI-deflated) and thus do not incorporate developments within the personal income distribution, growth of non-wage components, changing terms of trade or sectoral aspects of decoupling, which might be of particular importance for East European countries (Nolan, Roser, and Thewissen, 2019).5
The results for the countries that have so far not been analysed in detail in other studies point to two diverging trends: over the period 1995-20176 the average compensation has been growing faster than productivity in Bulgaria, Estonia, Latvia, Lithuania and Romania (Astrov et al., 2019; Theodoropoulou, 2019). In contrast, compensation growth has recently failed to keep up with productivity growth in Croatia (since 2014) and Cyprus (since 2013), and over the entire period it has lagged behind productivity growth in Greece and Slovenia (Theodoropoulou, 2019). Furthermore, the OECD's (2018) findings of particularly high decoupling of productivity from wages in Poland owing to a declining labour share are supported (Theodoropoulou, 2019).
Overall, the review of empirical results in the context of different concepts and measurements used reveals several aspects of importance to our analysis. First, the choice of measurements does not merely reflect a “right” or “wrong” indicator choice, but instead determines the type of decoupling and underlying factors that are being analysed. Second, there is considerable cross-country variability in the experience of decoupling within EU member states, and developments in the labour share and the compensation/wage distribution are both important factors explaining overall decoupling of productivity developments from the “typical” worker's pay. For many EU-CEE11 countries, however, decoupling has only been looked at with regard to the fall of the labour share at the level of the total economy, while developments in compensation/wage inequality, terms of trade and within sectors have not been analysed so far. Extending on the available literature, the following descriptive analysis provides further insight into how overall decoupling is explained by the development of the labour share, wage inequality, changing terms of trade, and growth of non-wage components of compensation (see Figure 1). Additionally, we distinguish between broad sectoral aggregates, which are of particular importance to the EU-CEE11 economies (see Section 4.2).
4 The single country results in Prenner (2018) are likely to contain some error in the compensation series, since results do not at all resemble those of other studies.
5 The latter two aspects are included through the use of compensation and the CPI but not contrasted to other measures, while changes within the distribution of personal incomes are not included at all.
6 In Theodoropoulou (2019) the base year for Greece is 1983.

DATA SOURCES AND ANALYSIS 15 Research Report 448
3. Data sources and analysis
For productivity measures and labour compensation per worker we use the newly constructed EU KLEMS Release 2019.7 KLEMS uses gross value added (GVA) instead of GDP for calculating productivity measures. Most of the literature uses gross productivity measures rather than measures of “net productivity”, such as net value added (NVA), which equals GVA minus capital depreciation (consumption of fixed capital). From an income distribution perspective, net productivity should be the preferred measure of productivity, since it more accurately reflects the income available for distribution to workers (Lawrence, 2016; OECD, 2018; Stansbury and Summers, 2018). However, there is considerable uncertainty around measures of capital depreciation and therefore NVA, because depreciation is not observed but imputed. Further, imputation methods differ between countries. This renders GVA the more consistent indicator for a comparative perspective, while NVA more accurately reflects the gains of productivity available for distribution between factors of production (OECD, 2018). Net labour productivity is thus hard to measure accurately, and measures are less consistent and comparable between countries. Therefore, we provide both measures in the discussion of our results. In most countries, GVA has grown more slowly than GDP in recent decades (Pessoa and Van Reenen, 2013). This means that decoupling at the level of the total economy, if it has happened, should be slightly smaller than we would find using productivity indicators based on GDP rather than GVA.
To get a better approximation of compensation across the total economy, KLEMS provides labour compensation, which imputes compensation for the self-employed, assuming that they receive the same hourly wage as the employees in each industry and year (Stehrer et al., 2019).8
Additionally, we obtain a series on wages and salaries9 and capital depreciation from national accounts, and data on median wages and salaries from the Structure of Earnings Survey (SES) (Eurostat, 2020). Data from the SES are only available at four-yearly intervals, from 2002 until 2014.10
While KLEMS data encompass the total economy (Stehrer et al., 2019), the SES only covers NACE Rev. 2 sections B-S excluding O (see Table A.1). Excluded are therefore agriculture, forestry and fishing (Section A), activities of households as employers (section T), activities of extra-terrestrial organisations (section U), and public administration and defence (section O). The SES provides data for the following aggregates:
› sectors B-S excluding O, which are used as a proxy for the total economy
› sectors B-N, which cover the business economy
› sectors B-F, which cover industry and construction of the business economy
› sectors G-N, which cover services of the business economy
› sectors P-S, which cover education; human health and social work activities; arts, entertainment and recreation; and other (often publicly provided) service activities.11
7 See https://euklems.eu/ 8 Labour income is calculated as LAB=(H_EMP/H_EMPE) COMP. 9 In the following description of results, wages are used interchangeably with wages and salaries. 10 Data from the 2018 SES were not available at the time of writing.

16 DATA SOURCES AND ANALYSIS Research Report 448
KLEMS data provide a far more detailed sectoral breakdown, so our analysis is limited by the aggregates available in the SES. In the following analyses the aggregate of sectors B-S excluding O is used as a proxy for the total economy.
For the EU-CEE11 countries the CPI data are taken from the wiiw Annual Database (wiiw, 2020). This includes the national CPI until 1999 and the HICP from 2000. For the remaining EU countries the CPI data are taken from the OECD.Stat database (OECD, 2020). The GDP deflator is taken from the World Bank's World Development Indicators (World Bank 2020).
Data for Croatia are only available from 2008 (2010 and 2014 from the SES) and are therefore excluded from the analysis.12 Malta is excluded owing to missing data on the CPI and the GDP deflator.
We use annual compensation or wages and salaries per employed person instead of hourly wages to ensure consistency between data sources. Hourly wages in the SES do not include “non-standard payments” such as 13th- or 14th-month payments, holiday bonuses, quarterly or annual company bonuses and annual payments in kind. These are included in the SES wages per employee and also in the KLEMS and national accounts data on average compensation/wages.
Using the available aggregates described above, we first depict the decoupling and underlying factors at the level of the total economy (sectors B-S excluding O) for all EU28 countries for the period 2002-2014 and discuss the results briefly against the backdrop of the existing empirical studies summarised above. Next we focus on the countries which have been analysed only superficially in previous studies and for which our data are able to provide further insights. Therefore, we look at the EU-CEE11 countries and analyse trends of decoupling over time and provide results on decoupling within the sectoral aggregates of the business economy defined above.
11 Note that the differentiation between the business economy and the public sector is not distinct: while these sectors cover services, which are in many countries largely provided by the state, the activities in these sectors are not necessarily only provided by the state. See for example the private provision of education or health services.
12 See Astrov et al. (2019) and Theodoropoulou (2019) for some analysis of available data on Croatia.

RESULTS 17 Research Report 448
4. Results
We first present the results on decoupling and its underlying factors within the EU member states at the level of the total economy (Section 4.1). Subsequently, we focus on the EU-CEE11 countries (Section 4.2). Here we look at decoupling at the level of the total economy and the two broad sectoral aggregates of industry and construction and services. We contrast wage-productivity decoupling within the aggregate of countries that have previously been characterised as belonging to the European manufacturing core (Stehrer and Stöllinger, 2015; Stöllinger et al., 2013; Stöllinger, 2016)13 with decoupling in the remaining EU-CEE11 countries (Section 4.2.1). Further, we show the individual countries’ experiences (Section 4.2.2) to examine the substantial cross-country variation uncovered in previous studies (OECD, 2018; Nolan, Roser and Thewissen, 2019; Theodoropoulou, 2019).
4.1. TOTAL ECONOMY DECOUPLING IN EU COUNTRIES
Table 1 shows the amount of wage-productivity decoupling in percentage points per year at the level of the total economy and corresponding underlying developments. These are derived from the average annual growth rates of productivity and compensation/wage measures per employed person (see Appendix Table A.2). The development of the labour share using GVA and NVA (column 2 and column 3) corresponds to the difference in yearly growth rates between GVA and average compensation and the growth rates of NVA and average compensation, respectively. Column 4 shows the difference in average annual growth rates of average compensation deflated with the GDP deflator and compensation deflated with the CPI, which corresponds to worsening terms of trade for consumers. Column 5 shows the difference between annual growth rates of average and median wages and salaries derived from the SES, which is used as a measure of wage inequality. As the SES does not provide data for a lot of (mostly western European) countries for the whole period, data on the measure of income inequality over the analysed time period are missing. However, the decoupling in these countries, including wage inequality developments, has been analysed in OECD (2018) for a similar time period. Depending on data availability in the SES (see column 5), the annual total decoupling using GVA or NVA (column 6 and column 7) refers to decoupling including the development of wage inequality or not.
In terms of terminology, it is important to note that decoupling is used to refer to values below 0, i.e. the decoupling of wage growth from productivity growth, while reverse decoupling (or negative decoupling) is sometimes used to characterise values of decoupling above 0 - if compensation/wages grow faster than labour productivity.
13 Including Germany, Austria, the Czech Republic, Slovakia, Hungary and Poland.

18 RESULTS Research Report 448
Table 1 / Underlying factors of total economy decoupling in the EU28 countries in percentage points per year, 2002-2014, sectors B-S excluding O
Labour share
using GVA Labour share
using NVA Terms of trade Wage
inequality Total
decoupling GVA Total
decoupling NVA Austria 0.0 0.2 -0.2 - -0.2 0.0 Belgium -0.1 0.2 -0.3 - -0.4 -0.1 Bulgaria 1.7 1.6 0.1 -1.3 0.5 0.4 Cyprus -0.1 0.1 -0.1 - -0.2 0.0 Czech Republic 0.0 0.0 -0.6 -0.2 -0.8 -0.7 Germany -0.2 -0.1 -0.4 - -0.6 -0.5 Denmark -0.2 -0.3 0.2 - 0.0 0.0 Estonia 0.8 0.9 1.2 - 1.9 2.1 Greece -0.3 0.0 -0.7 - -1.0 -0.7 Spain -0.3 - -0.5 0.4 -0.5 - Finland 0.7 1.0 -0.1 - 0.6 0.9 France 0.4 0.7 -0.3 - 0.1 0.4 Hungary -0.1 0.0 -0.6 0.1 -0.7 -0.5 Ireland -0.2 0.2 -1.2 -0.2 -1.5 -1.1 Italy 0.4 0.8 -0.3 - 0.1 0.5 Lithuania 0.1 0.1 0.4 0.1 0.7 0.6 Luxembourg -0.1 -0.3 0.6 - 0.5 0.3 Latvia 1.4 1.5 0.9 - 2.3 2.4 The Netherlands 0.0 0.1 -0.3 -0.2 -0.5 -0.4 Poland -0.7 -1.0 0.0 -0.2 -0.9 -1.2 Portugal -1.0 -0.8 -0.2 - -1.1 -0.9 Romania -2.2 -3.0 2.5 -0.3 -0.1 -0.8 Sweden 0.2 0.2 0.2 0.0 0.3 0.4 Slovenia 0.3 0.6 -0.5 0.4 0.2 0.5 Slovakia -0.1 -1.0 -1.4 -0.1 -1.6 -2.5 United Kingdom 0.1 0.1 -0.3 0.0 -0.2 -0.2
Note: GVA = gross value added; NVA = net value added (= GVA minus capital depreciation). Depending on the data availability evident from column 5, the values for total decoupling refer to decoupling with or without wage inequality. Thus, comparability between countries is limited. Source: EU KLEMS Release 2019; Eurostat (2020).
The results are broadly in line with the analyses of the OECD (2018) and Theodoropoulou (2019), which cover similar time periods and reveal considerable variation in wage-productivity decoupling across European countries.14 For example, Poland, Hungary and Slovakia are among the countries with the highest yearly rates of decoupling in our analysis as well. For Slovakia, we can additionally show that the decoupling found in Theodoropoulou (2019) can be attributed to worsening terms of trade for the most part, while a declining labour share and rising wage inequality play a secondary role. In line with Theodoropoulou (2019), our results reveal reverse decoupling in Bulgaria, Estonia, Latvia and Lithuania, meaning that, at the level of the total economy, compensation grew faster than productivity. For Romania, on the other hand, our results indicate that while a strongly falling labour share and increasing wage inequality have worked towards wage-
14 In addition to not covering exactly the same time periods, results diverge because we use productivity per employee as opposed to the measures of hourly productivity and compensation/wages used in OECD (2018) and Theodoropoulou (2019). The growth of productivity per employee has generally been slightly lower than growth of productivity per hour worked, but the difference varies between countries (Leitner and Stehrer, 2019). Additionally, we include the "terms of trade wedge" (Bivens and Mishel 2015, p. 6) not included in the other analyses, and the SES does not include median wages for many of the European OECD countries analysed in OECD (2018).

RESULTS 19 Research Report 448
productivity decoupling, improving terms of trade for Romanian consumers have offset these trends within the observed period. Additionally, the results show that labour compensation decoupled faster from NVA than from GVA between 2002 and 2014, which puts Romania in the group of countries with the highest rates of decoupling when considering NVA. Below we shed more light on the cross-country differences in macro-level decoupling by focusing on sectoral developments within selected country aggregates, and subsequently we look at each EU-CEE11 country in detail.
4.2. DECOUPLING IN THE EU-CEE11
We now focus on the EU-CEE11 countries, most of which have experienced growth in labour productivity following their integration into the EU and the euro area (Leitner and Stehrer, 2019). However, trickle down of increased labour productivity to local workers in the form of compensation and wage growth has been questioned (Bohle, 2018). Additionally, we include Austria and Germany, because they are closely linked to many EU-CEE11 economies. For most of the EU-CEE11 countries decoupling has not been analysed in detail before, and the limited analyses previously available as well as our results at the level of the total economy point to severe decoupling in some of them, and reverse decoupling in others.
Figure 2 / Change of the share of employment in manufacturing (NACE rev. 2 section C) between 2000/2 and 2014/16
Note: 2000/2 = average values for the years 2000-2002; 2014/16 = averages for the years 2014-2016. Source: Eurostat (2020); own display.

20 RESULTS Research Report 448
These aggregate trends in wage-productivity decoupling might in part reflect changes in the countries' industry structures but can more likely be traced back to distinct wage-productivity decoupling within specific sectors (Schwellnus, Kappeler and Pionnier, 2017). For the period analysed the sectoral breakdown of the wage-productivity relationship is particularly interesting for the EU-CEE11 countries, since it was characterised by rapid developments in employment and productivity in the manufacturing sector (Landesmann and Schröder, 2020; Stehrer and Stöllinger, 2015; Stöllinger et al., 2013; Stöllinger, 2016). Some countries kept or even enlarged their manufacturing sector, while other countries de-industrialised quickly (see Figure 2 and Bohle, 2018; Stehrer and Stöllinger, 2015; Stöllinger, 2016). As Stehrer and Stöllinger (2015, p. 33) show, the specialisation in manufacturing only happened relatively recently and strongly in many EU-CEE11 countries: "The average manufacturing export intensity was not very different in the group of CE manufacturing core countries and other EU member states back in 1995; from the early 2000s onwards, however, the two groups have embarked on divergent trends with the manufacturing core countries significantly increasing the export intensity per capita, climbing to some EUR 3,700, whereas that of the other member states was basically stagnating." This begs the question how these developments might translate into the typical worker's pay at the level of the total economy, and within industry in particular. How does the experience of decoupling vary between the manufacturing core and non-manufacturing core country groups, and do these developments have a sectoral dimension?
4.2.1. Decoupling of productivity from wages - a phenomenon of the Central European manufacturing core?
Let us first look at the decoupling of productivity from compensation/wages within the group of Central European (CE) manufacturing core countries and compare them with the aggregate patterns in the non-manufacturing core EU-CEE11 countries.
Figure 3 shows the simple average growth of productivity and compensation/wage measures within the countries of the CE manufacturing core, using 2002 as the base year.15 Looking at the level of the total economy (sectors B-S excluding O) first, we can see that throughout most of the period productivity in the CE manufacturing core countries has grown faster than compensation. The gap between the growth of wages narrowed during the crisis and seems to narrow again in the most recent years owing to strongly increasing compensation/wages. Throughout most of the period the decoupling of compensation from productivity is equally explained by a declining labour share (the gap between productivity growth and compensation growth at consumer prices) and worsening terms of trade for workers (the gap between compensation growth at producer prices and compensation growth at consumer prices). Furthermore, we can see that the non-wage components of compensation have grown at a slightly slower pace than wages and salaries.
The picture is almost identical when focusing on the business economy (sectors B-N), which excludes the sectors P-S covering mostly public services. Further, the SES data additionally tell us that, on average across the business economy in the countries of the CE manufacturing core, median wages have grown at a slightly slower rate than average wages and salaries.
15 This has been selected owing to data availability in the SES and because it marks the starting point of the diverging importance of manufacturing outlined above (Stehrer and Stöllinger, 2015). While it might seem trivial to note that attention needs to be paid to the period analysed (i.e. the base year selected), this is of particular importance for many of the new member states, whose rapid economic development in the 1990s and 2000s might alter results with a small shift of the base year.

RESULTS 21 Research Report 448
Within industry and construction (sectors B-F), the patterns observed for the total economy reappear much more pronounced. Thus, between 2002 and 2017 productivity has grown much more strongly than compensation at consumer prices, which leaves a substantial gap between the two in 2017 relative to 2002. As the curve for compensation at producer prices shows, this is to a large extent explained by a falling labour share, and to some extent also by worsened terms of trade for workers in the CE manufacturing core. In contrast, average compensation at consumer prices has grown in line with productivity in the service sector (sectors G-N). However, the gap between the growth of average and median wages in 2014 suggests that wage inequality has been growing within these sectors, indicating that the “typical” worker's pay has to some extent decoupled from the growth of productivity.
Figure 3 / CE manufacturing core: Productivity and wage decoupling decomposition, 2002 = 100
Note: Depicted are the unweighted averages of the growth rates within countries of the Central European manufacturing core (including Germany, Austria, the Czech Republic, Slovakia, Hungary and Poland). SES data for the sectors B-S excluding O are excluded because they are not available for Germany and Austria. Source: EU KLEMS Release 2019; Eurostat, 2020, own display.
The EU-CEE11 countries which are not considered part of the CE manufacturing core have had, on average, a very different experience. At the level of the total economy, Figure 4 reveals a story of reverse decoupling: compensation/wages at consumer prices have grown faster than productivity in relation to 2002. In 2017 the gap between the two is almost equally explained by an increasing labour share and improved terms of trade for workers within these countries relative to 2002.
80
100
120
140
1995 2000 2005 2010 2015 2020
Sectors B-S excluding O
80
100
120
140
1995 2000 2005 2010 2015 2020
Sectors B-N
80
100
120
140
1995 2000 2005 2010 2015 2020
Sectors B-F
80
100
120
140
1995 2000 2005 2010 2015 2020
Sectors G-N
Gross value added, GDP deflator Net value added, GDP deflator
Labour compensation, GDP deflator Labour compensation, CPI
Wages and salaries, CPI SES: mean wages and salaries, CPI
SES: median wages and salaries, CPI

22 RESULTS Research Report 448
Figure 4 / CEE11 without countries of the manufacturing core: productivity and wage decoupling decomposition, 2002 = 100
Note: Depicted are the unweighted averages of the growth rates within EU-CEE11 countries that are not part of the Central European manufacturing core (Bulgaria, Estonia, Lithuania, Latvia, Romania, and Slovenia). SES data for the sectors B-S excluding O are excluded because they not available for Estonia and Latvia. Source: EU KLEMS Release 2019; Eurostat, 2020, own display.
The data for the business economy show a similar picture and reveal no significant gap between average and median wages.
Compensation/wages in industry and construction have tracked productivity in this sector much more closely in the countries that are not part of the CE manufacturing core. Furthermore, the difference between net value added and gross value added reveals that the rate of depreciation has fallen and that more of the gains from productivity should be available for distribution between the factors of production.
Accordingly, the higher growth of compensation as opposed to wages observed at the level of the total economy appears more markedly in the services of the business economy than in industry and construction. Here, compensation and wages at consumer prices have grown much faster than compensation at producer prices, which have grown faster than GVA and NVA, pointing to an increasing labour share and improved terms of trade.
50
100
150
200
1995 2000 2005 2010 2015 2020
Sectors B-S excluding O
50
100
150
200
1995 2000 2005 2010 2015 2020
Sectors B-N
50
100
150
200
1995 2000 2005 2010 2015 2020
Sectors B-F
50
100
150
200
1995 2000 2005 2010 2015 2020
Sectors G-N
Gross value added, GDP deflator Net value added, GDP deflator
Labour compensation, GDP deflator Labour compensation, CPI
Wages and salaries, CPI SES: mean wages and salaries, CPI
SES: median wages and salaries, CPI

RESULTS 23 Research Report 448
4.2.2. EU-CEE11 countries in detail
Our results for the manufacturing core and non-manufacturing core countries reveal an important link between wage-productivity decoupling and the countries’ growth regimes and industry structures, and provide some insights for joint policy efforts. However, these aggregated results still obfuscate considerable cross-country variation in wage productivity decoupling. Below, we look at the individual countries in more detail.
Bulgaria
Figure 5 shows the development of productivity and compensation measures in Bulgaria between 1995 and 2017, using 2002 as the base year. At the level of the total economy, we can see that labour compensation has grown faster than productivity, as measured by gross value added or net value added. This observation holds when looking at compensation as well as when looking at wages and salaries in relation to the productivity measures. The slightly faster growth of labour compensation when deflated by the CPI rather than the GDP deflator suggests that the terms of trade for Bulgarian consumers have improved, lowering the relative cost of consumption. The slight gap between the growth of compensation and wages and salaries suggests that the non-wage components of compensation have grown slightly more slowly than wages and salaries in the period from 2002 until 2017.
Figure 5 / Bulgaria: productivity and wage decoupling decomposition, 2002 = 100
Source: EU KLEMS Release 2019; Eurostat, 2020, own display.
50
100
150
200
250
1995 2000 2005 2010 2015 2020
Sectors B-S excluding O
50
100
150
200
250
1995 2000 2005 2010 2015 2020
Sectors B-N
50
100
150
200
1995 2000 2005 2010 2015 2020
Sectors B-F
50
100
150
200
250
1995 2000 2005 2010 2015 2020
Sectors G-N
Gross value added, GDP deflator Net value added, GDP deflator
Labour compensation, GDP deflator Labour compensation, CPI
Wages and salaries, CPI SES: mean wages and salaries, CPI
SES: median wages and salaries, CPI

24 RESULTS Research Report 448
When looking at the SES data, it becomes evident that median wages have grown more slowly than average wages. Further, the graph shows that productivity and compensation have grown in tandem up to the crisis, while productivity growth levels were significantly slower in the post-crisis period, when compensation kept growing at a relatively stable rate. This picture remains largely unchanged when focusing solely on the business economy (sectors B-N).
An interesting pattern emerges when differentiating between developments in industry and construction (sectors B-F) and services of the business economy (sectors G-N). While in industry and construction compensation growth has lagged behind productivity growth for most of the period following 2002 and only catching up with productivity development from 2015 onwards,16 compensation has grown a lot faster than productivity in sectors covering the services of the business economy. Thus, the overall picture of the level of the total economy reflects the trends in the services of the business economy.
Czech Republic
In the Czech Republic, productivity and average wages at the level of the total economy have grown in tandem for most of the period. It is evident that productivity and wage levels flatlined for most of the post-crisis years, surpassing their 2007 level only after 2015. In this period, average compensation using the CPI has grown slightly more slowly than the other measures, including average compensation deflated with the GDP deflator, which suggests that the terms of trade have slightly worsened for workers in the Czech Republic. Additionally, this implies that the non-wage components of compensation have grown more slowly than wages and salaries themselves. Trends visible based on SES data diverge strongly from those observed based on KLEMS and NA data. These differences might stem from the diverging coverage between data sources, since the SES only covers enterprises with ten or more employees and uses full-time equivalents (FTEs) instead of persons in employment.17 Nevertheless, the SES data reveal that mean and median wages and salaries grew together over the observed period. The patterns observed for the sectors B-N do not differ substantially from those observed for sectors B-S excluding O.
A different picture emerges for industry and construction. Here productivity has grown faster than compensation and wages and salaries, with gross value added being at 147% of its 2002 level in 2017, while compensation deflated by the GDP deflator was at 140% of its 2002 level in 2017 and compensation deflated with the CPI in 2017 was at 132% of its 2002 level. This means that the labour share fell and terms of trades worsened for consumers in the Czech Republic.
In the services of the business economy, most measures grew together during the observed period. What stands out is that wages and salaries deflated with the CPI have grown faster than CPI-deflated compensation, implying that the non-wage components of compensation have grown more slowly than the wages and salaries themselves, as also observed at the level of the total economy. Furthermore, in contrast to the other sectoral aggregates, we can observe a slightly stronger decoupling of median wages from mean wages, showing that wage inequality has increased in the services of the business economy, in particular in the pre-crisis years.
16 Patterns evident in the sectors B-F before 2002 suggest that this picture would emerge even more strongly when selecting for instance 1995 as the base year, because productivity in 1995 was only at about 60% of its value in 2002, while compensation and wages and salaries (at least when using the CPI) were approximately at the same level as in 2002.
17 See Schröder and Schwarzhappel (2020).

RESULTS 25 Research Report 448
Figure 6 / Czech Republic: productivity and wage decoupling decomposition, 2002 = 100
Source: EU KLEMS Release 2019; Eurostat, 2020, own display.
Estonia
A considerable gap between average compensation and productivity has developed in Estonia, with compensation and wages and salaries reaching about 168% of their 2002 level in 2008 and gross/net productivity only reaching 132% of its 2002 level in 2008. During the crisis both declined sharply, but they increased again starting from their low in 2009. In the post-crisis period compensation and productivity have grown at similar rates, preserving the gap between compensation and productivity until 2017. Thus Estonia presents an example of the case of reverse decoupling. The labour compensation series deflated with the GDP deflator shows that this is equally explained by an increasing labour share as well as by improving terms of trade for Estonian consumers. Furthermore, we can see from the graph which illustrates these developments within the business economy that median wages have grown faster than mean wages.
In Estonia, the patterns regarding the decoupling of compensation/wages from productivity are very similar across the sectoral aggregates. What is interesting in Estonia’s case, however, are the varying growth rates of productivity and compensation/wages themselves. While productivity and compensation/wages in industry and construction have recovered rather quickly after the crisis and surpassed their pre-crisis high, productivity and compensation/wages in the services of the business economy have grown relatively slowly. In services, compensation and wages and salaries have just reached their pre-crisis level relative to 2002, and
80
100
120
140
160
1995 2000 2005 2010 2015 2020
Sectors B-S excluding O
80
100
120
140
160
1995 2000 2005 2010 2015 2020
Sectors B-N
80
100
120
140
160
1995 2000 2005 2010 2015 2020
Sectors B-F
80
100
120
140
160
1995 2000 2005 2010 2015 2020
Sectors G-N
Gross value added, GDP deflator Net value added, GDP deflator
Labour compensation, GDP deflator Labour compensation, CPI
Wages and salaries, CPI SES: mean wages and salaries, CPI
SES: median wages and salaries, CPI

26 RESULTS Research Report 448
productivity in these sectors is still lower in 2017 than it was in 2007. For both sectors, however, it is evident that productivity has grown more slowly than wages.
Figure 7 / Estonia: productivity and wage decoupling decomposition, 2002 = 100
Source: EU KLEMS Release 2019; Eurostat, 2020, own display.
Hungary
Between 2002 and 2017 the average Hungarian workers’ compensation at consumer prices has grown slightly less than their productivity. The biggest portion of total decoupling can be attributed to worsening terms of trade for Hungarian workers, and a small part is due to a declining labour share. Additionally, in contrast to compensation, wages and salaries have grown together with productivity growth, which reflects the slow growth of non-wage components as an important factor in the Hungarian case. Regarding overall productivity growth, we can see that Hungary has not yet overcome the crisis, with productivity still being below its 2008 level. Based on SES data, we can see that changes in median wages have broadly followed trends in mean wages. In the business economy, trends are broadly similar, but generally more pronounced than in the total economy.
When comparing industry and construction with the services of the business economy, two diverging trends become evident. In Hungary, productivity in industry and construction has consistently grown faster than compensation at consumer prices. In contrast, productivity growth in the services of the business economy
50
100
150
200
1995 2000 2005 2010 2015 2020
Sectors B-S excluding O
50
100
150
200
1995 2000 2005 2010 2015 2020
Sectors B-N
50
100
150
200
1995 2000 2005 2010 2015 2020
Sectors B-F
50
100
150
200
1995 2000 2005 2010 2015 2020
Sectors G-N
Gross value added, GDP deflator Net value added, GDP deflator
Labour compensation, GDP deflator Labour compensation, CPI
Wages and salaries, CPI SES: mean wages and salaries, CPI
SES: median wages and salaries, CPI
RESULTS 27 Research Report 448
has generally (and particularly in the pre-crisis period) been lower than compensation growth, with the indicators converging only in the most recent years. Furthermore, productivity and compensation in industry and construction have generally been growing and have also recovered quickly after the crisis, while productivity and compensation in the service sectors have grown up to the crisis, then dropped to 2002 levels in 2014/2015, and only show an upwards trend in the most recent years.
Figure 8 / Hungary: productivity and wage decoupling decomposition, 2002 = 100
Source: EU KLEMS Release 2019; Eurostat, 2020, own display.
Lithuania
At the level of the total economy, the data for Lithuania reveal a very similar picture to the one shown for Estonia. In Lithuania, too, a considerable gap has developed between average compensation and productivity, with compensation and wages and salaries reaching about 173% of their 2002 level in 2008 and gross/net productivity only reaching 141% of its 2002 level in 2008. During the crisis both registered a sharp decline. In the post-crisis period this gap initially narrowed until 2013 but then started to widen again from 2014. In 2017 the gap between productivity and wages was once again considerable compared with its level in 2002. As for Estonia, the labour compensation series deflated with the GDP deflator shows that this gap is explained in equal measure by an increasing labour share as well as by improving terms of trade for consumers. The picture for the business economy does not differ much from the one that emerges for the total economy.
80
90
100
110
120
1995 2000 2005 2010 2015 2020
Sectors B-S excluding O
80
90
100
110
120
1995 2000 2005 2010 2015 2020
Sectors B-N
80
100
120
140
160
1995 2000 2005 2010 2015 2020
Sectors B-F
80
100
120
1995 2000 2005 2010 2015 2020
Sectors G-N
Gross value added, GDP deflator Net value added, GDP deflator
Labour compensation, GDP deflator Labour compensation, CPI
Wages and salaries, CPI SES: mean wages and salaries, CPI
SES: median wages and salaries, CPI

28 RESULTS Research Report 448
Figure 9 / Lithuania: productivity and wage decoupling decomposition, 2002 = 100
Source: EU KLEMS Release 2019; Eurostat, 2020, own display.
For industry and construction we can see that compensation growth has broadly been in line with productivity growth. The growth of compensation has been similar in the services of the business economy, but productivity growth in these sectors has experienced far lower growth rates, leading to a substantial gap between compensation and productivity measures in 2017.
The SES data do not show a substantial gap between mean and median compensation developing between 2002 and 2014 in any of the sectoral aggregates.
Latvia
Latvia’s experience is comparable to that of the other Baltic countries. Since 2002 compensation has also grown much faster than productivity, reflecting an increasing labour share and improved terms of trade for Latvian consumers. However, compensation growth has been even higher in Latvia than in Estonia and Lithuania, while productivity has grown at a faster rate than in Estonia and at a similar rate to that in Lithuania. This has led to a large amount of reverse decoupling of compensation from productivity measures.
50
100
150
200
1995 2000 2005 2010 2015 2020
Sectors B-S excluding O
50
100
150
200
1995 2000 2005 2010 2015 2020
Sectors B-N
50
100
150
200
1995 2000 2005 2010 2015 2020
Sectors B-F
50
100
150
200
1995 2000 2005 2010 2015 2020
Sectors G-N
Gross value added, GDP deflator Net value added, GDP deflator
Labour compensation, GDP deflator Labour compensation, CPI
Wages and salaries, CPI SES: mean wages and salaries, CPI
SES: median wages and salaries, CPI

RESULTS 29 Research Report 448
Similar to Estonia and Lithuania, compensation growth has been comparable between industry and construction and services of the business economy, and productivity growth has been slower in the service sectors.
Additionally, median wages have grown considerably faster than mean wages in the Latvian business economy, which is particularly driven by the service sectors.
Figure 10 / Latvia: productivity and wage decoupling decomposition, 2002 = 100
Source: EU KLEMS Release 2019; Eurostat, 2020, own display.
Poland
A particularly interesting picture of decoupling emerges for Poland. Take the level of the total economy first: in the pre-crisis period productivity grew initially very fast and then levelled off, while compensation initially declined but then grew fast. As a result, in 2008 both productivity and the compensation measures were at a similar level as in 2002. A similar pattern emerges after the crisis, which hit Poland much less than most other European economies. Productivity initially grew much faster than compensation, but in 2017 both converged towards a similar level relative to 2002. Additionally, the SES data reveal that between 2010 and 2014 wage inequality rose in Poland.
100
150
200
250
1995 2000 2005 2010 2015 2020
Sectors B-S excluding O
100
150
200
250
1995 2000 2005 2010 2015 2020
Sectors B-N
100
150
200
250
1995 2000 2005 2010 2015 2020
Sectors B-F
100
150
200
250
1995 2000 2005 2010 2015 2020
Sectors G-N
Gross value added, GDP deflator Net value added, GDP deflator
Labour compensation, GDP deflator Labour compensation, CPI
Wages and salaries, CPI SES: mean wages and salaries, CPI
SES: median wages and salaries, CPI

30 RESULTS Research Report 448
This picture remains mostly unchanged when focusing on the business economy only. However, it is evident that the gap between mean and median wages (i.e. wage inequality) has been much bigger in the sectors of the business economy.
All in all the data suggest that the considerable gap between productivity growth and the growth in average compensation, as for example noted by the OECD (2018) for 1995 until 2013, might be closing in the most recent years, but that the distribution of the growth in average compensation is increasingly uneven, as indicated by a widening gap between mean and median compensation.
The distinction between industry and construction and the services of the business economy sheds some light on these developments.
Figure 11 / Poland: productivity and wage decoupling decomposition, 2002 = 100
Source: EU KLEMS Release 2019; Eurostat, 2020, own display.
In industry and construction productivity has been growing very fast between 2002 and 2017, with only a short period of levelling off between 2003 and 2008.18 Compensation in these sectors, however, has been growing rather slowly. Between 2002 and 2017 GVA in industry and construction increased to about 150% of its level in 2002, while compensation/wages growth only increased to about 130% of its level in 2002. Thus
18 Note also the different scale in the graph for the sectors B-F in contrast to that for sectors G-N.
100
120
140
1995 2000 2005 2010 2015 2020
Sectors B-S excluding O
100
120
140
1995 2000 2005 2010 2015 2020
Sectors B-N
100
120
140
160
1995 2000 2005 2010 2015 2020
Sectors B-F
100
120
140
1995 2000 2005 2010 2015 2020
Sectors G-N
Gross value added, GDP deflator Net value added, GDP deflator
Labour compensation, GDP deflator Labour compensation, CPI
Wages and salaries, CPI SES: mean wages and salaries, CPI
SES: median wages and salaries, CPI

RESULTS 31 Research Report 448
productivity has largely decoupled from productivity growth during these years in Polish industry and construction, with the data hinting at convergence in most recent years.
In contrast, productivity has developed at a slower rate in the services of the business economy, which means that compensation/wage growth, showing similar developments across these sectoral aggregates, has tracked these changes much more closely. However, the SES data reveal that these increases in average compensation/wages in the service economy have been accompanied by increasing wage inequality, which implies that the benefits from these increases in average compensation/wages are less equally distributed.
Romania
In Romania, productivity and compensation at consumer prices have grown in tandem for most of the period. Only in the most recent years have compensation and wages at consumer prices grown much faster than productivity at producer prices, leaving a considerable gap between the two series in 2017. The series on the compensation at producer prices shows that the labour share has drastically fallen before and during the crisis. Thus, the common growth of productivity and labour compensation is mostly due to improving terms of trade for Romanian consumers in the pre-crisis years. This becomes evident from compensation deflated with the GDP deflator, which is only about 150% of its 2002 level in 2017, while compensation and wages at consumer prices are at about 225% of their 2002 level in 2017. The SES data reveal no significant gap in the growth of average versus median wages. The focus on the business economy leaves this picture mostly unchanged.
In the pre-crisis years productivity in industry and construction grew very fast in Romania. In the post-crisis years productivity mostly flatlined, while compensation fell sharply in the initial crisis period and only recovered starting in 2014, finally matching productivity growth relative to 2002 in 2017. However, while the growth of compensation at consumer prices has broadly kept up with this growth, compensation at producer prices has strongly decoupled from productivity, which implies a strongly declining labour share in Romanian industry and construction, which is to some extent offset by the improved terms of trade for Romanian consumers.
Between the two sectoral aggregates we can see that most of the declining labour share in Romania can be attributed to industry and construction, since it cannot be observed in the service sector of the business economy. Instead we can see in the service sector that compensation/wages at consumer prices have grown much faster than productivity within services. Compared with industry and construction, productivity in the service economy took a deep hit during the crisis years, but then it also increased faster in the post-crisis years from 2011 to 2017.
The SES data do not imply changes in the levels of wage inequality in both sectoral aggregates.

32 RESULTS Research Report 448
Figure 12 / Romania: productivity and wage decoupling decomposition, 2002 = 100
Note: Net value added for Romania is not displayed due to missing depreciation data for some years and sectors. Source: EU KLEMS Release 2019; Eurostat, 2020, own display.
Slovenia
In general, growth of productivity and compensation in Slovenia follow very similar trends from 2002 until 2017. Productivity and wages have grown in tandem up to the crisis, and both have pretty much stagnated since the crisis. What stands out in the Slovenian case is that labour compensation at producer prices has not experienced the same hard decline in the crisis as the other indicators. This leaves a small but consistent gap between labour compensation and gross value added (both at producer prices), suggesting an increased labour share in the post-crisis period relative to the years before the crisis. SES data tell us that between 2002 and 2014 median wages grew faster than mean wages, which suggests that incomes became more evenly distributed during this period.
For Slovenia, the picture of decoupling does not change much when considering only the business economy or differentiating between industry and construction and the service sectors. However, it is evident that productivity in industry and construction grew slightly faster than compensation both before and after the crisis, which suggests that decoupling of compensation from productivity might still be a relevant issue in Slovenia, in particularly when also considering their developments before 2002, as reflected in Theodoropoulou (2019).
50
100
150
200
250
1995 2000 2005 2010 2015 2020
Sectors B-S excluding O
50
100
150
200
250
1995 2000 2005 2010 2015 2020
Sectors B-N
50
100
150
200
250
1995 2000 2005 2010 2015 2020
Sectors B-F
50
100
150
200
250
1995 2000 2005 2010 2015 2020
Sectors G-N
Gross value added, GDP deflator Labour compensation, GDP deflator
Labour compensation, CPI Wages and salaries, CPI
SES: mean wages and salaries, CPI SES: median wages and salaries, CPI

RESULTS 33 Research Report 448
Regarding the development of productivity on its own, it is interesting to note that productivity in industry and construction recovered much more quickly after the crisis, while productivity in the services of the business economy is still below its pre-crisis level.
Figure 13 / Slovenia: productivity and wage decoupling decomposition, 2002 = 100
Source: EU KLEMS Release 2019; Eurostat, 2020, own display.
Slovakia
Figure 14 shows that productivity and compensation at producer prices have grown in tandem in Slovakia. However, when looking at compensation/wages at consumer prices, the graphs show that they have strongly decoupled from the growth of compensation at producer prices, which suggests a substantial worsening in the terms of trade for Slovakian workers. When considering the growth of net value added, the gap with compensation/wages at consumer prices is even wider.
The comparison of sectoral aggregates reveals that the trends of decoupling observed at the level of the total economy are more pronounced in industry and construction, whereas they are less marked in the services of the business economy, similar to our findings for other countries.
80
100
120
140
1995 2000 2005 2010 2015 2020
Sectors B-S excluding O
80
100
120
140
1995 2000 2005 2010 2015 2020
Sectors B-N
60
80
100
120
140
1995 2000 2005 2010 2015 2020
Sectors B-F
80
100
120
140
1995 2000 2005 2010 2015 2020
Sectors G-N
Gross value added, GDP deflator Net value added, GDP deflator
Labour compensation, GDP deflator Labour compensation, CPI
Wages and salaries, CPI SES: mean wages and salaries, CPI
SES: median wages and salaries, CPI

34 RESULTS Research Report 448
Across the observed period and across the different sectoral aggregates income inequality in Slovakia was very stable between 2002 and 2014, as illustrated by the uniform growth of median wages and average wages.
Figure 14 / Slovakia: productivity and wage decoupling decomposition, 2002 = 100
Source: EU KLEMS Release 2019; Eurostat, 2020, own display.
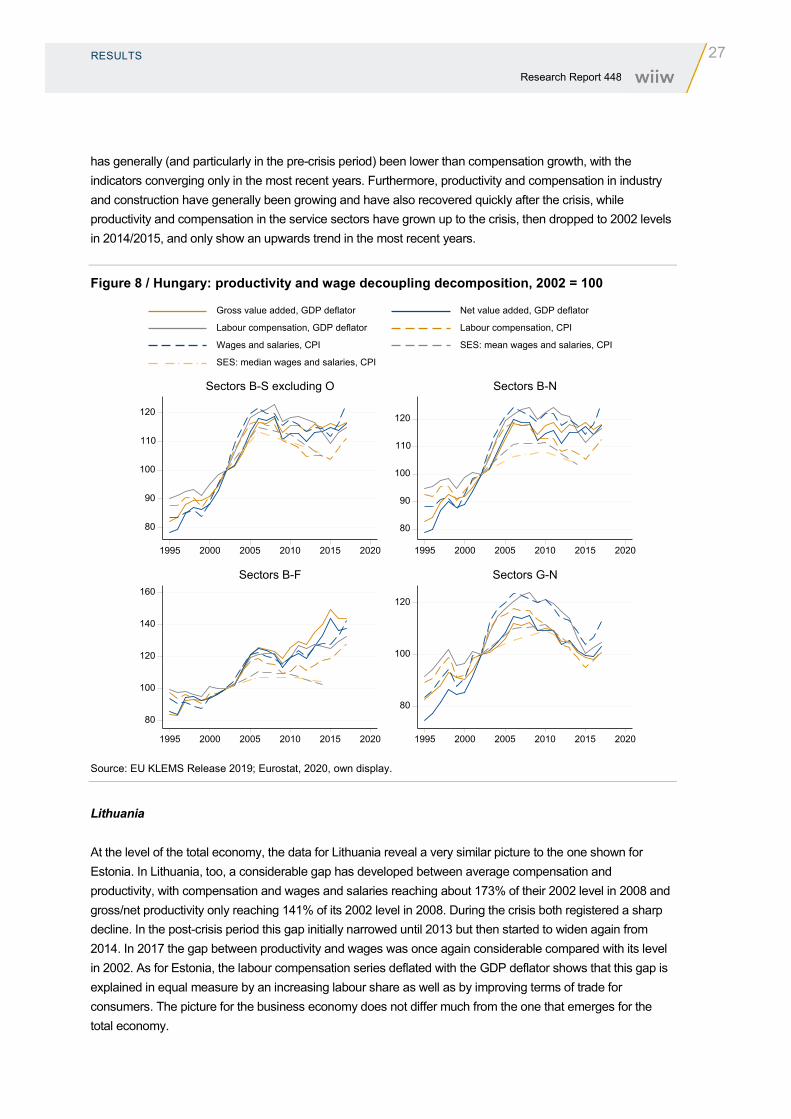
Germany and Austria
For the sake of comparison, in the following section we also present the data for Germany and Austria, whose economies are tightly interwoven with the economies of many of the EU-CEE11 countries (Stehrer and Stöllinger, 2015). Note the smaller range of the y axis in Figure 15 and Figure 16, which reflects the less pronounced developments in productivity and wage growth that are to be expected for these more advanced economies.
For Germany, we can see that up to the crisis productivity at the level of the total economy has increased strongly. It decreased sharply during the crisis but recovered to its pre-crisis level up to 2017. Relative to 2002, wages and salaries even stagnated (at producer prices) or decreased leading up to the crisis and then matched the growth of productivity in the post-crisis period. Data from the SES on median wages in the business economy tell us that in addition to these developments a considerable gap developed between
50
100
150
200
1995 2000 2005 2010 2015 2020
Sectors B-S excluding O
50
100
150
200
1995 2000 2005 2010 2015 2020
Sectors B-N
50
100
150
200
1995 2000 2005 2010 2015 2020
Sectors B-F
50
100
150
200
1995 2000 2005 2010 2015 2020
Sectors G-N
Gross value added, GDP deflator Net value added, GDP deflator
Labour compensation, GDP deflator Labour compensation, CPI
Wages and salaries, CPI SES: mean wages and salaries, CPI
SES: median wages and salaries, CPI

RESULTS 35 Research Report 448
median and average wages, indicating that the “typical” worker did not gain from the increases in productivity between 2002 and 2014, as analysed in more detail by Kügler, Schönberg and Schreiner (2018).
Figure 15 / Germany: productivity and wage decoupling decomposition, 2002 = 100
Source: EU KLEMS Release 2019; Eurostat, 2020, own display.
By dividing the business economy into industry and construction and services, diverging patterns become evident. On the one hand, productivity has increased strongly in industry and construction, while compensation/wages (at consumer prices) have stagnated throughout most of this period, with increases only recorded in the most recent years. In the services of the business economy, on the other hand, productivity has mostly stagnated and even fallen modestly during the crisis years. However, compensation and wages at consumer prices have also started to grow in the services of the business economy in the most recent years. Furthermore, we can see that increases income inequality have been larger in services than in industry and construction.
In Austria, the growth of compensation and wages at producer as well as consumer prices has decoupled from the growth of productivity in the pre-crisis period. Owing to decreases in productivity during the crisis years, productivity and wages show similar growth rates relative to 2002 in the post-crisis period. However, the observed diverging patterns between 1995 and 2002 suggest that, when considering the longer time period between 1995 and 2017, growth of compensation/wages using producer prices has decoupled from the growth of productivity, and even more so when looking at compensation/wages at consumer prices, as
90
95
100
105
110
1995 2000 2005 2010 2015 2020
Sectors B-S excluding O
90
95
100
105
110
1995 2000 2005 2010 2015 2020
Sectors B-N
80
100
120
140
1995 2000 2005 2010 2015 2020
Sectors B-F
80
100
120
140
1995 2000 2005 2010 2015 2020
Sectors G-N
Gross value added, GDP deflator Net value added, GDP deflator
Labour compensation, GDP deflator Labour compensation, CPI
Wages and salaries, CPI SES: mean wages and salaries, CPI
SES: median wages and salaries, CPI
36 RESULTS Research Report 448
found by Theodoropoulou (2019). For Austria, the SES data do not show a substantial gap in the growth of median versus average wages.
Figure 16 / Austria: productivity and wage decoupling decomposition, 2002 = 100
Source: EU KLEMS Release 2019; Eurostat, 2020, own display.
90
95
100
105
110
1995 2000 2005 2010 2015 2020
Sectors B-S excluding O
90
95
100
105
110
1995 2000 2005 2010 2015 2020
Sectors B-N
80
90
100
110
120
1995 2000 2005 2010 2015 2020
Sectors B-F
80
90
100
110
120
1995 2000 2005 2010 2015 2020
Sectors G-N
Gross value added, GDP deflator Net value added, GDP deflator
Labour compensation, GDP deflator Labour compensation, CPI
Wages and salaries, CPI SES: mean wages and salaries, CPI
SES: median wages and salaries, CPI

CONCLUSIONS 37 Research Report 448
5. Conclusions
This article has examined the decoupling of productivity from wages in the period 2002-2017 in European countries, with a particular focus on the Central and East European members of the EU. It has first shown decoupling at the level of the total economy and subsequently contrasted wage-productivity decoupling within industry and construction with decoupling in the service sector. Additionally, it has revealed factors underlying the decoupling of productivity from compensation and/or wages, namely changes in the labour share, changes in the terms of trade, the development of non-wage components of compensation, and wage inequality.
In general, the analysis has shown that the decoupling of productivity from labour productivity in European countries has been a lot less clear-cut than seems to have been the case in the US and therefore confirms the substantial cross-country variation found in previous studies (e.g. Nolan, Roser and Thewissen, 2019; OECD, 2018; Theodoropoulou, 2019). Based on previous literature analysing the increasing concentration of manufacturing in a Central European manufacturing core (Stehrer and Stöllinger 2015; Stöllinger 2016), we have differentiated the decoupling in EU-CEE11 countries that belong to the CE manufacturing core and those that do not. The analysis shows that patterns of wage-productivity decoupling reflect the different growth paths that these countries followed after EU integration and their corresponding industry structure.
In the countries considered part of the CE manufacturing core productivity has grown faster than compensation throughout most of the analysed period from 2002 to 2017. The gap between productivity and wage growth shrank during the crisis, then widened following the crises years and shrank again in the most recent years, driven by strong compensation/wage growth. Throughout this period the decoupling of compensation from productivity is explained equally by a declining labour share and by worsening terms of trade for workers. Wage inequality and the slower growth of the non-wage components of compensation play a smaller role in total decoupling. Within industry and construction these patterns reappear much more pronounced, whereas they are much less pronounced in the services sector owing to slower productivity growth.
A very different picture has emerged for the countries that do not belong to the CE manufacturing core. Here, the analysis has revealed reverse decoupling, meaning that compensation/wages have grown faster than productivity, irrespective of the measurements used. In 2017 this gap is almost equally explained by an increasing labour share and by improved terms of trade for workers within these countries relative to 2002. The sectoral breakdown shows that growth of compensation and wages has been broadly in line with productivity growth in industry and construction. In the service sector, on the other hand, compensation and wages at consumer prices have grown much faster than compensation at producer prices, which itself has grown faster than GVA and NVA. This points to reverse decoupling owing to an increasing labour share and improved terms of trade.
In the analysis of individual countries, Poland and Slovakia stand out as the countries that have experienced the strongest decoupling of productivity from wages. While worsening terms of trade were found to explain this trend in Slovakia, a falling labour share explained these developments in Poland. In Poland, however, the
38 CONCLUSIONS Research Report 448
most recent trends in wage developments seem to counteract the trend of decoupling. As Pessoa and Van Reenen (2013) found for the UK, we observe reverse decoupling (compensation growing faster than productivity) in the personal services industry in many countries. However, we have to keep in mind that this aggregate also covers the sectors where productivity growth is particularly hard to measure accurately (OECD, 2018). The Baltic countries, previously characterised as following a dependent debt-driven growth path (Bohle, 2018), stand out from the group of non-manufacturing core EU-CEE11 countries as particularly strong cases of reverse decoupling. In most countries the overall picture of decoupling remains largely unchanged when focusing on the business economy as opposed to our aggregate of the total economy. This suggests that trends in the (mostly) public sector, which are excluded in the aggregate for the business economy, do not differ much from those observed for the business economy and the total economy, or that these sectors are too small in terms of value added and compensation paid to impact the overall picture.
Going forward, economic policy should consider two interwoven developments demonstrated by this analysis. On the one hand, the fact that compensation growth has broadly followed productivity growth in most countries highlights the importance of common measures aimed at increasing productivity, and especially so in light of further common challenges facing the region, such as demographic change (Leitner and Stehrer, 2019) and the coronavirus pandemic. Allowing for productivity growth against the backdrop of these challenges necessitates substantial public-sector investment, which should be pursued and coordinated at the EU level, since these key challenges cannot realistically be met by any of the member states individually (Landesmann and Stöllinger, 2020).
On the other hand, a general implication of the productivity-wage decoupling literature has been that wages, and particularly median wages, should play a central role besides productivity measures for monitoring living standards and inclusive growth (see e.g. Nolan, Roser and Thewissen, 2019). Our analysis reinforces these results with regard to the (East) European member states, and in particular those countries that belong to the Central European manufacturing core, where wage growth has not followed productivity growth. Recent undermining of wage negotiation mechanisms and the coverage of collective-bargaining agreements in these countries mean that the benefits of productivity increases and general improvements in the labour market situation are not fully passed on to workers (Astrov et al., 2019). Therefore, industrial policy has to be linked to wage and fiscal policy measures. Improving a country’s competitiveness and unemployment through low wage growth over a long period is unlikely to be a viable strategy, especially when also considering developments in wage inequality and the evidence that labour market deregulation will not cure unemployment (Gil-Alana and Skare, 2018; Heimberger, 2019; Kügler, Schönberg and Schreiner, 2018; López-Villavicencio and Silva, 2011; Meager and Speckesser, 2011). The delicate balance between these factors further demonstrates the necessity of an integrated and coordinated EU industrial, wage and fiscal policy (Gräbner et al., 2019; Landesmann and Stöllinger, 2020).
Our results provide first insights into the importance of the EU-CEE11 countries' industry structures for their experience of wage-productivity decoupling. However, specific sectoral and regional developments are obscured by the use of very broad sectoral aggregates and the analysis of developments at the country level. Since shifts in industry structure within Europe have a strong regional dimension (see Figure 17), decoupling could also be analysed on a regional scale. Currently, the limiting factor for a more in-depth analysis of decoupling across European countries is the lack of a data source providing comparable data on median wages for a more detailed sectoral breakdown and/or on a regional scale.

CONCLUSIONS 39 Research Report 448
Figure 17 / Changes in industry structure in Europe
(a) Change of the share of employment in manufacturing of motor vehicles, trailers and semi-trailers; 2008/9-2016/7
(b) Change of the share of employment in computer programming, consultancy and related activities; 2008/9-2016/7
Note: 2008/9 = average values for the years 2008 and 2009; 2016/17 = averages for the years 2016 and 2017. Source: Eurostat (2020); own display.

40 CONCLUSIONS Research Report 448
Future analysis should also incorporate the analysis of productivity and wage developments within specific industries. The manufacture of electrical equipment or motor vehicles, trailers and semi-trailers could be of particular interest to the countries of the Central European manufacturing core (see Figure 17a). In contrast, productivity and wage developments within sectors at the digital frontier are also often seen as related to a fall of the labour share (Acemoglu and Restrepo, 2016; Autor et al., 2017; Autor et al., 2020; Brynjolfsson and McAfee 2014; Katz and Murphy 1992; Zilian et al., 2016). Industries such as computer programming, consultancy and related activities or scientific research and development could be of interest to the Baltic countries, for example, where employment in these sectors has grown strongly in the past decade (see Figure 17b) and our analysis indicates strong growth of productivity and compensation in the service sector in general.
A further step for future research should be a comparative analysis of which institutional arrangements might explain the rate at which productivity growth translates into median wage growth, as has been partly done in other recent studies (Kügler et al., 2018; Astrov et al., 2019). Based on economic theory and the vast literature on decoupling, we know that there is some link between the development of productivity and wages (Elgin and Kuzubas, 2013; López-Villavicencio and Silva, 2011; Meager and Speckesser, 2011; Nikulin, 2015; Pasimeni, 2018) and which economic factors can serve as proximate explanations for these developments. In a next step, studies should turn to the analysis of institutional determinants of the rate at which productivity growth translates into wage growth.

REFERENCES 41 Research Report 448
References
Acemoglu, Daron and Pascual Restrepo (May 2016). The Race Between Machine and Man: Implications of Technology for Growth, Factor Shares and Employment. Working Paper 22252. National Bureau of Economic Research. https://doi.org/10.3386/w22252, http://www.nber.org/papers/w22252.
Alexander, Scott (2019). Wage Stagnation: Much More Than You Wanted to Know. https://slatestarcodex.com/2019/02/25/wage-stagnation-much-more-than-you-wanted-to-know/. Accessed: 2019-11-04
Astrov, Vasily et al. (2019). Wage Developments in the Central and Eastern European EU Member States. wiiw Research Report, No. 443. https://wiiw.ac.at/wage-developments-in-the-central-and-eastern-european-eu-member-states-p-5108.html.
Autor, David, David Dorn, Lawrence F. Katz, Christina Patterson and John van Reenen (2020). “The Fall of the Labor Share and the Rise of Superstar Firms”, 135.2. https://scholar.harvard.edu/lkatz/publications/fall-labor-share-and-rise-superstar-firms.
Autor, David, David Dorn, Lawrence F. Katz, Christina Patterson and John van Reenen (2017). “Concentrating on the Fall of the Labor Share”, American Economic Review 107.5, pp. 180–85. https://doi.org/10.1257/aer.p20171102, http://www.aeaweb.org/articles?id=10.1257/aer.p20171102.
Azmat, Ghazala, Alan Manning and John van Reenen (2012). “Privatization and the Decline of Labour’s Share: International Evidence from Network Industries”, Economica 79.315, pp. 470–492. ISSN: 00130427, 14680335. http://www.jstor.org/stable/23274806.
Bivens, Josh, Elise Gould et al. (2014). Raising America’s Pay. Why It’s Our Central Economic Policy Challenge. Briefing Paper No. 378. Economic Policy Institute. https://www.epi.org/files/pdf/65287.pdf.
Bivens, Josh and Lawrence Mishel (2015). Understanding the Historic Divergence Between Productivity and a Typical Worker’s Pay. Why it Matters and Why It’s Real. Briefing Paper No. 406. Economic Policy Institute. https://www.epi.org/files/2015/understanding-productivity-pay-divergence-final.pdf.
Blanchard, Olivier and Francesco Giavazzi (2003). “Macroeconomic Effects of Regulation and Deregulation in Goods and Labor Markets”, The Quarterly Journal of Economics 118.3, pp. 879–907. ISSN: 0033-5533. https://doi.org/10.1162/00335530360698450.
Bohle, Dorothee (2018). “European Integration, Capitalist Diversity and Crises Trajectories on Europe’s Eastern Periphery”, New Political Economy 23.2, pp. 239–253. https://doi.org/10.1080/13563467.2017.1370448.
Bosworth, Barry and George L. Perry (1994). Productivity and Real Wages: Is There a Puzzle?, Brookings Papers on Economic Activity 25.1, pp. 317–343. https://ideas.repec.org/a/bin/bpeajo/v25y1994i1994-1p317-343.html.
Brynjolfsson, Erik and Andrew McAfee (2014). The second machine age: Work, progress, and prosperity in a time of brilliant technologies. New York: W. W. Norton & Company.
Economic Policy Institute (2019). The Productivity-Pay Gap. https://www.epi.org/productivity-pay-gap/.
Elgin, Ceyhun and Tolga Umut Kuzubas (2013). Wage-productivity gap in OECD economies. Economics: The Open-Access, Open-Assessment E-Journal 7.2013-21, pp. 1–21. ISSN: 1864-6042. https://doi.org/10.5018/economics-ejournal.ja.2013-21, http://hdl.handle.net/10419/74549.
EU KLEMS Release 2019 (2019). EU KLEMS Growth and Productivity Accounts Release 2019. Database. https://euklems.eu/.

42 REFERENCES Research Report 448
European Communities (2008). NACE Rev. 2. Statistical classification of economic activities in the European Community. https://ec.europa.eu/eurostat/documents/3859598/5902521/KS-RA-07-015-EN.PDF.
Eurostat (2020). Eurostat Database. https://ec.europa.eu/eurostat/data/database.
Feldstein, Martin (2008). “Did wages reflect growth in productivity?” Journal of Policy Modeling 30.4. Growth, Productivity, and Wages in the U. S. Economy, pp. 591–594. ISSN: 0161-8938. https://doi.org/10.1016/j.jpolmod.2008.04.003, http://www.sciencedirect.com/science/article/pii/S0161893808000343.
Gil-Alana, Luis A. and Skare, Marinko (2018). “Testing the great decoupling: a long memory approach”, Empirica 45.4, pp. 801–820. ISSN: 1573-6911. https://doi.org/10.1007/s10663- 017-9390-6.
Gräbner, Claudius et al. (2019). “Structural change in times of increasing openness: assessing path dependency in European economic integration”, Journal of Evolutionary Economics. https://doi.org/10.1007/s00191-019-00639-6.
Hall, Ben (2019). “Huge wage rises signal new phase in central Europe’s transformation Poland, Czech Republic and Hungary among countries looking to shed ‘cheap labour’ reputation”, Financial Times. Accessed: 2019-14-11. https://www.ft.com/content/2c3c46ac-ef6f-11e9-ad1e-4367d8281195.
Heimberger, Philipp (2019). The Impact of Labour Market Institutions and Capital Accumulation on Unemployment: Evidence for the OECD, 1985-2013. wiiw Working Paper No. 164. https://wiiw.ac.at/the-impact-of-labour-market-institutions-and-capital-accumulation-on-unemployment-evidence-for-the-oecd-1985-2013-p-4886.html.
Karabarbounis, Loukas and Brent Neiman (2014). “The Global Decline of the Labor Share”, The Quarterly Journal of Economics, 129.1, pp. 61–103. ISSN: 0033-5533. https://doi.org/10.1093/qje/qjt032.
Katz, Lawrence F. and Kevin M. Murphy (1992). “Changes in Relative Wages, 1963–1987: Supply and Demand Factors”, The Quarterly Journal of Economics, 107.1, pp. 35–78. ISSN: 0033-5533. https://doi.org/10. 2307/2118323.
Kügler, Alice, Uta Schönberg and Ragnhild Schreiner (2018). Productivity Growth, Wage Growth, and Unions. Proceedings of ECB Forum on Central Banking, June 20th 2018. European Central Bank, pp. 215–247. https://discovery.ucl.ac.uk/id/eprint/10069845.
Landesmann, Michael A. and Joris M. Schröder (2020). “Agglomeration of European Industries”. In: The Oxford Handbook of Industrial Hubs and Economic Development. Ed. by Arkebe Oqubay and Justin Yifu Lin, forthcoming. Oxford: Oxford University Press. Chap. 13. https://global.oup.com/academic/product/the-oxford-handbook-of-industrial-hubs-and-economic-development-9780198850434?q=Oqubay&lang=en&cc=fi#.
Landesmann, Michael A. and Roman Stöllinger (2020). The European Union’s Industrial Policy: What are the Main Challenges? wiiw Policy Note/Policy Report, No. 36. https://wiiw.ac.at/the-european-union-s-industrial-policy-what-are-the-main-challenges-p-5211.html.
Lawrence, Robert Z. (2016). “Does Productivity Still Determine Worker Compensation? Domestic and International Evidence”. In: The US Labor Market. Questions and Challenges for Public Policy. Ed. by Michael R. Strain. Washington, DC: American Enterprise Institute. Chap. 2, pp. 42–61. https://www.aei.org/wp-content/uploads/2016/07/The-US-Labor-Market-7-1-complete.pdf.
Leitner, Sandra and Robert Stehrer (2019). The Automatisation Challenge Meets the Demographic Challenge: In Need of Higher Productivity Growth. wiiw Working Paper, No. 171. https://wiiw.ac.at/the-automatisation-challenge-meets-the-demographic-challenge-in-need-of-higher-productivity-growth-p-5158.html.
López-Villavicencio, Antonia and José Ignacio Silva (2011). “Employment protection and the non-linear relationship between the wage-productivity gap and unemployment”, Scottish Journal of Political Economy, 58.2, pp. 200–220. https://doi.org/10.1111/j.1467-9485.2011.00543.x, https://onlinelibrary.wiley.com/doi/abs/10.1111/j.1467-9485.2011.00543.x.

REFERENCES 43 Research Report 448
Meager, Nigel and Stefan Speckesser (2011). Wages, productivity and employment: A review of theory and international data. Thematic expert ad-hoc paper. Institute for Employment Studies. http://ec.europa.eu/social/main.jsp?catId=1087&langId=en
Nikulin, Dagmara (2015). “Relationship between wages, labour productivity and unemployment rate in new EU member countries”, Journal of International Studies, 8.1, pp. 31–40. https://doi.org/10.14254/2071-8330.2015/8-1/3, https://doi.org/10.14254/2071-8330.2015/8-1/3.
Nolan, Brian, Max Roser, and Stefan Thewissen (2019). “GDP Per Capita Versus Median Household In-come: What Gives Rise to the Divergence Over Time and how does this Vary Across OECD Countries?”, Review of Income and Wealth, 65.3, pp. 465–494. https://doi.org/10.1111/roiw.12362. url: https://onlinelibrary.wiley.com/doi/abs/10.1111/roiw.12362.
OECD (2018). “Decoupling of wages from productivity: What implications for public policies?” In: OECD Economic Outlook, Volume 2018 Issue 2. Ed. by OECD. Paris: OECD. Chap. 2, pp. 51–65. https://doi.org/https://doi.org/10.1787/eco_outlook-v2018-2-en, https://www.oecd-ilibrary.org/content/publication/eco_outlook-v2018-2-en.
OECD (2020). OECD.Stat. Database. https://stats.oecd.org/.
Pasimeni, Paolo (2018). The Relation between Productivity and Compensation in Europe. European Economy Discussion Papers. European Commission. http://ec.europa.eu/social/main.jsp?catId=1087&langId=en.
Pessoa, João P. and John Van Reenen (2013). Decoupling of Wage Growth and Productivity Growth? Myth and Reality. CEP Discussion Paper No 1246. Centre for Economic Performance, London School of Economics and Political Science. https://cep.lse.ac.uk/_new/publications/abstract.asp?index=4356
Prenner, Christoph (2018). “Does productivity pay off? The link between productivity and pay in the EU.” Unpublished working paper. https://www.boeckler.de/pdf/v_2018_10_26_prenner.pdf.
Schröder, Joris M. and Monika Schwarzhappel (2020). Comparing Wage Levels and Developments in Europe: Mind the Data Source. wiiw Statistical Report No. 8. https://wiiw.ac.at/comparing-wage-levels-and-developments-in-europe-mind-the-data-source-p-5175.html.
Schwellnus, Cyrille, Andreas Kappeler and Pierre-Alain Pionnier (2017). “Decoupling of wages from productivity”. In: 1373. https://doi.org/https://doi.org/10.1787/d4764493-en, https://www.oecd-ilibrary.org/content/paper/d4764493-en.
Sharpe, Andrew, Jean-Francois Arsenault and Peter Harrison (2008). The Relationship between Productivity and Real Wage Growth in Canada and OECD Countries, 1961-2006. CSLS Research Reports 2008-08. Centre for the Study of Living Standards. https://ideas.repec.org/p/sls/resrep/0808.html.
Sherk, James (2013). Productivity and Compensation: Growing Together. Backgrounder 2825. The Heritage Foundation. http://thf_media.s3.amazonaws.com/2013/pdf/bg2825.pdf.
Stansbury, Anna M. and Lawrence H. Summers (2018). Productivity and Pay: Is the Link Broken? Peterson Institute for International Economics Working Paper 18-05. https://www.piie.com/publications/working-papers/productivity-and-pay-link-broken.
Stehrer, Robert et al. (2019). Industry Level Growth and Productivity Data with Special Focus on Intangible Assets. Report on methodologies and data construction for the EU KLEMS Release 2019. The Vienna Institute for International Economic Studies. https://euklems.eu/wp-content/uploads/2019/10/Methodology.pdf
Stehrer, Robert and Roman Stöllinger (2015). The Central European Manufacturing Core: What is Driving Regional Production Sharing? FIW-Research Reports No 02 2014/15. https://www.econstor.eu/handle/10419/121234.
Stöllinger, Roman (2016). Structural change and global value chains in the EU. In: Empirica, 43.4, pp. 801–829. ISSN: 1573-6911. https://doi.org/10.1007/s10663-016-9349-z.

44 REFERENCES Research Report 448
Stöllinger, Roman et al. (2013). A ‘Manufacturing Imperative’ in the EU – Europe’s Position in Global Manufacturing and the Role of Industrial Policy. wiiw Research Report, No. 391. https://wiiw.ac.at/a-manufacturing-imperative-in-the-eu--europe-s-position-in-global-manufacturing-and-the-role-of-industrial-policy-p-3081.html.
Theodoropoulou, Sotiria (2019). Convergence to fair wage growth? Evidence from European countries on the link between productivity and real compensation growth, 1970-2017. ETUI Research Paper – Working Paper 2019.07. European Trade Union Institute. http://dx.doi.org/10.2139/ssrn.3402894.
wiiw (2020). wiiw Annual Database. https://data.wiiw.ac.at/annual-database.html.
World Bank (2020). World development indicators. Database. http://datatopics.worldbank.org/world-development-indicators/.
Zilian, Stella et al. (2016). “Technologischer Wandel und Ungleichheit. Zum Stand der empirischen Forschung”, Wirtschaft und Gesellschaft, 42.4, pp. 591–615. https://www.wu.ac.at/fileadmin/wu/d/i/vw1/Willi/Technologischer_Wandel_und_Ungleichheit__WuG_2016_4_pdf.

APPENDIX 45 Research Report 448
Appendix
Table A.1 / Level 1 NACE Rev. 2 (2008) codes
Code Economic Area A Agriculture, forestry and fishing B Mining and quarrying C Manufacturing D Electricity, gas, steam and air conditioning supply E Water supply; sewerage, waste management and remediation activities F Construction G Wholesale and retail trade; repair of motor vehicles and motorcycles H Transportation and storage I Accommodation and food service activities J Information and communication K Financial and insurance activities L Real estate activities M Professional, scientific and technical activities N Administrative and support service activities O Public administration and defence; compulsory social security P Education Q Human health and social work activities R Arts, entertainment and recreation S Other service activities T Activities of households as employers; undifferentiated goods and services producing activities of households for own use U Activities of extraterritorial organisations and bodies
Source: European Communities (2008)

46 APPENDIX Research Report 448
Table A.2 / Annual growth rates of productivity and compensation per employed person in EU28 Countries, 2002-2014, sectors B-S excluding O
Gross value added GDPD
Net value added GDPD
Average labour
compensation GDPD
Average labour
compensation CPI
Average wages and
salaries CPI
SES average
wages and salaries CPI
SES median
wages and salaries
Austria 0.2 0.1 0.2 0.1 0.1 - - Belgium 0.5 0.2 0.4 0.1 0.0 - - Bulgaria 2.5 2.6 4.2 4.3 4.8 5.5 4.2 Cyprus 0.3 0.2 0.2 0.1 1.1 - - Czech Republic 1.9 1.9 1.9 1.4 1.8 2.8 2.6 Germany 0.4 0.3 0.2 -0.2 0.0 - - Denmark 1.0 1.0 0.7 1.0 1.2 - - Estonia 2.5 2.4 3.3 4.5 4.2 - - Greece -0.3 -0.7 -0.6 -1.4 -1.3 - - Spain 0.7 - 0.4 -0.2 -0.4 -0.2 0.2 Finland 0.2 -0.1 0.9 0.8 0.8 - - France 0.5 0.3 0.9 0.6 0.4 - - Hungary 1.2 1.1 1.0 0.4 1.2 0.4 0.5 Ireland 2.3 2.0 2.1 1.0 0.9 0.8 0.6 Italy -0.4 -0.8 0.0 -0.3 -0.2 - - Lithuania 3.9 4.0 4.1 4.5 4.5 3.7 3.8 Luxembourg -0.2 0.0 -0.3 0.3 0.2 - - Latvia 3.0 3.0 4.5 5.4 5.3 - - The Netherlands 0.8 0.7 0.8 0.5 0.0 0.1 -0.1 Poland 2.1 2.4 1.5 1.4 1.5 1.9 1.7 Portugal 1.0 0.8 0.0 -0.2 -0.2 - - Romania 4.4 5.1 2.2 4.6 4.7 2.3 1.9 Sweden 1.4 1.3 1.5 1.7 1.6 1.4 1.3 Slovenia 1.4 1.2 1.8 1.3 0.8 2.0 2.4 Slovakia 3.5 4.3 3.3 1.9 1.6 3.6 3.5 United Kingdom 0.6 0.7 0.8 0.5 -0.1 -2.0 -2.0
Source: EU KLEMS Release 2019 (2019), Eurostat (2020).
IMPRESSUM
Herausgeber, Verleger, Eigentümer und Hersteller: Verein „Wiener Institut für Internationale Wirtschaftsvergleiche“ (wiiw), Wien 6, Rahlgasse 3 ZVR-Zahl: 329995655 Postanschrift: A 1060 Wien, Rahlgasse 3, Tel: [+431] 533 66 10, Telefax: [+431] 533 66 10 50 Internet Homepage: www.wiiw.ac.at Nachdruck nur auszugsweise und mit genauer Quellenangabe gestattet. Offenlegung nach § 25 Mediengesetz: Medieninhaber (Verleger): Verein "Wiener Institut für Internationale Wirtschaftsvergleiche", A 1060 Wien, Rahlgasse 3. Vereinszweck: Analyse der wirtschaftlichen Entwicklung der zentral- und osteuropäischen Länder sowie anderer Transformationswirtschaften sowohl mittels empirischer als auch theoretischer Studien und ihre Veröffentlichung; Erbringung von Beratungsleistungen für Regierungs- und Verwaltungsstellen, Firmen und Institutionen.

wiiw.ac.at
https://wiiw.ac.at/p-5356.html