Embed Size (px)
Citation preview

10/1/2009
1
I t d ti t D i i T Al ithI t d ti t D i i T Al ithIntroduction to Decision Tree AlgorithmIntroduction to Decision Tree Algorithm
Wenyan Li (Emily Li)
Sep. 29, 2009
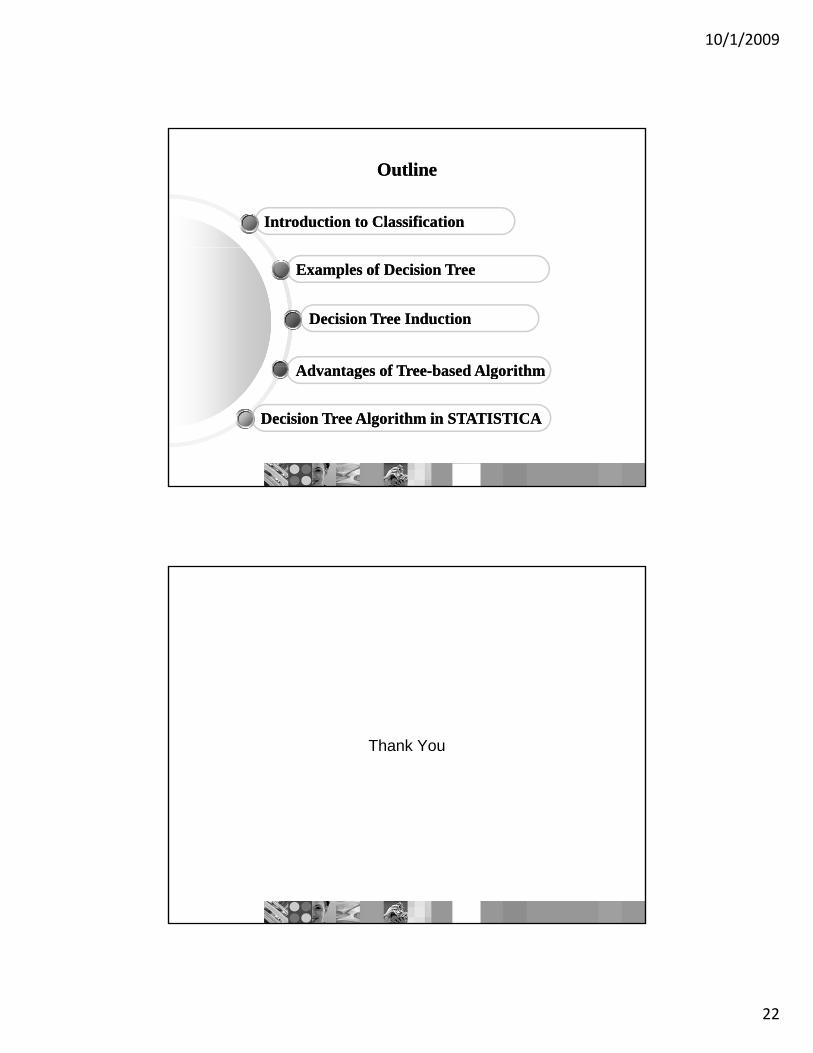
OutlineOutline
Introduction to ClassificationIntroduction to Classification
Ad t f TAd t f T b d Al ithb d Al ith
Decision Tree InductionDecision Tree Induction
Examples of Decision TreeExamples of Decision Tree
Advantages of TreeAdvantages of Tree--based Algorithmbased Algorithm
Decision Tree Algorithm in STATISTICADecision Tree Algorithm in STATISTICA

10/1/2009
2
Introduction to ClassificationIntroduction to Classification
A classification technique (or classifier) is a systematic approach
to building classification models from an input data set. g p
The training data consist of pairs of input objects (typically
vectors), and desired outputs.
The output of the function can be a continuous value (called
regression), or can be a categorical value (called classification).
Introduction to ClassificationIntroduction to Classification
No Time Power Output Wind Speed Fault 296
input objects desired outputTraining data set:
p p
1 4/3/09 8:40 PM -1.48 4.30 0
2 4/4/09 7:00 AM -5.40 5.88 1
3 4/4/09 5:05 PM -10.07 6.72 0
… … … … …
Test data set:
No Time Power Output Wind Speed Fault 296
1 4/5/09 3:10 AM -8.40 11.74 ?
2 4/5/09 1:20 PM -19.00 12.70 ?

10/1/2009
3
Illustrating Classification TaskIllustrating Classification Task
Tid Attrib1 Attrib2 Attrib3 Class
1 Yes Large 125K No
2 No Medium 100K No
3 No Small 70K No
Apply
Model
Learn
Model
4 Yes Medium 120K No
5 No Large 95K Yes
6 No Medium 60K No
7 Yes Large 220K No
8 No Small 85K Yes
9 No Medium 75K No
10 No Small 90K Yes 10
Tid Attrib1 Attrib2 Attrib3 ClassTid Attrib1 Attrib2 Attrib3 Class
11 No Small 55K ?
12 Yes Medium 80K ?
13 Yes Large 110K ?
14 No Small 95K ?
15 No Large 67K ? 10
Examples of Classification TaskExamples of Classification Task
Predicting tumor cells as benign or malignant
Classifying credit card transactions
as legitimate or fraudulent
Classifying secondary structures of protein
as alpha-helix, beta-sheet, or random
coilcoil
Categorizing news stories as finance,
weather, entertainment, sports, etc
10/1/2009
4
Classification TechniquesClassification Techniques
Decision Tree based Methods
Rule-based Methods
Memory based reasoning
Neural Networks
Naïve Bayes and Bayesian Belief Networks
Support Vector Machines
OutlineOutline
Introduction to ClassificationIntroduction to Classification
Ad t f TAd t f T b d Al ithb d Al ith
Tree InductionTree Induction
Examples of Decision TreeExamples of Decision Tree
Advantages of TreeAdvantages of Tree--based Algorithmbased Algorithm
Decision Tree Algorithm in STATISTICADecision Tree Algorithm in STATISTICA

10/1/2009
5
Example of a Decision TreeExample of a Decision Tree
Tid Refund MaritalStatus
TaxableIncome Cheat
Splitting AttributesStatus Income Cheat
1 Yes Single 125K No
2 No Married 100K No
3 No Single 70K No
4 Yes Married 120K No
5 No Divorced 95K Yes
6 No Married 60K No
7 Yes Divorced 220K No
Refund
MarSt
TaxInc
NO
NO
Yes No
Married Single, Divorced
8 No Single 85K Yes
9 No Married 75K No
10 No Single 90K Yes10
YESNO
< 80K > 80K
Training Data Model: Decision Tree
Another Example of Decision TreeAnother Example of Decision Tree
Tid Refund Marital Taxable
MarStMarried
Single, Divorced
Tid Refund MaritalStatus
TaxableIncome Cheat
1 Yes Single 125K No
2 No Married 100K No
3 No Single 70K No
4 Yes Married 120K No
5 No Divorced 95K Yes
6 No Married 60K No
Refund
TaxInc
YESNO
NO
NO
Yes No
< 80K > 80K
7 Yes Divorced 220K No
8 No Single 85K Yes
9 No Married 75K No
10 No Single 90K Yes10
There could be more than one tree that fits the same data!

10/1/2009
6
Apply Model to Test DataApply Model to Test Data
Refund Marital Status
Taxable Income Cheat
N M i d 80K ?
Test Data
Refund
MarSt
TaxInc
NO
NO
Yes No
Married Single, Divorced
No Married 80K ?10
YESNO
< 80K > 80K
Apply Model to Test DataApply Model to Test Data
Refund Marital Status
Taxable Income Cheat
N M i d 80K ?
Test Data
Refund
MarSt
TaxInc
NO
NO
Yes No
Married Single, Divorced
No Married 80K ?10
YESNO
< 80K > 80K

10/1/2009
7
Apply Model to Test DataApply Model to Test Data
Refund Marital Status
Taxable Income Cheat
N M i d 80K ?
Test Data
Refund
MarSt
TaxInc
NO
NO
Yes No
Married Single, Divorced
No Married 80K ?10
YESNO
< 80K > 80K
Apply Model to Test DataApply Model to Test Data
Refund Marital Status
Taxable Income Cheat
N M i d 80K ?
Test Data
Refund
MarSt
TaxInc
NO
NO
Yes No
Married Single, Divorced
No Married 80K ?10
YESNO
< 80K > 80K

10/1/2009
8
Apply Model to Test DataApply Model to Test Data
Refund Marital Status
Taxable Income Cheat
N M i d 80K ?
Test Data
Refund
MarSt
TaxInc
NO
NO
Yes No
Married Single, Divorced
No Married 80K ?10
Assign Cheat to “No”
YESNO
< 80K > 80K
OutlineOutline
Introduction to ClassificationIntroduction to Classification
Ad t f TAd t f T b d Al ithb d Al ith
Decision Tree InductionDecision Tree Induction
Examples of Decision TreeExamples of Decision Tree
Advantages of TreeAdvantages of Tree--based Algorithmbased Algorithm
Decision Tree Algorithm in STATISTICADecision Tree Algorithm in STATISTICA

10/1/2009
9
Decision Tree InductionDecision Tree Induction
Many Algorithms:
– Hunt’s Algorithm (one of the earliest)g ( )
– CART
– ID3, C4.5
– SLIQ,SPRINT
General Structure of Hunt’s AlgorithmGeneral Structure of Hunt’s Algorithm
Let Dt be the set of training records that reach a node t
General Procedure:– If Dt contains records that belong
Tid Refund Marital Status
Taxable Income Cheat
1 Yes Single 125K No
2 No Married 100K No If Dt contains records that belong the same class yt, then t is a leaf node labeled as yt
– If Dt is an empty set, then t is a leaf node labeled by the default class, yd
– If Dt contains records that belong to more than one class, use an
ib li h d i
3 No Single 70K No
4 Yes Married 120K No
5 No Divorced 95K Yes
6 No Married 60K No
7 Yes Divorced 220K No
8 No Single 85K Yes
9 No Married 75K No
10 No Single 90K Yes 10
DtDattribute test to split the data into smaller subsets. Recursively apply the procedure to each subset.
t
?
Dt
?

10/1/2009
10
Hunt’s Hunt’s AlgorithmAlgorithm
Don’t Cheat
Refund
Don’t Cheat
Don’t Cheat
Yes No
Tid Refund MaritalStatus
TaxableIncome Cheat
1 Yes Single 125K No
2 No Married 100K No
3 No Single 70K No
4 Yes Married 120K NoCheat Cheat
Refund
Don’t Cheat
Yes No
MaritalStatus
Single,Married
Refund
Don’t Cheat
Yes No
MaritalStatus
Single,
4 Yes Married 120K No
5 No Divorced 95K Yes
6 No Married 60K No
7 Yes Divorced 220K No
8 No Single 85K Yes
9 No Married 75K No
10 No Single 90K Yes10
Don’t Cheat
Cheat
Divorced Married
TaxableIncome
Don’t Cheat
< 80K >= 80K
Don’t Cheat
Cheat
Single,Divorced Married
Tree InductionTree Induction
Greedy strategy.
– Split the records based on an attribute test that optimizes certain p p
criterion.
Issues
– Determine how to split the records
How to specify the attribute test condition?
How to determine the best split?
– Determine when to stop splitting

10/1/2009
11
Tree InductionTree Induction
Greedy strategy.
– Split the records based on an attribute test that optimizes certain p p
criterion.
Issues
– Determine how to split the records
How to specify the attribute test condition?
How to determine the best split?
– Determine when to stop splitting
How to Specify Test Condition?How to Specify Test Condition?
Depends on attribute types
– Nominal
– Ordinal
– Continuous
Depends on number of ways to split
– 2-way split– 2-way split
– Multi-way split

10/1/2009
12
Splitting Based on Nominal AttributesSplitting Based on Nominal Attributes
Multi-way split: Use as many partitions as distinct values. CarType
Binary split: Divides values into two subsets.
Need to find optimal partitioning.
Family
Sports
Luxury
CarType
{Family, Luxury} {Sports}
CarType
{Sports, Luxury} {Family}
OR
Multi-way split: Use as many partitions as distinct values.
Splitting Based on Ordinal AttributesSplitting Based on Ordinal Attributes
Size
S ll
Binary split: Divides values into two subsets.
Need to find optimal partitioning.
Small
Medium
Large
SizeSize
OR
What about this split?
{Medium, Large} {Small}
{Small, Medium} {Large}
OR
Size
{Small, Large} {Medium}

10/1/2009
13
Splitting Based on Continuous AttributesSplitting Based on Continuous Attributes
Different ways of handling:
– Discretization to form an ordinal categorical attributeg
Static – discretize once at the beginning
Dynamic – ranges can be found by equal interval bucketing, equal
frequency bucketing (percentiles), or clustering.
– Binary Decision: (A < v) or (A v)
consider all possible splits and finds the best cut consider all possible splits and finds the best cut
can be more compute intensive
Splitting Based on Continuous AttributesSplitting Based on Continuous Attributes

10/1/2009
14
Tree InductionTree Induction
Greedy strategy.
– Split the records based on an attribute test that optimizes certain
criterion.
Issues
– Determine how to split the records
How to specify the attribute test condition?
How to determine the best split? How to determine the best split?
– Determine when to stop splitting
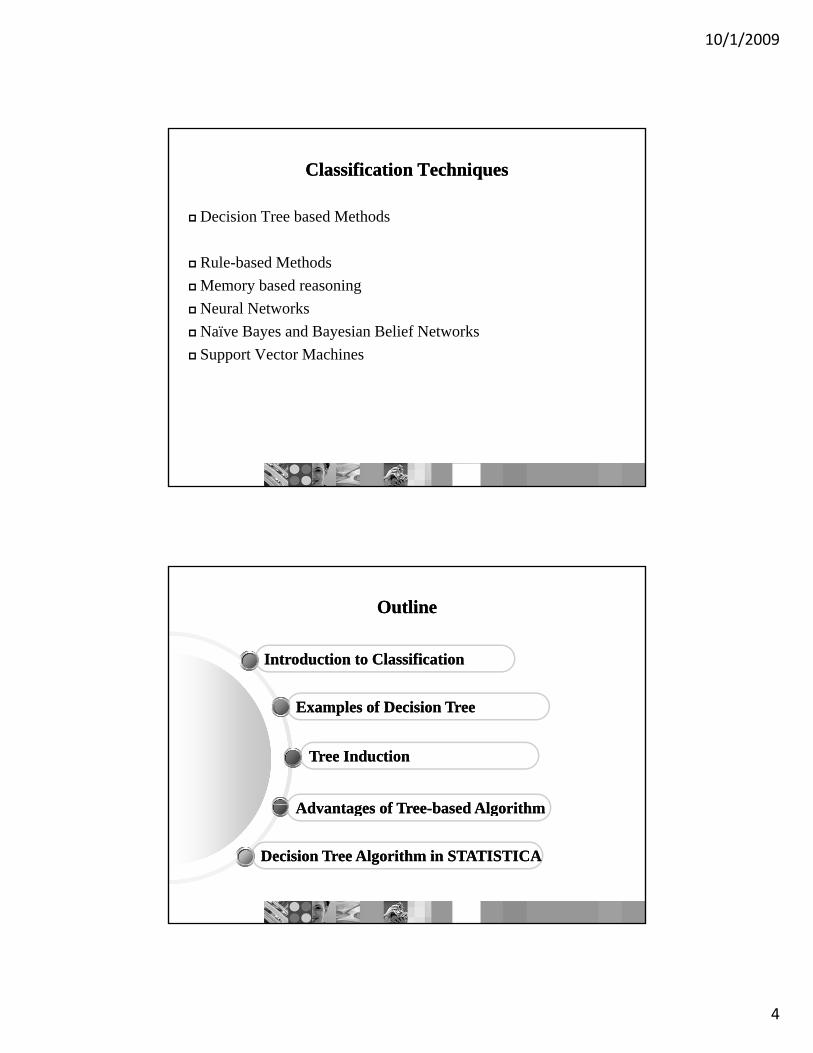
How to determine the Best SplitHow to determine the Best Split
Before Splitting: 10 records of class 0,10 records of class 1
Which test condition is the best?
10/1/2009
15
How to determine the Best SplitHow to determine the Best Split
Greedy approach:
– Nodes with homogeneous class distribution are preferredg p
Need a measure of node impurity:
Non-homogeneous,
High degree of impurity
Homogeneous,
Low degree of impurity
Measures of Node ImpurityMeasures of Node Impurity
Gini Index
Entropy
Misclassification error

10/1/2009
16
Splitting Splitting Criteria based on INFOCriteria based on INFO
Entropy at a given node t:
j
tjptjptEntropy )|(log)|()(
(NOTE: p( j | t) is the relative frequency of class j at node t).
– Measures homogeneity of a node.
Maximum (log nc) when records are equally distributed among all classes
implying least information
Minimum (0.0) when all records belong to one class, implying most
i f ti
j
information
– Entropy based computations are similar to the GINI index
computations
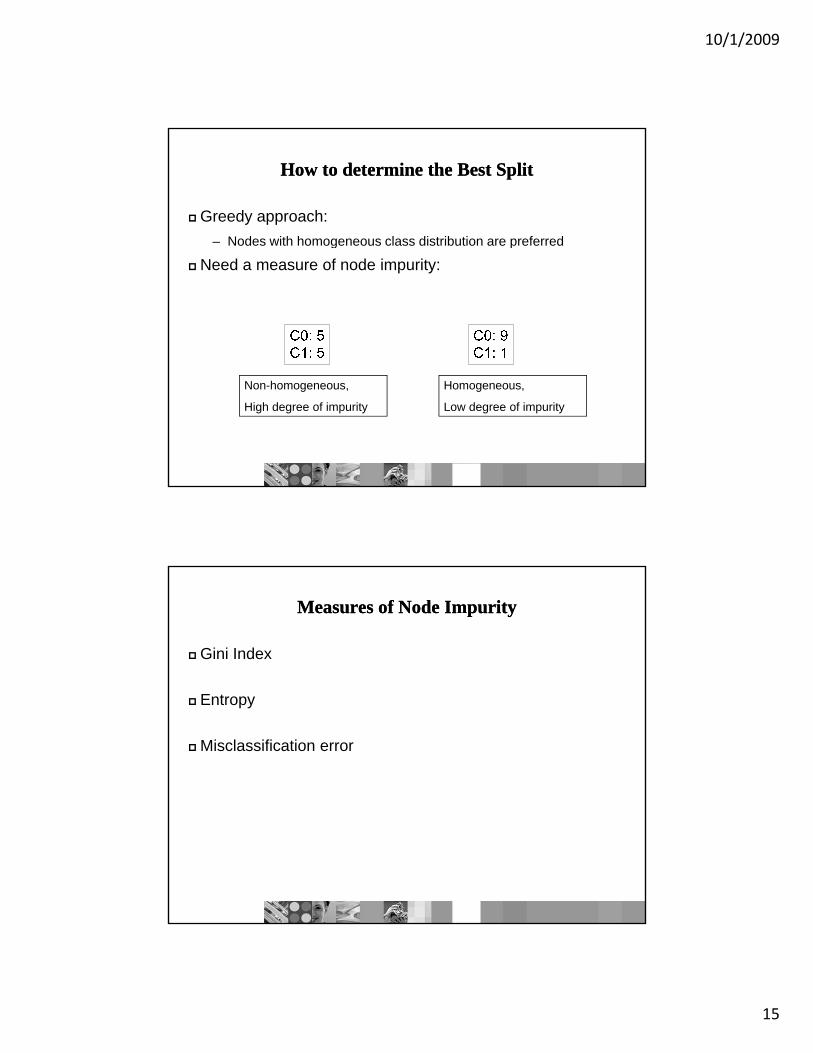
Examples for Examples for Computing Computing EntropyEntropy
j
tjptjptEntropy )|(log)|()(2
C1 0 C2 6
C1 1 C2 5
C1 2 C2 4
10/1/2009
17
Examples for Examples for Computing Computing EntropyEntropy
j
tjptjptEntropy )|(log)|()(2
C1 0 C2 6
C1 1 C2 5
P(C1) = 0/6 = 0 P(C2) = 6/6 = 1
Entropy = – 0 log 0 – 1 log 1 = – 0 – 0 = 0
P(C1) = 1/6 P(C2) = 5/6
Entropy = – (1/6) log2 (1/6) – (5/6) log2 (1/6) = 0.65
C1 2 C2 4
P(C1) = 2/6 P(C2) = 4/6
Entropy = – (2/6) log2 (2/6) – (4/6) log2 (4/6) = 0.92
Splitting Based on INFO...Splitting Based on INFO...
Information Gain:
ki
litiEntropy
npEntropyGAIN )()(
Parent Node, p is split into k partitions;
ni is number of records in partition i
– Measures Reduction in Entropy achieved because of
the split. Choose the split that achieves most reduction
( G )
isplit
pyn
ppy1
)()(
(maximizes GAIN)
– Disadvantage: Tends to prefer splits that result in large
number of partitions, each being small but pure.

10/1/2009
18
Splitting Based on INFO...Splitting Based on INFO...
Gain Ratio:
GAINGainRATIO Split
kii
nnSplitINFO log
Parent Node, p is split into k partitionsni is the number of records in partition i
– Adjusts Information Gain by the entropy of the partitioning (SplitINFO) Higher entropy partitioning
SplitINFOGainRATIO
split
i nnSplitINFO
1log
partitioning (SplitINFO). Higher entropy partitioning (large number of small partitions) is penalized!
– Designed to overcome the disadvantage of Information Gain
Splitting Criteria based on Classification ErrorSplitting Criteria based on Classification Error
Classification error at a node t :
)|(1)( iPE
Measures misclassification error made by a node.
Maximum (1 - 1/nc) when records are equally distributed among
all classes, implying least interesting information
)|(max1)( tiPtErrori
Minimum (0.0) when all records belong to one class, implying
most interesting information

10/1/2009
19
Examples for Computing ErrorExamples for Computing Error
)|(max1)( tiPtErrori
C1 0 C2 6
C1 1 C2 5
C1 2 C2 4
Examples for Computing ErrorExamples for Computing Error
)|(max1)( tiPtErrori
C1 0 C2 6
C1 1 C2 5
P(C1) = 0/6 = 0 P(C2) = 6/6 = 1
Error = 1 – max (0, 1) = 1 – 1 = 0
P(C1) = 1/6 P(C2) = 5/6
Error = 1 – max (1/6, 5/6) = 1 – 5/6 = 1/6
C1 2 C2 4
P(C1) = 2/6 P(C2) = 4/6
Error = 1 – max (2/6, 4/6) = 1 – 4/6 = 1/3

10/1/2009
20
Tree InductionTree Induction
Greedy strategy.
– Split the records based on an attribute test that optimizes certain p p
criterion.
Issues
– Determine how to split the records
How to specify the attribute test condition?
How to determine the best split?
– Determine when to stop splitting
Stopping Criteria for Tree InductionStopping Criteria for Tree Induction
Stop expanding a node when all the records belong to the
same class
Stop expanding a node when all the records have similar
attribute values
Early termination (to be discussed later)

10/1/2009
21
OutlineOutline
Introduction to ClassificationIntroduction to Classification
Ad t f TAd t f T b d Al ithb d Al ith
Decision Tree InductionDecision Tree Induction
Examples of Decision TreeExamples of Decision Tree
Advantages of TreeAdvantages of Tree--based Algorithmbased Algorithm
Decision Tree Algorithm in STATISTICADecision Tree Algorithm in STATISTICA
Decision Tree Based ClassificationDecision Tree Based Classification
Advantages:
– Inexpensive to constructp
– Extremely fast at classifying unknown records
– Easy to interpret for small-sized trees
– Accuracy is comparable to other classification techniques for many
simple data sets
10/1/2009
22
OutlineOutline
Introduction to ClassificationIntroduction to Classification
Ad t f TAd t f T b d Al ithb d Al ith
Decision Tree InductionDecision Tree Induction
Examples of Decision TreeExamples of Decision Tree
Advantages of TreeAdvantages of Tree--based Algorithmbased Algorithm
Decision Tree Algorithm in STATISTICADecision Tree Algorithm in STATISTICA
Thank You


![Red-Black Tree Algorithm : Design & Analysis [12]](https://img.dokumen.tips/doc/110x75/56649ef45503460f94c08106/red-black-tree-algorithm-design-analysis-12.jpg)