Embed Size (px)
Citation preview
March 16, 2015
Initiating Coverage
ICICI Securities Ltd | Retail Equity Research
Decent play among southern PSBs… Indian Bank is well placed among southern PSU banks to revive at a more rapid pace given its relative strength with strong low cost deposit (29.7%), ability to generate higher NIMs (2.47%), healthy capital base (13.1%) and better asset quality as on Dec’14. We forecast Indian Bank to grow its balance sheet at 12% CAGR in FY14-17E. With moderate incremental slippages, asset quality concern may recede from H2FY16E, thereby improving its RoE to 10.5% (conservative growth assumptions) in FY17E from a trough of 9.0% in FY14. We initiate coverage on Indian Bank with a BUY rating and a target price of | 221 (0.9x FY17E ABV).
Adequately capitalised; no risk of substantial dilution in near term Amid deteriorating asset quality, Indian Bank remains adequately capitalised with its capital adequacy ratio (CAR) at 13.06% (Tier I – 10.56%) as of December 2014 vs. banks now trailing with <8% Tier I. On ploughing back 9MFY15 profits, CAR was at 13.8% inducing confidence in Indian Bank’s ability to shore up balance sheet, going ahead. Capital infusion of | 280 crore by GoI in FY15 will strengthen CAR by 16-18 bps ruling out substantial dilution in near term. In addition, a higher GoI stake (81.5% as of December 2014) gives the bank an opportunity to strengthen capital ratios through additional capital raising activity.
Asset quality concerns to recede from H2FY16E, B/S to grow at 12% CAGR With relatively lower exposure to stressed sectors (22% of total advances) and higher exposure to SEBs, which have been largely restructured, Indian Bank is well placed compared to peers. The management expects slippages to continue with its run rate in Q4FY15 and H1FY16 on the back of a gradual revival in economy. It is expected to improve from H2FY16E onwards. As a result, we expect asset quality concerns to recede in FY17E, after touching 4.6% in FY16E (vs. 3.7% in FY14 and 4.5% in Q3FY15). Higher provision cover (57.1% in Q3FY15) and superior CAR at 13.8% reduces our balance sheet concern. We expect the same to grow at 12% CAGR to | 265053 crore over FY14-17E.
Valuations to stay at premium vs. comparable peers; initiate with BUY
At the CMP of | 174, Indian Bank is trading at 0.7x FY17E ABV of | 245. Considering it is relatively better on NPA pressures, stronger capital position compared to peers (see Exhibit 39), aiding faster recovery, we expect Indian Bank to trade at a premium compared to peers. We have assumed two valuation approaches, two stage model and relative P/ABV. Hence, we initiate coverage on Indian Bank with a BUY rating, valuing at 0.9x FY17E ABV leading to a target price of | 221, with an upside of 27%.
Exhibit 1: Valuation Metrics (Year-end March) FY13 FY14 FY15E FY16E FY17E
Net Interest Income (| crore) 4,529.1 4,360.4 4,569.7 5,228.3 6,202.2 Pre Provisioning Profit (| crore) 3,061.3 2,900.6 2,976.5 3,372.3 4,000.3
Net Profit (| crore) 1,581.1 1,159.0 1,086.9 1,289.8 1,728.8
EPS (|) 36.8 24.9 22.6 26.9 36.0 Growth (%) (0.1) (32.2) (9.2) 18.7 34.0 P/E (x) 21.9 7.0 7.7 6.5 4.9 Price / Adj Book (x) 0.83 0.77 0.81 0.78 0.71 GNPA (| crore) 3,565.5 4,562.2 6,047.0 7,122.9 7,924.7 NNPA (| crore) 2,384.3 2,384.3 2,384.3 2,384.3 2,384.3 RoA (%) 1.0 0.7 0.6 0.6 0.7 RoE (%) 13.9 9.0 7.6 8.4 10.5
Source: Company, ICICIdirect.com Research
Indian Bank (INDIBA) | 174 Rating Matrix
Rating : BuyTarget : | 221Target Period : 12 monthsPotential Upside : 27%
Key Variables | Crore FY14 FY15E FY16E FY17ENII 4360 4570 5228 6202PPP 2901 2977 3372 4000PAT 1159 1087 1290 1729
Valuation Summary (YoY Growth) FY14 FY15E FY16E FY17EP/E 7.0 7.7 6.5 4.9 Target P/E 8.9 9.8 8.2 6.1 P/ABV 0.8 0.8 0.8 0.7 Target P/ABV 1.0 1.0 1.0 0.9 RoA 0.7 0.6 0.6 0.7 RoE 9.0 7.6 8.4 10.5
Stock Data Particulars Amount
Market Capitalisation | 7458 crore GNPA (Q3FY15) 4.5%NNPA (Q3FY15) 2.7%NIM % (Q3FY15) 2.5 52 week H/L 224.2/101.8 Equity capital | 465 Crore Face value | 10 DII Holding (%) 8.6 FII Holding (%) 6.0
Price movement
05000100001500020000250003000035000
04080
120160200240280
Jan-
12
May
-12
Sep-
12
Jan-
13
May
-13
Sep-
13
Jan-
14
May
-14
Sep-
14
Jan-
15
Indian Bank (LHS) BSE Sensex
Research Analyst Kajal Gandhi [email protected] Vishal Narnolia [email protected]
Vasant Lohiya [email protected]
Page 2ICICI Securities Ltd | Retail Equity Research
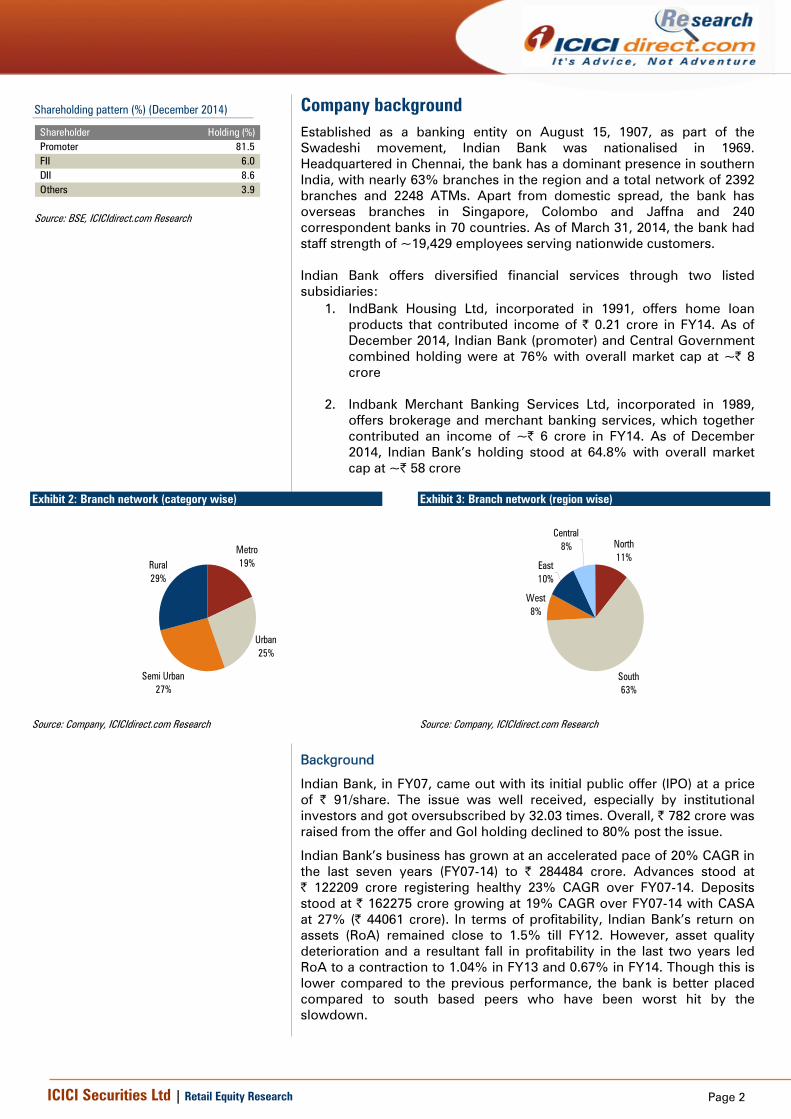
Company background Established as a banking entity on August 15, 1907, as part of the Swadeshi movement, Indian Bank was nationalised in 1969. Headquartered in Chennai, the bank has a dominant presence in southern India, with nearly 63% branches in the region and a total network of 2392 branches and 2248 ATMs. Apart from domestic spread, the bank has overseas branches in Singapore, Colombo and Jaffna and 240 correspondent banks in 70 countries. As of March 31, 2014, the bank had staff strength of ~19,429 employees serving nationwide customers. Indian Bank offers diversified financial services through two listed subsidiaries:
1. IndBank Housing Ltd, incorporated in 1991, offers home loan products that contributed income of | 0.21 crore in FY14. As of December 2014, Indian Bank (promoter) and Central Government combined holding were at 76% with overall market cap at ~| 8 crore
2. Indbank Merchant Banking Services Ltd, incorporated in 1989,
offers brokerage and merchant banking services, which together contributed an income of ~| 6 crore in FY14. As of December 2014, Indian Bank’s holding stood at 64.8% with overall market cap at ~| 58 crore
Exhibit 2: Branch network (category wise)
Rural29%
Semi Urban27%
Urban25%
Metro19%
Source: Company, ICICIdirect.com Research
Exhibit 3: Branch network (region wise)
Central8%
East10%
West8%
South63%
North11%
Source: Company, ICICIdirect.com Research
Background
Indian Bank, in FY07, came out with its initial public offer (IPO) at a price of | 91/share. The issue was well received, especially by institutional investors and got oversubscribed by 32.03 times. Overall, | 782 crore was raised from the offer and GoI holding declined to 80% post the issue.
Indian Bank’s business has grown at an accelerated pace of 20% CAGR in the last seven years (FY07-14) to | 284484 crore. Advances stood at | 122209 crore registering healthy 23% CAGR over FY07-14. Deposits stood at | 162275 crore growing at 19% CAGR over FY07-14 with CASA at 27% (| 44061 crore). In terms of profitability, Indian Bank’s return on assets (RoA) remained close to 1.5% till FY12. However, asset quality deterioration and a resultant fall in profitability in the last two years led RoA to a contraction to 1.04% in FY13 and 0.67% in FY14. Though this is lower compared to the previous performance, the bank is better placed compared to south based peers who have been worst hit by the slowdown.
Shareholding pattern (%) (December 2014)
Shareholder Holding (%)Promoter 81.5 FII 6.0 DII 8.6 Others 3.9
Source: BSE, ICICIdirect.com Research
Page 3ICICI Securities Ltd | Retail Equity Research
In the past….
After conducting its business satisfactorily for a prolonged period, Indian Bank had its own share of bad times in the past experiencing financial setbacks in the 1990s. Owing to relentless lending, exposure to risky sectors rose. This eventually led to an increase in NPA to alarming levels pushing the bottomline to the red mark. A restructuring plan was formulated and submitted in June 2000, seeking recapitalisation from GoI to improve the bank’s financial strength as well as comply with prudential income recognition norms. Implementation of the plan comprised initiatives on various counts bringing in structural and operational changes including elimination of a tier in the banking structure, branch rationalisation, introduction of VRS, technology upgradation, etc.
Post implementation of the restructuring plan, the bank reported a net profit each year from FY03 onwards. By FY07, the bank managed to recover its accumulated losses. The PAT registered 11% CAGR in the last 10 years (FY04-14).
Key Personnel
TM Bhasin, Chairman & Managing Director assumed charge on April 1, 2010. His five year term is set to expire in March 2015. He has done his MBA (Finance) from University of Delhi and is a Harvard alumnus having done an Advanced Management Programme at JFK School of Government, Harvard. He is also an LLB. from Campus Law Centre, University of Delhi and holds a Master's Degree in Science. Prior to this assignment, he was Executive Director, United Bank of India (UBI) since November 7, 2007. He has overall 37 years of experience in the banking industry and started his journey as a probationary officer in June 1978 with Oriental Bank of Commerce. He served the bank for over three decades in various capacities. He is also associated with various boards and governing bodies of reputed organisations such as;
Chairman, Indian Bank’s Association (IBA) Chairperson, SWIFT - India Director on the board of United India Insurance Co Ltd Vice President, Governing Council, IIBF Chairman of the Governing Board of the Institute of Banking
Personnel Selection (IBPS)
B Raj Kumar, Executive Director took charge on January 1, 2012. A postgraduate in engineering with an MBA and CAIIB, B Raj Kumar began his career with Andhra Bank in December, 1978 and has more than 36 years of experience serving the banking industry. Prior to Indian Bank, he was heading the integrated treasury of Andhra Bank as General Manager, thereby acquiring expertise in the field of investments and international banking.
Mahesh Kumar Jain, assumed charge as Executive Director of Indian Bank on September 27, 2013. With academic credits including MCom, MBA, CAIIB, CFA and FRM, he worked as General Manager in Syndicate Bank, handling important portfolios comprising credit, operations, investments, risk management, etc.
Page 4ICICI Securities Ltd | Retail Equity Research
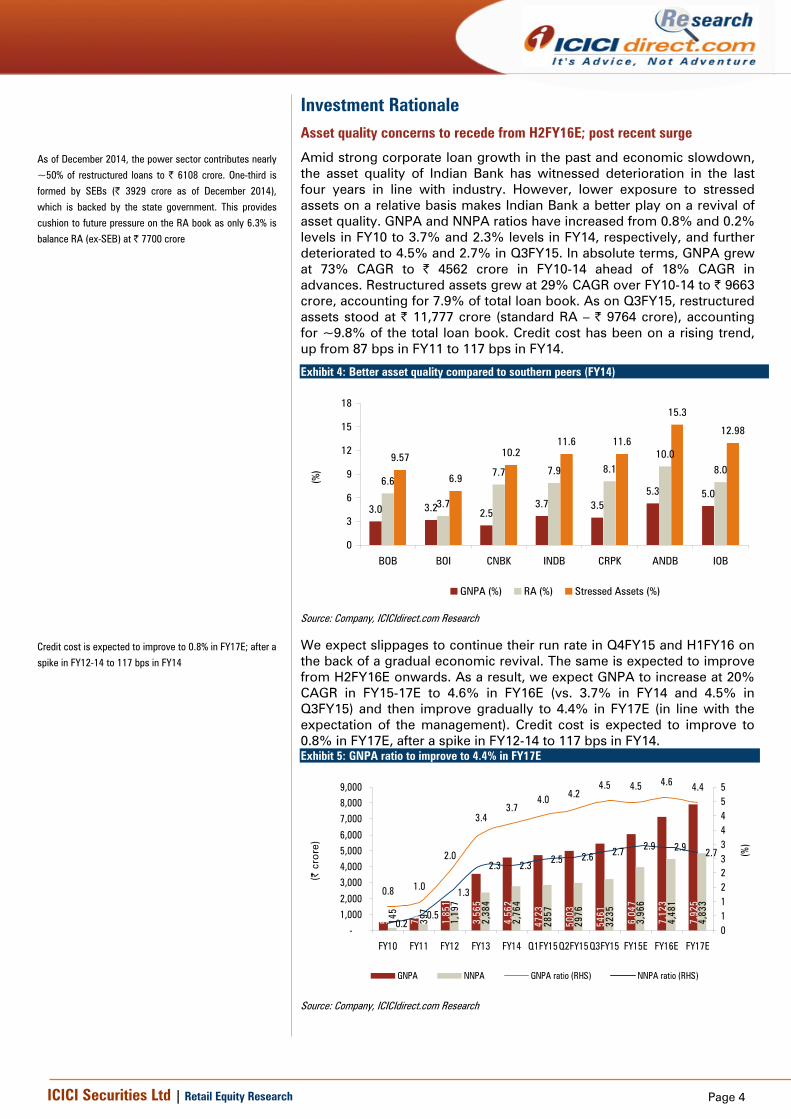
Investment Rationale Asset quality concerns to recede from H2FY16E; post recent surge
Amid strong corporate loan growth in the past and economic slowdown, the asset quality of Indian Bank has witnessed deterioration in the last four years in line with industry. However, lower exposure to stressed assets on a relative basis makes Indian Bank a better play on a revival of asset quality. GNPA and NNPA ratios have increased from 0.8% and 0.2% levels in FY10 to 3.7% and 2.3% levels in FY14, respectively, and further deteriorated to 4.5% and 2.7% in Q3FY15. In absolute terms, GNPA grew at 73% CAGR to | 4562 crore in FY10-14 ahead of 18% CAGR in advances. Restructured assets grew at 29% CAGR over FY10-14 to | 9663 crore, accounting for 7.9% of total loan book. As on Q3FY15, restructured assets stood at | 11,777 crore (standard RA – | 9764 crore), accounting for ~9.8% of the total loan book. Credit cost has been on a rising trend, up from 87 bps in FY11 to 117 bps in FY14.
Exhibit 4: Better asset quality compared to southern peers (FY14)
3.0 3.2 2.53.7 3.5
5.3 5.06.6
3.7
7.7 7.9 8.110.0
8.09.57
6.9
10.211.6 11.6
15.3
12.98
0
3
6
9
12
15
18
BOB BOI CNBK INDB CRPK ANDB IOB
(%)
GNPA (%) RA (%) Stressed Assets (%)
Source: Company, ICICIdirect.com Research
We expect slippages to continue their run rate in Q4FY15 and H1FY16 on the back of a gradual economic revival. The same is expected to improve from H2FY16E onwards. As a result, we expect GNPA to increase at 20% CAGR in FY15-17E to 4.6% in FY16E (vs. 3.7% in FY14 and 4.5% in Q3FY15) and then improve gradually to 4.4% in FY17E (in line with the expectation of the management). Credit cost is expected to improve to 0.8% in FY17E, after a spike in FY12-14 to 117 bps in FY14. Exhibit 5: GNPA ratio to improve to 4.4% in FY17E
510
740
1,85
1
3,56
5
4,56
2
4723
5003
5461
6,04
7
7,12
3
7,92
5
145
397
1,19
7
2,38
4
2,76
4
2857
2976
3235
3,96
6
4,48
1
4,83
3
0.8 1.0
2.0
3.43.7
4.0 4.24.5 4.5 4.6 4.4
0.20.5
1.3
2.3 2.3 2.5 2.6 2.7 2.9 2.9 2.7
-
1,000
2,000
3,000
4,000
5,000
6,000
7,000
8,000
9,000
FY10 FY11 FY12 FY13 FY14 Q1FY15Q2FY15Q3FY15 FY15E FY16E FY17E
(| c
rore
)
01122334455
(%)
GNPA NNPA GNPA ratio (RHS) NNPA ratio (RHS)
Source: Company, ICICIdirect.com Research
As of December 2014, the power sector contributes nearly
~50% of restructured loans to | 6108 crore. One-third is
formed by SEBs (| 3929 crore as of December 2014),
which is backed by the state government. This provides
cushion to future pressure on the RA book as only 6.3% is
balance RA (ex-SEB) at | 7700 crore
Credit cost is expected to improve to 0.8% in FY17E; after a
spike in FY12-14 to 117 bps in FY14

Page 5ICICI Securities Ltd | Retail Equity Research
Corporate, MSME book – worst hit in slowdown
Indian Bank’s loan portfolio is dominated by corporate loans, which grew at 19.6% CAGR over FY10-14 to | 64639 crore, resulting in an increase in its contribution to 52% in FY14 from 50% in FY10. However, owing to the economic slowdown, this segment has been the worst hit with NPA at | 2955 crore, accounting for 65% of total NPA (4.6% of segment exposure) as of March 2014. NPA in MSME stood at | 887 crore (19.5% of total NPA) in FY14; 5.5% of total segment exposure as of March 2014.
Exhibit 6: Category-wise exposure and NPA (FY14)
| crore Exposure Share in advance NPA Share in NPA as a% of Exposure
Agriculture 19047 15.3% 352 7.7% 1.8%
Corporate 64639 52.0% 2955 64.8% 4.6%
Retail 17068 13.7% 369 8.1% 2.2%
MSME 16104 12.9% 887 19.5% 5.5%
Overseas 7500 6.0%
Total 124358 4562 3.7%
Source: Company, ICICIdirect.com Research
Infrastructure, iron & steel, textile and engineering have been the worst hit sectors accounting for 24.5% of the total loan book at | 29304 crore as of March 2014. These sectors accounted for 42.9% of total NPA at | 1956 crore in FY14. The infrastructure sector witnessed lowest slippages compared to its segmental exposure at | 611 crore (3.0% of segment) in FY14. However, it accounted for 13.4% of total NPA due to high proportion of total loans. The iron & steel sector contributed highest proportion to NPA at | 809 crore (17.7% of total NPA) as of March 2014, accounting for 20.2% of segment exposure. These higher delinquencies resulted in provision rising at 38% CAGR to | 1425 crore over FY10-14 while provisions on NPL moved to | 1147 crore (30% CAGR in FY10-14).
Exhibit 7: Stressed sector exposure and NPA (FY14)
| crore Exposure % of Total Exposure NPA % of total NPA
Power (incl SEB) 12663 10.2 299 6.6%
Iron & Steel 3995 3.2 809 17.7%
Textile 3939 3.2 181 4.0%
Enginering 1949 1.6 355 7.8%
Infra (incl power) 19422 15.6 611 13.4%
Total 29304 23.6 1956 42.9% Source: Company, ICICIdirect.com Research
Despite exposure to stressed sectors, Indian Bank is well placed with lower exposure to the power and iron & steel sectors when compared to peers (see exhibit below). Iron & steel exposure stood at | 3995 crore in FY14, comprising 3.2% of total loans, which is lower compared to other south based peers. In the power sector, state owned entities (SOEs) including Tamil Nadu, Rajasthan, Andhra Pradesh, Punjab, Gujarat and Karnataka SEBs, comprise ~50% of advances to the power sector, at | 6712 crore as of March 2014 (5.5% of total loans); backed by state government guarantee.
The corporate segment NPA stood at | 2955 crore in FY14;
accounting for ~65% of total NPA
The infrastructure, iron & steel, textile and engineering
sector’s exposure accounted for 24% in industry and 28%
for PSU banks as of June 2014
SoEs including Tamil Nadu, Rajasthan, Andhra Pradesh,
Punjab, Gujarat and Karnataka SEBs, comprise ~50% of
advances to the power sector, at | 6721 crore as of March
2014

Page 6ICICI Securities Ltd | Retail Equity Research
Exhibit 8: Lower power exposure compared to southern peers (FY14)
4.7
7.2
12.7
10.211.2
8.28.7
0
2
4
6
8
10
12
14
BOB
BOI
CNBK
I NDB
C RPK
A ND B IO
B
(%)
Source: Company, ICICIdirect.com Research
Exhibit 9: Relatively higher exposure to SEB
1.4
3.1
7.6
5.5
2.9
4.3 4.3
0
2
4
6
8
10
BOB
BOI
CNBK
INDB
CRPK
ANDB IO
B
(%)
Source: Company, ICICIdirect.com Research
As of December 2014, the power sector contributes nearly ~50% of restructured loans to | 6108 crore. One third is formed by SEB (| 3929 crore as of December 2014), which is backed by the state government. Hence, a higher exposure to SEBs on a relative basis leads to better safety as with a substantial proportion of SEB exposure being restructured, a chunky slippage in RA can be ruled out. Going ahead, the bank has maintained a relatively high provision cover of 57.1% and superior CAR at 13.8% as of December 2014, in order to adequately handle any shock on the asset quality.
Retail loans – higher secured portfolio saves quality
Retail loans, which accounted for nearly 14% of total advances have been manageable in terms of slippages owing to (1) higher proportion of housing loans, which account for ~45% of the retail book and ~6.2% of the total loan book as on FY14; (2) unsecured retail loans such as personal loans form a very small proportion (~3.4%) of the total loans.
On asset quality, retail loans remain relatively strong with 8.1% contribution in NPA on an exposure of | 17068 crore, 13.7% of loans. Education loans remain an area of concern, though smaller in proportion, due to high NPA at ~| 300 crore on an exposure of | 3443 crore (10% of segment exposure). Going forward, we expect the bank to focus on secured lending. Hence, the retail book will be a major driver of the loan book and factor in 14.7% CAGR over FY14-17E to | 25729 crore. Within retail loans, home finance will remain in focus while a traction in education loans, which has witnessed higher delinquencies, will remain slow, ruling out any drastic deterioration in the asset quality.
Retail loans remain relatively strong with 8.1% contribution
in NPA on an exposure of | 17068 crore; forming 13.7% of
loans

Page 7ICICI Securities Ltd | Retail Equity Research
Rising presence improved efficiency to lead to deposit growth
The deposit base of Indian Bank witnessed a traction of 16% CAGR over FY10-14 to | 162275 crore; higher than industry growth of 15.1% during the same period. Current account savings account (CASA) grew at 11.6% CAGR in FY10-14 to | 44061 crore, lower compared to deposit accretion during the same period. We expect the deposit base to increase at 13% CAGR over FY15-17E to | 236103 crore considering the improving efficiency on deposit mobilisation and branch addition. We have built in a CASA CAGR of 13% over FY15-17E to | 63431 crore and expect the CASA ratio to remain stable at 27%. Exhibit 10: Deposit base to expand at 13% CAGR in FY15-17E
7258288228
105804120804
141980162275
179809204541
23610318.9
21.619.9
14.2
17.5
14.3
10.8
13.815.4
40000
90000
140000
190000
240000
290000
FY09 FY10 FY11 FY12 FY13 FY14 FY15E FY16E FY17E
(| c
rore
)
0
5
10
15
20
25
(%)
Deposits Deposits Growth (YoY) (RHS)
Source: Company, ICICIdirect.com Research
The traction in deposit can be attributed to expansion of branch network, high savings and improvement in deposit mobilisation. Indian Bank’s branch network increased to 2253 branches in FY14 from 1758 in FY10, which is further likely to touch 2450 by March 2015 (2392 in Q3FY15). We expect the bank to maintain its branch addition run rate (150-200 branches per annum) and reach a network of ~2800 branches by FY17E. Deposit per branch witnessed 9.5% CAGR over FY10-14 to | 72 crore per branch (| 50 crore per branch in FY10), as more branches attain maturity. We expect the deposit mobilisation per branch to grow at 5.4% CAGR over FY15-17E to reach | 84 crore per branch in FY17E. Exhibit 11: Deposit growth led by branch addition, improved deposit mobilisation
1758 1863 19582092
22532442
26222802
50.2
56.861.7
67.972.0 73.6
78.084.3
0
500
1000
1500
2000
2500
3000
FY10 FY11 FY12 FY13 FY14 FY15E FY16E FY17E
(No.
)
30
40
50
60
70
80
90
(| c
rore
)
Branches (LHS) Deposit/ branch
Source: Company, ICICIdirect.com Research
The deposit base is expected to increase at 13% CAGR
over FY15-17E to | 236103 crore, considering improving
efficiency on deposit mobilisation and branch addition

Page 8ICICI Securities Ltd | Retail Equity Research
Traction in saving deposit to contribute to CASA
In the past four years, absolute CASA deposits have increased at 11.6% CAGR over FY10-14 to | 44061 crore, mainly led by SA deposits, which witnessed a CAGR of 14.1% to | 36901 crore. During the same period, CA deposits remained muted growing at CAGR of 2% to | 7160 crore. Consequently, the CASA ratio declined to 27.2% in FY14 from 32.2% in FY10. Lower traction of CASA compared to deposit growth (17% CAGR in FY10-14), can be attributed to elevated inflation coupled with higher interest rates offered on term deposits. This led to a shift of savings towards term deposits growing at 18.6% CAGR in FY10-14 to | 118214 crore. In addition, slower corporate growth impacted growth in CA balance during the same period. Exhibit 12: CASA traction led by SA
12.414.1
15.3 15.5 16.4 16.918.1
19.7
3.8 3.5 3.6 3.3 3.2 3.1 3.0 3.0
0
5
10
15
20
25
FY10 FY11 FY12 FY13 FY14 FY15E FY16E FY17E
(| c
rore
)
SA/ Branch CA/ Branch
Source: Company, ICICIdirect.com Research
Despite challenges, the CASA/branch and SA/branch have improved consistently. As on FY14, they stood at | 19.6 crore (4.9% CAGR over FY10-14) and | 16.4 crore (7.2% CAGR over FY10-14), respectively. Though the CASA/branch is well placed compared to south based peers, it remains below larger banking peers like Canara Bank, Bank of Baroda, Bank of India, etc. Hence, there is large scope for improvement. We expect the CASA/branch to improve at 5% CAGR over FY15-17E to | 22.6 crore on the back of traction in SA/branch at a CAGR of 6.3% to | 19.7 crore in FY17E. Consequently, we expect SA balances to grow faster at 14.3% CAGR to | 55133 crore compared to 5% growth expected in CA balances to | 8298 crore over FY14-17E.
With higher branch addition (~2800 in FY17E vs. 2253 in FY14) and improving efficiency in CASA mobilisation (5% CAGR in FY14-17E), we expect low cost deposit growth to follow deposit trajectory thereby increasing at 13% CAGR to | 63431 crore in FY17E. Hence, the CASA ratio is expected to remain stable near 27% in FY15-17E.
Exhibit 13: CASA ratio to remain stable in FY15-17E
1758 1863 1958 2092 22532442
26222802
0
500
1000
1500
2000
2500
3000
FY10 FY11 FY12 FY13 FY14 FY15E FY16E FY17E
(| c
rore
)
24
27
30
33
(%)
Branches (LHS) CASA (%)
Source: Company, ICICIdirect.com Research
Exhibit 14: CASA per branch to continue to improve
1758 1863 1958 2092 22532442
26222802
16.217.6
18.8 18.7 19.6 20.021.1
22.6
0
500
1000
1500
2000
2500
3000
FY10 FY11 FY12 FY13 FY14 FY15E FY16E FY17E
(| c
rore
)
10
15
20
25
(| c
rore
)
Branches (LHS) CASA/ branch
Source: Company, ICICIdirect.com Research
Higher CASA ratio compared to southern peers (FY14) %
31.822.1 24.5 27.1
20.324.8 25.3
010203040
BOB
BOI
CNBK
INDB
CRPK
ANDB IO
B
Source: Company, ICICIdirect.com, Research
Higher CASA/branch compared to southern peers (Q3FY15) %
29.723.6 21.7 19.6 19.5 16.6 17.7
0
10
20
30
40
BOB
BOI
CNBK
INDB
CRPK
ANDB IO
B
Source: Company, ICICIdirect.com, Research

Page 9ICICI Securities Ltd | Retail Equity Research
Advances growth to moderate compared to past trend; still remains healthy
The total credit book as on FY14 stood at | 122209 crore. The credit traction has been strong at 19% CAGR in the past four years. This is way ahead of the industry, which grew at 17.4% CAGR. We believe a well diversified composition of the loan book has arisen from a rapid expansion (2253 branches in FY14 vs. 1758 in FY10) of the branch network. This is a major reason that has enabled Indian Bank to clock such strong growth in a challenging economic environment. We have built in a healthy 13% CAGR in advances to | 178191 crore in FY15-17E.
Exhibit 15: Loan book growth moderating, to pickup in FY17
5139762146
7525090324
105643122209
134982
153696
17819129.0
20.9 21.1 20.017.0
10.513.9
15.915.7
40000
60000
80000
100000
120000
140000
160000
180000
200000
FY09 FY10 FY11 FY12 FY13 FY14 FY15E FY16E FY17E
(| c
rore
)
0
5
10
15
20
25
30
35
(%)
Advances Growth (YoY) (RHS)
Source: Company, ICICIdirect.com Research
SME, retail segments to drive growth in advance
Indian Bank’s loan portfolio is driven by well-diversified products, primarily divided into large corporate (52% of gross advances to | 64639 crore in FY14), MSME at | 16104 crore (13%), agriculture at | 19047 crore (15%) and retail at | 17068 crore (14%) segments. The overseas business contributes 6% of total advance at | 7500 crore in FY14.
Credit traction has been strong at 19% CAGR in the past
four years. This is way ahead of the industry, which grew
at 17.4% CAGR, moderating now
Loan portfolio break-up (FY14)
Agri15%
Corporate52%
Retail14%
MSME13%
Overseas6%
Source: Company, ICICIdirect.com, Research
Page 10ICICI Securities Ltd | Retail Equity Research
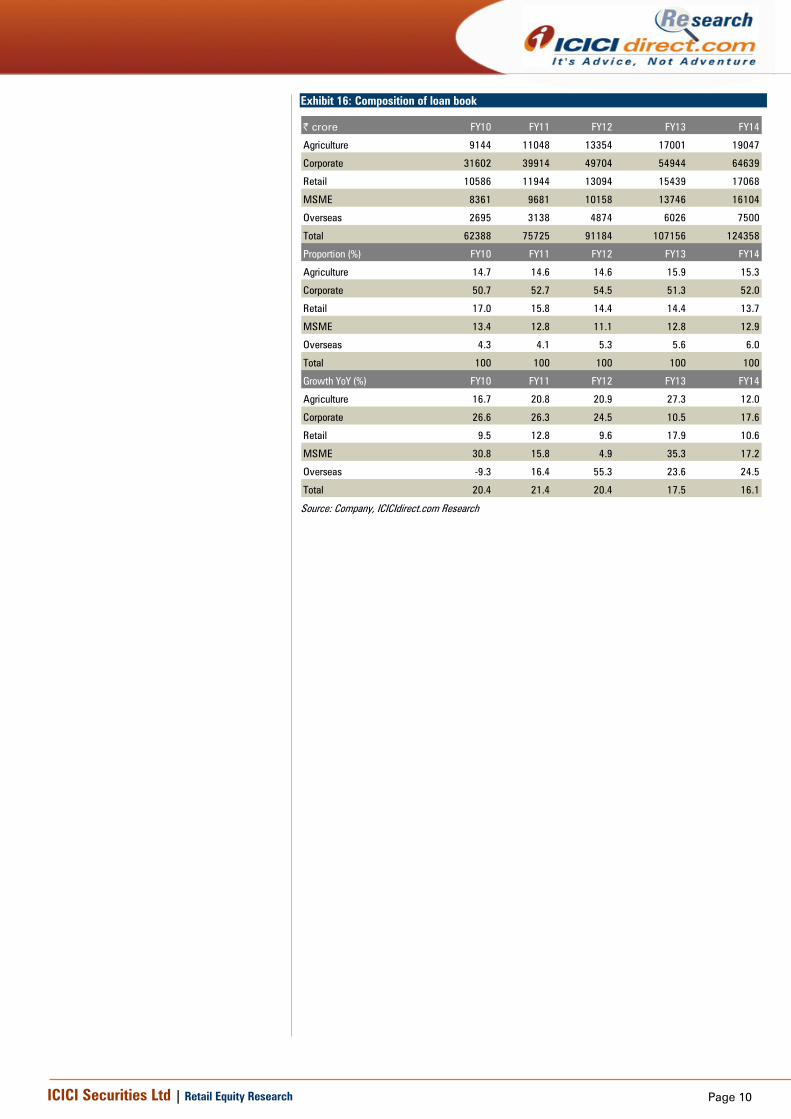
Exhibit 16: Composition of loan book
| crore FY10 FY11 FY12 FY13 FY14
Agriculture 9144 11048 13354 17001 19047
Corporate 31602 39914 49704 54944 64639
Retail 10586 11944 13094 15439 17068
MSME 8361 9681 10158 13746 16104
Overseas 2695 3138 4874 6026 7500
Total 62388 75725 91184 107156 124358
Proportion (%) FY10 FY11 FY12 FY13 FY14
Agriculture 14.7 14.6 14.6 15.9 15.3
Corporate 50.7 52.7 54.5 51.3 52.0
Retail 17.0 15.8 14.4 14.4 13.7
MSME 13.4 12.8 11.1 12.8 12.9
Overseas 4.3 4.1 5.3 5.6 6.0
Total 100 100 100 100 100
Growth YoY (%) FY10 FY11 FY12 FY13 FY14
Agriculture 16.7 20.8 20.9 27.3 12.0
Corporate 26.6 26.3 24.5 10.5 17.6
Retail 9.5 12.8 9.6 17.9 10.6
MSME 30.8 15.8 4.9 35.3 17.2
Overseas -9.3 16.4 55.3 23.6 24.5
Total 20.4 21.4 20.4 17.5 16.1
Source: Company, ICICIdirect.com Research

Page 11ICICI Securities Ltd | Retail Equity Research
Exhibit 17: Composition of retail loan book
| crore FY10 FY11 FY12 FY13 FY14
Home 5307 5508 5878 6696 7758
Auto 248 301 405 555 641
Personal 365 450 417 535 588
Education 2300 2807 3222 3449 3444
Jewel 1100 1161 1380 2123 2134
Others 1536 1717 1809 2082 2493
Total 10856 11944 13111 15439 17068
Proportion (%) FY10 FY11 FY12 FY13 FY14
Home 48.9 46.1 44.8 43.4 45.5
Auto 2.3 2.5 3.1 3.6 3.8
Personal 3.4 3.8 3.2 3.5 3.4
Education 21.2 23.5 24.6 22.3 20.2
Jewel 10.1 9.7 10.5 13.7 12.5
Others 14.1 14.4 13.8 13.5 14.6
Total 100.0 100.0 100.0 100.0 100.0
Growth YoY (%) FY10 FY11 FY12 FY13 FY14
Home 4.1 3.8 6.7 13.9 15.9
Auto 12.7 21.1 34.6 37.3 15.5
Personal -17.2 23.2 -7.3 28.1 10.1
Education 35.6 22.0 14.8 7.0 -0.1
Jewel 27.9 5.6 18.8 53.8 0.5
Others 13.8 11.8 5.3 15.1 19.8
Total 12.3 10.0 9.8 17.8 10.5
Source: Company, ICICIdirect.com Research
The size of the retail book as on FY14 stood at | 17068 crore (12.7% CAGR in FY10-14 vs. 18.8% CAGR in total loans) and accounted for 14% of the total loan book. This book is well diversified in terms of product offering but remains tilted towards home loans, which account for ~45% of the retail book and ~6.2% of total loan book as on FY14. Educational and gold loans follow in terms of contribution to the retail book forming 20.2% and 12.5% of the retail book. Unsecured retail loans such as personal loans form a very small proportion (~3-4%) of total loan book.
In the past four years, the home financing segment of Indian Bank witnessed slower growth at 9.9% CAGR to | 7759 crore, leading to a decline in proportion of the same to 45% in FY14 from 49% in FY10. Auto loans have been growing the fastest amid a lower base at 26.8% CAGR to | 642 crore in FY14. As can be seen in exhibits above, in the last four years, the gold loan category has been on a higher growth trajectory. It witnessed robust traction at 18% CAGR to | 2133 crore as on FY14 vs. 12.7% CAGR in case of retail book. Being south-based (South India accounted for nearly 50% of total education loans by SCBs), education loan, owing to state pressure, remained a focus area with a traction of 10.62% CAGR in FY10-14 to | 3444 crore. However, repayment concerns in education loans resulted in higher NPA (~8-10% of the segment exposure). This prompted the bank to cut down its pace on the same, going ahead. Consequently, we expect the education loans trajectory at 12.6% CAGR in FY15-17E, behind retail loan growth at 14.7% CAGR, thereby lowering its contribution by nearly 90 bps to 19% by FY17E.
Retail book to push overall loan book traction; factoring in
14.7% CAGR over FY15-17E to
| 25729 crore
Break-up of retail book (FY14)
Home45%
Auto4%Personal
3%
Education20%
Jewel13%
Others15%
Source: Company, ICICIdirect.com, Research
Page 12ICICI Securities Ltd | Retail Equity Research
Going forward, we expect the retail book to be a major driver of the overall loan book and factor in 14.7% CAGR over FY15-17E to | 25729 crore. Among segments, home loans will be the main driver and are expected to grow at 16.3% CAGR in FY15-17E to | 12204 crore, thereby increasing its contribution in retail book to 48% in FY17E vs. 45% in FY14.
Exhibit 18: Expected growth in retail book
| crore FY14 FY15E FY16E FY17E
Home 7758 9023 10539 12362
Auto 641 693 776 916
Personal 588 665 765 887
Education 3444 3823 4320 4925
Jewel 2134 2350 2819 3417
Others 2493 2733 2961 3222
Total 17060 19287 22180 25729
Proportion (%) FY14 FY15E FY16E FY17E
Home 45.5 46.8 47.5 48.0
Auto 3.8 3.6 3.5 3.6
Personal 3.4 3.4 3.4 3.4
Education 20.2 19.8 19.5 19.1
Jewel 12.5 12.2 12.7 13.3
Others 14.6 14.2 13.3 12.5
Total 100.0 100.0 100.0 100.0
Growth YoY (%) FY14 FY15E FY16E FY17E
Home 15.9 16.3 16.8 17.3
Auto 15.5 8.0 12.0 18.0
Personal 10.1 13.0 15.0 16.0
Education -0.1 11.0 13.0 14.0
Jewel 0.5 10.1 20.0 21.2
Others 19.8 9.6 8.3 8.8
Total 10.5 13.1 15.0 16.0 Source: Company, ICICIdirect.com Research
Corporate loan book growth sluggish, though on higher base
Indian Bank’s corporate book at | 64639 crore as on FY14; growing at 19.6% CAGR in FY10-14 constitutes 52% of the total loan book. On the back of higher focus on corporate lending, share of corporate loans increased to 52% in FY14 compared to 50% in FY10. This book is diversified among various sectors with infrastructure (15% of total loans) and NBFC (9.2% of total loans) being the major contributors as of FY14.
Going forward, the management plans to focus more on SME and retail segment as it is relatively healthy and has less asset quality risk than in term loans, especially in the current environment. Consequently, we expect the corporate book to post a CAGR of 12.6% over FY15-17E to | 92261 crore, thereby reducing its contribution to 50.7% in the total loan book vs. 52% in FY14.

Page 13ICICI Securities Ltd | Retail Equity Research
Exhibit 19: Corporate segment contribution to decline by FY17E
14.7 14.6 14.6 15.9 15.3 16.3 15.8 14.9
50.7 52.7 54.5 51.3 52.0 50.6 50.0 50.7
17.0 15.8 14.4 14.4 13.7 14.0 14.2 14.1
13.4 12.8 11.1 12.8 12.9 13.1 13.7 13.6
0102030405060708090
100
FY10 FY11 FY12 FY13 FY14 FY15E FY16E FY17E
(%)
Agriculture Corporate Retail MSME Overseas
Source: Company, ICICIdirect.com Research
Overall, we expect that with retail book traction at 14.7% CAGR and 12.6% CAGR in corporate book, total advances would increase at 13.4% CAGR to | 178191 crore over FY15-17E.
NIM on revival path; though pace may be slow…
Indian Bank witnessed margin erosion to 2.7% in FY14 vs. 3.6% in FY12, primarily owing to asset quality deterioration and decline in CASA. Further, NIM continued to trend southwards to 2.55% in Q3FY15. On a relative basis, Indian Bank is well placed with higher NIMs at 2.6% (as reported) in FY14 and 2.47% in Q3FY15, compared to peers (see exhibit 21 and 22). Going forward, we expect CASA to remain stable near 27% and slippages to remain moderate compared to the run rate witnessed in previous fiscals (23% CAGR over FY12-14). As a result, we expect the bank’s NIMs to improve to 2.6% in FY16E and 2.7% in FY17E.
Exhibit 20: NIM expansion in FY16-17E
3.8 4.03.6
3.2
2.7 2.5 2.6 2.7
0.0
0.5
1.0
1.5
2.0
2.5
3.0
3.5
4.0
4.5
FY10 FY11 FY12 FY13 FY14 FY15E FY16E FY17E
(%)
NIMs (Calculated)
Source: Company, ICICIdirect.com Research
With retail book traction at 14.7% CAGR and 12.6% CAGR
in corporate book, we expect total advances to increase at
13.4% CAGR to | 178191 crore over FY15-17E
On a relative basis, Indian Bank is well placed with higher
NIMs at 2.6% (as reported) in FY14 and 2.47% in Q3FY15,
compared to peers

Page 14ICICI Securities Ltd | Retail Equity Research
Exhibit 21: Better NIMs as compared to its peers (FY14)
2.0 2.1 2.0
2.6
1.8
2.4 2.3
0
1
2
3
BOB
BOI
CNBK
INDB
CRPK
ANDB IO
B
(%)
Source: Company, ICICIdirect.com Research
Exhibit 22: Better NIMs as compared to its peers (Q3FY15)
2.2 2.2 2.22.5
2.1
3.4
2.1
0
1
2
3
4
BOB
BOI
CNBK
INDB
CRPK
ANDB IO
B
(%)
Source: Company, ICICIdirect.com Research
Moderate slippages to provide support to yields
Despite a rising interest rate environment and an increase in proportion of MSME loans to 13% in FY14 vs. 11% in FY12, yield on assets (YoA) fell to 9.5% in FY14 vs. 10.1% in FY12. This slide in YoA can be attributed to interest reversal owing to asset quality deterioration with GNPA rising to 3.7% in FY14 vs. 2.0% in FY12. Cost of funds, on the other hand, has been on an uptrend to 6.8% in FY14 vs. 6.5% in FY12. As a result, the margin spread got narrowed by ~92 bps over FY12-14, which resulted in a muted NII performance. Going ahead, with the interest rate cycle turning south, we expect Indian Bank to witness some slide in YoA. However, such a slide is expected to be partially contained on the back of stable incremental slippages owing to a gradual improvement in NPA. As a result, we have factored in YoA will decline to 9.1%, which entails moderation of ~38 bps over FY15-17E. Exhibit 23: Rise in NPA impacting NIMs
9.3 9.210.1 9.9 9.5 9.2 9.2 9.1
0.8 1.02.0
3.4 3.74.5 4.6 4.4
0
2
4
6
8
10
12
FY10 FY11 FY12 FY13 FY14 FY15E FY16E FY17E
(%)
YoA (%) GNPA ratio (%)
Source: Company, ICICIdirect.com Research
Easing rate environment, stable CASA to lower CoF
Indian Bank witnessed a rise in cost of funds (CoF) to 6.8% in FY14 vs. 6.5% in FY12, on the back of a decline in CASA to 27.2% in FY14 compared to 30.6% in FY12. Lower traction of CASA compared to deposit growth (17% CAGR in FY10-14) can be attributed to elevated inflation coupled with higher interest rates offered on term deposits, which led to a shift of savings towards term deposits growing at 18.6% CAGR over FY10-14 to | 118214 crore coupled with a slower corporate activity impacting current deposit during the same period.

Page 15ICICI Securities Ltd | Retail Equity Research
Exhibit 24: YoA, CoF gap narrows
9.3% 9.2%10.1% 9.9% 9.5% 9.2% 9.2% 9.1%
5.5% 5.3%6.5% 6.7% 6.8% 6.7% 6.6% 6.4%
0%
2%
4%
6%
8%
10%
12%
FY10 FY11 FY12 FY13 FY14 FY15E FY16E FY17E
(%)
YoA CoF
Source: Company, ICICIdirect.com Research
Going ahead, with interest rates easing, we expect cost of deposits to move southwards by ~36-38 bps over FY15-17E. Stable CASA, on the back of branch addition and improved efficiency, will help the bank to manage its CoF better. Hence, we have factored in CoF will decline to 6.4% in FY17E on a calculated basis.
Stable CD ratio to support margin accretion
In FY06-14, Indian Bank witnessed a marked and consistent improvement in its CD ratio from 53% in FY05 to 74-75% in FY14. Such an improvement in CD ratio is primarily on the back of an advances growth at 23% CAGR over FY06-14, surpassing deposit accretion, which was garnered at 19% CAGR in the same period. This has partially helped to keep YoA under control in times of dwindling asset quality. Going forward, we expect the CD ratio to remain stable around 74-75%, which will help margin accretion.
Exhibit 25: CD ratio to remain stable around 74-75%
53 5562 65
71 70 7175 74 75 75 75 75 75
0
10
20
30
40
50
60
70
80
FY05
FY06
FY07
FY08
FY09
FY10
FY11
FY12
FY13
FY14
9MFY
15
FY15
E
FY16
E
FY17
E
(%)
Source: Company, ICICIdirect.com Research
Indian Bank has witnessed a marked and consistent
improvement in its CD ratio from 53% in FY05 to 74-75%
level in FY14

Page 16ICICI Securities Ltd | Retail Equity Research
Adequately capitalised; no risk of substantial dilution in near term
Amid deteriorating asset quality, Indian Bank remains comfortable on the capital front with its capital adequacy ratio (CAR) at 13.06% (Tier I – 10.56%) as of December 2014. The capital consumption run rate remained at a normalised pace with risk weighted asset (RWA) growing at a CAGR of 17.3% to | 110109 crore in FY10-14, in line with the balance sheet, which grew 16.6% CAGR to | 187327 crore. On ploughing back 9MFY15 profits, CAR stood at 13.8% in Q3FY15, which induces confidence on the bank’s ability to shore up the balance sheet ahead.
Exhibit 26: Adequately capitalised for future growth
12.713.6 13.5 13.1 13.2 13.1 13.0
12.211.4
11.1 11.0 11.1 10.9 10.5 10.6 10.610.0 9.5
4
6
8
10
12
14
16
FY10 FY11 FY12 FY13 FY14 9MFY15 FY15E FY16E FY17E
(%)
CaR (%) Tier I (%)
Source: Company, ICICIdirect.com Research
Recently, as part of the capital infusion plan for FY15, GoI announced capital infusion of | 280 crore by way of preferential allotment in Indian Bank, which will strengthen the bank’s capital position by adding 16-18 bps to CAR. In FY14, GoI converted perpetual non cumulative preference shares of | 400 crore into equity at | 114.03 per share, thereby increasing GoI holding from 80% to 81.5%, one of the highest among peers. This can be exploited by the bank to raise its capital ratios ahead. Going forward, we expect the balance sheet to grow at 12% CAGR in FY15-17E, ahead of RWA trajectory ruling out a substantial capital requirement in the near term (in line with management guidance that current CAR base should be sufficient to sustain balance sheet growth, going ahead).
Exhibit 27: Relative strength on CAR (FY14)
12.3
10.0 10.612.6
11.610.8 10.8
0
4
8
12
16
BOB
BOI
CNBK
INDB
CRPK
ANDB IO
B
(%)
Source: Company, ICICIdirect.com Research
Exhibit 28: Relative strength on CAR (Q3FY15)
12.410.7 9.9
13.111.3 10.5 10.2
0
4
8
12
16
BOB
BOI
CNBK
INDB
CRPK
ANDB IO
B
(%)
Source: Company, ICICIdirect.com Research * ratio without adding 9 months profit
Higher GoI holding and better CAR among peer makes
Indian Bank a better play, going ahead

Page 17ICICI Securities Ltd | Retail Equity Research
Exhibit 29: Highest GoI holding among peers (December 2014)
56.3
66.7 69.0
81.5
63.3 60.1
73.8
0
20
40
60
80
100
BOB BOI CNBK INDB CRPK ANDB IOB
(%)
Source: Company, ICICIdirect.com Research
Page 18ICICI Securities Ltd | Retail Equity Research
Risks & concerns High concentration risk in southern region
With ~63% branches (out of 2389 branches as of December 2014) in South Indian states, Indian Bank faces high concentration risk. Although the bank is planning to reduce its dependence on the home state by opening new branches in other states, aggressive expansion in other parts of India remains a challenge. Inability to develop a branch network outside can make the bank vulnerable to region specific risks.
Educational loan exposure in retail loans continues to remain a concern
Indian Bank, in line with south based peers, has a substantial exposure (20% of retail book) towards educational loans, which has witnessed higher NPA to the tune of | 300 crore (10% of segmental exposure). Continuance of slippages poses a risk leading to higher-than-expected delinquency impacting profitability.
Asset quality concern remains; delayed economic recovery to add pressure
The management expects slippages to continue in Q4FY15 and H1FY16 and further expects it to recede after two or three quarters. Slower accretion of NPA is expected to result in muted slippages growth from H2FY16 onwards. However, a delay in economic revival could pose a risk leading to higher-than-anticipated delinquency impacting profitability compared to our estimates.
Management change can become an overhang
A delay in appointment of new CMD can act as an overhang, which can impact business and profitability as the tenure of the current CMD Mr. Bhasin will expire in March 2015. Executive Directors, will continue to be a part of the board with their tenure remaining as they were appointed in 2012 and 2013.
Page 19ICICI Securities Ltd | Retail Equity Research
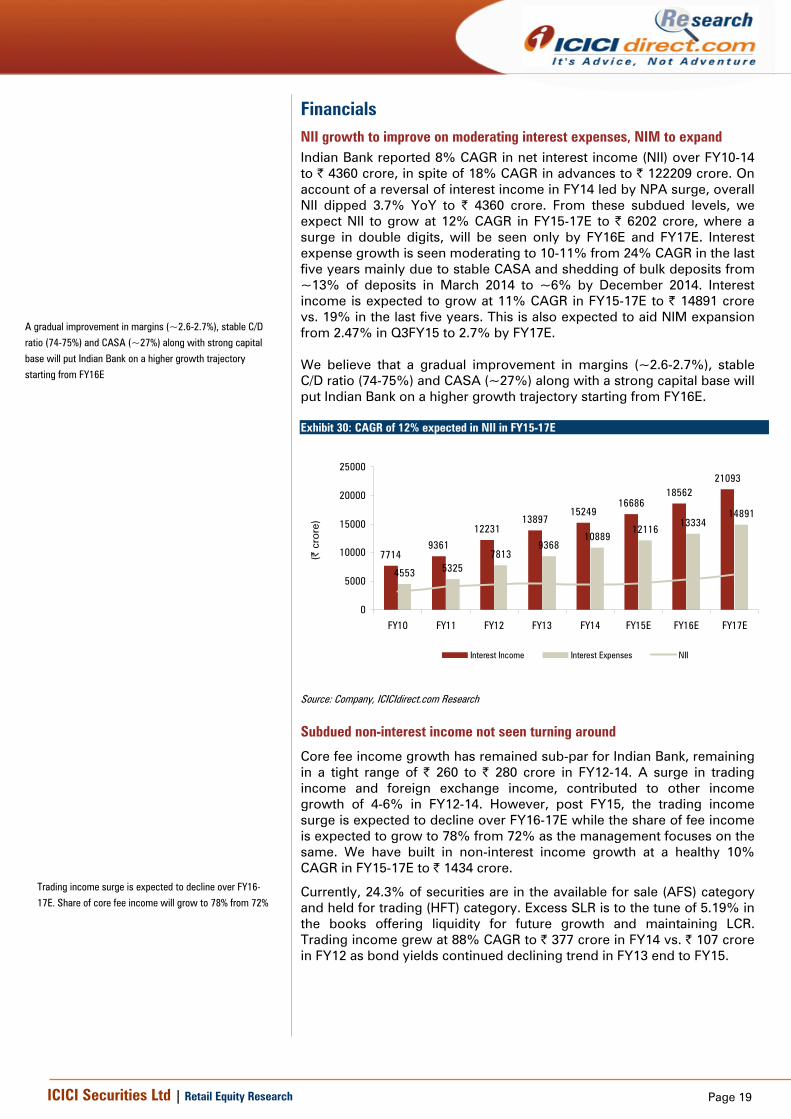
Financials NII growth to improve on moderating interest expenses, NIM to expand Indian Bank reported 8% CAGR in net interest income (NII) over FY10-14 to | 4360 crore, in spite of 18% CAGR in advances to | 122209 crore. On account of a reversal of interest income in FY14 led by NPA surge, overall NII dipped 3.7% YoY to | 4360 crore. From these subdued levels, we expect NII to grow at 12% CAGR in FY15-17E to | 6202 crore, where a surge in double digits, will be seen only by FY16E and FY17E. Interest expense growth is seen moderating to 10-11% from 24% CAGR in the last five years mainly due to stable CASA and shedding of bulk deposits from ~13% of deposits in March 2014 to ~6% by December 2014. Interest income is expected to grow at 11% CAGR in FY15-17E to | 14891 crore vs. 19% in the last five years. This is also expected to aid NIM expansion from 2.47% in Q3FY15 to 2.7% by FY17E. We believe that a gradual improvement in margins (~2.6-2.7%), stable C/D ratio (74-75%) and CASA (~27%) along with a strong capital base will put Indian Bank on a higher growth trajectory starting from FY16E. Exhibit 30: CAGR of 12% expected in NII in FY15-17E
77149361
1223113897
1524916686
1856221093
4553 53257813
936810889
1211613334
14891
0
5000
10000
15000
20000
25000
FY10 FY11 FY12 FY13 FY14 FY15E FY16E FY17E
(| c
rore
)
Interest Income Interest Expenses NII
Source: Company, ICICIdirect.com Research
Subdued non-interest income not seen turning around
Core fee income growth has remained sub-par for Indian Bank, remaining in a tight range of | 260 to | 280 crore in FY12-14. A surge in trading income and foreign exchange income, contributed to other income growth of 4-6% in FY12-14. However, post FY15, the trading income surge is expected to decline over FY16-17E while the share of fee income is expected to grow to 78% from 72% as the management focuses on the same. We have built in non-interest income growth at a healthy 10% CAGR in FY15-17E to | 1434 crore.
Currently, 24.3% of securities are in the available for sale (AFS) category and held for trading (HFT) category. Excess SLR is to the tune of 5.19% in the books offering liquidity for future growth and maintaining LCR. Trading income grew at 88% CAGR to | 377 crore in FY14 vs. | 107 crore in FY12 as bond yields continued declining trend in FY13 end to FY15.
A gradual improvement in margins (~2.6-2.7%), stable C/D
ratio (74-75%) and CASA (~27%) along with strong capital
base will put Indian Bank on a higher growth trajectory
starting from FY16E
Trading income surge is expected to decline over FY16-
17E. Share of core fee income will grow to 78% from 72%

Page 20ICICI Securities Ltd | Retail Equity Research
Exhibit 31: Non-interest income break-up
285.8 257.0 259.1 269.5 309.9 356.4107.3 213.1
377.4 415.1 352.8 317.6173.8 88.5
154.6 139.1 158.6 180.8665.3 724.6
580.6 472.2 518.5 579.4
0
200
400
600
800
1000
1200
1400
1600
FY12 FY13 FY14 FY15E FY16E FY17E
(| c
rore
)Commision, exchange and brokerage Trading gains Forex Other Income
Source: Company, ICICIdirect.com Research
Employee cost, efficiency parameters well placed The cost to income ratio of Indian Bank deteriorated from 38.6% in FY10 to 49.4% in FY14, on the back of slower topline growth along with higher provision in lieu of employees (wage revision and pension liabilities). Total employee cost for FY14 was | 1927 crore, 13.1% CAGR in FY11-14 on total employee base of | 19429 crore. Final wage agreement at 15% will not have a substantial impact as Indian Bank has already provided for the same. Considering the anticipated topline growth, we expect the cost income ratio to improve from current levels though the pace is likely to remain gradual owing to branch expansion plans. We expect the cost to income ratio to improve to 47.6% in FY17E from 49.4% in FY14. Exhibit 32: Cost to income ratio to improve to 47.6% by FY17E
43.6
38.636.9
38.7
47.349.4 49.3 48.7 47.6
30
35
40
45
50
55
FY09 FY10 FY11 FY12 FY13 FY14 FY15E FY16E FY17E
(%)
CI Ratio
Source: Company, ICICIdirect.com Research
Investment made by the bank in human capital and technology is expected to continue to yield dividends. Business per employee and per branch is expected to rise to | 147.9 crore and | 20.8 crore, respectively, by FY17E.

Page 21ICICI Securities Ltd | Retail Equity Research
Exhibit 33: Employee break-up (FY12-14)
FY12 FY13 FY14
Officer 7908 8511 8698
Clerk 8488 8194 8874
Sub Staff 2386 2165 1857
Total 18782 18870 19429 Source: Company, ICICIdirect.com Research
Other opex has been growing at 15.1% CAGR in FY11-14 to | 905 crore. We factor in 13.7% CAGR over FY15-17E to | 1331 crore, leading to overall expenses growing at 8.7% CAGR to | 3636 crore over FY15-17E. Exhibit 34: Efficiency parameters to improve further in tandem with growth in business activity
75.485.5
97.2107.8
118.4126.3 128.9
136.6147.9
6.1 7.6 9.3 11.1 13.2 14.9 16.2 18.3 20.8
0.1
0.1
0.20.2
0.2 0.2 0.20.2
0.2
0
20
40
60
80
100
120
140
160
FY09 FY10 FY11 FY12 FY13 FY14 FY15E FY16E FY17E
(| c
rore
)
0.0
0.1
0.1
0.2
0.2
0.3
(| c
rore
)
Business per Branch (LHS) Business per Employee PPP per Employee
Source: Company, ICICIdirect.com Research
Credit cost maintained at 117 bps, expect moderation Provision expenses have been on the rise growing at 38% CAGR to | 1425 crore in FY11-14, owing to higher traction in NPL provision. Provision for NPL increased at 30% CAGR over FY11-14 to | 1147 crore, on the back of deteriorating asset quality. Hence, credit cost increased to 117 bps in FY14 compared to 87 bps in FY11. This rise in credit cost is due to an increase in NPAs (73.3% CAGR to | 4562 crore) on the one hand and degradation in NPA quality on the other in FY11-14 (see Exhibit 36). The proportion of doubtful NPAs has increased at a CAGR of 273% over FY11-14 to | 2446 crore, thereby forming 53.6% of total NPA vs. 6.4% in FY11. This rise in proportion of doubtful NPAs resulted in higher provision expenses impacting profitability. Exhibit 35: Credit cost to decline in FY16-FY17E
| crore FY11 FY12 FY13 FY14 FY15E FY16E FY17E
Provision - NPL 719 767 953 1147 1134 1176 1163
Provision - investments -6 -6 0 7 -5 10 10
Other provisions -56 434 282 270 249 232 247
Total provisions 657 1195 1235 1425 1378 1418 1420
Credit cost (%) 0.87 1.32 1.17 1.17 1.02 0.92 0.80 Source: Company, ICICIdirect.com Research

Page 22ICICI Securities Ltd | Retail Equity Research
Going forward, owing to the higher focus on retail and SME loans and cautious approach towards corporate lending, we expect slippages to continue their run rate till H1FY16E and improve from H2FY16E onwards. As a result, GNPA is expected to increase at 20% CAGR in FY15-17E to touch 4.6% in FY16E (vs. 3.7% in FY14 and 4.5% in Q3FY15) and then improve gradually to 4.4% in FY17E. Consequently, credit cost is expected to improve to 0.8% in FY17E. Exhibit 36: NPA classification
| crore FY11 FY12 FY13 FY14
Sub-Standard 682 1323 2234 2103
Doubtful 47 514 1323 2446
Loss 11 14 8 13
Proportion (%) FY11 FY12 FY13 FY14
Sub-Standard 92.1 71.5 62.7 46.1
Doubtful 6.4 27.7 37.1 53.6
Loss 1.5 0.8 0.2 0.3 Source: Company, ICICIdirect.com Research
PAT estimated to grow at 14% CAGR over FY15-17E
Profit, which de-grew during FY13-14 on the back of a business slowdown and higher provision, is estimated to grow at 14% CAGR over FY15-17E to | 1729 crore. With lower accretion in provision on the back of stabilising asset quality, a sharp jump in PAT is anticipated in FY17E which will drive return ratios. RoE, which declined from 20.2% in FY10 to 9.0% in FY14, is expected to improve to 10.3% by FY17E. Being already strong on capital, a substantial dilution may not be in pipeline, preventing a major dent in RoE. Similarly, RoA is expected at ~0.7% for FY17E.
Exhibit 37: Return ratios to improve
20.2 19.317.2
13.9
9.07.6 8.4
10.5
1.71.5
1.3
1.0
0.70.6 0.6
0.7
-2
1
4
7
10
13
16
19
22
FY10 FY11 FY12 FY13 FY14 FY15E FY16E FY17E
(%)
0.0
0.3
0.6
0.9
1.2
1.5
1.8
(%)
RoE (LHS) RoA
Source: Company, ICICIdirect.com Research
GNPA is expected to increase at 20% CAGR in FY15-17E to
4.6% in FY16E (vs.. 3.7% in FY14 and 4.5% in Q3FY15) and
then improve gradually to 4.4% in FY17E
Page 23ICICI Securities Ltd | Retail Equity Research
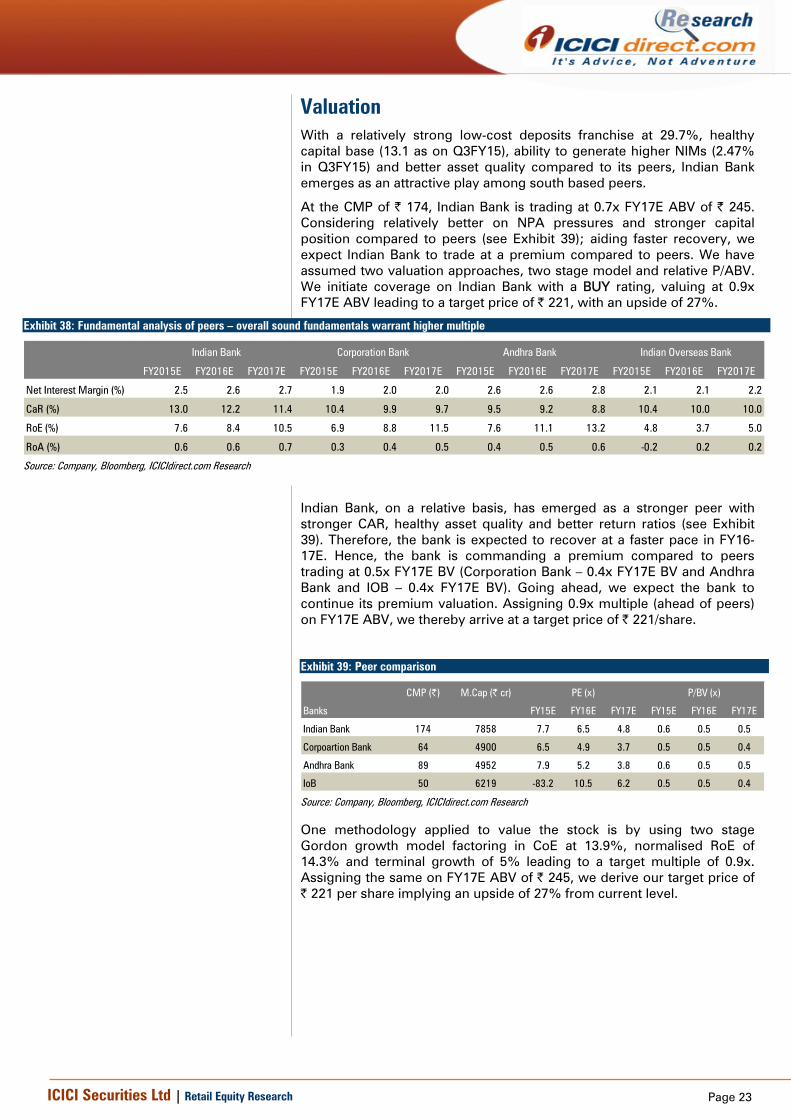
Valuation With a relatively strong low-cost deposits franchise at 29.7%, healthy capital base (13.1 as on Q3FY15), ability to generate higher NIMs (2.47% in Q3FY15) and better asset quality compared to its peers, Indian Bank emerges as an attractive play among south based peers.
At the CMP of | 174, Indian Bank is trading at 0.7x FY17E ABV of | 245. Considering relatively better on NPA pressures and stronger capital position compared to peers (see Exhibit 39); aiding faster recovery, we expect Indian Bank to trade at a premium compared to peers. We have assumed two valuation approaches, two stage model and relative P/ABV. We initiate coverage on Indian Bank with a BUY rating, valuing at 0.9x FY17E ABV leading to a target price of | 221, with an upside of 27%.
Exhibit 38: Fundamental analysis of peers – overall sound fundamentals warrant higher multiple
FY2015E FY2016E FY2017E FY2015E FY2016E FY2017E FY2015E FY2016E FY2017E FY2015E FY2016E FY2017E
Net Interest Margin (%) 2.5 2.6 2.7 1.9 2.0 2.0 2.6 2.6 2.8 2.1 2.1 2.2
CaR (%) 13.0 12.2 11.4 10.4 9.9 9.7 9.5 9.2 8.8 10.4 10.0 10.0
RoE (%) 7.6 8.4 10.5 6.9 8.8 11.5 7.6 11.1 13.2 4.8 3.7 5.0
RoA (%) 0.6 0.6 0.7 0.3 0.4 0.5 0.4 0.5 0.6 -0.2 0.2 0.2
Indian Bank Corporation Bank Andhra Bank Indian Overseas Bank
Source: Company, Bloomberg, ICICIdirect.com Research
Indian Bank, on a relative basis, has emerged as a stronger peer with stronger CAR, healthy asset quality and better return ratios (see Exhibit 39). Therefore, the bank is expected to recover at a faster pace in FY16-17E. Hence, the bank is commanding a premium compared to peers trading at 0.5x FY17E BV (Corporation Bank – 0.4x FY17E BV and Andhra Bank and IOB – 0.4x FY17E BV). Going ahead, we expect the bank to continue its premium valuation. Assigning 0.9x multiple (ahead of peers) on FY17E ABV, we thereby arrive at a target price of | 221/share.
Exhibit 39: Peer comparison
CMP (|) M.Cap (| cr)
Banks FY15E FY16E FY17E FY15E FY16E FY17E
Indian Bank 174 7858 7.7 6.5 4.8 0.6 0.5 0.5
Corpoartion Bank 64 4900 6.5 4.9 3.7 0.5 0.5 0.4
Andhra Bank 89 4952 7.9 5.2 3.8 0.6 0.5 0.5
IoB 50 6219 -83.2 10.5 6.2 0.5 0.5 0.4
PE (x) P/BV (x)
Source: Company, Bloomberg, ICICIdirect.com Research
One methodology applied to value the stock is by using two stage Gordon growth model factoring in CoE at 13.9%, normalised RoE of 14.3% and terminal growth of 5% leading to a target multiple of 0.9x. Assigning the same on FY17E ABV of | 245, we derive our target price of | 221 per share implying an upside of 27% from current level.

Page 24ICICI Securities Ltd | Retail Equity Research
Exhibit 40: Assumptions for valuation and target price (FY17E ABV basis)
Gorden Growth Model Value
Risk free rate 7.8%
Equity risk premium 5.5%
Beta 1.1
Cost of equity 13.9%
Terminal Growth 5.0%
Stage 2 growth 17.0%
Normalised RoE 14.3%
Derived target P/ABV multiple 0.90
Target Price (| per share) 221 Source: Company, ICICIdirect.com Research
Indian Bank has been trading in line with most of its peers historically. However, the stock has recently started surpassing its comparable peers, owing to the relatively better performance accomplished by the bank. On a per branch metric, Indian Bank commands highest valuation among comparable peers (see Exhibit 41) based on the better performance and profitability at | 0.5 crore per branch in FY14. At our target price of | 221 per share, Indian Bank is valued at | 3.8 crore Mcap per branch on anticipated branch network of 2802 in FY17E. This looks fairly justified given expectations of a faster recovery, going forward, amid current relative strength. Exhibit 41: Peer branch metrics (FY14) – M/Cap per branch at premium, expect to stay | crore Mcap/Branch Business/Branch PAT/Branch
Indian Bank 3.5 126.3 0.5
Corporation Bank 2.4 163.5 0.3
Andhra Bank 2.3 118.0 0.2
IoB 1.9 123.7 0.1
Source: Company, ICICIdirect.com Research
Exhibit 42: Indian Bank surpasses peers – Less volatile over the years
0.0
0.5
1.0
1.5
2.0
2.5
Mar
-07
Sep-
07
Mar
-08
Sep-
08
Mar
-09
Sep-
09
Mar
-10
Sep-
10
Mar
-11
Sep-
11
Mar
-12
Sep-
12
Mar
-13
Sep-
13
Mar
-14
Sep-
14
(x)
Indian Bank Corporation Bank Andhra Bank IoB
Source: Company, ICICIdirect.com Research
Page 25ICICI Securities Ltd | Retail Equity Research
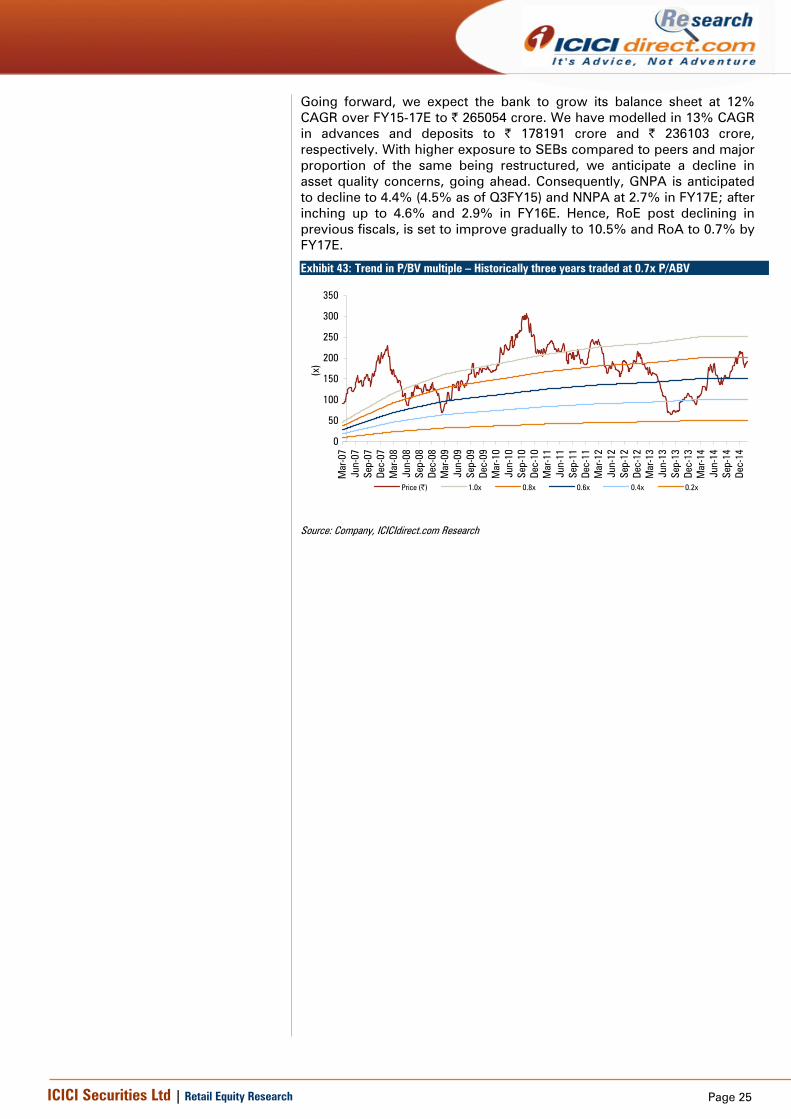
Going forward, we expect the bank to grow its balance sheet at 12% CAGR over FY15-17E to | 265054 crore. We have modelled in 13% CAGR in advances and deposits to | 178191 crore and | 236103 crore, respectively. With higher exposure to SEBs compared to peers and major proportion of the same being restructured, we anticipate a decline in asset quality concerns, going ahead. Consequently, GNPA is anticipated to decline to 4.4% (4.5% as of Q3FY15) and NNPA at 2.7% in FY17E; after inching up to 4.6% and 2.9% in FY16E. Hence, RoE post declining in previous fiscals, is set to improve gradually to 10.5% and RoA to 0.7% by FY17E.
Exhibit 43: Trend in P/BV multiple – Historically three years traded at 0.7x P/ABV
0
50
100
150
200
250
300
350
Mar
-07
Jun-
07Se
p-07
Dec-
07M
ar-0
8Ju
n-08
Sep-
08De
c-08
Mar
-09
Jun-
09Se
p-09
Dec-
09M
ar-1
0Ju
n-10
Sep-
10De
c-10
Mar
-11
Jun-
11Se
p-11
Dec-
11M
ar-1
2Ju
n-12
Sep-
12De
c-12
Mar
-13
Jun-
13Se
p-13
Dec-
13M
ar-1
4Ju
n-14
Sep-
14De
c-14
(x)
Price (|) 1.0x 0.8x 0.6x 0.4x 0.2x
Source: Company, ICICIdirect.com Research
Page 26ICICI Securities Ltd | Retail Equity Research
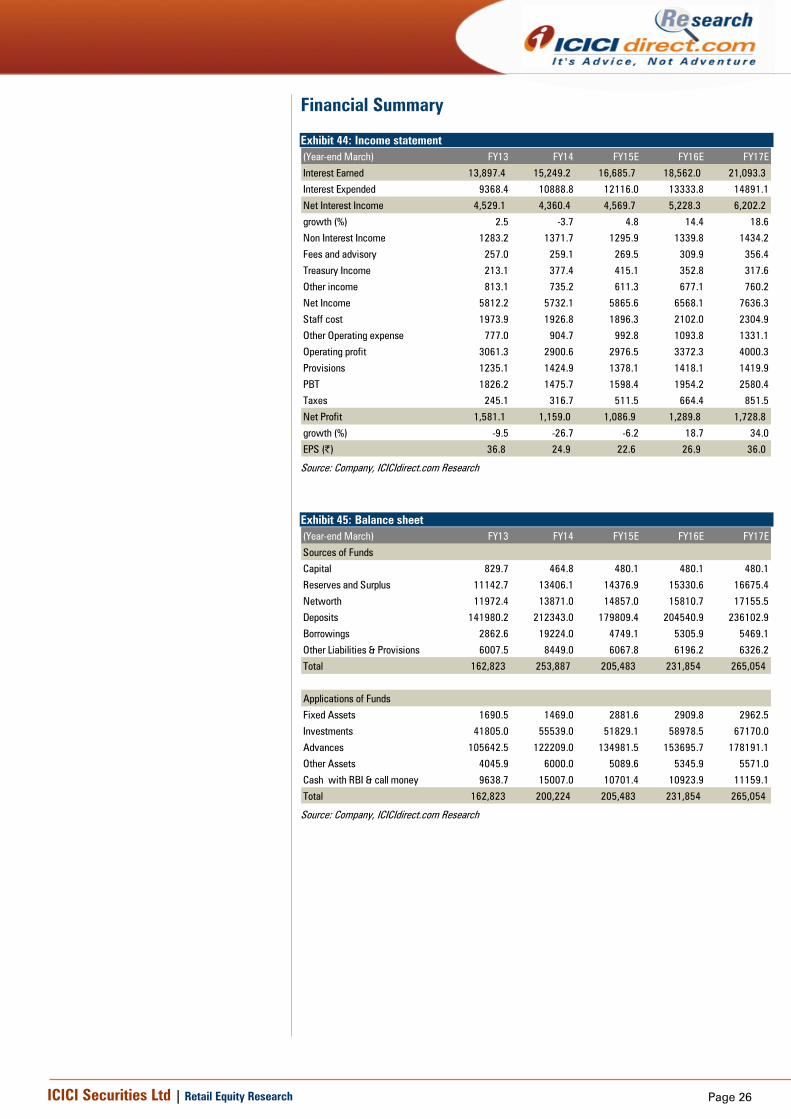
Financial Summary Exhibit 44: Income statement (Year-end March) FY13 FY14 FY15E FY16E FY17E
Interest Earned 13,897.4 15,249.2 16,685.7 18,562.0 21,093.3
Interest Expended 9368.4 10888.8 12116.0 13333.8 14891.1
Net Interest Income 4,529.1 4,360.4 4,569.7 5,228.3 6,202.2
growth (%) 2.5 -3.7 4.8 14.4 18.6
Non Interest Income 1283.2 1371.7 1295.9 1339.8 1434.2
Fees and advisory 257.0 259.1 269.5 309.9 356.4
Treasury Income 213.1 377.4 415.1 352.8 317.6
Other income 813.1 735.2 611.3 677.1 760.2
Net Income 5812.2 5732.1 5865.6 6568.1 7636.3
Staff cost 1973.9 1926.8 1896.3 2102.0 2304.9
Other Operating expense 777.0 904.7 992.8 1093.8 1331.1
Operating profit 3061.3 2900.6 2976.5 3372.3 4000.3
Provisions 1235.1 1424.9 1378.1 1418.1 1419.9
PBT 1826.2 1475.7 1598.4 1954.2 2580.4
Taxes 245.1 316.7 511.5 664.4 851.5
Net Profit 1,581.1 1,159.0 1,086.9 1,289.8 1,728.8
growth (%) -9.5 -26.7 -6.2 18.7 34.0
EPS (|) 36.8 24.9 22.6 26.9 36.0
Source: Company, ICICIdirect.com Research
Exhibit 45: Balance sheet (Year-end March) FY13 FY14 FY15E FY16E FY17E
Sources of Funds
Capital 829.7 464.8 480.1 480.1 480.1
Reserves and Surplus 11142.7 13406.1 14376.9 15330.6 16675.4
Networth 11972.4 13871.0 14857.0 15810.7 17155.5
Deposits 141980.2 212343.0 179809.4 204540.9 236102.9
Borrowings 2862.6 19224.0 4749.1 5305.9 5469.1
Other Liabilities & Provisions 6007.5 8449.0 6067.8 6196.2 6326.2
Total 162,823 253,887 205,483 231,854 265,054
Applications of Funds
Fixed Assets 1690.5 1469.0 2881.6 2909.8 2962.5
Investments 41805.0 55539.0 51829.1 58978.5 67170.0
Advances 105642.5 122209.0 134981.5 153695.7 178191.1
Other Assets 4045.9 6000.0 5089.6 5345.9 5571.0
Cash with RBI & call money 9638.7 15007.0 10701.4 10923.9 11159.1
Total 162,823 200,224 205,483 231,854 265,054
Source: Company, ICICIdirect.com Research

Page 27ICICI Securities Ltd | Retail Equity Research
Exhibit 46: Key ratios (Year-end March) FY13 FY14 FY15E FY16E FY17E
ValuationNo. of Equity Shares (Crore) 43.0 46.5 48.0 48.0 48.0EPS (Rs.) 36.8 24.9 22.6 26.9 36.0BV (Rs.) 267.1 286.5 297.9 317.8 345.8ABV (Rs.) 211.6 227.0 215.3 224.4 245.1P/E 4.7 7.0 7.7 6.5 4.8P/BV 0.7 0.6 0.6 0.5 0.5P/ABV 0.8 0.8 0.8 0.8 0.7
Yields & Margins (%)Net Interest Margins 3.2 2.7 2.5 2.6 2.7Yield on assets 9.9 9.5 9.2 9.2 9.1Avg. cost on funds 6.7 6.8 6.7 6.6 6.4Yield on average advances 10.8 10.0 9.9 9.9 9.9
Avg. Cost of Deposits 6.9 7.0 6.9 6.8 6.6
Quality and Efficiency (%)
Cost to income ratio 47.3 49.4 49.3 48.7 47.6
Credit/Deposit ratio 74.4 75.3 75.1 75.1 75.5GNPA 3.4 3.7 4.5 4.6 4.4NNPA 2.3 2.3 2.9 2.9 2.7
ROE 13.9 9.0 7.6 8.4 10.5
ROA 1.0 0.7 0.6 0.6 0.7
Source: Company, ICICIdirect.com Research
Exhibit 47: Key growth rates (Year-end March) FY13 FY14 FY15E FY16E FY17E
Total assets 15.1 15.0 9.7 12.8 14.3Advances 17.0 15.7 10.5 13.9 15.9Deposit 17.5 14.3 10.8 13.8 15.4Total Income 12.8 9.5 8.2 10.7 13.2
Net interest income 2.5 -3.7 4.8 14.4 18.6Operating expenses 25.8 2.9 2.0 10.6 13.8Operating profit -11.6 -5.2 2.6 13.3 18.6Net profit -9.5 -26.7 -6.2 18.7 34.0Net worth 10.3 16.0 7.4 6.7 8.8
EPS (9.5) (32.2) (9.2) 18.7 34.0
Source: Company, ICICIdirect.com Research

Page 29ICICI Securities Ltd | Retail Equity Research
RATING RATIONALE ICICIdirect.com endeavours to provide objective opinions and recommendations. ICICIdirect.com assigns ratings to its stocks according to their notional target price vs. current market price and then categorises them as Strong Buy, Buy, Hold and Sell. The performance horizon is two years unless specified and the notional target price is defined as the analysts' valuation for a stock. Strong Buy: >15%/20% for large caps/midcaps, respectively, with high conviction; Buy: >10%/15% for large caps/midcaps, respectively; Hold: Up to +/-10%; Sell: -10% or more;
Pankaj Pandey Head – Research [email protected]
ICICIdirect.com Research Desk, ICICI Securities Limited, 1st Floor, Akruti Trade Centre, Road No 7, MIDC, Andheri (East) Mumbai – 400 093
Page 30ICICI Securities Ltd | Retail Equity Research
ANALYST CERTIFICATION We /I, Kajal Gandhi, CA, Vishal Narnolia, MBA and Vasant Lohiya, CA, Research Analysts, authors and the names subscribed to this report, hereby certify that all of the views expressed in this research report accurately reflect our views about the subject issuer(s) or securities. We also certify that no part of our compensation was, is, or will be directly or indirectly related to the specific recommendation(s) or view(s) in this report.
Terms & conditions and other disclosures: ICICI Securities Limited (ICICI Securities) is a full-service, integrated investment banking and is, inter alia, engaged in the business of stock brokering and distribution of financial products. ICICI Securities is a wholly-owned subsidiary of ICICI Bank which is India’s largest private sector bank and has its various subsidiaries engaged in businesses of housing finance, asset management, life insurance, general insurance, venture capital fund management, etc. (“associates”), the details in respect of which are available on www.icicibank.com. ICICI Securities is one of the leading merchant bankers/ underwriters of securities and participate in virtually all securities trading markets in India. We and our associates might have investment banking and other business relationship with a significant percentage of companies covered by our Investment Research Department. ICICI Securities generally prohibits its analysts, persons reporting to analysts and their relatives from maintaining a financial interest in the securities or derivatives of any companies that the analysts cover. The information and opinions in this report have been prepared by ICICI Securities and are subject to change without any notice. The report and information contained herein is strictly confidential and meant solely for the selected recipient and may not be altered in any way, transmitted to, copied or distributed, in part or in whole, to any other person or to the media or reproduced in any form, without prior written consent of ICICI Securities. While we would endeavour to update the information herein on a reasonable basis, ICICI Securities is under no obligation to update or keep the information current. Also, there may be regulatory, compliance or other reasons that may prevent ICICI Securities from doing so. Non-rated securities indicate that rating on a particular security has been suspended temporarily and such suspension is in compliance with applicable regulations and/or ICICI Securities policies, in circumstances where ICICI Securities might be acting in an advisory capacity to this company, or in certain other circumstances. This report is based on information obtained from public sources and sources believed to be reliable, but no independent verification has been made nor is its accuracy or completeness guaranteed. This report and information herein is solely for informational purpose and shall not be used or considered as an offer document or solicitation of offer to buy or sell or subscribe for securities or other financial instruments. Though disseminated to all the customers simultaneously, not all customers may receive this report at the same time. ICICI Securities will not treat recipients as customers by virtue of their receiving this report. Nothing in this report constitutes investment, legal, accounting and tax advice or a representation that any investment or strategy is suitable or appropriate to your specific circumstances. The securities discussed and opinions expressed in this report may not be suitable for all investors, who must make their own investment decisions, based on their own investment objectives, financial positions and needs of specific recipient. This may not be taken in substitution for the exercise of independent judgment by any recipient. The recipient should independently evaluate the investment risks. The value and return on investment may vary because of changes in interest rates, foreign exchange rates or any other reason. ICICI Securities accepts no liabilities whatsoever for any loss or damage of any kind arising out of the use of this report. Past performance is not necessarily a guide to future performance. Investors are advised to see Risk Disclosure Document to understand the risks associated before investing in the securities markets. Actual results may differ materially from those set forth in projections. Forward-looking statements are not predictions and may be subject to change without notice. ICICI Securities or its associates might have managed or co-managed public offering of securities for the subject company or might have been mandated by the subject company for any other assignment in the past twelve months. ICICI Securities or its associates might have received any compensation from the companies mentioned in the report during the period preceding twelve months from the date of this report for services in respect of managing or co-managing public offerings, corporate finance, investment banking or merchant banking, brokerage services or other advisory service in a merger or specific transaction. ICICI Securities or its associates might have received any compensation for products or services other than investment banking or merchant banking or brokerage services from the companies mentioned in the report in the past twelve months. ICICI Securities encourages independence in research report preparation and strives to minimize conflict in preparation of research report. ICICI Securities or its analysts did not receive any compensation or other benefits from the companies mentioned in the report or third party in connection with preparation of the research report. Accordingly, neither ICICI Securities nor Research Analysts have any material conflict of interest at the time of publication of this report. It is confirmed that Kajal Gandhi, CA, Vishal Narnolia, MBA and Vasant Lohiya, CA,, Research Analysts of this report have not received any compensation from the companies mentioned in the report in the preceding twelve months. Compensation of our Research Analysts is not based on any specific merchant banking, investment banking or brokerage service transactions. ICICI Securities or its subsidiaries collectively or Research Analysts do not own 1% or more of the equity securities of the Company mentioned in the report as of the last day of the month preceding the publication of the research report. Since associates of ICICI Securities are engaged in various financial service businesses, they might have financial interests or beneficial ownership in various companies including the subject company/companies mentioned in this report. It is confirmed that Kajal Gandhi, CA, Vishal Narnolia, MBA and Vasant Lohiya, CA, Research Analysts do not serve as an officer, director or employee of the companies mentioned in the report. ICICI Securities may have issued other reports that are inconsistent with and reach different conclusion from the information presented in this report. Neither the Research Analysts nor ICICI Securities have been engaged in market making activity for the companies mentioned in the report. We submit that no material disciplinary action has been taken on ICICI Securities by any Regulatory Authority impacting Equity Research Analysis activities. This report is not directed or intended for distribution to, or use by, any person or entity who is a citizen or resident of or located in any locality, state, country or other jurisdiction, where such distribution, publication, availability or use would be contrary to law, regulation or which would subject ICICI Securities and affiliates to any registration or licensing requirement within such jurisdiction. The securities described herein may or may not be eligible for sale in all jurisdictions or to certain category of investors. Persons in whose possession this document may come are required to inform themselves of and to observe such restriction.