Embed Size (px)
Citation preview

December 2, 2021

COVID-19 Cases in the Canada, Ontario, andWindsor-Essex
2021-12-02
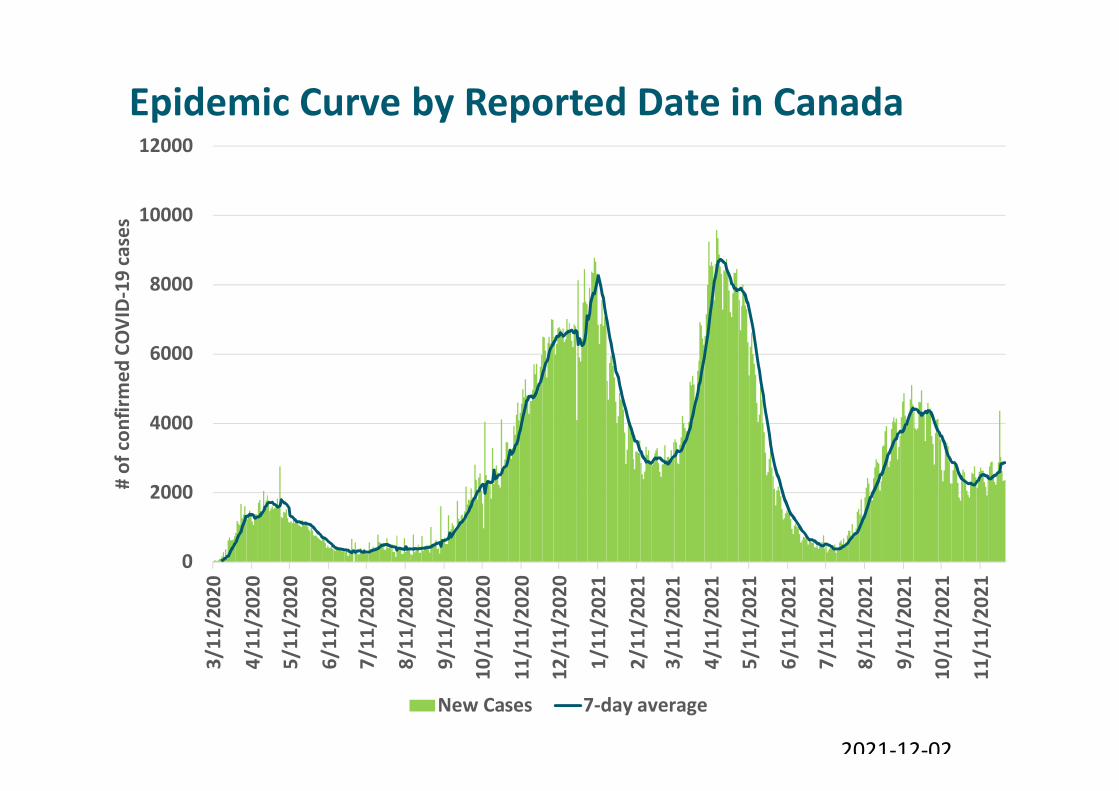
Epidemic Curve by Reported Date in Canada
2021-12-02
0
2000
4000
6000
8000
10000
12000
3/11
/202
0
4/11
/202
0
5/11
/202
0
6/11
/202
0
7/11
/202
0
8/11
/202
0
9/11
/202
0
10/1
1/20
20
11/1
1/20
20
12/1
1/20
20
1/11
/202
1
2/11
/202
1
3/11
/202
1
4/11
/202
1
5/11
/202
1
6/11
/202
1
7/11
/202
1
8/11
/202
1
9/11
/202
1
10/1
1/20
21
11/1
1/20
21
# of
con
firm
ed C
OVI
D-19
case
s
New Cases 7-day average

Epidemic Curve by Reported Date in Ontario
2021-12-02
0
1000
2000
3000
4000
5000
6000
3/11
/202
0
4/11
/202
0
5/11
/202
0
6/11
/202
0
7/11
/202
0
8/11
/202
0
9/11
/202
0
10/1
1/20
20
11/1
1/20
20
12/1
1/20
20
1/11
/202
1
2/11
/202
1
3/11
/202
1
4/11
/202
1
5/11
/202
1
6/11
/202
1
7/11
/202
1
8/11
/202
1
9/11
/202
1
10/1
1/20
21
11/1
1/20
21
# of
con
firm
ed C
OVI
D-19
case
s
New Cases 7-day average

Epidemic Curve by Reported Date in Windsor-Essex
2021-12-02
0
50
100
150
200
250
3003/
24/2
020
4/24
/202
0
5/24
/202
0
6/24
/202
0
7/24
/202
0
8/24
/202
0
9/24
/202
0
10/2
4/20
20
11/2
4/20
20
12/2
4/20
20
1/24
/202
1
2/24
/202
1
3/24
/202
1
4/24
/202
1
5/24
/202
1
6/24
/202
1
7/24
/202
1
8/24
/202
1
9/24
/202
1
10/2
4/20
21
11/2
4/20
21
# of
con
firm
ed C
OVI
D-19
case
s
Date Reported
Case Count 7-day average

Windsor-Essex Rate by Reported Week
2021-12-02
0
200
400
600
800
1000
1200
1400
1600
0.0
50.0
100.0
150.0
200.0
250.0
300.0
350.0
400.0
17 20 23 26 29 32 35 38 41 44 47 50 53 3 6 9 12 15 18 21 24 27 30 33 36 39 42 45
# of
CO
VID-
19 ca
ses
Rate
per
100
,000
pop
ulat
ion
Reported Week
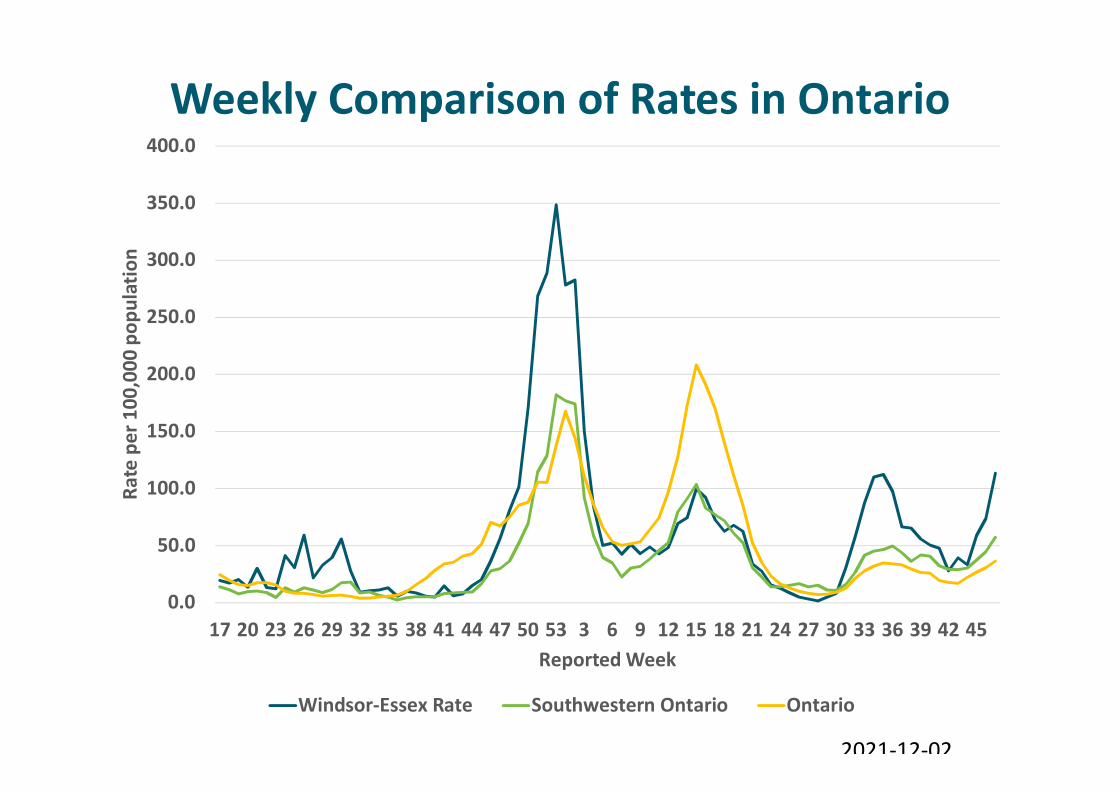
Weekly Comparison of Rates in Ontario
2021-12-02
0.0
50.0
100.0
150.0
200.0
250.0
300.0
350.0
400.0
17 20 23 26 29 32 35 38 41 44 47 50 53 3 6 9 12 15 18 21 24 27 30 33 36 39 42 45
Rate
per
100
,000
pop
ulat
ion
Reported Week
Windsor-Essex Rate Southwestern Ontario Ontario

Week 47 Case Rates by Public Health Unit(November 21 to November 27, 2021)
2021-12-02
0.0
50.0
100.0
150.0
200.0
250.0
Tim
iska
min
gAl
gom
aW
inds
or-E
ssex
Sudb
ury
KFL&
AHa
ldim
and-
Nor
folk
Sout
hwes
tern
Bran
tSi
mco
e M
usko
kaHP
ECTh
unde
r Bay
Chat
ham
-Ken
tEa
ster
n O
ntar
ioLa
mbt
onW
ater
loo
Huro
n Pe
rth
Durh
am York
Ott
awa
Halto
nG
rey
Bruc
ePe
terb
orou
ghN
iaga
raHa
milt
onM
iddl
esex
-Lon
don
Toro
nto
Renf
rew
WD
GPe
elHK
PRN
orth
wes
tern
LGLD
NBP
SPo
rcup
ine
Rate
per
100
,000
pop
ulat
ion
PHU Ontario


0
2,000
4,000
6,000
8,000
10,000
12,000
14,000
0.0%
5.0%
10.0%
15.0%
20.0%
25.0%
Wee
k01-
08 F
eb29
Wee
k12
Mar
28W
eek1
6 Ap
r25
Wee
k20
May
23W
eek2
4 Ju
n20
Wee
k28
Jul1
8W
eek3
2 Au
g15
Wee
k 36
Sep
12W
eek
40 O
ct10
Wee
k 44
Nov
7W
eek
48 D
ec5
Wee
k 52
Jan2
Wee
k 4
Jan3
0W
eek
8 Fe
b27
Wee
k 12
Mar
27W
eek
16 A
pr24
Wee
k 20
May
22W
eek
24 Ju
n19
Wee
k 28
Jul1
7W
eek
32 A
ug14
Wee
k 36
Sep
11W
eek
40 O
ct9
Wee
k 44
Nov
6 # of
peo
ple
test
ed/#
of t
ests
com
plet
ed
% p
ositi
vity
Week
Weekly test completed % positivity (all WEC tests)
Percent Positivity by Week by All Tests
2021-12-02

% Positivity in Ontario: 7-Day Average
2021-12-02
0.0%
1.0%
2.0%
3.0%
4.0%
5.0%
6.0%
7.0%
8.0%
Hald
iman
d-N
orfo
lkSo
uthw
este
rnTi
mis
kam
ing
Win
dsor
-Ess
exBr
ant C
ount
yAl
gom
aSu
dbur
ySi
mco
e M
usko
kaHu
ron
Pert
hW
ater
loo
Chat
ham
-Ken
tHP
ECTh
unde
r Bay
KFL&
ALa
mbt
onN
iaga
raEa
ster
n O
ntar
ioDu
rham
LGLD
York
Mid
dles
ex-L
ondo
nHa
lton
Peel
Pete
rbor
ough
Renf
rew
Cou
nty
Ott
awa
Toro
nto
WD
GHa
milt
onG
rey
Bruc
eN
BPS
HKPR
Porc
upin
eN
orth
wes
tern
% p
ositi
vity
: 7-d
ay a
vera
ge
PHU Ontario

% Positivity in Windsor-Essex by Age: 7-Day Average
2021-12-02
0.0%
5.0%
10.0%
15.0%
20.0%
25.0%
30.0%
35.0%
01Ap
r202
0
01M
ay20
20
01Ju
n202
0
01Ju
l202
0
01Au
g202
0
01Se
p202
0
01O
ct20
20
01N
ov20
20
01De
c202
0
01Ja
n202
1
01Fe
b202
1
01M
ar20
21
01Ap
r202
1
01M
ay20
21
01Ju
n202
1
01Ju
l202
1
01Au
g202
1
01Se
p202
1
01O
ct20
21
01N
ov20
21
% p
osiv
itiy
-7-d
ay a
vera
ge
Date
0 to 17 18 to 34 35 to 64 65+
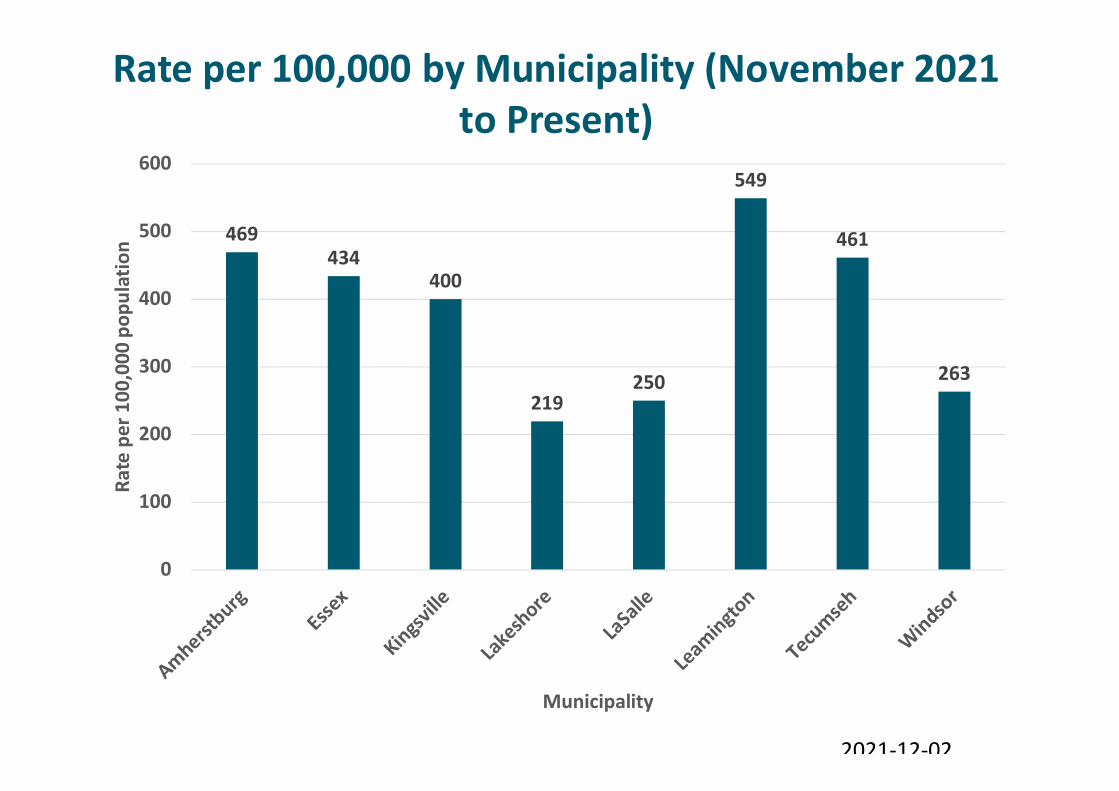
Rate per 100,000 by Municipality (November 2021to Present)
2021-12-02
469434
400
219250
549
461
263
0
100
200
300
400
500
600
Rate
per
100
,000
pop
ulat
ion
Municipality

Distribution of COVID-19 Cases by Municipalityin last 30 days (November 1 to November 30)
2021-12-02
Amherstburg8%
Essex7%
Kingsville7%
Lakeshore6%
LaSalle6%
Leamington12%
Tecumseh8%
Windsor46%

Distribution of COVID-19 Cases by Municipalityin last 7 days (November 17 to November 30)
2021-12-02
Amherstburg9%
Essex6%
Kingsville8%
Lakeshore6%
LaSalle6%
Leamington13%
Tecumseh6%
Windsor46%

Age & Sex Distribution
2021-12-02
23%
10%
17%
16%14%
10%
6%
3%
47%
52%
16%
22%
16%14% 13%
9%5% 6%
52%
48%
0%
10%
20%
30%
40%
50%
60%
0 to 19years
20 to 29years
30 to 39years
40 to 49years
50 to 59years
60 to 69years
70 to 79years
80+years
Male Female
% o
f CO
VID-
19 ca
ses
Last Two Weeks Overall

Source of Acquisition (November to Present)
2021-12-02
31.6%
28.6%
20.4%
7.3%
1.5%
10.6%
0.0%
5.0%
10.0%
15.0%
20.0%
25.0%
30.0%
35.0%
Community HouseholdContact
Close Contact Outbreak Travel UnderInvestigation
% o
f cas
es
Exposure Type

Epidemic Curve of School-Aged Cases
2021-12-02
0
5
10
15
20
25
30
3/22
/202
0
4/22
/202
0
5/22
/202
0
6/22
/202
0
7/22
/202
0
8/22
/202
0
9/22
/202
0
10/2
2/20
20
11/2
2/20
20
12/2
2/20
20
1/22
/202
1
2/22
/202
1
3/22
/202
1
4/22
/202
1
5/22
/202
1
6/22
/202
1
7/22
/202
1
8/22
/202
1
9/22
/202
1
10/2
2/20
21
11/2
2/20
21
# of
CO
VID-
19 ca
ses
Reported Date
# School-Aged Cases School-aged 7-day average

7-Day Average Comparison Between School-Aged Children & Overall Windsor-Essex
Population
2021-12-02
024681012141618
0
50
100
150
200
250
3/22
/202
0
4/22
/202
0
5/22
/202
0
6/22
/202
0
7/22
/202
0
8/22
/202
0
9/22
/202
0
10/2
2/20
20
11/2
2/20
20
12/2
2/20
20
1/22
/202
1
2/22
/202
1
3/22
/202
1
4/22
/202
1
5/22
/202
1
6/22
/202
1
7/22
/202
1
8/22
/202
1
9/22
/202
1
10/2
2/20
21
11/2
2/20
21
# of
SCH
OO
L-AG
ED c
ases
: 7-d
ay a
vera
ge
# of
OVE
RVAL
L cas
es: 7
-day
ave
rage
Reported Date
Overall 7-day average School-aged 7-day average

COVID-19 In-Patient Hospitalizations
2021-12-02
0
20
40
60
80
100
120
0
500
1,000
1,500
2,000
2,500
3,000
26/M
ar/2
0
26/A
pr/2
0
26/M
ay/2
0
26/J
un/2
0
26/J
ul/2
0
26/A
ug/2
0
26/S
ep/2
0
26/O
ct/2
0
26/N
ov/2
0
26/D
ec/2
0
26/J
an/2
1
26/F
eb/2
126
/Mar
/21
26/A
pr/2
1
26/M
ay/2
1
26/J
un/2
1
26/J
ul/2
1
26/A
ug/2
1
26/S
ep/2
1
26/O
ct/2
1
26/N
ov/2
1 # of
CO
VID-
19 ca
ses h
ospi
taliz
ed (W
inds
or-E
ssex
)
# of
CO
VID-
19 ca
ses h
ospi
taliz
ed (O
ntar
io)
Ontario Windsor-Essex

COVID-19 ICU
2021-12-02
0
5
10
15
20
25
30
0
100
200
300
400
500
600
700
800
900
29/M
ar/2
0
29/A
pr/2
0
29/M
ay/2
0
29/J
un/2
0
29/J
ul/2
0
29/A
ug/2
0
29/S
ep/2
0
29/O
ct/2
0
29/N
ov/2
0
29/D
ec/2
0
29/J
an/2
1
28/F
eb/2
1
31/M
ar/2
1
30/A
pr/2
1
31/M
ay/2
1
30/J
un/2
1
31/J
ul/2
1
31/A
ug/2
1
30/S
ep/2
1
31/O
ct/2
1
# of
CO
VID-
19 ca
ses i
n IC
U (W
inds
or-E
ssex
)
# of
CO
VID-
19 ca
ses i
n IC
U (O
ntar
io)
Ontario Windsor-Essex

Weekly Vaccination Case Rates (November 22 toNovember 28, 2021)
2021-12-02
Relative risk = 3.4. Unvaccinated cases are 3.4 times more likely to acquire COVID-19compared to those fully vaccinated
244.3
72.3
0.0
50.0
100.0
150.0
200.0
250.0
300.0
Unvaccinated Fully Vaccinated
Rate
per
100
,000
pop
ulat
ion

Weekly Vaccination Rates of In-PatientHospitalized Cases (November 22 to November
28, 2021)
2021-12-02
Relative risk = 6.0. Unvaccinated cases are 6.0 times more likely to be hospitalized forCOVID-19 compared to those fully vaccinated
19.2
3.2
0.0
5.0
10.0
15.0
20.0
25.0
Unvaccinated Fully Vaccinated
Rate
per
100
,000
pop
ulat
ion

2021-12-02
Weekly Vaccination Rate of ICU Cases(November 22 to November 28, 2021)
Relative risk = 4.8. Unvaccinated cases are 4.8 times more likely to be hospitalized inthe ICU for COVID-19 compared to those fully vaccinated
3.0
0.6
0.0
0.5
1.0
1.5
2.0
2.5
3.0
3.5
Unvaccinated Fully Vaccinated
Rate
per
100
,000
pop
ulat
ion

Doubling Time (Day over Day Comparison)
2021-12-02
1
20
400
800028
-Mar
28-A
pr
28-M
ay
28-J
un
28-J
ul
28-A
ug
28-S
ep
28-O
ct
28-N
ov
28-D
ec
28-J
an
28-F
eb
31-M
ar
30-A
pr
31-M
ay
30-J
un
31-J
ul
31-A
ug
30-S
ep
31-O
ct
Doub
ling
Tim
e (lo
g10)
Reported Date
ONT Doubling TimeWECHU Doubling TimeCanada Doubling Time

Median R0 (Effective)
2021-12-02
0
0.5
1
1.5
2
2.5
3
3/24
/202
0
4/24
/202
0
5/24
/202
0
6/24
/202
0
7/24
/202
0
8/24
/202
0
9/24
/202
0
10/2
4/20
20
11/2
4/20
20
12/2
4/20
20
1/24
/202
1
2/24
/202
1
3/24
/202
1
4/24
/202
1
5/24
/202
1
6/24
/202
1
7/24
/202
1
8/24
/202
1
9/24
/202
1
10/2
4/20
21
11/2
4/20
21
Mea
n R0
Date of Symptom Onset

COVID-19 Vaccine Status
2021-12-02

Number of Vaccine Doses Administered Daily toWindsor-Essex Residents (October to Present)
2021-12-02
0
500
1000
1500
2000
2500
3000#
of d
oses
adm
inist
ered
dai
ly
Dose 1 Dose 2 Dose 3

WEC Residents Vaccinated With At Least OneDose by Age Group
2021-12-02
12.8%
78.6%73.8%
79.7%
88.3% 89.0% 88.1%91.4%
94.7% 99.9%
86.8%80.9%
77.2%
0.0%
10.0%
20.0%
30.0%
40.0%
50.0%
60.0%
70.0%
80.0%
90.0%
100.0%
% o
f age
gro
up v
acci
nate
d w
ith a
t lea
st 1
dos
e

WEC Residents Fully Vaccinated by Age Group
2021-12-02
0.0%
73.8%69.8%
75.2%
83.7% 85.7% 85.8%89.8%
93.3%97.3%
83.7%77.0%
73.5%
0.0%
10.0%
20.0%
30.0%
40.0%
50.0%
60.0%
70.0%
80.0%
90.0%
100.0%%
of W
EC re
side
nts f
ully
vac
cina
ted

Vaccine Coverage in WEC by Forward Sortation AreaWith at Least 1 Dose Administered (all residentsincluding children)
2021-12-02
0.0%
10.0%
20.0%
30.0%
40.0%
50.0%
60.0%
70.0%
80.0%
90.0%
N0P
N0R
N8H
N8M N8N N8P
N8R N8S
N8T
N8W N8X N8Y
N9A N9B N9C N9E
N9G
N9H N9J
N9K
N9V N9Y
Hots
pot
Ove
rall
% o
f pop
ulat
ion
vacc
inat
ed w
ith a
t lea
st 1
dose

Fully Vaccinated Coverage Rates by ForwardSortation Area in Windsor-Essex County (all residentsincluding children)
2021-12-02
0.0%
10.0%
20.0%
30.0%
40.0%
50.0%
60.0%
70.0%
80.0%
90.0%N
0PN
0RN
8HN
8M N8N N8P
N8R N8S
N8T
N8W N8X N8Y
N9A N9B N9C N9E
N9G
N9H N9J
N9K
N9V N9Y
Hots
pot
Ove
rall
% o
f pop
ulat
ion
fully
vac
cina
ted
with
2 d
oses

Percentage of Residents 5+ With At Least 1 Doseby Public Health Unit
2021-12-02
70.0%72.0%74.0%76.0%78.0%80.0%82.0%84.0%86.0%88.0%90.0%92.0%
LGLD
Nor
thw
este
rnKF
L&A
Ott
awa
Mid
dles
ex-L
ondo
nDu
rham
Halto
nTo
ront
oTh
unde
r Bay
Peel
WD
GW
ater
loo
York
Sudb
ury
Algo
ma
HKPR
East
ern
Pete
rbor
ough
Nia
gara
NBP
SBr
ant
Ham
ilton
Sim
coe
Mus
koka
Porc
upin
eW
inds
or-E
ssex
HPEC
Huro
n-Pe
rth
Chat
ham
-Ken
tTi
mis
kam
ing
Renf
rew
Lam
bton
Hald
iman
d-N
orfo
lkSo
uthw
este
rnG
rey
Bruc
e
% o
f pop
ulat
ion
5+ w
ith a
t lea
st 1
dos
e
PHU Ontario

Percentage of Residents 5+ Fully Vaccinated byPublic Health Unit
2021-12-02
68.0%
70.0%
72.0%
74.0%
76.0%
78.0%
80.0%
82.0%
84.0%
86.0%
88.0%
LGLD
Nor
thw
este
rnKF
L&A
Ott
awa
Halto
nM
iddl
esex
-Lon
don
Durh
amTo
ront
oPe
elW
DG
York
HKPR
Thun
der B
ayPe
terb
orou
ghW
ater
loo
Sudb
ury
East
ern
Nia
gara
Algo
ma
NBP
SSi
mco
e M
usko
kaHa
milt
onBr
ant
Huro
n-Pe
rth
Win
dsor
-Ess
exHP
ECPo
rcup
ine
Chat
ham
-Ken
tTi
mis
kam
ing
Renf
rew
Lam
bton
Sout
hwes
tern
Gre
y Br
uce
Hald
iman
d-N
orfo
lk
% o
f res
iden
ts 5
+ fu
lly v
acci
nate
d
PHU Ontario
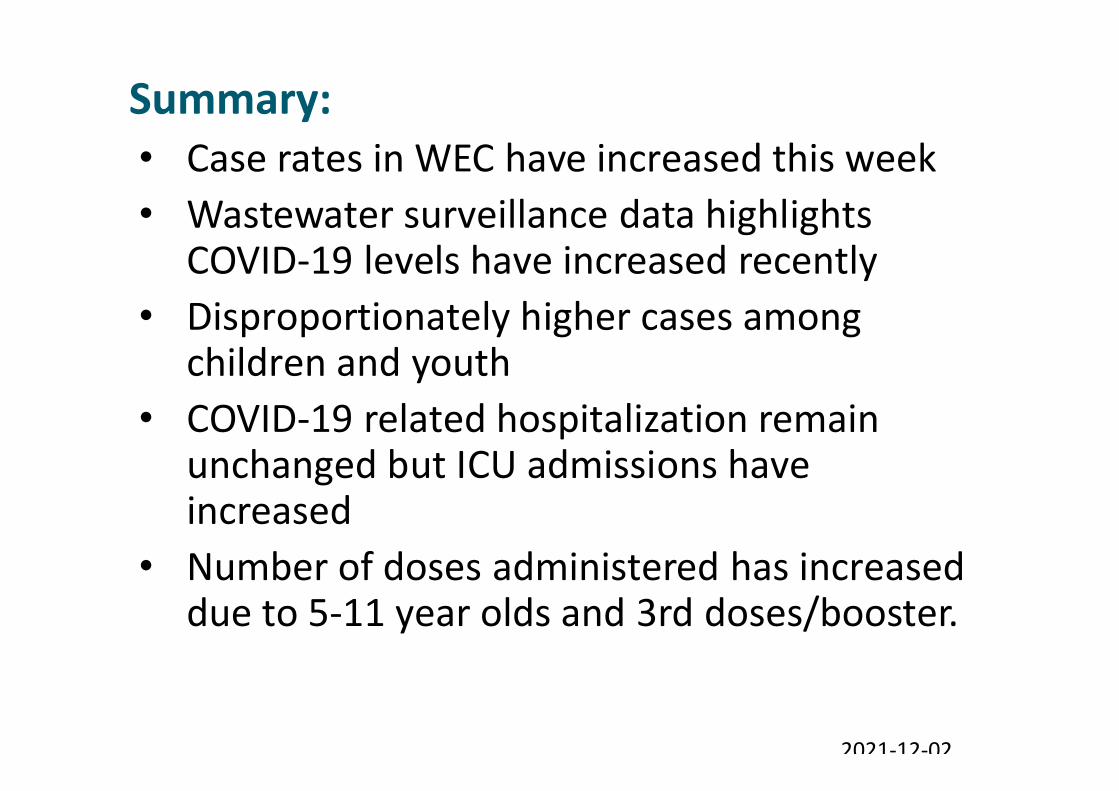
Summary:• Case rates in WEC have increased this week• Wastewater surveillance data highlights
COVID-19 levels have increased recently• Disproportionately higher cases among
children and youth• COVID-19 related hospitalization remain
unchanged but ICU admissions haveincreased
• Number of doses administered has increaseddue to 5-11 year olds and 3rd doses/booster.
2021-12-02
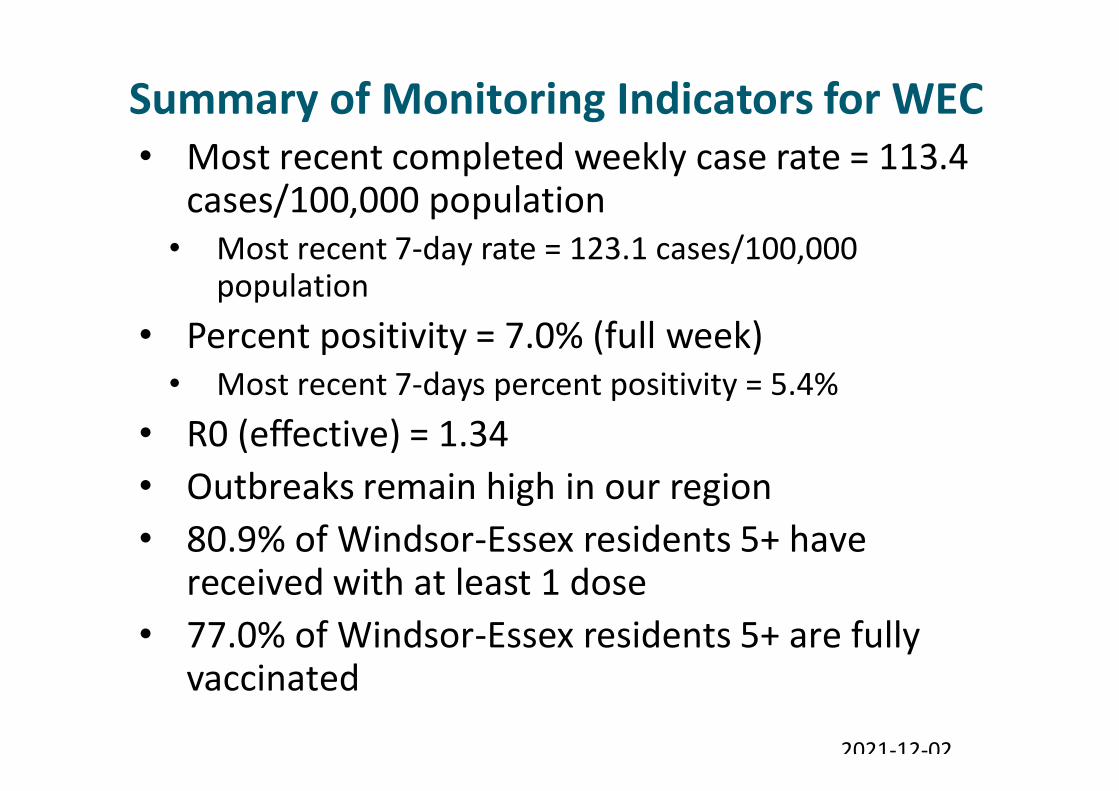
Summary of Monitoring Indicators for WEC• Most recent completed weekly case rate = 113.4
cases/100,000 population• Most recent 7-day rate = 123.1 cases/100,000
population• Percent positivity = 7.0% (full week)• Most recent 7-days percent positivity = 5.4%
• R0 (effective) = 1.34• Outbreaks remain high in our region• 80.9% of Windsor-Essex residents 5+ have
received with at least 1 dose• 77.0% of Windsor-Essex residents 5+ are fully
vaccinated
2021-12-02