Embed Size (px)
Citation preview


May 23, 2016
MaryJo Feuerbach USEPA Region 1 5 Post Office Square Suite 100 Mail Code OEP06-1 Boston, Massachusetts 02109-3912
Mario Paula USEPA Region 2 CEPB 290 Broadway New York, New York 10007
Eric Howe, Ph.D. Technical Coordinator Lake Champlain Basin Program 54 West Shore Road Grand Isle, Vermont 05458
Mike Jennings NEIWPCC Wannalancit Mills 650 Suffolk Street, Suite 410 Lowell, Massachusetts 01854
Dear MaryJo, Mario, Eric, and Mike,
On behalf of the New York State Department of Environmental Conservation and the Vermont Department of Environmental Conservation, I have enclosed for your review and appropriate action version 1.4 of the 2016 Quality Assurance Project Plan (QAPP) for the Lake Champlain Basin Program (LCBP) Lake Champlain Long-Term Water Quality and Biological Monitoring Project (LTMP). The scope of work, along with procedures, protocols, and methods remains consistent with prior year’s approved project plans. Significant updates are enumerated below:
1. With the retirement of Eric Smeltzer from Vermont DEC, Angela
Shambaugh has assumed the role of Vermont DEC Project Manager.
2. MaryJo Feuerbach is now the EPA Region 1 LCBP Project Manager. 3. Dr Nora Conlon is now the EPA Region 1 Project QA/QC Officer. 4. Jane Ceraso is now the NEIWPCC LCBP Project Officer.
5. Michaela Stickney has moved on from her role as LCBP Vermont State
Coordinator, with Bethany Sargent being named to fill this role.

6. The Vermont DEC laboratory has been re-designated as the Vermont Agriculture and Environmental Laboratory. Analytical methods and QA/QC process remain unchanged.
7. A new stream gauge will be installed on Stevens Brook in the St. Albans
Bay watershed to support MS4 activities in St. Albans City. This gauge will be upstream of the USGS gauge presently used for the Long-term monitoring project. VTDEC will develop a model to predict flow at the current USGS gauge using the new MS4 gauge to evaluate its suitability to support developing tributary loading estimates. It is anticipated a predictive model will be developed allowing the currently utilized gauge to be removed. (10.3)
8. An analysis on the level of precision obtained from 13 high flow biased
sampling events on each tributary will be conducted and reported on with the 2016 field season reporting. The results will then inform work for the 2017 field season. (10.4)
9. The number of lake stations and water samples collected for analyses of
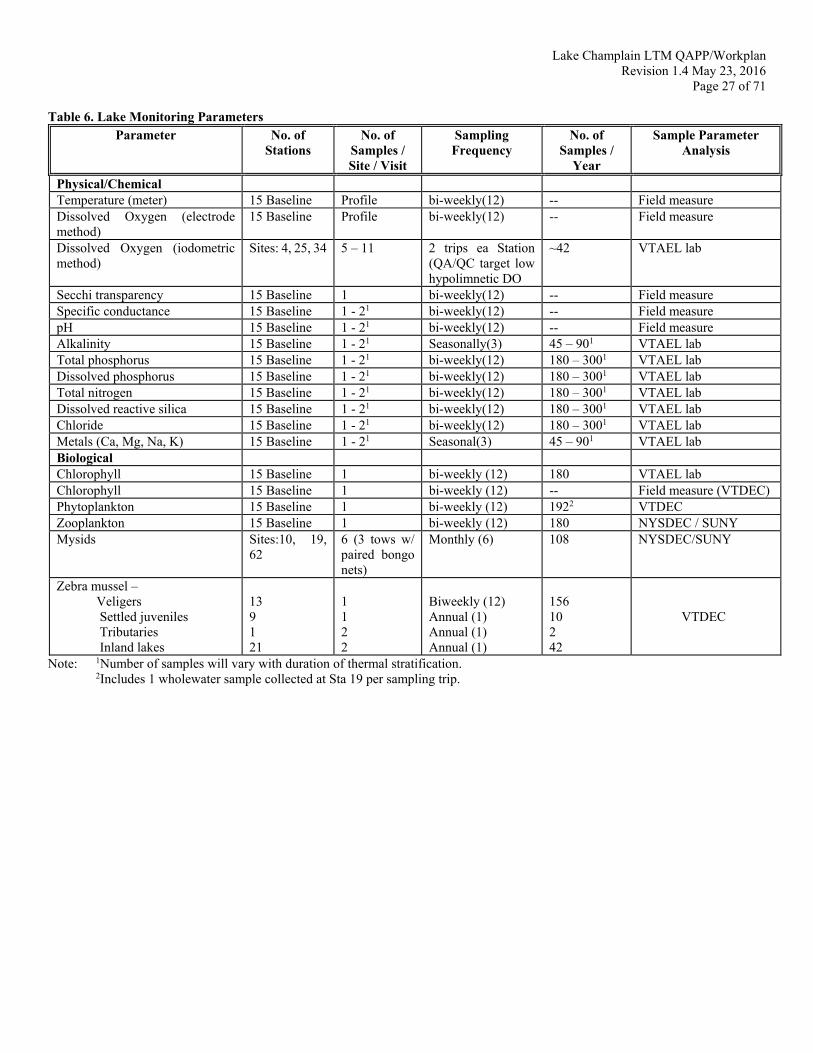
dissolved oxygen utilizing the modified Winkler method as a QA check on the LDO probes will be reduced based on excellent correlation of data between the two methods. This will result in savings in both time and cost. (11.1, Figure 8, and Table 6)
Other changes are largely editorial in nature and do not alter the scope of this project. Hyperlinks have been updated as necessary. If you have questions regarding this, you may contact either myself at (518)
897-1241 or Angela Shambaugh at (802) 490-6130. You may also email us at [email protected] and [email protected]. Please let us know if you require clarifications or modifications to this for approval.
Sincerely;
Fredric Dunlap NY Lake Champlain Basin Coordinator Enclosure Attachment c: Angela Shambaugh

Lake Champlain LTM QAPP/Workplan Revision 1.4 May 23, 2016
Page 1 of 71
1.0 Title & Approvals LONG-TERM WATER QUALITY AND BIOLOGICAL MONITORING
PROJECT FOR LAKE CHAMPLAIN 2016 Quality Assurance Project Plan
PREPARED BY
VERMONT DEPARTMENT OF ENVIRONMENTAL CONSERVATION
WATERSHED MANAGEMENT DIVISION
NEW YORK STATE DEPARTMENT OF ENVIRONMENTAL CONSERVATION DIVISION OF WATER
PREPARED FOR
LAKE CHAMPLAIN BASIN PROGRAM
P. O. BOX 204 54 WEST SHORE ROAD
GRAND ISLE, VERMONT 05458
Angela Shambaugh, Project Manager, VTDEC
Date
Fred Dunlap, Project Manager, NYSDEC
Date
Dan Needham, Project QA/QC Officer, VAEL
Date
Rose Ann Garry, QA/QC Officer, NYSDEC DOW (Delegated by EPA Region 2)
Date
MaryJo Feuerbach, Project Officer, EPA Region 1
Date
Mario Paula, Project Officer, EPA Region 2
Date
Nora Conlon, Ph.D., QA/QC Officer, EPA Region 1
Date
Mike Jennings, NEIWPCC
Date
Eric Howe, Ph.D., Technical Coordinator, LCBP Date

Lake Champlain LTM QAPP/Workplan Revision 1.4 May 23, 2016
Page 2 of 71
2.0 Table of Contents 1.0 Title & Approvals ................................................................................................................................................................................ 1 2.0 Table of Contents ................................................................................................................................................................................. 2 3.0 Distribution List ................................................................................................................................................................................... 4 4.0 Task/Organization ................................................................................................................................................................................ 5 5.0 Problem Definition/Background .......................................................................................................................................................... 6 6.0 Project Purpose/Task Description ....................................................................................................................................................... 7 7.0 Data Quality Objectives for Measurement Data ................................................................................................................................ 11 8.0 Training Requirements/Certifications ................................................................................................................................................ 11 9.0 Documentation and Records .............................................................................................................................................................. 11 10.0 Sampling Process Design ................................................................................................................................................................. 12 11.0 Sampling Methods Requirements .................................................................................................................................................... 25 12.0 Sample Handling and Custody Requirements .................................................................................................................................. 32 13.0 Analytical Methods Requirements ................................................................................................................................................... 32 14.0 Quality Control Requirements ......................................................................................................................................................... 36 15.0 Instrument/Equipment Testing, Inspection, and Maintenance Requirements .................................................................................. 38 16.0 Instrument Calibration and Frequency ............................................................................................................................................. 39 17.0 Inspection and Acceptance Requirements for Supplies ................................................................................................................... 40 18.0 Non-direct measurements ................................................................................................................................................................ 41 19.0 Data Management ............................................................................................................................................................................ 42 20.0 Assessments and Response Actions ................................................................................................................................................. 43 21.0 Reports ............................................................................................................................................................................................. 44 22.0 Data Review, Validation, and Verification Requirements ............................................................................................................... 45 23.0 Validation and Verification Methods ............................................................................................................................................... 45 24.0 Reconciliation with Data Quality Objectives ................................................................................................................................... 45 25.0 Budget .............................................................................................................................................................................................. 46 Notes: ....................................................................................................................................................................................................... 46 26.0 References ........................................................................................................................................................................................ 47 Appendix A. Laboratory Methods for Biological Samples ...................................................................................................................... 49 Appendix B: Data review procedures ...................................................................................................................................................... 54 Appendix C. Project data forms ............................................................................................................................................................... 56 Appendix D. Rock River Monitoring Program 2014 Quality Assurance Project Plan ............................................................................ 60

Lake Champlain LTM QAPP/Workplan Revision 1.4 May 23, 2016
Page 3 of 71
2.1 List of Tables Table 1. Phosphorus and pelagic food web indicators that will be developed from data collected by the LTMP ..................................... 7 Table 2. Project Schedule Timeline ......................................................................................................................................................... 10 Table 3. Lake sampling locations and total station depths ....................................................................................................................... 14 Table 4. List of lake and tributary sampling station locations and total river drainage areas. ................................................................. 16 Table 5. Openwater and nearshore sampling site locations for zebra mussel and mysid monitoring in Lake Champlain ....................... 19 Table 6. Lake Monitoring Parameters ...................................................................................................................................................... 27 Table 7. Summary of processing, preservation, and storage containers for water quality parameters ..................................................... 28 Table 8. Tributary monitoring parameters ............................................................................................................................................... 31 Table 9. Analytical procedures for parameters and field measurements .................................................................................................. 32 Table 10. Parameter table for biological monitoring ............................................................................................................................... 35 Table 11. Quality assurance information for analytes .............................................................................................................................. 36 Table 12. Field data quality objectives for veliger, settled juvenile and adult density duplicate samples for zebra mussels .................. 37 Table 13. Laboratory data quality objectives for veliger, season settled juvenile and adult density duplicate samples for zebra mussels ................................................................................................................................................................................................................. 37 Table 14. Data quality objectives for phytoplankton analyses ................................................................................................................. 37 Table 15. Water quality sampling equipment .......................................................................................................................................... 39 Table 16. Biological sampling equipment ............................................................................................................................................... 39 Table 17. Calibration frequency, procedures, standards and acceptance criteria for major measurement systems ................................. 40 2.2 List of Figures Figure 1. Lake Champlain Basin Location ................................................................................................................................................ 9 Figure 2. Location of lake and tributary sampling stations. ..................................................................................................................... 13 Figure 3. Detecting change in total phosphorus concentration in Lake Champlain ................................................................................. 15 Figure 4. Precision of mean total phosphorus loading estimates as a function of sample size for the Missisquoi River ......................... 17 Figure 5. Open-water and nearshore sampling site locations for Lake Champlain zebra mussel and mysid sampling ........................... 21 Figure 6. Inland lake and tributary sampling site locations for zebra mussels ......................................................................................... 22 Figure 7. Spiny Waterflea Distribution in the Great Lakes and other NY waters .................................................................................... 24 Figure 8. Comparison of Winkler and LDO methods for Dissolved Oxygen .......................................................................................... 25

Lake Champlain LTM QAPP/Workplan Revision 1.4 May 23, 2016
Page 4 of 71
3.0 Distribution List Distribution List
QAPP recipient Title Organization Phone Email MaryJo Feuerbach EPA 1 Project Coordinator EPA Region I 617-918-1578 [email protected] Nora Conlon, Ph.D. EPA 1 QA Officer EPA Region I 781-918-8335 [email protected] Mario Paula EPA 2 Project Coordinator EPA Region II 212-637-3819 [email protected] Mike Jennings NEIWPCC QA Officer NEIWPCC 978-323-7929 [email protected] Jane Ceraso NEIWPCC Project Officer NEIWPCC 978-349-2508 [email protected] Angela Shambaugh VT Project Manager VTDEC 802-490-6131 [email protected] Fred Dunlap NY Project Manager NYSDEC 518-897-1241 [email protected] Bethany Sargent VT Lake Champlain Coordinator VTDEC 802-490-6131 [email protected] Eric Howe LCBP Technical Coordinator LCBP 802-372-3213 [email protected] Dan Needham VAEL QA Officer VTDEC 802-585-9707 [email protected] Rose Ann Garry NY QA Officer NYSDEC Division of Water 518-402-8159 [email protected] Tim Mihuc LCRI Director LCRI-SUNY 518-564-3038 [email protected] Luke Myers LCRI Field/Lab Manager LCRI-SUNY 518-564-3044 [email protected] Pete Stangel NEIWPCC Environmental Analyst VTDEC 802-490-6132 [email protected]

Lake Champlain LTM QAPP/Workplan Revision 1.4 May 23, 2016
Page 5 of 71
Project Management NYSDEC – VTDEC
Project Managers
Angela Shambaugh, VTDEC Fred Dunlap, NYSDEC
Approval Authority EPA Region 1 & 2
Project Coordinators
MaryJo Feuerbach, EPA 1 Mario Paula, EPA 2
Project Management QA/QC
Project QA/QC Officers Dan Needham, VAEL
Rose Ann Garry, NYSDEC
Vermont Project Team Field Sampling, Biological Analysis
Pete Stangel, VTDEC
Angela Shambaugh, VTDEC
Water Chemistry Analysis VT Agriculture and Environmental
Laboratory (VAEL)
T. Guy Roberts Laboratory Director, VAEL
New York Project Team Field Sampling, Biological Analysis
Tim Mihuc, Ph.D., Director
Luke Myers, Field/Lab Manager Lake Champlain Research Institute
(LCRI) at SUNY Plattsburgh
Lake Champlain Basin Oversight Lake Champlain Basin Program
LCBP Technical Advisory Committee
LCBP Technical Coordinator
Eric Howe, Ph.D.
Approval Authority QA/QC EPA Region 1 & 2
NEIWPCC
Project QA/QC Officers Nora Conlon, Ph.D., EPA 1
Carol Lynes, EPA 2 Mike Jennings, NEIWPCC
4.0 Task/Organization Project Organization

Lake Champlain LTM QAPP/Workplan Revision 1.4 May 23, 2016
Page 6 of 71
5.0 Problem Definition/Background Lake Champlain is one of the largest lakes in the United States and is often called the "Sixth Great Lake". Stretching 120 miles, it forms the boundary between New York and Vermont (Figure 1). The contributing watershed area of approximately 8,200 square miles spans from the Adirondack Mountains of New York to the Green Mountains of Vermont and into the Province of Quebec, Canada. Lake Champlain provides the public with many opportunities for recreation including swimming, fishing, bird watching, etc. It serves as a source of drinking water for communities, such as the City of Burlington. Lake Champlain receives treated wastewater from municipal and industrial sources, and non-point runoff from agricultural and urban sources. These sources, among others, can contribute to existing or potential water quality problems within the lake system. For instance, some problems being addressed are eutrophication, toxic substances, algal blooms, fish contamination, low dissolved oxygen, etc. The presence of aquatic invasive species including Eurasian watermilfoil, water chestnut, zebra mussels, and most recently, spiny water flea exert pressures on the Lake’s ecosystem. Nearby threats include asian clam, quagga mussels, round goby, and hydrilla among others. Chemical and biological data was collected at many locations in Lake Champlain during the 1970's and earlier (Myer and Gruendling 1979). These early studies provide good historical baseline data, but are limited in parameter coverage and seasonal and spatial extent. In many cases, measurements of major nutrients were not made concurrently with the biological samples, and, therefore ecological interrelationships could not be established. Since 1979, the Vermont Lay Monitoring Program has provided lake-wide monitoring of parameters related to eutrophication during the summer season. Citizen volunteers are recruited and use a consistently applied methodology. Information about this program and data are available at the VTDEC Volunteer monitoring website: http://dec.vermont.gov/watershed/lakes-ponds/monitor/lay-monitoring The most extensive monitoring programs on Lake Champlain are the Lake Champlain Diagnostic-Feasibility Study (Vermont DEC and New York State DEC, 1997), the Long-Term Water Quality and Biological Monitoring Project for Lake Champlain (Vermont DEC and New York State DEC, 1998; Smeltzer et al, 2009; Smeltzer et al, 2012; Mihuc et al, 2012), and the Lake Champlain Biomonitoring Program conducted by the Vermont Water Resources and Lake Studies Center (Brown et al., 1992, 1993). Water Quality Monitoring: Detecting changes and trends in water quality is a primary purpose of monitoring. Water quality monitoring is important to document environmental change in Lake Champlain, both to check ecosystem health and assess compliance with regulatory standards. Monitoring can provide evidence of water quality deterioration and help initiate corrective actions. Water quality monitoring is needed to demonstrate the effectiveness of pollution reduction efforts made by management programs, and evaluate phosphorus loadings set by the TMDL. Biological Monitoring: Biological monitoring (biomonitoring) improves our knowledge of the response of aquatic ecosystems to changes in water quality conditions by providing a direct measure of aquatic community status. Aquatic communities integrate all aspects of seasonal and spatial variability in their environment and provide a more sensitive index of environmental change than water quality monitoring alone. Biomonitoring can serve as an "early warning" indicator by providing data and insights into biological changes and long term indications of significant changes

Lake Champlain LTM QAPP/Workplan Revision 1.4 May 23, 2016
Page 7 of 71
in system function or potential resource utilization. The Lake Champlain Basin Program Technical Advisory Committee supports the long term water quality and biological monitoring program and affirms that it should continue to focus on collecting information to track and evaluate management programs and assess progress toward achieving the phosphorus TMDL.
6.0 Project Purpose/Task Description 6.1. Objectives of Project Long term water quality and biological monitoring is necessary to detect environmental change in Lake Champlain. Environmental indicators, monitoring stations, monitoring frequencies, and sampling procedures have been selected for this purpose. Also, statistical considerations were applied to optimize the design of the monitoring program. The project will maintain a database and serve as the basis for establishing water quality, biological community, and lake environmental health relationships. Also, the Long Term Water Quality and Biological Monitoring Project for Lake Champlain (hereafter the LTMP) will support the Lake Champlain Basin Program’s Adaptive Management Process and Structured Decision-Making Framework, which both grew from an earlier Ecosystem Indicators Program. The Ecosystem Indicators Program developed a suite of indicators in the pressure-state-response (PSR) framework that was intended to describe the condition of the lake and track the effectiveness of management actions. The PSR framework is based on the premise that human activities exert pressures on the ecosystem that affect the state of the ecosystem. In response to a detrimental condition or trend in the lake, management actions and policies can be developed to reduce the pressures. Ecosystem Indicators are used to develop a scorecard that is embedded in the State of the Lake reports and are available to inform the public and lake managers (Table 1). Table 1. Phosphorus and pelagic food web indicators that will be developed from data collected by the LTMP
Indicator Supporting Measures
Phosphorus in lake water Annual mean total phosphorus concentration in each lake segment, and long-term trends.
Phosphorus in tributaries Mean total phosphorus loads for each tributary (reported for two-year intervals) and long-term trends.
Chlorophyll-a in lake water Annual mean chlorophyll-a concentration in each lake segment, and frequency of algae blooms.
Dissolved oxygen in lake water Hypolimnetic dissolved oxygen concentrations in deep lake segments, and long-term trends.
Phosphorus in wastewater discharges Annual phosphorus loads from each treatment facility, summarized by state/province and by lake segment subwatershed.
Nitrogen to phosphorus ratios Annual mean total nitrogen to total phosphorus ratios in each lake segment.
New exotic species Number of new invasive exotic species detected each year (phytoplankton, zooplankton, fish, vascular plants).
Phytoplankton community Taxonomic composition and relative abundance of major groups. Percent potential toxin-producing cyanobacteria.
Zooplankton community Taxonomic composition and relative abundance. Average size of zooplankton. Ratio of phytoplankton biomass to zooplankton biomass.
A secondary purpose of the LTMP is to support the Rock River Watershed Targeted Best Management Practice (BMP) Implementation Project which was initiated in 2010 by VT DEC. The purpose of the Rock River project

Lake Champlain LTM QAPP/Workplan Revision 1.4 May 23, 2016
Page 8 of 71
is to demonstrate water quality improvements resulting from focused agricultural BMP implementation in a small watershed known to contribute very high phosphorous loadings to Lake Champlain. Water quality monitoring in the Rock River watershed will provide before-and-after water quality data on the effects of BMP implementation. The Rock River Monitoring Program is currently supported by the Lake Champlain Basin Program. The ultimate duration of the Rock River monitoring program is not yet determined. Several years of post-BMP implementation data will be required to evaluate BMP effectiveness. A separate QAPP for this effort is included in Appendix D. 6.2. Intended Uses of Data Statistically reliable water quality trend information generated by the LTMP may be utilized by a various audiences and for many purposes, such as providing general information to the public, supporting additional research projects, or helping to direct management efforts. The principal investigators, the states of New York and Vermont, may use the data to help develop and support policy and management decisions, and to evaluate TMDL implementation. Additionally, data may help narrow and identify nutrient sources. Subsequently, this will help target resources for nutrient reductions. The project may be deemed successful if the objectives and data quality indicators, (precision, accuracy, representativeness, completeness, comparability, and sensitivity) are met. Data generated by this project will be evaluated and presented as an indicators scorecard developed by the LCBP. The scorecard will assess the condition and trends in the lake ecosystem. Multiple parameters monitored through this project include phosphorus concentrations, chlorophyll-a, nitrogen concentrations in the water column, and the composition and abundance of phytoplankton and zooplankton. These parameters will serve as indicators to assess pressures on the lake ecosystem, the condition of the lake and its response to management actions and policies. Data analyses for the development of the actual indicator values and scorecard presentations will be the shared responsibility of the Lake Champlain Basin Program staff, Technical Advisory Committee, and the LTMP personnel, and is beyond the scope of this QAPP.

Lake Champlain LTM QAPP/Workplan Revision 1.4 May 23, 2016
Page 9 of 71
Figure 1. Lake Champlain Basin Location

Lake Champlain LTM QAPP/Workplan Revision 1.4 May 23, 2016
Page 10 of 71
6.3 Project Schedule Table 2. Project Schedule Timeline
Task Jan Feb Mar Apr May Jun Jul Aug Sep Oct Nov Dec
Lake monitoring
Tributary monitoring1
Water chemistry analysis
Phytoplankton analysis
Zooplankton analysis
Zebra mussel analysis
Mysids analysis
Update work plan/ QAPP
Database management2
Project website updates3
Reporting Quarterly/Annual
Quarterly Annual Quarterly Quarterly
White = low activity, Light gray=moderate activity, Dark gray=high activity 1Event based sampling. Winter month sampling contingent on freeze/thaw cycles. 2 Download of data from VAEL Laboratory Information Management System, data review, update Access Database 3 Annually updated data made available in statistical summary, graphical and full tabular form on the project website

Lake Champlain LTM QAPP/Workplan Revision 1.4 May 23, 2016
Page 11 of 71
7.0 Data Quality Objectives for Measurement Data Data collected by the monitoring program are used to assess progress towards basin-wide water quality goals. The quality assurance program established for the LTMP specifies the criteria used to assess precision and accuracy of the data collected each year. These are discussed in detail in Section 14 and noted throughout this QAPP. Quality objectives and criteria for chemical analyses are documented in the Vermont Agriculture and Environmental Laboratory (formerly the Vermont DEC Laboratory) Quality Systems Manual (VAEL 2015; and noted throughout this QAPP.
8.0 Training Requirements/Certifications Many project team members have been involved in Lake Champlain basin monitoring on a continuous basis since the Diagnostic/Feasibility study was initiated in 1990. Project team members are professional career employees of the States of New York and Vermont Departments of Environmental Conservation working in the Water Quality and Watershed Management Divisions, respectively. Additionally, the SUNY team is supervised by Dr. Tim Mihuc who has an extensive background in biological sample collection and analyses. Team members are fully trained and experienced in ambient sample collection for both water chemistry and biological parameters. Staff remain up-to-date with equipment use and field protocols. No additional specialized training is necessary for the field aspects of this project. All temporary and seasonal staff associated with this project work under the supervision of project team members. VAEL personnel are supervised by the laboratory director, and meet the training/certification requirements specified by the Laboratory. Taxonomic expertise is required for the analysis of phytoplankton and zooplankton. Phytoplankton analyses will be conducted at the Vermont DEC by an experienced taxonomist with more than 15 years of experience with freshwater plankton from Lake Champlain. Zooplankton and mysids analyses will be conducted at the Lake Champlain Research Institute under the supervision of Dr. Timothy Mihuc.
9.0 Documentation and Records Current and identical versions (indicated by revision number and date) of the Quality Assurance Project Plan (QAPP) are maintained in both paper and electronic format by the two state project managers. Past years’ QAPPs are available in electronic format. Project field teams document field generated data on Field Log Sheets. NY field teams provide copies to the VT office and copies of all field sheets (VT and NY) reside in an archive in the Lakes and Ponds section of the Watershed Management Division, VT DEC. Copies of all NY field sheets and in-situ generated data are also maintained at the NYDEC Division of Water office in Ray Brook, NY. All data generated by participating laboratories are collected by the project managers in an electronic format that can be incorporated into the project master database. The project data is maintained by Vermont DEC and is stored in a Microsoft SQL Server 2005 database. Daily backup is provided, and copies of backup files are archived in separate locations. Database security features are employed to prevent editing or deletion of the original data by users other than the authorized database administrators. Copies of the current database are also available at the New York State DEC. The data are available to other government agencies, researchers, consultants, students, and the general public on request in

Lake Champlain LTM QAPP/Workplan Revision 1.4 May 23, 2016
Page 12 of 71
either electronic, paper copy form or on the web at: http://dec.vermont.gov/watershed/lakes-ponds/monitor/lake-champlain Graphical summaries of the data are made each year and posted on the website. Annual reports, program description and the current QAPP plan are also available through this site. Historical data summaries, reports, and project plans associated with this project are permanently archived and available in electronic format.
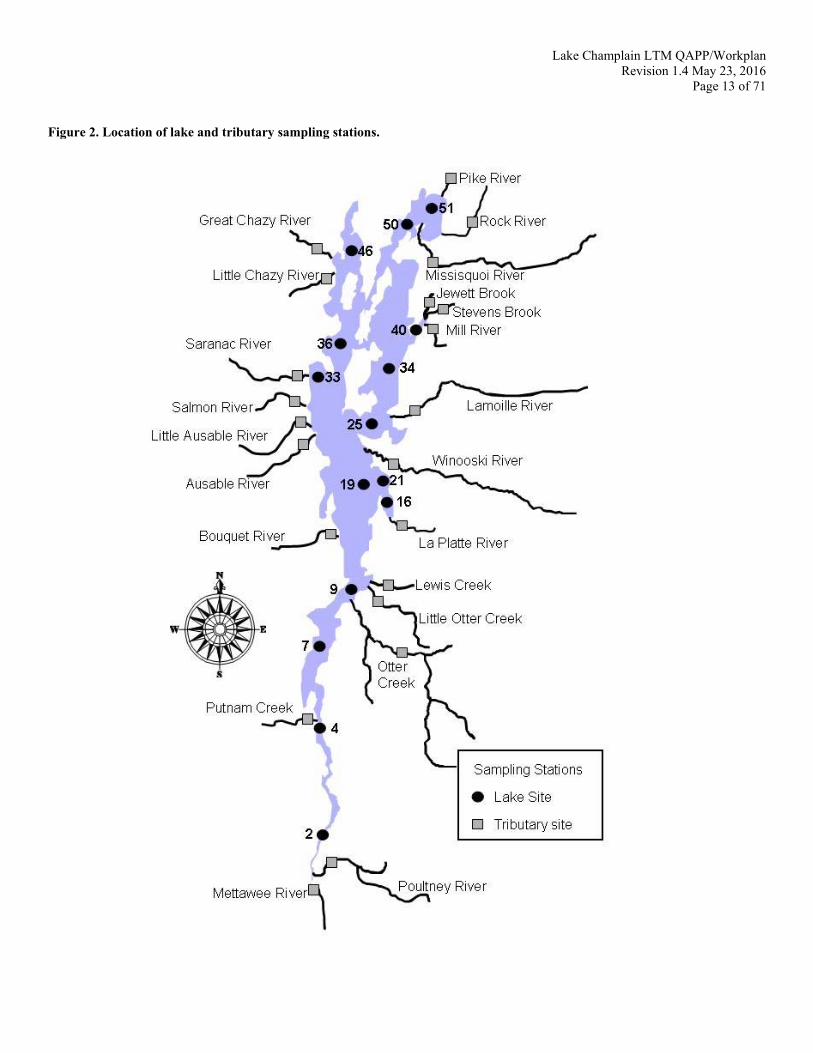
10.0 Sampling Process Design 10.1 Selection of Lake Station Locations The LTMP for Lake Champlain originally included lake monitoring at 12 lake stations (Nos. 2, 4, 7, 19, 21, 25, 33, 34, 36, 40, 46, 50) during the period 1992-2000 (Figure 2, Table 3). These stations were selected to represent major lake segments among which distinct water quality differences exist. Beginning in 2001, two lake water quality and biological sampling stations (9 and 16) were added. The Lake Monitoring Project Review Team of the Lake Champlain Basin Program determined that the program should include at least one sampling station in each of the 13 lake phosphorus management segments to track progress toward attaining the in-lake total phosphorus concentration criteria established for each lake segment. Lake stations for the Otter Creek and Shelburne Bay segments were added to provide sampling coverage for all lake segments with established phosphorus concentration criteria. (Lake Champlain Basin Program, 2003; Vermont DEC and New York State DEC, 2002). An additional lake water quality and biological sampling station (51) was added to the program in 2006. The Lake Champlain Bain Program’s Ecological Indicators Task Force recommended that an additional station be added in Missisquoi Bay to provide more complete spatial coverage and to better characterize water quality status and trends in this high priority lake segment. The in-lake phosphorus concentration criteria for Lake Champlain apply to central, open water locations in each lake segment. Station 51 was centrally located in Missisquoi Bay to provide data that is more consistent with the phosphorus criteria established for this lake segment. In summary, locations of the lake sampling stations were selected based on the following considerations:
• Include a centrally located station in each phosphorus management segment. • Avoid duplicating stations within lake areas where spatial water quality differences are small. • Avoid sites with strong, spatially shifting concentration gradients such as locations near river mouths or
in transition zones between adjoining segments. • Co-locate sites with stations that have been monitored historically by other programs such as the Vermont
Lay Monitoring Program and the Lake Champlain Diagnostic-Feasibility Study.
Lake Champlain LTM QAPP/Workplan Revision 1.4 May 23, 2016
Page 13 of 71
Figure 2. Location of lake and tributary sampling stations.

Lake Champlain LTM QAPP/Workplan Revision 1.4 May 23, 2016
Page 14 of 71
Table 3. Lake sampling locations and total station depths 1 Added beginning in 2001 2 Added beginning in 2006 10.2 Selection of Lake Sampling Frequency Lake sampling frequencies were determined so there is a reasonably high probability (power) of statistically detecting a meaningful environmental change over time, when such a change actually occurred (Green, 1989; Peterman, 1990). Using the procedure provided by Walker (1988), a power analysis was conducted for several lake chemical monitoring parameters to determine sampling frequencies that achieve an adequate power of detecting environmental change over time in Lake Champlain.. Because total phosphorus was considered to be the highest priority monitoring parameter, the power analysis focused on total phosphorus to determine optimum sampling frequencies. The procedure assumed that environmental change would be analyzed using a t-test for the difference in the mean phosphorus value between two time periods (e.g., a baseline period vs. a post-treatment period). Walker's (1988) procedure allows for a consideration of both within-year and between-year components of variance in lake sampling data. Within-day variance (i.e., variance of replicate samples obtained at the same station on the same day) is generally small relative to the within-year (date to date) and between-year variance components for common lake monitoring parameters (Knowlton et al., 1984), and was not included in the analysis. Lake Champlain monitoring data from the Lake Champlain Diagnostic-Feasibility Study (1990-1991) and the LTMP for Lake Champlain (1992-1993) were used to estimate the variance components for total phosphorus according to methods given in Walker (1988) and Smeltzer et al. (1989). The power analysis was conducted using the median values of the variance components across all lake stations. The power analysis requires specification of the magnitude of the environmental change to be detected. This is a somewhat arbitrary judgment, but it is an important specification because the required level of sampling effort and the program cost increase greatly as smaller change detection goals are considered. A minimum phosphorus change of 15% was specified for the power analysis, corresponding approximately to the phosphorus reduction needed for the Main Lake segment to comply with its water quality criterion value.
Station # Latitude N Longitude W Depth
(meters) 02 43° 42.89' 73° 22.98' 5 04 43° 57.10' 73° 24.47' 10 07 44° 07.56' 73° 24.77' 50 091 44° 14.53' 73° 19.75' 97 161 44° 25.55' 73° 13.92' 25 19 44° 28.26' 73° 17.95' 100 21 44° 28.49' 73° 13.90' 15 25 44° 34.92' 73° 16.87' 32 33 44° 42.07' 73° 25.09' 11 34 44° 42.49' 73° 13.61' 50 36 44° 45.37' 73° 21.30' 50 40 44° 47.12' 73° 09.73' 7 46 44° 56.90' 73° 20.40' 7 50 45° 00.80' 73° 10.43' 4 512 45° 02.50' 73° 07.78' 5

Lake Champlain LTM QAPP/Workplan Revision 1.4 May 23, 2016
Page 15 of 71
Larger reductions are needed in other lake segments (e.g., Missisquoi Bay, South Lake), so using 15% should ensure adequate power for detecting the targeted changes in these segments. However, the variances for some lake segments were larger than the median values, which could reduce statistical power in those cases. The results of the power analysis for lake total phosphorus are shown in Figure 3. The probability of detecting a 15% change in a multi-year mean phosphorus concentration is plotted vs. the number of years of sampling for several alternative within-year sampling frequency schedules. The “total number of years of monitoring” in Figure 3 refers to the number of years of sampling over two time periods (before and after) for which a phosphorus mean value is estimated. The number of years is assumed to be equal for each time period. For example, a value of 20 years of monitoring in Figure 3 indicates 10 years of baseline pre-monitoring followed by 10 years of post-monitoring. This analysis used a significance criterion of 0.05 for two-tailed t-tests. Figure 3 shows how power increases with longer monitoring program duration and with increased sampling frequency within each sampling season. Sampling seasons are assumed to be six months (180 days) in length. The choice of a desired level of power to serve as a monitoring program design criterion is a somewhat arbitrary decision, but a relatively high power of about 80% is a commonly used criterion (Snedecor and Cochran, 1967; Green, 1989). For total phosphorus, a sampling frequency of at least monthly would be required to detect a 15% change between two monitoring periods of 10 years each with an 80% power. A biweekly sampling frequency would detect such a change more quickly, with only four year monitoring periods. Sampling frequencies greater than biweekly give diminishing returns of power improvement. Based on this analysis, a biweekly sampling frequency (12 samples per year) was chosen for this monitoring program. 10.3 Selection of Tributary Monitoring Stations There are 22 Lake Champlain tributary rivers included in the monitoring program (Figure 2). The drainage areas of these rivers and the location of the sampling stations are given in Table 4. The tributaries and sampling locations were determined based on the following considerations:
• Monitoring should include the largest tributaries (larger than 100 km2 drainage area) or other sites (e.g., St. Albans Bay tributaries) where special management needs exist.
• Sampling locations should be as near to the river mouths as possible in order to capture loads from as much of the watershed as possible.
• All monitored rivers must have a continuous flow gage near the river mouth so that loads of phosphorus and other materials can be computed.
Figure 3. Detecting change in total phosphorus concentration in Lake Champlain
Power of detecting 15% change in total phosphorus
Total number of years of monitoring(Half before and half after change)
0 10 20 30 40
Pow
er (
%)
of t
-tes
t0
20
40
60
80
100
annual (1)
monthly (6)
bi-weekly (12)weekly (24)
Statistical power for detecting a 15% change in total phosphorus concentration in Lake Champlain as a function of the number of years of monitoring and various within-year sampling frequencies.

Lake Champlain LTM QAPP/Workplan Revision 1.4 May 23, 2016
Page 16 of 71
The 22 monitored rivers listed in Table 4 include all Lake Champlain tributaries larger than 100 km2 in drainage area with the exception of the LaChute Creek (702 km2). Twenty-one monitored tributaries have flow gauges operated by the U.S. Geological Survey or the Quebec Ministry of Sustainable Development, Environment, and Parks. The LaChute Creek (New York) does not have a flow gage station with publicly available data. Sample collection at Putnam Creek wase discontinued in 2015 due to funding shortfalls in USGS stream gauge operation as noted in Table 4. The VT DEC will be funding the existing USGS gauge at Stevens Brook in the St. Albans Bay watershed for one year with funds from this project. A new gauge to support MS4 activities in St. Albans City will be installed on Stevens Brook upstream of the existing gauge in 2016 which may make the current gauge at Stevens Brook redundant. VT DEC will develop a model to predict flow at the current Stevens Brook site, using the new MS4 gauge and the other existing gauges in the watershed. We expect that the model will fully support tributary loading estimates for Stevens Brook in the future, allowing the existing gauge to be removed. Table 4. List of lake and tributary sampling station locations and total river drainage areas.
Tributary Station1 Drainage Area at Mouth (km2)
Latitude N Longitude W
Vermont/Quebec Winooski (WINO01) 2,828 44° 31.52' 73° 15.41' Otter (OTTE01) 2,462 44° 09.94' 73° 15.40' Missisquoi (MISS01) 2,223 44° 55.23' 73° 07.63' Lamoille (LAMO01) 1,909 44° 37.96' 73° 10.39' Poultney (POUL01) 692 43° 34.24' 73° 23.53' Pike (PIKE01) 517 45° 07.38' 73° 04.18' Lewis (LEWI01) 209 44° 14.80' 73° 14.77' Little Otter (LOTT01) 185 44° 12.24' 73° 15.11' Rock River (ROCK02)2 152 44° 59.49' 73° 04.22' LaPlatte (LAPL01) 137 44° 22.21' 73° 13.01' Stevens (STEV01)3 39 44° 50.56' 73° 07.11' Jewett (JEWE02)3 20 44° 51.22' 73° 09.05' Mill River (MILL01)4 70 44° 46.47' 73° 08.39' New York Saranac (SARA01) 1,575 44° 41.52' 73° 27.19' Ausable (AUSA01) 1,323 44° 33.63' 73° 26.95' Mettawee (METT01) 1,098 43° 33.33' 73° 24.10' Great Chazy (GCHA01) 769 44° 58.81' 73° 25.96' Bouquet (BOUQ01) 712 44° 21.84' 73° 23.41' Little Ausable (LAUS01) 189 44° 35.65' 73° 29.79' Salmon (SALM01) 175 44° 38.40' 73° 29.70' Putnam (PUTN01)5 160 43° 57.35' 73° 25.99' Little Chazy (LCHA01) 139 44° 54.12' 73° 24.88' 1 Station codes used in the database are indicated in parentheses. 2 Added in 2007. 3 St. Albans Bay tributaries added in October 2008. 4 St. Albans Bay tributary added in November 2010 5 Discontinued in 2015, stream gauge de-activation

Lake Champlain LTM QAPP/Workplan Revision 1.4 May 23, 2016
Page 17 of 71
10.4 Selection of Tributary Sampling Frequency The primary purpose of the tributary sampling program is to assess the status and trends in loadings of total phosphorus and other materials to the lake using methods described in Vermont DEC and New York State DEC (1997), Medalie and Smeltzer (2004), and Hirsch et al. (2010). The tributary sampling frequency for the monitoring program was originally designed to include 10 samples per year, with sampling events targeted to high flow conditions in order to maximize the precision of annual mean loading estimates (Vermont DEC and New York State DEC, 1997). In 2000, a review of the monitoring program was conducted by the Lake Champlain Basin Program to ensure that the sampling effort was sufficient for the key purpose of estimating annual phosphorus loads from the tributaries. As part of this review, the tributary phosphorus data collected from 1990 to 1999 was statistically analyzed to empirically determine the relationship between the number of samples and the precision of the annual mean loading estimates. All total phosphorus sample results during 1990-1999 for selected rivers were used with corresponding average daily flow data to calculate mean phosphorus loads for the period using load estimation procedures provided by the FLUX program (Walker, 1987, 1996). Then, individual phosphorus results were randomly eliminated from the data set and the mean loads were recalculated using progressively smaller sample sizes. The precision of the mean load estimates (expressed as 95% confidence intervals) were examined as a function of sample size. The results of this analysis are shown in Figure 4 for the Missisquoi River. Similar findings were produced using data from other tributaries. When sample size increases from 10 to 20, there is a large improvement in the precision of the mean loading estimate. Samples sizes greater than 20 yield diminishing returns of improved precision. Subsequent operational experience has demonstrated the actual number of high flow events practically available for sampling is less than 20. A modified target of 13 high flow sampling events per year on each tributary was established in 2015. This represents 70% (~staff resources available in a given 365 day period) of the highest 5% of 365 daily flow values (~18) for each tributary. In addition, 4 low flow total phosphorus samples per year will be obtained in order to define the concentration vs. flow relationship over the full range of flow conditions for each tributary. This analysis was based on samples collected predominantly under high flow conditions, and achieving adequate precision of annual mean load estimates is dependent on continuing to sample primarily at high flow times. The target sampling frequency for parameters other than total phosphorus remained at 10 per year because precise loading estimates for these parameters were not considered essential on an annual basis, and data from multiple years could be combined to produce adequate precision for means loads over longer time intervals.
Figure 4. Precision of mean total phosphorus loading estimates as a function of sample size for the Missisquoi River
Missisquoi River
Number of Samples
10 20 30 40 50 100 180
Me
an L
oad
(m
t/yr)
0
100
200
300
400 1607
Note: Error bars are 95% confidence intervals for the mean loads. Dotted line indicates the mean load estimated using all available samples during 1990-1999 (N=180).

Lake Champlain LTM QAPP/Workplan Revision 1.4 May 23, 2016
Page 18 of 71
10.5 Selection of Zebra Mussel Monitoring Stations and Sampling Frequency Zebra mussel monitoring will include veliger (larvae) and settled veliger (juvenile) life stages at openwater and nearshore stations, respectively. Specific monitoring objectives encompass the following:
Determine the occurrence and density of zebra mussel veligers in selected openwater areas of Lake Champlain.
Determine the occurrence and density of full growing season settled juvenile mussels in selected nearshore areas of Lake Champlain.
Determine the occurrence of zebra mussels in Lake Champlain tributaries and inland lakes within the basin.
Using a plankton net, occurrence and density of veligers will be determined at 13 Lake Champlain openwater stations as shown in Table 5 and Figure 5. Veliger sampling at other openwater lake stations conducted during previous years was discontinued in 2006 because the infestation in these areas appeared to be fully developed. Renewed interest in sampling all segments of the lake re-established sampling effort for veligers at all open-water stations beginning in 2011. Openwater stations are co-located with stations of the LTMP. Co-location of these stations will allow for comparison of zebra mussel monitoring results with other water quality and biological data, and improved overall sampling efficiency. Occurrence and density of season settled juveniles will be determined at 9 nearshore stations, as shown in Table 5 and Figure 5, on both the Vermont and New York sides of the lake by deploying polyvinyl chloride (PVC) settling plates which will be left in the lake for the entire sampling season. Veliger sampling at public access areas or lake outlets will be performed in ten Vermont inland lakes (Figure 6) with high boating activity and close proximity to Lake Champlain. These lakes include: Lake Carmi, Fairfield Pond, Arrowhead Mountain Lake, Shelburne Pond, Lake Iroquois, Cedar Lake, Lake Dunmore, Lake Hortonia, Lake Bomoseen, and Lake St. Catherine. Eleven additional lakes in Vermont outside the Lake Champlain Basin with high boating activity will be sampled for veligers, including Lake Memphremagog, Lake Salem, Seymour Lake, Lake Willoughby, Island Pond, Crystal Lake, Caspian Lake, Joe’s Pond, Harvey’s Lake, Lake Morey, and Lake Fairlee. The Connecticut River will also be sampled. Shoreline surveys for the presence of adult zebra mussels will be conducted using diving mask and snorkel as time allows in any lake where veligers were found in plankton net tow samples.

Lake Champlain LTM QAPP/Workplan Revision 1.4 May 23, 2016
Page 19 of 71
Table 5. Openwater and nearshore sampling site locations for zebra mussel and mysid monitoring in Lake Champlain
Location Description Parameter Latitude
Longitude Coordinates
STA 02 Co-located with Lake Station 02, Benson Landing, VT Openwater Veligers
N 43° 42.89' W 73° 22.98'
STA 04 Co-located with Lake Station 04, Crown Point, NY Openwater Veligers
N 43° 57.10' W 73° 24.47'
STA 07 Co-located with Lake Station 07, Cole Bay, NY Openwater Veligers
N 44° 07.56' W 73° 24.77'
STA 19 Co-located with Lake Station 19, Main Lake, VT Openwater Veligers
N 44° 28.26' W 73° 17.95'
STA 21 Co-located with Lake Station 21, Burlington Bay, VT Openwater Veligers N 44° 28.49' W 73° 13.90'
STA 25 Co-located with Lake Station 25, outer Malletts Bay, VT Openwater Veligers
N 44° 34.92' W 73° 16.87'
STA 33 Co-located with Lake Station 33, Cumberland Bay, NY Openwater Veligers
N 44° 42.07' W 73° 25.09'
STA 34 Co-located with Lake Station 34, "Inland Sea," VT Openwater Veligers
N 44° 42.49' W 73° 13.61'
STA 36 Co-located with Lake Station 36, Grand Isle, VT Openwater Veligers
N 44° 45.37' W 73° 21.30'
STA 40 Co-located with Lake Station 40, St. Albans Bay, VT Openwater Veligers
N 44° 47.12' W 73° 09.73'
STA 46 Co-located with Lake Station 46, Isle LaMotte, VT Openwater Veligers
N 44° 56.90' W 73° 20.40'
STA 50 Co-located with Lake Station 50, Missisquoi Bay, VT Openwater Veligers
N 45° 00.80' W 73° 10.43'
STA 51 Co-located with Lake Station 51, Missisquoi Bay, Quebec Openwater Veligers N 45° 02.50' W 73° 07.78'
SH 05 Burlington Boathouse, VT @ dock
Season Settled Juveniles
N 44° 28.57' W 73° 13.39'
SH 06 Marble Island Club, Colchester, VT @ dock
Season Settled Juveniles
N 44° 34.24' W 73° 13.83'
SH 08 Ladds Landing (formerly Tudhope Sailing Center), Grand Isle, VT in "the Gut" @ dock
Season Settled Juveniles
N 44° 45.98' W 73° 17.50'
SH 09 St. Albans Bay, VT, town pier
Season Settled Juveniles
N 44° 48.39' W 73° 08.45'
SH 10 Missisquoi Bay Bridge, VT in bay
Season Settled Juveniles
N 44° 57.85' W 73° 13.23'
SH 11 Lighthouse Point Marina, near Rouses Point, NY @ dock
Season Settled Juveniles
N 44° 49.95' W 73° 21.00'

Lake Champlain LTM QAPP/Workplan Revision 1.4 May 23, 2016
Page 20 of 71
BAHA Basin Harbor, VT @ dock
Season Settled Juveniles
N 44° 11.48' W 73° 21.53'
CHIP Chipman Point Marina, VT @ dock
Season Settled Juveniles
N 43° 48.01' W 72° 22.35'
WILL Willsboro Bay Marina, Willsboro, NY @ dock
Season Settled Juveniles
N 44° 24.30' W 73° 23.30'
10
North of Thompson’s Point
Mysids only
N 44° 18.25' W 73° 19.32'
STA19 Main Lake Mysids only N 44° 28.26′ W 73° 17.95′
62
South of Diamond Island
Mysids only
N 44° 12.30' W 73° 22.00'

Lake Champlain LTM QAPP/Workplan Revision 1.4 May 23, 2016
Page 21 of 71
Figure 5. Open-water and nearshore sampling site locations for Lake Champlain zebra mussel and mysid sampling

Lake Champlain LTM QAPP/Workplan Revision 1.4 May 23, 2016
Page 22 of 71
Figure 6. Inland lake and tributary sampling site locations for zebra mussels

Lake Champlain LTM QAPP/Workplan Revision 1.4 May 23, 2016
Page 23 of 71
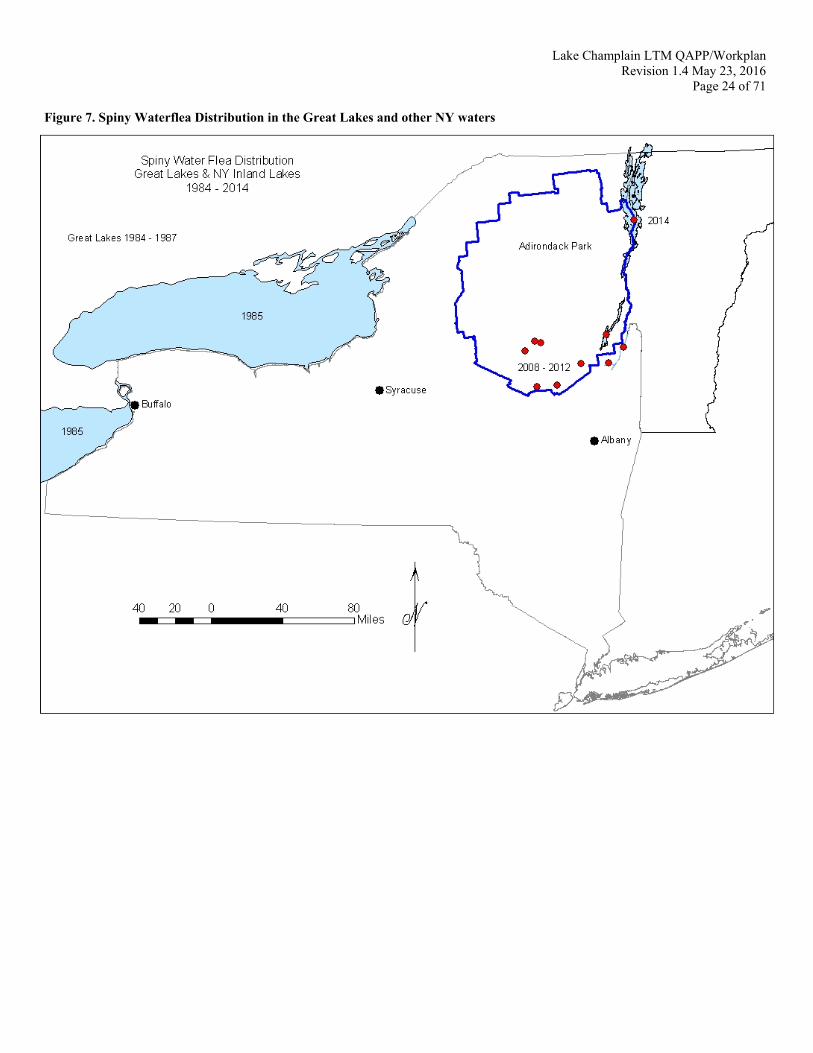
Openwater veliger monitoring will commence with deployment of season settling plates in late April. Veliger net tows will occur approximately every two weeks in conjunction with other sampling programs. Sampling for veligers will be discontinued in the fall when counts decrease to low values indicating that reproduction has ceased. Season settling plate retrieval will occur in October. Lake tributaries will be sampled during a period of two to three weeks in mid-summer. Inland lake veliger samples will be collected during the summer. 10.6 Selection of Mysid Stations and Sampling Frequency Mysids (Mysis relicta) are sampled at the very deepest parts of the lake (100 meters or deeper). Previous work indicated very few mysids were found above 100 meters during daytime hours (Siegfried, 2006). Sites deeper than 100 meters are limited to an area spanning from Station 19 in the Main Lake segment southward to the vicinity of Station 9 in the Otter Creek segment. Historical mysids sampling, therefore, was constrained to a relatively small area of the lake in a spatial context. The clustering of the original mysids sampling sites was to ensure an adequate baseline of information about the mysids population in the lake. Following establishment of a baseline dataset, the sampling network was reduced to 3 long term sites spatially separated to monitor for trends and shifts in seasonal patterns (Figure 5, Table 5). 10.7 Spiny Water Flea Monitoring The zooplankton spiny waterflea, Bythotrephes longimanus was first detected in the Great Lakes in the early 1980s and, by the late 1980s had spread throughout the Great Lakes. It remained undetected throughout most of New York’s inland waterbodies for 20+ years until 2009 when it was confirmed in a southeastern Adirondack lake. Over the next 4 to 5 years, it spread across several more southeastern Adirondack Lakes and subsequently into Lake George and the Champlain Canal system, both tributary to Lake Champlain. In 2014, spiny water flea was detected and confirmed in Lake Champlain (Figure 7). Through the fall of 2014, it spread very rapidly across much of Lake Champlain. As a result, zooplankton sampling and screening for spiny water flea in the Champlain Canal system, which had been added to the zooplankton component of this LTMP back in 2009, was discontinued beginning with the 2015 field season. Effort has shifted to tracking dispersal and densities of spiny water flea within Lake Champlain. Concurrent with the bi-weekly monitoring at the 15 routine LTMP lake stations (Table 3), full water column vertical tows utilizing a 0.5 m 250 µm mesh net will be conducted to sample for spiny water flea, as well as, other species not known to be in Lake Champlain. This will be in addition to the routine zooplankton monitoring done with the 30 cm 153 µm net described elsewhere in this document. Samples will be preserved using a 10% formalin-rose bengal solution. Samples containing spiny water flea will undergo complete counts and density information will be developed. In the event of any additional invasive species detection and confirmation, similar species counts and density estimates will be performed. Lab analysis will be in accordance with methods described elsewhere in this document.
Lake Champlain LTM QAPP/Workplan Revision 1.4 May 23, 2016
Page 24 of 71
Figure 7. Spiny Waterflea Distribution in the Great Lakes and other NY waters

Lake Champlain LTM QAPP/Workplan Revision 1.4 May 23, 2016
Page 25 of 71
11.0 Sampling Methods Requirements 11.1 Lake collections Chemical/Physical The 15 lake stations identified in Table 3 will be located using a global positioning system. Measurements and collections will be made at each station at the frequencies listed in Table 6. Sampling and field processing methodologies follow the Vermont Watershed Management Division’s Fields methods manual (VTDEC, 2012) (www.anr.state.vt.us/dec/waterq/bass/docs/bs_fieldmethodsmanual.pdf ) and the New York Division of Water’s Lake Champlain LTM SOP NYSDEC SOP 401-11, 2011 hereafter referenced as NYSDEC 2011. Hydrolab® MS-5 multi-probe units will be utilized at the stations to record temperature, oxygen, pH, conductivity, and chlorophyll (VT crew beginning 2011) at 1m increments. Dissolved oxygen will be measured using a luminescent optical probe. Chlorophyll profiles will be measured using an optical fluorometric probe. Also, a modified iodometric (Winkler) titration method, with the azide reagent eliminated, will be used to measure water column dissolved oxygen at 5-11 discrete depths at deep lake stations 4, 25, and 34 (VTDEC, 2012; NYSDEC 2011). Winkler analyses have been employed as a QA check on the data generated by the multi-probes. Over the years, very good correlations between the winkler and the luminescent (optical) DO probes has been observed. Comparisons between the two methods for 2015 is displayed in Figure 8. Beginning with the 2016 field season, the project will reduce the number of winkler analyses performed by approximately 75% to save both costs and time.
Figure 8. Comparison of Winkler and LDO methods for Dissolved Oxygen - 2015

Lake Champlain LTM QAPP/Workplan Revision 1.4 May 23, 2016
Page 26 of 71
Visual transparency using a Secchi disk will be measured and recorded (VTDEC, 2012; NYSDEC 2011). Alkalinity, total and dissolved phosphorus, total nitrogen, chloride, dissolved reactive silica, and metals (Ca, Mg, Na, K,) will be analyzed from composited samples collected with a horizontal VanDorn bottle or Kemmerer bottle. During nonstratified conditions, a single composite sample will be collected representing three discrete depths in the water column: 2 meters below the lake surface, mid-depth, and approximately 2 meters above the lake bottom. During stratified conditions, two samples will be obtained, representing the epilimnion and hypolimnion, respectively. Within the epilimnion, 3 discrete samples will be collected and then composited: 2 meters below the lake surface, mid-epilimnion, and approximately 2 meters above the upper knee of the thermocline. Within the hypolimnion, 2 discrete samples will be collected and then composited: mid-hypolimnion, and approximately 2 meters above the lake bottom. Table 7 summarizes the field processing procedures for the water chemistry parameters. Chlorophyll-a samples will be collected using a vertically-integrated hose-sampler beginning at the lake surface to a depth representing twice the Secchi depth (VTDEC, 2006). Samples for chlorophyll-a will be filtered in the field; 100 ml on 47mm diameter GF/A glass fiber filters wrapped in 90 mm No.3 glass fiber filters and placed in a dark container on ice for transport to the laboratory. At Station 19, an aliquot of sample will be saved in a 50 ml centrifuge tube, preserved with Lugols solution and retained in the phytoplankton archive. At the Vermont laboratory, samples will be frozen and stored until analyzed. Additionally, Vermont will measure chlorophyll in the integrated sample using the hydrolab unit. Phytoplankton Vertically-integrated phytoplankton samples will be collected using a 63μm mesh plankton net with a 13cm opening, towed upwards at a rate of 0.5 m/sec from a depth of twice the Secchi disk depth (VTDEC, 2012). The net will be rinsed with lake water, the concentrate will be collected into a 75 ml glass tube and preserved with Lugols solution. In addition to identifying each sample by date, location, and sample type (e.g. net phytoplankton), a line will be drawn on the tube indicating sample level. This will allow us to assess whether significant evaporation or leakage has occurred in storage. Samples will be stored at room temperature, in the dark, until analysis. The presence of spiny water flea in Lake Champlain has not yet adversely affected the use of small mesh plankton nets for phytoplankton Beginning in 2016, phytoplankton analysis will prioritize samples from the following stations - 04, 07, 19, 25, 36, 40 and 50. Phytoplankton samples from the remaining stations will be analyzed prior to the next field season as time permits. All samples will be retained in storage for five years. This prioritization will not affect samples collected as part of the Champlain Cyanobacteria Monitoring Program.
Lake Champlain LTM QAPP/Workplan Revision 1.4 May 23, 2016
Page 27 of 71
Table 6. Lake Monitoring Parameters Parameter No. of
Stations No. of
Samples / Site / Visit
Sampling Frequency
No. of Samples /
Year
Sample Parameter Analysis
Physical/Chemical Temperature (meter) 15 Baseline Profile bi-weekly(12) -- Field measure Dissolved Oxygen (electrode method)
15 Baseline Profile bi-weekly(12) -- Field measure
Dissolved Oxygen (iodometric method)
Sites: 4, 25, 34 5 – 11 2 trips ea Station (QA/QC target low hypolimnetic DO
~42 VTAEL lab
Secchi transparency 15 Baseline 1 bi-weekly(12) -- Field measure Specific conductance 15 Baseline 1 - 21 bi-weekly(12) -- Field measure pH 15 Baseline 1 - 21 bi-weekly(12) -- Field measure Alkalinity 15 Baseline 1 - 21 Seasonally(3) 45 – 901 VTAEL lab Total phosphorus 15 Baseline 1 - 21 bi-weekly(12) 180 – 3001 VTAEL lab Dissolved phosphorus 15 Baseline 1 - 21 bi-weekly(12) 180 – 3001 VTAEL lab Total nitrogen 15 Baseline 1 - 21 bi-weekly(12) 180 – 3001 VTAEL lab Dissolved reactive silica 15 Baseline 1 - 21 bi-weekly(12) 180 – 3001 VTAEL lab Chloride 15 Baseline 1 - 21 bi-weekly(12) 180 – 3001 VTAEL lab Metals (Ca, Mg, Na, K) 15 Baseline 1 - 21 Seasonal(3) 45 – 901 VTAEL lab Biological Chlorophyll 15 Baseline 1 bi-weekly (12) 180 VTAEL lab Chlorophyll 15 Baseline 1 bi-weekly (12) -- Field measure (VTDEC) Phytoplankton 15 Baseline 1 bi-weekly (12) 1922 VTDEC Zooplankton 15 Baseline 1 bi-weekly (12) 180 NYSDEC / SUNY Mysids Sites:10, 19,
62 6 (3 tows w/ paired bongo nets)
Monthly (6) 108 NYSDEC/SUNY
Zebra mussel – Veligers Settled juveniles Tributaries Inland lakes
13 9 1 21
1 1 2 2
Biweekly (12) Annual (1) Annual (1) Annual (1)
156 10 2 42
VTDEC
Note: 1Number of samples will vary with duration of thermal stratification. 2Includes 1 wholewater sample collected at Sta 19 per sampling trip.

Lake Champlain LTM QAPP/Workplan Revision 1.4 May 23, 2016
Page 28 of 71
Table 7. Summary of processing, preservation, and storage containers for water quality parameters Parameter
Processing
Preservation
Container
Holding Time
Total phosphorus b E 4 4 Total dissolved phosphorus a E 4 4 Total nitrogen b C 1 4 Chloride a E 1 4 Metals (Ca, Mg, Na, K) b B 3 5 Dissolved reactive silica (lake) a A 1 4 Alkalinity b A 2 3 Dissolved oxygen c D 5 1 Total suspended solids b A 6 2 Chlorophyll a d F 7 6
Processing: a - filtrate (through 0.45µ cellulose nitrate filter) b - whole sample c - fix in field w/ 2 ml MnSO4, followed by 2 ml of iodide
d - filter through glass fiber filter GF/A(1.6µm). Wrap in clean filter Preservation: A - no addition, sample kept cooled at <6ºC B - 0.5 ml concentrated HNO3 / 250 ml of sample. Trace metal grade.
C - 0.1 ml concentrated H2SO4 / 50 ml of sample, sample kept cooled at <6ºC. Use Reagent Grade
Sulfuric Acid with Low Level Nitrogen Total Nitrogen (N) <0.0005% D - after fixing with D. O. reagents, sample kept cooled at <6ºC, store in dark E - no addition, sample kept at room temperature F - freeze Containers: 1 - 50 ml polyethylene centrifuge tube 2 - 250 ml polyethylene bottle 3 - 250 ml polyethylene bottle, certified clean 4 - 60 ml glass vial 5 - 300 ml BOD bottle
6 - 1 liter polyethylene container (Tributaries) 7 - Wrap in clean filter, transport in light-proof container or wrapped in aluminum foil Holding times: 1 - 8 hours 2 - 7 days 3 - 14 days 4 - 28 days 5 - 6 months 6 - 21 days

Lake Champlain LTM QAPP/Workplan Revision 1.4 May 23, 2016
Page 29 of 71
Zooplankton
Zooplankton samples will be collected by vertical net tows using both a 30cm diameter, 153µm mesh net fitted with a 153µm screened cod end and a 50cm diameter, 250µm mesh net fitted with a 250µm screened cod end. (NYSDEC 2011). The larger net is primarily for screening and detection of spiny waterflea. Tows will begin just above the sediments and hauled vertically to the water surface. The net will remain still for approx. 30 seconds just above the bottom before start of retrieval. Net retrieval rate will be 1 meter per second. Station, date, net size, and tow depth will be recorded on sample bottles and field sheets.
Nets will be rinsed from the outside with lake water to wash organisms that may be stuck to the net down into the cod end. The cod end will be detached from the net and the screening and sides of cod end will be washed with a spray bottle, concentrating the samples into the bottom. The samples will be washed into 125 ml bottles. The cod end will be washed into the sample bottle until bottle is filled ½ full (approx. 65 ml). If resulting sample volume does not allow for adequate preservative, further concentrating of the sample will be necessary. The sample will be narcotized by adding 10 to 15 ml of cold club soda or ½ of an antacid tablet. Cold club soda may also be used when performing the final rinse from the cod end. After about 5 minutes (or if using antacid tablet, after fizzing stops), buffered 10% formalin-sucrose-rose bengal solution will be added to bring volume up to the shoulder to create a final approx. 5% formalin solution concentration (approx 2.5% formaldehyde concentration). The samples will be placed into coolers with ice. Samples will be transported to the laboratory for further processing. Mysids Mysids will be sampled by vertical net tows using paired bongo nets (0.5 m diameter, 253 µm mesh) at Stations 19, 10, and 62 (see Figure 5, Table 5), independent of the water chemistry and biological parameters, on a monthly basis (NYSDEC 2011). Triplicate vertical tows of the whole water column from just above the sediments to the surface will be performed. The net will remain still for approx. 30 seconds just above the bottom before start of retrieval. Net retrieval rate will be 1 meter per second. Station, date, net size, tow depth, and replicate will be recorded on sample bottles and field sheets. Nets will be rinsed from the outside with lake water to wash organisms that may be stuck to the net down into the cod end. The cod end will be detached from the net and the screening and sides of cod end will be washed with a spray bottle, concentrating the samples into the bottom. The samples will be washed into 125 ml bottles. The cod end will be washed into the sample bottle until bottle is filled ½ full (approx. 65 ml). If resulting sample volume does not allow for adequate preservative, further concentrating of the sample will be necessary. A buffered 10% formalin-sucrose solution will be added to bring volume up to the shoulder to create a final approx. 5% formalin solution concentration (approx 2.5% formaldehyde concentration). The samples will be placed into coolers with ice. Samples will be transported to the laboratory for further processing. In the laboratory, samples will be washed and picked to separate the mysids from the other organisms. Mysids will be placed in glass scintillation vials with 95% ethyl alcohol, labeled by station, date, and replicate and stored in the dark at room temperature for further processing.

Lake Champlain LTM QAPP/Workplan Revision 1.4 May 23, 2016
Page 30 of 71
Zebra mussels Open water zebra mussel veliger samples will be collected using vertical plankton net tows (VTDEC, 2012). A 13 cm aperture size Wisconsin style plankton net with a 63 µm net mesh size will be towed vertically to the lake surface from a depth of 10 m, or 1 m from the lake bottom in areas where the bottom depth is less than 10 m, at a 0.5 m/sec retrieval rate for optimal veliger entrapment. Veliger samples will consist of five composited net tows of equal length. Length of net tow, surface temperature, and Secchi depth will be recorded for each sample. Once out of the water, the net contents will be concentrated and transferred to a 50 ml plastic sampling container and preserved with a 95% ethanol solution in a 1:1 ratio of sample to ethanol. Samples do not need refrigeration while stored at the laboratory for analysis. After sampling, the net will be rinsed vigorously three times in the lake. The presence of spiny waterflea in Lake Champlain has not yet adversely affected sampling with small mesh nets. Occurrence and density of season settled zebra mussel juveniles will be determined using a 15 x 15 cm dark colored PVC settling plate. The plate will be arranged horizontally along a stainless steel threaded eyebolt. The plate will be suspended vertically in the water column by attaching a rope to the eyebolt to a marina dock, bridge abutment, or float. The plate will be submerged so that the plate is 2-3 m below the lake surface and can be adjusted during the summer as lake levels drop. The bottom of the eyebolt will be attached to a rope with a weight. The plate will remain in the water for the entire sampling season to estimate seasonal accumulation. The plates will be transported to the laboratory where they will be stored in a refrigerator at 4ο C (40ο F) and counted within 3 days. Tributary zebra mussel veliger samples will be collected using a horizontal plankton net tow (VTDEC, 2012) in the upper one meter of the water column. A 13 cm aperture size Wisconsin style plankton net with a 63 µm mesh net size will be towed horizontally at a 0.5 m/sec retrieval rate for optimal veliger entrapment. Net tow samples and field duplicates will be composites of five tows of equal length. Length of tow and surface water temperature will be recorded. The veliger tow will be taken in each tributary during the summer using a plankton net that was not used in Lake Champlain. Horizontal veliger tow samples will be preserved as described in the open water veliger section. When traveling between sampling areas the plankton net will be stored in a 95% ethanol solution for spread prevention purposes. Inland lake zebra mussel veliger samples will be collected using the same method as described in the tributary sampling section. Horizontal plankton net tows will be taken at public access areas or lake outlets. Veliger tow samples will be preserved as described in the open water veliger section. The veliger tow will be taken in each lake during the summer using a plankton net that was not used in Lake Champlain. When traveling between sampling areas, the plankton net will be stored in a 95% ethanol solution to kill any veligers that may be entrained in the net.

Lake Champlain LTM QAPP/Workplan Revision 1.4 May 23, 2016
Page 31 of 71
11.2 Tributary collections The stream sampling procedures used by the Lake Champlain Diagnostic-Feasibility Study and the LTMP have proven to be practical in the field and successful in supporting accurate loading estimates (Medalie, 2013). These procedures will continue to be used for a long-term monitoring program on Lake Champlain tributaries. Samples will be obtained at the downstream-most bridge crossings for each tributary at the same locations used for the previous studies. Depth and velocity integrated samples will be obtained using either the DH-48 or DH-59 suspended sediment samplers. Samples will be obtained under a full range of flow conditions each year, but with a strong emphasis on high flow conditions. Beginning in 2006, collections of four low flow events will also be conducted. The following measurements and collections will be made at each station (summarized in Table 8). Temperature will be measured directly and recorded using a thermometer or electronic thermistor. pH and conductivity will be measured directly and recorded using an ion selective electrode method. Alkalinity, total and dissolved phosphorus, total nitrogen, total suspended solids, chloride, and metals (Ca, Mg, Na, K) will be analyzed from composite samples. Samplers will be lowered to the bottom of the water column and slowly raised so as to collect a composite bottom-to-top sample. This procedure will be performed at 3 points across the stream on wider rivers, or at the centroid of flow on narrower ones. The collected samples will be composited into a single sample for chemical analysis. When traveling between sampling areas the suspended sediment sampler and rope will be stored in a 95% ethanol solution to kill any aquatic invasive species that could be entrained in the rope or in the water left on the device. The sampler will be rinsed in ambient water after immersion in the ethanol prior to sample collection at each sampling site. Table 8. Tributary monitoring parameters
Parameter No. of Stations
No. of Samples / Site / Visit
Annual Sampling Frequency
No. of Samples /
Year
Sample Parameter Analysis
Temperature (meter) 21 1 171 357 Field measure pH 21 1 171 357 Field measure Specific conductance 21 1 171 357 Field measure Total phosphorus 21 1 171 357 VAEL Dissolved phosphorus 21 1 141 294 VAEL Total nitrogen 21 1 141 294 VAEL Total suspended solids 21 1 141 294 VAEL Chloride 21 1 141 294 VAEL Alkalinity 21 1 Seasonally(3) 63 VAEL Metals (Ca, Mg, Na, K) 21 1 Seasonally(3) 63 VAEL
1 Beginning in 2015, tributary sampling target modified to 13 high flow events, representing 70% of the highest 5% of 365 daily flow values and 4 low flow events. 14 sampling events will be for full suite of parameters, (10 high flow and 4 low flow) and 3 sampling events will be for TP only.

Lake Champlain LTM QAPP/Workplan Revision 1.4 May 23, 2016
Page 32 of 71
12.0 Sample Handling and Custody Requirements Samples are collected by field teams from Vermont and New York. Vermont samples remain in the team’s custody until reaching the laboratory, where they are entered into the Laboratory’s Information Management System (LIMS). Log-in is normally completed on the day of collection. The VAEL QSM provides additional detail on log-in and laboratory custody. Water quality samples collected by the NY team remain in the team’s custody, under proper storage conditions, until arrangements can be made for transfer by VT staff to VAEL, typically within 2-5 days. NY samples are entered into the LIMS by VT staff when they reach the Laboratory. Copies of the field data collection sheets accompany the samples. Each sample is assigned a unique accession number. Accession numbers are sequential, and identify the team that collected them (e.g., NY samples are 41xxx, VT are 42xxx). All water quality containers filled from the sample use the same accession number. Plankton are assigned a number corresponding to the epilimnion or unstratified layers. All containers carry labels identifying station, accession number and parameter. In addition, the LIMS generates new labels identifying each container for water quality analysis by a unique laboratory identifier as well as the project-specific information. Table 7 documents sample container type and processing procedures for water quality samples. Table 10 documents this information for the biological samples.
13.0 Analytical Methods Requirements 13.1 Water Sample Analytical Methods Table 9 summarizes the field and laboratory analytical methods that will be used for water quality samples collected as part of the project Table 9. Analytical procedures for parameters and field measurements
Parameter Method [Reference] Phosphorus (all forms) APHA 4500-P H[b] Total nitrogen – modified. APHA 4500-NC.[b] Chloride APHA 4500-Cl G[b] Dissolved reactive silica APHA 4500-Si O2 F [b] Metals (Ca, Mg, Na, K) USEPA 6020A [a] Alkalinity APHA 2320-B [b] Total suspended solids APHA 2540-D [b] pH, in situ and laboratory Hydrolab [c], YSI [d], VTDEC [f] NYDEC [g] Dissolved oxygen, in situ and laboratory Hydrolab [c] APHA 4500-OC [b] VTDEC [f] NYDEC [g] Temperature, in situ Hydrolab [c], YSI [d], VTDEC [f], NYDEC [g] Specific conductance, in situ Hydrolab [c], YSI [d], VTDEC [f], NYDEC [g] Chlorophyll a USEPA 445.0 [e], VTDEC [f] Hydrolab (c)
[a] U. S. Environmental Protection Agency. Test methods for evaluating solid wastes. Office of Research and Development, Washington, D. C. [b] American Public Health Association, American Water Works Association, and Water Pollution Control Foundation. 2005. Standard Methods for the Examination of Water and Wastewater. 21st Edition. American Public Health Association, Washington, D.C. [c] Hydrolab Corporation. Rev B 1997. Operations and Maintenance Manuals for Hydrolab Surveyor IV, Austin, TX.

Lake Champlain LTM QAPP/Workplan Revision 1.4 May 23, 2016
Page 33 of 71
[d] YSI, Inc. 1998 Operations Manual for YSI Model 63 [e] U.S. Environmental Protection Agency. Method 445.0 In Vitro Determination of Chlorophyll a and Pheophytin in Marine and Freshwater Algae by Fluorescence. Revision 1.2 Sept. 1997. [f] Field Methods Manual. Vermont Department of Environmental Conservation, Watershed Management Division. 2012. [g] Lake Champlain LTM SOP. New York DEC Division of Water. 2011. 13.2 Biological Analytical methods Detailed procedures for the biological analyses are located in Appendix A. Short descriptions are presented here and summarized in Table 10. Zooplankton In the laboratory, counts will be made of all zooplankton (rotifers and crustaceans) in 1 ml subsamples. Subsamples will be drawn off using a 1ml Henson-Stempel pipette and counted in 1ml Sedgwick rafter cells under an inverted microscope at appropriate (40X to 100X) magnification. Additional 1 ml subsamples will be counted until at least 100 individuals of each dominant species are counted, or the entire sample has been examined. Identification will be made to lowest possible taxon. Zooplankton size will be measured and recorded. Up to 15 individuals of each taxon from each sample will be measured. For crustaceans, length will be measured from the tip of the head to the base of the tail spine (cladocerans) or caudal rami (copepods) (Johnson et al., 2004). For rotifers, length will be measured from the corona to the opposite end at the base of the spine or to the opposite end and excluding any extensions (USEPA, 2003). Size distributions will be recorded as counts per 0.1mm size categories. Abundance estimates will be converted to biomass estimates using literature values. Samples will be scanned for rare or non-indigenous species. Analysis will be performed at the Lake Champlain Research Institute at SUNY Plattsburgh. Phytoplankton Phytoplankton net samples will be prepared and analyzed utilizing Sedgewick Rafter cells following APHA (2005), identifying taxa to the lowest feasible level and measuring ten representative individuals for use in biomass calculations using standard geometric formulae (Wetzel and Likens, 2000). Counting will continue until at least 10 fields or 100 of the most abundant phytoplankter have been evaluated, or up to three 1 mL aliquots have been examined. Counts will be made on an Olympus CKX41 inverted microscope. Whole water samples will be analyzed using Utermohl settling chambers. Counting, measuring and identification criteria are identical to those for net plankton. Counts will be typically completed using a single aliquot. Samples will be archived for five years. Mysids Mysid density and size distributions will be determined for each sample. Mysids will be measured using digital calipers under a binocular microscope. Total length will be determined by measuring from behind the eyes to the cleft in the telson and will be recorded to the nearest 1 mm. Individuals will be classified as juvenile, female, or male and recorded in appropriate 1 mm size classes. The brood pouches of ovigerous females will be examined and brood size recorded. Young will be assigned to one of four development classes: stage 1 (egg), stage 2 (comma), stage 3 (eyes developed), stage 4 (fully developed 1-2 mm). (Balcer et al., 1984).

Lake Champlain LTM QAPP/Workplan Revision 1.4 May 23, 2016
Page 34 of 71
Zebra mussel veligers Analytical procedures and calibration follow methods detailed in Marsden (1992). A dissecting stereo-microscope at 30X magnification will be used with a cross-polarization light technique to enhance veliger detection for counting purposes. Veliger identification will be verified using a compound microscope with assistance from taxonomists at the Biomonitoring and Aquatic Studies Section of the VTDEC. For samples containing relatively few veligers (100 per sample), all veligers will be counted. If veliger samples are too numerous to count in full (>100 per sample), the sample will be diluted quantitatively as necessary and three 1 ml subsamples will be extracted into a Sedgewick-Rafter cell and counted. Zebra mussel settled juveniles Settled juvenile densities will be determined using methods described by Marsden (1992). The 15 X 15 cm (225 cm2) settling plate will be placed under a dissecting stereo-microscope at 30X magnification and all juveniles that have settled on the undersides of the plate will be counted. Only one side of the plate will be examined, as mussel shells on the bottom would be crushed while under the microscope. If settled juvenile densities are too abundant to count accurately, five 1 cm2 blocks will be counted using a 1 cm2 counting cell randomly placed on the plate. On season settling plates with dense encrustations and uniform distribution of individuals, ¼ of the plate will be counted. Comparisons of veliger and settled juvenile densities between lake stations and/or between years are based on seasonal time-weighted mean density estimates. Simpson’s integral was used to calculate the area under the density vs. time plots for each year, and the areas were divided by the duration of the sampling season. Seasonal weighted mean estimates were based on equal sampling season lengths of 150 days starting and ending with zero density values at the beginning and end of the sampling seasons. Seasonal weighted mean densities were considered more appropriate than geometric means, arithmetic means, or single peaks because of the extreme within-season variation in veliger and settled juvenile densities. Veliger production and juvenile settlement occur during discrete time periods, causing densities to increase from zero upwards over several orders of magnitude within a short time interval during a season at some stations. Mean values would therefore be too strongly biased by the number of samples obtained during non-reproductive periods. Seasonal time-weighted mean density values provide a better index of the overall larval and juvenile production at each site.

Lake Champlain LTM QAPP/Workplan Revision 1.4 May 23, 2016
Page 35 of 71
Table 10. Parameter table for biological monitoring
Parameter Chlorophyll-a Phytoplankton Zooplankton Mysids Zebra mussel young
Number 180 192
180 108 156 Veligers 9 Settled Juv.
Pretreatment 100 ml sample retained on a 47mm GF/A filter (1.6µm)
None Narcotize None None
Preservation freeze Acid Lugols, store in the dark
until analysis
10% formalin 10% formalin Veligers: 95% ethanol
Settled juveniles: Refrigerate
Container glass container, wrapped with aluminum foil
75 ml glass tubes 125 ml polyethylene bottles
125 ml polyethylene
bottles
Veligers: 50ml centrifuge tubes
Laboratory pretreatment
90% acetone Subsample Subsample concentrate, dilute
Separate, move to 90% ethyl
alcohol
Subsample if high density
Type of sample
Filter residue, ground and extracted
Concentrated lake water
total / 1-5 ml aliquots total sample 1-50ml veligers ¼ or whole plate for
settled juveniles Apparatus fluorometer Sedgewick Rafter
cell, inverted microscope @
200 – 400X
Sedgewick Rafter cell, inverted
microscope @ 40-100X
gridded dish, binocular
microscope @ >15X, digital
caliper
Petri dish or sedgewick rafter
cell 30x binocular scope with polarization
Data recorded calculate chl-a concentration,
based on fluorescence
species abundance, biovolume
Taxa, species abundance, size
Abundance, size frequency, sex
ratio, brood size
Abundance Settled juveniles
average size
Criteria for completion of analysis 1, 2, 3
total chl-a in µg/l
> 100 of dominants
counted or up to 3ml concentrate examined, scan for rare forms
> 100 of dominants counted, scan for rare
forms in counted aliquots
Total Count Total count
1Evaluation 1) counting error - mean of 2 replicate counts, S.E., analyst comparisons of sampling 2) site error - mean of replicate samples, 95% confidence error and analysis 3) taxonomic error - analyst comparisons, confirmations by external investigators, voucher specimens 4) pretreatment error - repeat examinations by other analysts 2Criteria of 1) S.E. < 10%, analyst comparisons within 2% acceptance 2) S.E. < 25% 3) Confirmed agreement on all determinations 4) No additional specimens found 3Response if 1) Increase number of replicate counts, additional training for analyst(s)
unacceptable 2) Increase number of replicate samples, modify sampling apparatus 3) Additional training for analyst(s) 4) Increase time/repeats for pretreatment examination, additional analyst training

Lake Champlain LTM QAPP/Workplan Revision 1.4 May 23, 2016
Page 36 of 71
14.0 Quality Control Requirements 14.1 Field Duplicates and Blanks Field QC samples represent approximately 10% of the water and biological collections made. Field duplicates are a second sample collected on-station and not a split of a sample. To generate a blank for water analytes, an aliquot of deionized water is run through the sampling equipment (ie: depth integrated sampler, horizontal VanDorn, churn splitter) after the equipment has been rinsed. 14.2 Laboratory Quality Assurance Table 11 summarizes the analytical quality assurance information for analytes measured as part of this project. Approximately 10 percent of all samples analyzed by VAEL will be laboratory spikes or laboratory duplicates. Also refer to the Laboratory QSM(VAEL 2015). Table 11. Quality assurance information for analytes
Parameter Reporting Limits
(PQLs) a Units Precision (RPD) b Accuracy (% Recovery) c
Reactive silica 0.2 mg/L as SiO2 5 85-115 Chloride 2.0 mg/L 5 85-110 Total nitrogen 0.1 mg/L 10 85-115 Total phosphorus 5.0 µg/L 15 85-115 Dissolved phosphorus 5.0 µg/L 15 85-115 Calcium 0.25 mg/L 20 75-125 Magnesium 0.25 mg/L 20 75-125 Potassium 0.5 mg/L 20 75-125 Sodium 0.5 mg/L 20 75-125 Alkalinity 1.0 mg/L as CaCO3 5,15 d N/A Total suspended solids 1.0 mg/L 15 e 80-120
Footnotes: aPractical Quantitation Limits (PQL) are 2 to 10 times the calculated MDL. PQL will increase when sample dilution is necessary. bRelative Percent Difference (RPD) of laboratory duplicates. Average RPD’s from historical data are approximately 1/2 to 1/5 these values and will vary due to sample matrix and concentration. RPDs will likely be higher for values at or near the PQL. cPercent recovery of matrix spikes calculated as a percent of known addition recovered. Percent Recovery ranges are laboratory control limits. dConc. range 1 (<20 mg/CaCO3/L)= 15 2 (>20 mg/CaCO3/L)= 5 ePrecision and accuracy for samples high in heavy sediment may be outside listed criteria. The entire sample volume cannot be filtered and heavy particles settle quickly while decanting an aliquot of sample. 14.3 Quality control checks for biological analyses Zebra mussels For open water veligers, two field duplicate samples will be collected per sampling cycle so that roughly 10% of the samples are dedicated to QC. Also, one sample from each field duplicate pair will be reanalyzed by the project manager or designee as laboratory analytical duplicates and the RPD values will be reported. Duplicate season

Lake Champlain LTM QAPP/Workplan Revision 1.4 May 23, 2016
Page 37 of 71
settling plate arrays will be placed at 1 station and used as a field duplicate. In the laboratory, 10% of all plate counts will be duplicated. Accuracy of veliger and settled juvenile identifications will be accomplished by comparison with reference samples and through consultation with taxonomists in the Biological and Aquatic Studies Section of the VTDEC. Data comparability will be achieved by using standardized methods as defined in the VTDEC Field Methods Manual (VTDEC, 2012) and in Marsden (1992). ). Data quality objectives for this project are given in Tables 12 and 13. Table 12. Field data quality objectives for veliger, settled juvenile and adult density duplicate samples for zebra mussels
Parameter Units Density Precision (RPD) Detection Limit
Veligers
N/m³
0-100 200% 0.66
>100-1000 100% 0.66
>1000 50% 0.66
Season Settled Juveniles
N/m² 0-100 200% 44
>100 50% 44
Table 13. . Laboratory data quality objectives for veliger, season settled juvenile and adult density duplicate samples for zebra mussels
Parameter Units Density Precision (RPD) Detection Limit
Veligers N/m³ 0-10 100% 0.66
>100 50% 0.66
Season Settled Juveniles
N/m² 0-100 100% 44
>100 50% 44
Phytoplankton In the laboratory, 10% of the counts will be duplicated and RPD values reported (Table 14). Identifications will be made using available taxonomic references including but not limited to Prescott (1982) and Ettl and Gärtner (1988). A digital photographic archive will be maintained. Table 14. Data quality objectives for phytoplankton analyses
Sample Type Parameter Units Precision (RPD)
Field Collection Total cell density Cells/L 200%
Field Collection Total biovolume µg/L 200%
Laboratory Analysis Total cell density Cells/L 100%
Laboratory Analysis Total biovolume µg/L 100%

Lake Champlain LTM QAPP/Workplan Revision 1.4 May 23, 2016
Page 38 of 71
Zooplankton and Mysids Reference collections, drawings, and photographs have been made of Lake Champlain zooplankton to assist in maintaining accuracy and consistency in taxonomic identification. 10% of the samples will be recounted by a second laboratory technician, or other project designee. Recounts will be conducted on the same subsamples as originally counted to remove bias except that associated with taxonomic identification and enumeration. To verify taxonomic identification, the Percentage Similarity of Community Index (PSc) (Barbiero, 2003) will be used to compare identification on a single sub-sample by two different analysts. The formula is given as:
Where a and b for a given species represent the relative percents of the total samples A and B respectively from a single sub-sample examined by two different analysts. The absolute value of their difference is summed over all k species. The sample is considered to pass if the PSc is 0.9 (90%) or greater.
To verify sample enumeration, the Relative % Difference (RPD) between two total counts on a single sub-sample conducted by two different analysts will be determined. The formula is given as: [|count#1 – count#2|]
RPD = __________________________________________ X 100 average(count#1, count#2)
Where count#1 and count#2 represent duplicate counts of total zooplankton on a single sub-sample conducted by two different analysts. The sample is considered to pass if the RPD is 5% or less.
The list of species between the original and recount samples will be compared to verify both taxa and counts are similar. In the event of gross differences or QC that is outside limits as described above, the sample will be re-examined to determine the cause of differences. Appropriate corrective actions will be taken.
15.0 Instrument/Equipment Testing, Inspection, and Maintenance Requirements Tables 16 and 17 list the field equipment used by the LTMP. Field equipment will be inspected prior to use at each station for cleanliness and needed repairs or adjustments. Equipment will be rinsed with ambient water at each station prior to use. After use at each station all field equipment will be thoroughly washed, and then rinsed again prior to use at the next station. Water sampling equipment will be inspected for smooth operation, and adjusted, maintained, or repaired as necessary. Worn parts will be repaired or replaced. Small holes in nets will be sealed with fingernail polish, larger holes by patching with appropriate mesh material. Damaged equipment that cannot be satisfactorily repaired will be replaced. Field instruments will be maintained in working order and calibrated in accordance with manufacturer’s specifications. Field instrument log books will be maintained with each instrument indicating dates of calibration, maintenance, and notes regarding abnormalities or problems, and corrective actions. Chemical reagents will be checked for contamination and expiration date. Contaminated or
k
PSc = 1 – 0.5∑| a - b| i=1
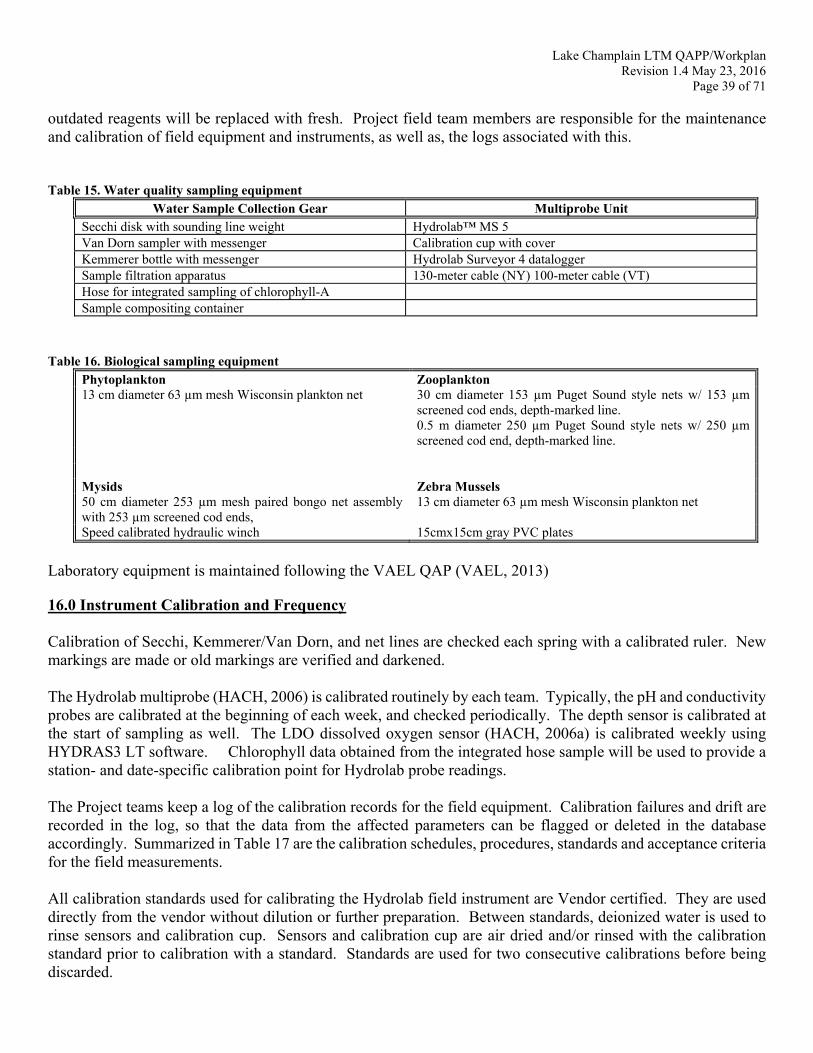
Lake Champlain LTM QAPP/Workplan Revision 1.4 May 23, 2016
Page 39 of 71
outdated reagents will be replaced with fresh. Project field team members are responsible for the maintenance and calibration of field equipment and instruments, as well as, the logs associated with this. Table 15. Water quality sampling equipment
Water Sample Collection Gear Multiprobe Unit Secchi disk with sounding line weight Hydrolab™ MS 5 Van Dorn sampler with messenger Calibration cup with cover Kemmerer bottle with messenger Hydrolab Surveyor 4 datalogger Sample filtration apparatus 130-meter cable (NY) 100-meter cable (VT) Hose for integrated sampling of chlorophyll-A Sample compositing container
Table 16. Biological sampling equipment
Phytoplankton Zooplankton 13 cm diameter 63 µm mesh Wisconsin plankton net 30 cm diameter 153 µm Puget Sound style nets w/ 153 µm
screened cod ends, depth-marked line. 0.5 m diameter 250 µm Puget Sound style nets w/ 250 µm screened cod end, depth-marked line.
Mysids Zebra Mussels 50 cm diameter 253 µm mesh paired bongo net assembly with 253 µm screened cod ends,
13 cm diameter 63 µm mesh Wisconsin plankton net
Speed calibrated hydraulic winch 15cmx15cm gray PVC plates
Laboratory equipment is maintained following the VAEL QAP (VAEL, 2013)
16.0 Instrument Calibration and Frequency Calibration of Secchi, Kemmerer/Van Dorn, and net lines are checked each spring with a calibrated ruler. New markings are made or old markings are verified and darkened. The Hydrolab multiprobe (HACH, 2006) is calibrated routinely by each team. Typically, the pH and conductivity probes are calibrated at the beginning of each week, and checked periodically. The depth sensor is calibrated at the start of sampling as well. The LDO dissolved oxygen sensor (HACH, 2006a) is calibrated weekly using HYDRAS3 LT software. Chlorophyll data obtained from the integrated hose sample will be used to provide a station- and date-specific calibration point for Hydrolab probe readings. The Project teams keep a log of the calibration records for the field equipment. Calibration failures and drift are recorded in the log, so that the data from the affected parameters can be flagged or deleted in the database accordingly. Summarized in Table 17 are the calibration schedules, procedures, standards and acceptance criteria for the field measurements. All calibration standards used for calibrating the Hydrolab field instrument are Vendor certified. They are used directly from the vendor without dilution or further preparation. Between standards, deionized water is used to rinse sensors and calibration cup. Sensors and calibration cup are air dried and/or rinsed with the calibration standard prior to calibration with a standard. Standards are used for two consecutive calibrations before being discarded.

Lake Champlain LTM QAPP/Workplan Revision 1.4 May 23, 2016
Page 40 of 71
Table 17. Calibration frequency, procedures, standards and acceptance criteria for major measurement systems Instrument (parameter) Frequency Procedure Standards Acceptance
Criteria
Hyd
rola
b m
ultip
robe
(Dissolved Oxygen, LDO method)
Weekly calibration using HYDRAS3 LT software
Barometric Pressure Calibration LDO instruction method 2
Barometer (uncorrected at elevation)
Comparison with Winkler data
(Depth) Daily Calibration (1 point)
1 m depth marking on instrument line
(pH) Weekly Calibration (2 point)
Vendor certified 7 & 10 buffers
+/- 0.2 @ 25oC
(Conductivity) Weekly Calibration (2 point)
Vendor certified 10 & 500 Nist- Traceable
Within 5% of certified value
(Temperature) Weekly Check against laboratory thermometer
Within 0.5 degrees
(chlorophyll) Calibrate using integrated sample data
Kemmerer/Van Dorn Lines Phytoplankton Lines Zooplankton Lines
1/yr Calibrate 1m markings on line
Meter stick New markings made and any incorrect ones removed.
Secchi Line 1/yr Calibrate 0.5m markings on line
Meter stick New markings made and any incorrect ones removed.
Hose 1/yr Calibrate 1m markings on line. 10% sulfuric acid rinse 3 times followed w/ tap water flush
Meter stick New markings made and any incorrect ones removed.
All instruments and equipment used within the VAEL are routinely calibrated by Laboratory personnel. Many small instruments and measurement devices are also annually calibrated by an external calibration service following ISO Guide 25 protocol. A summary of calibration procedures for individual instruments and tests is provided in Section 8 of the Lab QAP (VAEL, 2013). Stock Standards used for calibration are purchased from a reputable dealer or prepared at the Laboratory using reagent grade material. All purchased primary standards are certified by the vendor for purity and identity. Calibration Standards (working standards) are dilutions or mixtures of stock standards used to calibrate an instrument. These standards are prepared or re-standardized frequently. NIST traceable reference materials are used when available. A second source standard is routinely analyzed to verify the primary standard. To insure that instruments remain calibrated throughout analysis, it is Laboratory practice to run a Calibration Check Standard or a Quality Control Reference Sample immediately following calibration, after every 10-20 samples for extended runs and after the last sample analyzed (VAEL, 2013).
17.0 Inspection and Acceptance Requirements for Supplies Sample containers are provided by VAEL to both field teams. Vendor supplied containers have been determined to be contamination free for the parameters being tested (Table 1) and samples must be collected in the specified containers. All containers are one-use with the exception of 1 liter polyethylene (total suspended solids) and 300 ml BOD bottles (dissolved oxygen). These containers are washed and visually inspected by lab staff prior to

Lake Champlain LTM QAPP/Workplan Revision 1.4 May 23, 2016
Page 41 of 71
distribution. Sampling containers will be stored and maintained in a manner ensuring their integrity prior to their use. All sample containers and associated supplies will be visually inspected for cleanliness and potential contamination prior to use. Suspect containers will be set aside and replaced with new, clean containers. Sampling containers will be kept closed until time of sample collection. Project field team members are responsible for coordinating with laboratories for procuring and maintaining sampling supplies.
18.0 Non-direct measurements 18.1 Phosphorus loading from Wastewater Treatment Facilities Loads of phosphorus, as metric tons per year (mt/yr), will be reported annually for the 59 Vermont and 29 New York wastewater treatment facilities which have individual waste load allocations specified in the Lake Champlain Phosphorus TMDL. The data will be obtained from monthly discharge monitoring reports submitted by the wastewater facility operators to the Vermont DEC and the New York State DEC according to the monitoring specifications in their discharge permits. Total phosphorus concentrations (mg/l) are reported monthly for most facilities based on an average of one or more samples taken from the effluent each month. Most samples are composites (e.g., 8-hour or 24-hour). Monthly average effluent flow rates, as million gallons per day (mgd), are also reported. Monthly effluent flow and total phosphorus concentration measurements will be either transcribed manually or transferred electronically from the discharge monitoring reports into the project database. Data validation will occur by checking any values that are inconsistent with permit requirements or data from previous years and verifying that the data value in question is consistent with the original submission by the facility operators. The annual average flow rate (mgd) from each facility will be calculated as the mean of the monthly average flow rates (mgd). The annual average effluent phosphorus concentration from each facility will be calculated as the mean of the monthly concentration values. The annual phosphorus load (mt/yr) discharged from each facility will be calculated as the product of the annual average flow rate (mgd), times the annual average phosphorus concentration (mg/l), times a units conversion factor of 1.381. Vermont wastewater treatment facilities are required under the terms of their discharge permits to conduct total phosphorus and other laboratory analyses according to test procedures published in the Code of Federal Regulations (40 CFR Part 136). The Vermont Department of Environmental Conservation provides a Laboratory Manual and Quality Assurance Guidelines for Wastewater Treatment Facility Laboratories for use by facilities conducting their own analyses (Fish, 1995, 1996). Facilities using external laboratories send samples to laboratories certified by the National Environmental Laboratory Accreditation Institute (http://www.nelac-institute.org/ ). New York wastewater treatment facilities are required to monitor and test wastewater samples in accordance with procedures approved in the Code of Federal Regulations (40 CFR Part 136). Additionally, the Environmental Laboratory Approval Program (ELAP) of the Wadsworth Center of the New York State Department of Health (NYSDOH) is responsible for the certification of laboratories performing analyses on environmental samples. All laboratories analyzing environmental samples must be certified. ELAP currently grants certification to commercial, facility self-monitoring and government operated environmental laboratories, in categories covering Public potable (drinking) water, Non-potable water, Solid/hazardous Waste and ambient Air and Emissions. To become certified a laboratory must be directed by an individual who is qualified through education and experience, perform satisfactorily in at least semi-annual proficiency testing and a biennial on-site inspection.

Lake Champlain LTM QAPP/Workplan Revision 1.4 May 23, 2016
Page 42 of 71
Certified laboratories are required to use state-approved analytical methods and adhere to a program of mandated quality assurance/quality control procedures. The NYSDOH provides a Laboratory Certification Manual detailing procedures and protocols for certification: http://www.wadsworth.org/regulatory/elap 18.2 Invasive Species Documentation A variety of invasive species, including zebra mussels and alewife, are currently present in Lake Champlain. Numerous others are present in watersheds abutting Lake Champlain. The LCBP Aquatic Nuisance Species Subcommittee was created in 2005 to facilitate communication among partner agencies within the Basin with respect to identification and response to aquatic invasive species. The VTDEC and NYSDEC field personnel are members of this subcommittee and receive notification of potential and confirmed occurrences of new species. Any new invasive species found during program activities will be reported to the ANS Subcommittee and noted in the annual report.
19.0 Data Management 19.1 Field collection data Field collection data are noted on paper forms in the field. These forms are reviewed by each team. Originals from the NY field teams are maintained by the NY project manager at the NYDEC with copies accompanying samples sent for analysis to the VTDEC Laboratory in Vermont. Field documents are stored in a paper file in the Lakes and Ponds section of the Vermont Division of Watershed Management. These data receive a final evaluation at the end of each year, before incorporation into the project’s main database. Procedures for the year-end review of field data are located in Appendix B. 19.2 Water Chemistry Data Data management procedures for the VAEL are outlined in Section 10.0 of the Laboratory QAP (VAEL, 2013). This section covers data reduction, validation, reporting and storage procedures for the laboratory. Results of WQ analyses are reviewed by laboratory staff and periodically by the VT field team. Discrepancies and possible quality issues are addressed, and transmitted to the NY team as necessary. At the end of the year, approved water quality data is downloaded electronically and reviewed by VT staff prior to inclusion in the project database. Procedures for the year-end review of laboratory data are located in Appendix B. 19.3 Biological Data Biological data acquisition is overseen by NY staff (mysids, and zooplankton) or VT staff (phytoplankton and zebra mussels). Each team is responsible for sample analysis, data compilation, necessary calculations, and final review. Upon completion of this process, summary data are added to the Project database. Original analytical data reside with the respective project team. Summary data will be added to the project’s main database and will be accessible via the webpage. The complete databases will be available upon request. Phytoplankton Phytoplankton data are overseen by VT staff. Counts are recorded with a commercially purchased program, “Counter”. Biomass measurements are recorded in an ACCESS file. Data are evaluated for accuracy and completeness by the analyst during the course of the analysis and receive a second review prior discarding the sample. Data are backed up each day. Completed analytical data receive a final check for completeness and are

Lake Champlain LTM QAPP/Workplan Revision 1.4 May 23, 2016
Page 43 of 71
added to main phytoplankton data table. Final data storage and calculations of cell density/L and biomass/L are accomplished using Microsoft Access™. Summary data for each site are added to the project’s main database and are accessible via the webpage. The complete phytoplankton database is available upon request. Zooplankton and Mysids Zooplankton and Mysid data are maintained by the NYDEC project manager. All raw counts are recorded by the examining laboratory technicians into Microsoft ® Office Excel 2003 spreadsheet templates. Data are evaluated for completeness and accuracy. Formulas for conversion to density values are re-verified. All data are backed up on redundant hard-drives, as well as, written to compact disc. Final approved data will be migrated to Microsoft ® Office Access 2003 to be merged with the Long Term Project dataset. Zooplankton datasets are available upon request. Zebra mussels Zebra mussel data are overseen by VT staff. Counts are recorded on laboratory datasheets and entered into ACCESS database. Data are evaluated by the analyst during the course of the analysis and data entry process. Final data storage and calculations are accomplished using ACCESS. Summary data will be added to the project’smain database and will be accessible via the webpage:http://dec.vermont.gov/watershed/lakes-ponds/aquatic-invasives/monitoring/zebra-mussels. The complete data are available upon request. 19.4 Electronic Data storage The project master database and associated datasets are stored on VTDEC and NYSDEC computer servers. Daily and monthly back-ups are performed and the tapes are stored separately in fireproof cabinets in a locked room. See also Section 10.4 of the VAEL QAP for a complete description (VAEL, 2013). Additional data back-ups are stored on redundant servers as well as written to compact disc. The data are available to other government agencies, researchers, consultants, students, and the general public on request in either electronic, paper copy form or on the web at http://dec.vermont.gov/watershed/lakes-ponds/monitor/lake-champlain. Data are uploaded to Storet each spring as part of the VT DEC’s data package.
20.0 Assessments and Response Actions The VAEL is accredited through The National Environmental Laboratory Accreditation Institute-TNI (formerly NELAC). A TNI on-site audit is conducted every two years. A USEPA Region I Office of Environmental Measurement and Evaluation representative is a member of the TNI audit team. EPA Region I accepts TNI accreditation which is through the NH ELAP. Additional Laboratory Systems and Performance Audits are described in Section 12.0 of the Laboratory QAP (VAEL, 2013). Additionally, procedures for addressing problems encountered within the analytical laboratory and reporting corrective actions associated with the LTMP data to project staff are outlined in the Laboratory QAP (VAEL, 2013). Other significant sources of errors may arise from analytical and equipment problems associated with field instruments and sampling equipment, as well as, and deviations from intended plans and procedures. Deviations from the instruments, equipment, methods, or procedures outlined elsewhere in this plan will be identified and reported on the field data sheets. Additionally, the entire project will be available for inspection and review at any time. The project managers will conduct reviews with the project QA officers and other team members, as necessary, to check for project deficiencies, irregularities, or other problems. Deficiencies, irregularities, or other problems observed shall be reported to the project staff responsible for the element in question. Appropriate project personnel shall then develop and implement a corrective action to ensure the integrity of the project.

Lake Champlain LTM QAPP/Workplan Revision 1.4 May 23, 2016
Page 44 of 71
21.0 Reports Quarterly progress reports will be issued to the Lake Champlain Basin Program during the course of the study. Project managers and/or field team members will report on current status of on-going work, accomplishments, and problems encountered. Reports will be submitted through each state’s Lake Champlain Coordinator. An annual report is the joint responsibility of the co-investigators. An annual report will consist of a summary of the history and purpose of the LTMP, description of the sampling network, summary of field sampling and analytical methods, parameter listings, and data tables. The purposes of this annual report will be achieved by maintaining an up-to-date Program Description document, graphical statistical presentations of the data, and an interactive database on the project website: http://dec.vermont.gov/watershed/lakes-ponds/monitor/lake-champlain. In addition, the quarterly report produced in April each year will provide a summary of program accomplishments for the calendar year just ended, including the number of samples obtained and analyzed at each site by parameter. The project website will provide the ability for data users to selectively view the original data for specific sampling stations, time periods, and analytical tests using simple, interactive query forms. The tabular data displayed on the website can then be readily transferred to standard spreadsheet programs for further analysis. The tributary stations were sampled during 1990-1992 for total phosphorus, dissolved phosphorus, and chloride by the Lake Champlain Diagnostic-Feasibility Study (Vermont DEC and New York State DEC, 1997) using the same sampling and analytical methods employed by the current long-term monitoring program. These earlier tributary data have been added to the project database and will be included in the graphical statistical summaries well. Graphical displays of the chemical data on the project website will be updated annually to include each year’s data in a time series. These data are depicted as cumulative box plots for each test at each lake and tributary station over the entire monitoring period, showing median, 10th, 25th, 75th and 90th percentiles. Annual data are presented as scatterplots with trend lines determined by Lowess smoothing techniques. The lake graphs will include only data from epilimnion and unstratified samples. When results are below analytical detection limits, the detection limit will be used (i.e., ‘less than signs’ will be ignored). When simultaneously obtained field duplicates exist, only the first member of a duplicate pair will be used. Biological data will be summarized on the project website and will be updated annually thereafter. Graphical formats to best present abundance, composition and biomass of phytoplankton and zooplankton will be developed for the long term cumulative dataset and updated annually. Graphs will also be developed for the cumulative dataset for mysid abundance at each station and subsequently added into the project database when completed. Presentations of veliger and settled juvenile zebra mussel densities for Lake Champlain, major tributaries and inland lakes will follow the formats used in previous annual reports of zebra mussel monitoring efforts, incorporating existing historical data. The biological data are integrated into the interactive web-based dataset. These data are available for viewing and querying similarly to the water chemistry data. Additionally, the data from the biological monitoring effort will be available in paper format, electronically in spreadsheet format, or on CD.

Lake Champlain LTM QAPP/Workplan Revision 1.4 May 23, 2016
Page 45 of 71
22.0 Data Review, Validation, and Verification Requirements Water chemistry analysis is being conducted by the Vermont Agriculture and Environmental Laboratory (VAEL). Reference may be made to the quality assurance plan Section 10 (VAEL, 2013). Each data package generated is peer reviewed by a second staff analyst. The data are electronically imported into laboratory management system, and checked by a second analyst. The laboratory supervisor or designee reviews all parameters associated with a sample prior to authorizing the results. The zooplankton analysis is being conducted by the Lake Champlain Research Institute (LCRI) at the State University of New York at Plattsburgh. The phytoplankton and zebra mussel analyses are being conducted at the Biological Aquatic Assessment Laboratory of the Vermont DEC by Vermont project personnel. Similarly to the Vermont DEC lab process, the biological data will be peer reviewed in house before final review and release.
23.0 Validation and Verification Methods Final data validation is the responsibility of the Project Manager before reporting. Results of field blanks and duplicates are tracked during the sampling season to identify potential field-related problems. In the event that poor duplication or blanking is evident, data for the corresponding parameter is evaluated to ensure its quality. Poor replication or blanking may be cause for rejecting an entire run of data, although this is not a necessity. Field data are also reviewed periodically during the season to ensure quality. At the close of the field season, data quality metrics are calculated and compared to data quality objectives. In addition to the review conducted by VAEL to verify laboratory data quality, data are examined for accuracy prior to inclusion in the master database. This includes a review of laboratory-flagged data and outlier evaluation as outlined in Appendix B1. The Project Manager works with the field staff and Laboratory QA officer to eliminate transcription error or to identify the source of the problem prior to any wholesale rejection of data.
24.0 Reconciliation with Data Quality Objectives Data quality will be assessed following protocols outlined in this document and erroneous values will not be incorporated into summary materials. A final report will be generated annually and summary materials will be posted to the project webpage. Summary materials will present the data in a variety of formats to facilitate evaluation of long-term changes, local conditions, and emerging concerns. Data generated by the LTMP are an integral component of the Lake Champlain Basin Program’s Opportunities for Action, the overall management plan for reducing and preventing pollution and restoring full ecological health in the Lake Champlain Basin. The data provide the baseline information necessary to evaluate water quality conditions in the Basin and assess effectiveness of management programs. An oral presentation will be made to the LCBP’s Technical Advisory Committee (TAC), which reviews and comments upon the report. Questions and concerns regarding the data will be discussed by the TAC and the project managers prior to final acceptance. Modifications and new directions for the program structure will be addressed at that time, and again as the work plan is developed for the upcoming year.

Lake Champlain LTM QAPP/Workplan Revision 1.4 May 23, 2016
Page 46 of 71
25.0 Budget
Category NEIWPCC-
VT EPA-VT Total to VT Total to NY TOTAL
Personnel $105,910a 0
Travel $0 0
Supplies $0 0
Equipment $0 0
Contractual $9,000b 170,000
Laboratory Services $78,644c 0
Administrative Direct $39,628 0
Indirect Charges $18,522 0
TOTAL $ 113,750 $251,703 $365,453 $170,000 $535,453
Notes: a Includes salary and fringe for one full-time Environmental Scientist, managerial and administrative personnel support, and one six-month field assistant. b Includes support for the Rock River monitoring project sampling and cost-share for one UVM summer student intern. c Includes $5,100 for laboratory services for Rock River monitoring project.
Lake Champlain LTM QAPP/Workplan Revision 1.4 May 23, 2016
Page 47 of 71
26.0 References APHA 2005. American Public Health Association. Standard Methods for the analysis of water and wastewater. 21st edition. American Public Health Assocation. Washington D.C, Balcer, M.D., N. Korda and S. Dodson. 1984. Zooplankton of the Great Lakes. A guide to the identification and ecology of the common crustacean species, 174 p. University of Wisconsin Press. Barbiero, Richard P. 2003. Variability of Crustacean Zooplankton Data Generated by the Great Lakes National Program Office’s Annual Water Quality Survey. USEPA, GLNPO, Chicago, Il. Brown, E., A. Duchovnay, A. Shambaugh, and A. Williams and A. McIntosh. 1992. 1991 Lake Champlain Biomonitoring Program. Vermont Water Resources and Lake Studies Center. University of Vermont. Burlington. Brown, E., A. Duchovnay, A. Shambaugh, and A. Williams and A. McIntosh. 1993. 1992 Lake Champlain Biomonitoring Program. Vermont Water Resources and Lake Studies Center. University of Vermont. Burlington. Ettl, H. and Gärtner, G. 1988. Süsswasserflora von Mitteleuropa. Band 10. Chlorophyta II: Tetrasporales, Chlorococcales, Gloeodendrales. Gustav Fisher Verlag, Stuttgart. Fish, 1995. Laboratory Manual For Wastewater Analysis. Vermont Department of Environmental Conservation. Waterbury, VT. http://www.anr.state.vt.us/dec/ww/lab.htm Fish, A. 1996. Quality Assurance Guidelines for Wastewater Treatment Facility Laboratories. Vermont Department of Environmental Conservation. Waterbury, VT. http://www.anr.state.vt.us/dec/ww/om/LaboratoryQualityControlManual.pdf Green, R.H. 1989. Power analysis and practical strategies for environmental monitoring. Environmental Research. 50:195-205. HACH® Environmental. 2006. Hydrolab DS5X, DS5, and MS5 Water Quality Multiprobes User Manual. February 2006. Edition 3. Loveland, CO. HACH® Environmental. 2006 a HACH LDO™ Sensor Instruction Sheet. February 2006. Edition 4. Loveland, CO. Hirsch, R.M., Moyer, D.L., and Archfield, S.A., 2010. Weighted regressions on time, discharge, and season (WRTDS) with an application to Chesapeake Bay river inputs: Journal of the American Water Resources Association (JAWRA), v. 46, no. 5, p. 857–880. http://onlinelibrary.wiley.com/doi/10.1111/j.1752-1688.2010.00482.x/abstract. Johnson, T.B., M. Hoff, A. Trebitz, C. Bronte, T. Corry, J. Kitchell, S. Lozano, D. Mason, J. Scharold, S. Schram, D. Schreiner. 2004. Spatial Patterns in Assemblage Structures of Pelagic Forage Fish and Zooplankton in Western Lake Superior. Journal of Great Lakes Research 30 (Supplement 1):395-406 Knowlton, M.F., M.V. Hoyer, and J.R. Jones. 1984. Sources of variability in phosphorus and chlorophyll and their effects on use of lake survey data. Water Resources Bull. 20:397-407. Lake Champlain Basin Program. 2010. Opportunities for Action. An evolving plan for the future of the Lake Champlain Basin. Prep. by the Lake Champlain Steering Commitee. Grand Isle, VT.
Marsden, J.E. 1992. Standard protocols for monitoring and sampling Zebra mussels. Illinois Natural History Survey Biological Notes 138, Champaign, Illinois. 40 pp.
Medalie, L. and E. Smeltzer. 2004. Status and trends of phosphorus in Lake Champlain and its tributaries, 1990-2000. In Manley, T. et al. (eds.) Lake Champlain: Partnership and Research in the New Millennium. Kluwer Academic/Plenum Publishers. New York.
Medalie, L. 2013. “Concentration, Flux, and the Analysis of Trends of Total and Dissolved Phosphorus, Total Nitrogen, and Chloride in 18 Tributaries to Lake Champlain, Vermont and New York, 1990-2011.” USGS Scientific Investigations Report 2013-5021.
Mihuc T., F. Dunlap, C. Binggeli, L. Myers, C. Pershyn, A. Groves, and A. Waring. “Long-Term Patterns in Lake Champlain’s Zooplankton: 1992-2010.” Journal of Great Lakes Research (2012) 38:49-57.
Lake Champlain LTM QAPP/Workplan Revision 1.4 May 23, 2016
Page 48 of 71
Myer, G.E. and G.K. Gruendling. 1979. Limnology of Lake Champlain. Prep. for New England River Basins Commission. Burlington, VT. 407p. New York State Department of Environmental Conservation 2011. Lake Champlain LTM SOP 401-11 Rev 1.0. Ray Brook, NY Peterman, R.M. 1990. Statistical power analysis can improve fisheries research and management. Can. J. Fish. Aquat. Sci. 47:2-15. Prescott, G.W. 1982. Algae of the Western Great Lakes Area. Second Edition. Otto Koeltz Science Publishers, Koenigstein. Siegfried, Clifford. Director, NYS Museum. Personal Communication. 04/24/06. Smeltzer, E., W.W. Walker, Jr., and V. Garrison. 1989. Eleven years of lake eutrophication monitoring in Vermont: A critical evaluation. In Enhancing State Lake Management Programs. Proc. Natl. Conf. May 12-13, 1988. Chicago. Smeltzer, E., S. Shambaugh, and P. Stangel. “Environmental Change in Lake Champlain Revealed by Long-Term Monitoring.” Journal of Great Lakes Resarch. (2012) 38:6-18 Smeltzer, E., F. Dunlap, and M. Simoneau. 2009. “Lake Champlain Phosphorus Concentrations and Loading Rates, 1990-2008” Prep. for Lake Champlain Basin Program. Grand Isle, VT. Snedecor, G.W. and W.G. Cochran. 1967. Statistical Methods. 6th ed. Iowa State Univ. Press. Ames, IA. U.S. Environmental Protection Agency. 2003. Standard Operating Procedures for Zooplankton Analysis. Great Lakes National Program Office, Chicago, Ill. Vermont Department of Environmental Conservation. 2006 Field methods manual. Vermont Department of Environmental Conservation, Waterbury, Vermont. 187 pp. http://dec.vermont.gov/sites/dec/files/wsm/mapp/docs/bs_fieldmethodsmanual.pdf Vermont Department of Environmental Conservation Laboratory. 2013. Quality Assurance Plan, Waterbury, VT. www.anr.state.vt.us/dec/lab/htm/QualityControl.htm Vermont Agriculture and Environmental Laboratory. 2015. Quality Systems Manual. Vermont Agency of Agriculture, Burlington VT. Vermont Department of Environmental Conservation and New York State Department of Environmental Conservation. 1997. A phosphorus budget, model, and load reduction strategy for Lake Champlain. Lake Champlain Diagnostic-Feasibility Study Final Report. Waterbury, VT and Albany, NY. Vermont Department of Environmental Conservation and New York State Department of Environmental Conservation. 1998. Long-Term Water Quality and Biological Monitoring Project for Lake Champlain: Cumulative Report for Project Years 1992-1996. Waterbury, VT and Albany, NY. Vermont DEC and New York State DEC. 2002. Lake Champlain Phosphorus TMDL. Waterbury, VT and Ray Brook, NY.
Walker, W.W. 1987. Empirical methods for predicting eutrophication in impoundments. Report 4, Phase III: Applications manual. Tech. Rep. E-81-9. Prep. for U.S. Army Engineers Waterways Experiment Station. Vicksburg, MS. Walker, W.W. 1988. Lake/reservoir sampling design worksheet. LRSD.WK1 version 1.0. Software package No. 3. North American Lake Management Society. Alachua, FL. Walker, W.W. 1996. Simplified procedures for eutrophication assessment and prediction: User manual. Instruction report W-96-2. (Updated April 1999). U.S. Army Engineer Waterways Experiment Station. Vicksburg, MS.
Wetzel, R.G. and G.E. Likens. 2000. Limnological analyses. 3rd edition. Springer-Verlag, New York . 429 pp.

Lake Champlain LTM QAPP/Workplan Revision 1.4 May 23, 2016
Page 49 of 71
Appendix A. Laboratory Methods for Biological Samples A 1. Zebra mussel veligers Analytical procedures and calibration follow methods detailed in Marsden (1992). A dissecting stereo-microscope at 30X magnification will be used with a cross-polarization light technique to enhance veliger detection for counting purposes. Veliger identification will be verified using a compound microscope with assistance from taxonomists at the Biomonitoring and Aquatic Studies Section of the VTDEC. For samples containing relatively few veligers (<100 per sample), all veligers will be counted. If veliger samples are too numerous to count in full (>100 per sample), the sample will be diluted quantitatively as necessary and three 1 ml subsamples will be extracted into a Sedgewick-Rafter cell and counted. A 2. Zebra mussel settled juveniles Settled juvenile densities will be determined using methods described by Marsden (1992). The 15 X 15 cm (225 cm2) settling plate will be placed under a dissecting stereo-microscope at 30X magnification and all juveniles that have settled on the undersides of the plate will be counted. Only one side of the plate will be examined, as mussel shells on the bottom would be crushed while under the microscope. If settled juvenile densities are too abundant to count accurately, five 1 cm2 blocks will be counted using a 1 cm2 counting cell randomly placed on the plate. On season settling plates with dense encrustations and uniform distribution of individuals, ¼ of the plate will be counted. A 3. Setting up Phytoplankton Samples in Settling Chambers
1. Equipment Settling chamber unit: cylinder, baseplate, 2 glass plates Vaseline Small removable labels Pencil Graduated cylinder DI water
2. Procedure Using Vaseline, attach cylinder and baseplate together. Fill partially with DI to verify seal is
adequate. Chambers should be placed in a quiet, vibration-free location out of direct sun. Mix sample by inverting gently several times. Measure an appropriate sample aliquot in a graduated cylinder. (The volume will vary with the
amount of particulate and algal material likely to be in the sample. In general, 15-20mls provide sufficient organisms for counting. Too much material creates a 3 dimensional matrix that cannot be adequately counted.)
Pour sample into the settling chamber and rinse the graduated cylinder three times with a small amount of DI.
Using a DI squirt bottle, fill the chamber to the top and cap with a glass plate. There should be no more than a few drops forced out the chamber when the glass is put in place. There should be no leakage at the bottom of the cylinder. If there is leakage, the chamber will need to be drained, rebuilt and re-filled.
Using a removable label, note sample date, station and volume settled. Also note the date and time the chamber was filled. Place it on the base plate, on the side opposite the drainage hole.
Allow plankton to settle for 96 hrs.

Lake Champlain LTM QAPP/Workplan Revision 1.4 May 23, 2016
Page 50 of 71
A 4. Retrieving and Counting Settled Phytoplankton Samples
1. Equipment Catch basin (anything that will catch and retain the cylinder volume and allow the chamber to
be securely supported while draining. Small steep-sided bowls work well.) Filled settling chambers Glass cover plates Small disposable pipettor Microscope Analysis sheet
2. Procedure Transfer the column from the settling location to the catch basin, placing the drainage hole
over the basin. Do this CAREFULLY to avoid setting up currents in the chamber that will re-distribute the settled material.
Slowly slide the column over the drainage hole while holding it securely to the baseplate. While holding the base of the column steady and not disturbing the now-exposed sample in
the baseplate, slowly slide the glass plate at the top of the column to one side, releasing the liquid contained in the column into the catch basin. Slide the empty cylinder free of the base plate.
Look at the sample in the baseplate. To be able to place the glass cover plate with a minimum amount of disturbance, it should rise slightly above the level of the baseplate. If it does not, carefully add several drops of DI to the baseplate using the disposable pipettor.
Place one edge of the glass cover plate on the baseplate. Lower the cover plate so that it descends at an angle rather than parallel to the liquid surface, reducing the likelihood of trapping air under the cover. Do this gently – if large bubbles or currents are formed during this process, the uniform distribution of the algae on the bottom of the chamber is destroyed and the sample must be discarded.
Transfer the baseplate to the microscope. Using 200-400x, count the algae observed within the Whipple Grid boundaries using the following guidelines.
o Cells touching the upper and right boundaries of the grid are counted as falling within the grid. Those touching the lower and left boundaries are not.
o Count only those organisms that are within the grid. If a colony or filament lies partially outside of the grid, only record the number of cells that are within the grid.
o Cell counts must be estimated for dense colonies. Evaluate the colonial structure and the number of cells visible at the surface to estimate the numbers in the colony (e.g. if 10 cells are visible at the surface and the colony appears to have 4 layers, estimate 40 cells in the colony being counted.)
o Record both natural units and cell counts for each organism observed. o Count until at least 10 fields have been evaluated or 100 of the most abundant
phytoplankter have been counted. If the most abundant phytoplankter is a colony or cell, count at least 25 natural units and at least 100 cells.
o Identify each organism to the lower feasible taxonomic level. o After counting is completed, scan the chamber for taxa that were not observed during
counting. Record these as present (noted as -1) in the counting program. o Randomly select 10 individuals from each taxon. Measure them at 400x using the
ocular micrometer. Each taxon will have an assigned geometric figure and

Lake Champlain LTM QAPP/Workplan Revision 1.4 May 23, 2016
Page 51 of 71
measurements correspond to the axes needed for calculating the volume of the assigned figure.
o Clean the chambers, base plates and glass cover plates thoroughly with hot water and soap, followed by a final cleaning ethanol to remove any traces of Vaseline.
o Following APHA (2005), cells/mL = (C * A)/(F *AF * V) Where C = number of cells counted A = area of the chamber, mm2 F = number of fields counted AF = area of the field, mm2 V = volume settled, mL
A 5. Preparation and Counting of Net Phytoplankton Samples Using a Sedgewick Rafter Cell
1. Equipment Clean Sedgewick Rafter cells and cover slips Microscope with ocular micrometer and a Whipple Grid Small disposable pipettes Analysis sheet Graduated cylinder
2. Procedure Place cover slip on the empty Sedgewick Rafter cell so that ¾ of the cell is covered. If the cell
is filled properly, surface tension will pull the cover slip over the remaining portion of the cell and form a bubble-free seal.
Gently invert net plankton sample until well mixed. Using a clean disposable pipette, withdraw an aliquot of sample from the centrifuge tube. Dispense sample into the Sedgewick Rafter cell at the open end at a steady rate. Continue to
add liquid until the cover slip swings into place, sealing the cell. The chamber must be bubble-free and the material evenly dispersed. Otherwise, density calculations will be inaccurate. Discard the aliquot and repeat the procedure if the cell has not filled properly.
Using the graduated cylinder, measure the volume of the remaining concentrate. Add 1mL to this value (to account for the material used in the Sedgewick Rafter cell) and record on the data sheet.
Transfer the Sedgewick Rafter cell to the microscope. Using 200x, count the algae observed within the Whipple Grid boundaries using the following guidelines.
o Because samples were collected with a 63µm mesh net, do not count cells < than 50 µm in length (the width of 1 Whipple grid square at 200x) because their densities are not accurately represented in the samples. Record them on the data sheet as “present”. Diatoms and filaments with a length exceeding 50µm are counted despite the fact that their width may be significantly less than 50µm.
o Cells touching the upper and right boundaries of the grid are counted as falling within the grid. Those touching the lower and left boundaries are not.
o Count only those organisms that are within the grid. If a colony or filament lies partially outside of the grid, only record the number of cells that are within the grid.
o Cell counts must be estimated for dense colonies. Evaluate the colonial structure and the number of cells visible at the surface to estimate the numbers in the colony (e.g. if 10 cells are visible at the surface and the colony appears to have 4 layers, estimate 40 cells in the colony being counted.)
o Record both natural units and cell counts for each organism observed.

Lake Champlain LTM QAPP/Workplan Revision 1.4 May 23, 2016
Page 52 of 71
o Count until at least 10 fields have been evaluated or 100 of the most abundant phytoplankter have been counted. If the most abundant phytoplankter is a colony, count at least 25 natural units and a minimum of 100 cells. If this cannot be achieved with a single aliquot, rinse the chamber and count a second aliquot. Record the number of aliquots counted for each sample on the analysis sheet.
o Identify each organism to the lower feasible taxonomic level. o After counting is completed, scan the chamber for taxa that were not observed during
counting. Record these as “present” on the data sheet. o Randomly select 10 individuals from each taxon. Measure them at 400x using the
ocular micrometer. Each taxon will have an assigned geometric figure and measurements correspond to the axes needed for calculating the volume of the assigned figure.
o Clean the cells thoroughly before adding the next aliquot. o Following APHA (2005), cell density/L = number in concentrate/net volume (liters)
Cell number = (C * V)/(A * D * F) where C = number of cells counted
V = volume of the SR cell = 1000mm3 A = area of the field, mm2 D = depth of the field, 1 mm F = number of fields counted Number in concentrate = cell number*concentrate volume Net volume (meters3) = tow length (m) * π(0.065)2 Net volume (liters) = net volume (m3) * 1000
A6. Zooplankton laboratory workup
Laboratory glassware is cleaned according to standard laboratory protocols. Laboratory equipment is maintained, calibrated, and operated according to manufacturers’ specifications.
Gently invert sample bottle several times to mix the sample
Using a 1ml Henson-Stempel pipette, withdraw a subsample from the sample bottle. Rinse the outside
of the pipette. Dispense the subsample into a Sedgwick Rafter Counting cell.
Samples will be examined under an inverted microscope at appropriate magnification (40X to 100X).
Crustaceans and Rotifers will be identified to the lowest possible taxon. Additional 1ml subsamples will be similarly processed until at least 100 individuals of the dominant taxa are counted or the entire sample has been examined.
Zooplankton size will be measured and recorded. Up to 15 individuals of each taxon from each sample
will be measured. For crustaceans, length will be measured from the tip of the head to the base of the tail spine (cladocerans) or caudal rami (copepods) (Johnson et al., 2004). For rotifers, length will be measured from the corona to the opposite end at the base of the spine or to the opposite end and excluding any extensions (USEPA, 2003). Size distributions will be recorded as counts per 0.1mm size categories. Abundance estimates will be converted to biomass estimates using literature values.

Lake Champlain LTM QAPP/Workplan Revision 1.4 May 23, 2016
Page 53 of 71
Raw counts will be entered into Microsoft ® Office Excel 2003 spreadsheet templates. Density information will be calculated for each raw data entry using the formula:
[ ( TSV / SSV ) X RC ] / NVF
Where: TSV = Total Sample Volume SSV = # of sub-samples X sub-sample volume RC = Raw Data Count NVF = Net Volume Filtered given as area of net mouth opening in square meters X net tow depth in meters.
A7. Mysids laboratory workup
Samples are received in the laboratory preserved in a 10% formalin solution. Samples will be washed on a 200µm sieve and mysids will be picked and placed in 90% ethyl alcohol in glass scintillation vials for archiving. Samples will be labeled with station, date, tow depth, replicate.
Mysids will be examined under a binocular microscope and identified as male, female, or immature. A
developed (or evidence of developing) 4th pleopod on the 4th abdominal segment will signify a male while the presence of a marsupial pouch (or evidence of developing pouch) ventrally located beneath the carapace and between the swimming legs will signify a female. Indistinguishable individuals will be labeled as immatures.
Ovigerous females and brood sizes will be recorded. Brood stage will be noted as one of four;
o Stage 1: spherical egg o Stage 2: elongated, but indistinguishable parts
o Stage 3: elongated, but distinguishable parts (eyes visible)
o Stage 4: fully developed and ready for release.
Length measurements will be from just behind the eyes to the base of the telson using digital calipers. Laboratory workup will be recorded on bench sheets. Following review and verification, data will be
recorded into Microsoft ® Office Excel 2003 spreadsheet templates.

Lake Champlain LTM QAPP/Workplan Revision 1.4 May 23, 2016
Page 54 of 71
Appendix B: Data review procedures B 1. Adding annual data to the Project database
1. Begin this process after all data has been approved for release by the laboratory, usually not until mid-January.
2. Download data from SampleMaster using the Paradox format. Name this file “Prog63” and import into the Access 20XX_Chem data file. Ask the WQ Data Technician to run through the QC Check queries in the database, which include the following:
Check that the CustomerSampleNumber field is parsed correctly and has correct values for StationIDs, Time, Depth, QA code, Stratum, and FieldID. Check for duplicate FieldIDs.
Look over data that has been flagged by the chemists (e.g. overholds or other violations of QA/QC). Review the data, confer with the project manager and delete the codes or bad data as necessary.
Enter field data (temperature and Secchi for lakes; temperature, conductivity, pH for tributaries) Run the query to check the minimum and maximum for each lake and parameter. Check for data
that are anomalously high or low compared to previous years or unusual for the current year. Export the data to EXCEL and use the PivotTable and Chart function to plot the current year’s
data and compare it to past years and to itself. Make a final review of blanks data. Note any discrepancies or anomalies and discuss with the Project manager. Make appropriate
changes to the temporary data tables before appending to the main tables. 3. Have the WQ Data Technician run the queries to store the lake and tributary data in the WQ Data database,
where it will then be available on the WQ Division website. 4. A similar process is completed for the plankton data
Data are checked for accuracy and duplicate FieldIds. Plankton FieldIds are compared with water quality FieldIds. Minimum and maximum values are evaluated for accuracy.
Discrepancies are discussed with the Project Manager. The appropriate queries are run to complete the summary statistical calculations, store the data and
upload it to the WQ Division webpage. B 2. Updating Web Figures to include new data
1. Generate a query to collect all analyte data and sample date from the core lake stations Stratum = “E” or “U” QA = “A” Year = current year
2. Export the query table to EXCEL. 3. Open a lake webpage figure file in SigmaPlot. Each parameter has its own file, with a separate section
for the cumulative and annual data. In the annual figure data sheet, add the new year’s data to the column for each station. Take care
not to overwrite previous years’ data and check for the correct placement of new data. Run the transform steps to change sample date to Julian year-day and to create the Lowess-smoothed values for the figure.
In the cumulative figure data sheet, data are organized by station without regard to year. Copy the new data from EXCEL and paste into the appropriate station column. Take care not to override previous years’ data and to put data in the correct column.

Lake Champlain LTM QAPP/Workplan Revision 1.4 May 23, 2016
Page 55 of 71
To update the figures with the new data, double-click the graph. For the cumulative figure, double-click the “graph wizard” tab and verify that all stations are selected. For the annual figure, double-click the ‘graph wizard’ and verify that the appropriate data is selected for the current figure.
Verify that the figures accurately represent the new data. Figures should be compared to the previous year and checked for discrepancies. Update the title of the figures to include the new year. Update the name of the file to include the new year. Print the figures to facilitate checking.
4. Repeat these steps for the tributary figures. Use QA=”A” and the current year to generate the EXCEL file with a query. At this time, webpage tributary figures represent only cumulative data.

Lake Champlain LTM QAPP/Workplan Revision 1.4 May 23, 2016
Page 56 of 71
Appendix C. Project data forms
LAKE CHAMPLAIN LONG-TERM WATER QUALITY AND BIOLOGICAL MONITORING PROJECT - NY LAKE STATIONS
Collection Date (MMDDYY): Field Team:
Weather / Lake Conditions:
Accession # Sta # QA B,D
Time (24 hr)
Layer U,E,H
Depth (m)
Comp Depths (m)
Temp Co
Sp Cond (S/cm)
pH Secchi
(m) 4 1 . . . . . . . . . . . . . . . . . . . . . . . . . . . . . . . . . . . .
Sta # Chl-a Phyto Zoop Thermocline
Comments (m) (m) (m) Upper Lower
Unless otherwise noted: Thermocline and T/DO/pH/SpCond profiles at 1 M intervals with Hydrolab MS5 multiprobe sonde and Hydrolab Surveyor 4 logger. Chl-a samples are 100 ml samples collected by depth integrated hose and filtered onto 47 mm glass microfibre filters. Phytoplankton samples - 2X Secchi, vertical tow with 13 cm diameter 63 µm mesh net, 50 ml samples preserved with acid Lugols solution. Zooplankton samples - full column vertical tows with 30 cm diameter 153 m net, 100 ml samples, first narcotized and then preserved with buffered 10% formalin-sucrose-rose bengal solution to a final concentration of approximately 5% formalin solution

Lake Champlain LTM QAPP/Workplan Revision 1.4 May 23, 2016
Page 57 of 71
LAKE CHAMPLAIN LONG TERM MONITORING PROJECT – VT PHYSICAL PARAMETERS – LAKE
Collection Date (MMDDYY) __________________ Collector:________________
Weather conditions: Comments:Temp/DO data files: Phytoplankton sample type:
Field Id Number Sta # QA Time Layer Code
Depth (M)
Com Depths
Temp (C0)
Sp Cond (S/cm)
pH Secchi (M)
Ch-a Vol (ml)
. . .
. . .
. . .
. . .
. . .
. . .
. . .
. . .
. . .
. . .
. . .
. . .
. . .
. . .
. . .
. . .
. . .
. . .
. . .
. . .

Lake Champlain LTM QAPP/Workplan Revision 1.4 May 23, 2016
Page 58 of 71
LAKE CHAMPLAIN LONG TERM MONITORING PROJECT
PHYSICAL PARAMETERS - TRIBUTARIES
Collection Date (MMDDYY):________________ Collector:_________________
Field Id. Number Station QA Time Temp Sp.Cond. pH (0C) (S/cm)
. . . .
. .
. .
. .
. .
. .
. .
. .
. .
. .
. .
. .
. .
. .
Comments:

Lake Champlain LTM QAPP/Workplan Revision 1.4 May 23, 2016
Page 59 of 71
Lake Champlain Mysids Bench Tally Sheet
Station Date Depth Tally By Sheet of
Replicate Body Length in Millimeters as measured from behind the eyes to base of telsonMale 1 2 3 4 5 6 7 8 9 10 11 12 13 14 15 16 17 18 19 20
ABCDEF
Female 1 2 3 4 5 6 7 8 9 10 11 12 13 14 15 16 17 18 19 20ABCDEF
Juvenile 1 2 3 4 5 6 7 8 9 10 11 12 13 14 15 16 17 18 19 20ABCDEF
Replicate (A-F)Female SizeBrood StageBrood Size
Notes: Other Observations:Brood Stage
1 Egg2 Comma3 Eyes Developed4 Fully Developed
Mysid Size Distribution
Female Brood Data

Lake Champlain LTM QAPP/Workplan Revision 1.4 May 23, 2016
Page 60 of 71
Appendix D. Rock River Monitoring Program 2016 Quality Assurance Project Plan D 1. Problem Definition/Background A Rock River Watershed Targeted Best Management Practice (BMP) Implementation Project was initiated in 2010 with funding provided by the Lake Champlain Basin Program (LCBP) and with oversight provided by a coordinating committee including the U.S. Natural Resource Conservation Service (NRCS), the Vermont Agency of Agriculture, Food, and Markets (AAFM) and the Vermont Department of Environmental Conservation (DEC). The purpose of the project is to demonstrate water quality improvements from a focused agricultural BMP implementation effort in a small watershed where very high rates of phosphorus loading to Lake Champlain have been documented. The University of Vermont Extension Service was awarded a contract to implement the first phase of the BMP implementation project. This first phase included one-on-one outreach to the 12 to 15 farmers in the subwatershed and the development of farm-specific BMP action plans that addressed sediment and nutrient loss from crop, hay, and pasture fields. The Extension Service has provided farm assessments and technical assistance to nine farms in the watershed that agreed to participate in the project. The action plans developed for these farms included a variety of field-based agricultural BMPs such as cover crops and vegetative buffers. The second phase of the Rock River Subwatershed project was the implementation phase. Approximately $80,000 of LCBP funds was made available to UVM Extension for implementation of identified practices. It was intended that this funding will be used in conjunction with existing NRCS and AAFM funds to implement as many of the needed BMPs as possible in a short period of time. Most of the identified BMP implementation projects were expected to begin in 2013 or 2014. The Vermont Department of Environmental Conservation initiated a water quality monitoring project for the Rock River targeted watershed area in 2010 in order to provide before-and-after water quality data on the effects of BMP implementation. The Rock River Monitoring Program is now being supported by the Lake Champlain Basin Program. The ultimate duration of the Rock River monitoring program is not yet determined. Several years of post-BMP implementation data will be required to evaluate BMP effectiveness. D 2. Project Purpose/Task Description In order to document water quality improvements resulting from the targeted BMP implementation in the Rock River watershed, the Vermont DEC established monitoring stations immediately upstream and downstream of the BMP implementation area and funded the construction and operation of a U.S. Geological Survey (USGS) stream flow gage at the downstream site. The DEC issued a grant to the Friends of Northern Lake Champlain (FNLC), which was renewed in 2016, to support sample collection activities by trained local residents, and the Vermont Agriculture and Environmental Laboratory (formerly the VT DEC Laboratory) has been conducting the sample analyses.

Lake Champlain LTM QAPP/Workplan Revision 1.4 May 23, 2016
Page 61 of 71
D 3. Task/Organization Vermont DEC will be responsible for project management, oversight of field activities, and laboratory analyses (Section 4.0). The Friends of Northern Lake Champlain will conduct the sampling with training and supervision by Vermont DEC. D 4. Data Quality Objectives for Measurement Data Data quality objectives will be consistent with LTMP requirements (Section 7.0). D 5. Training Requirements/Certifications Training requirements applicable to Vermont DEC staff will be consistent with LTMP procedures (Section 8.0). Citizen samplers with the FNLC will be trained in person in the field by DEC staff on sampling methods, use of equipment, and sample documentation procedures. D 6. Documentation and Records FNLC field teams will document field generated data on Field Log Sheets which will be attached to the sample containers during local storage and subsequent transportation to the DEC Laboratory. The original Field Log Sheets will reside in an archive at the Vermont DEC office in Montpelier, VT. The project data will be maintained by Vermont DEC and stored in a Microsoft SQL Server database. Daily backup will be provided, and copies of backup files will be archived in separate locations. Database security features will be employed to prevent editing or deletion of the original data by users other than the authorized database administrators. The data will be available to other government agencies, researchers, consultants, students, and the general public on request. D 7. Sampling Process Design D 7.1 Sampling Stations A map of the study area and sampling stations is shown in Figure D1. The area targeted for BMP implementation is approximately 13.5 km2 in size on the upper Rock River in the towns of Highgate and Franklin, VT. Nearly all of the BMP implementation area is contained within the catchment area between the upstream monitoring station (RR20) and the downstream station (RR14). The implementation area occupies about 90% of the 15.1 km2 drainage area between the upstream and the downstream stations. Station location information is given in Table D1. A USGS continuous stream flow gage is co-located with the downstream sampling station (RR14).

Lake Champlain LTM QAPP/Workplan Revision 1.4 May 23, 2016
Page 62 of 71
Table D1. Location of monitoring stations. Station No. Location Latitude Longitude Drainage Area (km2) RR14a Cassidy Rd., Highgate, VT 44.96306 -72.99194 29.3b RR20 Barnum Rd., Franklin, VT 44.97279 -72.96785 14.2
a Co-located with USGS gage number 04294140 b Includes area draining to Station RR20
14
20
Contributing watershed
Sampling station 14
Targeted BMP implementation area
Figure D1. Map of the project area showing sub-watersheds draining to each sampling station and the approximate extent of the area targeted for BMP implementation. Drainage areas were delineated using the USGS StreamStats tool. (http://water.usgs.gov/osw/streamstats/Vermont.html)

Lake Champlain LTM QAPP/Workplan Revision 1.4 May 23, 2016
Page 63 of 71
D 7.2 Stream Flow Measurements A new USGS continuous flow gage (No. 04294140) with a drainage area of 29.3 km2 was established for this project at the downstream sampling location (RR14) in November 2010. The flow data are intended to serve several purposes. One purpose is to support a statistical analysis that controls for the effects of hydrologic variations between the pre-implementation and post-implementation periods. A second purpose is to permit the calculation of mass loading rates from the monitored watersheds. The Quebec Ministry of Sustainable Development, Environment, Wildlife, and Parks (MDDEFP) also maintains a continuous flow gage downstream on the Rock River at Saint Armand, QC (No. 030425, 70.9 km2 drainage area), and these data are available for use in supplementing the information from the USGS gage. D 7.3 Sampling Parameters and Methods Samples will be obtained manually as grab samples from the center of the river on each date for analysis of total phosphorus (TP), total dissolved phosphorus (DP), and total suspended solids (TSS). Sample containers, field processing procedures, and preservation methods will be consistent with LTMP procedures (Section 11.0). Sample site, parameter, date, and time will be recorded on container labels and written field forms. Samples will be stored locally with refrigeration (TSS only) for later pick-up and delivery to the Vermont DEC Laboratory by DEC staff. Due to logistical constraints in picking up and delivering samples to the laboratory, it will not be possible to analyze all TSS samples within the prescribed 7-day hold time, but these samples will be kept refrigerated throughout their storage time. A remark field in the database will be used to identify samples analyzed in the laboratory past their hold times so that appropriate data screening may be applied if deemed necessary at the time the data are statistically analyzed and reported. Sampling will be conducted biweekly year-round except during the winter months when snow and ice in the river make sampling impossible. Additional sampling will be conducted during high-flow events. The guideline used to define a high-flow event for sampling purposes will be the occurrence of either (1) a flow rate at the (MDDEFP) gage in excess of 2.0 m3/s, corresponding to the approximate upper 85th percentile of the historic average daily flows at this gage, or (2) a flow rate at the USGS gage greater than 30 cubic feet per second (cfs) which corresponds to a similar flow condition. D 7.4 Experimental Design The study was designed as an upstream/downstream – before/after analysis, which is a type of a paired watershed design (Clausen and Spooner, 1993). It was anticipated that Analysis of Covariance (ANCOVA) would be used to test for statistically significant differences in TP, DP, and TSS concentrations at the downstream station before vs. after BMP implementation (Meals, 2004). Corresponding concentrations at the upstream station would be used as the explanatory variable in the ANCOVA analysis in order to control for variations in hydrologic conditions and other factors between the pre-implementation and post-implementation periods, and to increase

Lake Champlain LTM QAPP/Workplan Revision 1.4 May 23, 2016
Page 64 of 71
the statistical power of the test. The option also exists to use the simultaneously measured flow rate at the USGS gage station as an explanatory variable. The ANCOVA method tests for differences in the linear regression relationship (slope and intercept) between the dependent variable (downstream concentration) and the independent (explanatory) variable. Effects of BMP implementation would be seen as a statistically significant reduction in the slope and/or intercept when comparing regressions for the before and after periods for a particular pair of variables. D 7.5 Sufficiency of Sampling Program to Achieve Project Objectives The sufficiency of the sampling program design for detecting phosphorus and sediment reductions after BMP implementation was evaluated using previously collected data at the two Rock River stream stations. Stations RR14 and RR20 were sampled on 12 dates between April 2008 and April 2009 as part of a synoptic sampling program conducted by Vermont DEC at sites throughout the Rock River watershed in Vermont. The FNLC began sampling at these two stations in October 2010 and final laboratory data available through July 2012 (N ≥ 126) were used for this analysis. The daily flow record at the USGS gage station was supplemented when data were missing during this period by predicting the daily flow at the USGS station from the flow at the MDDEFP gage using a regression relationship established between the two gages. Linear regression relationships between the Rock River variables are shown in Figure D2 for the data obtained from April 2008 through July 2012. Statistics for the regressions are given in Tables D2 and D3. All data were log-transformed prior to analysis to improve normality in the distributions of residual errors, and the statistics in Tables D2 and D3 were based on log10-transformed data. All regressions had positive slopes that were significantly different from zero (p<0.01). The regression relationships between upstream and downstream concentrations were moderately strong for TP and DP, as indicated by R2 values of 0.57 and 0.64 respectively, but weaker for TSS (R2 = 0.30). The regressions between concentration at Station RR14 and flow were very weak, with R2 values of 0.06-0.15. It is likely that the upstream concentrations, rather than the flow data, will prove to be the most useful explanatory variables for the ANCOVA analysis. The flow data will be remain useful for making loading estimates. The TSS regressions had some degree of autocorrelation present, as indicated by the Durbin-Watson statistics (Tables D2 and D3). It may be necessary to adjust for this autocorrelation during the final analysis in order to avoid inflated significance levels. The sufficiency of the calibration data set available to date for detecting phosphorus and sediment reductions after BMP implementation was tested using the “smallest worthwhile difference” method (Clausen and Spooner, 1993; Meals, 2004). This method considers the residual variance about the regression (from Tables D2 and D3) and the sample sizes during the before and after implementation periods (assumed to be equal) in order to estimate the smallest

Lake Champlain LTM QAPP/Workplan Revision 1.4 May 23, 2016
Page 65 of 71
change in the mean value of the dependent variable that would be detectable at a specified significance level (p=0.05). The smallest worthwhile difference analysis was conducted on log-transformed data, and the difference values were expressed as percent reductions from the geometric mean concentrations measured at the downstream station (RR14) during the calibration period. For the regressions involving concentrations at the downstream vs. upstream station, the smallest worthwhile differences were calculated to be 12% for TP, 8% for DP, and 22% for TSS. For the regressions involving downstream concentration vs. flow, which had higher residual variances, the calculated differences were 16% for TP, 12% for DP, and 25% for TSS. These results indicate that even relatively small reductions should be statistically detectable from the existing calibration data set if a post-implementation data set of equal size is obtained. However, the smallest worthwhile difference method assumes a statistical power of 50% (i.e., a 50% probability of detecting the specified change if it occurs). To increase the power of detecting these changes to a desired level of 80%, approximately twice the sample size may be needed (Loftis et al., 2001).

Lake Champlain LTM QAPP/Workplan Revision 1.4 May 23, 2016
Page 66 of 71
TP at Station RR20 (µg/L)
10 100 1000
TP a
t S
tatio
n R
R14
(µg
/L)
10
100
1000
DP at Station RR20 (µg/L)
1 10 100 1000
DP
at
Sta
tion
RR
14 (
µg/L
)
1
10
100
1000
TSS at Station RR20 (mg/L)
1 10 100
TSS
at
Sta
tion
RR
14 (
mg/
L)
1
10
100
1000
Flow at USGS Gage (cfs)
0.01 0.1 1 10 100 1000
TP a
t S
tatio
n R
R14
µg/
L)
10
100
1000
Flow at USGS Gage (cfs)
0.01 0.1 1 10 100 1000
DP
at
Sta
tion
RR
14 (
µg/L
)
1
10
100
1000
Flow at USGS Gage (cfs)
0.01 0.1 1 10 100
TSS
at
Sta
tion
RR
14 (
mg/
L)
1
10
100
1000
Figure D2. Regression relationships between TP, DP, and TSS concentrations at the downstream station (RR14) and the explanatory variables available for ANCOVA analysis. Dotted lines show 95% confidence intervals for the regressions. Data are from April 2008 through July 2012.

Lake Champlain LTM QAPP/Workplan Revision 1.4 May 23, 2016
Page 67 of 71
Table D2. Regression statistics for log of concentration at the downstream station (RR14) vs. log of concentration at the upstream station (RR20). Original units are as indicated in Figure 3.
logTP-14 vs. logTP-20 N=131 R2=0.57 Regression parameters Coefficient Std. Error t p Constant 0.398 0.138 2.877 0.005 TP-20 0.92 0.0707 13.013 <0.001 Analysis of Variance df SS MS F p Regression 1 8.331 8.331 169 <0.001 Residual 129 6.346 0.0492 Total 130 14.678 0.113 Durbin-Watson statistic = 1.589 (passed) logDP-14 vs. logDP-20 N=127 R2=0.64 Regression parameters Coefficient Std. Error t p Constant 0.539 0.0867 6.206 <0.001 DP-20 0.726 0.0487 14.907 <0.001 Analysis of Variance df SS MS F p Regression 1 2.424 2.424 122 <0.001 Residual 125 2.863 0.0229 Total 126 7.953 0.0631 Durbin-Watson statistic = 1.644 (passed) logTSS-14 vs. logTSS-20 N=126 R2=0.30 Regression parameters Coefficient Std. Error t p Constant 0.905 0.101 8.919 <0.001 TSS-20 0.753 0.104 7.248 <0.001 Analysis of Variance df SS MS F p Regression 1 10.584 10.584 52 <0.001 Residual 124 24.983 0.285 Total 125 35.567 0.285 Durbin-Watson statistic = 0.948 (failed)

Lake Champlain LTM QAPP/Workplan Revision 1.4 May 23, 2016
Page 68 of 71
Table D3. Regression statistics for log of concentration at the downstream station (RR14) vs. log of mean daily flow at the USGS gage. Original units are as indicated in Figure 3.
logTP-14 vs. logFlow N=131 R2=0.12 Regression parameters Coefficient Std. Error t p Constant 1.905 0.0719 26.498 <0.001 Flow 0.191 0.0464 4.12 <0.001 Analysis of Variance df SS MS F p Regression 1 1.707 1.707 17 <0.001 Residual 129 12.971 0.101 Total 130 14.678 0.113 Durbin-Watson statistic = 1.798 (passed) logDP-14 vs. logFlow N=127 R2=0.15 Regression parameters Coefficient Std. Error t p Constant 1.588 0.053 29.971 <0.001 Flow 0.163 0.0349 4.684 <0.001 Analysis of Variance df SS MS F p Regression 1 1.187 1.187 22 <0.001 Residual 125 6.765 0.0541 Total 126 7.953 0.0631 Durbin-Watson statistic = 1.529 (passed) logTSS-14 vs. logFlow N=132 R2=0.06 Regression parameters Coefficient Std. Error t p Constant 1.282 0.115 11.152 <0.001 Flow 0.212 0.0745 2.844 0.005 Analysis of Variance df SS MS F p Regression 1 2.113 2.113 8.0 0.005 Residual 130 33.948 .261 Total 131 36.061 0.275 Durbin-Watson statistic = 1.295 (failed)

Lake Champlain LTM QAPP/Workplan Revision 1.4 May 23, 2016
Page 69 of 71
D 8. Sampling Methods Requirements See Section D 7.3 above. D 9. Sample Handling and Custody Requirements Sample handling and custody requirements will be conistent with LTMP procedures (Section 12.0) except that initial custody of the sample will by held by FNLC samplers, prior to pick-up by Vermont DEC staff and transport to VAEL. D 10. Analytical Methods Requirements Analytical methods will be consistent with LTMP procedures (Section 13.0). D 11. Quality Control Requirements Laboratory quality assurance requirements will be consistent with LTMP procedures (Section 14.2). D 12. Instrument/Equipment Testing, Inspection, and Maintenance Requirements There are no instruments or equipment requiring testing, inspection, or maintenance for this project. D 13. Instrument Calibration and Frequency There are no instruments requiring calibration for this project. D 14. Inspection and Acceptance Requirements for Supplies Inspection and acceptance requirements for supplies will be consistent with LTMP procedures (Section 17.0). D 15. Non-direct measurements There are no non-direct measurement applicable to this project. D 16. Data Management Data management will be conducted according to LTMP procedures (Section 19.0), except that the Rock River monitoring data will not be made available on the LTMP website. These data will be available upon request to Vermont DEC staff. D 17. Assessments and Response Actions Assessments and response actions will be consistent with LTMP procedures (Section 20.0).

Lake Champlain LTM QAPP/Workplan Revision 1.4 May 23, 2016
Page 70 of 71
D 18. Data Review, Validation, and Verification Requirements Data review, validation, and verification requirements will be consistent with LTM procedures (Section 22.0). D 19. Validation and Verification Methods Validation and verification methods will be consitent with LTMP procedures (Section 23.0). D 20. Reconciliation with Data Quality Objectives The statistical evaluation of the study design (Section D 7.5 above) demonstrated that the design is sufficient to detect reductions in TP, DP, and TSS concentrations downstream of the targeted BMP implementation area if such reductions occur. A summary of the Rock River monitoring results will be included as part of the LTMP annual report to the Technical Advisory Committee (TAC), which reviews and comments upon the report. Questions and concerns regarding the data will be discussed by the TAC and the project managers prior to final acceptance of the report. Modifications and new directions for the program structure will be addressed at that time, and again as the work plan is developed for the upcoming year. D 21. Reports A summary of the Rock River monitoring results will be included as part of the LTMP annual report to the Lake Champlain Basin Program TAC. D 22. Budget The project budget for Rock River Monitoring Program is included within the budget for the Long-Term Monitoring Program (Section 25.0). Budget items specific to the Rock River Monitoring Program include contractual funds ($6,000) to support sampling by the Friends of Northern Lake Champlain and VAEL services ($5,100) for analysis of Rock River samples. The cost to operate the USGS gage on the Rock River is being funded by a State/USGS Cooperative Agreement. Additional support will be provided by Vermont DEC for database management, data analysis, and reporting.

Lake Champlain LTM QAPP/Workplan Revision 1.4 May 23, 2016
Page 71 of 71
D 23. References Clausen, J.C. and J. Spooner. 1993. Paired watershed study design. U.S. Environmental
Protection Agency, Office of Water, Washington, D.C. EPA 841-F-93-009. http://www.in.gov/idem/nps/files/iwpg_paired_watersheds.pdf
Loftis, J.C., L.H. MacDonald, S. Streett, H.K. Iyer, and K. Bunte. 2001. Detecting cumulative
watershed effects: The statistical power of pairing. J. Hydrology. 251:49-64. Meals, D.W. 2004. Water quality improvements following riparian restoration in two Vermont
agricultural watersheds. pp. 81-95 In Manley et al. (eds.) Lake Champlain: Partnerships and Research in the New Millennium. Kluwer Academic/Plenum. New York.