Embed Size (px)
Citation preview
Debugging and ProfilingLecture 7
Android Native Development Kit
8 April 2014
NDK Debugging and Profiling, Lecture 7 1/34
Logging
Debugging
Troubleshooting
Profiling
Bibliography
Keywords
NDK Debugging and Profiling, Lecture 7 2/34
Outline
Logging
Debugging
Troubleshooting
Profiling
Bibliography
Keywords
NDK Debugging and Profiling, Lecture 7 3/34
Android logging framework
I Logger kernel moduleI 4 separate buffers in memory
I Main for application messagesI Events for system eventsI Radio for radio-related messagesI System for low-level system debug messages
I Pseudo-devices in /dev/log
I Main, radio and system - 64KB buffers, free-form text
I Event - 256KB buffer, binary format
NDK Debugging and Profiling, Lecture 7 4/34
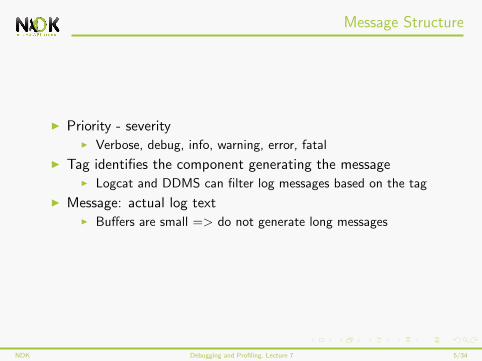
Message Structure
I Priority - severityI Verbose, debug, info, warning, error, fatal
I Tag identifies the component generating the messageI Logcat and DDMS can filter log messages based on the tag
I Message: actual log textI Buffers are small => do not generate long messages
NDK Debugging and Profiling, Lecture 7 5/34
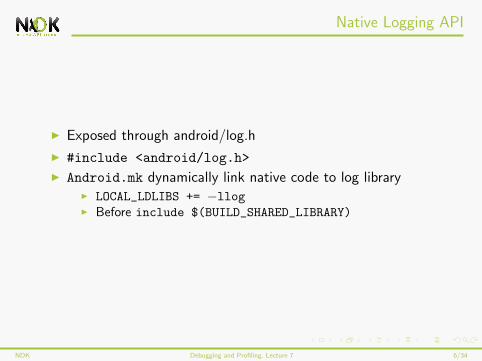
Native Logging API
I Exposed through android/log.h
I #include <android/log.h>I Android.mk dynamically link native code to log library
I LOCAL_LDLIBS += −llogI Before include $(BUILD_SHARED_LIBRARY)
NDK Debugging and Profiling, Lecture 7 6/34
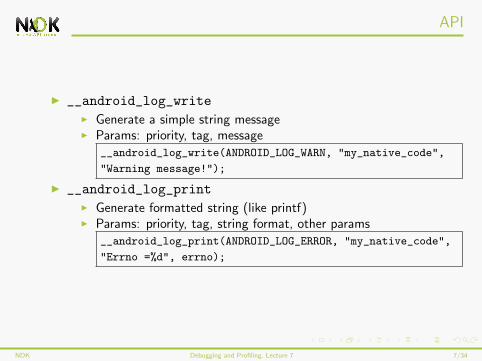
API
I __android_log_writeI Generate a simple string messageI Params: priority, tag, message
__android_log_write(ANDROID_LOG_WARN, "my_native_code",
"Warning message!");
I __android_log_printI Generate formatted string (like printf)I Params: priority, tag, string format, other params
__android_log_print(ANDROID_LOG_ERROR, "my_native_code",
"Errno =%d", errno);
NDK Debugging and Profiling, Lecture 7 7/34
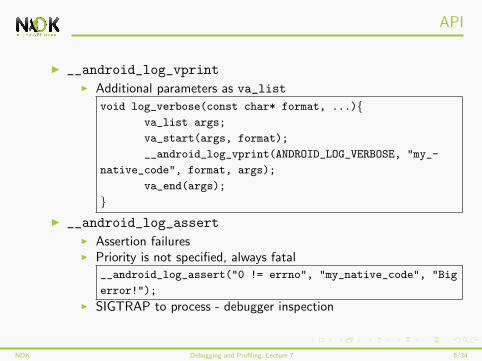
API
I __android_log_vprintI Additional parameters as va_list
void log_verbose(const char* format, ...){va_list args;
va_start(args, format);
__android_log_vprint(ANDROID_LOG_VERBOSE, "my_-
native_code", format, args);
va_end(args);
}I __android_log_assert
I Assertion failuresI Priority is not specified, always fatal
__android_log_assert("0 != errno", "my_native_code", "Big
error!");
I SIGTRAP to process - debugger inspection
NDK Debugging and Profiling, Lecture 7 8/34
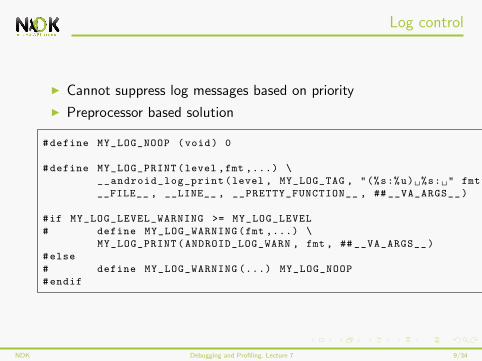
Log control
I Cannot suppress log messages based on priority
I Preprocessor based solution
#define MY_LOG_NOOP (void) 0
#define MY_LOG_PRINT(level ,fmt ,...) \
__android_log_print(level , MY_LOG_TAG , "(%s:%u) %s: " fmt , \
__FILE__ , __LINE__ , __PRETTY_FUNCTION__ , ## __VA_ARGS__)
#if MY_LOG_LEVEL_WARNING >= MY_LOG_LEVEL
# define MY_LOG_WARNING(fmt ,...) \
MY_LOG_PRINT(ANDROID_LOG_WARN , fmt , ## __VA_ARGS__)
#else
# define MY_LOG_WARNING (...) MY_LOG_NOOP
#endif
NDK Debugging and Profiling, Lecture 7 9/34
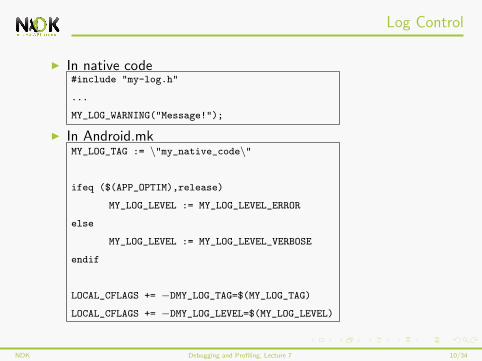
Log Control
I In native code#include "my-log.h"
...
MY_LOG_WARNING("Message!");
I In Android.mkMY_LOG_TAG := \"my_native_code\"
ifeq ($(APP_OPTIM),release)
MY_LOG_LEVEL := MY_LOG_LEVEL_ERROR
else
MY_LOG_LEVEL := MY_LOG_LEVEL_VERBOSE
endif
LOCAL_CFLAGS += −DMY_LOG_TAG=$(MY_LOG_TAG)LOCAL_CFLAGS += −DMY_LOG_LEVEL=$(MY_LOG_LEVEL)
NDK Debugging and Profiling, Lecture 7 10/34
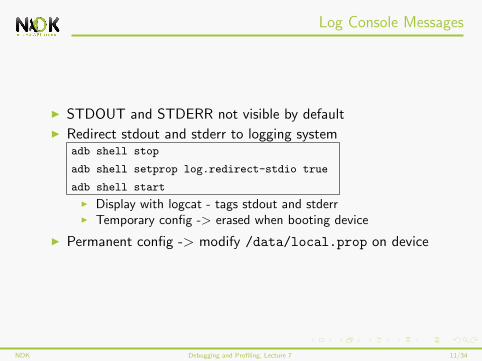
Log Console Messages
I STDOUT and STDERR not visible by defaultI Redirect stdout and stderr to logging system
adb shell stop
adb shell setprop log.redirect-stdio true
adb shell start
I Display with logcat - tags stdout and stderrI Temporary config -> erased when booting device
I Permanent config -> modify /data/local.prop on device
NDK Debugging and Profiling, Lecture 7 11/34
Outline
Logging
Debugging
Troubleshooting
Profiling
Bibliography
Keywords
NDK Debugging and Profiling, Lecture 7 12/34
GDB
I NDK supports debugging using GNU Debugger (GDB)I ndk-gdb script
I Handles error conditionsI Outputs error messages
I RequirementsI Use ndk-build -> build system generates files needed for
debuggingI android:debuggable in AndroidManifest.xmlI Android version 2.2 or higher
NDK Debugging and Profiling, Lecture 7 13/34
Debug Session Setup
I ndk-gdb script sets up the debug sessionI Launches the app using activity manager through ADB
I Activity manager sends the request to ZygoteI Zygote forks and creates new process
I ndk-gdb starts GDB server and attaches to the app
I Configures port forwarding to make GDB server accessiblefrom the host machine (debug port)
I Copies binaries for Zygote and shared libraries to the host
I Starts GDB clientI Debug session is active -> You can start debugging app
I Commands sent over the debug port
NDK Debugging and Profiling, Lecture 7 14/34
Debug from CLI
I Make sure Eclipse is closed
I Go to project directory
I rm -rf bin obj libs
I Compile native code using ndk-build
I We need build.xml -> android update project -p
I Compile and package the whole project in debug mode antdebug
I Deploy app on device ant installd
I ndk-gdb --start to start app and the debugging session
I When GDB prompt appears run commands
NDK Debugging and Profiling, Lecture 7 15/34
GDB Commands
I break: Breakpoint in a location (function name, file name &line number)
I clear: deletes all breakpoints
I enable/disable/delete: operations on a certain breakpoint
I next: go to the next line in source code
I continue: continue execution
I backtrace: display call stack
I backtrace full: call stack with local variables on frames
I print: display variable, expression, memory address, register
I display: continue printing value after each step
I info threads: list running threads
I thread: select a certain thread
NDK Debugging and Profiling, Lecture 7 16/34
DDMS
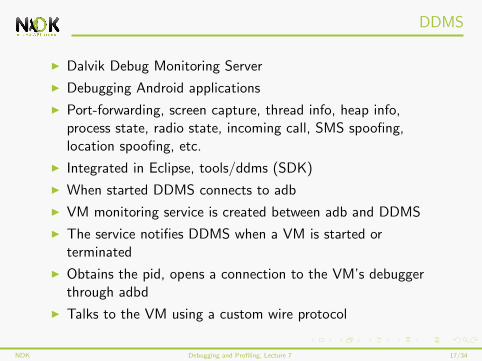
I Dalvik Debug Monitoring Server
I Debugging Android applications
I Port-forwarding, screen capture, thread info, heap info,process state, radio state, incoming call, SMS spoofing,location spoofing, etc.
I Integrated in Eclipse, tools/ddms (SDK)
I When started DDMS connects to adb
I VM monitoring service is created between adb and DDMS
I The service notifies DDMS when a VM is started orterminated
I Obtains the pid, opens a connection to the VM’s debuggerthrough adbd
I Talks to the VM using a custom wire protocol
NDK Debugging and Profiling, Lecture 7 17/34
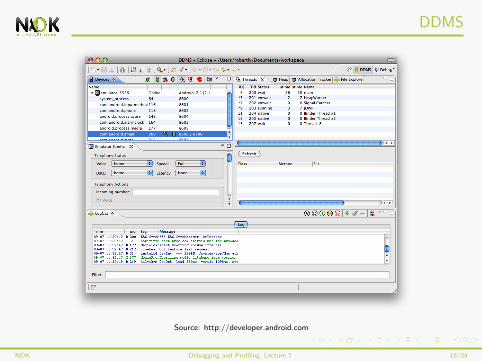
DDMS
Source: http://developer.android.com
NDK Debugging and Profiling, Lecture 7 18/34
DDMS
I View how much heap is the process usingI Select process in Devices tabI Update Heap to obtain heap infoI Cause GC to invoke Garbage Collection (refresh data)I Select object type to view number of allocated objects
I Track memory allocationI Start Tracking in the Allocation Tracker tabI Get Allocations to obtain list of allocated objectsI Finally Stop TrackingI Detailed info about the method and line that allocated a
certain object
I Examine thread infoI Update Threads to obtain thread info for the selected process
NDK Debugging and Profiling, Lecture 7 19/34
Outline
Logging
Debugging
Troubleshooting
Profiling
Bibliography
Keywords
NDK Debugging and Profiling, Lecture 7 20/34
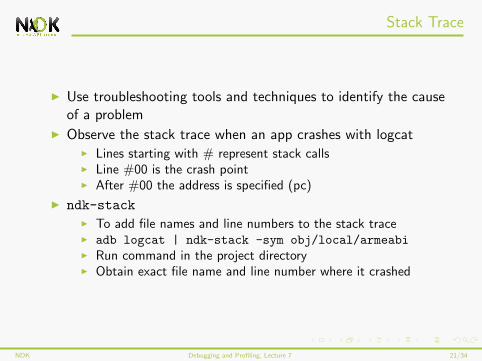
Stack Trace
I Use troubleshooting tools and techniques to identify the causeof a problem
I Observe the stack trace when an app crashes with logcatI Lines starting with # represent stack callsI Line #00 is the crash pointI After #00 the address is specified (pc)
I ndk-stackI To add file names and line numbers to the stack traceI adb logcat | ndk-stack -sym obj/local/armeabiI Run command in the project directoryI Obtain exact file name and line number where it crashed
NDK Debugging and Profiling, Lecture 7 21/34

CheckJNI
I Extended series of checks before calling JNI functionsI Enable CheckJNI on a device
I Rooted deviceadb shell stop
adb shell setprop dalvik.vm.checkjni true
adb shell start
I Logcat: D AndroidRuntime: CheckJNI is ON
I Regular deviceadb shell setprop debug.checkjni 1
I Logcat: D Late-enabling CheckJNI
I Error detected by CheckJNIW JNI WARNING: method declared to return
’Ljava/lang/String;’ returned ’[B’
W failed in LJniTest;.exampleJniBug
NDK Debugging and Profiling, Lecture 7 22/34
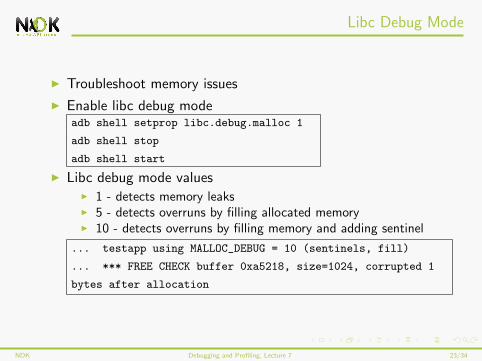
Libc Debug Mode
I Troubleshoot memory issues
I Enable libc debug modeadb shell setprop libc.debug.malloc 1
adb shell stop
adb shell start
I Libc debug mode valuesI 1 - detects memory leaksI 5 - detects overruns by filling allocated memoryI 10 - detects overruns by filling memory and adding sentinel
... testapp using MALLOC_DEBUG = 10 (sentinels, fill)
... *** FREE CHECK buffer 0xa5218, size=1024, corrupted 1
bytes after allocation
NDK Debugging and Profiling, Lecture 7 23/34
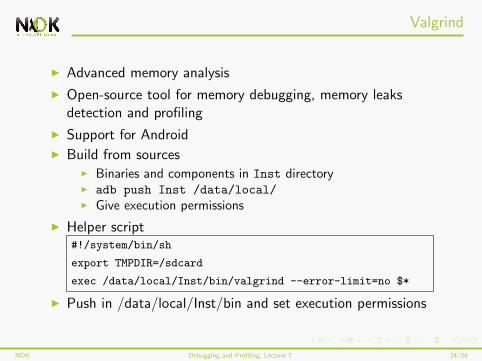
Valgrind
I Advanced memory analysis
I Open-source tool for memory debugging, memory leaksdetection and profiling
I Support for AndroidI Build from sources
I Binaries and components in Inst directoryI adb push Inst /data/local/I Give execution permissions
I Helper script#!/system/bin/sh
export TMPDIR=/sdcard
exec /data/local/Inst/bin/valgrind --error-limit=no $*
I Push in /data/local/Inst/bin and set execution permissions
NDK Debugging and Profiling, Lecture 7 24/34
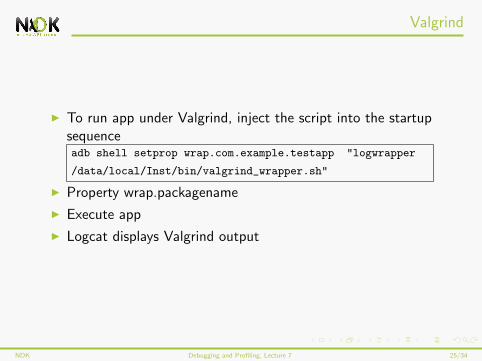
Valgrind
I To run app under Valgrind, inject the script into the startupsequenceadb shell setprop wrap.com.example.testapp "logwrapper
/data/local/Inst/bin/valgrind_wrapper.sh"
I Property wrap.packagename
I Execute app
I Logcat displays Valgrind output
NDK Debugging and Profiling, Lecture 7 25/34
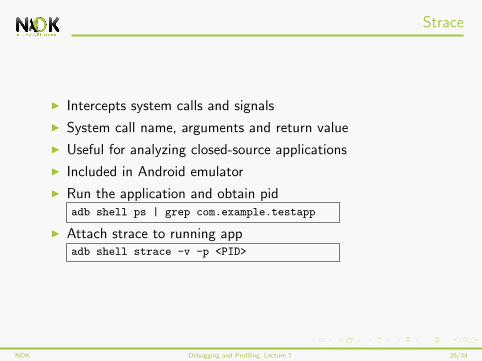
Strace
I Intercepts system calls and signals
I System call name, arguments and return value
I Useful for analyzing closed-source applications
I Included in Android emulator
I Run the application and obtain pidadb shell ps | grep com.example.testapp
I Attach strace to running appadb shell strace -v -p <PID>
NDK Debugging and Profiling, Lecture 7 26/34
Outline
Logging
Debugging
Troubleshooting
Profiling
Bibliography
Keywords
NDK Debugging and Profiling, Lecture 7 27/34
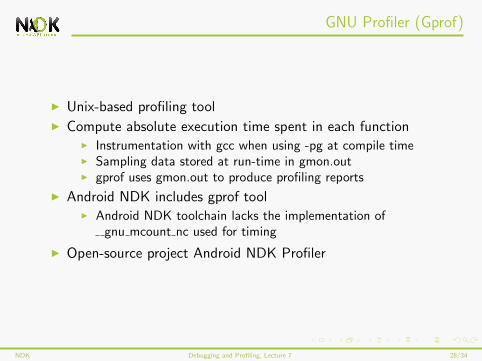
GNU Profiler (Gprof)
I Unix-based profiling toolI Compute absolute execution time spent in each function
I Instrumentation with gcc when using -pg at compile timeI Sampling data stored at run-time in gmon.outI gprof uses gmon.out to produce profiling reports
I Android NDK includes gprof toolI Android NDK toolchain lacks the implementation of
gnu mcount nc used for timing
I Open-source project Android NDK Profiler
NDK Debugging and Profiling, Lecture 7 28/34
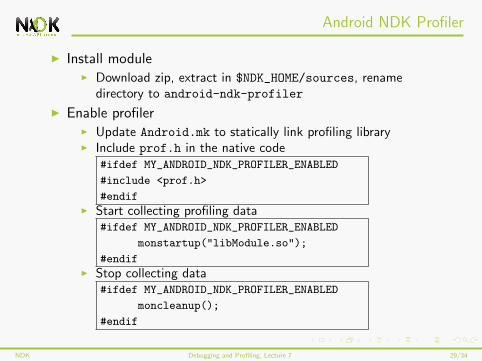
Android NDK Profiler
I Install moduleI Download zip, extract in $NDK_HOME/sources, rename
directory to android-ndk-profiler
I Enable profilerI Update Android.mk to statically link profiling libraryI Include prof.h in the native code
#ifdef MY_ANDROID_NDK_PROFILER_ENABLED
#include <prof.h>
#endifI Start collecting profiling data
#ifdef MY_ANDROID_NDK_PROFILER_ENABLED
monstartup("libModule.so");
#endifI Stop collecting data
#ifdef MY_ANDROID_NDK_PROFILER_ENABLED
moncleanup();
#endif
NDK Debugging and Profiling, Lecture 7 29/34
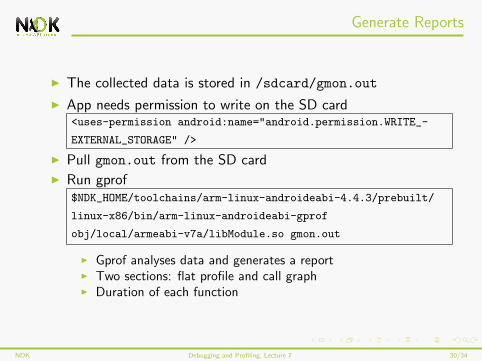
Generate Reports
I The collected data is stored in /sdcard/gmon.out
I App needs permission to write on the SD card<uses-permission android:name="android.permission.WRITE_-
EXTERNAL_STORAGE" />
I Pull gmon.out from the SD cardI Run gprof
$NDK_HOME/toolchains/arm-linux-androideabi-4.4.3/prebuilt/
linux-x86/bin/arm-linux-androideabi-gprof
obj/local/armeabi-v7a/libModule.so gmon.out
I Gprof analyses data and generates a reportI Two sections: flat profile and call graphI Duration of each function
NDK Debugging and Profiling, Lecture 7 30/34
Outline
Logging
Debugging
Troubleshooting
Profiling
Bibliography
Keywords
NDK Debugging and Profiling, Lecture 7 31/34
Bibliography
I Onur Cinar, Pro Android C++ with the NDK, Chapter 5, 14
I Sylvain Ratabouil, Android NDK, Beginner’s Guide, Chapter11
I https://code.google.com/p/android-ndk-profiler/wiki/Usage
I http://developer.android.com/tools/debugging/ddms.html
NDK Debugging and Profiling, Lecture 7 32/34
Outline
Logging
Debugging
Troubleshooting
Profiling
Bibliography
Keywords
NDK Debugging and Profiling, Lecture 7 33/34
I Logger
I Logging API
I Log control
I GDB
I DDMS
I Stack trace
I CheckJNI
I Libc Debug Mode
I Valgrind
I Strace
I Gprof
I Android NDK Profiler
NDK Debugging and Profiling, Lecture 7 34/34