Embed Size (px)
Citation preview
Debt Investor PresentationJuly 2021
2017. UK Power Networks. All rights reserved
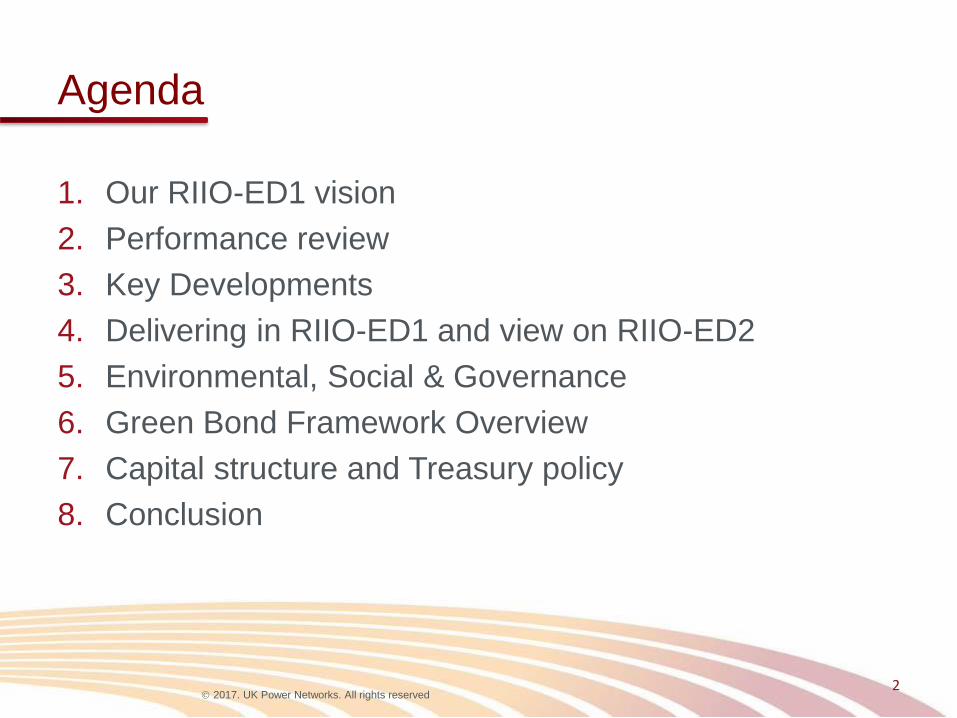
Agenda
1. Our RIIO-ED1 vision
2. Performance review
3. Key Developments
4. Delivering in RIIO-ED1 and view on RIIO-ED2
5. Environmental, Social & Governance
6. Green Bond Framework Overview
7. Capital structure and Treasury policy
8. Conclusion
2

2017. UK Power Networks. All rights reserved
1. OUR RIIO-ED1 VISION

2017. UK Power Networks. All rights reserved
Our Business Vision and Values
4
Performance focused within a set of values:
Integrity - Respect - Continuous Improvement - Responsibility - Unity - Diversity and Inclusiveness

2017. UK Power Networks. All rights reserved
2. PERFORMANCE REVIEW

2017. UK Power Networks. All rights reserved
32
28
32
9
11
5 53 3
2
5
0.15
0.12
0.16
0.05 0.06
0.03 0.03 0.02 0.02 0.01
0.02 -
0.05
0.10
0.15
0.20
0.25
0.30
0
5
10
15
20
25
30
35
2010/11 2011/12 2012/13 2013/14 2014/15 2015/16 2016/17 2017/18 2018/19 2019/20 2020/21F
Number of LTI incidents (employees and contractors)
LTI Accident frequency rates (per 100,000 hours worked)
Employer of Choice Performance• Our safety performance has
been the best across the GB
DNOs over the first five
years of RIIO-ED1
• We have seen an increase in
Lost Time Injuries in 2020/21
– We have introduced a
programme to ensure
focus remains on
operational safety as well
as COVID safety
• In 2020 UK Power Networks
was ranked 6th and achieved
its highest ever score of 768
in the Best Companies
survey
– This is a 7% improvement
on last year and places us
as a 3 star company, the
highest rating
• Achieved Platinum
accreditation from Investors
in People 6
84%Improvement in the frequency
rate of Lost Time Incidents
since 2010/11
5The number of incidents
where employees and
contractors needed at least
a full day off work due to
injuries during 2020/21

2017. UK Power Networks. All rights reserved
Respected and Trusted Corporate Citizen: Quality
of Supply Performance
• In 2020/21 CIs and CMLs
were 34% and 39% better
than the Ofgem target
• Our 2020/21 CML
performance is our best ever
• In 2020/21 we forecast to
earn £51.3m of IIS revenue
• This is 92% of the available
incentive revenue (£55.9m)
– EPN and LPN will earn
100% of the available
revenue
7
8663 57 60 53 46 49 49 41 44 44
24
2825 22
2119 17 14
14 13 13
77
5355 56
5049 48 47
44 45 45
0
50
100
150
200
250
2010/11 2011/12 2012/13 2013/14 2014/15 2015/16 2016/17 2017/18 2018/19 2019/202020/21
UKPN Customer Interruptions
EPN LPN SPN Ofgem Target
7247 50 51 40 35 39 42 35 34 32
42
31 34 3024
19 20 1716 14 11
73
4347 53
3536 35 38
37 33 33
0
50
100
150
200
250
2010/11 2011/12 2012/13 2013/14 2014/15 2015/16 2016/17 2017/18 2018/19 2019/202020/21
UKPN Customer Minutes Lost
EPN LPN SPN Ofgem Target
2017. UK Power Networks. All rights reserved
Respected and Trusted Corporate Citizen -
Customer Service Performance
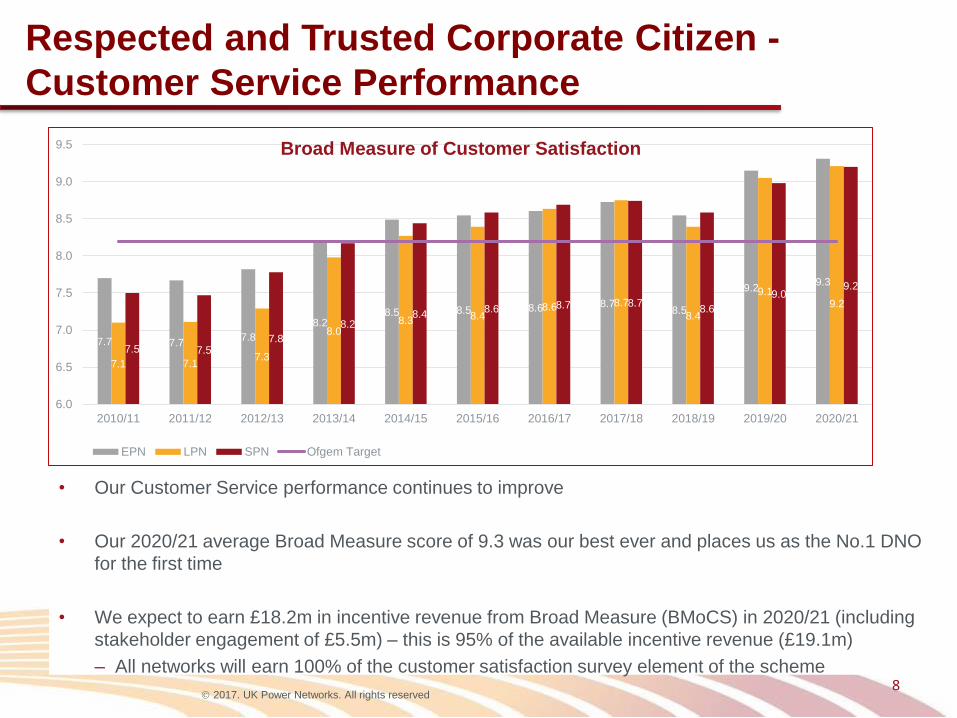
• Our Customer Service performance continues to improve
• Our 2020/21 average Broad Measure score of 9.3 was our best ever and places us as the No.1 DNO
for the first time
• We expect to earn £18.2m in incentive revenue from Broad Measure (BMoCS) in 2020/21 (including
stakeholder engagement of £5.5m) – this is 95% of the available incentive revenue (£19.1m)
– All networks will earn 100% of the customer satisfaction survey element of the scheme8
7.7 7.77.8
8.28.5 8.5 8.6 8.7
8.5
9.29.3
7.1 7.17.3
8.08.3 8.4
8.6 8.7
8.4
9.19.2
7.5 7.57.8
8.28.4
8.6 8.7 8.78.6
9.09.2
6.0
6.5
7.0
7.5
8.0
8.5
9.0
9.5
2010/11 2011/12 2012/13 2013/14 2014/15 2015/16 2016/17 2017/18 2018/19 2019/20 2020/21
Broad Measure of Customer Satisfaction
EPN LPN SPN Ofgem Target

2017. UK Power Networks. All rights reserved
Sustainably Cost Efficient - Cost Performance
• Our cumulative totex
outperformance over the first six
years of RIIO-ED1 was 14%
• We expect to deliver the highest
totex outperformance across all
DNOs
• Our output delivery is on track
• Health index delivery over the first five
years. We expect the cumulative six
year performance to be 79% compared
to a straight line target of 75%
9
25%
22%
18%16%
15%14%
0%
5%
10%
15%
20%
25%
30%
2015/16 2016/17 2017/18 2018/19 2019/20 20/21 F
Cumulative Underspend (%)
0%
10%
20%
30%
40%
50%
60%
70%
80%
90%
2015/16 2016/17 2017/18 2018/19 2019/20 2020/21 F
Cumulative Health Indicies Ofgem Target

2017. UK Power Networks. All rights reserved
3. KEY DEVELOPMENTS

2017. UK Power Networks. All rights reserved
Significant changes in Government policy
are driving faster decarbonisation
11
• Announcement of the Ten Point Plan, a series of ten commitments
supporting a green industrial revolution. The policy around Electric
Vehicles (EVs) could lead to an additional 2.3m EVs on our network by
2035
• In its Sixth Carbon Budget, the Climate Change Committee (CCC)
recommended a “Balanced Pathway” scenario to achieve net zero by
2050. The pathway is actually less ambitious than current EV policy, but
more ambitious regarding heat policy
• Energy White Paper, following the Ten Point Plan, sets out the
Government’s policies and commitments to reach net zero. This includes
the ambition to install 600,000 heat pumps a year by 2028, roughly one
third of which would be in UKPN’s licence area
2017. UK Power Networks. All rights reserved
The Electricity System Operator and the
DNOs have a agreed on a common future
energy scenario framework
12
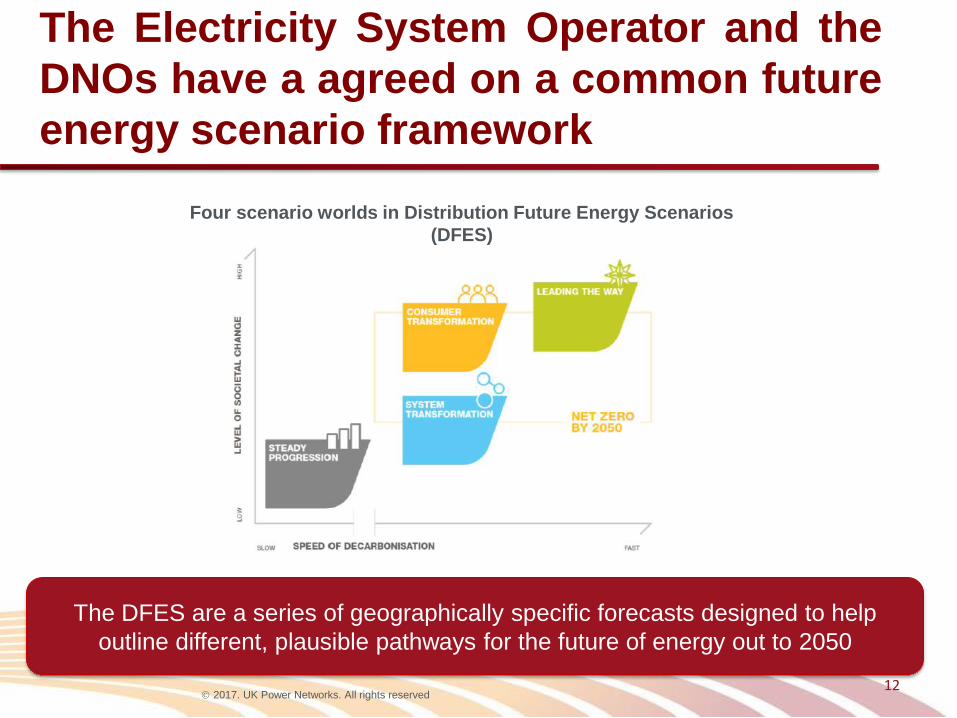
Four scenario worlds in Distribution Future Energy Scenarios
(DFES)
The DFES are a series of geographically specific forecasts designed to help
outline different, plausible pathways for the future of energy out to 2050

2017. UK Power Networks. All rights reserved
We expect significant deployment of Low Carbon
Technologies by 2030 under these scenarios
13
Scenario world
Parameter Steady ProgressionSystem
Transformation
Consumer
TransformationLeading the Way
Net-Zero by 2050? No Yes Yes Yes
Low-carbon gas grid? No Yes No Yes
Electric cars and vans in 2030 2.6 million 4.5 million 4.5 million 4.0 million
Homes with heat pumps in 2030 320,000 445,000 712,000 1,245,000
Homes with solar panels in 2030 195,000 248,000 397,000 248,000
Battery capacity in 2030 1.3 GW 2.7 GW 4.8 GW 4.1 GW
Total renewable generation in 2030 6.1 GW 7.2 GW 8.1 GW 8.6 GW

2017. UK Power Networks. All rights reserved14
The level of expenditure required in RIIO-ED2 will be
dependent on the rate of decarbonisation

2017. UK Power Networks. All rights reserved
4. DELIVERING IN RIIO-ED1 AND
VIEW ON RIIO-ED2
2017. UK Power Networks. All rights reserved
Different Approaches
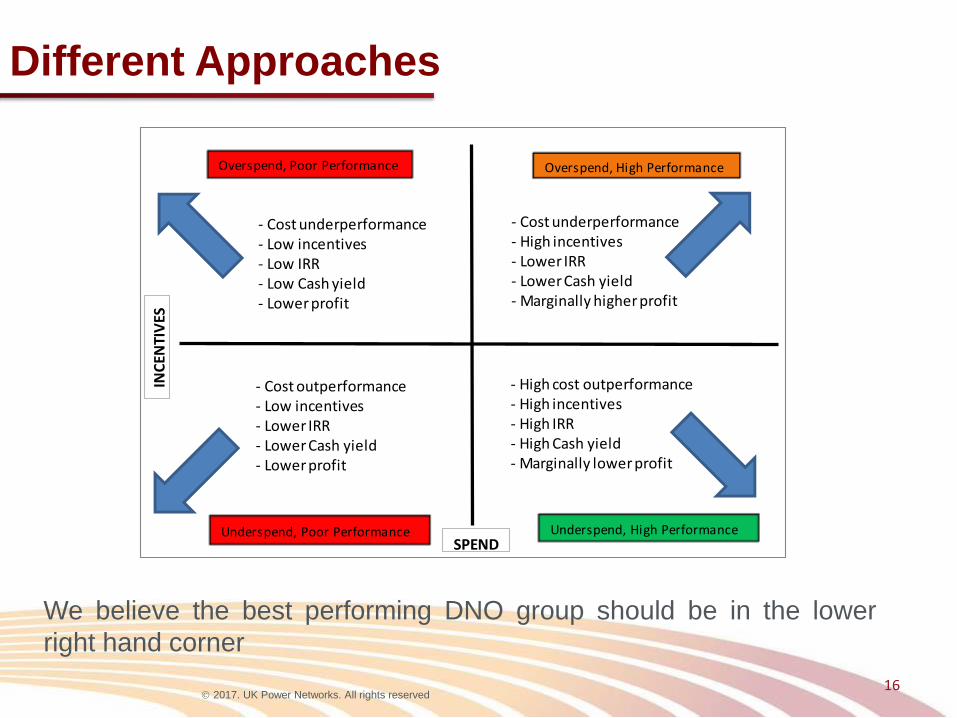
Underspend, Poor Performance
- High cost outperformance- High incentives- High IRR- High Cash yield- Marginally lower profit
- Cost underperformance- Low incentives- Low IRR- Low Cash yield- Lower profit
- Cost underperformance- High incentives- Lower IRR- Lower Cash yield- Marginally higher profit
- Cost outperformance- Low incentives- Lower IRR- Lower Cash yield- Lower profit
INC
ENTI
VES
Overspend, High PerformanceOverspend, Poor Performance
Underspend, High PerformanceSPEND
16
We believe the best performing DNO group should be in the lower
right hand corner
2017. UK Power Networks. All rights reserved
Comparative DNO Group Totex Analysis
17
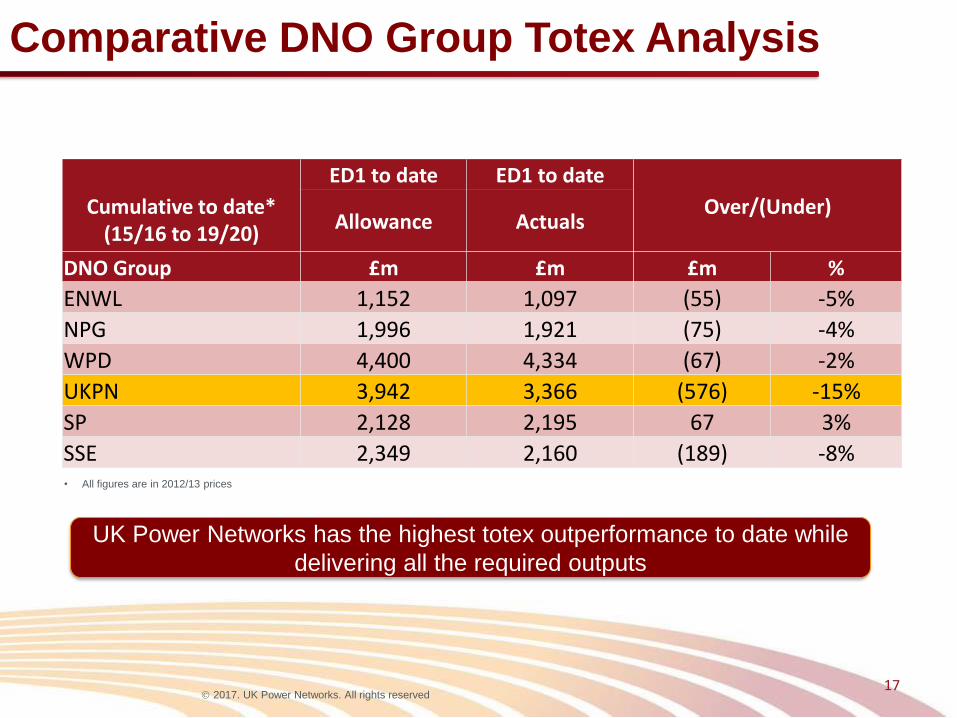
UK Power Networks has the highest totex outperformance to date while
delivering all the required outputs
Cumulative to date* (15/16 to 19/20)
ED1 to date ED1 to date
Over/(Under)Allowance Actuals
DNO Group £m £m £m %
ENWL 1,152 1,097 (55) -5%
NPG 1,996 1,921 (75) -4%
WPD 4,400 4,334 (67) -2%
UKPN 3,942 3,366 (576) -15%
SP 2,128 2,195 67 3%
SSE 2,349 2,160 (189) -8%• All figures are in 2012/13 prices

2017. UK Power Networks. All rights reserved
Comparative DNO Group Incentive Revenue
Analysis – First Five Years of RIIO-ED1
18
UK Power Networks has achieved the highest % of available incentive
revenue to date
DNO group IIS BMCSStakeholder
engagementATTQ/C Total
ENWL 85% 32% 99% 38% 74%NPG 89% 57% 31% 57% 78%WPD 75% 93% 92% 74% 79%UKPN 91% 61% 49% 74% 82%SP 37% 77% 53% 52% 46%SSE 33% 48% 84% 24% 38%

2017. UK Power Networks. All rights reserved
RIIO-ED1 Cumulative Comparative Analysis
19
We are the best performing DNO group over the first five years of RIIO-ED1

2017. UK Power Networks. All rights reserved
Ofgem RIIO-ED2 Sector Specific Methodology (SSMD)
20
Finance
Incentives
BPIThe operation of the Business Plan Incentive (BPI) is largely as expected.
However, Ofgem has made it easier to earn BPI rewards
Cost of Debt working assumptions is positive if maintained for Draft
Determinations. Cost of equity working assumption is as expected given CMA
appeal
Uncertainty
Environmental Scorecard and DSO are confirmed as new incentives although
without any information on size. The scale of others remains similar to the
SSMC, although the approach has changed for some
Ofgem have left the decision on key Uncertainty Mechanisms to future
consultation, or through the Draft Determinations. On Strategic Investment,
Ofgem’s initial focus is on a Capacity Volume Driver / Utilisation Metric, in line
with our position
Scenarios Ofgem position is that companies RIIO-ED2 forecasts should be informed by
National Grid Future Energy scenarios and Climate Change Committee Sixth
carbon Budget scenarios . Local variations are allowed if need is evidenced
Overall, the SSMD has more in keeping with a consultation document than with a
decision document. A number of decisions have been deferred until later in the
process. Where Ofgem has made decisions they typically confirm the position
adopted in the Sector Specific Methodology Consultation (SSMC)

2017. UK Power Networks. All rights reserved
CMA PR19 and RIIO-2 appeals
• CMA have taken a materially different position on both the cost ofequity and financeability to Ofwat and Ofgem
– CMA are using returns on AAA bonds as well as gilts indetermining the Risk Free Rate
– CMA is aiming up from its cost of equity range midpoint by 25 bps– Ofgem’s outperformance wedge effectively aims down by 25 bps
– CMA see the WACC as the main driver of financeability and do notsee adjustments to capitalisation and/or depreciation rates as validfinanceability levers
• Scope of RIIO-2 appeal broadly as expected
– We expect the CMA to maintain its position on the cost of equityand financeability
– In addition to cost of equity outperformance wedge, benchmarkingapproach and ongoing efficiency key issues for RIIO-ED2 as well
• Company statement of cases are strong in these areas
– We would expect Ofgem to incorporate RIIO-2 outcomes in RIIO-ED2 draft determination
21

2017. UK Power Networks. All rights reserved
5. ENVIRONMENTAL, SOCIAL & GOVERNANCE
2017. UK Power Networks. All rights reserved
Corporate Governance
23
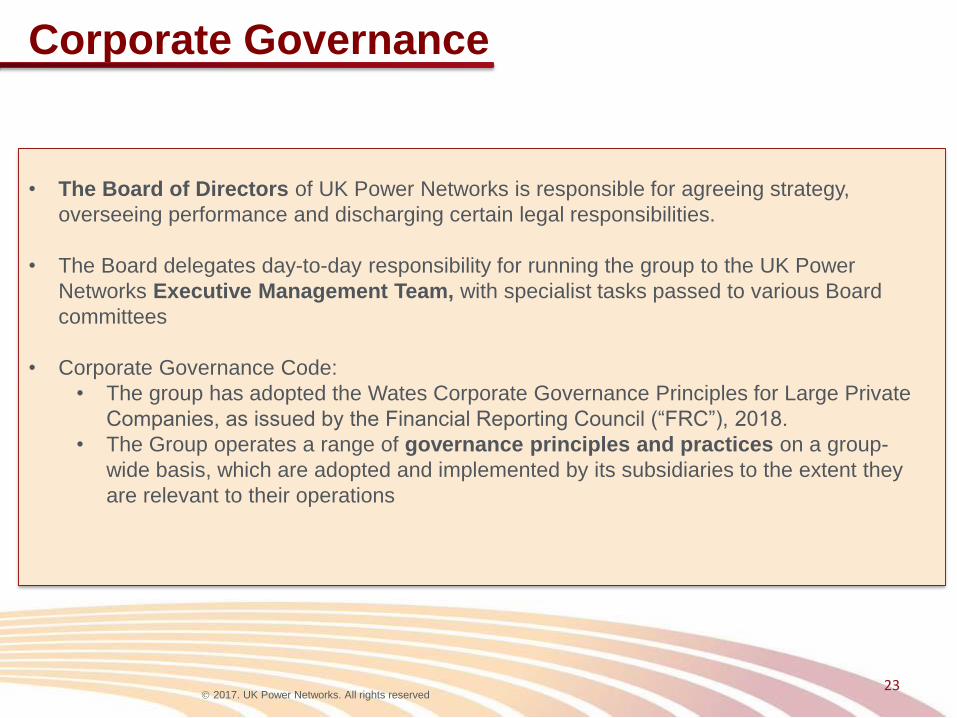
• The Board of Directors of UK Power Networks is responsible for agreeing strategy,
overseeing performance and discharging certain legal responsibilities.
• The Board delegates day-to-day responsibility for running the group to the UK Power
Networks Executive Management Team, with specialist tasks passed to various Board
committees
• Corporate Governance Code:
• The group has adopted the Wates Corporate Governance Principles for Large Private
Companies, as issued by the Financial Reporting Council (“FRC”), 2018.
• The Group operates a range of governance principles and practices on a group-
wide basis, which are adopted and implemented by its subsidiaries to the extent they
are relevant to their operations
2017. UK Power Networks. All rights reserved
Environment, social & governance
24
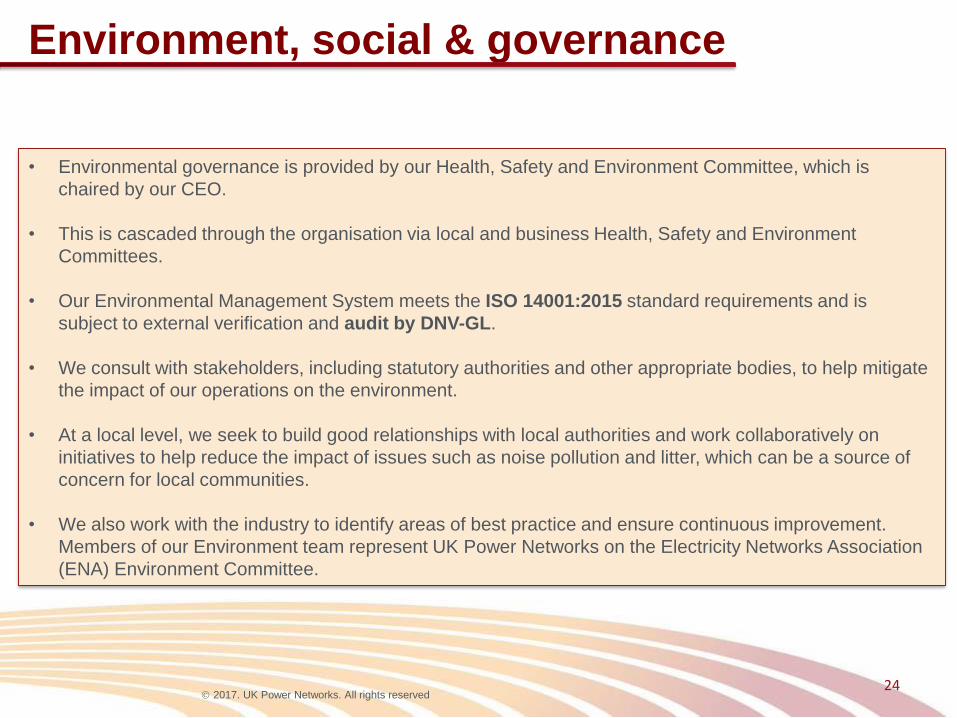
• Environmental governance is provided by our Health, Safety and Environment Committee, which is
chaired by our CEO.
• This is cascaded through the organisation via local and business Health, Safety and Environment
Committees.
• Our Environmental Management System meets the ISO 14001:2015 standard requirements and is
subject to external verification and audit by DNV-GL.
• We consult with stakeholders, including statutory authorities and other appropriate bodies, to help mitigate
the impact of our operations on the environment.
• At a local level, we seek to build good relationships with local authorities and work collaboratively on
initiatives to help reduce the impact of issues such as noise pollution and litter, which can be a source of
concern for local communities.
• We also work with the industry to identify areas of best practice and ensure continuous improvement.
Members of our Environment team represent UK Power Networks on the Electricity Networks Association
(ENA) Environment Committee.
2017. UK Power Networks. All rights reserved
Delivering a sustainable energy future for all
25
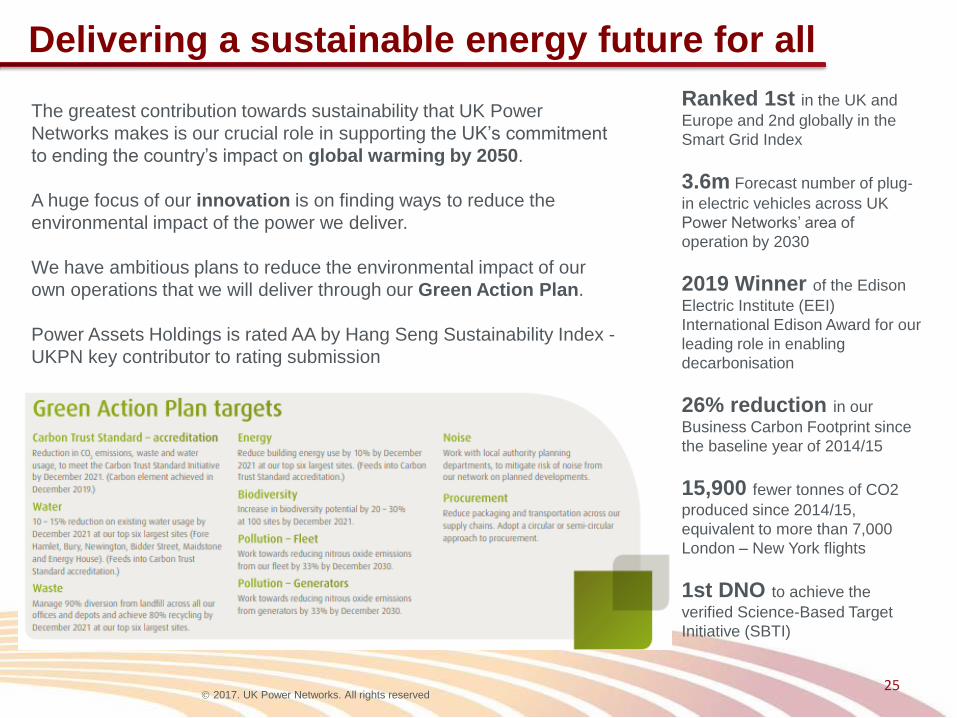
The greatest contribution towards sustainability that UK Power
Networks makes is our crucial role in supporting the UK’s commitment
to ending the country’s impact on global warming by 2050.
A huge focus of our innovation is on finding ways to reduce the
environmental impact of the power we deliver.
We have ambitious plans to reduce the environmental impact of our
own operations that we will deliver through our Green Action Plan.
Power Assets Holdings is rated AA by Hang Seng Sustainability Index -
UKPN key contributor to rating submission
Ranked 1st in the UK and
Europe and 2nd globally in the
Smart Grid Index
3.6m Forecast number of plug-
in electric vehicles across UK
Power Networks’ area of
operation by 2030
2019 Winner of the Edison
Electric Institute (EEI)
International Edison Award for our
leading role in enabling
decarbonisation
26% reduction in our
Business Carbon Footprint since
the baseline year of 2014/15
15,900 fewer tonnes of CO2
produced since 2014/15,
equivalent to more than 7,000
London – New York flights
1st DNO to achieve the
verified Science-Based Target
Initiative (SBTI)
2017. UK Power Networks. All rights reserved
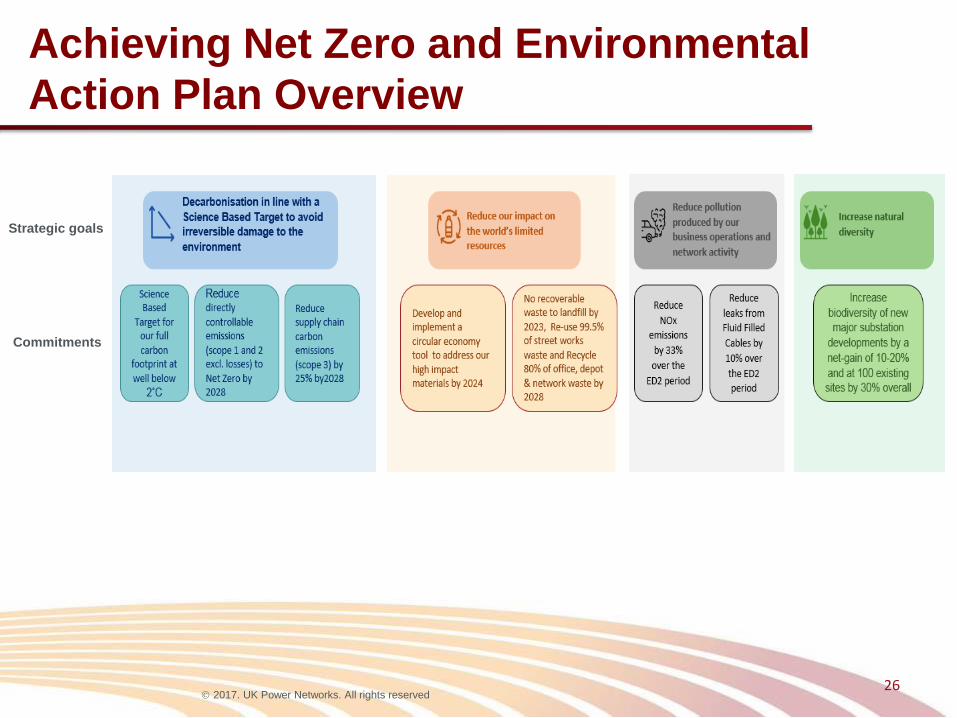
Achieving Net Zero and Environmental
Action Plan Overview
26
Strategic goals
Commitments

2017. UK Power Networks. All rights reserved
6. GREEN BOND FRAMEWORK OVERVIEW

2017. UK Power Networks. All rights reserved
Overview of UKPN Green Bond Framework
28
The ‘UKPN Green Bond Framework’ has been developed in accordance with the Green Bond Principles
(2021) as published by the International Capital Market Association (ICMA).
DNV has provided a Second Party Opinion (SPO).
UK Power Networks asserts that it will adopt the following, as set out in this Framework:
1) Use of Proceeds
An amount equivalent to the net proceeds raised
from any UK Power Networks Green Bond issued
under this Framework will be allocated, in part or in
full, to finance ‘Eligible Green Projects’
2) Project Evaluation and Selection
UKPN will establish a Green Financing Committee.
The Committee will meet on a semi-annual basis
3) Management of Proceeds
UKPN will establish a Green Bond Register which
will be reviewed annually by the Green Financing
Committee. Proceeds allocated to projects at most
3 years prior to the issuance. Proceeds will be
allocated within 3 years from issuance
4) Reporting
Impact and allocation reporting where feasible will
be provided annually and made available publicly
on the UKPN website

2017. UK Power Networks. All rights reserved
1) Use of Proceeds
29
Green Category Eligibility CriteriaUN SDG
Targets
Renewable
energy
Investment in electricity distribution networks dedicated to:
o Connecting to renewable energy sources, such as solar, wind or small hydro
o Capacity and grid reinforcement for heat decarbonisation
o Creating a direct connection, or expanding an existing direct connection between a power production plant that is less CO2
intensive than 100g CO2e/kWh
o On site renewable generation for our own operational consumption
Energy efficiency
Investments in technologies / infrastructure that result in increased energy-efficiency by at least 30% and/or reduce electricity grid
losses including:
o Retrofits: replacements and / or improvements to reduce energy losses
o Smart Equipment: devices and/or infrastructure allowing for energy efficiency, reliability, resiliency, and/or exchange of
Renewable electricity between users (i.e. Smart Meters)
o Non SF6 switchgear technology
Pollution
prevention and
control
Investments in waste prevention, collection and recycling including but not limited to:
o Removal of polychlorinated biphenyl (PCB) from the network
o Investments in mobile generators to reduce NOx
o Infrastructure improvements to prevent oil leaks from fluid filled cables and transformers
Circular economy initiatives, adapted products, production, technologies and processes (such as the design and introduction of reusable,
recyclable and refurbished materials, components and products; circular tools and services); and/or certified eco-efficient products
Green buildings
Acquisition or construction of existing or new commercial buildings that have achieved or expect to achieve the below certification:
BREEAM ≥ “Very Good” or LEED: ≥ “Gold” NABERS, or similar recognized standard
Renovations of existing buildings that achieve energy savings of at least 30%
Climate change
adaptation
Projects aimed at enhancing the protection of distribution networks from the impacts of climate change
Projects that protect the overhead lines network from extreme weather events caused by climate change
Environmentally
Sustainable
Management of
Living Natural
Resources and
Land Use
Investment on projects that would reduce the impact on land and terrestrial biodiversity, such as:
o The sustainable management and value enhancement of our land
o Biodiversity net gain improvements
o Terrestrial and aquatic biodiversity conservation and the preservation and restoration of natural landscapes
o Grid improvements including removing and undergrounding overhead power lines
o Purchase of environmentally certified products
Clean
Transportation
Investments in infrastructure for clean transportation: construction, development, operation, acquisition and/or maintenance of electric grid
infrastructure supporting sustainable mobility and cleaner vehicles with a lower environmental impact, including:
Electric vehicle infrastructure including charging stations, Transmission and Distribution systems and facilities supporting clean
transportation, such as network extensions or capacity upgrades
Renewal of fleet, including passenger cars, light commercial vehicles and large vehicles for Electric vehicles or vehicles with
zero tailpipe emissions and Low Carbon vehicles (<50g CO2/km)
An amount equivalent to the net proceeds raised from any UK Power Networks Green Bond issued under this Green Bond
Framework will be allocated, in part or in full, to finance the following ‘Eligible Green Projects’
2017. UK Power Networks. All rights reserved
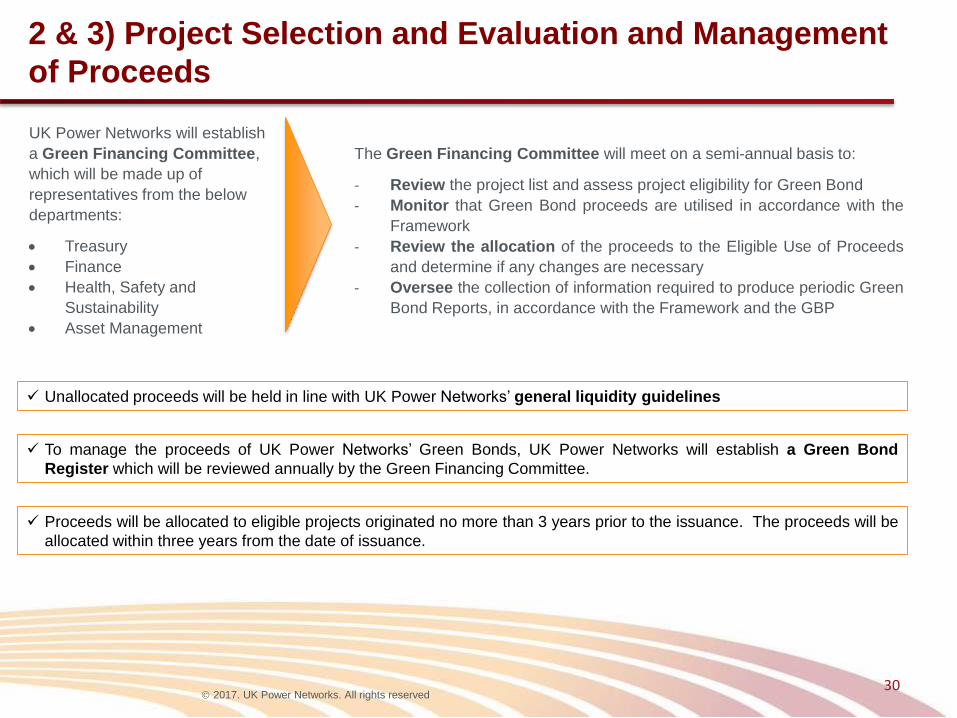
2 & 3) Project Selection and Evaluation and Management
of Proceeds
30
UK Power Networks will establish
a Green Financing Committee,
which will be made up of
representatives from the below
departments:
Treasury
Finance
Health, Safety and
Sustainability
Asset Management
The Green Financing Committee will meet on a semi-annual basis to:
- Review the project list and assess project eligibility for Green Bond
- Monitor that Green Bond proceeds are utilised in accordance with the
Framework
- Review the allocation of the proceeds to the Eligible Use of Proceeds
and determine if any changes are necessary
- Oversee the collection of information required to produce periodic Green
Bond Reports, in accordance with the Framework and the GBP
Unallocated proceeds will be held in line with UK Power Networks’ general liquidity guidelines
To manage the proceeds of UK Power Networks’ Green Bonds, UK Power Networks will establish a Green Bond
Register which will be reviewed annually by the Green Financing Committee.
Proceeds will be allocated to eligible projects originated no more than 3 years prior to the issuance. The proceeds will be
allocated within three years from the date of issuance.
2017. UK Power Networks. All rights reserved
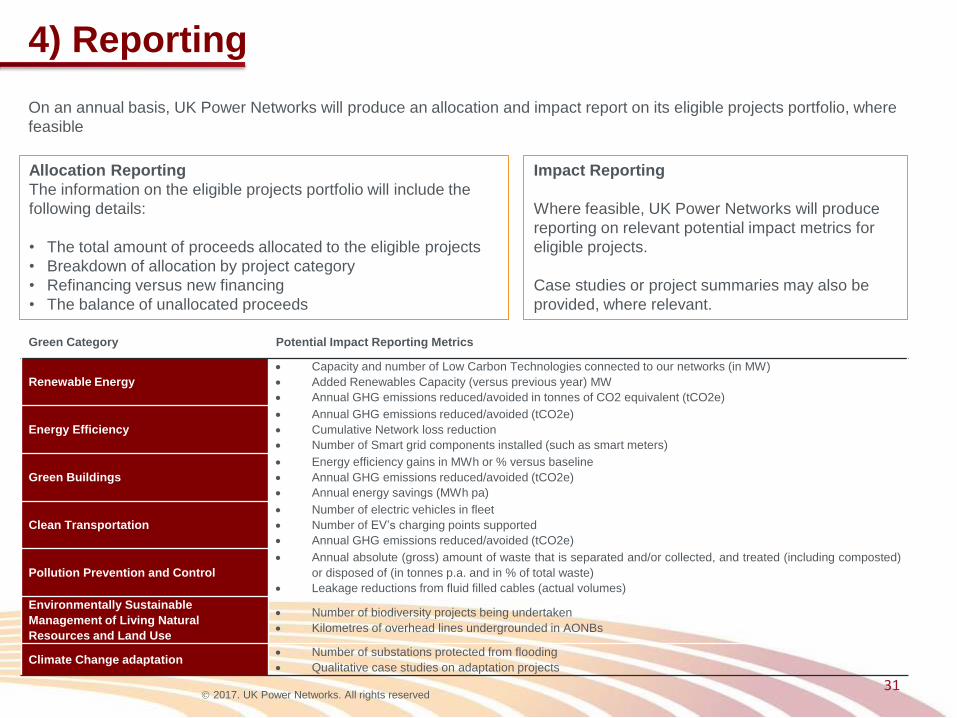
4) Reporting
31
On an annual basis, UK Power Networks will produce an allocation and impact report on its eligible projects portfolio, where
feasible
Allocation Reporting
The information on the eligible projects portfolio will include the
following details:
• The total amount of proceeds allocated to the eligible projects
• Breakdown of allocation by project category
• Refinancing versus new financing
• The balance of unallocated proceeds
Impact Reporting
Where feasible, UK Power Networks will produce
reporting on relevant potential impact metrics for
eligible projects.
Case studies or project summaries may also be
provided, where relevant.
Green Category Potential Impact Reporting Metrics
Renewable Energy
Capacity and number of Low Carbon Technologies connected to our networks (in MW)
Added Renewables Capacity (versus previous year) MW
Annual GHG emissions reduced/avoided in tonnes of CO2 equivalent (tCO2e)
Energy Efficiency
Annual GHG emissions reduced/avoided (tCO2e)
Cumulative Network loss reduction
Number of Smart grid components installed (such as smart meters)
Green Buildings
Energy efficiency gains in MWh or % versus baseline
Annual GHG emissions reduced/avoided (tCO2e)
Annual energy savings (MWh pa)
Clean Transportation
Number of electric vehicles in fleet
Number of EV’s charging points supported
Annual GHG emissions reduced/avoided (tCO2e)
Pollution Prevention and Control
Annual absolute (gross) amount of waste that is separated and/or collected, and treated (including composted)
or disposed of (in tonnes p.a. and in % of total waste)
Leakage reductions from fluid filled cables (actual volumes)
Environmentally Sustainable
Management of Living Natural
Resources and Land Use
Number of biodiversity projects being undertaken
Kilometres of overhead lines undergrounded in AONBs
Climate Change adaptation Number of substations protected from flooding
Qualitative case studies on adaptation projects
2017. UK Power Networks. All rights reserved
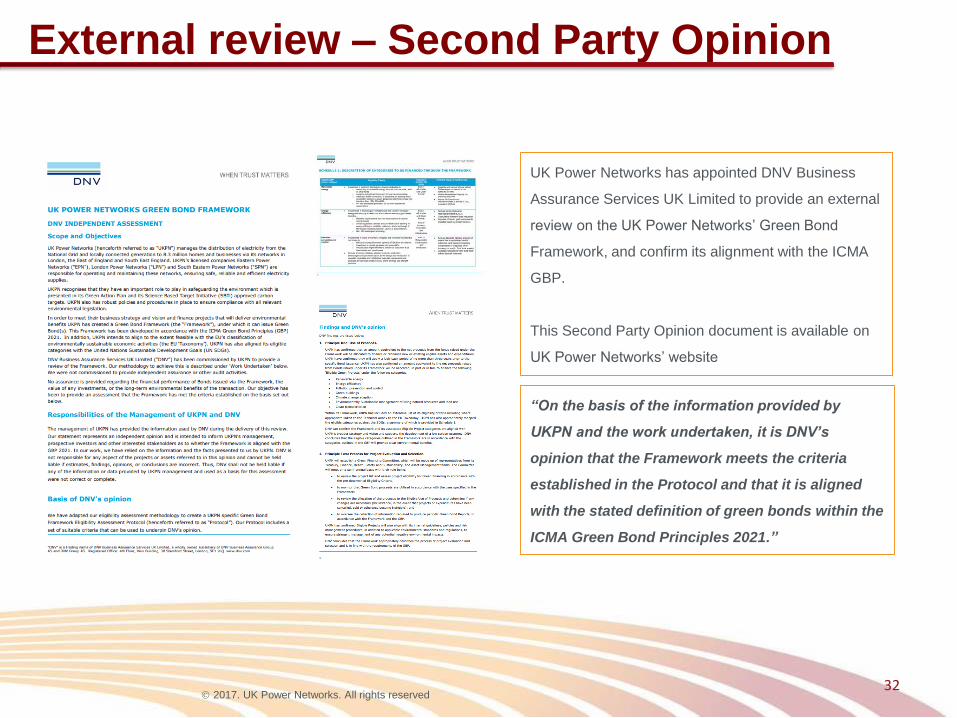
External review – Second Party Opinion
32
“On the basis of the information provided by
UKPN and the work undertaken, it is DNV’s
opinion that the Framework meets the criteria
established in the Protocol and that it is aligned
with the stated definition of green bonds within the
ICMA Green Bond Principles 2021.”
UK Power Networks has appointed DNV Business
Assurance Services UK Limited to provide an external
review on the UK Power Networks’ Green Bond
Framework, and confirm its alignment with the ICMA
GBP.
This Second Party Opinion document is available on
UK Power Networks’ website

2017. UK Power Networks. All rights reserved
Green Recovery Plan – Case Study
33
2017. UK Power Networks. All rights reserved
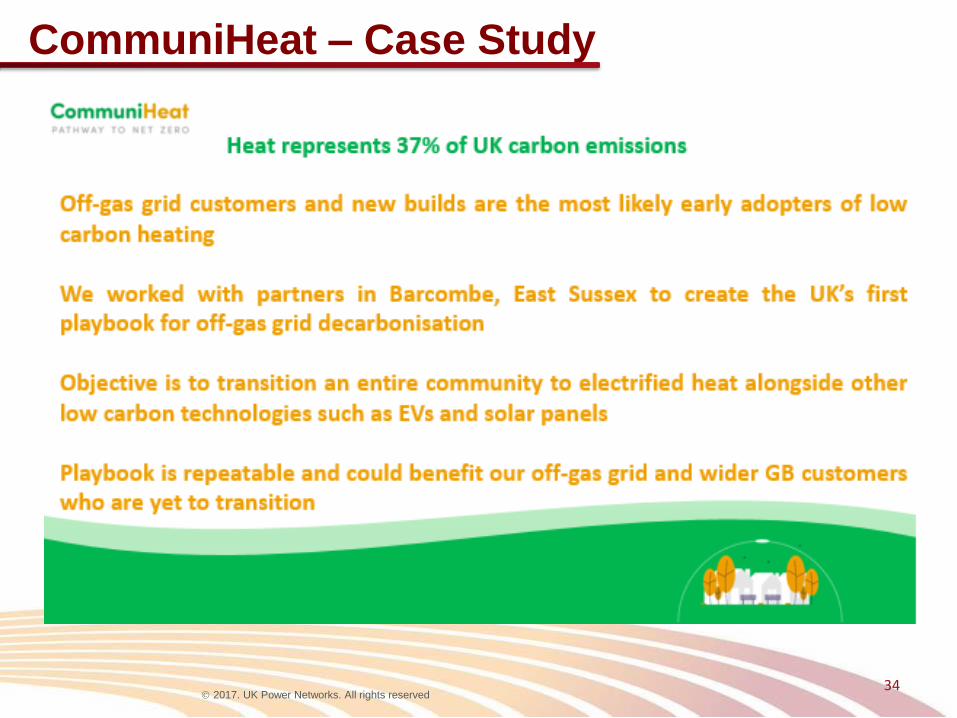
CommuniHeat – Case Study
34

2017. UK Power Networks. All rights reserved
7. CAPITAL STRUCTURE AND TREASURY
POLICY

2017. UK Power Networks. All rights reserved
Capital Structure Commitment and Dividend
Policy
• The shareholders maintain a conservative and flexible dividend
policy
• We are committed to maintaining a BBB+ credit rating for the three
DNOs.
– Flexibility evidenced by shareholders taking a reduced dividend
from Northern Gas Networks rather than pushing up gearing
when RPI fell dramatically
– And in our case relating to tax payments in 2018 and our
budgeted reduction in dividend in 2021
36

2017. UK Power Networks. All rights reserved
• The facility matures in April 2024 with the option to extend twice by one year
Cash and Liquidity
37
• c.£395m cash at 31 March 2021

2017. UK Power Networks. All rights reserved
Funding
• UK Power Networks Services Holdings Refinancing
• £200m secured from two investors on a deferred draw
basis, 20 year maturity with average coupon of 2.6655%
• £490m of DNO debt maturing in H2 2021
• Currently undrawn £500m RCF is capable of covering
the projected cash position at fiscal year-end
38
2017. UK Power Networks. All rights reserved
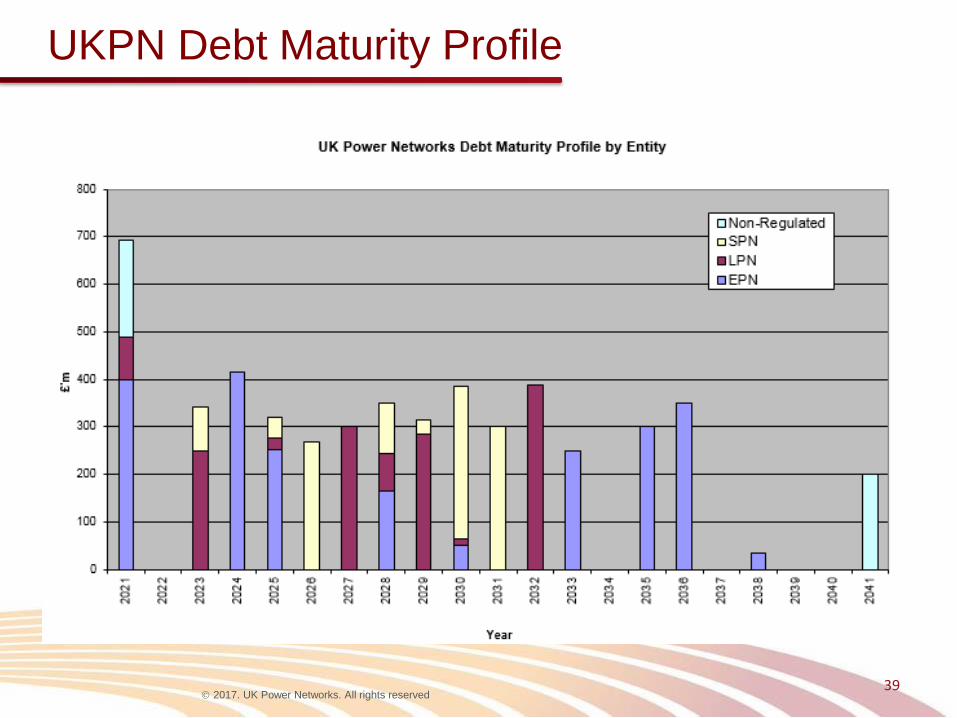
UKPN Debt Maturity Profile
39

2017. UK Power Networks. All rights reserved
8. CONCLUSION

2017. UK Power Networks. All rights reserved
• 2020/21 was another successful year for UK Power
Networks despite the disruption caused by COVID-19
• We are delivering lower costs to customers and
providing excellent network reliability with industry
leading customer service
• We are at the forefront of facilitating the Net Zero
transition
• We have published a Green Bond Framework
• We were the leading DNO group in 2019/20 and expect
to be again in 2020/21
• We are committed to maintaining at least BBB+ or
equivalent credit ratings at our three DNOs
Conclusion
41