Embed Size (px)
Citation preview
RIOCAN INVESTOR PRESENTATION
RBC Unsecured Debt Conference December 3, 2013
TRANSFORMING…
Forward Looking Statements
2
Certain information included in this presentation contains forward-looking statements within the meaning of applicable securities laws including, among others, statements concerning our objectives, our strategies to achieve those objectives, as well as statements with respect to management's beliefs, plans, estimates, and intentions, and similar statements concerning anticipated future events, results, circumstances, performance or expectations that are not historical facts. Certain material factors, estimates or assumptions were applied in drawing a conclusion or making a forecast or projection as reflected in these statements and actual results could differ materially from such conclusions, forecasts or projections.
Additional information on the material risks that could cause our actual results to differ materially from the conclusions, forecast or projections in these statements and the material factors, estimates or assumptions that were applied in drawing a conclusion or making a forecast or projection as reflected in the forward-looking information can be found in our annual information form and annual report that are available on our website and at www.sedar.com.
Except as required by applicable law, RioCan undertakes no obligation to publicly update or revise any forward-looking statement, whether as a result of new information, future events or otherwise.
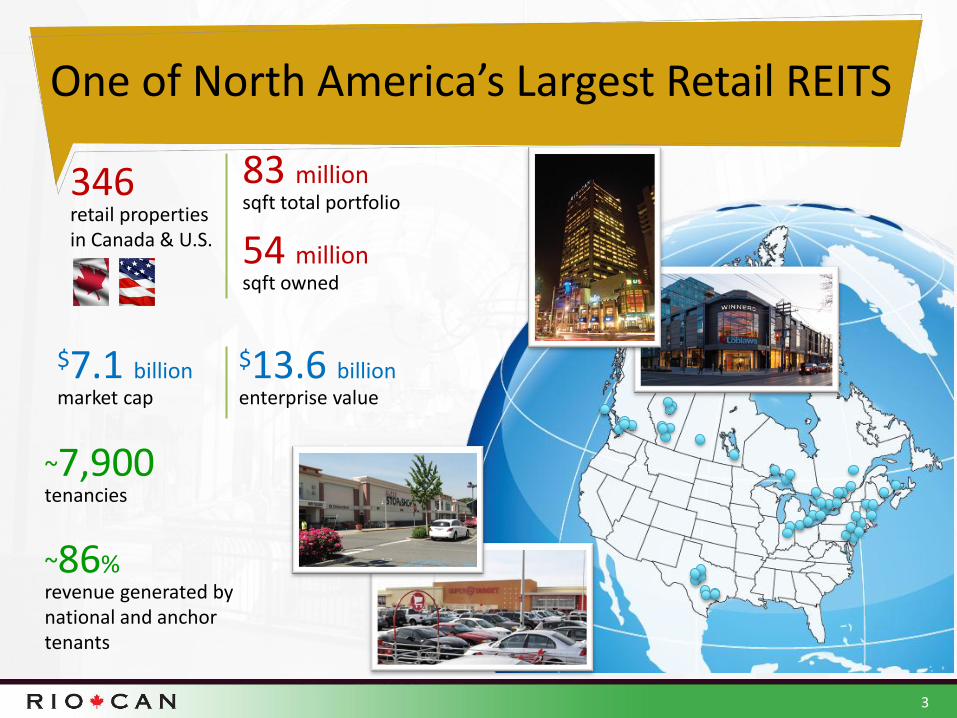
One of North America’s Largest Retail REITS
3
346 retail properties in Canada & U.S.
83 million sqft total portfolio
$7.1 billion market cap
54 million sqft owned
$13.6 billion enterprise value
~86% revenue generated by national and anchor tenants
~7,900 tenancies

Objectives
4
Disciplined growth strategy in Canada and U.S. that is positioned to benefit from robust acquisition activity and development pipeline
In 2013, RioCan began capital recycling program to sell lower growth assets predominantly in secondary and tertiary markets to improve organic growth and further focus the portfolio in Canada’s six major markets (Vancouver, Edmonton, Calgary, Toronto, Ottawa and Montreal)
Experienced, performance driven management team
Dominant, geographically diversified platform
Maintain and strengthen RioCan’s already conservative balance sheet to build on RioCan’s financial strength and reduce cost of capital with a diversified debt ladder to reduce interest rate risk
Diversified portfolio of national retail tenants
Strong operating results and proven track record
QC
PA
VA
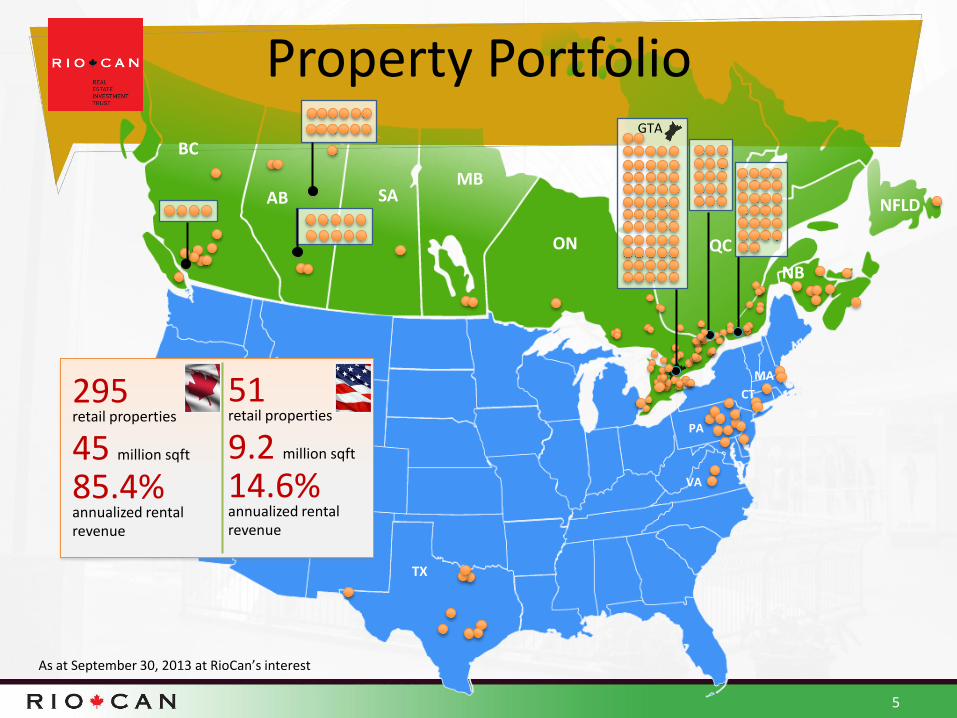
Property Portfolio
5
As at September 30, 2013 at RioCan’s interest
CT
MA
BC
AB
ON
QC SA MB
NB
NFLD
295 retail properties
45 million sqft
85.4% annualized rental revenue
TX
GTA
51 retail properties
9.2 million sqft
14.6% annualized rental revenue
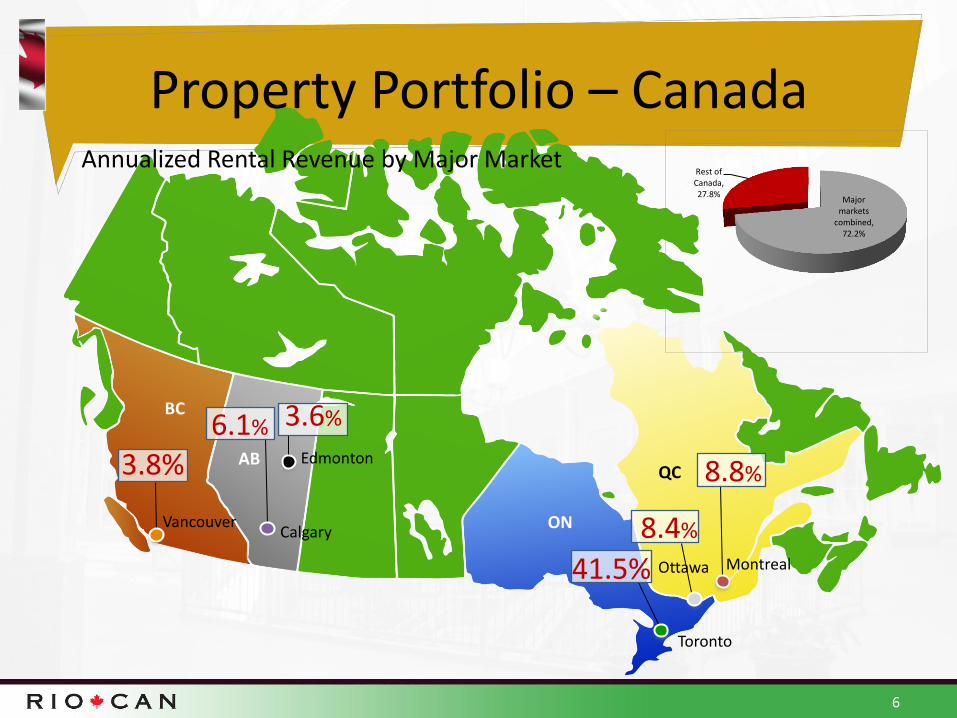
Property Portfolio – Canada
6
Calgary
Edmonton
Vancouver
Toronto
Montreal Ottawa
BC
AB
ON
QC
Annualized Rental Revenue by Major Market
8.4%
Major markets
combined, 72.2%
Rest of Canada, 27.8%
6.1%
3.8%
3.6%
8.8%
41.5%
PA
VA
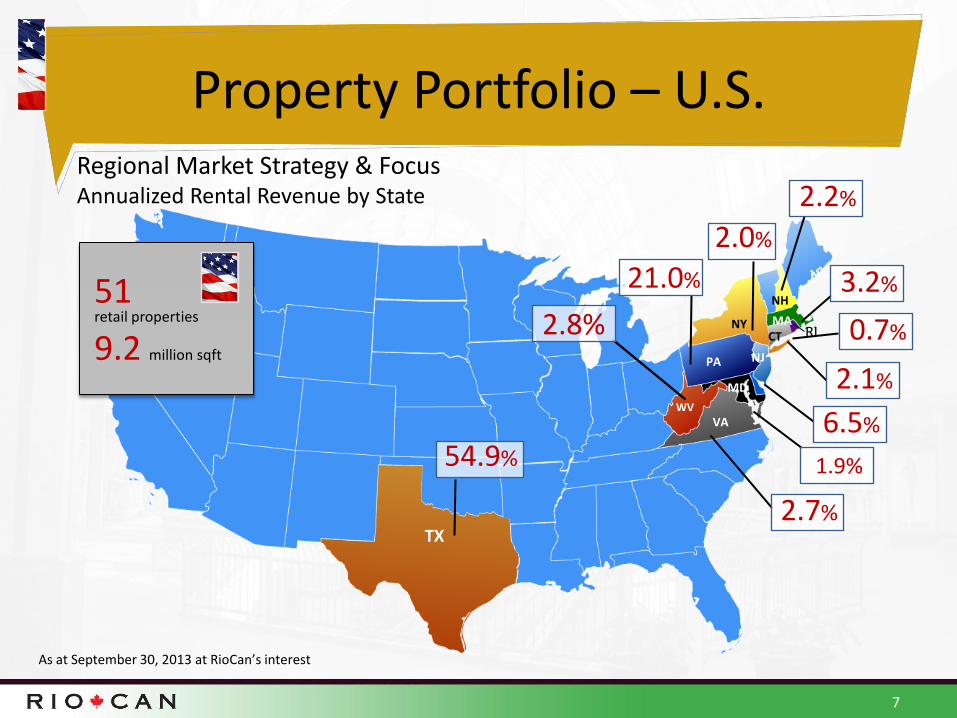
Property Portfolio – U.S.
7
RI CT
NH
MA
TX
Regional Market Strategy & Focus Annualized Rental Revenue by State
NY
MD
NJ
WV
54.9%
2.7%
1.9%
6.5%
2.1%
0.7%
3.2%
2.8%
21.0%
2.0%
2.2%
51 retail properties
9.2 million sqft
As at September 30, 2013 at RioCan’s interest
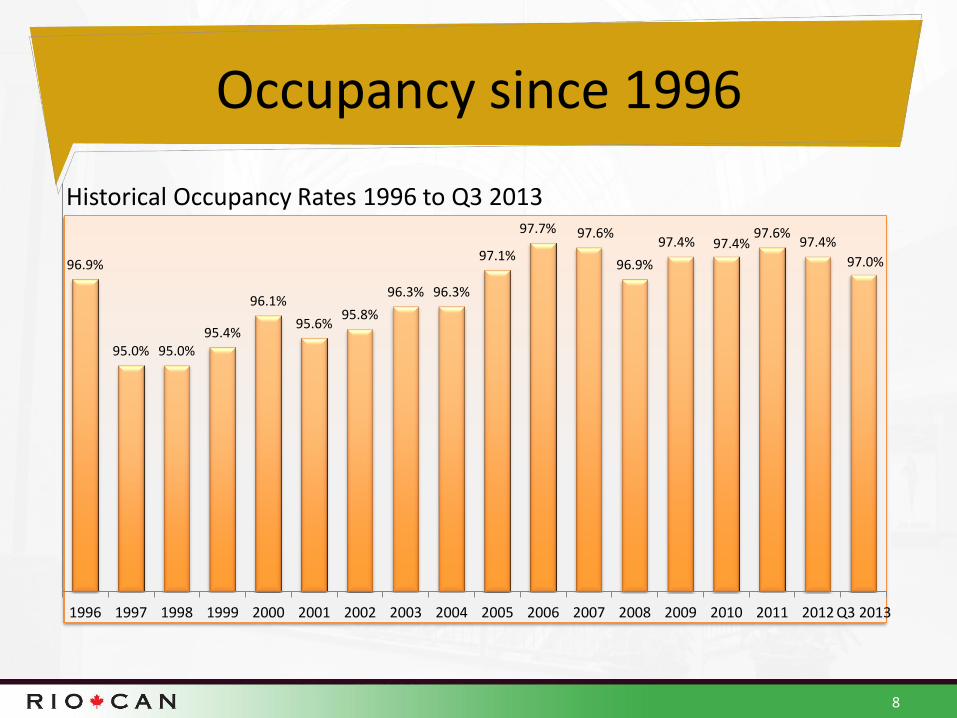
Occupancy since 1996
96.9%
95.0% 95.0% 95.4%
96.1%
95.6% 95.8%
96.3% 96.3%
97.1%
97.7% 97.6%
96.9%
97.4% 97.4% 97.6%
97.4%
97.0%
1996 1997 1998 1999 2000 2001 2002 2003 2004 2005 2006 2007 2008 2009 2010 2011 2012 Q3 2013
8
Historical Occupancy Rates 1996 to Q3 2013

Objectives
9
Disciplined growth strategy in Canada and U.S. that is positioned to benefit from robust acquisition activity and development pipeline
In 2013, RioCan began capital recycling program to sell lower growth assets predominantly in secondary and tertiary markets to improve organic growth and further focus the portfolio in Canada’s six major markets (Vancouver, Edmonton, Calgary, Toronto, Ottawa and Montreal)
Experienced, performance driven management team
Dominant, geographically diversified platform
Maintain and strengthen RioCan’s already conservative balance sheet to build on RioCan’s financial strength and reduce cost of capital with a diversified debt ladder to reduce interest rate risk
Diversified portfolio of national retail tenants
Strong operating results and proven track record
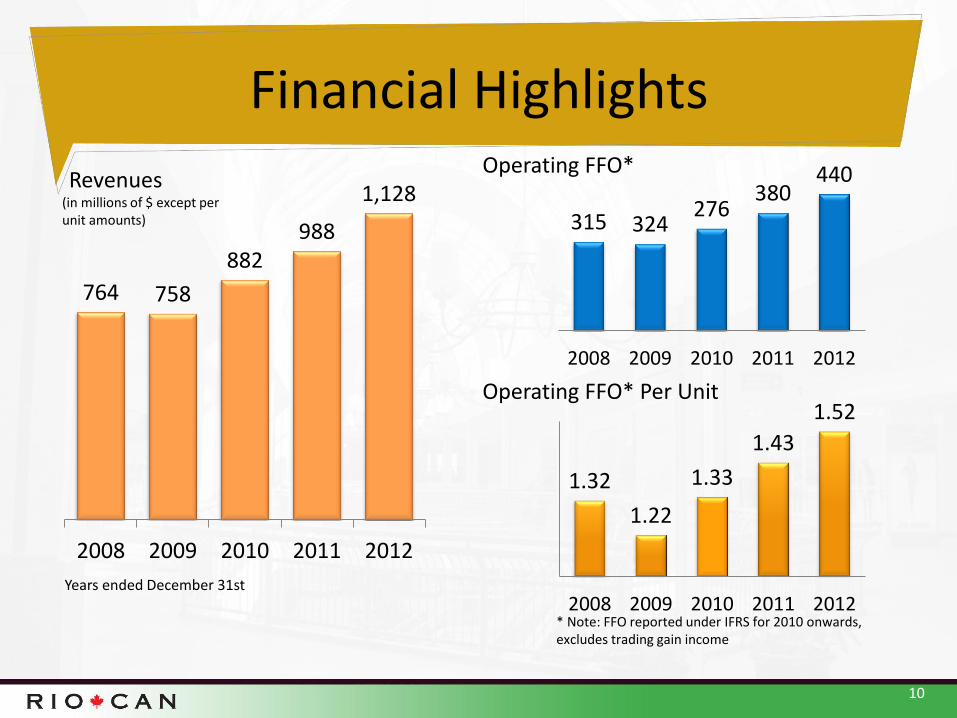
Financial Highlights
(in millions of $ except per unit amounts)
Revenues
764 758
882 988
1,128
2008 2009 2010 2011 2012
Operating FFO*
315 324 276
380 440
2008 2009 2010 2011 2012
Operating FFO* Per Unit
1.32
1.22
1.33
1.43
1.52
2008 2009 2010 2011 2012
10
Years ended December 31st
* Note: FFO reported under IFRS for 2010 onwards, excludes trading gain income
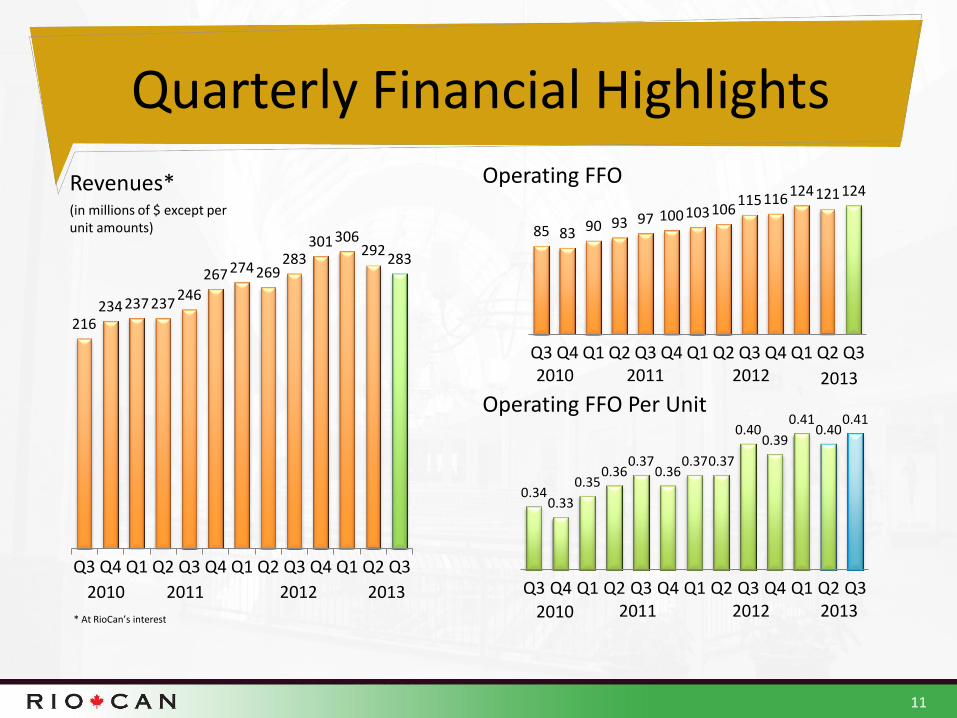
Quarterly Financial Highlights
(in millions of $ except per unit amounts)
Revenues*
216 234 237 237
246
267 274 269 283
301 306 292
283
Q3 Q4 Q1 Q2 Q3 Q4 Q1 Q2 Q3 Q4 Q1 Q2 Q3
Operating FFO
85 83 90 93 97 100 103 106 115 116
124 121 124
Q3 Q4 Q1 Q2 Q3 Q4 Q1 Q2 Q3 Q4 Q1 Q2 Q3
Operating FFO Per Unit
0.34 0.33
0.35 0.36
0.37 0.36
0.37 0.37
0.40 0.39
0.41 0.40
0.41
Q3 Q4 Q1 Q2 Q3 Q4 Q1 Q2 Q3 Q4 Q1 Q2 Q3
11
2010 2011 2012
2010 2011 2012
2010 2011 2012 2013
* At RioCan’s interest 2013
2013
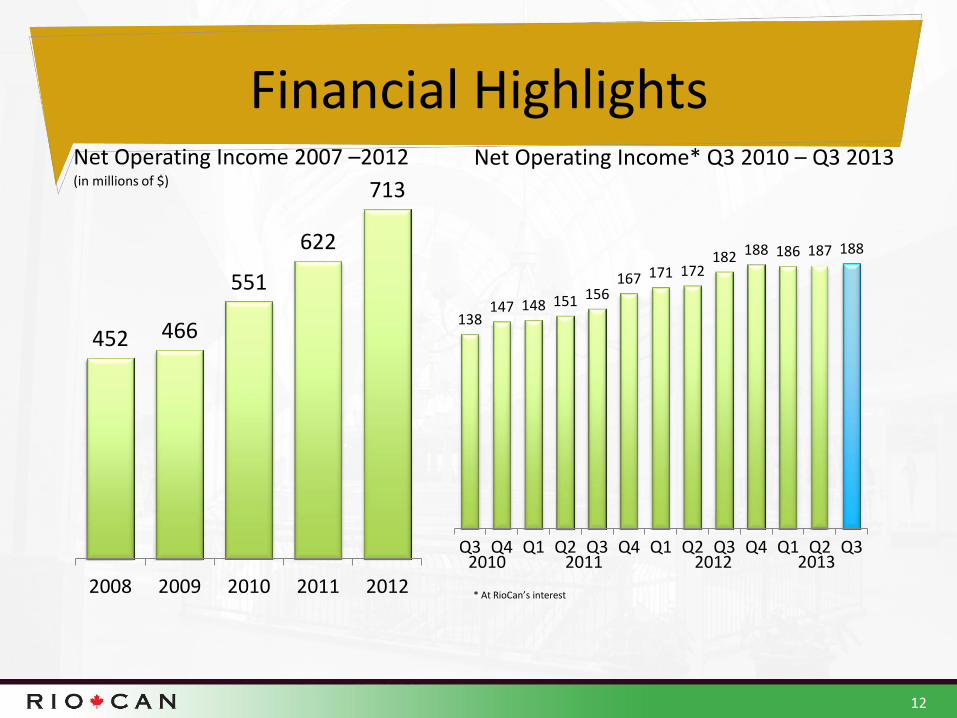
Financial Highlights
(in millions of $)
452 466
551
622
713
2008 2009 2010 2011 2012
Net Operating Income* Q3 2010 – Q3 2013
138 147 148 151 156
167 171 172 182 188 186 187 188
Q3 Q4 Q1 Q2 Q3 Q4 Q1 Q2 Q3 Q4 Q1 Q2 Q3
Net Operating Income 2007 –2012
12
2010 2011 2012
* At RioCan’s interest
2013

Financial Summary
13 *Coverage figures calculated on a twelve month rolling basis
Period Ended September 30,
(in millions of $ except per unit amounts) % Change
2013 2012 2013 vs. 2012
Total Revenues - consolidated 2.60% $276 $269
Total Revenues – at RioCan’s interest 3.57% $290 $280
Operating FFO 7.83% $124 $115
Operating FFO per Unit 2.50% $0.41 $0.40
Distributions to unitholders 5.94% $107 $101
Distributions to unitholders per Unit (annualized) 2.17% $1.41 $1.38
Distributions to unitholders net of distribution reinvestment plan (DRIP) 8.22% $79 $73
Distributions to unitholders net of DRIP per Unit (past 12 months) -1.92% $1.02 $1.04
Unit issue proceeds under distribution reinvestment plan - $28 $28
Distribution reinvestment plan participation rate -4.78% 25.9% 27.2%
As at % Change September 30, 2013 31-Dec-12
Total assets - consolidated 3.75% $13,092 $12,619
Total assets – at RioCan’s interest 3.61% $13,353 $12,888
Debt – consolidated 5.17% $5,733 $5,451
Debt – at RioCan’s interest 4.79% $5,991 $5,717
Debt to Total Assets – (at RioCan’s interest) n/a 44.7% 43.6%
Debt Service Coverage (at RioCan’s interest)* 5.56% 2.09x 1.98x
Market capitalization -11.03% $7,359 $8,271
Total capitalization (incl. Preferred Units) -4.55% $13,624 $14,274
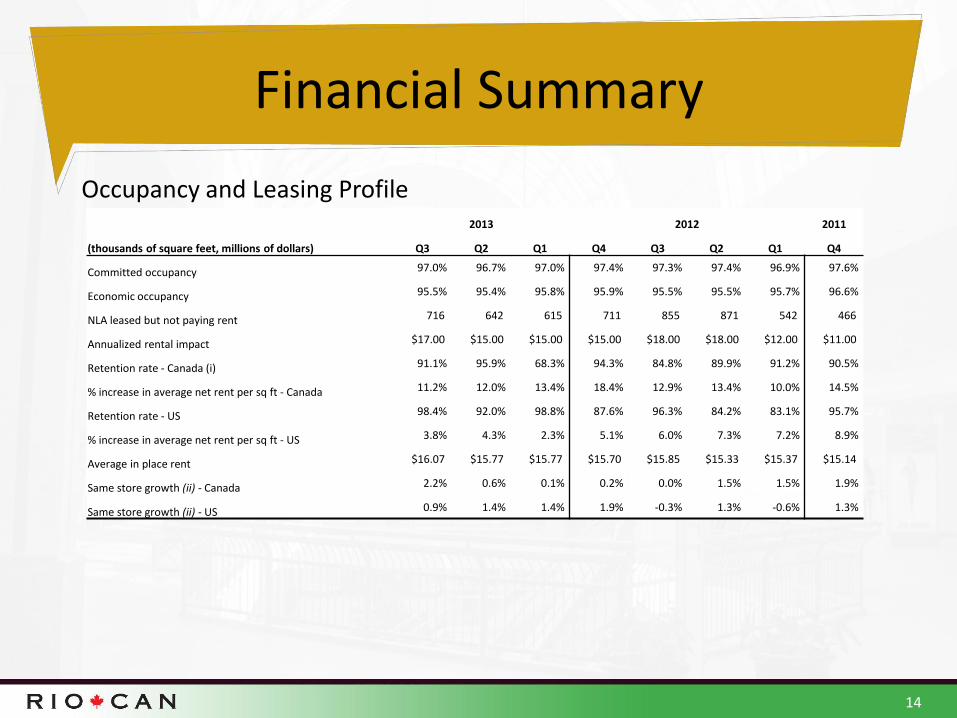
Financial Summary
14
Occupancy and Leasing Profile 2013 2012 2011
(thousands of square feet, millions of dollars) Q3 Q2 Q1 Q4 Q3 Q2 Q1 Q4
Committed occupancy 97.0% 96.7% 97.0% 97.4% 97.3% 97.4% 96.9% 97.6%
Economic occupancy 95.5% 95.4% 95.8% 95.9% 95.5% 95.5% 95.7% 96.6%
NLA leased but not paying rent 716 642 615 711 855 871 542 466
Annualized rental impact $17.00 $15.00 $15.00 $15.00 $18.00 $18.00 $12.00 $11.00
Retention rate - Canada (i) 91.1% 95.9% 68.3% 94.3% 84.8% 89.9% 91.2% 90.5%
% increase in average net rent per sq ft - Canada 11.2% 12.0% 13.4% 18.4% 12.9% 13.4% 10.0% 14.5%
Retention rate - US 98.4% 92.0% 98.8% 87.6% 96.3% 84.2% 83.1% 95.7%
% increase in average net rent per sq ft - US 3.8% 4.3% 2.3% 5.1% 6.0% 7.3% 7.2% 8.9%
Average in place rent $16.07 $15.77 $15.77 $15.70 $15.85 $15.33 $15.37 $15.14
Same store growth (ii) - Canada 2.2% 0.6% 0.1% 0.2% 0.0% 1.5% 1.5% 1.9%
Same store growth (ii) - US 0.9% 1.4% 1.4% 1.9% -0.3% 1.3% -0.6% 1.3%
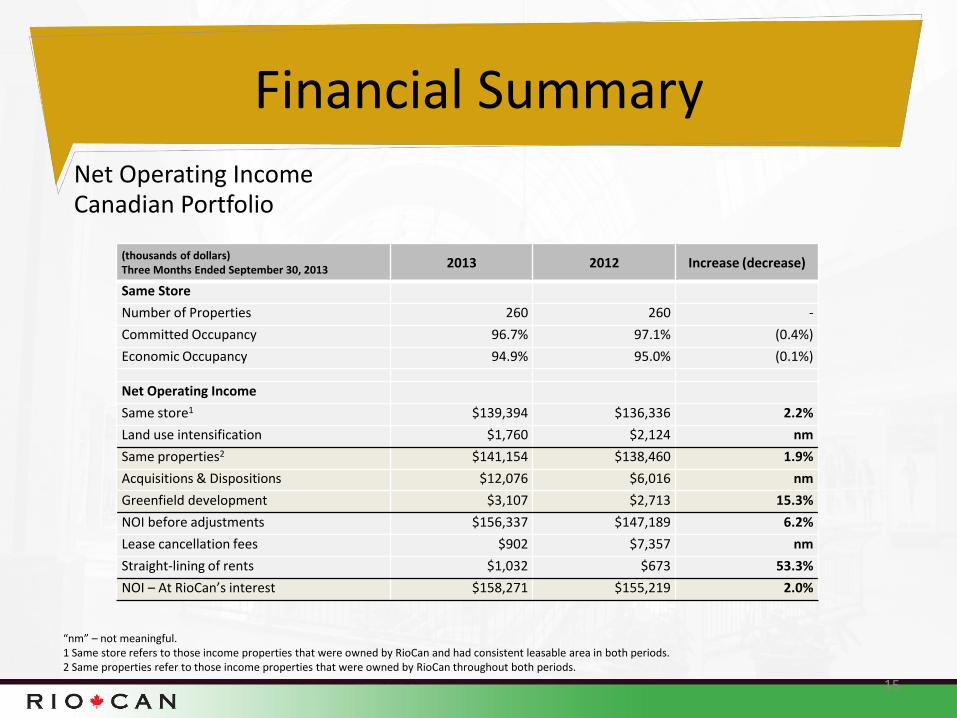
Financial Summary
15
(thousands of dollars) Three Months Ended September 30, 2013
2013 2012 Increase (decrease)
Same Store
Number of Properties 260 260 -
Committed Occupancy 96.7% 97.1% (0.4%)
Economic Occupancy 94.9% 95.0% (0.1%)
Net Operating Income
Same store1 $139,394 $136,336 2.2%
Land use intensification $1,760 $2,124 nm
Same properties2 $141,154 $138,460 1.9%
Acquisitions & Dispositions $12,076 $6,016 nm
Greenfield development $3,107 $2,713 15.3%
NOI before adjustments $156,337 $147,189 6.2%
Lease cancellation fees $902 $7,357 nm
Straight-lining of rents $1,032 $673 53.3%
NOI – At RioCan’s interest $158,271 $155,219 2.0%
“nm” – not meaningful. 1 Same store refers to those income properties that were owned by RioCan and had consistent leasable area in both periods. 2 Same properties refer to those income properties that were owned by RioCan throughout both periods.
Net Operating Income Canadian Portfolio

Financial Summary
16
(thousands of dollars) Three Months ended Sept. 30,
2013 2012 Increase
(decrease)
Base rent – US$ $23,947 $23,766 0.8%
Property tax and operating cost recoveries – US$ 7,501 6,791 10.5%
Other – US$ 177 230 nm
Rental revenue – US$ 31,625 30,787 2.7%
Property operating costs – US$ 9,150 8,505 7.6%
Same store and same properties 12– US$ $22,475 $22,282 0.9%
Foreign currency translation adjustment 871 27 nm
Same store and same properties 12 – CDN$ 23,346 22,309 4.6%
Acquisitions 6,162 – nm
Dispositions - 987 nm
NOI before adjustments $29,508 $23,296 26.6%
Lease cancellation fee 49 – nm
Straight-lining of rents 499 674 nm
NOI – At RioCan’s interest $30,056 $23,970 25.4%
Overall US Occupancy was 97.4% as September 30, 2013. “nm” – not meaningful. 1 Same store refers to those income properties that were owned by RioCan and had consistent leasable area in both periods. 2 Same properties refer to those income properties that were owned by RioCan throughout both periods..
Net Operating Income US Portfolio
Objectives
17
Disciplined growth strategy in Canada and U.S. that is positioned to benefit from robust acquisition activity and development pipeline
In 2013, RioCan began capital recycling program to sell lower growth assets predominantly in secondary and tertiary markets to improve organic growth and further focus the portfolio in Canada’s six major markets (Vancouver, Edmonton, Calgary, Toronto, Ottawa and Montreal)
Experienced, performance driven management team
Dominant, geographically diversified platform
Maintain and strengthen RioCan’s already conservative balance sheet to build on RioCan’s financial strength and reduce cost of capital with a diversified debt ladder to reduce interest rate risk
Diversified portfolio of national retail tenants
Strong operating results and proven track record
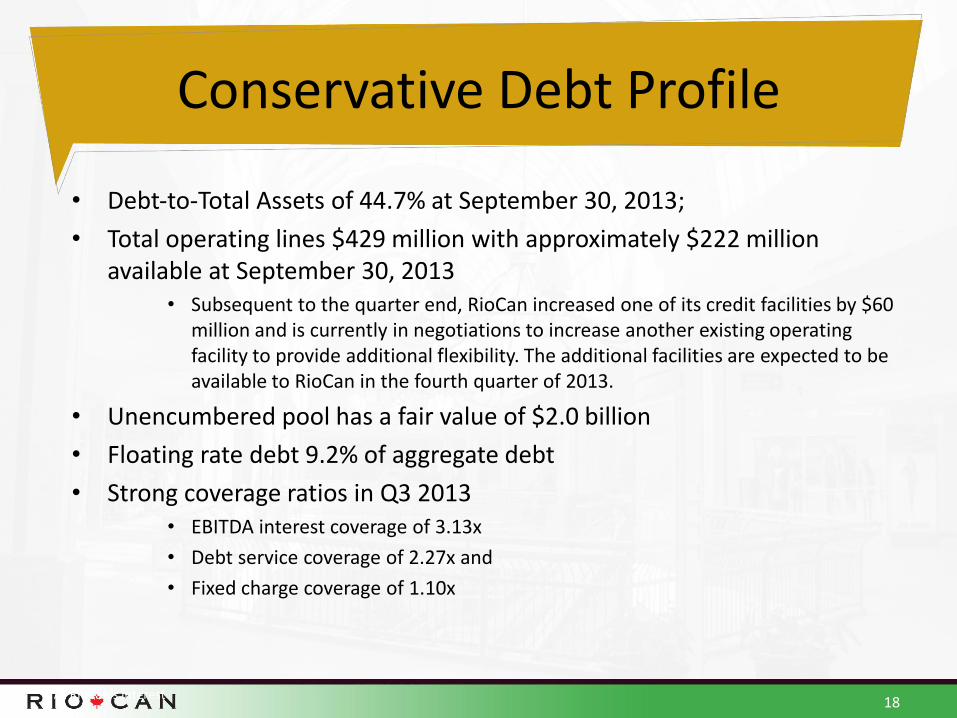
Conservative Debt Profile
• Debt‐to‐Total Assets of 44.7% at September 30, 2013;
• Total operating lines $429 million with approximately $222 million available at September 30, 2013
• Subsequent to the quarter end, RioCan increased one of its credit facilities by $60 million and is currently in negotiations to increase another existing operating facility to provide additional flexibility. The additional facilities are expected to be available to RioCan in the fourth quarter of 2013.
• Unencumbered pool has a fair value of $2.0 billion
• Floating rate debt 9.2% of aggregate debt
• Strong coverage ratios in Q3 2013 • EBITDA interest coverage of 3.13x
• Debt service coverage of 2.27x and
• Fixed charge coverage of 1.10x
18 * At RioCan’s interest
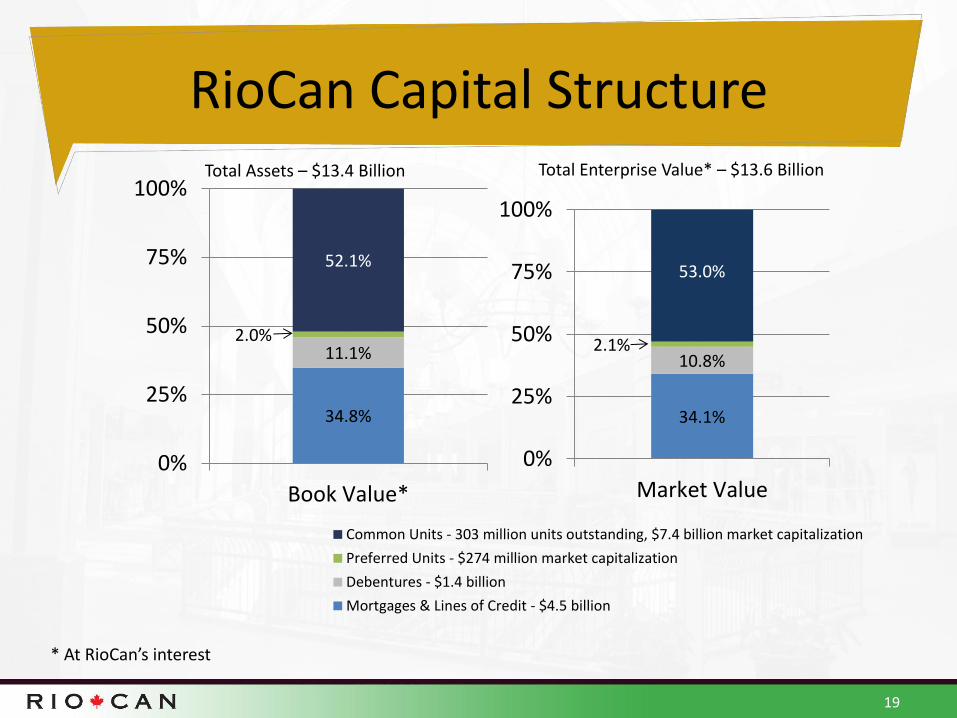
RioCan Capital Structure
34.8%
11.1% 2.0%
52.1%
0%
25%
50%
75%
100%
Book Value*
Common Units - 303 million units outstanding, $7.4 billion market capitalization
Preferred Units - $274 million market capitalization
Debentures - $1.4 billion
Mortgages & Lines of Credit - $4.5 billion
19
34.1%
10.8% 2.1%
53.0%
0%
25%
50%
75%
100%
Market Value
Total Assets – $13.4 Billion Total Enterprise Value* – $13.6 Billion
* At RioCan’s interest

Conservative Debt Structure Growth in Asset vs Debt
20
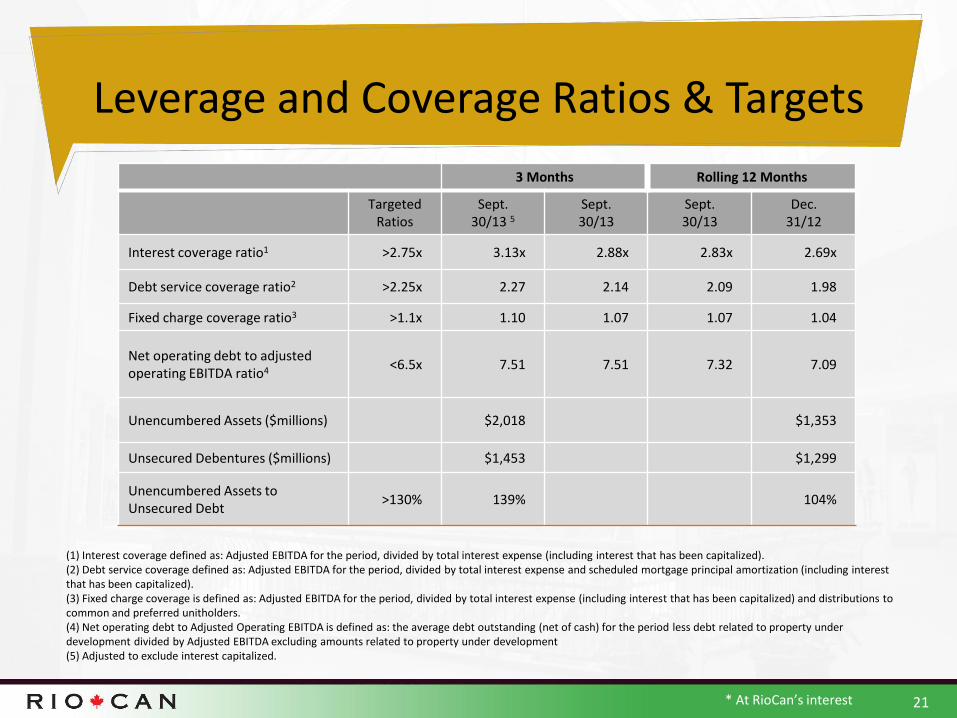
Leverage and Coverage Ratios & Targets
21
3 Months Rolling 12 Months
Targeted Ratios
Sept. 30/13 5
Sept. 30/13
Sept. 30/13
Dec. 31/12
Interest coverage ratio1 >2.75x 3.13x 2.88x 2.83x 2.69x
Debt service coverage ratio2 >2.25x 2.27 2.14 2.09 1.98
Fixed charge coverage ratio3 >1.1x 1.10 1.07 1.07 1.04
Net operating debt to adjusted operating EBITDA ratio4 <6.5x 7.51 7.51 7.32 7.09
Unencumbered Assets ($millions) $2,018 $1,353
Unsecured Debentures ($millions) $1,453 $1,299
Unencumbered Assets to Unsecured Debt
>130% 139% 104%
(1) Interest coverage defined as: Adjusted EBITDA for the period, divided by total interest expense (including interest that has been capitalized). (2) Debt service coverage defined as: Adjusted EBITDA for the period, divided by total interest expense and scheduled mortgage principal amortization (including interest that has been capitalized). (3) Fixed charge coverage is defined as: Adjusted EBITDA for the period, divided by total interest expense (including interest that has been capitalized) and distributions to common and preferred unitholders. (4) Net operating debt to Adjusted Operating EBITDA is defined as: the average debt outstanding (net of cash) for the period less debt related to property under development divided by Adjusted EBITDA excluding amounts related to property under development (5) Adjusted to exclude interest capitalized.
* At RioCan’s interest
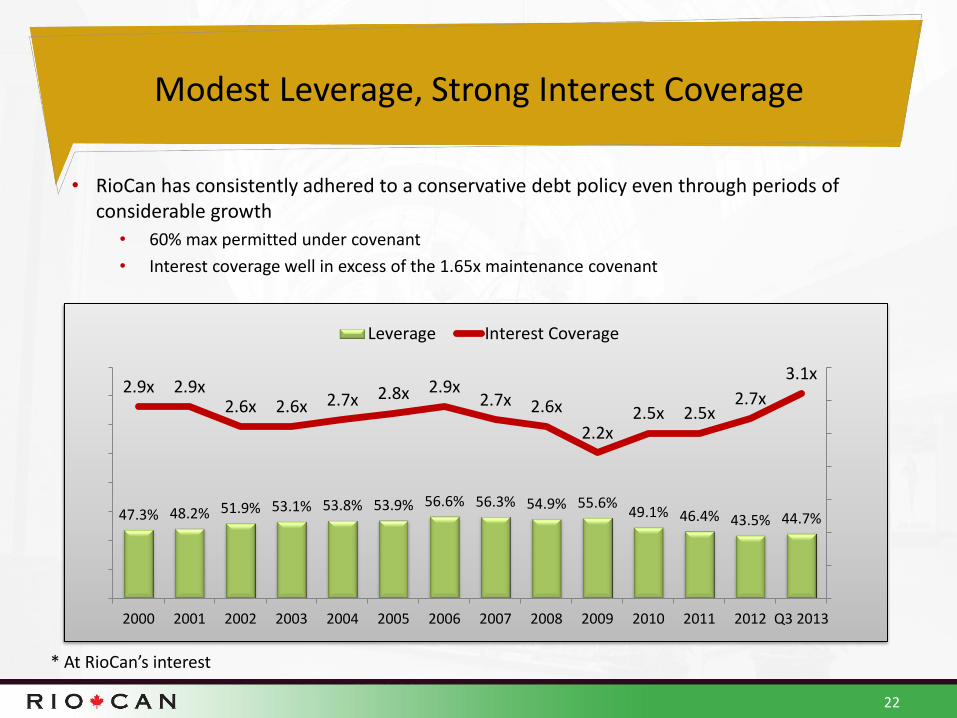
Modest Leverage, Strong Interest Coverage
• RioCan has consistently adhered to a conservative debt policy even through periods of considerable growth
• 60% max permitted under covenant
• Interest coverage well in excess of the 1.65x maintenance covenant
22
47.3% 48.2% 51.9% 53.1% 53.8% 53.9% 56.6% 56.3% 54.9% 55.6% 49.1% 46.4% 43.5% 44.7%
2.9x 2.9x 2.6x 2.6x 2.7x 2.8x 2.9x
2.7x 2.6x
2.2x 2.5x 2.5x
2.7x
3.1x
2000 2001 2002 2003 2004 2005 2006 2007 2008 2009 2010 2011 2012 Q3 2013
Leverage Interest Coverage
* At RioCan’s interest
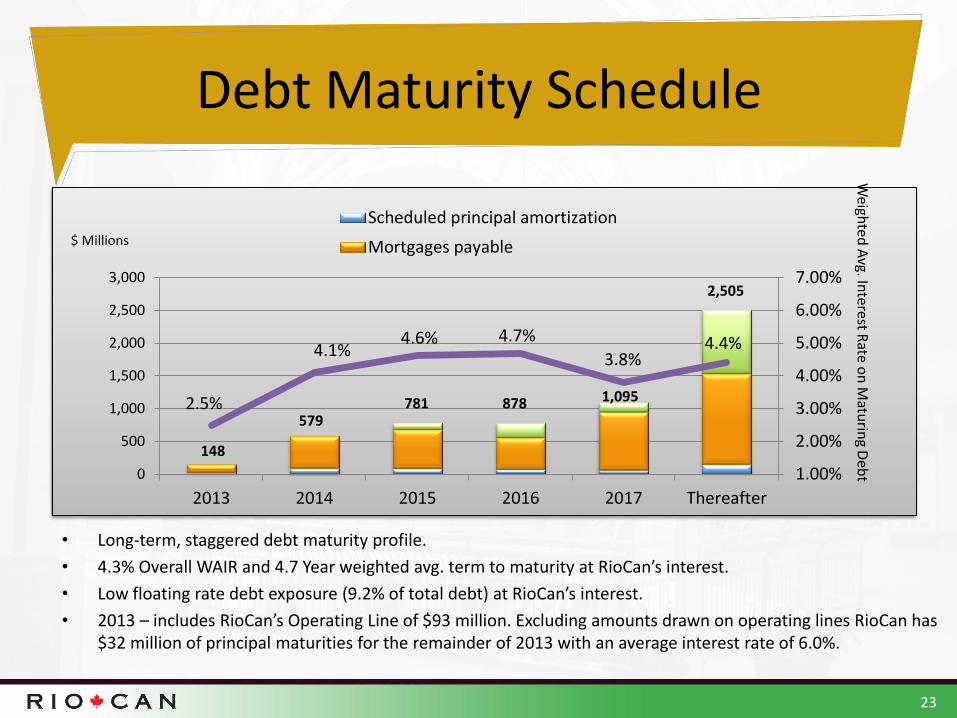
Debt Maturity Schedule
23
• Long‐term, staggered debt maturity profile.
• 4.3% Overall WAIR and 4.7 Year weighted avg. term to maturity at RioCan’s interest.
• Low floating rate debt exposure (9.2% of total debt) at RioCan’s interest.
• 2013 – includes RioCan’s Operating Line of $93 million. Excluding amounts drawn on operating lines RioCan has $32 million of principal maturities for the remainder of 2013 with an average interest rate of 6.0%.
2.5%
4.1% 4.6% 4.7%
3.8% 4.4%
1.00%
2.00%
3.00%
4.00%
5.00%
6.00%
7.00%
0
500
1,000
1,500
2,000
2,500
3,000
2013 2014 2015 2016 2017 Thereafter
Scheduled principal amortization
Mortgages payable$ Millions
Weigh
ted A
vg. Interest R
ate on
Matu
ring D
ebt
148
579 781 878 1,095
2,505

Objectives
24
Disciplined growth strategy in Canada and U.S. that is positioned to benefit from robust acquisition activity and development pipeline
In 2013, RioCan began capital recycling program to sell lower growth assets predominantly in secondary and tertiary markets to improve organic growth and further focus the portfolio in Canada’s six major markets (Vancouver, Edmonton, Calgary, Toronto, Ottawa and Montreal)
Experienced, performance driven management team
Dominant, geographically diversified platform
Maintain and strengthen RioCan’s already conservative balance sheet to build on RioCan’s financial strength and reduce cost of capital with a diversified debt ladder to reduce interest rate risk
Diversified portfolio of national retail tenants
Strong operating results and proven track record

Strong Tenant Relationships
25
Strong Tenant Relationships
26
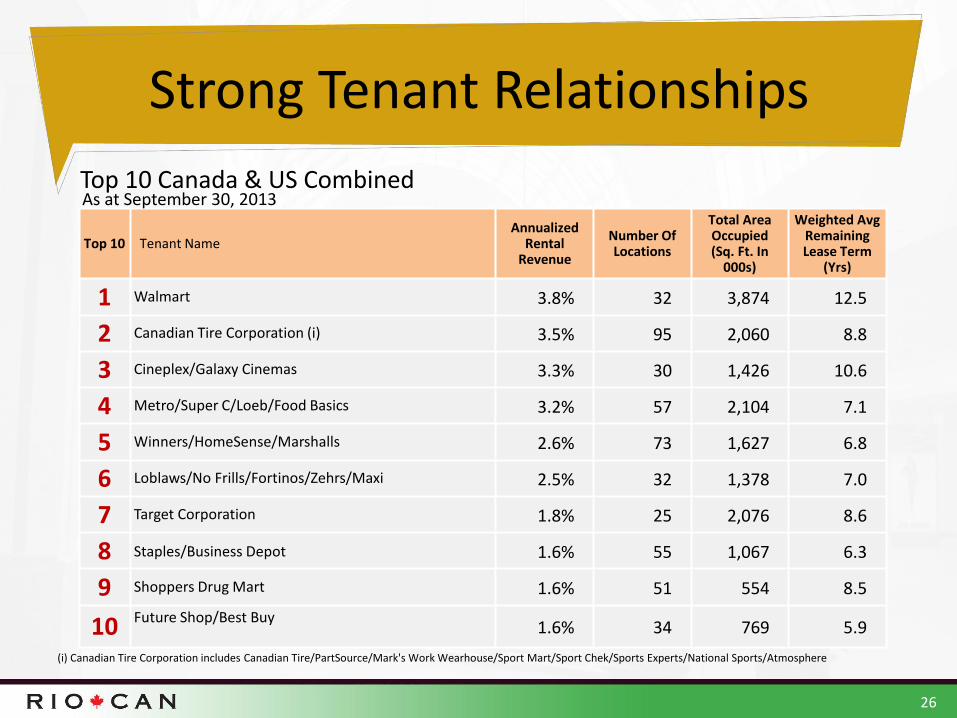
Top 10 Canada & US Combined
Top 10 Tenant Name Annualized
Rental Revenue
Number Of Locations
Total Area Occupied (Sq. Ft. In
000s)
Weighted Avg Remaining Lease Term
(Yrs)
1 Walmart 3.8% 32 3,874 12.5
2 Canadian Tire Corporation (i) 3.5% 95 2,060 8.8
3 Cineplex/Galaxy Cinemas 3.3% 30 1,426 10.6
4 Metro/Super C/Loeb/Food Basics 3.2% 57 2,104 7.1
5 Winners/HomeSense/Marshalls 2.6% 73 1,627 6.8
6 Loblaws/No Frills/Fortinos/Zehrs/Maxi 2.5% 32 1,378 7.0
7 Target Corporation 1.8% 25 2,076 8.6
8 Staples/Business Depot 1.6% 55 1,067 6.3
9 Shoppers Drug Mart 1.6% 51 554 8.5
10 Future Shop/Best Buy 1.6% 34 769 5.9
(i) Canadian Tire Corporation includes Canadian Tire/PartSource/Mark's Work Wearhouse/Sport Mart/Sport Chek/Sports Experts/National Sports/Atmosphere
As at September 30, 2013

Strong Tenant Relationships
27
Top 10 Canada & US Combined – Pro Forma Recently announced Transactions
Top 10 Tenant Name
1 Loblaws/No Frills/Fortinos/Zehrs/Maxi/ Shoppers Drug Mart (i)
2 Walmart
3 Canadian Tire Corporation
4 Cineplex/Galaxy Cinemas (ii)
5 Metro/Super C/Loeb/Food Basics
6 Winners/HomeSense/Marshalls
7 Target Corporation
8 Staples/Business Depot
9 Sobey’s / Safeway (iii)
10 Future Shop/Best Buy
The following pro forma rankings assume the successful closings of all the deals mentioned below: (i) Loblaws has entered into an agreement to
purchase Shoppers Drug Mart which is scheduled to close in the first quarter of 2014. Loblaws will be RioCan’s largest tenant by gross revenue.
(ii) Cineplex has purchased certain theatre locations from Empire Co., including two locations within the RioCan portfolio. Cineplex will become RioCan’s 4th largest tenant as measured by gross revenue when the Loblaws acquisition described above is completed.
(iii) On November 4, 2013 Sobeys completed the purchase of Safeway Canada. As a result, Sobeys is RioCan’s 9th largest tenant by gross revenue.
Strong Tenant Relationships
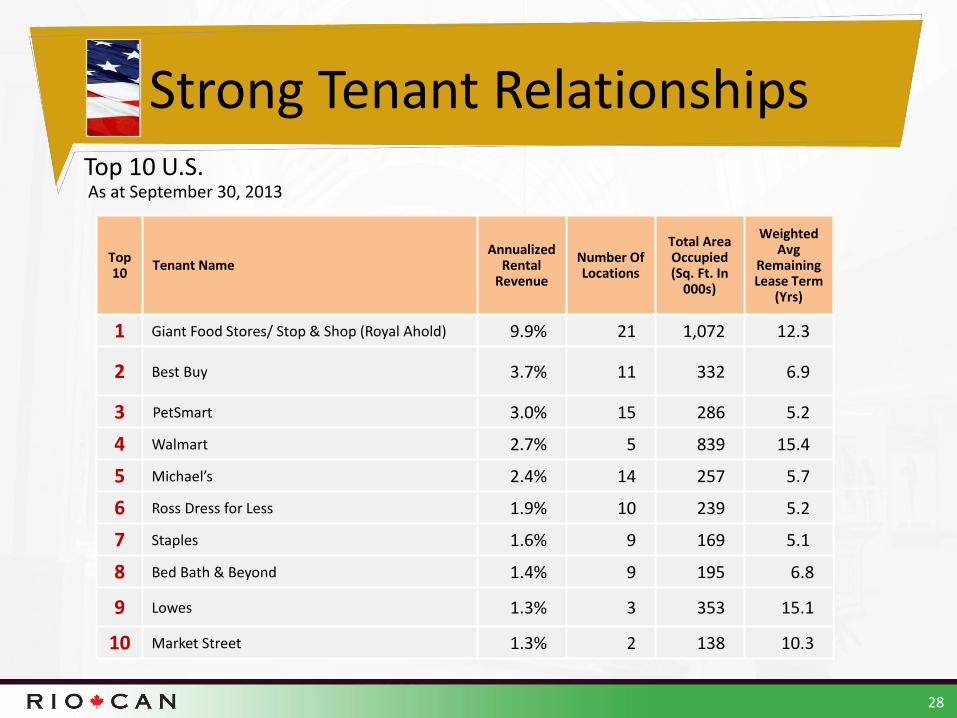
28
Top 10 U.S.
Top 10
Tenant Name Annualized
Rental Revenue
Number Of Locations
Total Area Occupied (Sq. Ft. In
000s)
Weighted Avg
Remaining Lease Term
(Yrs)
1 Giant Food Stores/ Stop & Shop (Royal Ahold) 9.9% 21 1,072 12.3
2 Best Buy 3.7% 11 332 6.9
3 PetSmart 3.0% 15 286 5.2
4 Walmart 2.7% 5 839 15.4
5 Michael’s 2.4% 14 257 5.7
6 Ross Dress for Less 1.9% 10 239 5.2
7 Staples 1.6% 9 169 5.1
8 Bed Bath & Beyond 1.4% 9 195 6.8
9 Lowes 1.3% 3 353 15.1
10 Market Street 1.3% 2 138 10.3
As at September 30, 2013
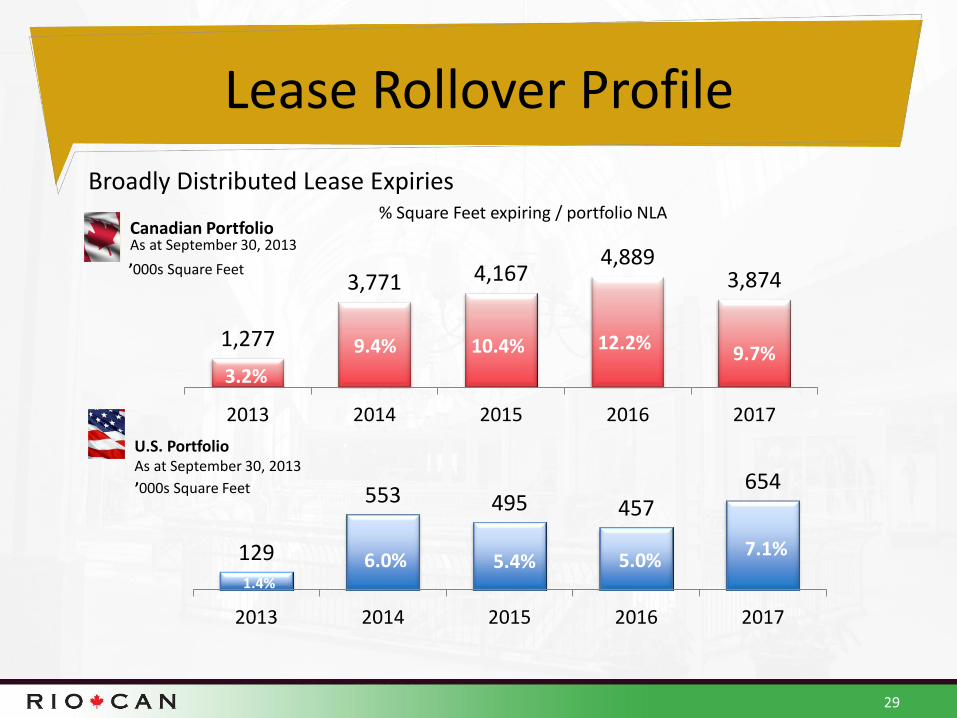
Lease Rollover Profile
Broadly Distributed Lease Expiries
29
1,277
3,771 4,167 4,889
3,874
2013 2014 2015 2016 2017
129
553 495 457 654
2013 2014 2015 2016 2017
% Square Feet expiring / portfolio NLA Canadian Portfolio As at September 30, 2013
U.S. Portfolio As at September 30, 2013
’000s Square Feet
’000s Square Feet
3.2%
9.4% 10.4% 12.2% 9.7%
1.4%
6.0% 5.4% 5.0% 7.1%
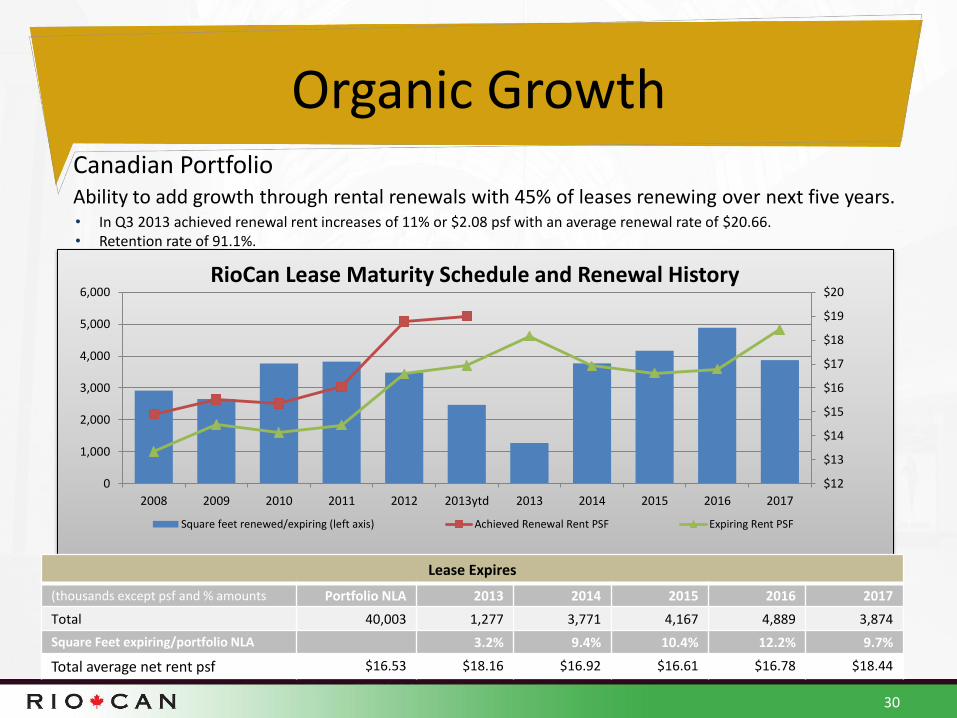
Organic Growth
Lease Expires
(thousands except psf and % amounts Portfolio NLA 2013 2014 2015 2016 2017
Total 40,003 1,277 3,771 4,167 4,889 3,874
Square Feet expiring/portfolio NLA 3.2% 9.4% 10.4% 12.2% 9.7%
Total average net rent psf $16.53 $18.16 $16.92 $16.61 $16.78 $18.44
30
Canadian Portfolio Ability to add growth through rental renewals with 45% of leases renewing over next five years. • In Q3 2013 achieved renewal rent increases of 11% or $2.08 psf with an average renewal rate of $20.66. • Retention rate of 91.1%.
$12
$13
$14
$15
$16
$17
$18
$19
$20
0
1,000
2,000
3,000
4,000
5,000
6,000
2008 2009 2010 2011 2012 2013ytd 2013 2014 2015 2016 2017
RioCan Lease Maturity Schedule and Renewal History
Square feet renewed/expiring (left axis) Achieved Renewal Rent PSF Expiring Rent PSF
Organic Growth
Lease Expires
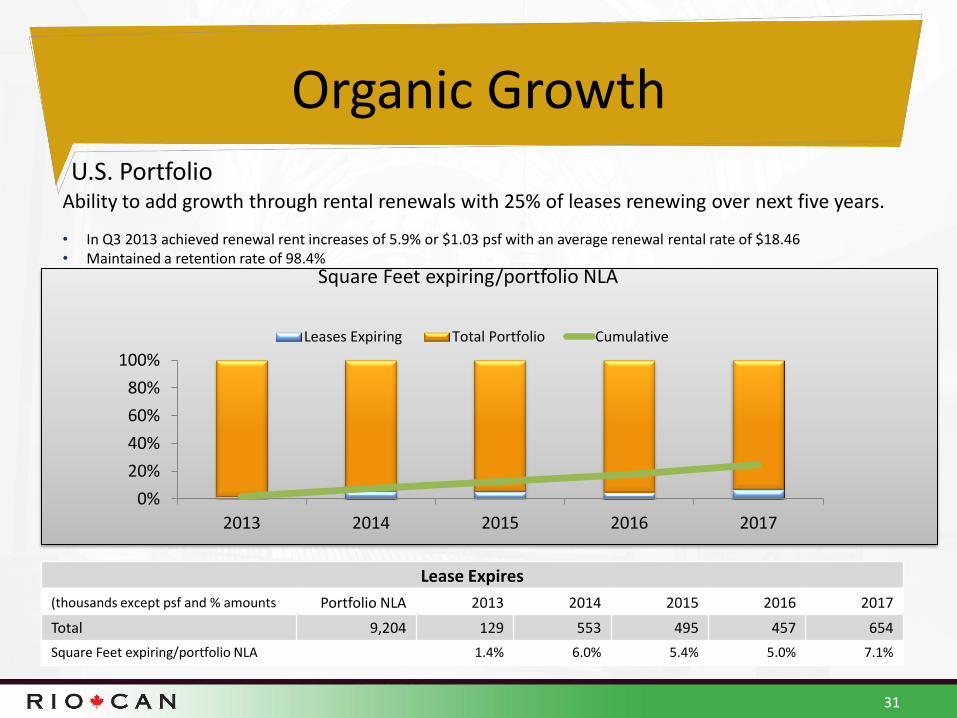
(thousands except psf and % amounts Portfolio NLA 2013 2014 2015 2016 2017
Total 9,204 129 553 495 457 654
Square Feet expiring/portfolio NLA 1.4% 6.0% 5.4% 5.0% 7.1%
31
U.S. Portfolio
0%
20%
40%
60%
80%
100%
2013 2014 2015 2016 2017
Leases Expiring Total Portfolio Cumulative
Square Feet expiring/portfolio NLA
Ability to add growth through rental renewals with 25% of leases renewing over next five years.
• In Q3 2013 achieved renewal rent increases of 5.9% or $1.03 psf with an average renewal rental rate of $18.46 • Maintained a retention rate of 98.4%
Objectives
32
Disciplined growth strategy in Canada and U.S. that is positioned to benefit from robust acquisition activity and development pipeline
In 2013, RioCan began capital recycling program to sell lower growth assets predominantly in secondary and tertiary markets to improve organic growth and further focus the portfolio in Canada’s six major markets (Vancouver, Edmonton, Calgary, Toronto, Ottawa and Montreal)
Experienced, performance driven management team
Dominant, geographically diversified platform
Maintain and strengthen RioCan’s already conservative balance sheet to build on RioCan’s financial strength and reduce cost of capital with a diversified debt ladder to reduce interest rate risk
Diversified portfolio of national retail tenants
Strong operating results and proven track record

Extracting Value by Recycling Capital
• RioCan had dispositions of $16 million during the quarter and dispositions of $422 million during the year through November 18, 2013.
• RioCan has two property dispositions in Canada under firm contract where conditions have been waived pursuant to a purchase and sale agreement at a sale price of $194 million. These properties carry $92 million of in place mortgage debt that will be assumed by the purchaser. These sales are expected to be completed before year end.
• RioCan is also in the process of marketing for sale two other properties in Canada. One of the properties is under conditional contract for a sales price of $47 million. This property has associated debt of $7 million.
• Current asset sales plan involves selling centres in lower growth and secondary markets;
• These asset sales will further enhance RioCan’s strategy to be focused in Canada’s high population, high growth markets;
– RioCan’s concentration in Canada’s six high growth markets exceeds 70% (Year end 2012 68%)
– Capital from asset sales redeployed into enclosed mall acquisitions and development activities.
33
RioCan’s plan to recycle capital into higher growth assets will provide for enhanced returns to unitholders and a reduced need for access to public equity markets to raise capital.
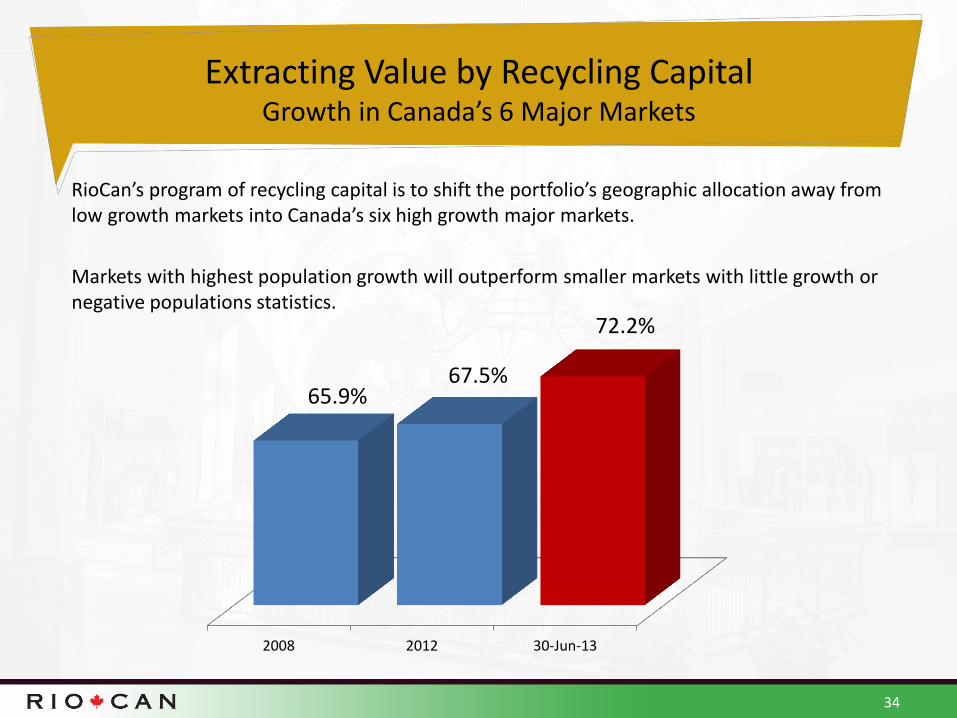
Extracting Value by Recycling Capital Growth in Canada’s 6 Major Markets
RioCan’s program of recycling capital is to shift the portfolio’s geographic allocation away from low growth markets into Canada’s six high growth major markets.
Markets with highest population growth will outperform smaller markets with little growth or negative populations statistics.
34
2008 2012 30-Jun-13
65.9% 67.5%
72.2%
Objectives
35
Disciplined growth strategy in Canada and U.S. that is positioned to benefit from robust acquisition activity and development pipeline
In 2013, RioCan began capital recycling program to sell lower growth assets predominantly in secondary and tertiary markets to improve organic growth and further focus the portfolio in Canada’s six major markets (Vancouver, Edmonton, Calgary, Toronto, Ottawa and Montreal)
Experienced, performance driven management team
Dominant, geographically diversified platform
Maintain and strengthen RioCan’s already conservative balance sheet to build on RioCan’s financial strength and reduce cost of capital with a diversified debt ladder to reduce interest rate risk
Diversified portfolio of national retail tenants
Strong operating results and proven track record

Development Activity
At September 30, 2013
Total developments comprise 11.7 million square feet, including shadow anchors (7.2 million square feet included in Greenfield developments and 3.1 million square feet of Urban intensification projects).
• RioCan’s interest consists of 3.3 million square feet of Greenfield development and 1.5 million square feet of Urban intensification projects
• Total estimated development spending of $55.1 million for the balance of 2013 on Greenfield and Urban intensification activities. Overall development spending in the next five to seven years will range from $100 million to $150 million per year.
• RioCan’s committed active development pipeline totals approximately $308 million, with an additional $181 million of Non-committed development costs projected.
• Generate unlevered yield between 7% to 11%, at a weighted average of 8.0% to 9.0%.
• Recent Urban Development acquisitions include Yonge & Eglinton Northeast corner, Bathurst & College, and 740 Dupont in the GTA and Herongate Mall in Ottawa, ON.
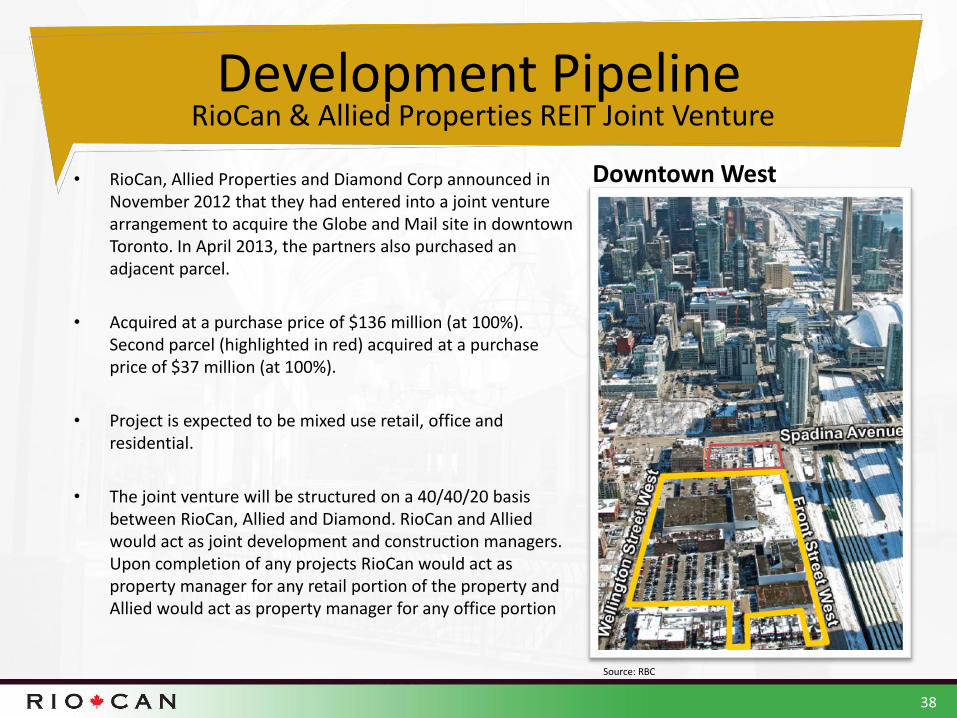
• In July 2012, RioCan formed a JV with Allied Property REIT to develop sites in major markets across Canada.
• RioCan, Allied Properties and Diamond Corp. entered into a joint venture arrangement and have acquired two parcels which comprise the Globe and Mail site in downtown Toronto.
36
Development Pipeline
Greenfield developments through in‐house capabilities and with partners, such as Trinity, Allied Properties, KingSett Capital, and Canada Pension Plan Investment Board (CPPIB)
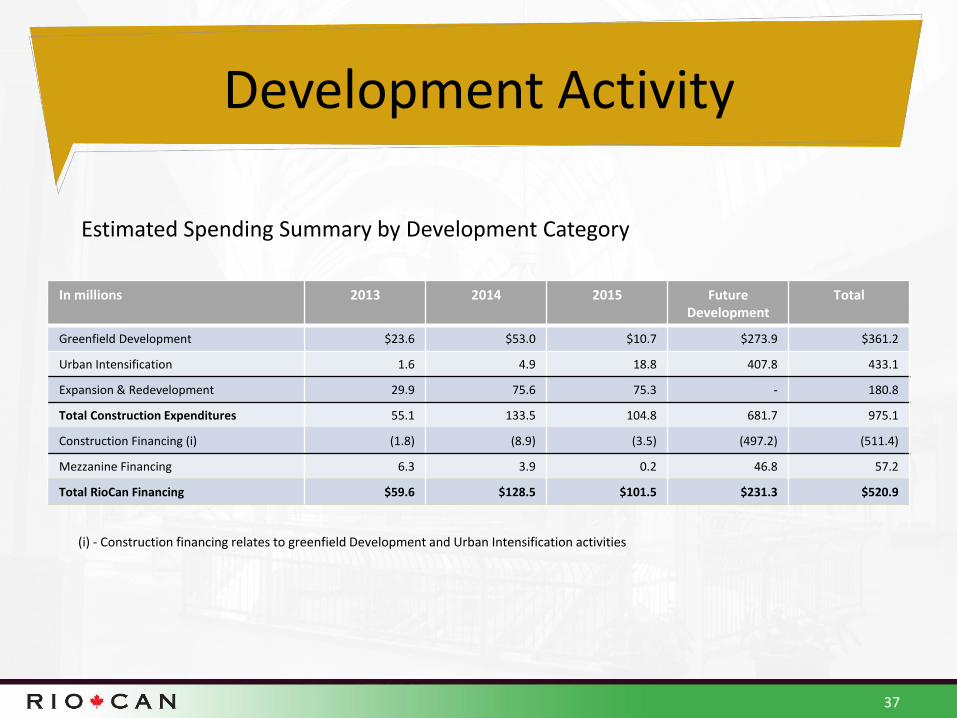
Development Activity
In millions 2013 2014 2015 Future Development
Total
Greenfield Development $23.6 $53.0 $10.7 $273.9 $361.2
Urban Intensification 1.6 4.9 18.8 407.8 433.1
Expansion & Redevelopment 29.9 75.6 75.3 - 180.8
Total Construction Expenditures 55.1 133.5 104.8 681.7 975.1
Construction Financing (i) (1.8) (8.9) (3.5) (497.2) (511.4)
Mezzanine Financing 6.3 3.9 0.2 46.8 57.2
Total RioCan Financing $59.6 $128.5 $101.5 $231.3 $520.9
37
(i) - Construction financing relates to greenfield Development and Urban Intensification activities
Estimated Spending Summary by Development Category
Development Pipeline
38
• RioCan, Allied Properties and Diamond Corp announced in November 2012 that they had entered into a joint venture arrangement to acquire the Globe and Mail site in downtown Toronto. In April 2013, the partners also purchased an adjacent parcel.
• Acquired at a purchase price of $136 million (at 100%). Second parcel (highlighted in red) acquired at a purchase price of $37 million (at 100%).
• Project is expected to be mixed use retail, office and residential.
• The joint venture will be structured on a 40/40/20 basis between RioCan, Allied and Diamond. RioCan and Allied would act as joint development and construction managers. Upon completion of any projects RioCan would act as property manager for any retail portion of the property and Allied would act as property manager for any office portion
RioCan & Allied Properties REIT Joint Venture
Downtown West
Source: RBC
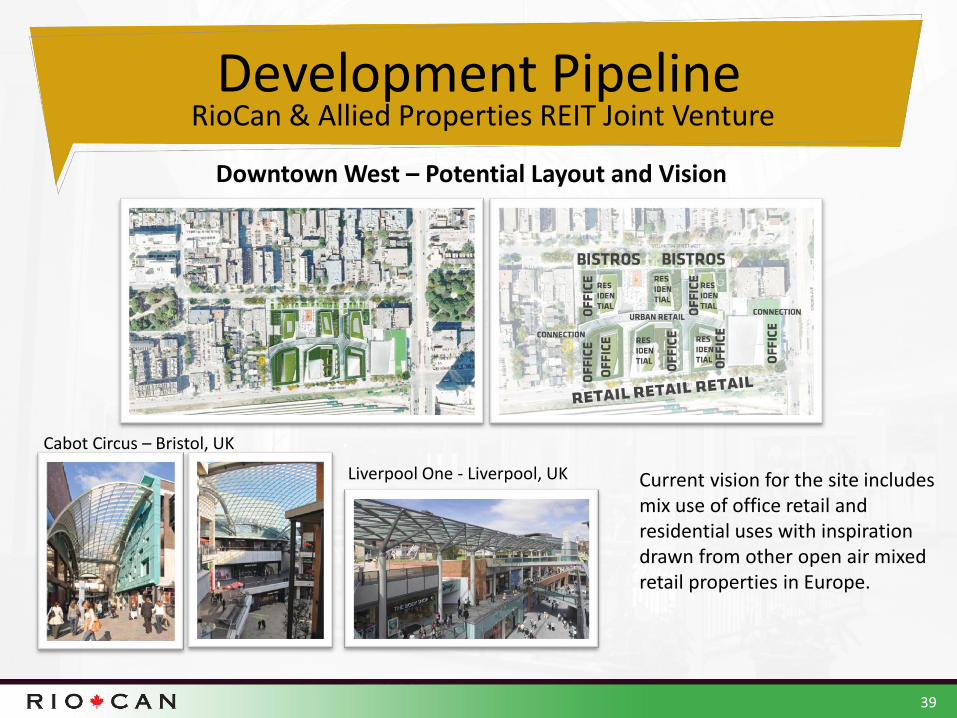
Development Pipeline
39
RioCan & Allied Properties REIT Joint Venture
Downtown West – Potential Layout and Vision
Cabot Circus – Bristol, UK
Liverpool One - Liverpool, UK Current vision for the site includes mix use of office retail and residential uses with inspiration drawn from other open air mixed retail properties in Europe.
Development Activity
40
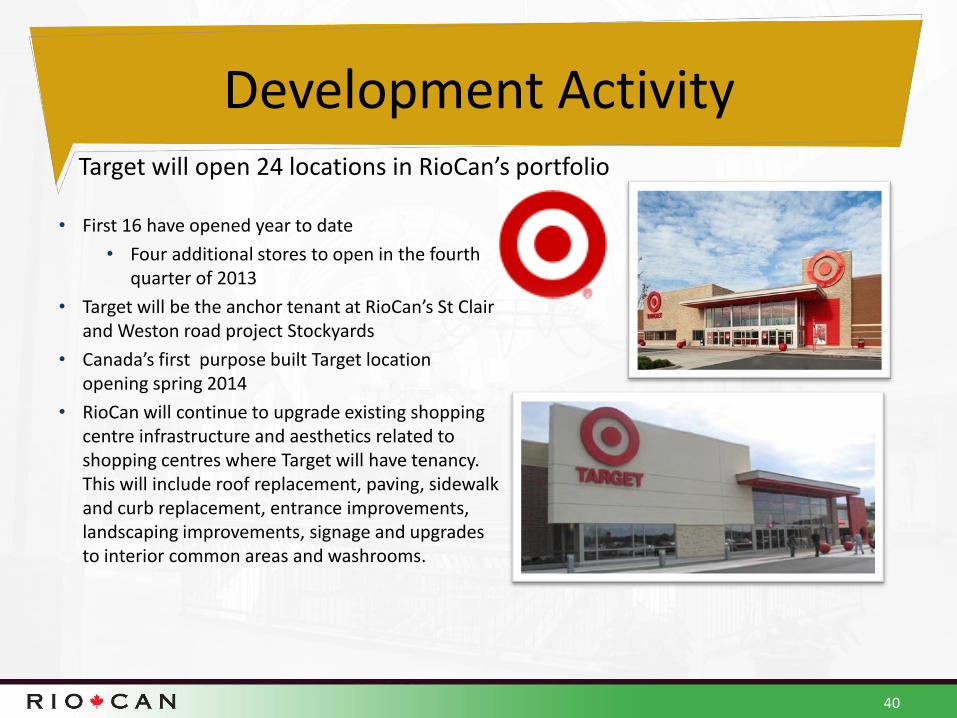
Target will open 24 locations in RioCan’s portfolio
• First 16 have opened year to date
• Four additional stores to open in the fourth quarter of 2013
• Target will be the anchor tenant at RioCan’s St Clair and Weston road project Stockyards
• Canada’s first purpose built Target location opening spring 2014
• RioCan will continue to upgrade existing shopping centre infrastructure and aesthetics related to shopping centres where Target will have tenancy. This will include roof replacement, paving, sidewalk and curb replacement, entrance improvements, landscaping improvements, signage and upgrades to interior common areas and washrooms.
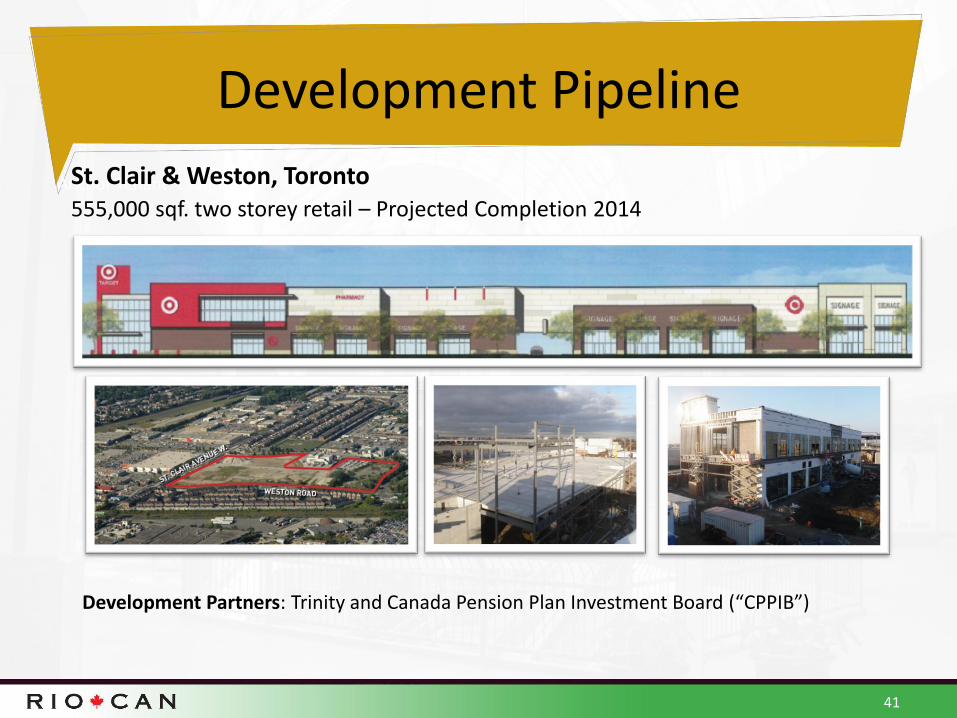
Development Pipeline
Anchor Tenant - Target
41
St. Clair & Weston, Toronto 555,000 sqf. two storey retail – Projected Completion 2014
Development Partners: Trinity and Canada Pension Plan Investment Board (“CPPIB”)
Development Pipeline
42
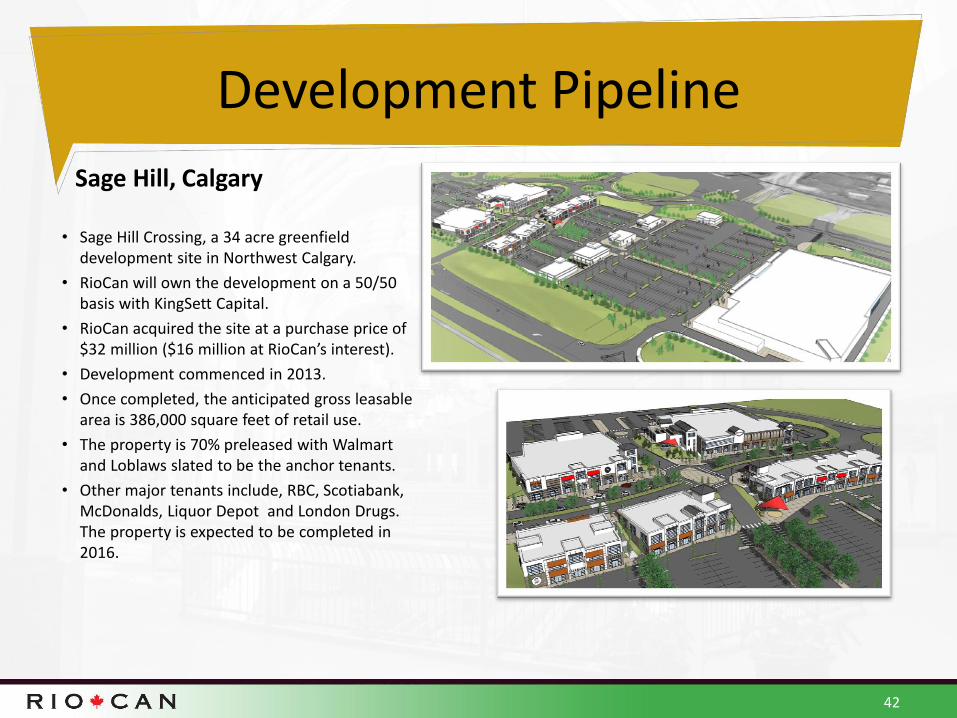
Sage Hill, Calgary
• Sage Hill Crossing, a 34 acre greenfield development site in Northwest Calgary.
• RioCan will own the development on a 50/50 basis with KingSett Capital.
• RioCan acquired the site at a purchase price of $32 million ($16 million at RioCan’s interest).
• Development commenced in 2013.
• Once completed, the anticipated gross leasable area is 386,000 square feet of retail use.
• The property is 70% preleased with Walmart and Loblaws slated to be the anchor tenants.
• Other major tenants include, RBC, Scotiabank, McDonalds, Liquor Depot and London Drugs. The property is expected to be completed in 2016.
Creating New Cash Flow Sources
43
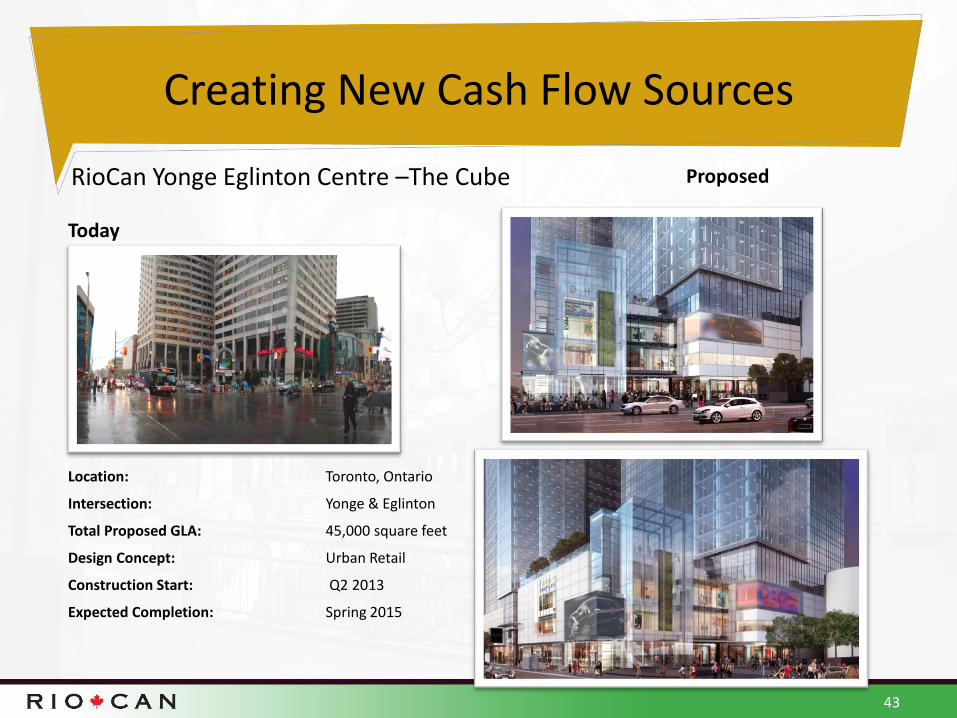
RioCan Yonge Eglinton Centre –The Cube
Location: Toronto, Ontario
Intersection: Yonge & Eglinton
Total Proposed GLA: 45,000 square feet
Design Concept: Urban Retail
Construction Start: Q2 2013
Expected Completion: Spring 2015
Today
Proposed
Creating New Cash Flow Sources
44
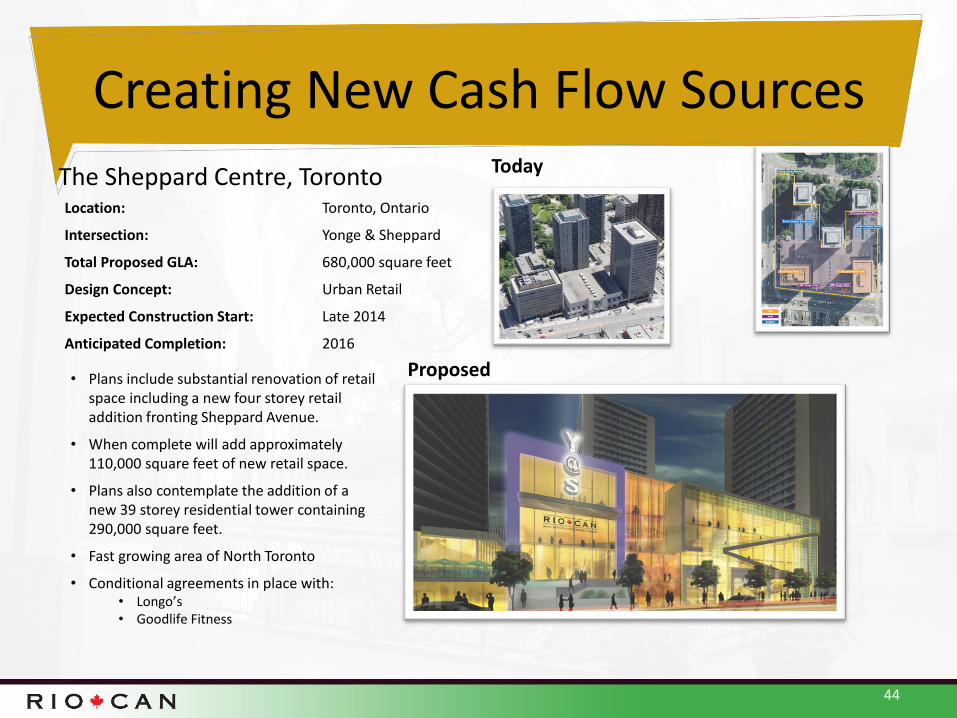
The Sheppard Centre, Toronto Location: Toronto, Ontario
Intersection: Yonge & Sheppard
Total Proposed GLA: 680,000 square feet
Design Concept: Urban Retail
Expected Construction Start: Late 2014
Anticipated Completion: 2016
Today
• Plans include substantial renovation of retail space including a new four storey retail addition fronting Sheppard Avenue.
• When complete will add approximately 110,000 square feet of new retail space.
• Plans also contemplate the addition of a new 39 storey residential tower containing 290,000 square feet.
• Fast growing area of North Toronto
• Conditional agreements in place with: • Longo’s • Goodlife Fitness
Proposed

Creating New Cash Flow Sources
45
Location: Toronto, Ontario
Intersection: Yonge & Eglinton
Total Proposed GLA: 54,000 square feet
Design Concept: Urban Retail
Anticipated Completion: 2017
NE Yonge Eglinton - Toronto, Ontario
• 1.1 acre site has been approved for redevelopment by the city of Toronto with a 58 storey tower at corner of Yonge and Eglinton and a 36 storey tower fronting Roehampton Avenue (first street north of Eglinton).
• Condominium portion of the project is 90% pre-sold by dollar value.
• North tower to be developed as rental residential. Current plans are for 208 unit residential apartment building.

RioCan Yonge Eglinton Centre
2300 Yonge Street, Suite 500
PO Box 2386
Toronto, Ontario
M4P 1E4
TRANSFORMING…