Embed Size (px)
Citation preview

O p e n
31 October 2016 DEBEN ESTUARY 2016 WATBB5647R001D01 i
REPORT
Deben Estuary Entrance Review
Defence sensitivity
Client: Suffolk Coastal District Council
Reference: WATBB5647R001D01
Revision: 03/Final
Date: 31 October 2016
O p e n
31 October 2016 DEBEN ESTUARY 2016 WATBB5647R001D01 i
HASKONINGDHV UK LTD.
Rightwell House
Rightwell East
Bretton
Peterborough
PE3 8DW
Water
VAT registration number: 792428892
+44 1733 334455
+44 1733 262243
royalhaskoningdhv.com
T
F
E
W
Document title: Deben Estuary Entrance Review
Document short title: Deben Estuary 2016
Reference: WATBB5647R001D01
Revision: 03/Final
Date: 31 October 2016
Project name: Deben Estuary Review
Project number: BB5647
Author(s): Gregor Guthrie
Drafted by:
Checked by:
Date / initials:
Approved by:
Date / initials:
Classification
Open
Disclaimer
No part of these specifications/printed matter may be reproduced and/or published by print, photocopy, microfilm or by
any other means, without the prior written permission of HaskoningDHV UK Ltd.; nor may they be used, without such
permission, for any purposes other than that for which they were produced. HaskoningDHV UK Ltd. accepts no
responsibility or liability for these specifications/printed matter to any party other than the persons by whom it was
commissioned and as concluded under that Appointment. The quality management system of HaskoningDHV UK Ltd.
has been certified in accordance with ISO 9001, ISO 14001 and OHSAS 18001.
O p e n
31 October 2016 DEBEN ESTUARY 2016 WATBB5647R001D01 ii
Table of Contents
1 Introduction 1
1.1 Purpose 1
1.2 Report Structure 2
1.3 Overview of Estuary Behaviour 3
1.3.1 General Context 3
2 The Estuary 7
2.1 Coastal Processes 7
2.2 Conceptual behaviour of the outer estuary behaviour 9
2.3 Detailed Change 9
3 Local Assessment 18
3.1 Bawdsey Quay Wall 19
3.1.1 Condition 19
3.1.2 Flood risk 20
3.1.3 Erosion and interaction with estuary processes 21
3.2 Bawdsey Manor 23
3.2.1 Beach level analysis 24
4 Conclusions, Implications for Management and
Recommendations 29
4.1 Conclusions and Implications for Management 29
4.2 Review of Previous Management Conclusions (2003) 31
4.2.1 Review of Do Nothing and Defence Integrity. 32
4.2.2 Review of Previous Recommendation 2003 34
4.3 Recommendations 36
4.3.1 General Recommendations 36
4.3.2 Recommendations with Respect to the Bawdsey Quay Frontage. 36
4.3.3 Recommendations with Respect to Bawdsey Manor 37
4.3.4 Recommendations on Flow Measurements. 37

O p e n
31 October 2016 DEBEN ESTUARY 2016 WATBB5647R001D01 iii
O p e n
31 October 2016 DEBEN ESTUARY 2016 WATBB5647R001D01 1
1 Introduction
1.1 Purpose
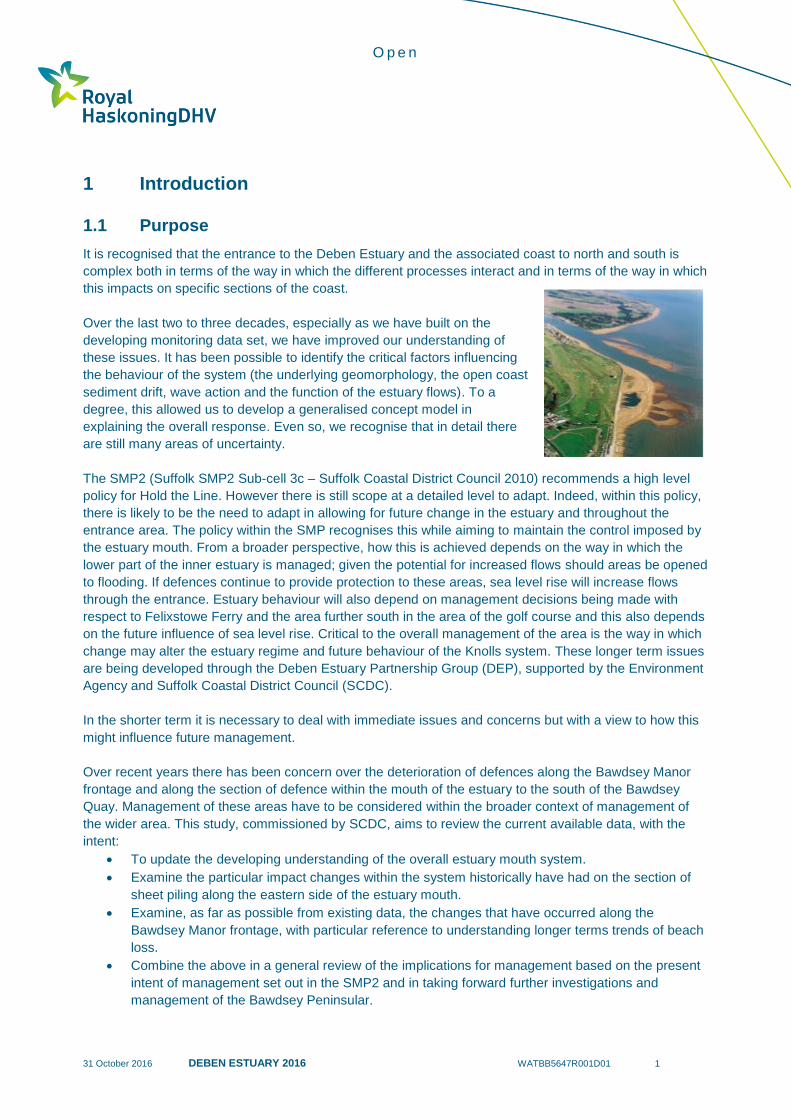
It is recognised that the entrance to the Deben Estuary and the associated coast to north and south is
complex both in terms of the way in which the different processes interact and in terms of the way in which
this impacts on specific sections of the coast.
Over the last two to three decades, especially as we have built on the
developing monitoring data set, we have improved our understanding of
these issues. It has been possible to identify the critical factors influencing
the behaviour of the system (the underlying geomorphology, the open coast
sediment drift, wave action and the function of the estuary flows). To a
degree, this allowed us to develop a generalised concept model in
explaining the overall response. Even so, we recognise that in detail there
are still many areas of uncertainty.
The SMP2 (Suffolk SMP2 Sub-cell 3c – Suffolk Coastal District Council 2010) recommends a high level
policy for Hold the Line. However there is still scope at a detailed level to adapt. Indeed, within this policy,
there is likely to be the need to adapt in allowing for future change in the estuary and throughout the
entrance area. The policy within the SMP recognises this while aiming to maintain the control imposed by
the estuary mouth. From a broader perspective, how this is achieved depends on the way in which the
lower part of the inner estuary is managed; given the potential for increased flows should areas be opened
to flooding. If defences continue to provide protection to these areas, sea level rise will increase flows
through the entrance. Estuary behaviour will also depend on management decisions being made with
respect to Felixstowe Ferry and the area further south in the area of the golf course and this also depends
on the future influence of sea level rise. Critical to the overall management of the area is the way in which
change may alter the estuary regime and future behaviour of the Knolls system. These longer term issues
are being developed through the Deben Estuary Partnership Group (DEP), supported by the Environment
Agency and Suffolk Coastal District Council (SCDC).
In the shorter term it is necessary to deal with immediate issues and concerns but with a view to how this
might influence future management.
Over recent years there has been concern over the deterioration of defences along the Bawdsey Manor
frontage and along the section of defence within the mouth of the estuary to the south of the Bawdsey
Quay. Management of these areas have to be considered within the broader context of management of
the wider area. This study, commissioned by SCDC, aims to review the current available data, with the
intent:
To update the developing understanding of the overall estuary mouth system.
Examine the particular impact changes within the system historically have had on the section of
sheet piling along the eastern side of the estuary mouth.
Examine, as far as possible from existing data, the changes that have occurred along the
Bawdsey Manor frontage, with particular reference to understanding longer terms trends of beach
loss.
Combine the above in a general review of the implications for management based on the present
intent of management set out in the SMP2 and in taking forward further investigations and
management of the Bawdsey Peninsular.

O p e n
31 October 2016 DEBEN ESTUARY 2016 WATBB5647R001D01 2
This study aims to advance the understanding of the area and highlight, in broad terms, how different
elements of management may be critical to overall management, within the agreed intent of the SMP2.
The study, aims to assist in the various decision making processes.
1.2 Report Structure
The following sub-section (Section 1.3) provides a general overview of change within the estuary. Section
2 develops on this, discussing the general information on coastal processes and moving on to look in
more detail as to the specific changes that have occurred in the behaviour of the Estuary Entrance area.
Section 3 discusses more specifically the two areas of concern identifying changes that have occurred.
This draws upon information on historic and more recent changes and links this through to the broader
trends over the wider area. This section draws together the conclusions with respect to individual sections
of defence.
Section 4 discusses the implications in terms of management and makes recommendations for immediate
and longer term actions, highlighting key aspect of risks and critical uncertainty. Reference is made
Bawdsey Manor Implementation report (2003 SCDC) considering how recommendations fit within this
improved understanding.

O p e n
31 October 2016 DEBEN ESTUARY 2016 WATBB5647R001D01 3
1.3 Overview of Estuary Behaviour
A general location plan is shown as Figure 1.1 identifying key features referred to in this report and
showing also the overall topography of the area. The area is described within three different zones as
indicated within the figure.
Figure 1.1 Location Plan
1.3.1 General Context
The wider valley of the estuary is formed between two areas of higher ground, at Bawdsey Manor and at
North Felixstowe (Figure 1.1).
In the nearshore area there are a range of banks, influencing and influenced by the development of the
coast (Burningham and French - CERU 2014), as shown in Figure 1.2.
It may be seen that, in the area of the Deben, there is a general widening of the nearshore platform (down
to 5m Chart Datum) which tends to increase in width further south towards Felixstowe.
Effectively at the broader scale, the coastline to north and south of the valley has a standard orientation
(between the mid-section area of the Bawdsey cliffs and the inflection of the southern shore at the Dip,
north of the Cobbolds Point headland) but with northern shoreline slightly set back, the Deben estuary
being formed with a shallow embayment.
Felixstowe
Ferry
Bawdsey
Manor
North
Felixstowe
Inner estuary
Estuary
mouth
Golf
course
The
Knolls
Bawdsey
Quay
Horse
bank
Martello
Towers
Outer
estuary
T1000
T100
T10
MHWS
Felixstowe
Marshes
Bawdsey Marshes
m OD
N
O p e n
31 October 2016 DEBEN ESTUARY 2016 WATBB5647R001D01 4
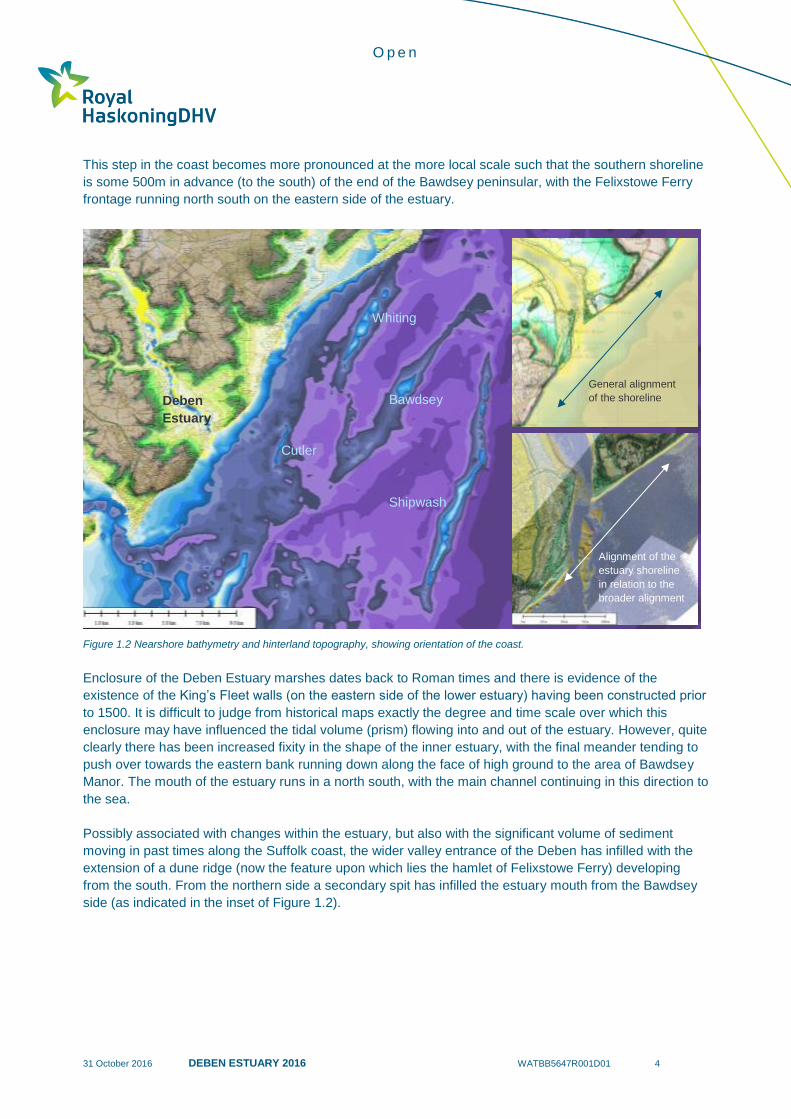
This step in the coast becomes more pronounced at the more local scale such that the southern shoreline
is some 500m in advance (to the south) of the end of the Bawdsey peninsular, with the Felixstowe Ferry
frontage running north south on the eastern side of the estuary.
Figure 1.2 Nearshore bathymetry and hinterland topography, showing orientation of the coast.
Enclosure of the Deben Estuary marshes dates back to Roman times and there is evidence of the
existence of the King’s Fleet walls (on the eastern side of the lower estuary) having been constructed prior
to 1500. It is difficult to judge from historical maps exactly the degree and time scale over which this
enclosure may have influenced the tidal volume (prism) flowing into and out of the estuary. However, quite
clearly there has been increased fixity in the shape of the inner estuary, with the final meander tending to
push over towards the eastern bank running down along the face of high ground to the area of Bawdsey
Manor. The mouth of the estuary runs in a north south, with the main channel continuing in this direction to
the sea.
Possibly associated with changes within the estuary, but also with the significant volume of sediment
moving in past times along the Suffolk coast, the wider valley entrance of the Deben has infilled with the
extension of a dune ridge (now the feature upon which lies the hamlet of Felixstowe Ferry) developing
from the south. From the northern side a secondary spit has infilled the estuary mouth from the Bawdsey
side (as indicated in the inset of Figure 1.2).
Whiting
Bawdsey
Shipwash
Cutler
Deben
Estuary
General alignment
of the shoreline
and
Alignment of the
estuary shoreline
in relation to the
broader alignment
O p e n
31 October 2016 DEBEN ESTUARY 2016 WATBB5647R001D01 5
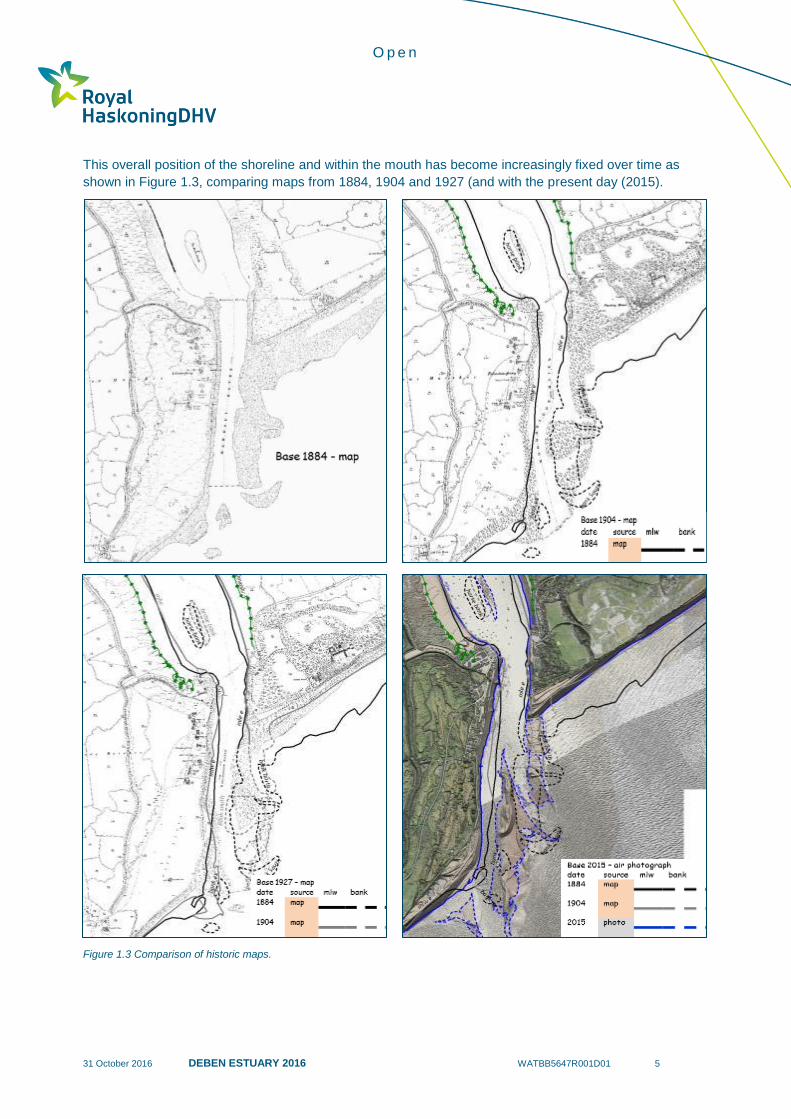
This overall position of the shoreline and within the mouth has become increasingly fixed over time as
shown in Figure 1.3, comparing maps from 1884, 1904 and 1927 (and with the present day (2015).
Figure 1.3 Comparison of historic maps.
O p e n
31 October 2016 DEBEN ESTUARY 2016 WATBB5647R001D01 6
The developing changes occurring over the last century are discussed more fully later but key points are
highlighted below to provide an overall context:
1884
While there are defences evident within the inner estuary, by 1884, there appears to have been
little protection at the mouth or to the shoreline around the outer estuary.
At the northern end of the estuary mouth, on the western side, there is a distinct spit forming into
the inner estuary, with the shoreline further south tending to belly out (to the east) into the main
north south channel running along the Felixstowe Ferry frontage.
Within the inner estuary the Horse bank (Horse Sands) is well aligned to the northern spit, forming
almost as a banner bank within the wider inner estuary.
Although there is evidence of shoals beyond the southern end of the main outer estuary channel
these tend to sit within the limits of the southern foreland.
1904
By 1904, the shape of the western outer shoreline changes, still building out towards the southern
foreland but developing a more significant curve running through to the northern point of the
western side of the estuary mouth. The ferry had been repositioned at this northern point.
Associated with this shift of the outer estuary channel, in a westerly direction, along the central
section of the Felixstowe Ferry frontage, there was the first sign of defence, attempting to control
erosion of the shoreline in this location.
However, what is also seen over the early part of the 20th century is the apparent growth westward
of the southern foreland, effectively re-emphasising the curve in the outer channel.
Early defences had been constructed in the form of groynes to the Bawdsey Manor frontage, in
apparent response to the loss of intertidal foreshore since 1884. Records indicate that a
substantial groyne system had been put in place between the Manor and the estuary by
1892.(Phil Hadwen et al - Pictures from the Past, 1990)
Within the inner estuary, there had been a slight shift in the position of Horse Sands and a
corresponding movement of the low water mark on the eastern bank of the inner estuary, tending
to suggest a link with the alignment of the outer channel and the increased pressure, further
developing the outer curve of the final meander of the inner estuary.
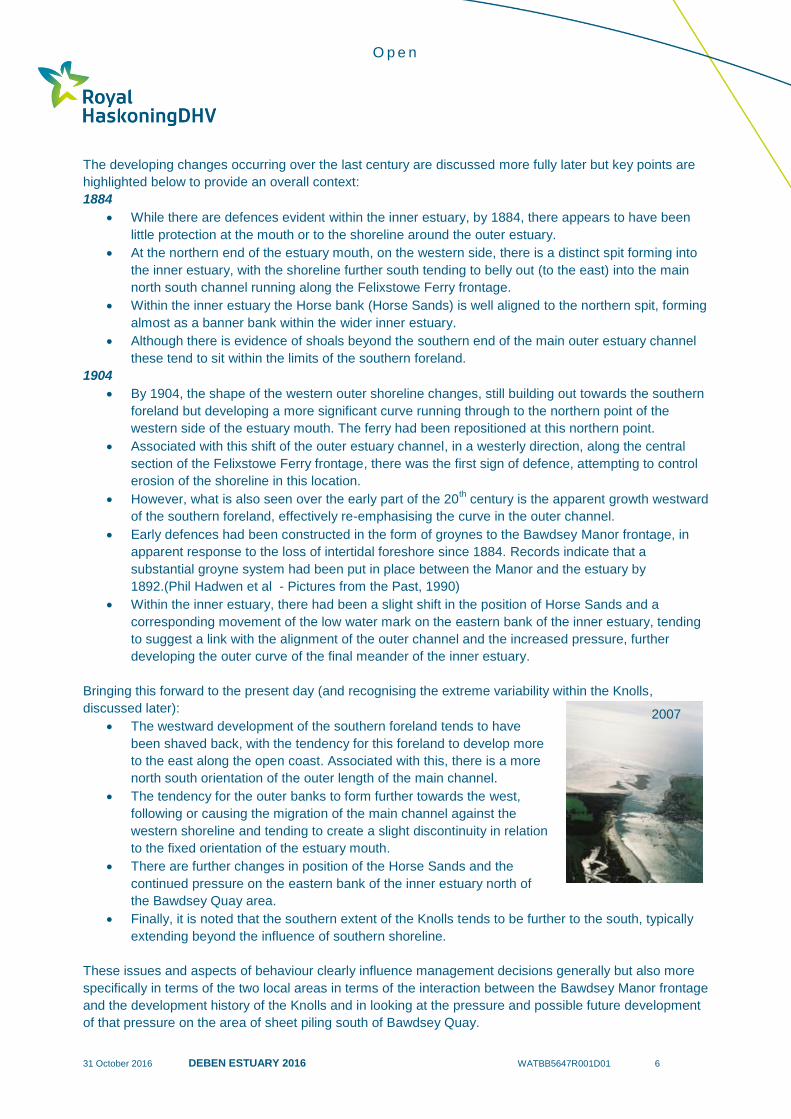
Bringing this forward to the present day (and recognising the extreme variability within the Knolls,
discussed later):
The westward development of the southern foreland tends to have
been shaved back, with the tendency for this foreland to develop more
to the east along the open coast. Associated with this, there is a more
north south orientation of the outer length of the main channel.
The tendency for the outer banks to form further towards the west,
following or causing the migration of the main channel against the
western shoreline and tending to create a slight discontinuity in relation
to the fixed orientation of the estuary mouth.
There are further changes in position of the Horse Sands and the
continued pressure on the eastern bank of the inner estuary north of
the Bawdsey Quay area.
Finally, it is noted that the southern extent of the Knolls tends to be further to the south, typically
extending beyond the influence of southern shoreline.
These issues and aspects of behaviour clearly influence management decisions generally but also more
specifically in terms of the two local areas in terms of the interaction between the Bawdsey Manor frontage
and the development history of the Knolls and in looking at the pressure and possible future development
of that pressure on the area of sheet piling south of Bawdsey Quay.
2007
O p e n
31 October 2016 DEBEN ESTUARY 2016 WATBB5647R001D01 7
2 The Estuary
2.1 Coastal Processes
Tide levels are reported in the Admiralty Tide tables as set out in Table 2.1:
Table 2.1. Tide Levels
MLWS MLWN MHWN MHWS Spring range
Woodbridge Haven -1.43 -0.93 0.97 1.77 3.2
Bawdsey -1.43 -0.77 1.03 1.63 3.1
Extreme water levels are reported for the nearshore area as set out in Table 2.2.
Table 2.2. Extreme Water Levels
Return period
(1 in “n” years) 1 10 50 100 250 500 1000
Level m OD 2.67 3.14 3.51 3.69 3.94 4.14 4.36
Nearshore tidal currents are relatively low (SMP2) with flood flows down the coast (north to south) and
ebb flows running from the south to north. It is highlighted, therefore, that flow into the Deben estuary on
the flood in effect has to reverse direction to flow north through the estuary mouth. On the ebb flows out of
through the estuary mouth again have to turn towards the north to join the generally northward flow
against the shoreline.
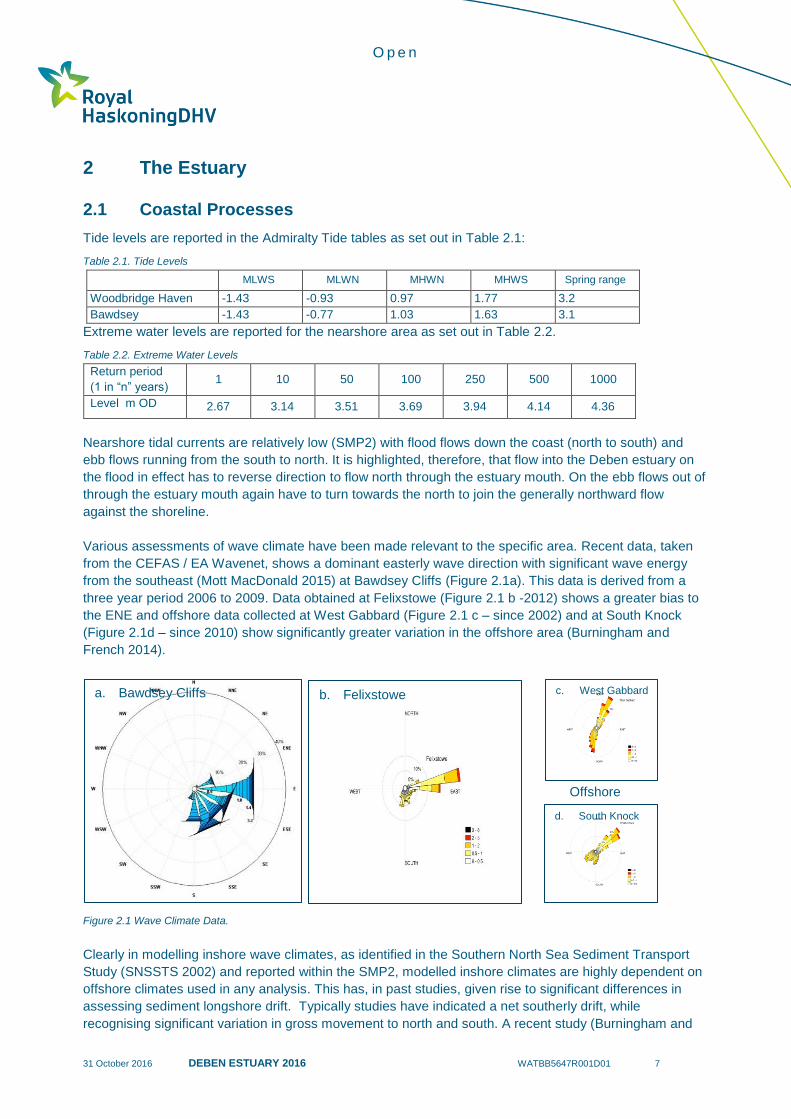
Various assessments of wave climate have been made relevant to the specific area. Recent data, taken
from the CEFAS / EA Wavenet, shows a dominant easterly wave direction with significant wave energy
from the southeast (Mott MacDonald 2015) at Bawdsey Cliffs (Figure 2.1a). This data is derived from a
three year period 2006 to 2009. Data obtained at Felixstowe (Figure 2.1 b -2012) shows a greater bias to
the ENE and offshore data collected at West Gabbard (Figure 2.1 c – since 2002) and at South Knock
(Figure 2.1d – since 2010) show significantly greater variation in the offshore area (Burningham and
French 2014).
Figure 2.1 Wave Climate Data.
Clearly in modelling inshore wave climates, as identified in the Southern North Sea Sediment Transport
Study (SNSSTS 2002) and reported within the SMP2, modelled inshore climates are highly dependent on
offshore climates used in any analysis. This has, in past studies, given rise to significant differences in
assessing sediment longshore drift. Typically studies have indicated a net southerly drift, while
recognising significant variation in gross movement to north and south. A recent study (Burningham and
a. Bawdsey Cliffs b. Felixstowe
Offshore
c. West Gabbard
d. South Knock
O p e n
31 October 2016 DEBEN ESTUARY 2016 WATBB5647R001D01 8
French 2014), suggests a weak northerly net movement along the Bawdsey Cliffs based on weighting
modelling of southerly and north-easterly wave directions.
Such an approach highlights the response of beaches to specific storm directions, demonstrating quite
clearly the sensitivity to offshore wave conditions and certainly suggesting that there may be greater
movement both to the north and south. The variation in wave climate may be a significant factor in driving
differential drift patterns at the shore.
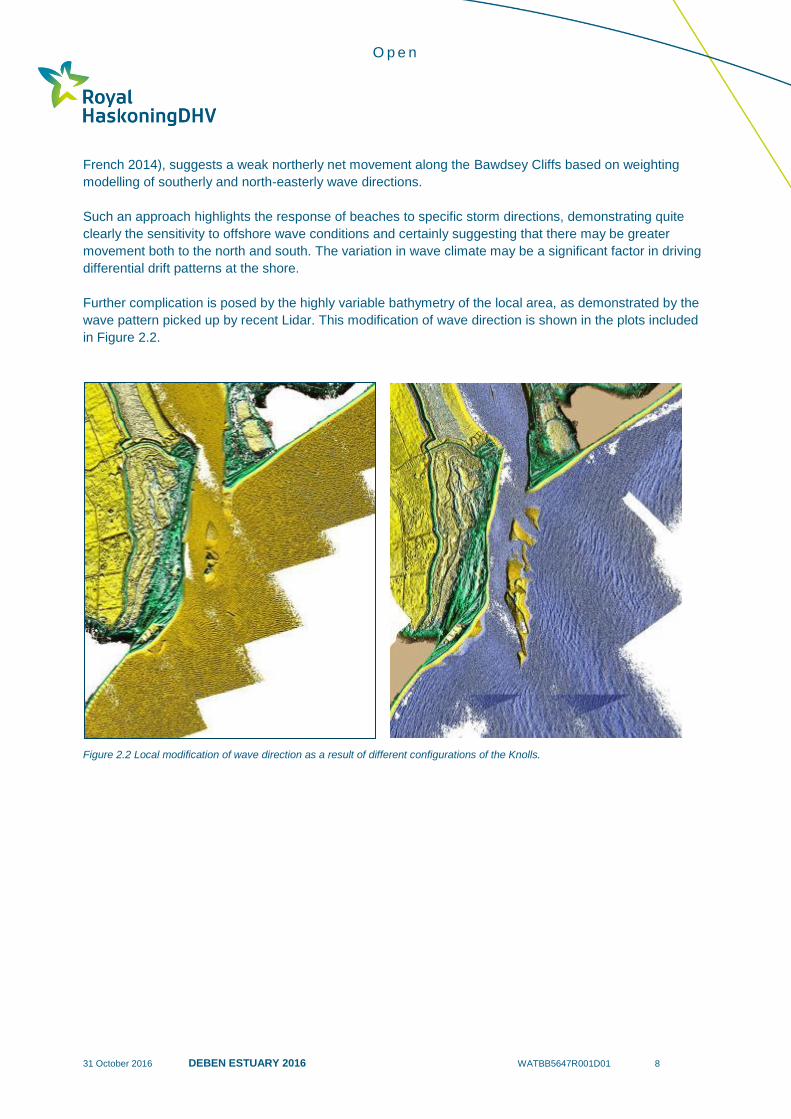
Further complication is posed by the highly variable bathymetry of the local area, as demonstrated by the
wave pattern picked up by recent Lidar. This modification of wave direction is shown in the plots included
in Figure 2.2.
Figure 2.2 Local modification of wave direction as a result of different configurations of the Knolls.
O p e n
31 October 2016 DEBEN ESTUARY 2016 WATBB5647R001D01 9
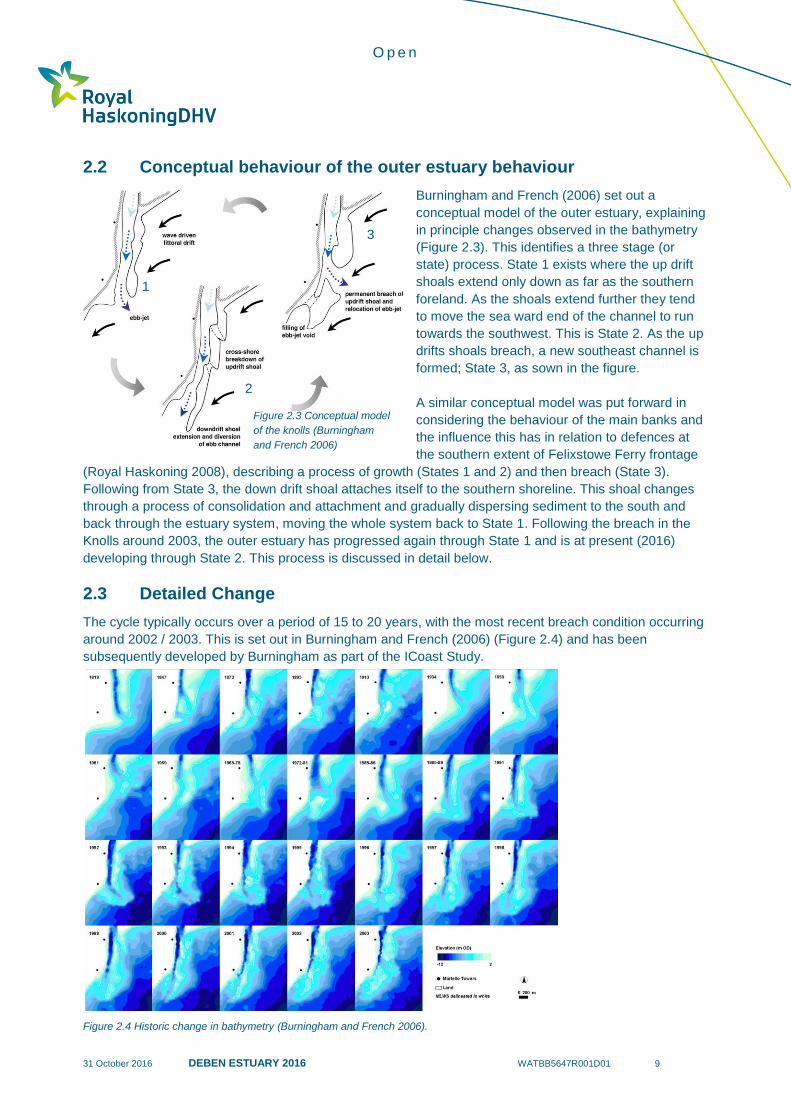
2.2 Conceptual behaviour of the outer estuary behaviour
Burningham and French (2006) set out a
conceptual model of the outer estuary, explaining
in principle changes observed in the bathymetry
(Figure 2.3). This identifies a three stage (or
state) process. State 1 exists where the up drift
shoals extend only down as far as the southern
foreland. As the shoals extend further they tend
to move the sea ward end of the channel to run
towards the southwest. This is State 2. As the up
drifts shoals breach, a new southeast channel is
formed; State 3, as sown in the figure.
A similar conceptual model was put forward in
considering the behaviour of the main banks and
the influence this has in relation to defences at
the southern extent of Felixstowe Ferry frontage
(Royal Haskoning 2008), describing a process of growth (States 1 and 2) and then breach (State 3).
Following from State 3, the down drift shoal attaches itself to the southern shoreline. This shoal changes
through a process of consolidation and attachment and gradually dispersing sediment to the south and
back through the estuary system, moving the whole system back to State 1. Following the breach in the
Knolls around 2003, the outer estuary has progressed again through State 1 and is at present (2016)
developing through State 2. This process is discussed in detail below.
2.3 Detailed Change
The cycle typically occurs over a period of 15 to 20 years, with the most recent breach condition occurring
around 2002 / 2003. This is set out in Burningham and French (2006) (Figure 2.4) and has been
subsequently developed by Burningham as part of the ICoast Study.
Figure 2.4 Historic change in bathymetry (Burningham and French 2006).
1
2
3
Figure 2.3 Conceptual model
of the knolls (Burningham
and French 2006)

O p e n
31 October 2016 DEBEN ESTUARY 2016 WATBB5647R001D01 10
There are longer time steps between earlier plots included in Figure 2.4. As such there may have been
changes not noted in the record. In general, however, there appears to have been an extension of the
Knolls system further south since the 1980’s. In particular, it was noted that during the early part of this
century (2003), the extension of the Knolls had reached further along the southern open coast than had
ever previously been reported.
It is suggested by this present study that this additional growth possibly started around 1950 but was then
“hit back” by the major event of 1953. During the period between 1953 and through to the late 1980’s the
plots show significant growth attached to the north south orientated Felixstowe Ferry shoreline. Since
then, and as suggested earlier in discussion around the historical development (Figure 1.2), the main
channel has persistently set more directly against the north-south western frontage (the Felixstowe Ferry
frontage). This has resulted in progressive hardening of the defence line, particularly and more recently
along the southern end of this north south orientated section of the coast (in front of the Golf Course).
As further evidence of this, information based on air photographs have been used to complement the
analysis of bathymetric presented above.
1953.
While an earlier sequence of severe storms during the 1930’s and 40’s may have influenced behaviour up
to 1953, the major event during that year (1953) gave rise to one of the highest water levels events
recorded within the North Sea. This was accompanied by severe wave action from the north east. It is
recorded that shingle beaches in many areas were overtopping spreading sediment fans inland. This
certainly occurred at Felixstowe Ferry, together with flooding of the Hamlet and areas of land behind. The
beach along the Bawdsey manor frontage was also reported to have been stripped. Figure 2.5a shows an
air photograph of the impact on the area and upon the Knolls. This image was taken within days of the
storm as part of the RAF Floodlight exercise.
It may be seen that all evidence of the upper
northern structure of the Knolls has been flattened
and, from the inset of the Bawdsey Manor, that the
sheet piled corner at the mouth of the estuary is
exposed. There is no distinct channel running south
but there is evidently a major deposition of sediment
along the southern section of the Felixstowe Ferry
frontage. There remains a relatively healthy beach
running further to the north on this western side of
the estuary.
It is suggested that the normally tidally dominated
regime was, during this event, overwhelmed by wave
action and wave processes. This is supported by the
bathymetric plot for 1961 (Figure 2.4), that the storm
consolidated a large volume of sediment within the
area of the outer estuary. It is further suggested that
it then took over a decade for this sediment to be
reworked into the more typical tidally dominated
form.
Figure 2.5 1953 following the Great Storm.
Deposition of sediment
to the southern end of
the Felixstowe Ferry
Frontage
N
O p e n
31 October 2016 DEBEN ESTUARY 2016 WATBB5647R001D01 11
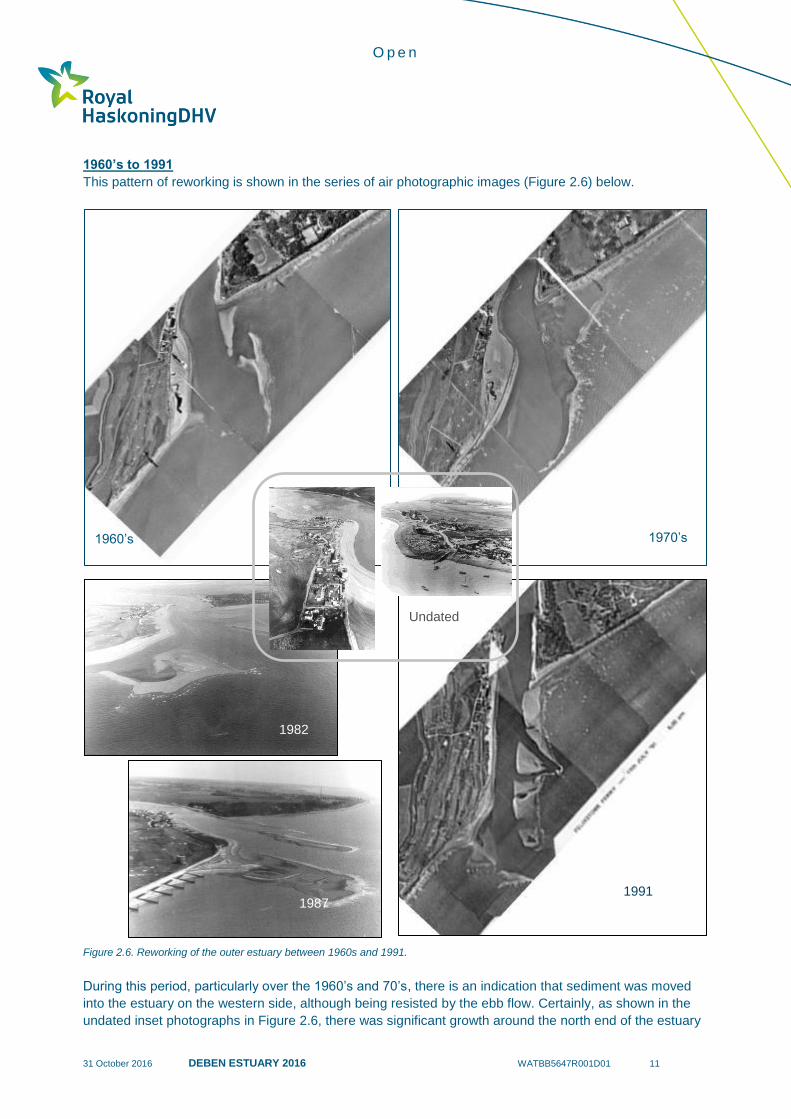
1960’s to 1991
This pattern of reworking is shown in the series of air photographic images (Figure 2.6) below.
Figure 2.6. Reworking of the outer estuary between 1960s and 1991.
During this period, particularly over the 1960’s and 70’s, there is an indication that sediment was moved
into the estuary on the western side, although being resisted by the ebb flow. Certainly, as shown in the
undated inset photographs in Figure 2.6, there was significant growth around the north end of the estuary
1960’s 1970’s
1982
1987 1991
Undated
O p e n
31 October 2016 DEBEN ESTUARY 2016 WATBB5647R001D01 12
mouth during this period. Indeed, it was not until the late 1980’s that additional protection works were
undertaken along the northern section of the Felixstowe Ferry frontage as a result of more persistent
erosion in this area.
Although rather indistinct, there is seen to be some
degree of a beach, particularly in the 1960’s image
(Figure 2.6), in front of the sheet piled wall south of
Bawdsey Quay. This is highlighted in the scanned
photograph, taken in 1988, following the
construction of the Tripod Terminal Groyne on the
western side of the mouth. This, again, highlights
the sensitivity of this frontage in relation to the main
shape of the outer (and inner) estuary channel.
In terms of the Bawdsey manor frontage, again
rather indistinctly shown on the images in Figure
2.6, there is some increase in the western end of
the beach between 1960’s and 1970’s. However, the groynes further to the north are exposed.
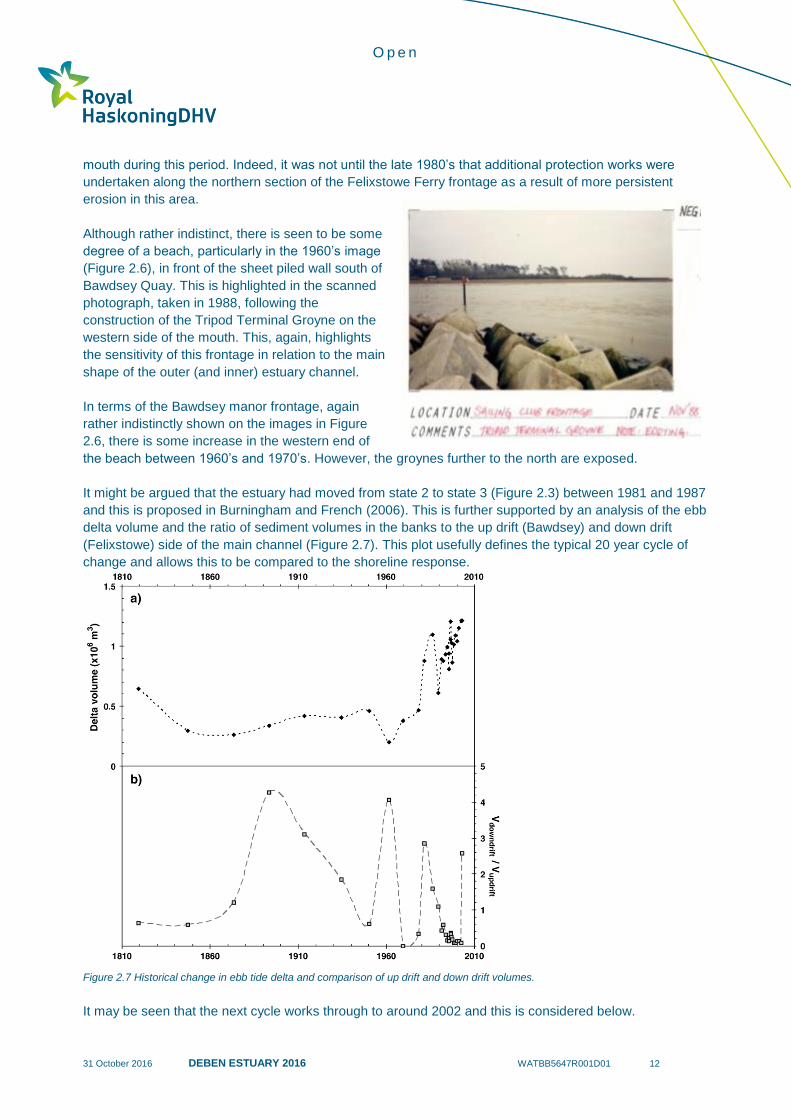
It might be argued that the estuary had moved from state 2 to state 3 (Figure 2.3) between 1981 and 1987
and this is proposed in Burningham and French (2006). This is further supported by an analysis of the ebb
delta volume and the ratio of sediment volumes in the banks to the up drift (Bawdsey) and down drift
(Felixstowe) side of the main channel (Figure 2.7). This plot usefully defines the typical 20 year cycle of
change and allows this to be compared to the shoreline response.
Figure 2.7 Historical change in ebb tide delta and comparison of up drift and down drift volumes.
It may be seen that the next cycle works through to around 2002 and this is considered below.

O p e n
31 October 2016 DEBEN ESTUARY 2016 WATBB5647R001D01 13
1992 to 2003
Around 1991 the EA monitoring programme started taken regular air photographs. These have been
examined and the waterline plotted (taken as a nominal mean low water). It is recognised that some
variation will be due to actual water levels at the time of the record on the following plots (Figure 2.8).
Plots are shown over short periods of time, progressively showing the change in base image. For
reference a control line has been included showing the extension of the line of the Bawdsey Quay
frontage, highlighting the degree to which the Knolls over the outer estuary extend west of this line. This
gives some indication of the pressure on the west shoreline and the degree of curvature of the channel.
Figure 2.8 Comparison of mlw 1992 to 2003
Initially in 1992 the northern section of the Knolls (the up-drift shoals) is relatively in line with the reference
line. The length of the banks stop short of the southern corner of the western shoreline (State 1, 1992). As
this develops, the banks extend further south, over lapping the southern foreland (1997 and 2003). As the
banks at the southerner push west, there is distinct erosion at the apex of the foreland (State 2).
As these southern banks squeeze against the shore (2001), the main channel reduces in width, with
further erosion of the shore and a more persistent channel starts to develop as shown in the figure (State
3). This channel develops further (2003) and the southern channel closes with the down drift shoal
attaching to the shore south of the Martello Tower. During the process there is some movement of
sediment north along the Felixstowe ferry frontage. It is difficult to determine the impact on the Bawdsey
Extension of Knolls 1992
Extension of Knolls 1997 Extension of Knolls 1997
Extension of
Knolls 2003
Erosion at the
Foreland

O p e n
31 October 2016 DEBEN ESTUARY 2016 WATBB5647R001D01 14
Quay area at this scale and, due to the limited extent of the air photographs, it is not possible to assess
the impact on the Horse Sands or the eastern edge of the inner estuary.
The area of pressure in front of Bawdsey Manor tends to remain in a consistent position, although there
appears to be slightly increased pressure moving from 1992 through to 1997, with a corresponding growth
of the Bawdsey spit area.
2003 to 2015
Further research has been undertaken by Helene Burningham considering new bathymetric data as Part
of the ICoast project. This is reproduced below in Figure 2.9 in a similar format that that previously
presented.
Figure 2.9. Comparison of bathymetry 2003 to 2013.(Burningham 2016)
In a similar manner this is complemented by an assessment of the Knolls from subsequent air
photographs (Figure 2.10) with a discussion in term of the impact on the shoreline.
Previously Discussed
State 3 State 1
State 2
State 3
State 3 State 1
State 2

O p e n
31 October 2016 DEBEN ESTUARY 2016 WATBB5647R001D01 15
Figure 2.10 Comparison of mlw 1992 to 2003
Rock
revetment
constructed
New
groynes
constructed
O p e n
31 October 2016 DEBEN ESTUARY 2016 WATBB5647R001D01 16
Over the period 2003 to 2005 the Knoll banks have very definitely separated into the up drift and down
drift shoals. There is a general setting back of the down drift shoal against the shoreline. As part of this
process, the groynes along the southern shoreline become increasingly exposed as the down drift shoal
acts as a nearshore breakwater pulling sediment in to its lee. This is clearly seen in the consistent
orientation of the beach within the groyne bays.
There is little change in the up drift beach in front of Bawdsey Manor. There does appear to be a westward
movement of the banks tending to narrow the main channel. Associated with this is slight increase in
erosion north of the rock revetment.
This westerly movement of the northern up drift shoals continues through 2006 to 2008. As predicted in
the conceptual model, flow pressure develops on the up drift shoal to the southern end of the western side
of the estuary. Contributing to the general wave driven process of attachment of the down drift shoals to
the southern shore, the flow from the estuary tends to straighten out the northern face of the new foreland.
There is clearly pressure on the rock revetment just to the north of the foreland and increasing pressure
for erosion to the north of the revetment.
The angle of the channel face of the northern up drift shoal might suggest that the flow direction is ebb
dominated. The alignment of the shoreline north of the rock revetment equally suggests that erosion may
be ebb driven. Unfortunately how this relates to a continuation of flow patterns within the inner estuary at
this time cannot be determined because of the limits of the air photography.
Comparison of the position of the Horse Sands, between 1992, 2006 and the subsequent position in 2011,
however, shows a significant shift of this inner estuary bank towards the east. There is a marked change
in shape of this bank occurring between 2006 and 2008.
This would suggest quite substantial changes in the flow patterns, which may also influence the pressure
on the eastern bank around the Bawdsey Quay.
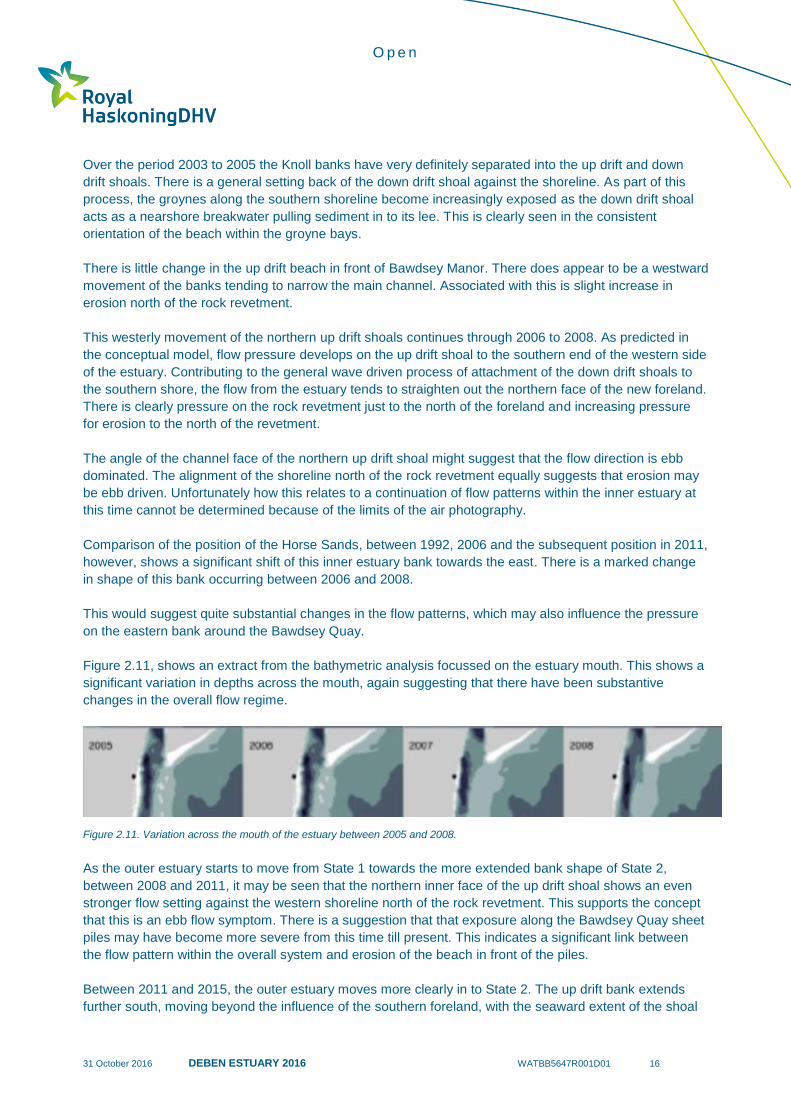
Figure 2.11, shows an extract from the bathymetric analysis focussed on the estuary mouth. This shows a
significant variation in depths across the mouth, again suggesting that there have been substantive
changes in the overall flow regime.
Figure 2.11. Variation across the mouth of the estuary between 2005 and 2008.
As the outer estuary starts to move from State 1 towards the more extended bank shape of State 2,
between 2008 and 2011, it may be seen that the northern inner face of the up drift shoal shows an even
stronger flow setting against the western shoreline north of the rock revetment. This supports the concept
that this is an ebb flow symptom. There is a suggestion that that exposure along the Bawdsey Quay sheet
piles may have become more severe from this time till present. This indicates a significant link between
the flow pattern within the overall system and erosion of the beach in front of the piles.
Between 2011 and 2015, the outer estuary moves more clearly in to State 2. The up drift bank extends
further south, moving beyond the influence of the southern foreland, with the seaward extent of the shoal

O p e n
31 October 2016 DEBEN ESTUARY 2016 WATBB5647R001D01 17
moving progressive towards the west. It would be anticipated that this will continue extending further along
the open coast as the system moves towards State 3.
Potentially more significantly, while the inner face of the up drift shoal has tended to squeeze further
towards the western shoreline, a swash channel has tended to develop at its northern end. This seems
consistent with the idea that there is a strong ebb flow along the Bawdsey Quay area, which attempts to
relieve the pressure by cutting through the bank more directly to the south.
While it may be concluded that estuary does adopt this typically 20 year cyclical behaviour, it may also be
seen that that major high energy events may temporarily disrupt the actual pattern of change and may
indeed trigger slightly different characteristics associated with any particular cycle. There is the strong
indication, based on the evidence, that there are longer term trends of change underlying the cyclic
behaviour. Critically, the most significant underlying change appears to be the general migration of the
whole outer estuary process system towards the west. At present this is being resisted by increasing need
for defence.
This westward pressure develops along different sections of the frontage over different stages of the
overall cycle. The way in which this is responded to, does seem, also, to have consequences on other
areas of the system, such as at the sheet piles on the Bawdsey side of the estuary mouth.
In the following section, a more detailed analysis of change occurring locally has been undertaken, looking
where possible to link this to the broader scales change described above.
O p e n
31 October 2016 DEBEN ESTUARY 2016 WATBB5647R001D01 18
3 Local Assessment
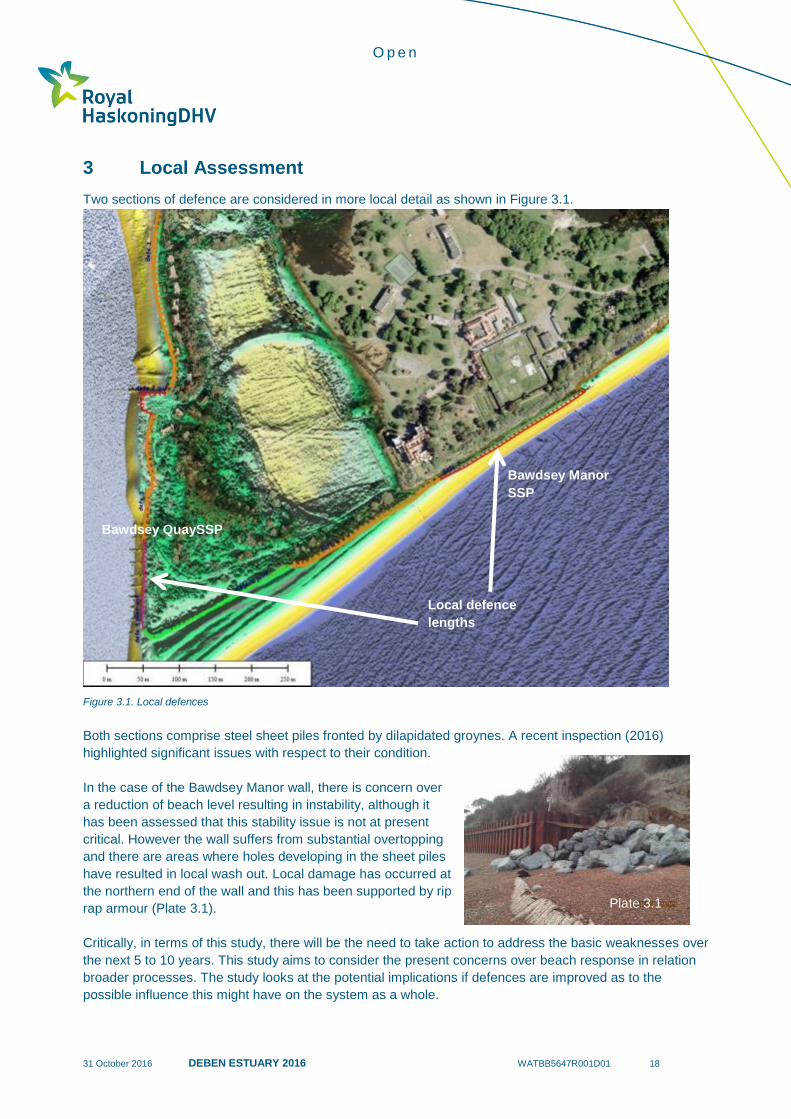
Two sections of defence are considered in more local detail as shown in Figure 3.1.
Figure 3.1. Local defences
Both sections comprise steel sheet piles fronted by dilapidated groynes. A recent inspection (2016)
highlighted significant issues with respect to their condition.
In the case of the Bawdsey Manor wall, there is concern over
a reduction of beach level resulting in instability, although it
has been assessed that this stability issue is not at present
critical. However the wall suffers from substantial overtopping
and there are areas where holes developing in the sheet piles
have resulted in local wash out. Local damage has occurred at
the northern end of the wall and this has been supported by rip
rap armour (Plate 3.1).
Critically, in terms of this study, there will be the need to take action to address the basic weaknesses over
the next 5 to 10 years. This study aims to consider the present concerns over beach response in relation
broader processes. The study looks at the potential implications if defences are improved as to the
possible influence this might have on the system as a whole.
Local defence
lengths
Bawdsey Manor
SSP
Bawdsey QuaySSP
Plate 3.1

O p e n
31 October 2016 DEBEN ESTUARY 2016 WATBB5647R001D01 19
In the case of the Bawdsey Quay wall, basic stability seems less of a risk overall although there has been
a period of significant erosion of the narrow area of beach. Of greater concern is the condition of the wall,
with, over a significant length almost total loss of the upper section of the pile.
3.1 Bawdsey Quay Wall
3.1.1 Condition
Over the northern section of the wall beach levels remain slightly higher and the wall appears to have
suffered less deterioration (Plate 3.2a). This section of wall is supported by tie (struts) connected to a
waling beam just below the crest of the piles. These piles do retain sediment behind and based on
previous reports has a toe depth of around -5m OD.
Further south, over the central section of the wall, there has been severe corrosion (Plate 3.2b) and,
where this has occurred, there has been significant loss of the shingle behind.
Plate 3.2. Bawdsey Quay Steel Sheet Pile Wall - a) Northern section, b) Central section
Further inspection of this central section of wall shows continuing loss of sediment behind as shown in
Plates 3.3 (photographs taken by the community monitoring team).
Plate 3.3. Bawdsey Quay Steel Sheet Pile Wall – recent inspection of the central section of wall (October 2016).
a b
O p e n
31 October 2016 DEBEN ESTUARY 2016 WATBB5647R001D01 20
This shows both loss of shingle through the main holes that have developed in the wall but also local sink
holes developing in other areas. The photographs clearly show the poor condition of both the crest waling
and the thinning of the ties. It cannot ruled out, from the more recent monitoring, that there is not further
holes below beach level or indeed, given the variation in construction around the whole area that over this
particular section of the wall the actual piles were not driven to a more shallow depth.
Subject to continued monitoring of the development of sink holes and further evidence of loss of sediment
behind, below the point of the obvious damaged sections of piling, it is possible that sediment is being loss
at the toe of this central section of wall. Clearly further substantial erosion of this beach could threaten the
wall.
This may require local action but in terms of this study the aim has also been to consider how pressure
might develop and has changed across this frontage and how this might relate to the way in which the
estuary may develop. This relates to the threat of flooding to the rear of the wall but also how, if this
defence is continued to be managed how this might influence or be influenced by management in other
areas.
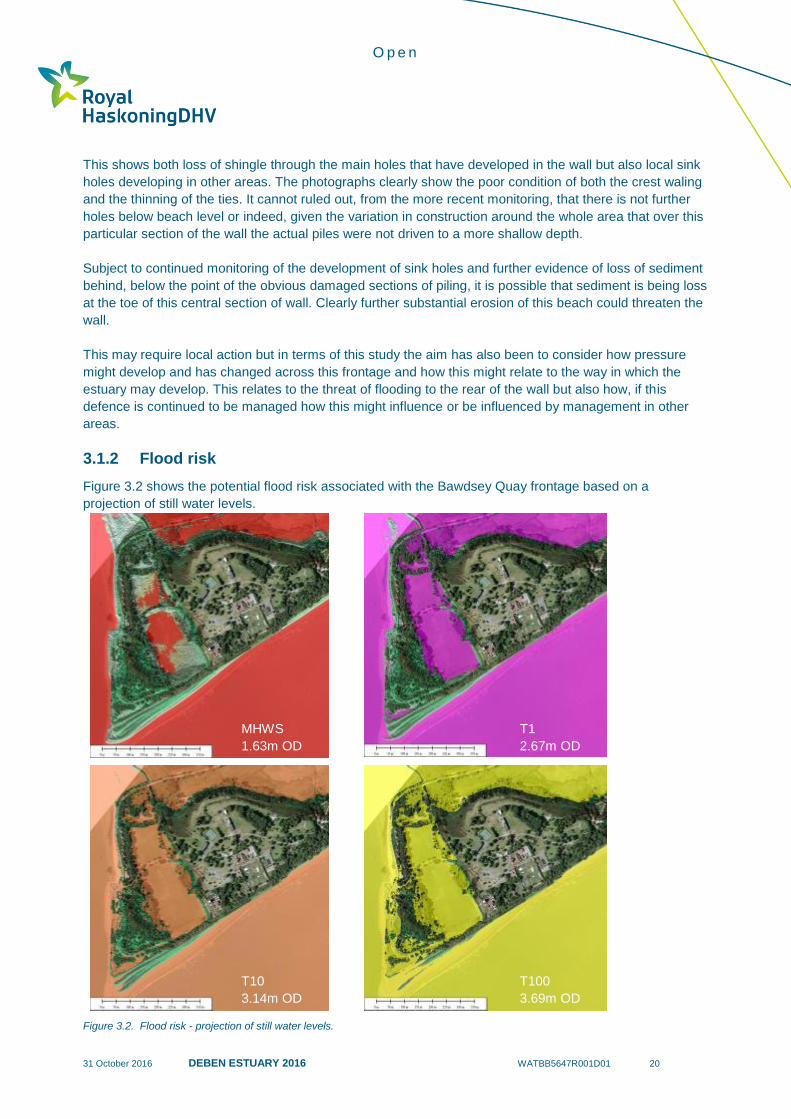
3.1.2 Flood risk
Figure 3.2 shows the potential flood risk associated with the Bawdsey Quay frontage based on a
projection of still water levels.
Figure 3.2. Flood risk - projection of still water levels.
MHWS
1.63m OD
T1
2.67m OD
T10
3.14m OD
T100
3.69m OD
O p e n
31 October 2016 DEBEN ESTUARY 2016 WATBB5647R001D01 21
It may be seen from the plots that under normal tidal conditions, while the low lying area to the rear of
Bawdsey Quay is below MHWS, there is a substantial width of higher ground immediately to the rear of
the defence. It is only as the 1:10 year level (T10) is reached that potential flood routes start to emerge
through this basic topography. Even then it is principally the Quay itself and the main entrance to the
Manor that possibly opens a path through to the wider area.
Under a T100 year event, more extensive flood routes develop, with the area of Bawdsey Quay and the
defences down to the Point potentially feeding through to possible flooding to the wider area to the north
and to the north of the Manor headland.
Given the state of the crest of the sheet pile wall, this section of defence is not considered to contribute to
the reduction of flood risk to the wider area.
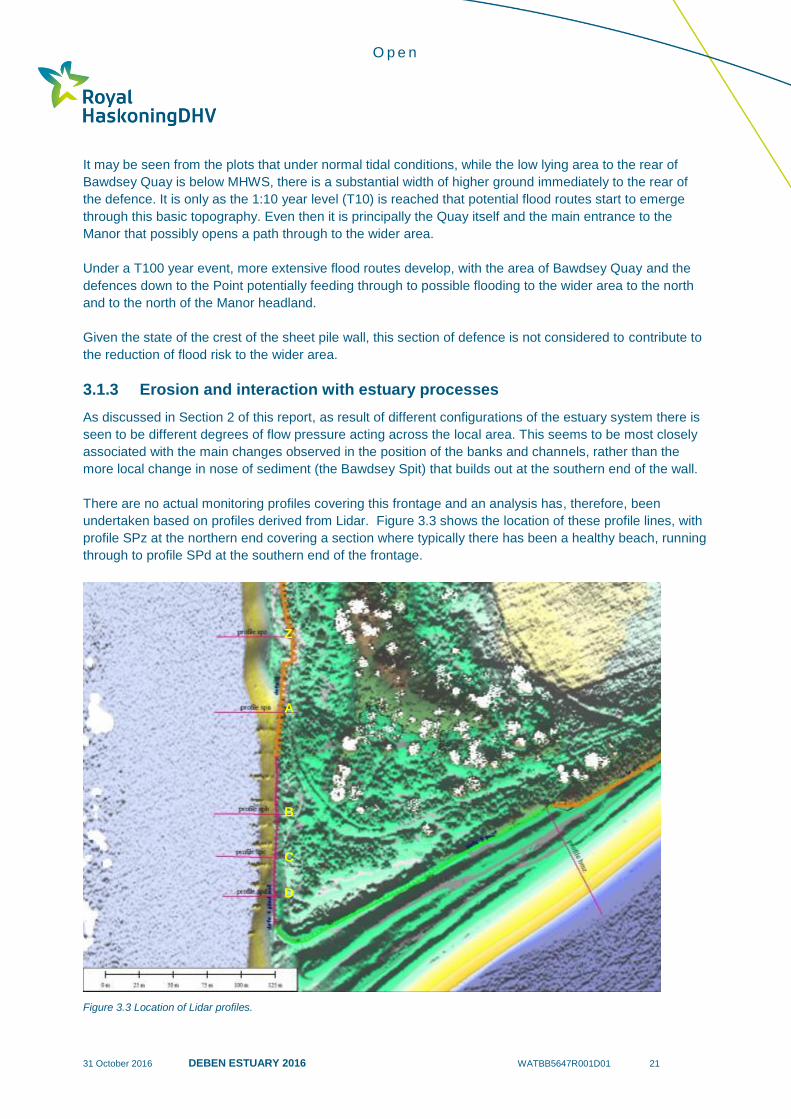
3.1.3 Erosion and interaction with estuary processes
As discussed in Section 2 of this report, as result of different configurations of the estuary system there is
seen to be different degrees of flow pressure acting across the local area. This seems to be most closely
associated with the main changes observed in the position of the banks and channels, rather than the
more local change in nose of sediment (the Bawdsey Spit) that builds out at the southern end of the wall.
There are no actual monitoring profiles covering this frontage and an analysis has, therefore, been
undertaken based on profiles derived from Lidar. Figure 3.3 shows the location of these profile lines, with
profile SPz at the northern end covering a section where typically there has been a healthy beach, running
through to profile SPd at the southern end of the frontage.
Figure 3.3 Location of Lidar profiles.
Z
A
B
C
D

O p e n
31 October 2016 DEBEN ESTUARY 2016 WATBB5647R001D01 22
The analysis for all profiles is shown in Figure 3.4. The profile taken in 2013 has been brought to the front
in the plots as a reference line shown boldly in red.
At the northern end of the site the profile (z) shows virtually no change, with a typical crest width of around
15m. Moving further south to profile PDa the profiles tend to lie within two groups, through to around 2012
and then a lower set of lines through to 2015. The profile line is taken at a point where there is clearly a
different process occurring suggesting a transition between high and low flow pressure. A simple analysis
of the approximate high water taken from the air photos shows a similar pattern with the transition point
remaining relatively stable through to 2006. This interface then moves north through to 2015. This seems
to match well the observed change in the banks of the outer estuary with the suggested change in flow
pattern highlighted earlier.
Subsequent profiles (SP b, c and d) all show largely similar results. It should be noted however that on
profile SP d, there has been significant recovery over 2015, presumably as the northern swash channel
has tended to open.
It may be concluded that this frontage is strongly linked to the way in which the outer estuary responds
and that this seems to be linked to the direction of flow. In the past, there is the indication that, as the
Figure 3.4. Analysis of profiles 1999 to 2015.
z a
b c
d
O p e n
31 October 2016 DEBEN ESTUARY 2016 WATBB5647R001D01 23
Knolls extends further to the south and as the channel tends to straighten, pressure on this frontage may
reduce. However, the development of the Knolls over this present cycle seems to have resulted in a more
distinct westward shift of the outer banks and this appears to have introduced more pressure on the sheet
piles. Clearly there is continued uncertainty associated with this interpretation and this might be better
clarified if the flow within the mouth was investigated further.
In terms of management, and subject to the above caveat, the pressure on the frontage tends to be a
glancing force of flow, rather than a direct pressure to set back. It might, from this, suggest that erosion
would not be particularly great if the defence were no longer maintained or indeed if the corroded section
of upper pile was removed. It is however, considered important to maintain the southern point of this
defence, without which the probable eastward flow could end up out flanking the up-drift Knolls system.
3.2 Bawdsey Manor
The earlier assessment of the estuary shows little indication of major interaction between the broader
scale variation and behaviour of estuary and the manner in which the critical section along the Bawdsey
Manor frontage behaves. Obviously, the consistency with which this section has lost beach material does
have links to the Knolls and this is discussed later. Equally, major events such as 1953 have impacts both
on the frontage and the estuary and locally there is the basic interaction in terms of longshore sediment
drift.
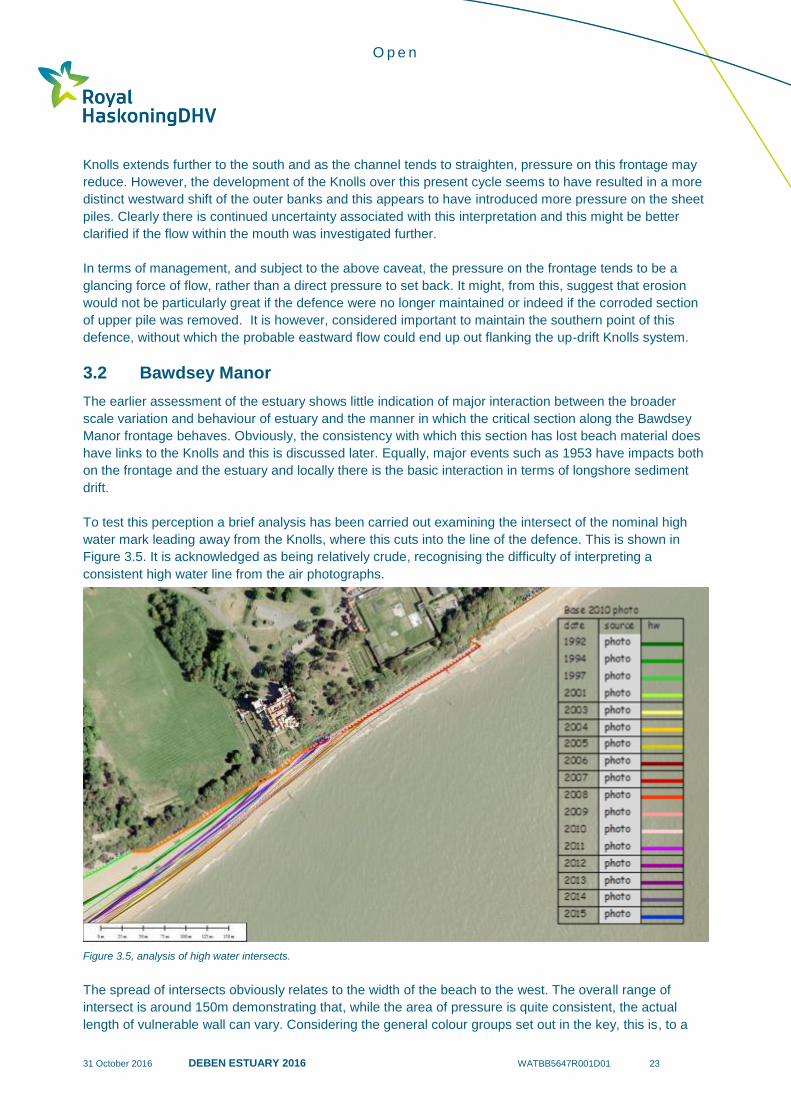
To test this perception a brief analysis has been carried out examining the intersect of the nominal high
water mark leading away from the Knolls, where this cuts into the line of the defence. This is shown in
Figure 3.5. It is acknowledged as being relatively crude, recognising the difficulty of interpreting a
consistent high water line from the air photographs.
Figure 3.5, analysis of high water intersects.
The spread of intersects obviously relates to the width of the beach to the west. The overall range of
intersect is around 150m demonstrating that, while the area of pressure is quite consistent, the actual
length of vulnerable wall can vary. Considering the general colour groups set out in the key, this is, to a
O p e n
31 October 2016 DEBEN ESTUARY 2016 WATBB5647R001D01 24
degree, reflected as bands where the intersect occurs. It might be concluded over the years 1992 to
around 2003 (green) the intersect was furthest west. The beach to the west built and extended protection
further east over the period between 2003 and 2011 (red and brown lines). Since 2011, the beach
intersect has tended to move west through to the present day (purple and blue lines).
Interestingly this coincides with the assessment of the change in State of the outer estuary. 2003
coincides with the development of a breach and, therefore, prior to this the Knolls tended to extend
furthest offshore. Following 2003, the knolls tended to shorten into State 1, reverting to State 2 (full
extension) from 2011. While this may simply be linked to the associated changes at the root of the Knolls,
there is the possibility that as the Knolls extend they increase the degree, or length of shoreline of
sheltered from waves from a more southerly direction.
This then means that that section of shoreline is subject solely to waves from a more east to north
direction. This then creates, in effect, a differential sediment divide where sediment is moved almost
exclusively to the west, west of this point of shelter, while sediment may be moved both east and west
further to the east. What sediment that does enter the critical area will tend to continue to the west,
irrespective that sediment further to the east may be moved out to the east. Certainly, whether this
mechanism is driven directly due to the states of the outer estuary as might be concluded from the above,
or to some other mechanism, this mechanism based on the shelter provided by the Knolls in general does
provide a sensible rational as to why this section of the Bawdsey Frontage has been so consistently under
pressure.
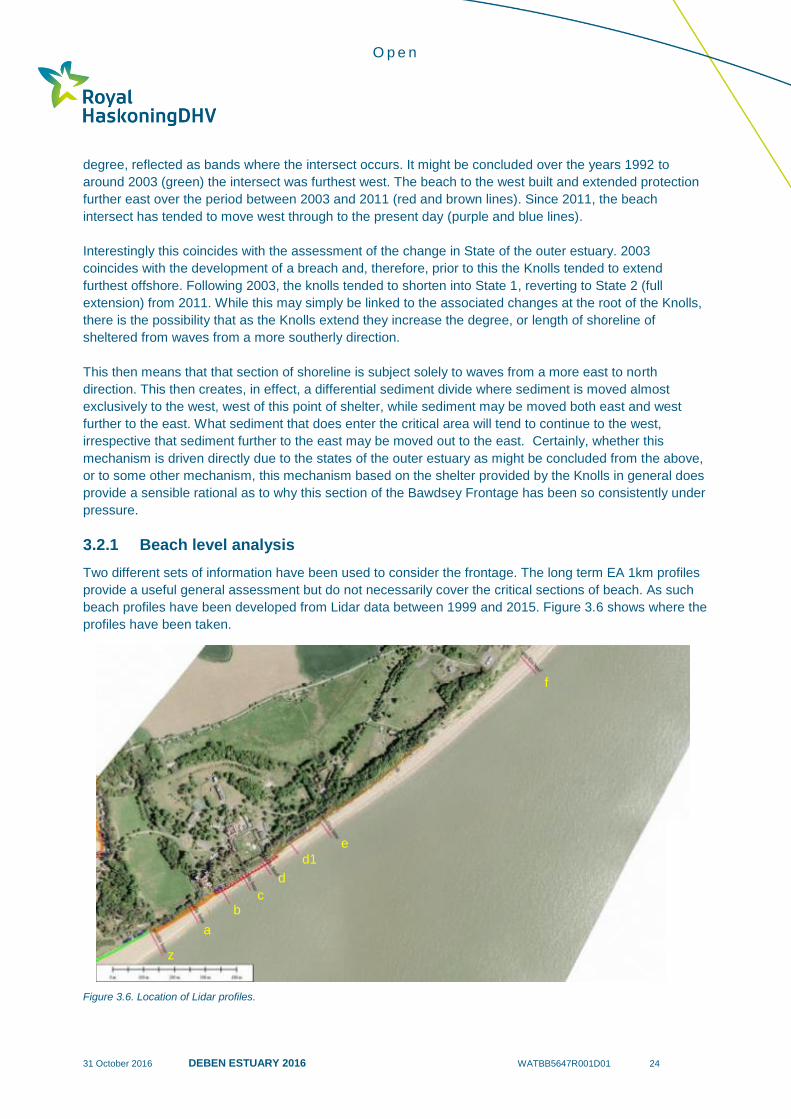
3.2.1 Beach level analysis
Two different sets of information have been used to consider the frontage. The long term EA 1km profiles
provide a useful general assessment but do not necessarily cover the critical sections of beach. As such
beach profiles have been developed from Lidar data between 1999 and 2015. Figure 3.6 shows where the
profiles have been taken.
Figure 3.6. Location of Lidar profiles.
z
a
b c
d
d1
e
f

O p e n
31 October 2016 DEBEN ESTUARY 2016 WATBB5647R001D01 25
Profile BM z is situated well to the west of the defence. Profiles BM a, b, c, d and d1 span the defence
length, with profile BM e being around 175m northeast of the wall and one further profile BM f being
located on the open coast 1 km from the area. The results are show in Figure 3.7. The profile taken from
2013 has been brought forward in the plot as a reference line shone in red.
Figure 3.7. Variation in beach levels. Profiles framed in red are directly in front of the critical section of defence.
z a
b c
d d1
e f
O p e n
31 October 2016 DEBEN ESTUARY 2016 WATBB5647R001D01 26
All survey results for profile BMz (west of the defence) are above the baseline survey (1999). Typically
beach levels for 2003 and 2008 are most advanced, levels decrease to 2013 (shown in red) and increase
slightly through 2014 and 2015. Profile BMa, just north of the defence shows a similar pattern to that of
BMz.
In front of the defence, profiles show a relatively similar response, although at a lower general level. The
recovery of beach levels in 2014 and 2015 is more marked over profile BMb (the furthest to the west) but
on profile BMd the recovery seen in 2014 has been lost in 2015.
Typically over the central and eastern end of the defence the variation is in the order of 0.5m to 1m at the
toe of the defence over the clay platform.
Immediately to the northeast of the defence (profile BMd1) the natural beach shows possibly less
variation. Beach loss occurred in 2012 but recovered in 2013. Since then there has been some loss
through 2014 and 2015. Profile BMe shows again some beach loss in 2014 and 2015 but with less loss in
2012.
Further north (BMf), Lidar coverage only allowed comparison of 1999, 2003, 2008, 2012 and 2013. There
has been a consistent loss from the beach face indicating beach steepening.
Overall there seems to have been continuing loss over 2014 and 2015 over the northern section of the
frontage with slight corresponding gains along the more western profiles. While this is not in itself
evidence of southerly drift, it does support the basic concept. The Lidar from 2013 would have been prior
to the major extreme water events of November and December in 2013. It is notable, therefore, that
generally the 2014 profile, particularly over the western section of the defence do not show greater loss.
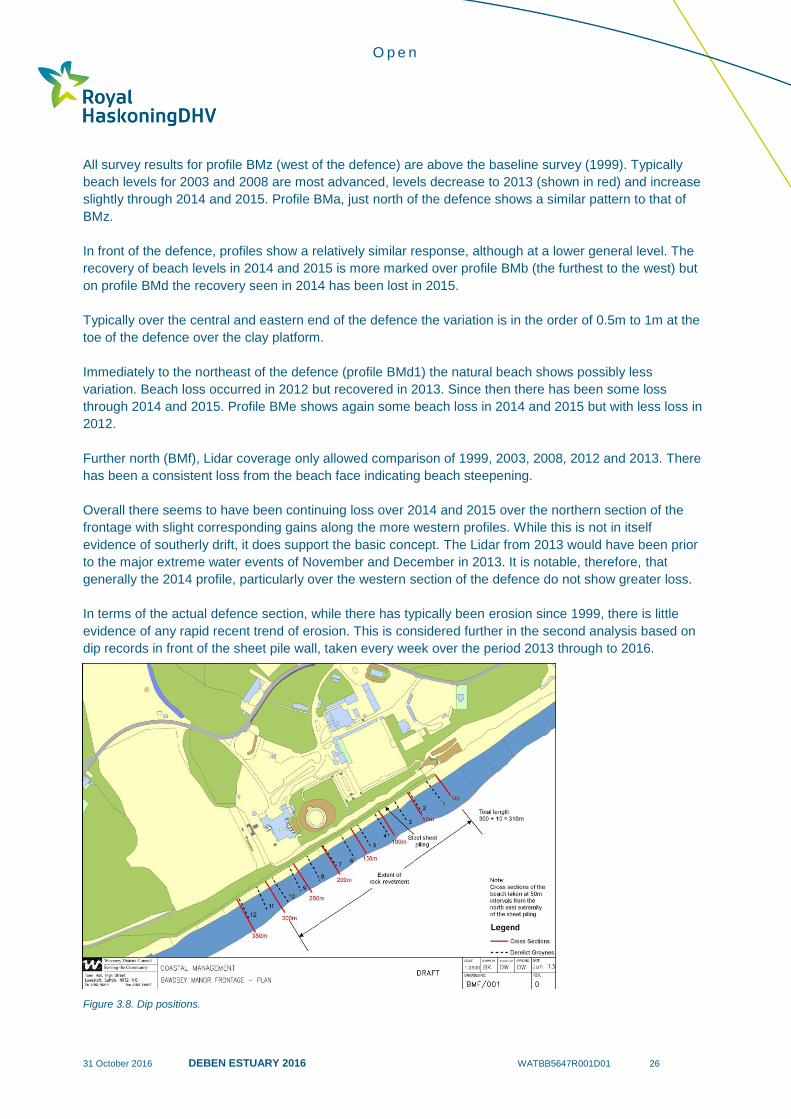
In terms of the actual defence section, while there has typically been erosion since 1999, there is little
evidence of any rapid recent trend of erosion. This is considered further in the second analysis based on
dip records in front of the sheet pile wall, taken every week over the period 2013 through to 2016.
Figure 3.8. Dip positions.

O p e n
31 October 2016 DEBEN ESTUARY 2016 WATBB5647R001D01 27
Dip records are made at 50m centres with ch0 at the north-eastern end, as shown in Figure 3.8.
The results of the dips are presented in Figure 3.9, showing a rolling (3 point) average for each dip
location over the full survey period.
Figure 3.9. weekly dip records of pile exposure averaged over 3 record points.
From chainage 0 to chainage 150, there has been a relatively consistent trend of beach loss, while at
chainages 200 to 300 show little net change over the period. This has to be placed in the longer term
perspective discussed above.
The data sets show more distinctly individual response to storms, such in October and December 2013.
However, what is also seen is some variation in response at different profiles. While this has not been
analysed in detail, immediately during the event in October 2013 and in the weeks following there appears
to have been loss at chainage 300 but that associated with this there was growth at the toe of the wall
further to the east.
Subsequent loss from the more easterly positions may have given rise to progressive increase in levels
further to the west. If normalised the counter responses between positions might tend to be more obvious
but it is notable that loss from chainage 0 tends to be linked to increases in positions further to the west.
The general conclusion is that sediment moves quite readily across the area and that drift is not
necessarily constrained by the defence or by the residual effect of the old groynes.
Overall for this frontage, and with the exception of the beach to the west, it has to be assumed that there
is, as reported in the EA monitoring overview, a general slow pressure for beach steepening and retreat.

O p e n
31 October 2016 DEBEN ESTUARY 2016 WATBB5647R001D01 28
While there may be periods of recovery, the long term trend is for beach loss. This may become critical for
the wall over the next decade, possibly sooner.
Holding the line of the defence in the longer term will result in differential erosion between this frontage
and that to the northeast. There is scope, however, in manging the northern corner in such a manner as to
allow sediment infill to compensate for this and still allow drift across the frontage to the west.
Overall the changes seen in profiles suggest that net drift along the whole length of the Bawdsey cliffs is to
the southwest, however, this is possibly a lot less than some modelling had suggested in the past.
Furthermore, it is quite probable that under different wave conditions gross transport is both to the
northwest and southeast.
In general and in relation to this, there seems little direct local interaction in response to changes in the
wider area of the outer estuary. However, there could be an indirect influence of the Knolls in terms of
modification of wave exposure tending to drive the particular area of pressure along the critical defence
section and increasing the net westward drift into the lee of the Knolls.
Should the defence along the Bawdsey Manor frontage not be maintained it is quite probable that there
would be a period of rapid catch up in terms of erosion, over and above the longer term erosion
associated with the frontage as a whole. This would obviously have serious local consequences for
Bawdsey Manor but may also influence the manner in which sediment is provide to the estuary system as
well as opening up the low lying land below Bawdsey Manor to regular flooding.
While there would need to be further detailed study considering the potential impact of continued defence
of the length, in principle and as long as any approach recognises the need to sustain sediment drift along
the area, there appears to be no significant risk that defences would strongly influence the continued
development of the wider estuary.
O p e n
31 October 2016 DEBEN ESTUARY 2016 WATBB5647R001D01 29
4 Conclusions, Implications for Management and
Recommendations
4.1 Conclusions and Implications for Management
Current and Future Management
Typically management in the past has tended to be quite responsive in particular on the western frontage
running south from Felixstowe Ferry. Works were undertaken during the 1950 following the major storm,
again in the 1980’s as the area around the ferry eroded and again around the turn of the century. It is
understood that the Deben Estuary Partnership have been working to develop plans in relation to the flood
risks within the estuary. This report concludes that there are significant issues developing as the outer
estuary evolves. Issue such as those with respect to the Bawdsey Quay wall are shown to potentially have
broader impacts elsewhere. It is therefore conclude that the work undertaken by the Partnership now
needs to focus on the management of the mouth and outer estuary so as to develop a consistent
approach within which local issues can be assessed.
Similarly, at present the approach to management of the Bawdsey frontage, as set out in the Bawdsey
Manor Implementation report, need to be reviewed and established as a clear agreement going forward. It
is in the context that the following conclusions (and subsequent recommendations) are highlighted.
The Estuary
In terms of development of the wider estuary area, the study, building to a large degree on the work done
by the CERU UCL, supports the basic findings that the outer estuary undergoes a cyclic progression on a
time scale of some 20 years. Although this present study would suggest that the major storm event of
1953 introduced a perturbation within the cycle and potentially has introduced certain different changes to
the system, it is concluded that the cyclic behaviour of the estuary is continuing through to the present and
most probably in to the future. This conclusion is fundamental to the approach to future management.
Essential to this, as set out in the SMP2, is continued management of the mouth of the estuary as a whole
(both east and west banks). This control area supports the use and values of the area, while maintaining a
level of fixity within which the general natural function of the estuary regime is maintained.
Notwithstanding all the above, and while accepting this cyclic behaviour, the study also concludes that
there are other underlying longer term changes that are likely to have significant influence on the way in
which the area might be managed.
The study has identified a significant interaction between the way the outer estuary behaviour may
influence the pattern of flow across the mouth of the estuary and within the inner estuary. Inevitably, there
is likely to be significant feedback between these three zones. Changes that have occurred within the
outer estuary influences the direction of flow through the mouth, which in turn seems to impact on the
distribution of flow within the wider inner estuary and on the position of the Horse Sands, which in turn is
likely to influence the direction of flow through the mouth, influencing the specific behaviour of the outer
estuary. These changes appear to influence and put pressure on different sections of defences within the
mouth and, in particular, may have resulted in the increased pressure on the section of steel sheet piles to
the south of the Bawdsey Quay. It is concluded that this aspect of whole estuary behaviour needs further
investigation.
It should also be noted that the direction of flow within the outer estuary appears to have very direct
impact on the pressures that develop along the Felixstowe Ferry frontage.
O p e n
31 October 2016 DEBEN ESTUARY 2016 WATBB5647R001D01 30
Coupled to this is what appears to be a general movement of the main Knolls banks in a westerly
direction. While this varies as the estuary works through the different states of the nominal 20 year cycle,
in more recent years this tendency to increasingly squeeze the channel against the western shoreline
further increases the risk to the whole area and imposes different factors to be considered in terms of
management.
This westerly movement is reflected in the progressive need over the last 40 years to increasingly harden
the defence line, most particularly in management of the southern section of the Felixstowe Ferry frontage
resulting in the construction of the long rock revetment. If this westerly pressure continues, it may become
more difficult to maintain this linear defence in its current form as the channel may tend to deepen during
periods when the main channel is forced closer to the western frontage.
As highlighted, this seems to be coupled to the way in which flows are directed through the mouth of the
estuary and, as such, longer term management of the deteriorating piled wall south of the Bawdsey Quay
need to consider potential influence on the wider area.
Bawdsey Quay Wall
More immediately, it seems unlikely that erosion of the narrow beach in front of the Bawdsey Quay wall
will affect the stability of the wall given that, due to loss of upper piling, the wall seems to retain little
material behind.
While in the longer term, the solution to this problem will need to be considered in relation to the wider
management of the area, consideration might be given to cutting off the deteriorated section of piles. This
would certainly not increase the flood risk to the hinterland as the wall does not at present provide a
competent flood defence.
However, in line with the recommendation presented in the Bawdsey Manor Implementation Report (Royal
Haskoning 2003) it is considered necessary to maintain the general position of the defence at the head of
the Bawdsey Peninsular. While there may be some modification required in the alignment of this this point,
loss of the control of the point could, given the pressure on the frontage to the north and given the general
trend for movement to the west of the Knolls banks, result in significant change to the main channel
position. While in the broader picture, over a longer time scale, such a change might need to be
considered, this could result in a major step change in the way in which the whole area might then need to
be managed. This is discussed further in relation to the review of the conclusions of the Bawdsey Manor
Implementation Report (2003) in the subsequent section below.
Bawdsey Manor
The study concludes that while the defences along the Bawdsey Manor frontage is far less directly
connected to the behaviour of the wider estuary, continued management of this section of wall, over and
above the direct impact that failure would have on the Manor, does provide benefits in terms of
management of the overall integrity for the Bawdsey Peninsular.
In addressing this problem and accepting the need for more detailed consideration of potential impacts on
longshore drift, it is considered that the general approach to defence, as set out in the Implementation
Report is still appropriate. The report suggested that a rock revetment would minimise potential impacts,
recognising that some more adaptive approach might be required at the north-eastern end to allow a
suitable transition between the hard defence and the naturally eroding cliff line beyond.
The study has highlighted the potential sensitivities in terms of management of the Bawdsey Quay wall
with respect to the broader area while effectively concluding that the management of the Bawdsey Manor
O p e n
31 October 2016 DEBEN ESTUARY 2016 WATBB5647R001D01 31
wall is more one of a local issue at this time but has longer term implications as set out in the Bawdsey
Manor Implementation Report 2003. Overall the study confirms in principle the general approach set out in
the Implementation Report as fulfilling the intent set by the SMP2. This is also discussed further in relation
to the review of the conclusions of the 2003 report in the section below.
4.2 Review of Previous Management Conclusions (2003)
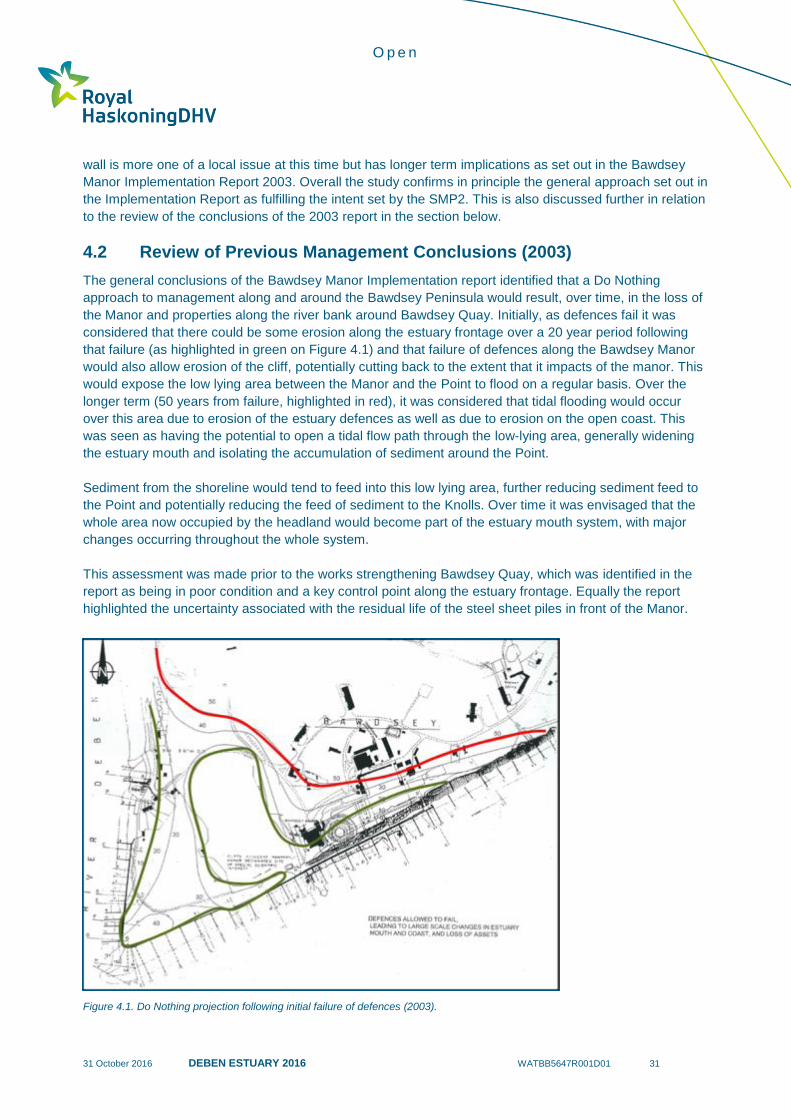
The general conclusions of the Bawdsey Manor Implementation report identified that a Do Nothing
approach to management along and around the Bawdsey Peninsula would result, over time, in the loss of
the Manor and properties along the river bank around Bawdsey Quay. Initially, as defences fail it was
considered that there could be some erosion along the estuary frontage over a 20 year period following
that failure (as highlighted in green on Figure 4.1) and that failure of defences along the Bawdsey Manor
would also allow erosion of the cliff, potentially cutting back to the extent that it impacts of the manor. This
would expose the low lying area between the Manor and the Point to flood on a regular basis. Over the
longer term (50 years from failure, highlighted in red), it was considered that tidal flooding would occur
over this area due to erosion of the estuary defences as well as due to erosion on the open coast. This
was seen as having the potential to open a tidal flow path through the low-lying area, generally widening
the estuary mouth and isolating the accumulation of sediment around the Point.
Sediment from the shoreline would tend to feed into this low lying area, further reducing sediment feed to
the Point and potentially reducing the feed of sediment to the Knolls. Over time it was envisaged that the
whole area now occupied by the headland would become part of the estuary mouth system, with major
changes occurring throughout the whole system.
This assessment was made prior to the works strengthening Bawdsey Quay, which was identified in the
report as being in poor condition and a key control point along the estuary frontage. Equally the report
highlighted the uncertainty associated with the residual life of the steel sheet piles in front of the Manor.
Figure 4.1. Do Nothing projection following initial failure of defences (2003).

O p e n
31 October 2016 DEBEN ESTUARY 2016 WATBB5647R001D01 32
4.2.1 Review of Do Nothing and Defence Integrity.
In review, in general, the concerns and issues raised by the report and the typical response of the estuary
and frontages still seem valid. It should, however, be noted that the Quay has been significantly improved
and the timescale of associated with failure of this feature and other defences are possibly extended.
Figure 4.2 shows the defence sections referred to in the previous report. These are used as a reference in
the following discussion. The original assessment of pile depth and residual life is included in the Figure.
Figure 4.2. Definition of defence sections, with assessed details (2003)
In more detail, the present study adds to this.
It has been concluded that sediment passes through the critical section of defence in front of the Manor.
Maintaining this drift continues to be an important part of maintaining the defences to the west. While it is
recognised that the net drift to the south, generally, may be more intermittent than previously thought, the
main influence on the health of the beach to the west of the Manor sheet pile wall seems to be more
connected to the State of the outer estuary, rather than a steady continuous supply from the north.
A recent inspection of the frontage, to the west of the Manor, highlighted a section of piles (referred to as
Section 4 in the previous report) where, where visible, the top of the piles are severely degraded. This
tends to be further towards the Point. Closer to the Manor, and directly across the low lying land, the
visible section of the piles show some damage but remain well buried. This confirms the previous
O p e n
31 October 2016 DEBEN ESTUARY 2016 WATBB5647R001D01 33
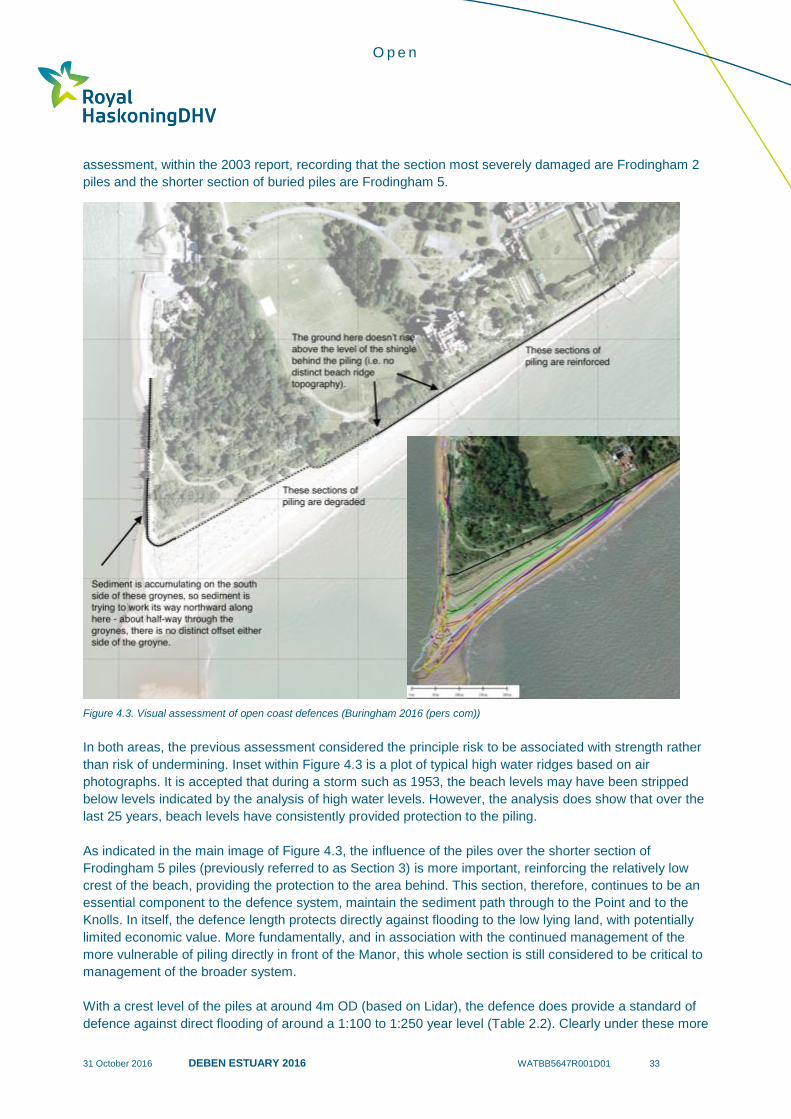
assessment, within the 2003 report, recording that the section most severely damaged are Frodingham 2
piles and the shorter section of buried piles are Frodingham 5.
Figure 4.3. Visual assessment of open coast defences (Buringham 2016 (pers com))
In both areas, the previous assessment considered the principle risk to be associated with strength rather
than risk of undermining. Inset within Figure 4.3 is a plot of typical high water ridges based on air
photographs. It is accepted that during a storm such as 1953, the beach levels may have been stripped
below levels indicated by the analysis of high water levels. However, the analysis does show that over the
last 25 years, beach levels have consistently provided protection to the piling.
As indicated in the main image of Figure 4.3, the influence of the piles over the shorter section of
Frodingham 5 piles (previously referred to as Section 3) is more important, reinforcing the relatively low
crest of the beach, providing the protection to the area behind. This section, therefore, continues to be an
essential component to the defence system, maintain the sediment path through to the Point and to the
Knolls. In itself, the defence length protects directly against flooding to the low lying land, with potentially
limited economic value. More fundamentally, and in association with the continued management of the
more vulnerable of piling directly in front of the Manor, this whole section is still considered to be critical to
management of the broader system.
With a crest level of the piles at around 4m OD (based on Lidar), the defence does provide a standard of
defence against direct flooding of around a 1:100 to 1:250 year level (Table 2.2). Clearly under these more
O p e n
31 October 2016 DEBEN ESTUARY 2016 WATBB5647R001D01 34
extreme conditions there is the potential for wave over topping. It is evident that wave overtopping does
occur both along this section and further to the west. However, while at present shingle overwash occurs,
there is no evidence that this would lead to a full breach.
It was suggested in the 2003 report that both Section 3 and the more westerly Section 4 might typically
have a life of 12 years. Clearly this has been exceeded and the strength of the piles have not really been
put to the test. Given that in this area beach levels seem to be maintained, potentially the threat of failure
comes either from the risk of Section 3 being outflanked by failure of the piles in front of the Manor or over
the longer term with sea level rise.
With respect to the former issue, while there is the need to address short term issues, such as the
damage to the northern end of the Bawdsey Manor Sheet Pile wall and local damage to the pile, quite
probably further works would not become critical for some 5 years. Even then a staged approach might be
taken to addressing the problem, as suggested in the 2003 report, a rock toe, building on this with a more
substantial rock revetment in 10 to 15 years time. As such the risk to the integrity of Sections 3 and 4 are
moved through towards this typical time scale.
With sea level rise it is anticipated that there might be some increased exposure of the piles to the eastern
end of Section 3. Effectively the wedge of sediment shown historically linking through to the root of the
Knolls might tend to start further to the west along the defence sections. In addition, there would be
increased wave over topping associated with higher water levels. Typically this might become critical with
around 0.3m sea level rise (potential in 20 to 50 years time depending on the rate of sea level rise), at
which point the standard of defence against direct flooding would be in the order 1:20 to 1:50.
The Point, itself, is still seen to be in fair condition and, without any deterioration of beach levels (the
concern was for undermining in the 2003 report) it is reasonable to extend the residual life of this structure
to 15 to 20 years, subject to changes in estuary behaviour as described in earlier sections of this report.
With the above discussion, coupled to the earlier conclusions drawn with respect to the Bawdsey Quay
Wall, it is possible to review the also the recommendations previously made in 2003.
4.2.2 Review of Previous Recommendation 2003
The 2003 report recognised the uncertainty associated with change in the estuary and with respect to the
residual life of individual sections of defence. Based on this, the approach recommended along the open
coast was basically to hold the line placing rock as a revetment to the Manor frontage, while ensuring the
protection and continued supply of sediment down to the Point.
This still seems appropriate, with the possible need to extend rock armour slightly beyond the exposed
section of piling to prevent breach. While existing plans are being developed by the owners of the Manor,
which would need to demonstrate that a continued supply of sediment would be maintained, the rest of the
frontage should continue to be monitored to determine to what degree further support or possible
extension of these plans might usefully be undertaken at the same time to address the longer term
requirements of the frontage further to the west to meet more strategic needs for management.
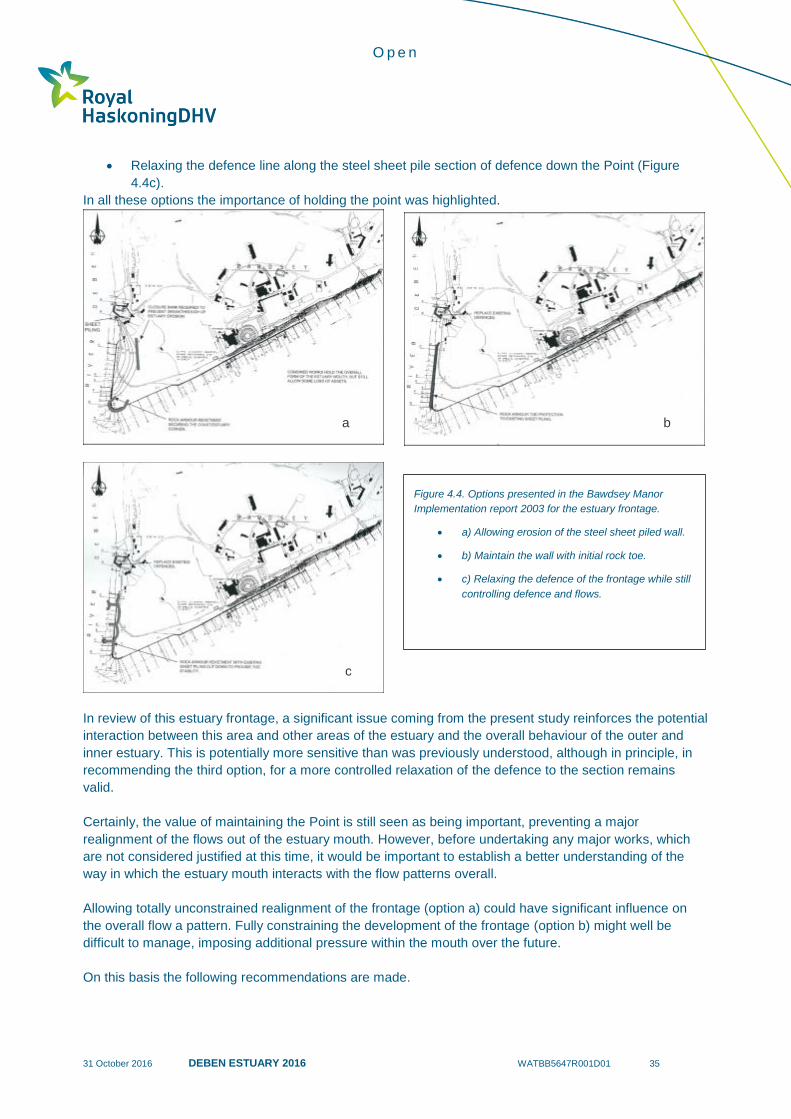
In terms of the Bawdsey Quay, estuary mouth frontage, the 2003 report put forward a range of options for
management. These included:
Reinforcing the Quay (which has since been undertaken) while allowing erosion to occur between
the Quay and the Point (Figure 4.4 a).
Undertaking further support of the sheet piles with a rock toe as initial early works (Figure 4.4 b)
O p e n
31 October 2016 DEBEN ESTUARY 2016 WATBB5647R001D01 35
Relaxing the defence line along the steel sheet pile section of defence down the Point (Figure
4.4c).
In all these options the importance of holding the point was highlighted.
In review of this estuary frontage, a significant issue coming from the present study reinforces the potential
interaction between this area and other areas of the estuary and the overall behaviour of the outer and
inner estuary. This is potentially more sensitive than was previously understood, although in principle, in
recommending the third option, for a more controlled relaxation of the defence to the section remains
valid.
Certainly, the value of maintaining the Point is still seen as being important, preventing a major
realignment of the flows out of the estuary mouth. However, before undertaking any major works, which
are not considered justified at this time, it would be important to establish a better understanding of the
way in which the estuary mouth interacts with the flow patterns overall.
Allowing totally unconstrained realignment of the frontage (option a) could have significant influence on
the overall flow a pattern. Fully constraining the development of the frontage (option b) might well be
difficult to manage, imposing additional pressure within the mouth over the future.
On this basis the following recommendations are made.
Figure 4.4. Options presented in the Bawdsey Manor
Implementation report 2003 for the estuary frontage.
a) Allowing erosion of the steel sheet piled wall.
b) Maintain the wall with initial rock toe.
c) Relaxing the defence of the frontage while still
controlling defence and flows.
a b
c

O p e n
31 October 2016 DEBEN ESTUARY 2016 WATBB5647R001D01 36
4.3 Recommendations
It is recommended that the findings of the study are communicated with the Deben Estuary Partnership for
discussion. Further to this the following additional recommendations are made.
4.3.1 General Recommendations
It is recommended that the Deben Estuary partnership further consider defining the short to longer term
management response to the anticipated increased pressure on Felixstowe Ferry, developing a necessary
response to this and thus avoiding a reactive approach in the future. Based on the typical cyclical
behaviour of the outer estuary, it is expected that as the estuary moves from its current State 2 towards
State 3, within the next 5 to 10 years, there may be management issues that develop around the southern
section of the defence. This, as discussed below, needs to include consideration of areas and linkages
over the wider area.
Associated with this, it is recommended that a truly long term vision should be developed for the whole
area. Developing this, should consider possible options for management extending beyond the constraints
of the current use and form of the whole area.
Associated with this and as part of developing a possible management approach for the future, it is
recommended that there is further investigation into the local flow regime around the whole area. While
some further information may be gained from a review of previous modelling, it is considered that this
should be supported by some form of float tracking and / or fixed current meter installation to measure the
actual and present flow patterns within the lower part of the estuary.
It is obviously recommended that monitoring continues building on the present data set. In this, specific
attention should be paid to extending air photographic coverage so as to include the inner estuary as well
as local monitoring of the Bawdsey Quay sheet pile frontage.
4.3.2 Recommendations with Respect to the Bawdsey Quay Frontage.
The most immediate issue in relation to the sheet pile wall is possibly one primarily of safety due the
condition of the upper part of the wall, although recent concerns as to the development of sink holes in the
back shingle does raise the issue as to whether the piles over the central section do in fact extend to -5m
OD.
It is recognised also that there may be a need to maintain access along the narrow foreshore.
Immediately, therefore, it is recommended that consideration is given to cutting back damaged sections of
piling to a level capable of still proving a back stop preventing direct erosion. Within this, it is
recommended that consideration is also given to the influence this might have on the wall further to the
south. The intention would be to maintain the integrity of the piles around the Point.
It is recommended that two trial holes be dug in front of the central section of the sheet piles, preferably, in
front of areas where sink holes have developed to the rear of the wall. The trial holes would aim to identify
the condition of the sheet piles below present beach levels and to confirm the depth of the piling. Clearly it
would be neither sensible nor practical to excavate to the toe of the piles. Excavation down from current
beach level by 2m would give a sound bases for assessing the risk of undermining.

O p e n
31 October 2016 DEBEN ESTUARY 2016 WATBB5647R001D01 37
Should the piles show excessive wear or should the toe to the piles be clearly much higher than expected
then there would be the need to support the toe purely to continue to provide the degree of flow protection
indicted above.
Over the medium and longer term and subject to the recommendations with respect to flow measurement,
it is recommended that management of this frontage needs to be considered in conjunction with future
management of the Felixstowe Ferry frontage. It is, therefore, recommended that the medium to long term
plan for the Bawdsey Quay frontage is considered in conjunction with planning for the wider area, taking
account of the findings of this report.
On this basis, it is recommended that only such works as are immediately required be undertaken to
maintain the present influence on the flow regime. Should the piles be at risk from undermining, it would
be recommended that a low rock toe be constructed along the central vulnerable section of the defence.
In terms of access along the frontage, there should be further discussion about access along the rear of
the wall, potentially avoiding the need for more immediate works to retain levels of the foreshore. Should
this be impracticable then it is recommended that short rock structures might be constructed replacing at
least in part the dilapidated groyne field at the root of the groynes. It is recommended, however, that such
structures are kept to a minimum length certainly extending no further the present length of the old timber
groynes.
4.3.3 Recommendations with Respect to Bawdsey Manor
It is recognised that management of the defence is dependent on decisions being made by the land
owner, obviously tempered by the need to fulfil any standard approvals.
It is recommended, within this context, that the recommendations provided in the separate assessment of
works needed along this frontage advance to outline design.
It is further recommended that as this design is developed the Deben Estuary Partnership is involved,
considering whether works may be may be extended of whether it is effective to develop further the
management of the area to the west alongside works to the critical section of the frontage.
4.3.4 Recommendations on Flow Measurements.
The aim of the measurements would be to map the typical flow patterns throughout the flood and ebb
cycle considering how flows entering the estuary and flowing from within the estuary tend to set against
different sections of the shore. The Deben estuary, with the strong flows experienced throughout the
system, lends itself to a drogue of float tracking approach due to the relatively short time taken for floats to
traverse the section of interest. While clearly not instantaneous, flows may be mapped over different
phases of the tide.
However to obtain this type of coverage it would be necessary to use “strings” of floats across the width of
the channel.
Water circulation patterns can be investigated using low cost solutions such as GPS-equipped tracking
drifters or drogues. These are constructed of polyurethane foam floats comprising a weighted anchor line
or a weight at a specific depth to capture movement associated with the vertical water unit of interest
rather than movement driven by wind. In the low-cost option, tracking can be achieved using hand-held
GPS units. Although the best vertical accuracy available (±5 m) is inappropriate for coastal use, the spatial
position accuracy of units such as the Garmin eTrex High Resolution handheld GPS is ±3 m, and
O p e n
31 October 2016 DEBEN ESTUARY 2016 WATBB5647R001D01 38
therefore suitable for surveys over distances of several 100 metres. The GPS units are enclosed within
waterproof bags and placed within a recess cut into the surface of the foam float to maximise satellite
connection and position accuracy.
For the investigation of inlet tidal current patterns, the drogues would be released at low tide close to the
ebb-jet region to capture the pathway of the incoming tide. For the ebbing tide, the drogues would be
released from positions between Bawdsey and Felixstowe Ferry Quays. There could be further
opportunity to release an additional group of drogues north of Horse Sand to capture the tide as it enters
the final meander to the inlet. Ideally, multiple drogues would be released so allow for some variation in
the position and timing of release. The drogues would need to be monitored during the course of the tidal
state as some will certainly ground on a shoreline. In these instances, the drogue can be returned to a
central-channel position and re-released. In all surveys, the drogues must be numbered and detailed
notes regarding the timing and position of releases and re-releases is necessary in order to appropriately
interpret the recorded flow patterns.
The GPS units can be set up to acquire positions on the basis of a time or distance interval. Previous
experience with this has achieved good results from the use of a 1m distance interval. The positions will
contain some noise within the ±3 m, but the use of a high resolution acquisition provides a means to
derive an average path which is likely more accurate than simply using a 3-5 m distance interval.
Data downloaded from the GPS units on completion of the survey can be viewed within a GIS, and the
positions can be converted to vector flow lines. The positions are all time-logged, so the relative speed, in
addition to position, through the different stages of the tidal cycle can be understood.
In combination with the GPS drogue survey, a simple tide gauge could be installed at either Quay to
accurately record the tidal cycle. Bathymetry surveys of the channel from Horse Sand through to the ebb
jet should be conducted close to the drogue survey period to allow a comparison between tidal current
patterns, channel position and channel bedforms. Wind and wave conditions are also important to the
behaviour of the drogues, and ideally the surveys would be conducted on calm days. The drogue surveys
should be undertaken on neap and spring tides, and ideally at regular periods through the year. At the
very least, quarterly surveys over the course of a few years should be sufficient to pick up any trends or
shifts in channel and flow patterns.
This programme would be reviewed once the initial survey was undertaken, being then able to interpret
flows patterns in relation to the natural development of the Knolls bank system.
Critically, the programme of work needs to extend to capture the anticipated major change in realignment
of the Knolls moving from State 1 through to the development of State 2 (now developing) and then to
identify the change as the outer estuary moves into State 3.
It is anticipated that as the banks start to extend out in to the offshore area, extending down the open
coast to the south, there will be, as seen in the past, increased pressure on the Golf course frontage.
Associated with this, will be how the pressure potentially slacken or increases in the area of Bawdsey
Quay.