Embed Size (px)
Citation preview

DE 14-238 Determination Regarding PSNH’s Generation Assets Settling Response toDean M. Murphy Testimony Filed on 1/26/2016
Date of Response: 2 1 2016Witness: Billy Leung, REMI
Upon review of the testimony filed by Dean M. Murphy of Brattle Group on January 26th, 2016the New Hampshire Public Utilities Commission requested REMI to run an additional simulationto model the $1.63 million in energy cost savings over the first five year (2017-202 1) time period.The purpose of this simulation is to better understand the economic impacts associated with theenergy cost savings and compare them to previous simulations of the various divestitureproceeding estimated outcomes displayed in the Commission Staff Set TC-46 response. In orderfor REMI to input the energy cost savings, we required a breakdown of the energy cost savingsper year and by customer class. Eric Chung on behalfof Eversource Energy, provided REMI withthe inputs which account for energy cost changes to industrial, commercial, residential and publicstreet lighting customers. Table one provides the energy cost savings in current millions of dollarsthat were inputs for this analysis. A negative dollar amount reflects a cost savings.
Table 1: Ener Cost Chanes b Customer Class 2017—2021 in Millions of Current DollarsSettlement 2017 2018 2019 2020 2021 Total A~erage
~ r~~1 38:0 .~-$~4;OO ~$18.00~ ~?~-$8.O0., ~~$163.O0 -$32.60ftncreases~relatedIto generation ~ .: ~ - - .. ~ . - - -.
Residential -$11.71~ ~. -‘ i~~i5~i~ $9i~ ~ $730 - $324 $6609 _____
Industrial -$7.79 -$3.95
~ ~ — ~ ,$005 $002 •~$O47 $009
When running the simulation, REMI modeled the energy cost savings as the same policy variableinput categories in the TC-46 response and original economic assessment report. To compare theresults to the previous findings, REMI ran the energy cost savings offof the default REMI controlforecast. Table two provides summary level results of the Brattle Group PSNH divestiture energycost changes when viewed as the difference from the REMI baseline. Table three compares thevarious estimated outcomes based on aggregate energy cost savings compared to variousapplicable economic indicators. Table four provides additional comparisons to understand theaggregate energy cost changes input into REMI and the results totals for the first five year timeperiod.
When reading Tables three and four, TC-46A is based on a net electricity cost increase whereasthe other simulations are based on assumptions reflecting a net cost decrease. The differences inthe results ofthe four net positive economic impacts are based on the ratios ofthe various consumerclasses affected and the years in which the energy cost changes occurred.
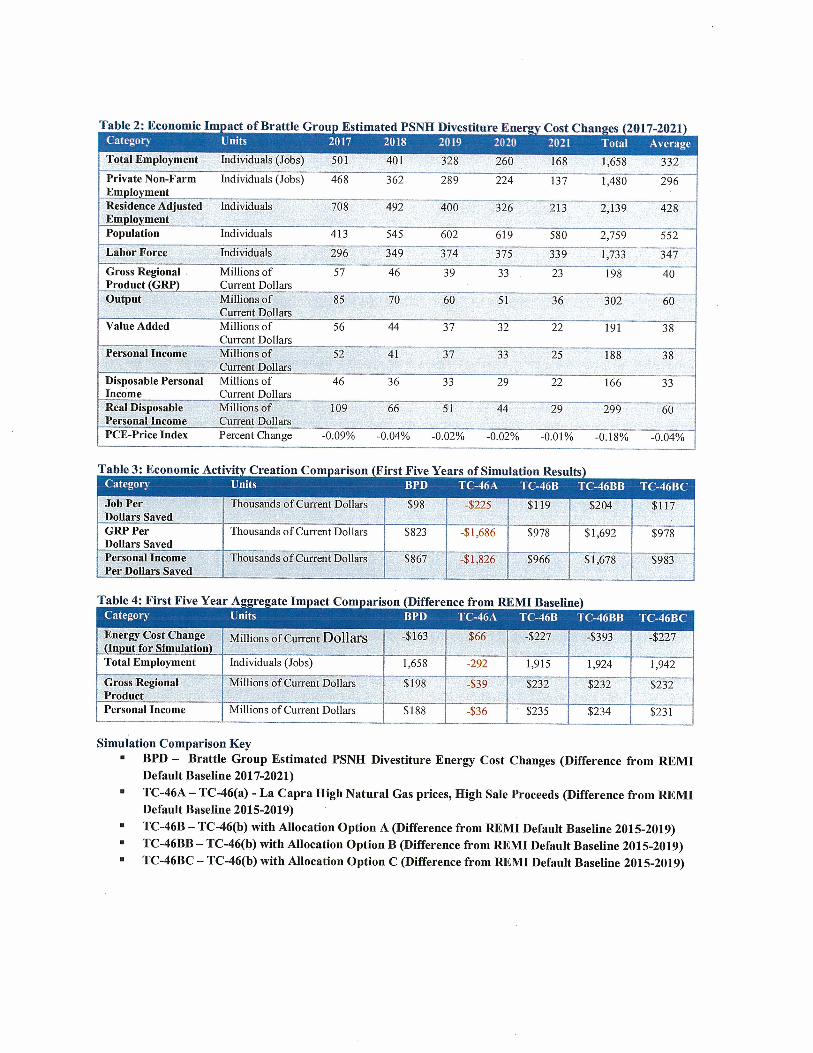
Table 2: Economic Tm ‘act of Brattle Grou’ Estimated PSNH Divestiture Ener Cost Chanes 2017-2021Ca e~o s 2017 2018 2019 2020 2021 Total Merage
~ (Job~~ ≠~ 5%~~4O1 ~~i~’ 1’658 ~ 332~
PrivateNon-Farm Individuals(Jobs) 468 362 289 224 137 1,480 296Em ‘to ment~~i~lo~ ment ~ “~ .‘ -~“ ~4 ;_
Population Individuals 413 545 602 619 580 2,759 552
~Eäbô~Fóië~~Gross Regional Millions of 57 46 39 33 23 198 40Product GRP Current Dollars
~ ~ ~, ~ 7O~f~ ~ ,~‘ ~ ~ 6~ ~Value Added Millions of 56 44 37 32 22 191 38
Current lollarsMi1liöli~f~, ~-..• .~:~~‘i:
~ ~ ~urrent Do1lars~ ~ ~DisposablePersonal Milli.nsof 46 36 33 29 22 166 33Income Current ~ollars
~R~óiible,~% ~MiIl~ñsof~ ~ ~ ~1j~~I~ersonal Income Current Dollars j- .. ~.. ~,. ~. ,. ~ -~
PCE-Price Index Percent Change -0.09% -0.04°o -0.02% 0.02°o -0.01% -0.18% -0.04%
Table 3: Economic Activi Creation Corns arison irst Five Years of Simulation ResultsCategory Units BPD TC-46A TC-46B TC-46BB TC-46BC
~J~BWer,, ~ ,,~ i .~ $98 ~~ ‘~. ~ ~i;~ ~~GRP Per Thousands of Current DollarsDollars Saved
~h~liIi~coiñe~ ;~3~ ~Th’ ~‘i~Dollars~ ~f~’~; .,~• ~‘!‘~ ~ ~iJ
Table 4: First Five Year A~regate Impact Comparison (Difference from REMI BaselinelL~I~~g!1~ unfit ,: a .r~rii r~Fj~ergy €ost~hange ~ Millions of €urrent ~ $1r63 ~ ~. $66 ,~ $227 ~$393 ‘~, ~$227~(Input,for Simulation). ~ - . •.~*4 ~ - ., .. ~
Total Employment Individuals (Jobs) 1,658 -292 1,915 1,924 1,942
~ross ~‘~oi~l ~Milli~is of~ ~D~ll~Th ,~. -, ~~$198~ ~$39 ~j$232~ ~$232 ~ ~ ‘$232~Produ~t~ ‘~ ~ ~ t~t ‘~ ‘~ ~Personal Income Millions of Current Dollars $188 -$36 $235 $234 $231
Simulation Comparison K y• BPD — Brattle Group Estimated PSNH Divestiture Energy Cost Changes (Difference from REMI
Default Baseline 2017-2021)• TC-46A — TC-46(a) - La Capra High Natural Gas prices, High Sale Proceeds (Difference from REMI
Default Baseline 2015-2019)• TC-46B — TC-46(b) with Allocation Option A (Difference from REMI Default Baseline 2015-2019)• TC-46BB — TC-46(b) with Allocation Option B (Difference from REMI Default Baseline 201 5-2019)• TC-46BC — TC-46(b) with Allocation Option C (Difference from REMI Default Baseline 2015-2019)
$1~1.9.~
I

Additional Tables Per Request of Commission Staff, 2/4/2016:
TableS: Change in Private Non-Farm Employment Summaryn Descendin order Units are in Individual JobsCategory
:iiiction - 23
Retail Trade - 44-45
Accommodation and Food Services - 72
Health Care and Social Assistance - 62
Other Services, except Public Administration - 81
Professional, Scientific, and Technical Services - 54
Utilities - 22
Finance and Insurance - 52
Wholesale Trade - 42~irjs, Eiitertainment, and Recreation - 71
Transportation and Warehousing - 48-49
Educational Services - 61
Information - 51
Management of Companies and Enterprises - 55
Minin - 21Forestry, Fishing, and Related Activities - 113-115
(‘arcgor5
Construction - 23
Real Estate and Rental and Leasing - 53
Accommodation and Food Services - 72
Health Care and Social Assistance - 62
Wholesale Trade - 42
Professional, Scientific, and Technical Services - 54
Finance and Insurance - 52
Information - 51
Administrative and Waste Management Services - 56
Other Services, except Public Administration - 81
Management of Companies and Enterprises - 55
Transportation and Warehousing - 48-49
Educational Services - 61
Arts, Entertainment, and Recreation - 71
Mining - 21
Forestry, Fishing, and Related Activities - 113-115
124 120 95 68 35 442 88
82 54 43 35 23 236 47
55 42 37 32 23 189 38
45 30 24 19 13 131 26
32 19 14 10 6 81 16
19 17 14 12 8 70 14
12 9 6 57 11
9 7 4 48 10
8 7 5 43 9
20 9 6 4 2 41 8
11 8 7 5 3 34 7
9 7 5 4 3 29 6
9 6 5 4 2 25 5
6 4 3 2 1 16 3
4 3 2 1 0 11 2
4 3 2 2 1 11 2
3 3 2 2 1 11 2
2 2 1 1 1 7 11 1 0 0 0 2 0
Manufacturing - 31-33 16 14
Administrative and Waste Management Services - 56 15 12
Real Estate and Rental and Leasing - 53 12 10
Table 6: Change in Private Non-Farm Industry Sales SummaryIn Descendin order in Current Millions of Dollars
Manufacturing - 31-33
Retail Trade - 44-45
Utilities - 22 1~.7 &5 5.5 4.2 2 37 7
erage15.8 16.2 13.5 10.3 6 62 12
7.7 7.7 7.1 6.3 4.9
8.5 6.1 5.2 4.6 3.4
5.2 4.5 4 3.4 2.5
4.5 3.9 3.7 3.4 2.8
5.3 3.7 3.1 2.7 2
3 2.6 2.3 2.1 1.7
2.7 2.6 2.3 2.1 1.6
3.1 2.3 2 1.7 1.1
2.1 1.7 1.5 1.3 1
1.7 1.6 1.5 1.4 1.1
2.4 1.5 1.2 1 0.6
0.6 0.6 0.6 0.5 0.4
0.6 0.5 0.4 0.3 0.2
0.5 0.4 0.4 0.4 0.3
0.4 0.3 0.2 0.2 0.2
0.3 0.3 0.2 0.2 0.1
0.1 0.1 0.1 0.1 0
34 7
28 6
20 4
18 4
17 3
12 2
11 2
10 2
8 2
7 1
7 1
3 1
2 0
2 0
1 0
1 0
0 0

Table 7 Production Cost Chan ~c - Percent Chan e from ‘ I Default Base ‘e In Descendin order)Category 2017 2018 2019 2020 2021 Average
~~• :..C’:;S’~L~C-..~ •‘.;ij.-. •I.~’ -
Accommodation and Food Services - 72 -0.14% -0.06% -0.03% 0.02% -0.01% -0.05%
~Educad~tsW~j~s -~ wi. ..~-~ on:2%;x~co!cys%-v~ ?~0Ôi%~k~~ ~-o_:os%~~~•;~ .-cgZSJ ~,. ..I,~:.;-a;C~ - ~-
Arts, Eatertainment, and Recreation - 71 -0.08% -0.03% -0.02% -0.0 1% 0.00% -0.03%~w~nraa -~~~Lvvnoicsaie~traue ~r44•~’~ i~ L~4~:~ ~ff..: ~;~iuulo.u.o3%:~
‘‘9..’’ ..:~1’. ~5 e~’~~4~ ~$~&F ‘i~i~~$>~&Th).
Construction - 23 -0.06% -0.02% -0.01% -0.01% 0.00% -0.02%
1-c Ti fl6% &P2°~’~~ 001% $101°~ 000% 0L02%Real Estate and Rental and Leasing - 53 -0.06% -0.01% 0.00% 0.00% 0.0 1% -0.01%
~ W~rr~ $~-~c ~0~05% ~o~n%~ ~,$!0~01%~ V000%~ ‘0~00% - .~0 01%.~ t “2~t~ — in -~. t~ t -~ r~ ~. c
Information - 51 -0.05% -0.02% -0.01% -0.01% 0.00% -0.02%~~ ~S~0fC5%t~~-~ ,.jt-~ ~j- ,~: .-t~ ~r~hô, ~ -½.- ~.-
Other Services, except Public Administration - 81 -0.05% -0.01% -0.01% 0.00% 0.00% -0.01%
4$ ~~Th90~kL :-o:oi~’0Manufacturing 3133 004% 002% 001% 001% 000% 001%
~F.restry, Fishing, and Related Activities 113 115 0 03% 0 00% 0 00% 0 00% 0 00% 0 01%
rifitiante and4ffitiFihiéWS2 1~J t”. ~. ~%n!oro2w ~ O00%t 0100%~P’~-. 0!00%~1~0~00%.~. :~of0O%.•kt#~. ~j~’-. ~4 ~ t.~ £~4-. ,. i~it,Wi%trr4e3 ~
Utilities - 22 -0.02% 0.01% 0.01% 0.01% 0.01% 0.00%
.~1raftsportatiOfl1~fl[thWarehbuiiifg ~~48~49~7w._ -p.-- :e~oio1%;;:~.:70!00%..C 4 ~ ‘*~zz½. rS,~ i -~ ?, ,~j - ..-
For reference, Tables Five, Six and Seven include the summary level private non-farm industryand the corresponding NAICS code.