Embed Size (px)
Citation preview

Daya Bay Outage Management
Atoms for the Future 2012 Seminar
Paris
24 October 2012
Contents
1. Nuclear Power Development in China
2. Daya Bay Performance
3. Daya Bay Outage Management

Nuclear power development in Mainland China
First civil nuclear reactor, Qinshan, commissioned in
Feb 1994
First commercial scale nuclear power station, Daya
Bay, commissioned in May 1994
By 2020, target installed capacity in China is 40 GW
Chinese Government officials had indicated a higher
national target of 60-70 GW (5% of total installed
capacity)

0
500
1000
1500
2000
2500
3000
2011- 2015- 2020- 2030- 2040-
Nuclear
Solar
Wind
Hydro
Fossil
2011-2040 Installed Generating Capacity (GW)
China would increase its decarbonization targets in the future years, impacting the Nuclear Power
deployment pace and magnitude.
Outlook for nuclear : 15%
Source: Nuclear Power 2012

China needs to
build 280 CAP1400
(or 230 CEPR1750
units) for achieving
its presently stated
goal of 15%
nuclear capacity
share by 2040
Build 32 NPPs
in 13 years
Numbers are rate
of NPPs per year
connected to the grid
taken at the maximum
persistent rate
Projected Rate of NPP Construction in China
Source – Dr. Staehle
0
20
40
60
80
100
120
1960 1970 1980 1990 2000 2010 2020 2030
To
tal
NP
P N
um
ber
Year
USA 4.63
France 3.83
Japan 1.82
Canada 0.74
Russia 1.26
Korea 0.69
China 1.1
China 6
China 10
Target of 75GW
in 2020
Target of
210GW in
2030

Operating Nuclear Units in China
Owner NPP Gross Power
(MWe) Total (MWe) Reactor Type
CGNPC
Daya Bay 2x984
6,120
PWR(M310)
Lingao I 2x990 PWR(M310)
Lingao II 2x1086 PWR(CPR1000)
CNNC
Qinshan I 320
6,440
PWR
Qinshan II 4x650 PWR
Qinshan III 2x700 PHWR
Tianwan 2x1060 VVER
CPIC NIL
Mainland Total 12,560 MWe
CGNPC – China Guangdong Nuclear Power Co.
CNNC – China National Nuclear Co.
CPIC – China Power International Co.
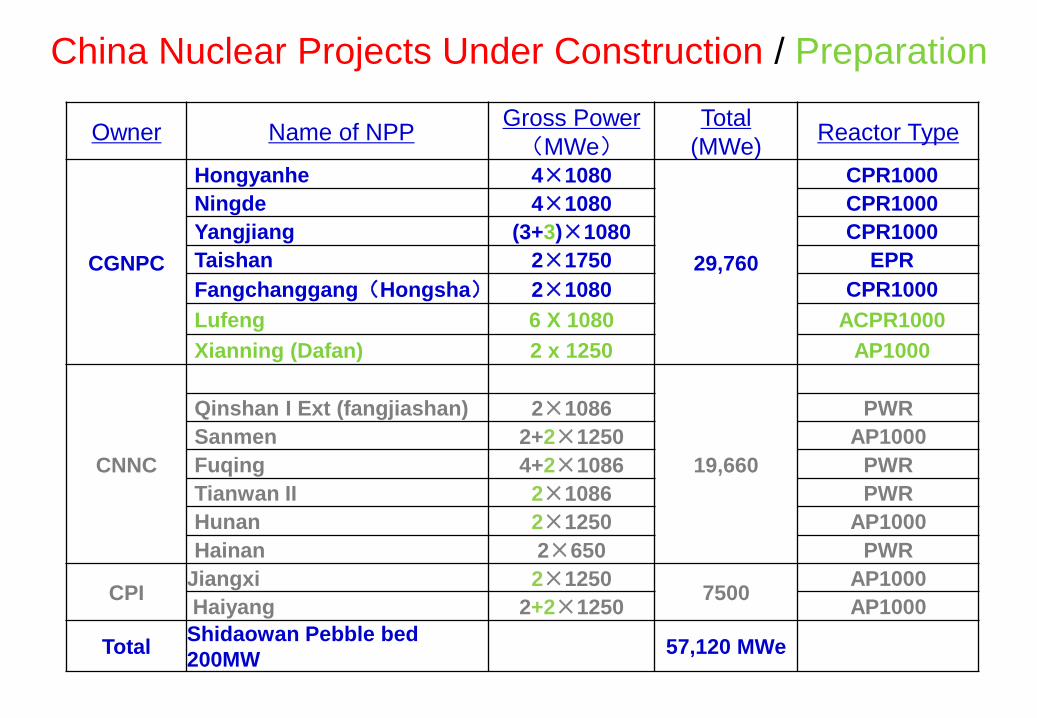
China Nuclear Projects Under Construction / Preparation
Owner Name of NPP Gross Power
(MWe)
Total
(MWe) Reactor Type
CGNPC
Hongyanhe 4×1080
29,760
CPR1000
Ningde 4×1080 CPR1000
Yangjiang (3+3)×1080 CPR1000
Taishan 2×1750 EPR
Fangchanggang(Hongsha) 2×1080 CPR1000
Lufeng 6 X 1080 ACPR1000
Xianning (Dafan) 2 x 1250 AP1000
CNNC 19,660
Qinshan I Ext (fangjiashan) 2×1086 PWR
Sanmen 2+2×1250 AP1000
Fuqing 4+2×1086 PWR
Tianwan II 2×1086 PWR
Hunan 2×1250 AP1000
Hainan 2×650 PWR
CPI Jiangxi 2×1250
7500 AP1000
Haiyang 2+2×1250 AP1000
Total Shidaowan Pebble bed
200MW 57,120 MWe

In Operation
Under Construction
NDRC approved for preparatory works
南海诸岛
Geographical Locations of China NPP Hongyanhe
Haiyang
Tianwan
Qinshan II
Qinshan I
Sanmen
Qingshan III
Fuqing
Taiwan
Daya Bay
Lingao II
Taishan
Yangjiang
Ningde
Lingao I
Fangchanggang
Hainan
Xianning
Shidaoswan
Hunan Jiangxi

Contents
1. Nuclear Power Development in China
2. Daya Bay Performance
3. Daya Bay Outage Management

6 Operating Units at Daya Bay Site
Unit Name Reactor
Type
Gross
Capability
(MWe)
Date of
Commercial
Operation
Refueling
Cycle
Daya Bay 1 PWR 984 1994-02-01 18 months
Daya Bay 2 PWR 984 1994-05-06 18 months
Lingao 1 PWR 990 2002-05-28 12 months
Lingao 2 PWR 990 2003-01-08 12 months
Lingao 3 PWR 1,080 2010-09-20 12 months
Lingao 4 PWR 1,080 2011-08-07 12 months

Un
it C
ap
ab
ility
Fa
cto
r (%
)
1995-1999 2000-2004 2005-2009
86.4%
76.7%
65.2%
80.84%
89.46%
86.14%
95.67%
89.86%
91.72%
Range of 5-year Capability Factor (1995-2009)
5-year Average
Increasing Daya Bay Generation Capability
Sustaining the Performance
Improvement of the Fleet:
•Identify the best method
•Standardizing it
•Continue improving it
•Transfer the improvements
company-wide

Lingao
86.47%
104.962 TWh
Daya Bay
82.87%
215.748 TWh
Lif
eti
me L
oad
Facto
r (%
)
Lifetime sent-out to December 2009 (TWh)
Lifetime Average Load Factor and Electricity Sent-out
Lo
ad F
acto
r (%
)
1995-1999 2000-2004 2005-2009
81.80%
72.10%
61.56%
80.41%
87.03%
85.01%
94.98%
89.57%
91.44%
Range of 5-year Load Factor (Daya Bay 1995-2009)
5-year Average
Replicating & Sustaining the Improvements
Across Every Unit CGN Operates

Contents
1. Nuclear Power Development in China
2. Daya Bay Performance
3. Daya Bay Outage Management

1. Refueling;
2. Regulatory Inspection and Test;
3. Preventive and Corrective Maintenance;
4. Performance Improvement Works.
Outage Purpose

1. First Refueling Outage • Primary Circuit hydraulic test;
• Containment pressure test;
• RPV In-Service-Inspection;
• Clearance of teething problems and post-service inspections on major
equipment/system…
2. Normal Refueling Outage • Refueling;
• Regulatory inspections, tests and preventive maintenance.
• Preventive and Corrective maintenance and engineering works.
3. Short Refueling Outage • Refueling;
• Regulatory inspections, tests and preventive maintenance.
• Preventive and Corrective maintenance and slight engineering works.
4. 10th Year Outage • Similar regulatory required works as 1st refueling outage
• Post-PSA required inspections and improvement works
• Major engineering works/modifications.
Types of Refueling Outage

Outage Management – Planning, Preparations and Execution
– Outage Safety, QA, ALARA, HPI and Communications.
– Process and Technology Integration
– Cost Control and Reduction
– Using New Technology
– Evaluating Specific Long-term Outage Performance Strategies
– Appling Best Practices, Lessons Learned and Operating Experience
– Completing Benchmarking, Standardization and Plant Assessments
– Performing Risk Assessments
– Issue Resolution, Deep Contingencies and Recommendations

Outage Management Program
Outage Program Review
Outage Initial-Preparation
Outage Preparation
Outage Execution
Post-Outage Critique
Strategy /
Development
Execution
Outage
Management
Self-reliance
maintenance
Teaming of
Contractors
Outage
Optimization
1
2
3
4
5
5-Y&10-Y Planning
6
6 Stages
Planning &
Optimization
2 Groups 4Teams 5 Capabilities
Long Term
Planners
Outage
Command and
Control
Maintenance
Experts (Mission
Critical Skills
Strategic
Partners
Experts
Development
Leadership and integration to improve outage
planning, preparation and execution

Outage Management Organization
Outage
Control
Centre
Daily Work
Management
General
Management
Maintenance
Management
Operations
Management
Technical
Management
Safety & QA
Management
OPO OPL OPH OPA OPP LPO TEN TCW TTS TCS TDA SNS SQA MOT MRM MSM MGS MIC MOT
Outage
Strategic
Planning
Functional Departments

AREVA NUCLEAR HUAINAN DONG BEI
Coordinator Planner
Coordinator
Planner
Coordinator
Coordinator
Planning
assistant
NI planning
CI planning
Contractors Safety surveillance
Industrial safety
Radiation protection
Supports
Responsible persons
NCR
management
NI machinery
CI
Machinery
Electric
equipment
Instrument
control
3-waste management
MSM
assistant
MRM head MSM head
CI
coordinator
CI
coordinator
MRM
assistant
MEE head
MEE
assistant
CI
coordinator
MIC head
MIC
assistant
CI
coordinator
MGS
assistant
Decontam-
ination
TTS head
In-service
inspection
Performance
test
TEN head
Engineering
modification
MGS head
Persons responsible for major projects
Date:
year/month/day
MSM
QC leader
MRM
QC leader
MEE
QC leader
MIC
QC leader
MGS
QC leader
TTS
QC leader
TEN
QC leader
Planner
Equipment surveillance
Outage manager
Assistant outage manager
Planning engineer
Operations manager
Equipment engineer
CI manager
STA
Quality assurance engineer
XXX Outage
Organization
Operational
assistant
NI blocking manager
Periodic test
MGS
coordinator MIC
coordinator
MEE
coordinator
MRM
coordinator
MSM
coordinator
TTS
coordinator
TEN
coordinator
STA assistant
NI Manager
CI blocking manager
TCW
QC leader
QC leader
QC leader
QC leader
TCW head
TCW
coordinator
Civil works
Corrosion
Prevention Shift scheduling
Labor
management
Item
substitution
RCM
Requalification
team
Requalification
manager
Performance
& vibration test MRM MEE MIC
HUAI NAN DONG BEI
NUCLEAR Company
TEN MSM
WR management
Training
engineer
Quality assurance
License application
Experience feedback
Contracted
procurement
Chemical control
Fuel
management
Generation planning
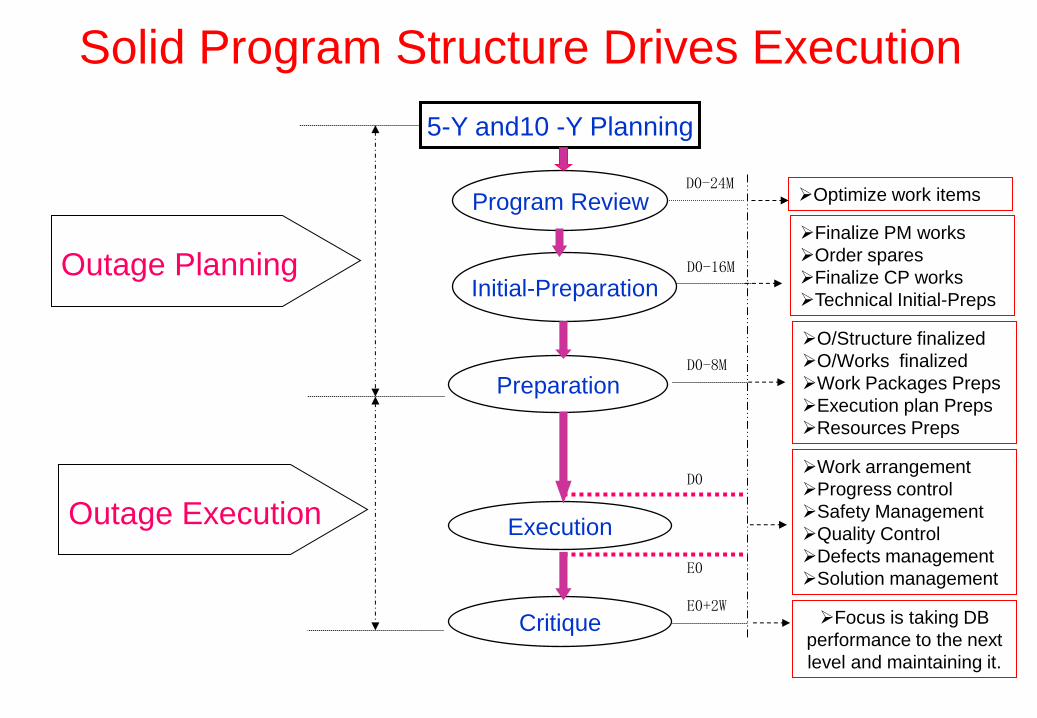
Program Review
Initial-Preparation
Preparation
Execution
Critique
D0-16M
D0-8M
D0
E0+2W
D0-24M
E0
Finalize PM works
Order spares
Finalize CP works
Technical Initial-Preps
Work arrangement
Progress control
Safety Management
Quality Control
Defects management
Solution management
Optimize work items
O/Structure finalized
O/Works finalized
Work Packages Preps
Execution plan Preps
Resources Preps
Focus is taking DB
performance to the next
level and maintaining it.
5-Y and10 -Y Planning
Outage Planning
Outage Execution
Solid Program Structure Drives Execution

Solid Outage Management Structure
Value added to outage process
– Improved outage planning and implementation
– Reduced costs through integration of plant and
vendor/sub-contractor teams
– Improved communication, integration and
performance
– Incorporation of best practices
– Improved working relationships through Increased
presence and direct interaction
– Increased oversight drives safety, Human
Performance initiatives.

Maintenance Program
Anti-Corrosion Program
PT Program
ISI Program
Performance Test Program
10-y outage program data
bank
Identify key PM items
Corporate Goal, KPIs
Normal Refueling outage
program data bank
Finalize Outage works
Outstanding Engineering
and Modification works,
Major Plant Defects Outage
Duration
Outage
Planning
Long-term
Planning
D0+24
Initial-Preparation
D0+16M
Outage Duration Decision Chart

Planning Team Goal
Focus on optimizing outage planning and performance
● Outage Milestone Enhancement
● Schedule Development
● Horizontal Schedule Review
● Vertical Schedule Review
● Peer Group Assessment
● Focus Team
● Resource Review

Milestones
Month before Outage
Starts (D0)
Refueling
Outage
10-year
Outage
IP0 Outage Initial-preparation (IP)starts +16 M
IP1 Outage spares procurement orders
issued +13 M
IP2 Outage program developed and validated +9 M +13 M
IP3 Outage major work items finalized +9 M +13 M
IP4 Outage critical path developed +9 M +13 M
IP5 Outage IP work hand-over +8 M +12 M
Outage Initial-Preparation Milestones

Outage Preparation Milestones Milestone Activity Refueling Outage 10-year Outage
P0 Outage preparation starts 8 months before outage 12 months before outage
P1 PM work requests submitted 9 weeks after outage preparation
work starts
13 weeks after outage preparation
work starts
P2 Outage major works finalized 1 week after program validation 2 weeks after program validation
P3 Outage organization finalized 3weeks after program validation 4 weeks after program validation
P4 Tech Spec of all sub- contracted works
ready and PR issued
1 week after finalizing the major
works
1 week after finalizing the major
works
P5 Freeze the major work list 6 weeks after program validation 8 weeks after program validation
P6 PM packages preparation completed 9 weeks after program validation 13 weeks after program validation
P7 PM packages review completed 10 weeks after submission 13 weeks after submission
P8 Print and issue the critical path chart
and main blocking chart
4 weeks after completing
preparation
6 weeks after completing
preparation
P9 List out the concerned spares 13 weeks before outage 13 weeks before outage
P10 PM submitted to NNSA for approval 13 weeks before outage 13 weeks before outage
P11 Critical path activities finalized 6 weeks before outage 9 weeks before outage
P12 PM work requests to SAP completed 4 weeks before outage 4 weeks before outage
P13 Daily work/outage team hand-over
meeting started 3 days before outage
3 days before outage
M00 Outage commence offline offline

M11 - Offline
M01 - Enter HSD
M02 - Leaving HSD
M03 - Entering NS/RRA mode
M04 - NS/RRA mode with T < 90degC
M10 - Entering MCS with P < 5 bar
M11 - MCS with small opening
M12 - MCS with large opening
M13 - RVH opening (RIC seal open)
M14 - Lifting RVH
M20 - Reactor cavity full
M21 - Start core offloading
M30 - Finish core offloading
M31 - Start lowering cavity water level
M32 - LL water work started
M33 - LL water work finished
Mt - Train Change-over
M40 - Reactor cavity full
M41 - Start core reloading
M42 - Core reloaded and validated
M50 - Start lowering cavity water level
M51 - Closing RVH (lifting from stand)
M52 - RVH closed
M53 - PZR manhole closed
M60 - Leaving MCS with P > 5 bar
M61 - RCS dynamic venting
M62 - NS/RRA mode with T >90deg C
M70 - Leaving RRA (NS/SG mode)
M71 - Entering HSD
M80 - Start dilution
M81 - Reactor critical
M82 - Start charging main steam lines
M83 - Steam to turbine set
M90 -Synchronization (on line)
M100 - Reactor at full power
Outage Execution Milestones

Critical Path Chart with RCS water level
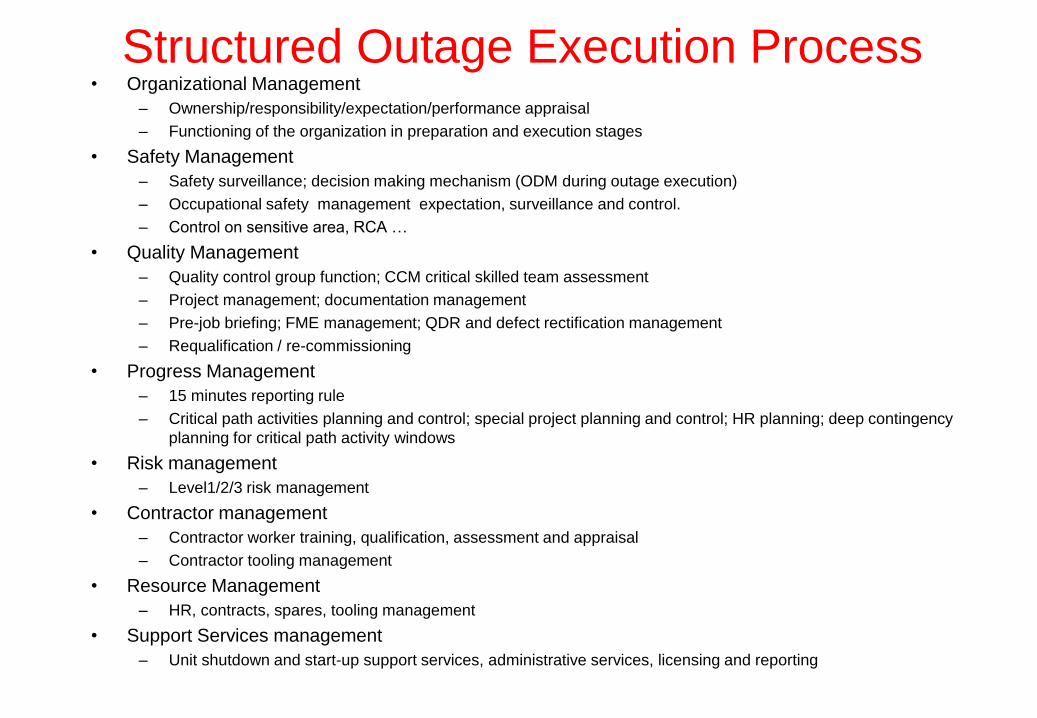
Structured Outage Execution Process • Organizational Management
– Ownership/responsibility/expectation/performance appraisal
– Functioning of the organization in preparation and execution stages
• Safety Management
– Safety surveillance; decision making mechanism (ODM during outage execution)
– Occupational safety management expectation, surveillance and control.
– Control on sensitive area, RCA …
• Quality Management
– Quality control group function; CCM critical skilled team assessment
– Project management; documentation management
– Pre-job briefing; FME management; QDR and defect rectification management
– Requalification / re-commissioning
• Progress Management
– 15 minutes reporting rule
– Critical path activities planning and control; special project planning and control; HR planning; deep contingency
planning for critical path activity windows
• Risk management
– Level1/2/3 risk management
• Contractor management
– Contractor worker training, qualification, assessment and appraisal
– Contractor tooling management
• Resource Management
– HR, contracts, spares, tooling management
• Support Services management
– Unit shutdown and start-up support services, administrative services, licensing and reporting

Outage Control Daily Meeting Schedule
Meeting Purpose Daily Meeting
1 Morning Progress Meeting with all functional Branch heads 0800 hr
2 Convention Island work coordination meeting 0820hr
3 Outage work coordination with all project leaders 0930hr
4 NCR actions tracking coordination meeting with stakeholders 1000hr
5 FME and quality assurance meeting with stakeholders 1110hr
6 Outage Planning meeting 1500hr
7 Convention Island Planning meeting 1620hr
8 Safety Health and environmental protection meeting 1630hr
9 Outage Control Centre management meeting 1845hr
10 Outage management Planning Meeting 1100hr and 2200hr

Partnering with Contractors
● Teaming of vendors/contractors for a mutually
beneficial relationship
● Establish a joint alliance team focused on improving
safety and outage performance
● Form teams to focus on all aspects of an outage
from setting goals and key performance objectives
to planning, training, implementation, post-outage
critique and drawing lessons learned.

Benchmarking with FROG Outage Windows FROG
Window FORG Window Information
DNMC
Window DNMC Window Information
DNMC
Shortest
FROG 1 Offline to Mode 5(<90oC) M00--M04 Offline--TRCP<90degC NS/RRA mode 27.3hr
FROG 2 Mode 5 to Mode 6 (unbolting the
first bolt on RVH) M04--M13
TRCP<90DegC NS/RRA mode to start work on RVH
(dismantling RIC seal) 37hr
FROG 3 Mode 6 to Start core offloading M13--M21 Start work on RVH(dismantling RIC seal)to Start Core
offloading 36.8hr
FROG 4 Start Core offloading to the last FA
in spent Fuel Pool M21--M30 Star to finish core offloading 35.3hr
FROG 5 Reactor Vessel empty M30--M41 Core offloaded to core reload starts 98.3hr
FROG 6 Core reload including verification M41--M42 Core reload start to finish including verification 41.2hr
FROG 7 Core verification to RVH in Place M42--M51 Core verification to RVH lift-up from stand 18hr
FROG 8 RVH in Place to all bolts tightened M51--M52 RVH lift-up from stand to RVH boxed(RIC seal replaced) 19hr
FROG 9 All RVH bolts tightened to first RCP
started M52--M60
RVH boxed(RIC seal replaced) to leaving MCS
(PRCP>5BAR) 8.5hr
FROG 10 First RCP started to Mode 4
(>90oC) M60--M62
Leaving MCS(PRCP>5BAR) to RCP<90degC NS/RRA
mode 15.1hr
FROG 11 Mode 4 to leaving RRA M62--M70 TRCP<90degC NS/RRA mode to NS/SG mode(leaving
RRA) 12.2hr
FROG 12 Leaving RRA to start dilution M70--M80 NS/SG mode(leaving RRA)to start dilution 31.9hr
FROG 13 To start dilution to online M80--M90 Start dilution to online 40.1hr
Total 17.5 days (achievable outage duration) 420.7hr

Operation & regulatory environments are different …
Outage Comparison
Source: McGraw Hill – “Global LWR Outage Durations”

Daya Bay Units’ Actual Outage Duration
40.7
31.4
19.7
59.6
48.2
33.3
0
10
20
30
40
50
60
70
1996-2000 2001-2005 2006-2010
Average Duration shortest duration

Daya Bay – The Way Forward
• 20 days will be the Daya Bay norm for predictable and repeatable refueling outage duration.
• Based on Daya Bay analysis of actual outage windows data, outage durations of 17 days can be achieved.

Thank You