Embed Size (px)
Citation preview

DAVIDNOELKELLYCIVIL
David Noel Kelly 2014.07.22 10:24:14 -04'00'

TABLE OF CONTENTS
Stormwater Management Summary Checklist for Stormwater Report Illicit Discharge Statement Runoff Summary
Existing Conditions Analysis .................................................................................................. Attachment A Existing Drainage Exhibit ............................................................................................................. Runoff Curve Numbers .................................................................................................................
Hydraflow Hydrographs Model ................................................................................................... Existing Conditions Hydrograph Summary Chart .................................................................... Individual Hydrographs for 100 year storm ..........................................................................
Proposed Conditions Analysis ............................................................................................... Attachment B Proposed Drainage Exhibit ........................................................................................................... Runoff Curve Numbers ................................................................................................................. Hydraflow Hydrographs Model ................................................................................................... Proposed Conditions Hydrograph Summary Chart .................................................................. Individual Hydrographs for 100 year storm .........................................................................
TSS Removal Spreadsheet ...................................................................................................... Attachment C Contech TSS Removal ................................................................................................................... Stormwater Maintenance System Operation and Maintenance Plan ....................................... Operations & Maintenance Log ................................................................................................... BMP Location Map .......................................................................................................................
Pipe Sizing Exhibit .................................................................................................................. Attachment D Rational Method ............................................................................................................................ Mannings Calculation ...................................................................................................................
Miscellaneous ............................................................................................................................ Attachment E Cultec Stormwater System Calculations ...................................................................................... Groundwater Adjustment (USGS Methodology – Frimpter Method) ...................................... NRCS Soil Survey Map .................................................................................................................. USGS Location Map… ...................................................................................................................

Page 1
INTRODUCTION
The purpose of this report is to analyze the pre-development and post-development drainage conditions for the proposed project and to demonstrate that the project will have no negative impacts on the surrounding properties and resource areas. The design incorporates many best management practices recommended by the Massachusetts Stormwater Management Handbook.
EXISTING SITE
The site is located on 64 Cambridge Street in Burlington, MA which is south of a ramp for Route 128. The site is currently occupied by a carpet store and a marble/granite store in existing 13,049 ± s.f. building and 4,510 ± s.f. buildings respectively with associated parking, utilities, and site development features.
Currently runoff from the site splits into three drainage areas and has no existing closed drainage system. The majority of the site runoff flows north to Route 128. One smaller area runs uncontrolled westwards to Cambridge Street and the other runs south and adjacent to the abutting Herb Chambers dealership property. See Existing Drainage Exhibit in Attachment A.
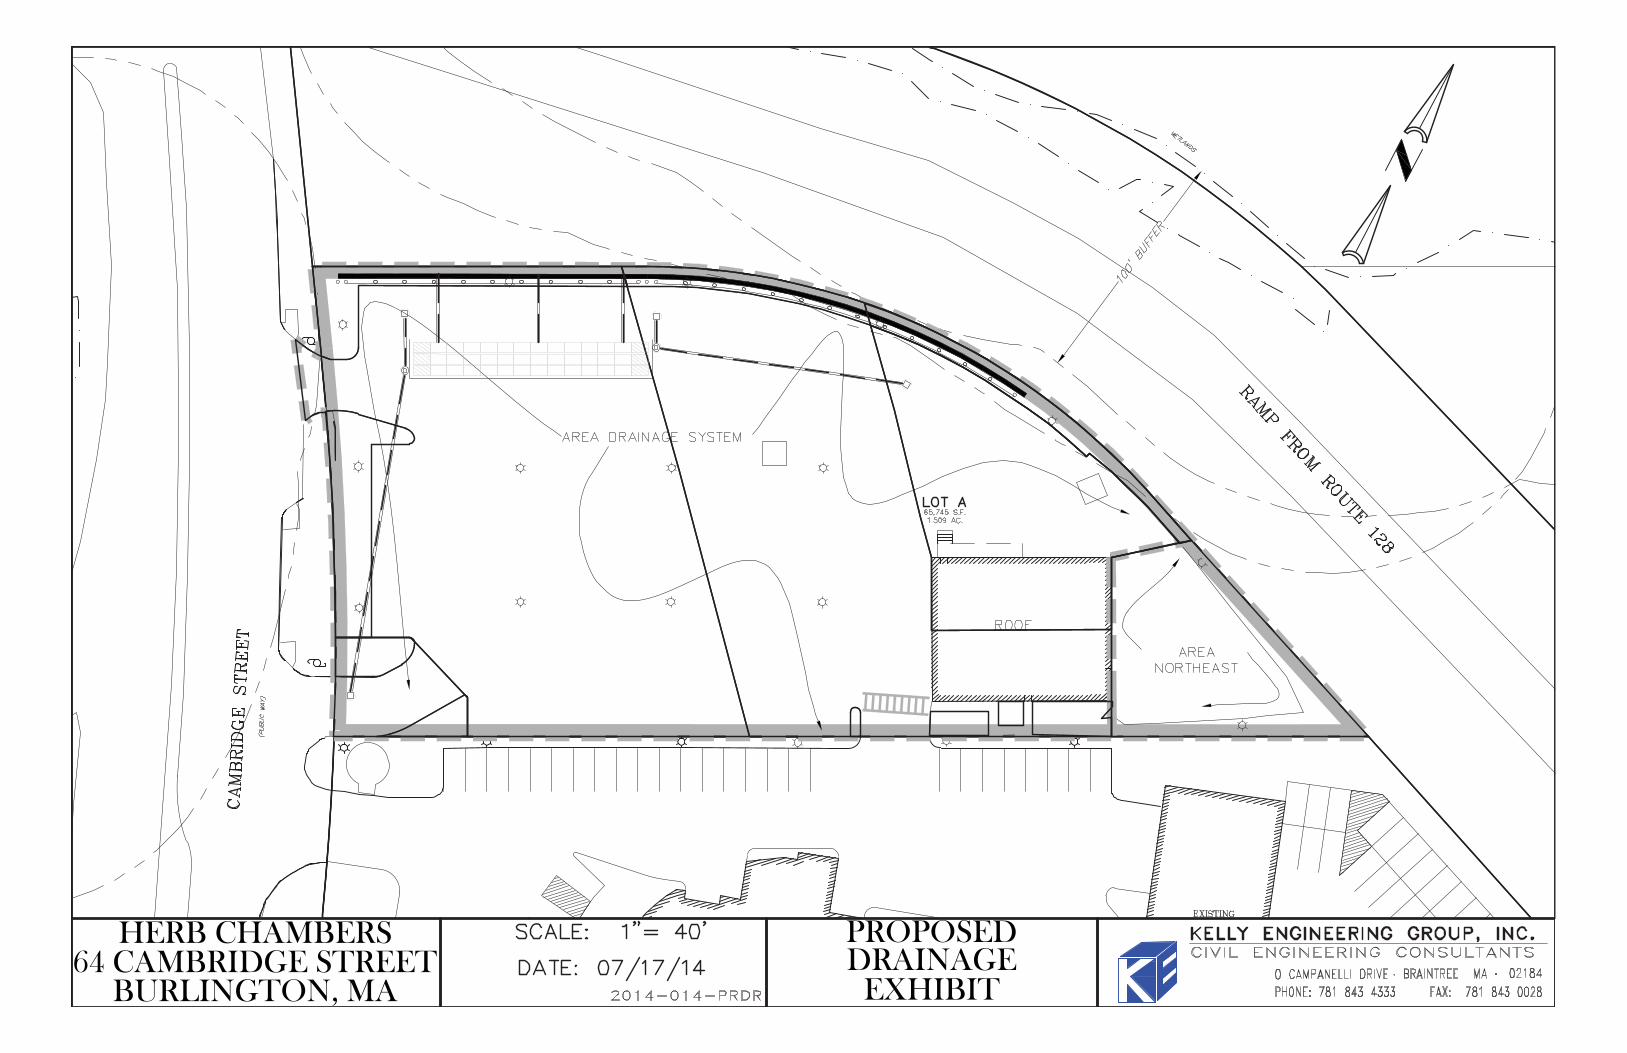
PROPOSED SITE
The proposed project entails the demolition of the existing 13,049 ± s.f. building and the construction of vehicle storage spaces for the adjacent Herb Chambers automobile dealership.
A stormwater management system has been designed to comply with Massachusetts Department of
Page 2
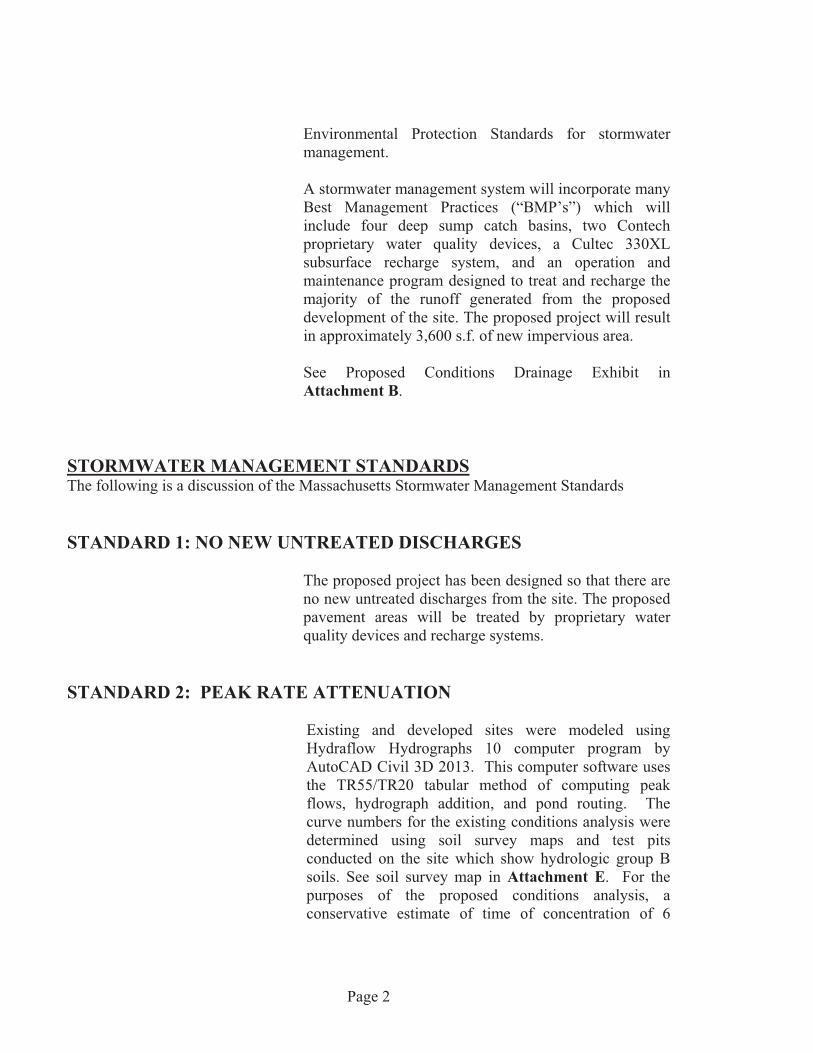
Environmental Protection Standards for stormwater management.
A stormwater management system will incorporate many Best Management Practices (“BMP’s”) which will include four deep sump catch basins, two Contech proprietary water quality devices, a Cultec 330XL subsurface recharge system, and an operation and maintenance program designed to treat and recharge the majority of the runoff generated from the proposed development of the site. The proposed project will result in approximately 3,600 s.f. of new impervious area.
See Proposed Conditions Drainage Exhibit in Attachment B.
STORMWATER MANAGEMENT STANDARDS The following is a discussion of the Massachusetts Stormwater Management Standards
STANDARD 1: NO NEW UNTREATED DISCHARGES
The proposed project has been designed so that there are no new untreated discharges from the site. The proposed pavement areas will be treated by proprietary water quality devices and recharge systems.
STANDARD 2: PEAK RATE ATTENUATION
Existing and developed sites were modeled using Hydraflow Hydrographs 10 computer program by AutoCAD Civil 3D 2013. This computer software uses the TR55/TR20 tabular method of computing peak flows, hydrograph addition, and pond routing. The curve numbers for the existing conditions analysis were determined using soil survey maps and test pits conducted on the site which show hydrologic group B soils. See soil survey map in Attachment E. For the purposes of the proposed conditions analysis, a conservative estimate of time of concentration of 6

Page 3
minutes was assumed for the proposed conditions analysis.
As can be seen from the summary chart below, the peak flows from the design storm on the site will be reduced as a result of this project. Peak flow mitigation will be provided within the infiltration basins.
The entire TR55 analysis is included in Attachment A (existing conditions) and B (proposed conditions) ofthis report.
Peak Runoff Chart
Storm�(yr,�inches) Existing�(cfs) Proposed�(cfs) Difference�(cfs)2,�3.1 3.75 3.00 �0.765,4.5 5.84 4.81 �1.0325,5.3 7.02 5.66 �1.3650,5.9 7.91 6.30 �1.61100,�6.5 8.80 6.97 �1.83
STANDARD 3: RECHARGE
The project site contains hydrologic group B soils according to the NRCS soil maps. Based on DEP guidelines for recharge, the required recharge volume for hydrologic group B soils is 0.35”. The total additional impervious area on the proposed site is approximately 3,600 s.f.
Required = 3,600 s.f. X 0.35 in. X 1 ft/ 12 in. = 105 cubic feet
The dedicated recharge volume has been provided in the stone beneath the recharge chambers. The provided recharge volumes for the infiltration basins were calculated using Hydraflow Hydrographs Extension for AutoCAD Civil 3D 2013 Version 10.
Provided recharge volume = 16’W * 101.5’L * 6”D * 0.35 = 284 cu.ft.
Page 4
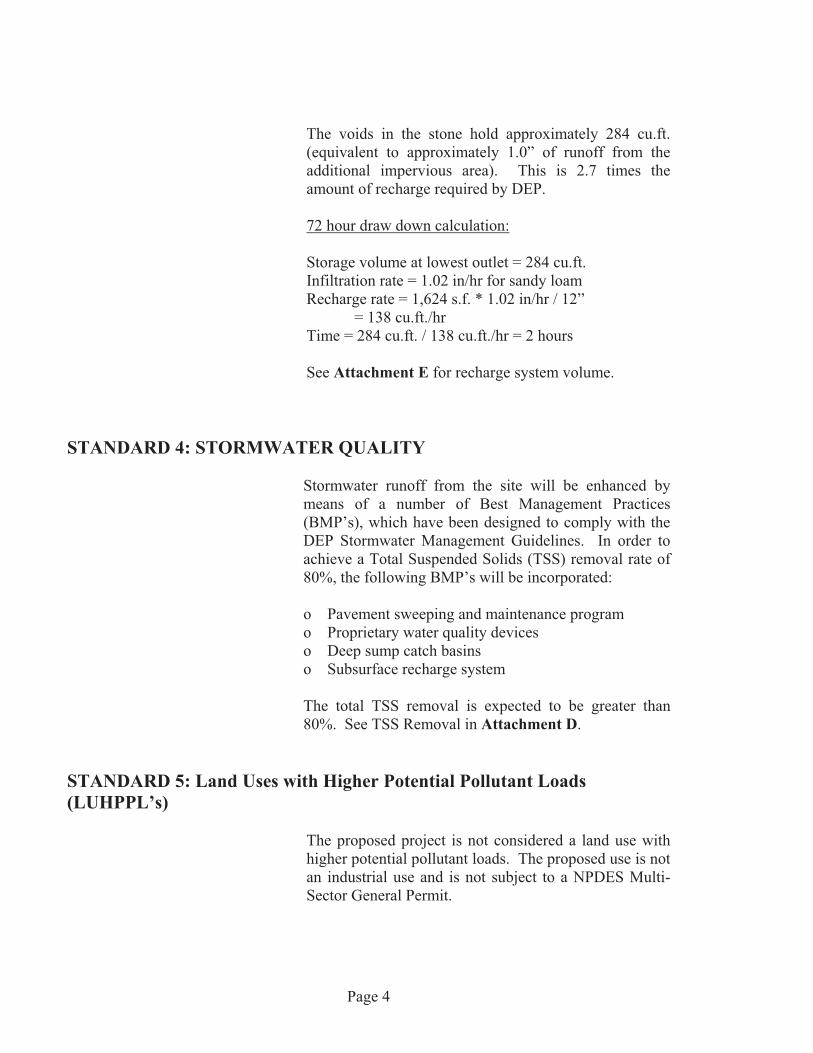
The voids in the stone hold approximately 284 cu.ft. (equivalent to approximately 1.0” of runoff from the additional impervious area). This is 2.7 times the amount of recharge required by DEP.
72 hour draw down calculation:
Storage volume at lowest outlet = 284 cu.ft. Infiltration rate = 1.02 in/hr for sandy loam Recharge rate = 1,624 s.f. * 1.02 in/hr / 12”
= 138 cu.ft./hr Time = 284 cu.ft. / 138 cu.ft./hr = 2 hours
See Attachment E for recharge system volume.
STANDARD 4: STORMWATER QUALITY
Stormwater runoff from the site will be enhanced by means of a number of Best Management Practices (BMP’s), which have been designed to comply with the DEP Stormwater Management Guidelines. In order to achieve a Total Suspended Solids (TSS) removal rate of 80%, the following BMP’s will be incorporated:
o Pavement sweeping and maintenance program o Proprietary water quality deviceso Deep sump catch basins o Subsurface recharge system
The total TSS removal is expected to be greater than 80%. See TSS Removal in Attachment D.
STANDARD 5: Land Uses with Higher Potential Pollutant Loads (LUHPPL’s)
The proposed project is not considered a land use with higher potential pollutant loads. The proposed use is not an industrial use and is not subject to a NPDES Multi-Sector General Permit.

Page 5
STANDARD 6: CRITICAL AREAS
The site is located in a Zone II aquifer protection area associated with the Mystic River Basin. 1” water quality depth has been provided in the Contech proprietary water quality devices. The area is not in an area of critical environmental concern.
STANDARD 7: REDEVELOPMENT
The proposed project constitutes both redevelopment and new development.
STANDARD 8: CONSTRUCTION PERIOD POLLUTION PREVENTION AND EROSION CONTROL
A construction phasing plan will be established when a site contractor is consulted. At that time a construction phasing plan and the associated Stormwater Pollution Prevention Plan will be prepared and submitted to the Town of Burlington and the EPA.
STANDARD 9: OPERATIONS AND MAINTENANCE PLAN
The Stormwater Management System Operation and Maintenance Plan and Long Term Pollution Prevention Plan, Operations and Maintenance Log, and BMP Location Map are provided in Attachment D.
STANDARD 10: ILLICIT DISCHARGES
An Illicit Discharge Statement is attached. The Long Term Pollution Prevention Plan can be found in Attachment D.

Page 6
HYDROLOGY AND HYDRAULICS:
Hydraulics:
Drain pipe sizing were designed by means of the Rational Method and based on a 25-year recurrence interval.
The Rational Method is based on the following formula:
Q=CiAWhere:
Q = Peak Rate of Runoff in Cubic Feet per Second C = Coefficient of Runoff i = Rainfall Intensity in Inches per Hour (A value 6.0 inches per hour was used per TP-40) A = Drainage Area in Acres
The values that have been used in the Rational Method formula to calculate the peak rate of runoff for this project are as follows:
C= Runoff Coefficients:
For our analysis, we used the following runoff coefficients: C = 0.90 for paved areas andC = 0.40 for grass, woods, and landscaping areas.
Tc = Time of Concentration Considering the fact that almost the whole site is paved, a Time of Concentration of 5 minutes has been used to determine rainfall intensity. This will give conservative estimates for peak runoff.
A = Drainage Area Drainage divide lines were determined by using Site Topographic

Page 7
Maps and the proposed grading plan prepared by this office. Existing watershed boundaries were verified by existing topographic information and by field inspection.
Storm drains were designed using the Manning formula.
Q = 1.49R2/3 A S1/2
n
Where
Q = Capacity of Pipe flowing full in cubic feet per second.R = Hydraulic radius n = Manning’s Resistance Coefficient (For our computation, we used n = .011 for HDPE) A = Cross sectional area of the pipe in square feet S = Slope of the pipe in feet per feet
The entire Rational Method and Manning’s Calculation is included in Attachment D.
CONCLUSION
An extensive stormwater management system has been designed for the project. The stormwater management system has been designed to comply with current (DEP) standards and will incorporate a number of Best Management Practices (“BMP’s”) that will ensure that the runoff will be treated prior to leaving the site.
The construction of the stormwater management system will ensure that stormwater runoff from this site will be of high quality and that there will be no adverse impacts on surrounding properties or resource areas.

swcheck • 04/01/08 Stormwater Report Checklist • Page 1 of 8
Massachusetts Department of Environmental ProtectionBureau of Resource Protection - Wetlands Program
Checklist for Stormwater ReportA. Introduction
Important: When filling out forms on the computer, use only the tab key to move your cursor - do not use the return key.
A Stormwater Report must be submitted with the Notice of Intent permit application to document compliance with the Stormwater Management Standards. The following checklist is NOT a substitute for the Stormwater Report (which should provide more substantive and detailed information) but is offered here as a tool to help the applicant organize their Stormwater Management documentation for their Report and for the reviewer to assess this information in a consistent format. As noted in the Checklist, the Stormwater Report must contain the engineering computations and supporting information set forth in Volume 3 of the Massachusetts Stormwater Handbook. The Stormwater Report must be prepared and certified by a Registered Professional Engineer (RPE) licensed in the Commonwealth.
The Stormwater Report must include: � The Stormwater Checklist completed and stamped by a Registered Professional Engineer (see
page 2) that certifies that the Stormwater Report contains all required submittals.1 This Checklist is to be used as the cover for the completed Stormwater Report.
� Applicant/Project Name � Project Address � Name of Firm and Registered Professional Engineer that prepared the Report � Long-Term Pollution Prevention Plan required by Standards 4-6 � Construction Period Pollution Prevention and Erosion and Sedimentation Control Plan required
by Standard 82
� Operation and Maintenance Plan required by Standard 9
In addition to all plans and supporting information, the Stormwater Report must include a brief narrative describing stormwater management practices, including environmentally sensitive site design and LID techniques, along with a diagram depicting runoff through the proposed BMP treatment train. Plans are required to show existing and proposed conditions, identify all wetland resource areas, NRCS soil types, critical areas, Land Uses with Higher Potential Pollutant Loads (LUHPPL), and any areas on the site where infiltration rate is greater than 2.4 inches per hour. The Plans shall identify the drainage areas for both existing and proposed conditions at a scale that enables verification of supporting calculations.
As noted in the Checklist, the Stormwater Management Report shall document compliance with each of the Stormwater Management Standards as provided in the Massachusetts Stormwater Handbook. The soils evaluation and calculations shall be done using the methodologies set forth in Volume 3 of the Massachusetts Stormwater Handbook.
To ensure that the Stormwater Report is complete, applicants are required to fill in the Stormwater Report Checklist by checking the box to indicate that the specified information has been included in the Stormwater Report. If any of the information specified in the checklist has not been submitted, the applicant must provide an explanation. The completed Stormwater Report Checklist and Certification must be submitted with the Stormwater Report.
1 The Stormwater Report may also include the Illicit Discharge Compliance Statement required by Standard 10. If not included inthe Stormwater Report, the Illicit Discharge Compliance Statement must be submitted prior to the discharge of stormwater runoff to the post-construction best management practices.
2 For some complex projects, it may not be possible to include the Construction Period Erosion and Sedimentation Control Plan inthe Stormwater Report. In that event, the issuing authority has the discretion to issue an Order of Conditions that approves theproject and includes a condition requiring the proponent to submit the Construction Period Erosion and Sedimentation Control Planbefore commencing any land disturbance activity on the site.

swcheck • 04/01/08 Stormwater Report Checklist • Page 2 of 8
Massachusetts Department of Environmental ProtectionBureau of Resource Protection - Wetlands Program
Checklist for Stormwater ReportB. Stormwater Checklist and Certification The following checklist is intended to serve as a guide for applicants as to the elements that ordinarily need to be addressed in a complete Stormwater Report. The checklist is also intended to provide conservation commissions and other reviewing authorities with a summary of the components necessary for a comprehensive Stormwater Report that addresses the ten Stormwater Standards.
Note: Because stormwater requirements vary from project to project, it is possible that a complete Stormwater Report may not include information on some of the subjects specified in the Checklist. If it is determined that a specific item does not apply to the project under review, please note that the item is not applicable (N.A.) and provide the reasons for that determination.
A complete checklist must include the Certification set forth below signed by the Registered Professional Engineer who prepared the Stormwater Report.
Registered Professional Engineer’s Certification I have reviewed the Stormwater Report, including the soil evaluation, computations, Long-term Pollution Prevention Plan, the Construction Period Erosion and Sedimentation Control Plan (if included), the Long-term Post-Construction Operation and Maintenance Plan, the Illicit Discharge Compliance Statement (if included) and the plans showing the stormwater management system, and have determined that they have been prepared in accordance with the requirements of the Stormwater Management Standards as further elaborated by the Massachusetts Stormwater Handbook. I have also determined that the information presented in the Stormwater Checklist is accurate and that the information presented in the Stormwater Report accurately reflects conditions at the site as of the date of this permit application.
Registered Professional Engineer Block and Signature
Signature and Date
ChecklistProject Type: Is the application for new development, redevelopment, or a mix of new and redevelopment?
New development
Redevelopment
Mix of New Development and Redevelopment
DAVIDNOELKELLYCIVIL
David Noel Kelly 2014.07.22 10:24:37 -04'00'

swcheck • 04/01/08 Stormwater Report Checklist • Page 3 of 8
Massachusetts Department of Environmental ProtectionBureau of Resource Protection - Wetlands Program
Checklist for Stormwater ReportChecklist (continued)
LID Measures: Stormwater Standards require LID measures to be considered. Document what environmentally sensitive design and LID Techniques were considered during the planning and design of the project:
No disturbance to any Wetland Resource Areas
Site Design Practices (e.g. clustered development, reduced frontage setbacks)
Reduced Impervious Area (Redevelopment Only)
Minimizing disturbance to existing trees and shrubs
LID Site Design Credit Requested:
Credit 1
Credit 2
Credit 3
Use of “country drainage” versus curb and gutter conveyance and pipe
Bioretention Cells (includes Rain Gardens)
Constructed Stormwater Wetlands (includes Gravel Wetlands designs)
Treebox Filter
Water Quality Swale
Grass Channel
Green Roof
Other (describe):
Standard 1: No New Untreated Discharges
No new untreated discharges
Outlets have been designed so there is no erosion or scour to wetlands and waters of the Commonwealth
Supporting calculations specified in Volume 3 of the Massachusetts Stormwater Handbook included.
swcheck • 04/01/08 Stormwater Report Checklist • Page 4 of 8
Massachusetts Department of Environmental ProtectionBureau of Resource Protection - Wetlands Program
Checklist for Stormwater ReportChecklist (continued)
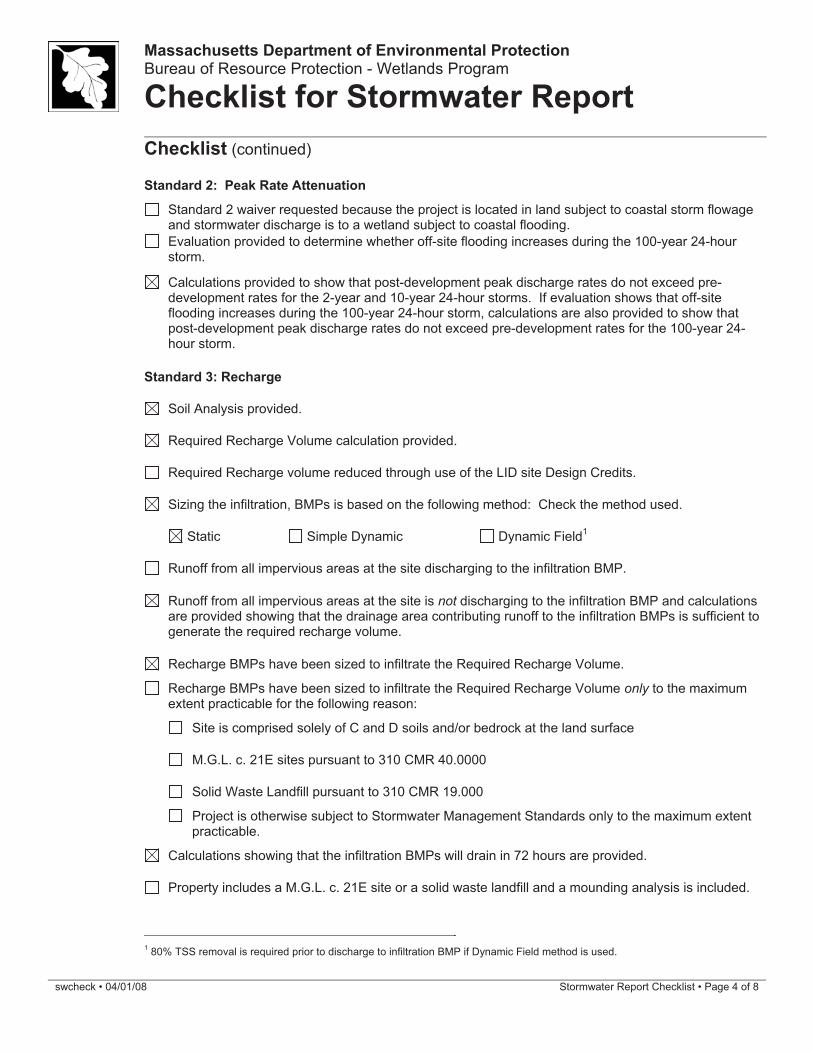
Standard 2: Peak Rate Attenuation
Standard 2 waiver requested because the project is located in land subject to coastal storm flowage and stormwater discharge is to a wetland subject to coastal flooding.
Evaluation provided to determine whether off-site flooding increases during the 100-year 24-hour storm.
Calculations provided to show that post-development peak discharge rates do not exceed pre-development rates for the 2-year and 10-year 24-hour storms. If evaluation shows that off-site flooding increases during the 100-year 24-hour storm, calculations are also provided to show that post-development peak discharge rates do not exceed pre-development rates for the 100-year 24-hour storm.
Standard 3: Recharge
Soil Analysis provided.
Required Recharge Volume calculation provided.
Required Recharge volume reduced through use of the LID site Design Credits.
Sizing the infiltration, BMPs is based on the following method: Check the method used.
Static Simple Dynamic Dynamic Field1
Runoff from all impervious areas at the site discharging to the infiltration BMP.
Runoff from all impervious areas at the site is not discharging to the infiltration BMP and calculations are provided showing that the drainage area contributing runoff to the infiltration BMPs is sufficient to generate the required recharge volume.
Recharge BMPs have been sized to infiltrate the Required Recharge Volume.
Recharge BMPs have been sized to infiltrate the Required Recharge Volume only to the maximum extent practicable for the following reason:
Site is comprised solely of C and D soils and/or bedrock at the land surface
M.G.L. c. 21E sites pursuant to 310 CMR 40.0000
Solid Waste Landfill pursuant to 310 CMR 19.000
Project is otherwise subject to Stormwater Management Standards only to the maximum extent practicable.
Calculations showing that the infiltration BMPs will drain in 72 hours are provided.
Property includes a M.G.L. c. 21E site or a solid waste landfill and a mounding analysis is included.
1 80% TSS removal is required prior to discharge to infiltration BMP if Dynamic Field method is used.

swcheck • 04/01/08 Stormwater Report Checklist • Page 5 of 8
Massachusetts Department of Environmental ProtectionBureau of Resource Protection - Wetlands Program
Checklist for Stormwater ReportChecklist (continued)
Standard 3: Recharge (continued)
The infiltration BMP is used to attenuate peak flows during storms greater than or equal to the 10-year 24-hour storm and separation to seasonal high groundwater is less than 4 feet and a mounding analysis is provided.
Documentation is provided showing that infiltration BMPs do not adversely impact nearby wetland resource areas.
Standard 4: Water Quality
The Long-Term Pollution Prevention Plan typically includes the following: � Good housekeeping practices; � Provisions for storing materials and waste products inside or under cover; � Vehicle washing controls; � Requirements for routine inspections and maintenance of stormwater BMPs; � Spill prevention and response plans; � Provisions for maintenance of lawns, gardens, and other landscaped areas; � Requirements for storage and use of fertilizers, herbicides, and pesticides; � Pet waste management provisions; � Provisions for operation and management of septic systems; � Provisions for solid waste management; � Snow disposal and plowing plans relative to Wetland Resource Areas; � Winter Road Salt and/or Sand Use and Storage restrictions; � Street sweeping schedules; � Provisions for prevention of illicit discharges to the stormwater management system; � Documentation that Stormwater BMPs are designed to provide for shutdown and containment in the
event of a spill or discharges to or near critical areas or from LUHPPL; � Training for staff or personnel involved with implementing Long-Term Pollution Prevention Plan; � List of Emergency contacts for implementing Long-Term Pollution Prevention Plan.
A Long-Term Pollution Prevention Plan is attached to Stormwater Report and is included as an attachment to the Wetlands Notice of Intent.
Treatment BMPs subject to the 44% TSS removal pretreatment requirement and the one inch rule for calculating the water quality volume are included, and discharge:
is within the Zone II or Interim Wellhead Protection Area
is near or to other critical areas
is within soils with a rapid infiltration rate (greater than 2.4 inches per hour)
involves runoff from land uses with higher potential pollutant loads.
The Required Water Quality Volume is reduced through use of the LID site Design Credits.
Calculations documenting that the treatment train meets the 80% TSS removal requirement and, if applicable, the 44% TSS removal pretreatment requirement, are provided.

swcheck • 04/01/08 Stormwater Report Checklist • Page 6 of 8
Massachusetts Department of Environmental ProtectionBureau of Resource Protection - Wetlands Program
Checklist for Stormwater ReportChecklist (continued)
Standard 4: Water Quality (continued)
The BMP is sized (and calculations provided) based on:
The ½” or 1” Water Quality Volume or
The equivalent flow rate associated with the Water Quality Volume and documentation is provided showing that the BMP treats the required water quality volume.
The applicant proposes to use proprietary BMPs, and documentation supporting use of proprietary BMP and proposed TSS removal rate is provided. This documentation may be in the form of the propriety BMP checklist found in Volume 2, Chapter 4 of the Massachusetts Stormwater Handbook and submitting copies of the TARP Report, STEP Report, and/or other third party studies verifying performance of the proprietary BMPs.
A TMDL exists that indicates a need to reduce pollutants other than TSS and documentation showing that the BMPs selected are consistent with the TMDL is provided.
Standard 5: Land Uses With Higher Potential Pollutant Loads (LUHPPLs)
The NPDES Multi-Sector General Permit covers the land use and the Stormwater Pollution Prevention Plan (SWPPP) has been included with the Stormwater Report.
The NPDES Multi-Sector General Permit covers the land use and the SWPPP will be submitted priorto the discharge of stormwater to the post-construction stormwater BMPs.
The NPDES Multi-Sector General Permit does not cover the land use.
LUHPPLs are located at the site and industry specific source control and pollution prevention measures have been proposed to reduce or eliminate the exposure of LUHPPLs to rain, snow, snow melt and runoff, and been included in the long term Pollution Prevention Plan.
All exposure has been eliminated.
All exposure has not been eliminated and all BMPs selected are on MassDEP LUHPPL list.
The LUHPPL has the potential to generate runoff with moderate to higher concentrations of oil and grease (e.g. all parking lots with >1000 vehicle trips per day) and the treatment train includes an oil grit separator, a filtering bioretention area, a sand filter or equivalent.
Standard 6: Critical Areas
The discharge is near or to a critical area and the treatment train includes only BMPs that MassDEP has approved for stormwater discharges to or near that particular class of critical area.
Critical areas and BMPs are identified in the Stormwater Report.

swcheck • 04/01/08 Stormwater Report Checklist • Page 7 of 8
Massachusetts Department of Environmental ProtectionBureau of Resource Protection - Wetlands Program
Checklist for Stormwater ReportChecklist (continued)
Standard 7: Redevelopments and Other Projects Subject to the Standards only to the maximum extent practicable
The project is subject to the Stormwater Management Standards only to the maximum Extent Practicable as a:
Limited Project
Small Residential Projects: 5-9 single family houses or 5-9 units in a multi-family development provided there is no discharge that may potentially affect a critical area.
Small Residential Projects: 2-4 single family houses or 2-4 units in a multi-family development with a discharge to a critical area
Marina and/or boatyard provided the hull painting, service and maintenance areas are protected from exposure to rain, snow, snow melt and runoff
Bike Path and/or Foot Path
Redevelopment Project
Redevelopment portion of mix of new and redevelopment.
Certain standards are not fully met (Standard No. 1, 8, 9, and 10 must always be fully met) and an explanation of why these standards are not met is contained in the Stormwater Report.
The project involves redevelopment and a description of all measures that have been taken to improve existing conditions is provided in the Stormwater Report. The redevelopment checklist found in Volume 2 Chapter 3 of the Massachusetts Stormwater Handbook may be used to document that the proposed stormwater management system (a) complies with Standards 2, 3 and the pretreatment and structural BMP requirements of Standards 4-6 to the maximum extent practicable and (b) improves existing conditions.
Standard 8: Construction Period Pollution Prevention and Erosion and Sedimentation Control
A Construction Period Pollution Prevention and Erosion and Sedimentation Control Plan must include the following information:
� Narrative; � Construction Period Operation and Maintenance Plan; � Names of Persons or Entity Responsible for Plan Compliance; � Construction Period Pollution Prevention Measures; � Erosion and Sedimentation Control Plan Drawings; � Detail drawings and specifications for erosion control BMPs, including sizing calculations; � Vegetation Planning; � Site Development Plan; � Construction Sequencing Plan; � Sequencing of Erosion and Sedimentation Controls; � Operation and Maintenance of Erosion and Sedimentation Controls; � Inspection Schedule; � Maintenance Schedule; � Inspection and Maintenance Log Form.
A Construction Period Pollution Prevention and Erosion and Sedimentation Control Plan containing the information set forth above has been included in the Stormwater Report.

swcheck • 04/01/08 Stormwater Report Checklist • Page 8 of 8
Massachusetts Department of Environmental ProtectionBureau of Resource Protection - Wetlands Program
Checklist for Stormwater ReportChecklist (continued)
Standard 8: Construction Period Pollution Prevention and Erosion and Sedimentation Control(continued)
The project is highly complex and information is included in the Stormwater Report that explains why it is not possible to submit the Construction Period Pollution Prevention and Erosion and Sedimentation Control Plan with the application. A Construction Period Pollution Prevention and Erosion and Sedimentation Control has not been included in the Stormwater Report but will be submitted before land disturbance begins.
The project is not covered by a NPDES Construction General Permit.
The project is covered by a NPDES Construction General Permit and a copy of the SWPPP is in the Stormwater Report.
The project is covered by a NPDES Construction General Permit but no SWPPP been submitted. The SWPPP will be submitted BEFORE land disturbance begins.
Standard 9: Operation and Maintenance Plan
The Post Construction Operation and Maintenance Plan is included in the Stormwater Report and includes the following information:
Name of the stormwater management system owners;
Party responsible for operation and maintenance;
Schedule for implementation of routine and non-routine maintenance tasks;
Plan showing the location of all stormwater BMPs maintenance access areas;
Description and delineation of public safety features;
Estimated operation and maintenance budget; and
Operation and Maintenance Log Form.
The responsible party is not the owner of the parcel where the BMP is located and the Stormwater Report includes the following submissions:
A copy of the legal instrument (deed, homeowner’s association, utility trust or other legal entity) that establishes the terms of and legal responsibility for the operation and maintenance of the project site stormwater BMPs;
A plan and easement deed that allows site access for the legal entity to operate and maintain BMP functions.
Standard 10: Prohibition of Illicit Discharges
The Long-Term Pollution Prevention Plan includes measures to prevent illicit discharges;
An Illicit Discharge Compliance Statement is attached;
NO Illicit Discharge Compliance Statement is attached but will be submitted prior to the discharge of any stormwater to post-construction BMPs.


RUNOFF SUMMARY
Herb Chambers - 64 Cambridge St. Burlington, MA
Peak Runoff Chart
Area NorthStorm Existing Proposed Difference
(yr, inches) (cfs) (cfs) (cfs)2,3.1 3.12 3 -0.12
10,4.5 4.84 4.81 -0.0325,5.3 5.8 5.66 -0.1450,5.9 6.53 6.3 -0.23100,6.5 7.25 7 -0.25
Area WestStorm Existing Proposed Difference
(yr, inches) (cfs) (cfs) (cfs)2,3.1 0.16 0 -0.16
10,4.5 0.31 0 -0.3125,5.3 0.4 0 -0.450,5.9 0.48 0 -0.48100,6.5 0.55 0 -0.55
Area SouthStorm Existing Proposed Difference
(yr, inches) (cfs) (cfs) (cfs)2,3.1 0.47 0 -0.47
10,4.5 0.69 0 -0.6925,5.3 0.81 0 -0.8150,5.9 0.91 0 -0.91100,6.5 1 0 -1


KELLY ENGINEERING GROUP, INC. Zero Campanelli Drive-Braintree-MA 02184 Phone 781 843 4333
Attachment AExisting Conditions

������������������ ��
������ ��������� ������������
�� ����� ��
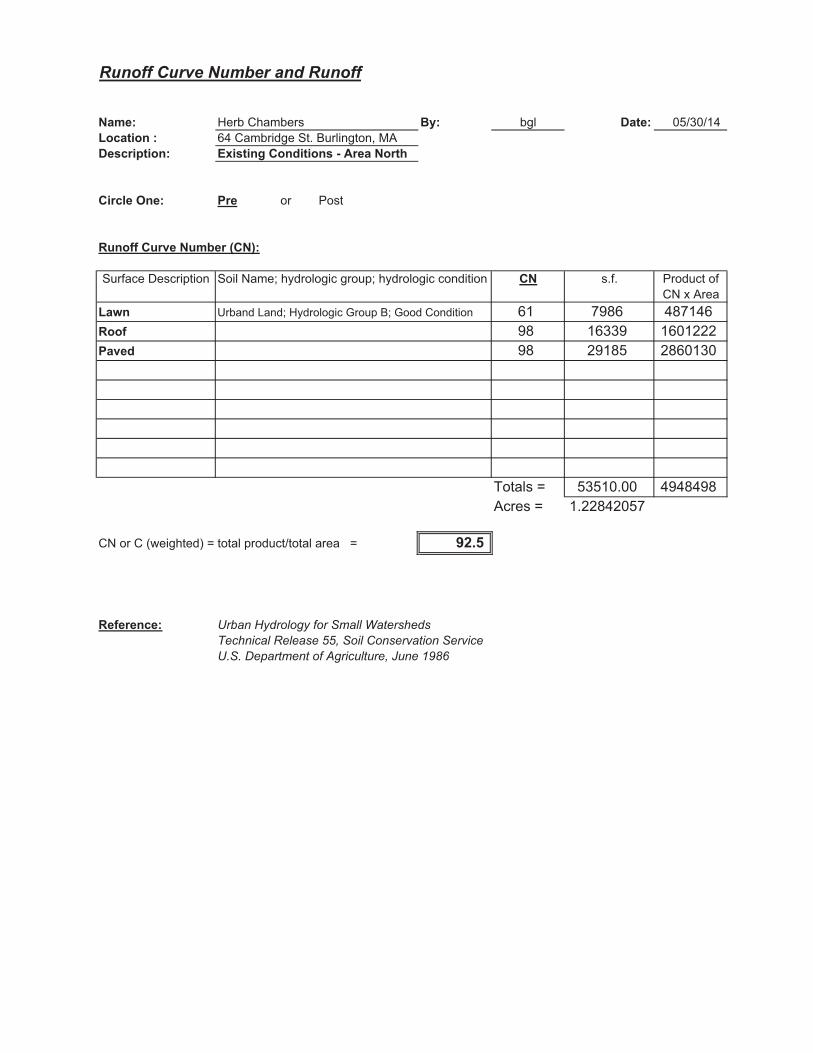
Runoff Curve Number and Runoff
Name: Herb Chambers By: bgl Date: 05/30/14Location : 64 Cambridge St. Burlington, MADescription: Existing Conditions - Area North
Circle One: Pre or Post
Runoff Curve Number (CN):
Surface Description Soil Name; hydrologic group; hydrologic condition CN s.f. Product ofCN x Area
Lawn Urband Land; Hydrologic Group B; Good Condition 61 7986 487146Roof 98 16339 1601222Paved 98 29185 2860130
Totals = 53510.00 4948498Acres = 1.22842057
CN or C (weighted) = total product/total area = 92.5
Reference: Urban Hydrology for Small WatershedsTechnical Release 55, Soil Conservation ServiceU.S. Department of Agriculture, June 1986

Runoff Curve Number and Runoff
Name: Herb Chambers By: bgl Date: 05/30/14Location : 64 Cambridge St. Burlington, MADescription: Existing Conditions - Area West
Circle One: Pre or Post
Runoff Curve Number (CN):
Surface Description Soil Name; hydrologic group; hydrologic condition CN s.f. Product ofCN x Area
Lawn Urband Land; Hydrologic Group B; Good Condition 61 3084 188124Roof 98 0 0Paved 98 2302 225596
Totals = 5386.00 413720Acres = 0.12364555
CN or C (weighted) = total product/total area = 76.8
Reference: Urban Hydrology for Small WatershedsTechnical Release 55, Soil Conservation ServiceU.S. Department of Agriculture, June 1986

Runoff Curve Number and Runoff
Name: Herb Chambers By: bgl Date: 05/30/14Location : 64 Cambridge St. Burlington, MADescription: Existing Conditions - Area South
Circle One: Pre or Post
Runoff Curve Number (CN):
Surface Description Soil Name; hydrologic group; hydrologic condition CN s.f. Product ofCN x Area
Lawn Urband Land; Hydrologic Group B; Good Condition 61 0 0Roof 98 1216 119168Paved 98 5896 577808
Totals = 7112.00 696976Acres = 0.16326905
CN or C (weighted) = total product/total area = 98.0
Reference: Urban Hydrology for Small WatershedsTechnical Release 55, Soil Conservation ServiceU.S. Department of Agriculture, June 1986

1 2 3
4
1
Watershed Model SchematicHydraflow Hydrographs Extension for AutoCAD® Civil 3D® 2013 by Autodesk, Inc. v10
Project: Pre-Existing Conditions.gpw Thursday, 06 / 26 / 2014
Hyd. Origin Description
Legend
1 SCS Runoff Area North2 SCS Runoff Area West3 SCS Runoff Area South4 Combine Total Exist. Runoff
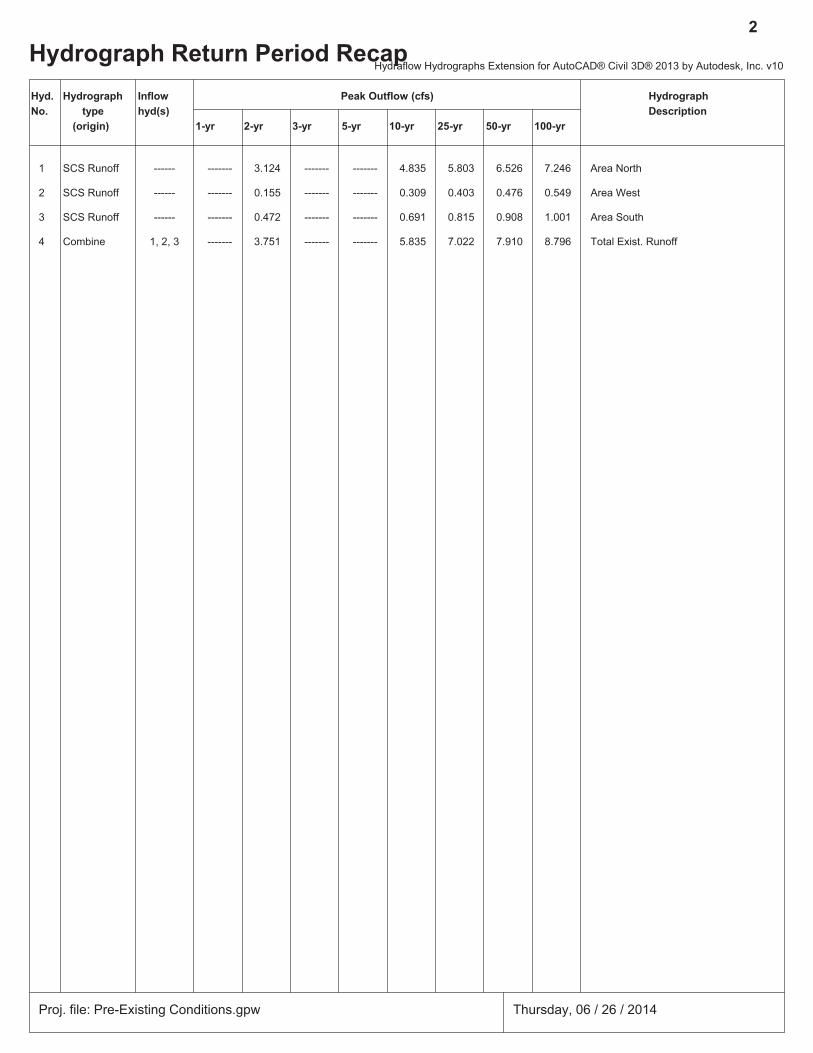
Hydrograph Return Period Recap2
Hyd. Hydrograph Inflow Peak Outflow (cfs) HydrographNo. type hyd(s) Description
(origin) 1-yr 2-yr 3-yr 5-yr 10-yr 25-yr 50-yr 100-yr
1 SCS Runoff ------ ------- 3.124 ------- ------- 4.835 5.803 6.526 7.246 Area North
2 SCS Runoff ------ ------- 0.155 ------- ------- 0.309 0.403 0.476 0.549 Area West
3 SCS Runoff ------ ------- 0.472 ------- ------- 0.691 0.815 0.908 1.001 Area South
4 Combine 1, 2, 3 ------- 3.751 ------- ------- 5.835 7.022 7.910 8.796 Total Exist. Runoff
Proj. file: Pre-Existing Conditions.gpw Thursday, 06 / 26 / 2014
Hydraflow Hydrographs Extension for AutoCAD® Civil 3D® 2013 by Autodesk, Inc. v10

Hydrograph Summary Report3
Hyd. Hydrograph Peak Time Time to Hyd. Inflow Maximum Total HydrographNo. type flow interval Peak volume hyd(s) elevation strge used Description
(origin) (cfs) (min) (min) (cuft) (ft) (cuft)
1 SCS Runoff 3.124 2 724 9,622 ------ ------ ------ Area North
2 SCS Runoff 0.155 2 724 476 ------ ------ ------ Area West
3 SCS Runoff 0.472 2 724 1,591 ------ ------ ------ Area South
4 Combine 3.751 2 724 11,689 1, 2, 3 ------ ------ Total Exist. Runoff
Pre-Existing Conditions.gpw Return Period: 2 Year Thursday, 06 / 26 / 2014
Hydraflow Hydrographs Extension for AutoCAD® Civil 3D® 2013 by Autodesk, Inc. v10

Hydrograph Summary Report4
Hyd. Hydrograph Peak Time Time to Hyd. Inflow Maximum Total HydrographNo. type flow interval Peak volume hyd(s) elevation strge used Description
(origin) (cfs) (min) (min) (cuft) (ft) (cuft)
1 SCS Runoff 4.835 2 724 15,273 ------ ------ ------ Area North
2 SCS Runoff 0.309 2 724 926 ------ ------ ------ Area West
3 SCS Runoff 0.691 2 724 2,365 ------ ------ ------ Area South
4 Combine 5.835 2 724 18,564 1, 2, 3 ------ ------ Total Exist. Runoff
Pre-Existing Conditions.gpw Return Period: 10 Year Thursday, 06 / 26 / 2014
Hydraflow Hydrographs Extension for AutoCAD® Civil 3D® 2013 by Autodesk, Inc. v10

Hydrograph Summary Report5
Hyd. Hydrograph Peak Time Time to Hyd. Inflow Maximum Total HydrographNo. type flow interval Peak volume hyd(s) elevation strge used Description
(origin) (cfs) (min) (min) (cuft) (ft) (cuft)
1 SCS Runoff 5.803 2 724 18,545 ------ ------ ------ Area North
2 SCS Runoff 0.403 2 724 1,206 ------ ------ ------ Area West
3 SCS Runoff 0.815 2 724 2,808 ------ ------ ------ Area South
4 Combine 7.022 2 724 22,559 1, 2, 3 ------ ------ Total Exist. Runoff
Pre-Existing Conditions.gpw Return Period: 25 Year Thursday, 06 / 26 / 2014
Hydraflow Hydrographs Extension for AutoCAD® Civil 3D® 2013 by Autodesk, Inc. v10

Hydrograph Summary Report6
Hyd. Hydrograph Peak Time Time to Hyd. Inflow Maximum Total HydrographNo. type flow interval Peak volume hyd(s) elevation strge used Description
(origin) (cfs) (min) (min) (cuft) (ft) (cuft)
1 SCS Runoff 6.526 2 724 21,010 ------ ------ ------ Area North
2 SCS Runoff 0.476 2 724 1,423 ------ ------ ------ Area West
3 SCS Runoff 0.908 2 724 3,141 ------ ------ ------ Area South
4 Combine 7.910 2 724 25,574 1, 2, 3 ------ ------ Total Exist. Runoff
Pre-Existing Conditions.gpw Return Period: 50 Year Thursday, 06 / 26 / 2014
Hydraflow Hydrographs Extension for AutoCAD® Civil 3D® 2013 by Autodesk, Inc. v10
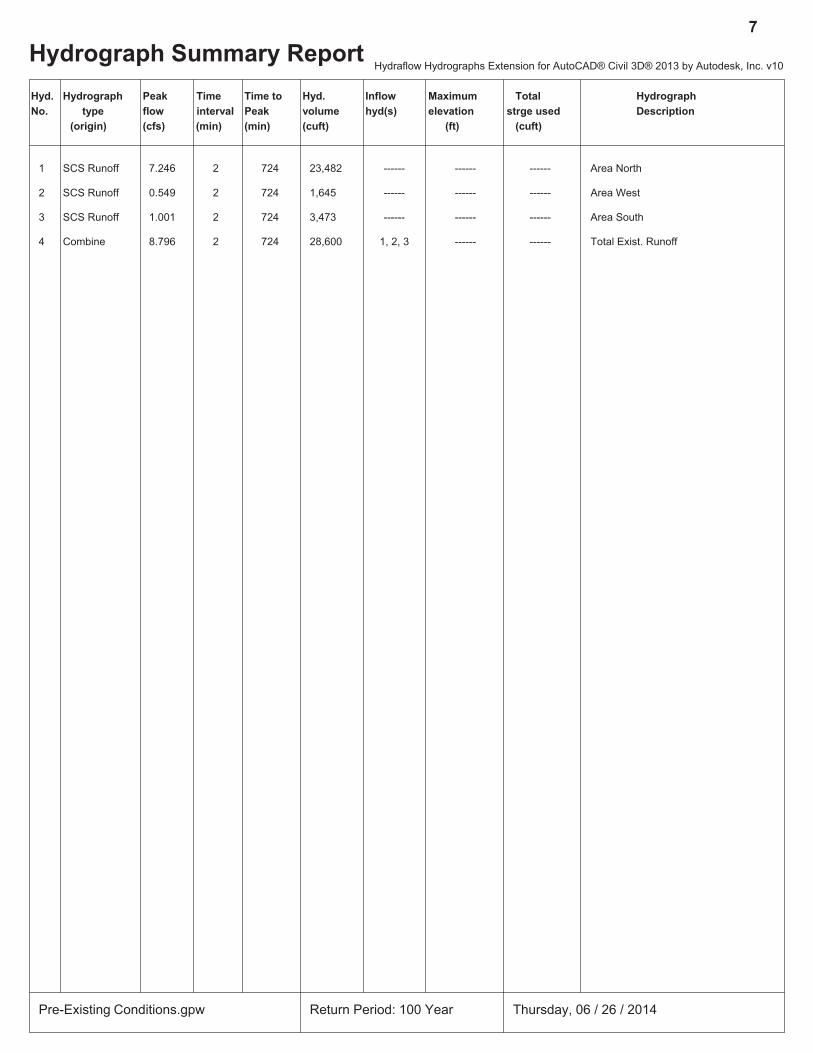
Hydrograph Summary Report7
Hyd. Hydrograph Peak Time Time to Hyd. Inflow Maximum Total HydrographNo. type flow interval Peak volume hyd(s) elevation strge used Description
(origin) (cfs) (min) (min) (cuft) (ft) (cuft)
1 SCS Runoff 7.246 2 724 23,482 ------ ------ ------ Area North
2 SCS Runoff 0.549 2 724 1,645 ------ ------ ------ Area West
3 SCS Runoff 1.001 2 724 3,473 ------ ------ ------ Area South
4 Combine 8.796 2 724 28,600 1, 2, 3 ------ ------ Total Exist. Runoff
Pre-Existing Conditions.gpw Return Period: 100 Year Thursday, 06 / 26 / 2014
Hydraflow Hydrographs Extension for AutoCAD® Civil 3D® 2013 by Autodesk, Inc. v10

Hydraflow Rainfall Report8
Hydraflow Hydrographs Extension for AutoCAD® Civil 3D® 2013 by Autodesk, Inc. v10 Thursday, 06 / 26 / 2014
Return Intensity-Duration-Frequency Equation Coefficients (FHA)Period(Yrs) B D E (N/A)
1 0.0000 0.0000 0.0000 --------
2 42.4120 9.2500 0.7886 --------
3 0.0000 0.0000 0.0000 --------
5 56.7673 11.0000 0.7948 --------
10 67.9290 12.0000 0.8012 --------
25 85.5668 13.2500 0.8118 --------
50 97.8027 13.7500 0.8148 --------
100 112.8269 14.5000 0.8222 --------
File name: Sample.IDF
Intensity = B / (Tc + D)^E
Return Intensity Values (in/hr)Period
(Yrs) 5 min 10 15 20 25 30 35 40 45 50 55 60
1 0.00 0.00 0.00 0.00 0.00 0.00 0.00 0.00 0.00 0.00 0.00 0.00
2 5.22 4.12 3.43 2.96 2.61 2.35 2.14 1.96 1.82 1.70 1.59 1.50
3 0.00 0.00 0.00 0.00 0.00 0.00 0.00 0.00 0.00 0.00 0.00 0.00
5 6.27 5.05 4.26 3.70 3.29 2.97 2.71 2.49 2.32 2.16 2.03 1.92
10 7.02 5.71 4.84 4.23 3.76 3.40 3.11 2.87 2.66 2.49 2.34 2.21
25 8.10 6.65 5.68 4.98 4.44 4.02 3.68 3.39 3.16 2.95 2.78 2.62
50 8.98 7.40 6.34 5.56 4.97 4.50 4.12 3.81 3.54 3.31 3.11 2.94
100 9.81 8.13 6.98 6.14 5.49 4.98 4.56 4.22 3.92 3.67 3.45 3.26
Tc = time in minutes. Values may exceed 60.
Rainfall Precipitation Table (in)Precip. file name: Sample.pcp
StormDistribution 1-yr 2-yr 3-yr 5-yr 10-yr 25-yr 50-yr 100-yr
SCS 24-hour 2.50 3.10 0.00 3.30 4.50 5.30 5.90 6.50
SCS 6-Hr 0.00 0.00 0.00 0.00 0.00 0.00 0.00 0.00
Huff-1st 0.00 0.00 0.00 2.75 0.00 0.00 0.00 0.00
Huff-2nd 0.00 0.00 0.00 0.00 0.00 0.00 0.00 0.00
Huff-3rd 0.00 0.00 0.00 0.00 0.00 0.00 0.00 0.00
Huff-4th 0.00 0.00 0.00 0.00 0.00 0.00 0.00 0.00
Huff-Indy 0.00 0.00 0.00 2.75 0.00 0.00 0.00 0.00
Custom 0.00 0.00 0.00 2.80 0.00 0.00 0.00 0.00

Hydrograph ReportHydraflow Hydrographs Extension for AutoCAD® Civil 3D® 2013 by Autodesk, Inc. v10 Thursday, 06 / 26 / 2014
Hyd. No. 1Area North
Hydrograph type = SCS Runoff Peak discharge = 7.246 cfsStorm frequency = 100 yrs Time to peak = 12.07 hrsTime interval = 2 min Hyd. volume = 23,482 cuftDrainage area = 1.228 ac Curve number = 92.5Basin Slope = 0.0 % Hydraulic length = 0 ftTc method = User Time of conc. (Tc) = 6.00 minTotal precip. = 6.50 in Distribution = Type IIIStorm duration = 24 hrs Shape factor = 484
9
0 2 4 6 8 10 12 14 16 18 20 22 24
Q (cfs)
0.00 0.00
2.00 2.00
4.00 4.00
6.00 6.00
8.00 8.00
Q (cfs)
Time (hrs)
Area NorthHyd. No. 1 -- 100 Year
Hyd No. 1

Hydrograph ReportHydraflow Hydrographs Extension for AutoCAD® Civil 3D® 2013 by Autodesk, Inc. v10 Thursday, 06 / 26 / 2014
Hyd. No. 2Area West
Hydrograph type = SCS Runoff Peak discharge = 0.549 cfsStorm frequency = 100 yrs Time to peak = 12.07 hrsTime interval = 2 min Hyd. volume = 1,645 cuftDrainage area = 0.124 ac Curve number = 76.8Basin Slope = 0.0 % Hydraulic length = 0 ftTc method = User Time of conc. (Tc) = 6.00 minTotal precip. = 6.50 in Distribution = Type IIIStorm duration = 24 hrs Shape factor = 484
10
0 2 4 6 8 10 12 14 16 18 20 22 24 26
Q (cfs)
0.00 0.00
0.10 0.10
0.20 0.20
0.30 0.30
0.40 0.40
0.50 0.50
0.60 0.60
0.70 0.70
0.80 0.80
0.90 0.90
1.00 1.00
Q (cfs)
Time (hrs)
Area WestHyd. No. 2 -- 100 Year
Hyd No. 2

Hydrograph ReportHydraflow Hydrographs Extension for AutoCAD® Civil 3D® 2013 by Autodesk, Inc. v10 Thursday, 06 / 26 / 2014
Hyd. No. 3Area South
Hydrograph type = SCS Runoff Peak discharge = 1.001 cfsStorm frequency = 100 yrs Time to peak = 12.07 hrsTime interval = 2 min Hyd. volume = 3,473 cuftDrainage area = 0.163 ac Curve number = 98Basin Slope = 0.0 % Hydraulic length = 0 ftTc method = User Time of conc. (Tc) = 6.00 minTotal precip. = 6.50 in Distribution = Type IIIStorm duration = 24 hrs Shape factor = 484
11
0 2 4 6 8 10 12 14 16 18 20 22 24
Q (cfs)
0.00 0.00
1.00 1.00
2.00 2.00
Q (cfs)
Time (hrs)
Area SouthHyd. No. 3 -- 100 Year
Hyd No. 3

Hydrograph ReportHydraflow Hydrographs Extension for AutoCAD® Civil 3D® 2013 by Autodesk, Inc. v10 Thursday, 06 / 26 / 2014
Hyd. No. 4Total Exist. Runoff
Hydrograph type = Combine Peak discharge = 8.796 cfsStorm frequency = 100 yrs Time to peak = 12.07 hrsTime interval = 2 min Hyd. volume = 28,600 cuftInflow hyds. = 1, 2, 3 Contrib. drain. area = 1.515 ac
12
0 2 4 6 8 10 12 14 16 18 20 22 24
Q (cfs)
0.00 0.00
2.00 2.00
4.00 4.00
6.00 6.00
8.00 8.00
10.00 10.00
Q (cfs)
Time (hrs)
Total Exist. RunoffHyd. No. 4 -- 100 Year
Hyd No. 4 Hyd No. 1 Hyd No. 2 Hyd No. 3

KELLY ENGINEERING GROUP, INC. Zero Campanelli Drive-Braintree-MA 02184 Phone 781 843 4333
Attachment BProposed Conditions
���������������� ��
������ ��������� ������������
�� ����� ��

Runoff Curve Number and Runoff
Name: Herb Chambers By: bgl Date: 05/30/14Location : 64 Cambridge St. Burlington, MADescription: Proposed Conditions - Area Northeast
Circle One: Pre or Post
Runoff Curve Number (CN):
Surface Description Soil Name; hydrologic group; hydrologic condition CN s.f. Product ofCN x Area
Lawn Urband Land; Hydrologic Group B; Good Condition 61 1463 89243Roof 98 0 0Paved 98 4177 409346
Totals = 5640.00 498589Acres = 0.12947658
CN or C (weighted) = total product/total area = 88.4
Reference: Urban Hydrology for Small WatershedsTechnical Release 55, Soil Conservation ServiceU.S. Department of Agriculture, June 1986

Runoff Curve Number and Runoff
Name: Herb Chambers By: bgl Date: 05/30/14Location : 64 Cambridge St. Burlington, MADescription: Proposed Conditions - Area Drainage System
Circle One: Pre or Post
Runoff Curve Number (CN):
Surface Description Soil Name; hydrologic group; hydrologic condition CN s.f. Product ofCN x Area
Lawn Urband Land; Hydrologic Group B; Good Condition 61 5960 363560Roof 98 4504 441392Paved 98 49904 4890592
Totals = 60368.00 5695544Acres = 1.38585859
CN or C (weighted) = total product/total area = 94.3
Reference: Urban Hydrology for Small WatershedsTechnical Release 55, Soil Conservation ServiceU.S. Department of Agriculture, June 1986

1 2
3
4
1
Watershed Model SchematicHydraflow Hydrographs Extension for AutoCAD® Civil 3D® 2013 by Autodesk, Inc. v10
Project: Post-Proposed Conditions.gpw Thursday, 06 / 26 / 2014
Hyd. Origin Description
Legend
1 SCS Runoff Area Northeast2 SCS Runoff Area Dainage System3 Reservoir Route thru system4 Combine Total Site Runoff
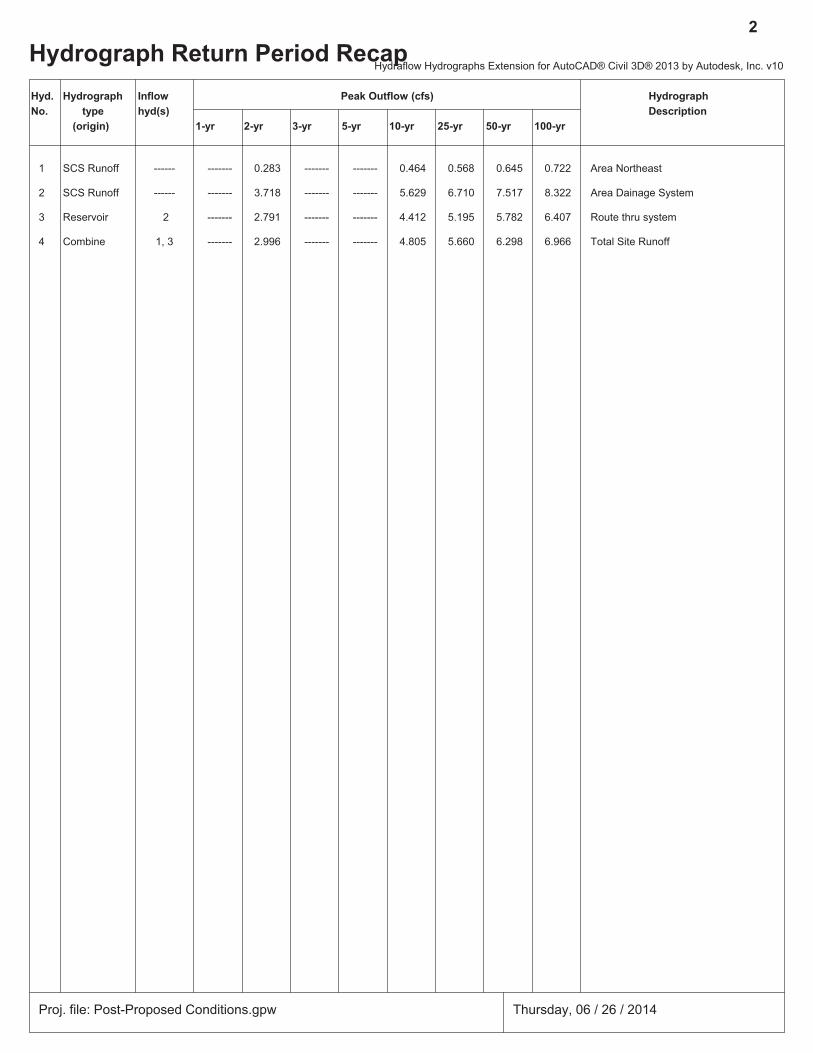
Hydrograph Return Period Recap2
Hyd. Hydrograph Inflow Peak Outflow (cfs) HydrographNo. type hyd(s) Description
(origin) 1-yr 2-yr 3-yr 5-yr 10-yr 25-yr 50-yr 100-yr
1 SCS Runoff ------ ------- 0.283 ------- ------- 0.464 0.568 0.645 0.722 Area Northeast
2 SCS Runoff ------ ------- 3.718 ------- ------- 5.629 6.710 7.517 8.322 Area Dainage System
3 Reservoir 2 ------- 2.791 ------- ------- 4.412 5.195 5.782 6.407 Route thru system
4 Combine 1, 3 ------- 2.996 ------- ------- 4.805 5.660 6.298 6.966 Total Site Runoff
Proj. file: Post-Proposed Conditions.gpw Thursday, 06 / 26 / 2014
Hydraflow Hydrographs Extension for AutoCAD® Civil 3D® 2013 by Autodesk, Inc. v10

Hydrograph Summary Report3
Hyd. Hydrograph Peak Time Time to Hyd. Inflow Maximum Total HydrographNo. type flow interval Peak volume hyd(s) elevation strge used Description
(origin) (cfs) (min) (min) (cuft) (ft) (cuft)
1 SCS Runoff 0.283 2 724 852 ------ ------ ------ Area Northeast
2 SCS Runoff 3.718 2 724 11,682 ------ ------ ------ Area Dainage System
3 Reservoir 2.791 2 728 11,329 2 186.23 1,876 Route thru system
4 Combine 2.996 2 728 12,181 1, 3 ------ ------ Total Site Runoff
Post-Proposed Conditions.gpw Return Period: 2 Year Thursday, 06 / 26 / 2014
Hydraflow Hydrographs Extension for AutoCAD® Civil 3D® 2013 by Autodesk, Inc. v10

Hydrograph Summary Report4
Hyd. Hydrograph Peak Time Time to Hyd. Inflow Maximum Total HydrographNo. type flow interval Peak volume hyd(s) elevation strge used Description
(origin) (cfs) (min) (min) (cuft) (ft) (cuft)
1 SCS Runoff 0.464 2 724 1,420 ------ ------ ------ Area Northeast
2 SCS Runoff 5.629 2 724 18,150 ------ ------ ------ Area Dainage System
3 Reservoir 4.412 2 728 17,798 2 186.68 2,394 Route thru system
4 Combine 4.805 2 726 19,218 1, 3 ------ ------ Total Site Runoff
Post-Proposed Conditions.gpw Return Period: 10 Year Thursday, 06 / 26 / 2014
Hydraflow Hydrographs Extension for AutoCAD® Civil 3D® 2013 by Autodesk, Inc. v10

Hydrograph Summary Report5
Hyd. Hydrograph Peak Time Time to Hyd. Inflow Maximum Total HydrographNo. type flow interval Peak volume hyd(s) elevation strge used Description
(origin) (cfs) (min) (min) (cuft) (ft) (cuft)
1 SCS Runoff 0.568 2 724 1,754 ------ ------ ------ Area Northeast
2 SCS Runoff 6.710 2 724 21,875 ------ ------ ------ Area Dainage System
3 Reservoir 5.195 2 728 21,523 2 186.96 2,704 Route thru system
4 Combine 5.660 2 726 23,278 1, 3 ------ ------ Total Site Runoff
Post-Proposed Conditions.gpw Return Period: 25 Year Thursday, 06 / 26 / 2014
Hydraflow Hydrographs Extension for AutoCAD® Civil 3D® 2013 by Autodesk, Inc. v10

Hydrograph Summary Report6
Hyd. Hydrograph Peak Time Time to Hyd. Inflow Maximum Total HydrographNo. type flow interval Peak volume hyd(s) elevation strge used Description
(origin) (cfs) (min) (min) (cuft) (ft) (cuft)
1 SCS Runoff 0.645 2 724 2,008 ------ ------ ------ Area Northeast
2 SCS Runoff 7.517 2 724 24,677 ------ ------ ------ Area Dainage System
3 Reservoir 5.782 2 728 24,325 2 187.21 2,944 Route thru system
4 Combine 6.298 2 726 26,333 1, 3 ------ ------ Total Site Runoff
Post-Proposed Conditions.gpw Return Period: 50 Year Thursday, 06 / 26 / 2014
Hydraflow Hydrographs Extension for AutoCAD® Civil 3D® 2013 by Autodesk, Inc. v10

Hydrograph Summary Report7
Hyd. Hydrograph Peak Time Time to Hyd. Inflow Maximum Total HydrographNo. type flow interval Peak volume hyd(s) elevation strge used Description
(origin) (cfs) (min) (min) (cuft) (ft) (cuft)
1 SCS Runoff 0.722 2 724 2,262 ------ ------ ------ Area Northeast
2 SCS Runoff 8.322 2 724 27,484 ------ ------ ------ Area Dainage System
3 Reservoir 6.407 2 728 27,132 2 187.53 3,177 Route thru system
4 Combine 6.966 2 726 29,394 1, 3 ------ ------ Total Site Runoff
Post-Proposed Conditions.gpw Return Period: 100 Year Thursday, 06 / 26 / 2014
Hydraflow Hydrographs Extension for AutoCAD® Civil 3D® 2013 by Autodesk, Inc. v10

Hydraflow Rainfall Report8
Hydraflow Hydrographs Extension for AutoCAD® Civil 3D® 2013 by Autodesk, Inc. v10 Thursday, 06 / 26 / 2014
Return Intensity-Duration-Frequency Equation Coefficients (FHA)Period(Yrs) B D E (N/A)
1 0.0000 0.0000 0.0000 --------
2 69.8703 13.1000 0.8658 --------
3 0.0000 0.0000 0.0000 --------
5 79.2597 14.6000 0.8369 --------
10 88.2351 15.5000 0.8279 --------
25 102.6072 16.5000 0.8217 --------
50 114.8193 17.2000 0.8199 --------
100 127.1596 17.8000 0.8186 --------
File name: SampleFHA.idf
Intensity = B / (Tc + D)^E
Return Intensity Values (in/hr)Period
(Yrs) 5 min 10 15 20 25 30 35 40 45 50 55 60
1 0.00 0.00 0.00 0.00 0.00 0.00 0.00 0.00 0.00 0.00 0.00 0.00
2 5.69 4.61 3.89 3.38 2.99 2.69 2.44 2.24 2.07 1.93 1.81 1.70
3 0.00 0.00 0.00 0.00 0.00 0.00 0.00 0.00 0.00 0.00 0.00 0.00
5 6.57 5.43 4.65 4.08 3.65 3.30 3.02 2.79 2.59 2.42 2.27 2.15
10 7.24 6.04 5.21 4.59 4.12 3.74 3.43 3.17 2.95 2.77 2.60 2.46
25 8.25 6.95 6.03 5.34 4.80 4.38 4.02 3.73 3.48 3.26 3.07 2.91
50 9.04 7.65 6.66 5.92 5.34 4.87 4.49 4.16 3.88 3.65 3.44 3.25
100 9.83 8.36 7.30 6.50 5.87 5.36 4.94 4.59 4.29 4.03 3.80 3.60
Tc = time in minutes. Values may exceed 60.
Rainfall Precipitation Table (in)Precip. file name: Sample.pcp
StormDistribution 1-yr 2-yr 3-yr 5-yr 10-yr 25-yr 50-yr 100-yr
SCS 24-hour 2.50 3.10 0.00 3.30 4.50 5.30 5.90 6.50
SCS 6-Hr 0.00 0.00 0.00 0.00 0.00 0.00 0.00 0.00
Huff-1st 0.00 0.00 0.00 2.75 0.00 0.00 0.00 0.00
Huff-2nd 0.00 0.00 0.00 0.00 0.00 0.00 0.00 0.00
Huff-3rd 0.00 0.00 0.00 0.00 0.00 0.00 0.00 0.00
Huff-4th 0.00 0.00 0.00 0.00 0.00 0.00 0.00 0.00
Huff-Indy 0.00 0.00 0.00 2.75 0.00 0.00 0.00 0.00
Custom 0.00 0.00 0.00 2.80 0.00 0.00 0.00 0.00

Hydrograph ReportHydraflow Hydrographs Extension for AutoCAD® Civil 3D® 2013 by Autodesk, Inc. v10 Thursday, 06 / 26 / 2014
Hyd. No. 1Area Northeast
Hydrograph type = SCS Runoff Peak discharge = 0.722 cfsStorm frequency = 100 yrs Time to peak = 12.07 hrsTime interval = 2 min Hyd. volume = 2,262 cuftDrainage area = 0.129 ac Curve number = 88.4Basin Slope = 0.0 % Hydraulic length = 0 ftTc method = User Time of conc. (Tc) = 6.00 minTotal precip. = 6.50 in Distribution = Type IIIStorm duration = 24 hrs Shape factor = 484
9
0 2 4 6 8 10 12 14 16 18 20 22 24
Q (cfs)
0.00 0.00
0.10 0.10
0.20 0.20
0.30 0.30
0.40 0.40
0.50 0.50
0.60 0.60
0.70 0.70
0.80 0.80
0.90 0.90
1.00 1.00
Q (cfs)
Time (hrs)
Area NortheastHyd. No. 1 -- 100 Year
Hyd No. 1

Hydrograph ReportHydraflow Hydrographs Extension for AutoCAD® Civil 3D® 2013 by Autodesk, Inc. v10 Thursday, 06 / 26 / 2014
Hyd. No. 2Area Dainage System
Hydrograph type = SCS Runoff Peak discharge = 8.322 cfsStorm frequency = 100 yrs Time to peak = 12.07 hrsTime interval = 2 min Hyd. volume = 27,484 cuftDrainage area = 1.386 ac Curve number = 94.3Basin Slope = 0.0 % Hydraulic length = 0 ftTc method = User Time of conc. (Tc) = 6.00 minTotal precip. = 6.50 in Distribution = Type IIIStorm duration = 24 hrs Shape factor = 484
10
0 2 4 6 8 10 12 14 16 18 20 22 24
Q (cfs)
0.00 0.00
2.00 2.00
4.00 4.00
6.00 6.00
8.00 8.00
10.00 10.00
Q (cfs)
Time (hrs)
Area Dainage SystemHyd. No. 2 -- 100 Year
Hyd No. 2
Hydrograph ReportHydraflow Hydrographs Extension for AutoCAD® Civil 3D® 2013 by Autodesk, Inc. v10 Thursday, 06 / 26 / 2014
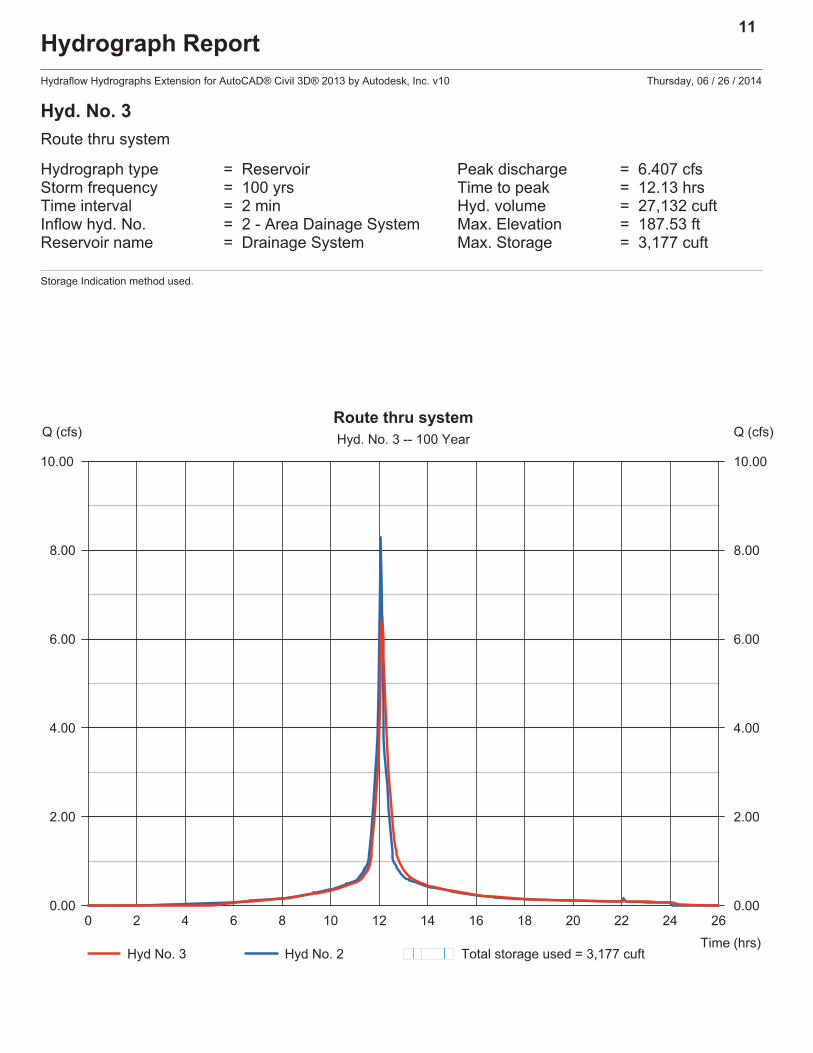
Hyd. No. 3Route thru system
Hydrograph type = Reservoir Peak discharge = 6.407 cfsStorm frequency = 100 yrs Time to peak = 12.13 hrsTime interval = 2 min Hyd. volume = 27,132 cuftInflow hyd. No. = 2 - Area Dainage System Max. Elevation = 187.53 ftReservoir name = Drainage System Max. Storage = 3,177 cuft
Storage Indication method used.
11
0 2 4 6 8 10 12 14 16 18 20 22 24 26
Q (cfs)
0.00 0.00
2.00 2.00
4.00 4.00
6.00 6.00
8.00 8.00
10.00 10.00
Q (cfs)
Time (hrs)
Route thru systemHyd. No. 3 -- 100 Year
Hyd No. 3 Hyd No. 2 Total storage used = 3,177 cuft

Pond Report 12
Hydraflow Hydrographs Extension for AutoCAD® Civil 3D® 2013 by Autodesk, Inc. v10 Thursday, 06 / 26 / 2014
Pond No. 1 - Drainage SystemPond DataUG Chambers -Invert elev. = 185.00 ft, Rise x Span = 2.50 x 4.33 ft, Barrel Len = 100.00 ft, No. Barrels = 3, Slope = 0.00%, Headers = NoEncasement -Invert elev. = 184.50 ft, Width = 4.67 ft, Height = 3.50 ft, Voids = 40.00%
Stage / Storage TableStage (ft) Elevation (ft) Contour area (sqft) Incr. Storage (cuft) Total storage (cuft)
0.00 184.50 n/a 0 00.35 184.85 n/a 196 1960.70 185.20 n/a 352 5481.05 185.55 n/a 466 1,0141.40 185.90 n/a 457 1,4711.75 186.25 n/a 442 1,9132.10 186.60 n/a 420 2,3332.45 186.95 n/a 388 2,7212.80 187.30 n/a 338 3,0593.15 187.65 n/a 237 3,2963.50 188.00 n/a 196 3,492
Culvert / Orifice Structures Weir Structures
[A] [B] [C] [PrfRsr] [A] [B] [C] [D]Rise (in) = 8.00 8.00 8.00 0.00Span (in) = 8.00 8.00 8.00 0.00No. Barrels = 1 1 1 0Invert El. (ft) = 185.00 185.50 186.00 0.00Length (ft) = 0.00 0.00 0.00 0.00Slope (%) = 0.00 0.00 0.00 n/aN-Value = .013 .013 .013 n/aOrifice Coeff. = 0.60 0.60 0.60 0.60Multi-Stage = n/a No No No
Crest Len (ft) = 0.00 0.00 0.00 0.00Crest El. (ft) = 0.00 0.00 0.00 0.00Weir Coeff. = 3.33 3.33 3.33 3.33Weir Type = --- --- --- ---Multi-Stage = No No No No
Exfil.(in/hr) = 0.000 (by Contour)TW Elev. (ft) = 0.00
Note: Culvert/Orifice outflows are analyzed under inlet (ic) and outlet (oc) control. Weir risers checked for orifice conditions (ic) and submergence (s).
0.00 1.00 2.00 3.00 4.00 5.00 6.00 7.00 8.00
Stage (ft)
0.00 184.50
1.00 185.50
2.00 186.50
3.00 187.50
4.00 188.50
Elev (ft)
Discharge (cfs)
Stage / Discharge
Total Q

Hydrograph ReportHydraflow Hydrographs Extension for AutoCAD® Civil 3D® 2013 by Autodesk, Inc. v10 Thursday, 06 / 26 / 2014
Hyd. No. 4Total Site Runoff
Hydrograph type = Combine Peak discharge = 6.966 cfsStorm frequency = 100 yrs Time to peak = 12.10 hrsTime interval = 2 min Hyd. volume = 29,394 cuftInflow hyds. = 1, 3 Contrib. drain. area = 0.129 ac
13
0 2 4 6 8 10 12 14 16 18 20 22 24 26
Q (cfs)
0.00 0.00
1.00 1.00
2.00 2.00
3.00 3.00
4.00 4.00
5.00 5.00
6.00 6.00
7.00 7.00
Q (cfs)
Time (hrs)
Total Site RunoffHyd. No. 4 -- 100 Year
Hyd No. 4 Hyd No. 1 Hyd No. 3

KELLY ENGINEERING GROUP, INC. Zero Campanelli Drive-Braintree-MA 02184 Phone 781 843 4333
Attachment C Water Quality


Area 0.67 acres CDS Model CDS2015-4Weighted C 0.83 Particle Size 50 micronsTc 5 minutes CDS Treatment 1.4 cfs
Capacity
Rainfall Intensity1
(in/hr)
Percent Rainfall Volume1
Cumulative Rainfall Volume
Total Flowrate
(cfs)
Treated Flowrate (cfs)
Removal Efficiency
(%)
Incremental Removal (%)
0.02 10.2% 10.2% 0.01 0.01 96.9 9.90.04 9.6% 19.8% 0.02 0.02 96.7 9.30.06 9.4% 29.3% 0.03 0.03 96.4 9.10.08 7.7% 37.0% 0.04 0.04 96.1 7.40.10 8.6% 45.6% 0.06 0.06 95.9 8.20.12 6.3% 51.9% 0.07 0.07 95.6 6.00.14 4.7% 56.5% 0.08 0.08 95.3 4.40.16 4.6% 61.2% 0.09 0.09 95.1 4.40.18 3.5% 64.7% 0.10 0.10 94.8 3.40.20 4.3% 69.1% 0.11 0.11 94.5 4.10.25 8.0% 77.1% 0.14 0.14 93.8 7.50.30 5.6% 82.7% 0.17 0.17 93.2 5.20.35 4.4% 87.0% 0.19 0.19 92.5 4.00.40 2.5% 89.5% 0.22 0.22 91.8 2.30.45 2.5% 92.1% 0.25 0.25 91.1 2.30.50 1.4% 93.5% 0.28 0.28 90.5 1.20.75 5.0% 98.5% 0.42 0.42 87.1 4.41.00 1.0% 99.5% 0.56 0.56 83.7 0.81.50 0.0% 99.5% 0.83 0.83 76.9 0.02.00 0.0% 99.5% 1.11 1.11 70.2 0.03.00 0.5% 100.0% 1.67 1.40 53.0 0.3
94.46.5%93.5%88.0%
1 - Based on 10 years of hourly precipitation data from NCDC Station 770, Boston WSFO AP, Suffolk County, MA2 - Reduction due to use of 60-minute data for a site that has a time of concentration less than 30-minutes.
BASED ON THE RATIONAL RAINFALL METHOD
for SYSTEM: WQD#1
CDS ESTIMATED NET ANNUAL TSS REDUCTION
HERB CHAMBERSBURLINGTON, MA
Predicted Net Annual Load Removal Efficiency =
Removal Efficiency Adjustment2 = Predicted % Annual Rainfall Treated =

Area 0.707 acres CDS Model CDS2015-4Weighted C 0.77 Particle Size 50 micronsTc 5 minutes CDS Treatment 1.4 cfs
Capacity
Rainfall Intensity1
(in/hr)
Percent Rainfall Volume1
Cumulative Rainfall Volume
Total Flowrate
(cfs)
Treated Flowrate (cfs)
Removal Efficiency
(%)
Incremental Removal (%)
0.02 10.2% 10.2% 0.01 0.01 97.0 9.90.04 9.6% 19.8% 0.02 0.02 96.7 9.30.06 9.4% 29.3% 0.03 0.03 96.4 9.10.08 7.7% 37.0% 0.04 0.04 96.2 7.40.10 8.6% 45.6% 0.05 0.05 95.9 8.20.12 6.3% 51.9% 0.07 0.07 95.6 6.00.14 4.7% 56.5% 0.08 0.08 95.4 4.40.16 4.6% 61.2% 0.09 0.09 95.1 4.40.18 3.5% 64.7% 0.10 0.10 94.8 3.40.20 4.3% 69.1% 0.11 0.11 94.6 4.10.25 8.0% 77.1% 0.14 0.14 93.9 7.50.30 5.6% 82.7% 0.16 0.16 93.2 5.20.35 4.4% 87.0% 0.19 0.19 92.6 4.00.40 2.5% 89.5% 0.22 0.22 91.9 2.30.45 2.5% 92.1% 0.24 0.24 91.3 2.30.50 1.4% 93.5% 0.27 0.27 90.6 1.30.75 5.0% 98.5% 0.41 0.41 87.3 4.41.00 1.0% 99.5% 0.54 0.54 84.0 0.91.50 0.0% 99.5% 0.82 0.82 77.4 0.02.00 0.0% 99.5% 1.09 1.09 70.7 0.03.00 0.5% 100.0% 1.63 1.40 54.1 0.3
94.56.5%93.5%88.0%
1 - Based on 10 years of hourly precipitation data from NCDC Station 770, Boston WSFO AP, Suffolk County, MA2 - Reduction due to use of 60-minute data for a site that has a time of concentration less than 30-minutes.
Predicted Net Annual Load Removal Efficiency =
Removal Efficiency Adjustment2 = Predicted % Annual Rainfall Treated =
BASED ON THE RATIONAL RAINFALL METHOD
for SYSTEM: WQD#2
CDS ESTIMATED NET ANNUAL TSS REDUCTION
HERB CHAMBERSBURLINGTON, MA
Page 1 of 1
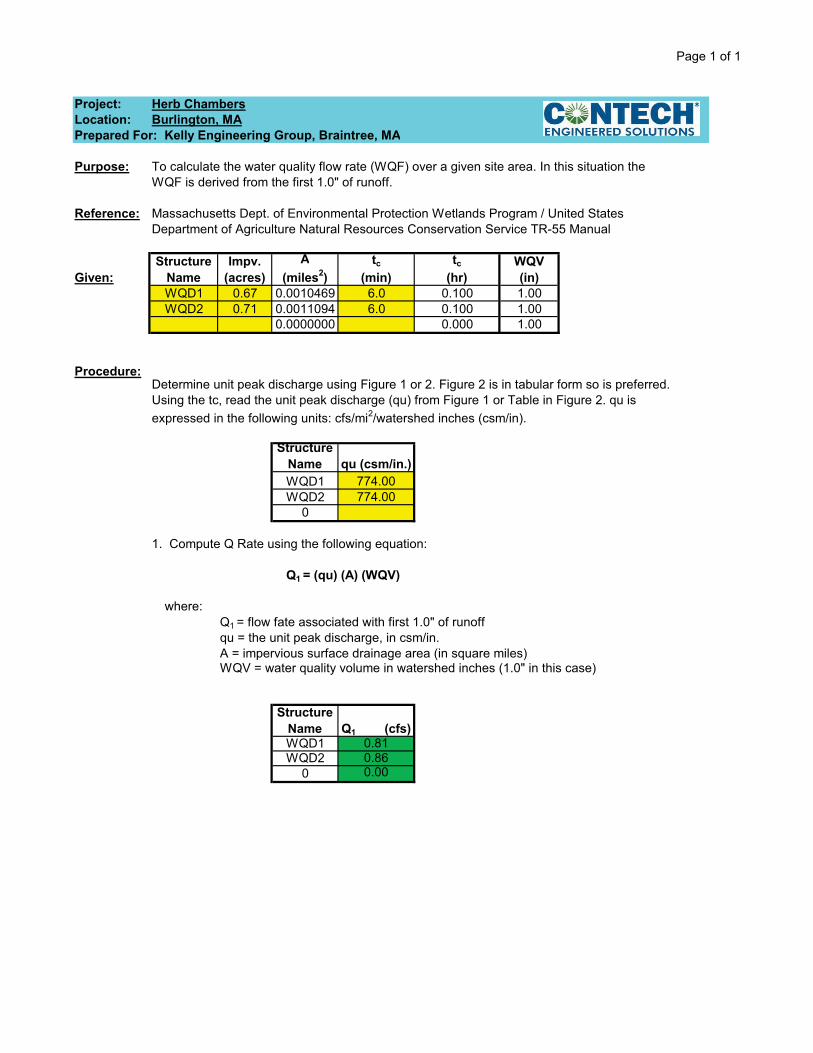
Project: Herb ChambersLocation: Burlington, MAPrepared For: Kelly Engineering Group, Braintree, MA
Purpose:
Reference:
Given:Structure
NameImpv.
(acres)A
(miles2)tc
(min)tc
(hr)WQV (in)
WQD1 0.67 0.0010469 6.0 0.100 1.00WQD2 0.71 0.0011094 6.0 0.100 1.00
0.0000000 0.000 1.00
Procedure:
Structure Name qu (csm/in.)WQD1 774.00WQD2 774.00
0
where:
A = impervious surface drainage area (in square miles)WQV = water quality volume in watershed inches (1.0" in this case)
Structure Name Q1 (cfs)WQD1 0.81WQD2 0.86
0 0.00
qu = the unit peak discharge, in csm/in.
To calculate the water quality flow rate (WQF) over a given site area. In this situation the WQF is derived from the first 1.0" of runoff.
Massachusetts Dept. of Environmental Protection Wetlands Program / United States Department of Agriculture Natural Resources Conservation Service TR-55 Manual
Determine unit peak discharge using Figure 1 or 2. Figure 2 is in tabular form so is preferred. Using the tc, read the unit peak discharge (qu) from Figure 1 or Table in Figure 2. qu is expressed in the following units: cfs/mi2/watershed inches (csm/in).
1. Compute Q Rate using the following equation:
Q1 = (qu) (A) (WQV)
Q1 = flow fate associated with first 1.0" of runoff

1
HERB CHAMBERS CAMBRIDGE STREET, LLC STORMWATER MANAGEMENT SYSTEM OPERATION AND MAINTENANCE PLAN
&LONG-TERM POLLUTION PREVENTION PLAN
07/17/14
Prepared by:
KELLY ENGINEERING GROUP, INC.Zero Campanelli Drive
Braintree, Massachusetts 02184
OWNER AND RESPONSIBLE PARTY: Herb Chambers Cambridge Street, LLC 259 McGrath Highway Somerville, MA 02145
Note: If ownership of this property changes then the new owner becomes the responsible party. The Owner may assign responsibility to a tenant on the property.
2
Introduction
Considerable time, effort and cost has been spent in the design and construction of the stormwater management system for this development. The stormwater management system consists of a number of Best Management Practices (BMP’s). These BMP’s combine to ensure that storm runoff from the site will not damage the sensitive environmental resources surrounding the site. In order to ensure that these BMP’s operate as designed it is very important that the procedures in this operation and maintenance plan be followed. Most of these operation procedures require observation and measurement; however, at certain times more extensive maintenance measures may be needed. The following is an itemization of each of these BMP’s and their maintenance needs.
The party responsible for maintenance should contract with a maintenance organization capable of performing the more extensive measures such as pumping of catch basin sumps, etc.
BMP No. 1 – Paved Road Surface/Parking Lot Area:
• Regularly pick up and remove litter from the parking lot area, landscaped islands and perimeter landscaped areas and water quality areas.
• The paved area is to be swept a minimum of two times per year, at least once during April and again during September with a high efficiency vacuum sweeper or a regenerative air sweeper. If a mechanical sweeper is used, the paved area is to be swept a minimum of once a month.
BMP No. 2 - Deep Sump Catch Basins:
• Basins are to be inspected 4 times per year.
1. Verify that tees are secure and free-flowing. 2. Measure depth of sediment below water line.
• Basins are to be cleaned whenever sediment and hydrocarbons are observed. Basins are to be cleaned a minimum of twice per year. One of these cleanings shall occur before April 15th of each year and one shall occur before September 15th of each year. Basins may be cleaned either using a clamshell or a vacuum pump.
• All liquid shall be pumped from the sump of each basin at least once per year.
• All sediments and hydrocarbons should be properly handled and disposed of, in accordance with local, state and federal guidelines and regulations.
Note: See catch basin detail for explanation of terms.
BMP No. 3 – Contech Water Quality Inlets:
• Basins are to be inspected 4 times per year by owner or designee.
1. Verify that tees are secure and free-flowing. 2. Measure depth of sediment below water line.
• Basins are to be cleaned whenever 18” of sediment and hydrocarbons are observed. Basins are to be cleaned a minimum of twice per year. One of these cleanings shall occur before April 15th of each year and one shall occur before September 15th of each year. Basins may be cleaned either using a

3
clamshell or a vacuum pump.
• All liquid shall be pumped from the sump of each basin at least once per year.
• All sediments and hydrocarbons shall be properly handled and disposed of, in accordance with local, state and federal guidelines and regulations.
If any problems are encountered with the Contech Units, contact the manufacturer.
BMP No. 4 - Subsurface Recharge:
� The inlet pipe and observation basin shall be inspected 4 times a year. Any accumulated debris shall be removed.
� Inspect recharge facilities following a rainfall event greater than 2.5 inches in a 24 hour period.
� If standing water is observed for more than 48 hours following a storm event, immediately retain a qualified professional to assess whether infiltration function has been lost and develop recommended corrective actions.
Snow Removal:
• There shall be no plowing or stock piling of snow within all resource areas and any area subject to the jurisdiction of local and state regulations without the prior written permission from state or local approving authority.
• Road salts and de-icing materials shall be stored on impervious pads and covered to protect from wind and precipitation.
• No de-icing materials shall be stored nor used within all resource areas and any area subject to the jurisdiction of local and state regulations without the prior written permission from state or local approving authority.
• No de-icing materials shall be stored within Zone I, Zone II, Zone A, and 200 feet from a river or estuary.
Storage and Use of Chemicals:
• No pesticides, herbicides, nor insecticides shall be stored nor used within all resource areas and any area subject to the jurisdiction of local and state regulations without the prior written permission from state or local approving authority.
• Chemical storage on site shall be limited. Any chemicals that must be stored shall be stored in a secure area in accordance with Local and State regulations.
Hazardous Waste:
• Containment – In the event of a discharge or spill of oil or another hazardous material, outlets to stormwater management systems shall be plugged so that hazardous material do not enter resource areas.
• Reporting - In the event of a discharge or spill of oil or another hazardous material, responsible facility personnel, oil spill and/or hazardous material removal organizations, federal, state, and local regulatory agencies, the Town of Burlington Board of Health, fire and police departments, and the EPA National

4
Response Center 1-800-424-8802 shall be rapidly notified. • Hazardous Waste – All hazardous waste materials will be disposed of in the manner specified by local,
state and/or federal regulations and by the manufacturer of such products. • There shall be no illicit discharges to the stormwater management system.
Material and Waste Storage, Handling and Management:
• All waste materials will be collected and stored in a securely lidded metal dumpster from a solid waste management company licensed to do business by the state and the town. The dumpster will comply with all local and state solid waste management regulations.
Training for Long Term Pollution Prevention Plan:
• All staff or personnel involved and responsible for implementing the Stormwater Management System Operations and Maintenance Plan and the Long-Term Pollution Prevention Plan shall be properly trained as required under the DEP Stormwater Management Regulations. Training shall be documented with records kept with other stormwater maintenance records.
Operation and maintenance of septic systems:
• Septic systems shall be properly maintained according to manufacturer’s specifications.
Pet Waste Management:
• Pooper-scooper laws for pets shall be followed. • Never dump pet waste into storm drains, catch basins, or the drainage system. • Pet waste shall be scooped up and disposed of properly in the garbage.
Lawn and Garden activities:
• There shall be no exterior storage of fertilizers, pesticides, herbicides, or insecticides. No pesticides, herbicides, nor insecticides shall be stored nor used within any resource areas its buffers, and any area subject to the jurisdiction of local and state regulations without the prior written permission from state or local approving authority.
• Fertilizers and pesticides shall be applied properly, sparingly, and outside any resource areas and its buffers.
To reduce the impact of fertilizers, consider the following tips; • Don’t fertilize before a rain storm. • Consider using organic fertilizers. They release nutrients more slowly. • Test soils before applying fertilizers. Some soils may not need fertilizers. A standard soil test costs
$9.00. (Call the UMass Extension Soil Testing Lab at 413-545-2311 or download a soil test order form at http://www.umass.edu/plsoils/soiltest/.)

5
form at http://www.umass.edu/plsoils/soiltest/.)

Her
b C
ham
bers
PRO
JEC
T LO
CA
TIO
N: 6
4 C
ambr
idge
Str
eet,
Bur
lingt
on, M
A
STO
RM
WA
TER
MA
NA
GEM
ENT
BES
T M
AN
AG
EMEN
T PR
AC
TIC
ES -
INSP
ECTI
ON
SC
HED
ULE
AN
D E
VALU
ATI
ON
CH
ECK
LIST
Bes
t Man
agem
ent
Pra
ctic
e In
spec
tion
Freq
uenc
y (1
)
Dat
e I
Insp
ecto
r M
inim
um M
aint
enan
ce a
nd K
ey It
ems
to
Che
ck (1
) C
lean
ing/
Rep
air
Nee
ded
yes_
_ no
__
(list
item
s)
Dat
e of
C
lean
ing
/Rep
air
Per
form
ed B
y
Stre
et S
wee
ping
4x
per
yea
r V
acuu
m s
wee
per
Dee
p S
ump
and
Hoo
ded
Cat
ch
Basi
ns
4x p
er y
ear
Rem
ove
sedi
men
t 1x
per y
ear o
r if >
6”
Rec
harg
e C
ham
bers
4x
per
yea
r In
spec
t afte
r 2.5
” rai
n in
24
hour
s, d
rain
tim
e le
ss th
an 3
day
s
CD
S w
ater
Qua
lity
devi
ce
4x p
er y
ear
Per
man
ufac
ture
r Req
uire
men
ts
(1)
Ref
er to
the
Ope
ratio
n an
d M
aint
enan
ce P
lan
for r
ecom
men
datio
ns re
gard
ing
freq
uenc
y of
insp
ectio
ns a
nd
mai
nten
ance
of s
peci
fic B
MP'
s.
reco
mm
enda
tions
rega
rdin
g fr
eque
ncy
for i
nspe
ctio
n an
d m
aint
enan
ce o
f spe
cific
BM
Ps.
Stor
mw
ater
Con
trol
Man
ager
/Env
ironm
enta
l Mon
itor:
Sta
mp/
Sign
atur
e


KELLY ENGINEERING GROUP, INC. Zero Campanelli Drive-Braintree-MA 02184 Phone 781 843 4333
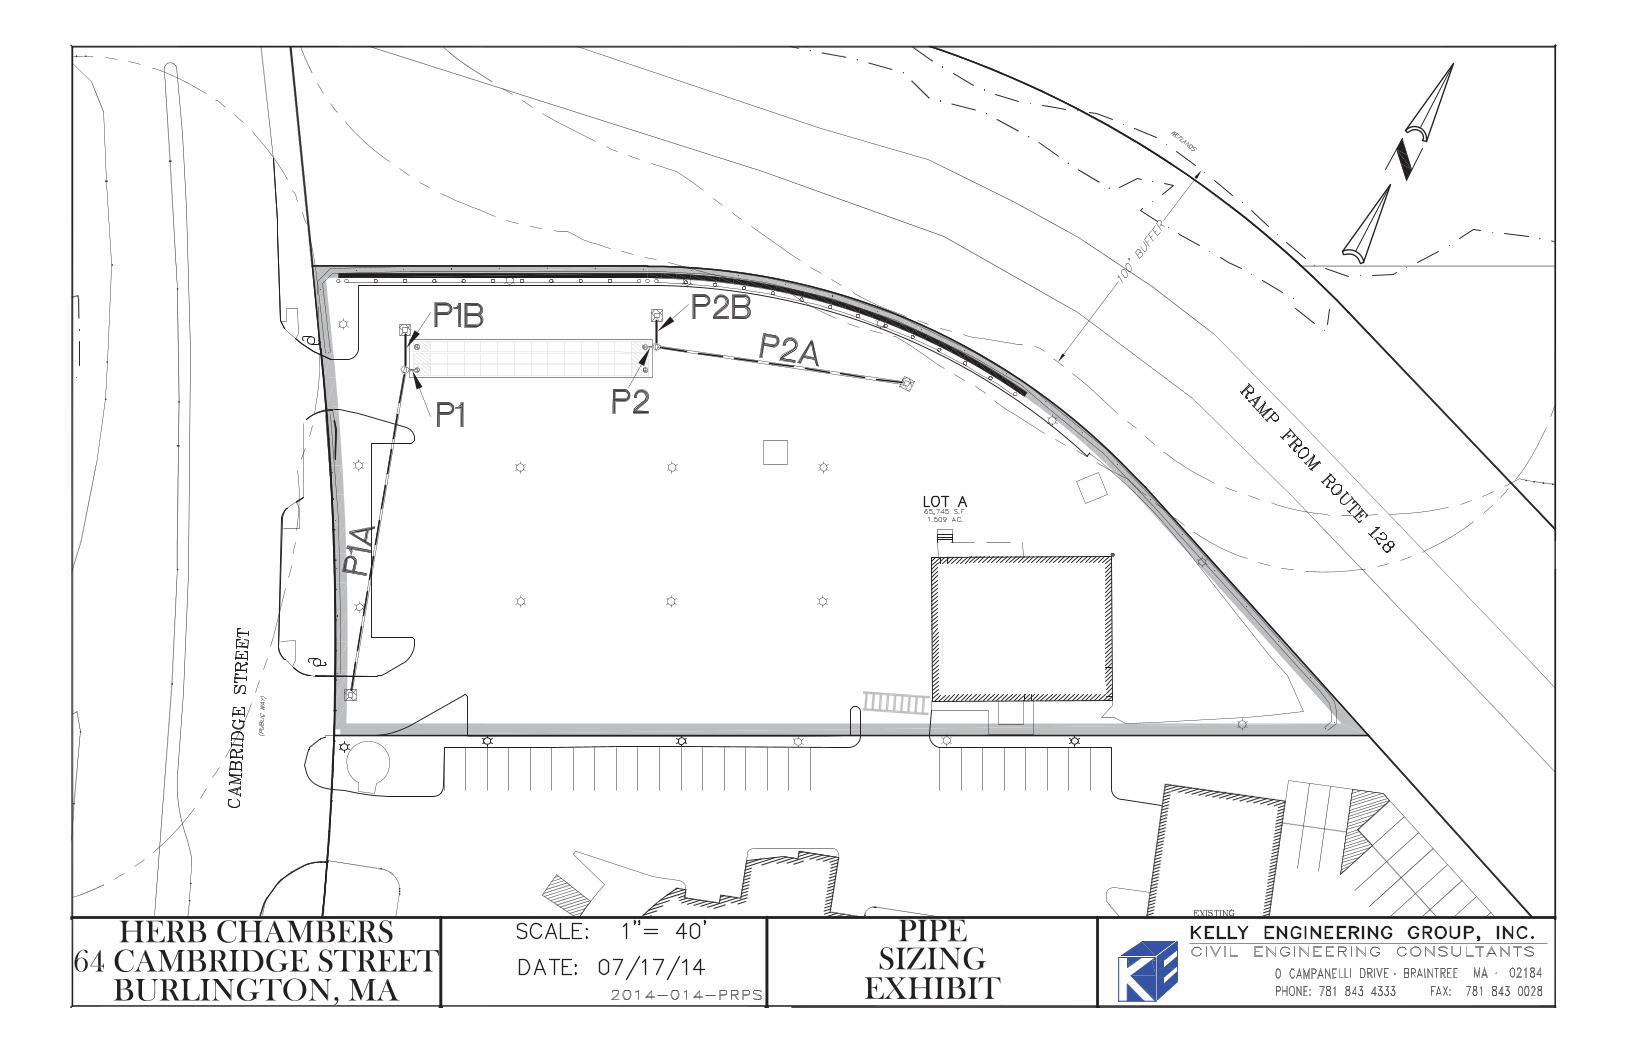
Attachment D Pipe Sizing
Hydrology ReportHydraflow Express Extension for AutoCAD® Civil 3D® 2013 by Autodesk, Inc. Friday, Jul 11 2014
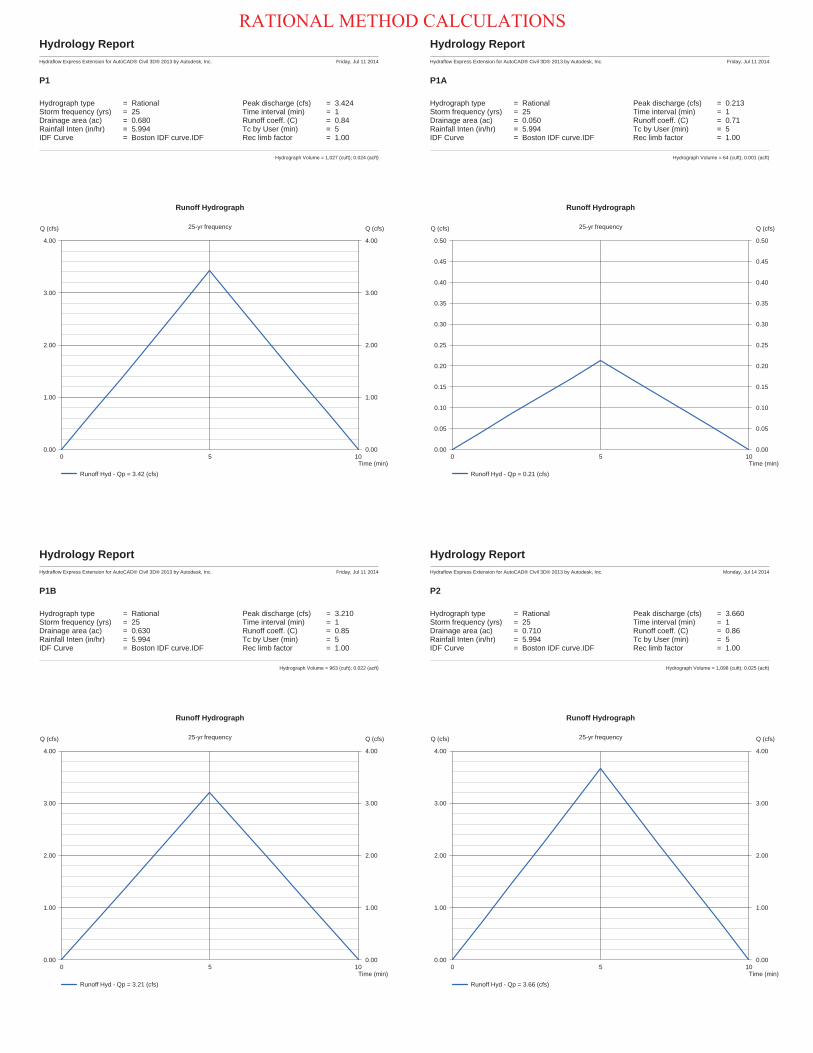
P1
Hydrograph type = Rational Peak discharge (cfs) = 3.424Storm frequency (yrs) = 25 Time interval (min) = 1Drainage area (ac) = 0.680 Runoff coeff. (C) = 0.84Rainfall Inten (in/hr) = 5.994 Tc by User (min) = 5IDF Curve = Boston IDF curve.IDF Rec limb factor = 1.00
Hydrograph Volume = 1,027 (cuft); 0.024 (acft)
0 5 10
Q (cfs)
0.00 0.00
1.00 1.00
2.00 2.00
3.00 3.00
4.00 4.00
Q (cfs)
Time (min)
Runoff Hydrograph
25-yr frequency
Runoff Hyd - Qp = 3.42 (cfs)
Hydrology ReportHydraflow Express Extension for AutoCAD® Civil 3D® 2013 by Autodesk, Inc. Friday, Jul 11 2014
P1A
Hydrograph type = Rational Peak discharge (cfs) = 0.213Storm frequency (yrs) = 25 Time interval (min) = 1Drainage area (ac) = 0.050 Runoff coeff. (C) = 0.71Rainfall Inten (in/hr) = 5.994 Tc by User (min) = 5IDF Curve = Boston IDF curve.IDF Rec limb factor = 1.00
Hydrograph Volume = 64 (cuft); 0.001 (acft)
0 5 10
Q (cfs)
0.00 0.00
0.05 0.05
0.10 0.10
0.15 0.15
0.20 0.20
0.25 0.25
0.30 0.30
0.35 0.35
0.40 0.40
0.45 0.45
0.50 0.50
Q (cfs)
Time (min)
Runoff Hydrograph
25-yr frequency
Runoff Hyd - Qp = 0.21 (cfs)
Hydrology ReportHydraflow Express Extension for AutoCAD® Civil 3D® 2013 by Autodesk, Inc. Friday, Jul 11 2014
P1B
Hydrograph type = Rational Peak discharge (cfs) = 3.210Storm frequency (yrs) = 25 Time interval (min) = 1Drainage area (ac) = 0.630 Runoff coeff. (C) = 0.85Rainfall Inten (in/hr) = 5.994 Tc by User (min) = 5IDF Curve = Boston IDF curve.IDF Rec limb factor = 1.00
Hydrograph Volume = 963 (cuft); 0.022 (acft)
0 5 10
Q (cfs)
0.00 0.00
1.00 1.00
2.00 2.00
3.00 3.00
4.00 4.00
Q (cfs)
Time (min)
Runoff Hydrograph
25-yr frequency
Runoff Hyd - Qp = 3.21 (cfs)
Hydrology ReportHydraflow Express Extension for AutoCAD® Civil 3D® 2013 by Autodesk, Inc. Monday, Jul 14 2014
P2
Hydrograph type = Rational Peak discharge (cfs) = 3.660Storm frequency (yrs) = 25 Time interval (min) = 1Drainage area (ac) = 0.710 Runoff coeff. (C) = 0.86Rainfall Inten (in/hr) = 5.994 Tc by User (min) = 5IDF Curve = Boston IDF curve.IDF Rec limb factor = 1.00
Hydrograph Volume = 1,098 (cuft); 0.025 (acft)
0 5 10
Q (cfs)
0.00 0.00
1.00 1.00
2.00 2.00
3.00 3.00
4.00 4.00
Q (cfs)
Time (min)
Runoff Hydrograph
25-yr frequency
Runoff Hyd - Qp = 3.66 (cfs)
RATIONAL METHOD CALCULATIONS

Hydrology ReportHydraflow Express Extension for AutoCAD® Civil 3D® 2013 by Autodesk, Inc. Monday, Jul 14 2014
P2A
Hydrograph type = Rational Peak discharge (cfs) = 1.108Storm frequency (yrs) = 25 Time interval (min) = 1Drainage area (ac) = 0.220 Runoff coeff. (C) = 0.84Rainfall Inten (in/hr) = 5.994 Tc by User (min) = 5IDF Curve = Boston IDF curve.IDF Rec limb factor = 1.00
Hydrograph Volume = 332 (cuft); 0.008 (acft)
0 5 10
Q (cfs)
0.00 0.00
1.00 1.00
2.00 2.00
Q (cfs)
Time (min)
Runoff Hydrograph
25-yr frequency
Runoff Hyd - Qp = 1.11 (cfs)
Hydrology ReportHydraflow Express Extension for AutoCAD® Civil 3D® 2013 by Autodesk, Inc. Monday, Jul 14 2014
P2B
Hydrograph type = Rational Peak discharge (cfs) = 2.503Storm frequency (yrs) = 25 Time interval (min) = 1Drainage area (ac) = 0.480 Runoff coeff. (C) = 0.87Rainfall Inten (in/hr) = 5.994 Tc by User (min) = 5IDF Curve = Boston IDF curve.IDF Rec limb factor = 1.00
Hydrograph Volume = 751 (cuft); 0.017 (acft)
0 5 10
Q (cfs)
0.00 0.00
1.00 1.00
2.00 2.00
3.00 3.00
Q (cfs)
Time (min)
Runoff Hydrograph
25-yr frequency
Runoff Hyd - Qp = 2.50 (cfs)

hannel ReportHydraflow Express Extension for AutoCAD® Civil 3D® 2013 by Autodesk, Inc. Friday, Jul 11 2014
P1
r ularDiameter (ft) = 1.00
Invert Elev (ft) = 100.00Slope ( ) = 1.00
-Value = 0.011
al ulat onCompute by nown Q
nown Q (cfs) = 3.42
H ghl ghtedDepth (ft) = 0.69Q (cfs) = 3.420Area (sqft) = 0.58Velocity (ft/s) = 5.90
etted Perim (ft) = 1.96Crit Depth, c (ft) = 0.80Top idth (ft) = 0.92E (ft) = 1.23
0 1 2 3
Elev (ft) Depth (ft)e t on
99.50 -0.50
100.00 0.00
100.50 0.50
101.00 1.00
101.50 1.50
102.00 2.00
Reach (ft)
hannel ReportHydraflow Express Extension for AutoCAD® Civil 3D® 2013 by Autodesk, Inc. Friday, Jul 11 2014
P1A
r ularDiameter (ft) = 1.00
Invert Elev (ft) = 100.00Slope ( ) = 1.00
-Value = 0.011
al ulat onCompute by nown Q
nown Q (cfs) = 0.21
H ghl ghtedDepth (ft) = 0.16Q (cfs) = 0.213Area (sqft) = 0.08Velocity (ft/s) = 2.61
etted Perim (ft) = 0.82Crit Depth, c (ft) = 0.19Top idth (ft) = 0.73E (ft) = 0.27
0 1 2 3
Elev (ft) Depth (ft)e t on
99.50 -0.50
100.00 0.00
100.50 0.50
101.00 1.00
101.50 1.50
102.00 2.00
Reach (ft)
hannel ReportHydraflow Express Extension for AutoCAD® Civil 3D® 2013 by Autodesk, Inc. Friday, Jul 11 2014
P1B
r ularDiameter (ft) = 1.00
Invert Elev (ft) = 100.00Slope ( ) = 1.50
-Value = 0.011
al ulat onCompute by nown Q
nown Q (cfs) = 3.21
H ghl ghtedDepth (ft) = 0.57Q (cfs) = 3.210Area (sqft) = 0.46Velocity (ft/s) = 6.91
etted Perim (ft) = 1.71Crit Depth, c (ft) = 0.77Top idth (ft) = 0.99E (ft) = 1.31
0 1 2 3
Elev (ft) Depth (ft)e t on
99.50 -0.50
100.00 0.00
100.50 0.50
101.00 1.00
101.50 1.50
102.00 2.00
Reach (ft)
hannel ReportHydraflow Express Extension for AutoCAD® Civil 3D® 2013 by Autodesk, Inc. Monday, Jul 14 2014
P2
r ularDiameter (ft) = 1.00
Invert Elev (ft) = 100.00Slope ( ) = 1.00
-Value = 0.011
al ulat onCompute by nown Q
nown Q (cfs) = 3.66
H ghl ghtedDepth (ft) = 0.72Q (cfs) = 3.660Area (sqft) = 0.61Velocity (ft/s) = 6.03
etted Perim (ft) = 2.03Crit Depth, c (ft) = 0.82Top idth (ft) = 0.90E (ft) = 1.29
0 1 2 3
Elev (ft) Depth (ft)e t on
99.50 -0.50
100.00 0.00
100.50 0.50
101.00 1.00
101.50 1.50
102.00 2.00
Reach (ft)
MANNING CALCULATIONS

hannel ReportHydraflow Express Extension for AutoCAD® Civil 3D® 2013 by Autodesk, Inc. Monday, Jul 14 2014
P2A
r ularDiameter (ft) = 1.00
Invert Elev (ft) = 100.00Slope ( ) = 1.90
-Value = 0.011
al ulat onCompute by nown Q
nown Q (cfs) = 1.11
H ghl ghtedDepth (ft) = 0.30Q (cfs) = 1.108Area (sqft) = 0.20Velocity (ft/s) = 5.58
etted Perim (ft) = 1.16Crit Depth, c (ft) = 0.45Top idth (ft) = 0.92E (ft) = 0.78
0 1 2 3
Elev (ft) Depth (ft)e t on
99.50 -0.50
100.00 0.00
100.50 0.50
101.00 1.00
101.50 1.50
102.00 2.00
Reach (ft)
hannel ReportHydraflow Express Extension for AutoCAD® Civil 3D® 2013 by Autodesk, Inc. Monday, Jul 14 2014
P2B
r ularDiameter (ft) = 1.00
Invert Elev (ft) = 100.00Slope ( ) = 2.20
-Value = 0.011
al ulat onCompute by nown Q
nown Q (cfs) = 2.50
H ghl ghtedDepth (ft) = 0.44Q (cfs) = 2.503Area (sqft) = 0.34Velocity (ft/s) = 7.47
etted Perim (ft) = 1.45Crit Depth, c (ft) = 0.68Top idth (ft) = 0.99E (ft) = 1.31
0 1 2 3
Elev (ft) Depth (ft)e t on
99.50 -0.50
100.00 0.00
100.50 0.50
101.00 1.00
101.50 1.50
102.00 2.00
Reach (ft)

KELLY ENGINEERING GROUP, INC. Zero Campanelli Drive-Braintree-MA 02184 Phone 781 843 4333
Attachment E Miscellaneous

Prep
ared
For
:Pr
ojec
t Inf
orm
atio
n:En
gine
er:
Cal
cula
tions
Per
form
ed B
y:H
erb
Cha
mbe
rs C
ambr
idge
Her
b C
ham
bers
Stre
et, L
LC64
Cam
brid
ge S
treet
Kel
ly E
ngin
eerin
g G
roup
, Inc
.25
9 M
cGra
th H
ighw
ayS
omer
ville
0 C
ampa
nelli
Driv
eS
omer
ville
MA
0180
3B
rain
tree
MA
0214
5M
A02
184
Pho
neD
ate:
78
1-84
3-43
33Fa
x78
1-84
3-00
28E
mai
lbl
i@ke
llyen
gine
erin
ggro
up.c
om
Inpu
t Giv
en P
aram
eter
sC
ham
ber S
peci
ficat
ions
Uni
t of M
easu
reEn
glis
h30
.5in
ches
Sel
ect M
odel
52.0
0in
ches
8.50
feet
Sto
ne P
oros
ity
40.0
%7.
00fe
etN
umbe
r of H
eade
r Sys
tem
s1
Hea
der
52.2
1cu
. fee
tS
tone
Dep
th A
bove
Cha
mbe
r6
inch
es79
.26
cu. f
eet
Sto
ne D
epth
Bel
ow C
ham
ber
6in
ches
Wor
kabl
e B
ed D
epth
10.0
0fe
et4.
63fe
etM
ax. B
ed W
idth
17.0
0fe
et16
.00
feet
Sto
rage
Vol
ume
Req
uire
d34
50.0
0cu
. fee
t36
37.1
2cu
. fee
t
Mat
eria
ls L
ist
Rec
harg
er 3
30XL
HD
S
torm
wat
er S
yste
m b
y C
ULT
EC, I
nc.
43pi
eces
2pi
eces
42pi
eces
498.
70sq
. yar
ds3
piec
es16
.00
feet
36pi
eces
130.
53cu
. yar
ds3
piec
es27
8.19
cu. y
ards
Bed
Det
ail
Num
ber o
f Row
s W
ide
3pi
eces
Num
ber o
f Cha
mbe
rs L
ong
14pi
eces
Cha
mbe
r Row
Wid
th14
.00
feet
Cha
mbe
r Row
Len
gth
99.5
0fe
etBe
d W
idth
16.0
0fe
etBe
d Le
ngth
101.
50fe
etBe
d Ar
ea R
equi
red
1624
.00
sq. f
eet
Bed
deta
il fo
r ref
eren
ce o
nly.
Not
pro
ject
spe
cific
. Not
to s
cale
. Use
CU
LTEC
Sto
rmG
enie
to o
utpu
t pro
ject
spe
cific
det
ail.
End
Cha
mbe
rsVo
lum
e of
Exc
avat
ion
(mm
/dd)
Ston
e
CU
LTEC
No.
410
™ F
ilter
Fab
ricC
ULT
EC N
o. 2
0L P
olye
thyl
ene
Line
rAc
tual
Num
ber o
f Cha
mbe
rs R
equi
red
Star
ter C
ham
bers
In
term
edia
te C
ham
bers
Rec
harg
er 3
30XL
HD
HVL
V FC
-24
Bed
Dep
thB
ed W
idth
Sto
rage
Vol
ume
Pro
vide
d
Imag
e fo
r vis
ual r
efer
ence
onl
y.M
ay n
ot re
flect
sel
ecte
d m
odel
.
Hei
ght
Wid
thLe
ngth
Inst
alle
d Le
ngth
Bar
e C
ham
ber V
olum
eIn
stal
led
Cha
mbe
r Vol
ume
Appr
ox. U
nit C
ount
- no
t for
con
stru
ctio
n
CU
LTEC
, Inc
.P
.O. B
ox 2
80,
Bro
okfie
ld, C
T 06
804
US
AP
hone
: 203
-775
-441
6 -
Fax
: 203
-775
-146
2 -
ww
w.c
ulte
c.co
mC
opyr
ight
199
6-20
12 C
ULT
EC
, Inc
. -
All
right
s re
serv
edC
ULT
EC
SD
C v
. 201
2-02

Proj
ect N
ame:
Her
b C
ham
bers
Dat
e:
Cro
ss S
ectio
n D
etai
l
3in
ches
10in
ches
6in
ches
30.5
inch
es6
inch
es
42.5
inch
es55
.5in
ches
Con
cept
ual g
raph
ic o
nly.
Not
job
spec
ific.
A6.
0in
ches
B30
.5in
ches
Rec
harg
er 3
30XL
HD
Stor
mw
ater
Sys
tem
C6.
0in
ches
2226
.51
cu. f
eet
D10
.0in
ches
0.91
cu. f
eet
E12
.0fe
et14
09.7
0cu
. fee
tF
52.0
inch
es36
37.1
2cu
. fee
tG
4.83
feet
Cen
ter t
o C
ente
r Spa
cing
Cha
mbe
r Wid
thM
ax. D
epth
of C
over
Allo
wed
Abo
ve C
row
n of
Cha
mbe
rD
epth
of 9
5% C
ompa
cted
Fill
Dep
th o
f Sto
ne A
bove
Uni
ts
Cha
mbe
r Hei
ght
Bed
Dep
th
Pav
emen
t
Tota
l Sto
rage
Pro
vide
dS
tone
Feed
Con
nect
ors
Cha
mbe
rs
Dep
th o
f Sto
ne B
ase
Effe
ctiv
e D
epth
Sto
ne B
elow
Cha
mbe
r Hei
ght
Sto
ne A
bove
95%
Com
pact
ed F
ill
(mm
/dd)
Rec
harg
er 3
30XL
HD
Bre
akdo
wn
of S
tora
ge P
rovi
ded
by
CU
LTEC
, Inc
.P
.O. B
ox 2
80,
Bro
okfie
ld, C
T 06
804
US
AP
hone
: 203
-775
-441
6 -
Fax
: 203
-775
-146
2 -
ww
w.c
ulte
c.co
mC
opyr
ight
199
6-20
12 C
ULT
EC
, Inc
. -
All
right
s re
serv
edC
ULT
EC
SD
C v
. 201
2-02

1
ZERO CAMPANELLI DRIVE BRAINTREE MA 02184 PHONE- 781 843 4333 FAX -781 843 0028
KELLY ENGINEERING GROUP, INC
Groundwater Adjustment (USGS Methodology) Standing water was encountered in TP1. Groundwater was not encountered on TP2. Mottling (seasonal high groundwater) was encountered in TP3. The following is the estimated high groundwater adjustment using USGS Methodology (Frimpter Method). The site is located in the Town of Burlington and soils on the site are predominantly sandy loam. USGS observation well MA-XMW 78 Wilmington, MA was chosen for its proximity and similar soil type to the site.
Frimpter Method Sh=Sc-[Sr(OWc-OWmax)/OWr]
Sh =estimate depth to the high groundwater elevation
Sc =10.1’ (measured depth to the current groundwater elevation at the site)
See Chart Below
Sr =4.2’ (expected range in water levels at the site. This value is based on the combined records of all observation wells for that parent material and landform)
See Fig. 2. Probability of water level range in sands and gravels on valley flats.
OWc =7.9’ (measured depth to the present groundwater elevation in the selected observation well)
See USGS observation well MA-XMW 78 Wilmington, MA June 12, 2014.
OWmax =4.12’ (maximum groundwater elevation on record for the selected observation well)
See USGS maximum water level for observation well MA-XMW 78 Wilmington, MA
OWr =5.94’ (historical upper limit of the annual range for the selected observation well)
See USGS observation well MA-XMW 78 Wilmington, MA
Groundwater Adjustment = Sr(OWc-OWmax)/OWr = 4.2(7.9-4.12)/5.94 = 2.7’
Test Hole # Sc Sh Surface Elevation ESHGW Bottom of Recharge
System
1 10.1 7.4 189.7 182.3 184.5

���
����
����
����
� ��
�
����
����
����
���
����
����
����
���
����
����
��
���
����
�����
�!��
����
���
$&
���
����
��
���
��
���
����
����
���
�
'��
���
�����
*��
���
���
�����
����
�*��
��
�����
*��
�+<\
+^\`
��
����
`��{
�<
������������������������������������������������
�������������������������������������������������������
���
��
���
��
���
���
��
���
��
���
���
����
���
���
����
���
�
���
��
���
��
���
���
��
���
��
���
���
����
���
���
����
���
�
��� ��� ��� �
��� ��� ��� ���
� ��� ��� �
��� ��� ���� �
��� ��� ���� �
��� ��� ��� �
��� ��� ���� �
��� ��� ���� �
�
��� ����������� �
�� �������� ������ ���������� � �
!"�
#�
$� ��� � %
&� '��� ��
� �!"
��
����
��
���(���
���
����
�������
��� "��)�� ���*���
�+ ������� �� , )���
���� -��. / 0�.1 2
���0

��
����
���
��
���
����
�
���
��
��
����
����
���
����
�!$
����
�{�|�
����
����$
}|&
����� ��
���
����
"���
�$"�
����
��*�
����
����
{���
����
��
���
�����
����
����
��*�
����
�
�����
��
��"�
���
���
��*�
����
����
{���
����
��
���
�����
����
����
��*�
����
�
�����
��
��"�
����
����
��*�
����
����
{���
����
��
���
�����
����
����
��*�
����
�
&��
���
���
��
����
� ��
����
���
���
����
�*��
�����
�~
���
|���
����
����
���
���
��
�~��
���
��
���~
����
����
��~��
��
;�
<"��
��> $
���
�����
����
����
����
����
���*
����
����
���
���
����
���$
}|��
����
��
����
���`
�^��
\\\�
'��
���
����
����
� ��
����
����
*���
�����
���
����
��
���
����
��
���{�
����
����
�����
����
����
�{�
���
����
����
����
�
����
����
���
���{
�����
����
���{
� ��
���
����
����
����
���{
���
����
���
���
�����
����
��
����
����
����
����
���
�����
����
��{��
�����
���
���
�����
����
����
���*
����
����
���
����
���
����
����
����
����
��
���
����
����
����
����
�����
����
����
����
� ��
����
���{�
�� ��
��
����
��
���
���
����
�{�
����
����
����
�~��
����
����
����
�*��
���
���
*��
'��
���
�����
*���
�~
���
�����
�++�
����
����
*���
����
����
����
*�
����
���
���
����
��
�'��
���
����
����
��
��<
���&
��
��{��
���
��'
����
����
��*�
����
����
����
�����
��'
���
����
���
����
����
����
���
����
���*
����
����
���
����
����
����
����
�����
���
����
����
����
���$
����
����
���
����
����
���*
����
����
����
����
����
$��
����
����
�����
����
���
����
����
����
����
����
����
��{�
��
����
����
����
����
���
����
{���
����
����
����
����
����
����
��
���
����
����
����
����
����
�{��
�����
��
�$
��~
��
����
�{�
����
����
���{
����
*���
���
����
��&��
���
����
���
�
��
�����
*���
$��
���
��
����
����
����
���
����
����
����
���
*���
$��
���
����
���
���
���`
<���
���`
���^
\`<
��
�� ��
���
����
�����
����
����
����
����
����
��&
�{���
����
����
��̀��
\�\\
\��
�����
���
���
���&
����
���
��
����
����
����
����
����
���
���<
\��̂
\``�
��
�̀�
^\``
����
����
����
����
�����
����
����
��
����
��
�����
����
����
����
���
��
���
����
���
���
����
����
����
�{{�
���{�
� ���
����
����
����
��
����
���
����
����
�����
��
����
�$��
����
�����
���
��
���
���
{���
�{�
����
����
����
���
��
����
���*
���
��
���
����
����
����
� ��
�
����
����
����
���
����
����
����
���
����
����
��
���
����
�����
�!��
����
���
$&
���
����
��
���
��
���
����
����
���
�
'��
���
�����
*��
���
���
�����
����
�*��
��
�����
*��
�+<\
+^\`
��
����
^��{
�<

����������������?
����������������?@���??��$�Z$���*�\����@���>>��_������$`������ z���������{|}!
��*�������$?Z�� ��*��������? ����" � ��������� �� ���������
��� ����������������������� ����
����*���������{��������� ^�� `\\�\�
������������������������ ~�� |{{�{�
�� ��*����
������� ��������� ��������� �{��������������������������� ��������� ������������ ��������{������������������� �������� �������������������������������{�� ��������{�������������+������������� ������ �������������� ��
�����������*����������������� ������������*������� ����������{������� ������������������������������������������������������������� ����������������������������������������������������{�� ������{����� �������������������������������������������������������� ��������$ �����������������������������������{������������������������� ������������������������������������������������������ �������{������{��� �����������������������{{��������������������� ���������������������������������������������������������������������{�� ����� ��� �������������{�������� �������
������������������������������������ ����������� �������� ����������{����}���� ������������������������*����� ������ ������������������������������*�������� ��������� �������������������
����"��*�����
������������� ������ ������������
����������������������������������
����������������������
���������������� ������������������������������ ������������ ������������!���������$
������������ �����������������
'����������*������������������*���������*��
�+<\+^\`������<��{�<

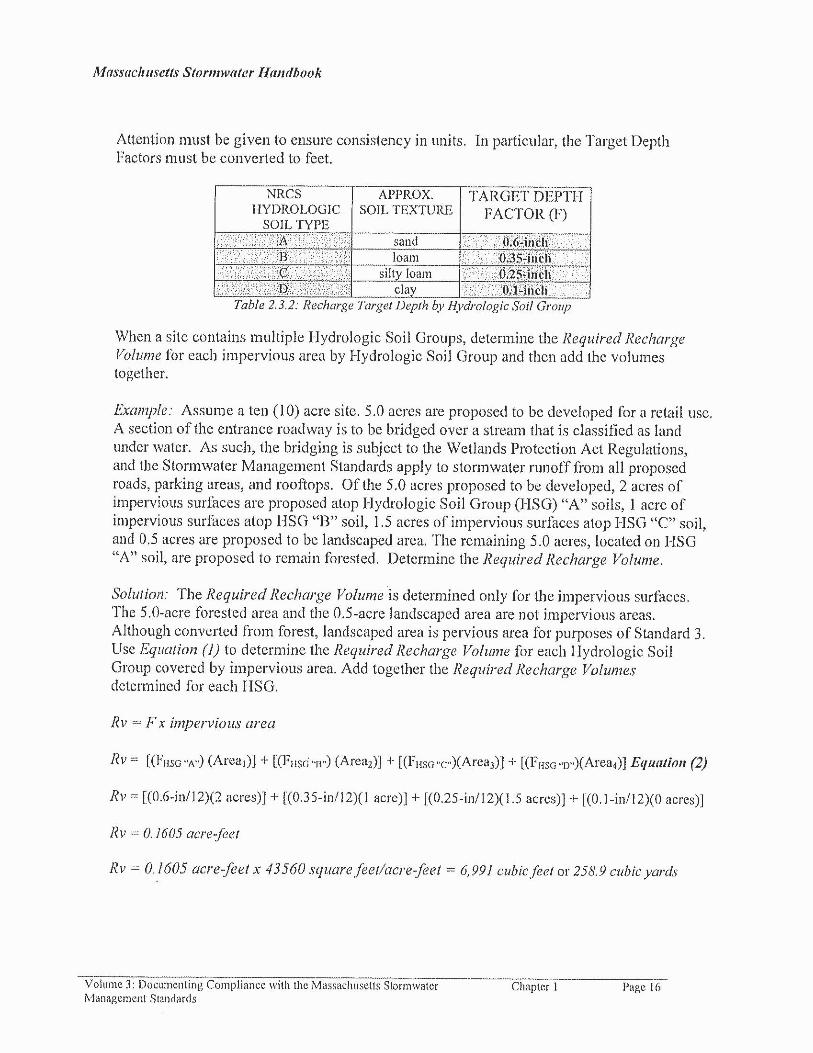

������������������ ������� �������������