Embed Size (px)
Citation preview

REGISTRATION NUMBER: 2014/042417/08 PRESIDENT: Sipho M Pityana VICE PRESIDENT: Martin Kingston CEO: Cas Coovadia NEDLAC CONVENOR: Kaizer Moyane DIRECTORS: Angela Russell, Bongi Kunene, Busisiwe Mavuso, Christopher Campbell, Deidre Penfold, Gwarega Mangozhe, John Dludlu, John Purchase, Roger Baxter, Stavros Nicolaou, Zoleka Lisa. Roger Baxter, Stavros Nicolaou, Zoleka Lisa
NATIONAL OFFICE 61 Katherine Street, Sandton, 2196
P.O. Box 652807, Benmore, 2010 www.busa.org.za +27 11 784 8000
COVID-19: Cargo movement update1 Date: 23 April 2021
Weekly snapshot
Table 1 - Port volumes and air cargo flows, week-on-week
Flows Current2 Previous3
Growth Import Export Total Import Export Total
Port Volumes (TEUs) 26 291 29 119 55 410 30 878 28 931 59 809 ↓7%
Air Cargo (tons) 4 368 3 335 7 703 4 364 2 586 6 951 ↑11%
Monthly snapshot
Figure 1 - Monthly4 cargo flows, year-on-year
Year-to-date Tracker
Figure 2 – International year-to-date flows 2019, 2020 & 20215: ocean & air freight, year-on-year (kg millions)
Key Notes
• An average of ~7,916 TEUs per day was handled last week, ↓7% from the previous week.
• Weekly international air cargo was ↑11% and currently at ~217% compared to the same time in
2020.
1 This update contains a combined overview of air, sea, and road freight to and from South Africa in the last week. The report is the 34th update. 2 ‘Current’ means the last 7 days’ (a week’s) worth of available data. 3 ‘Previous’ means the preceding 8-14 days’ (a week’s) worth of available data. 4 ‘Monthly’ means the last full month’s worth of available data compared to the same month in 2020. 5 For ocean freight, Jan-Mar cargo as reported by Transnet is used; whereas for air freight, Jan-Mar cargo to and from ORTIA is used (see below).
110%
114%
106%
102%
110%
217%
84%
0% 50% 100% 150% 200% 250%
Total Containers (TEUs)
TEUs Landed
TEUs Shipped
Vehicles (Units)
Total Cargo (excl. Vehicles)
International Air Cargo
Domestic Air Cargo
0 20 40 60 80
2021
2020
2019
International Ocean Freight
0 20 40 60 80
2021
2020
2019
International Air Freight

2
• Weekly domestic air cargo was ↓7% and currently at ~84% compared to the same time in 2020.
• Cross-border queue (~3.6hrs) & transit (~18.6hrs) times cost industry R247 million (↑9%) this week.
• Payload freight transportation (rail and road) decreased y-o-y by ↓6.4% in February 2021, as the
revenue decreased by ↓4.7% over the same period, according to Stats SA.
• For international air cargo, a ↑13.1% growth in cargo tonne-kilometres (CTKs) is expected in 2021.
Executive Summary
This update — the 35th of its kind — contains a consolidated overview of the South African supply chain and
the current state of international trade. Newly reported COVID-19 infections in South Africa have averaged
approximately 1,202 per day this week (marginally up from last week's average of 1,137). The total number
of cases recorded now stands at 1,571,3486, with a death toll amounting to 53,995 (up by 424). Globally,
South Africa dropped to 20th place (overtaken by Indonesia this week), as a worldwide total of some 145
million cases has now been recorded. In terms of administering vaccines, the international project continues
with more than 973 million doses of COVID-19 vaccines administered, constituting ~12.5%7 of the world's
population at the time of writing. According to the same source, South Africa still stands on 292,623 vaccine
jabs, unchanged from last week, as the country suspended its vaccination programme on 13 April as a
precautionary measure after fears of developing blood clots from the J&J vaccine8.
At our domestic container terminals, minor operational delays occurred at our respective commercial ports
over the week due to weather conditions. Nevertheless, the industry has experienced an upturn in
productivity over the medium term, although it is too early to tell whether this is a positive trend or not. For
the global maritime industry, trade continues to be affected by the three-pronged impact of container
imbalances, port congestion and low productivity. As has been widely reported, these constraints have
meant that global freight rates have increased substantially. As such, the "World Container Index" remains
very high again, rising by ↑0.2% to $4,913.07 per 40ft container this week.
The daily average volume of air cargo handled at ORTIA over the seven days starting 12 April amounted to
436 818 kg inbound and 333 479 kg outbound. This is an average of 770 297 kg per day. Concerning the
global aviation industry, the net loss forecasts imply industry-wide cash burn in 2021 of ↓$81bn.
International revenue passenger kilometres (RPKs) are forecast to add up to a mere 26% versus 2020 due to
a weaker than expected start to the year. Fortunately, the domestic passenger market is more robust, as is
the ongoing strength of the cargo market segment. For the year, a ↑13.1% growth in industry-wide cargo
tonne-kilometres (CTKs) is expected. Nevertheless, the aviation industry is forecast to only reach about ~55%
revenue levels of pre-crisis 2019, as cargo revenues are insufficient to offset shrunken passenger revenues.
For freight transportation by rail and road, Stats SA released preliminary figures for the industry for February.
The headline figure shows that the volume of goods transported (payload) decreased by ↓6.4% in February
2021 compared with February 2020. For the three months to February 2021, income for the industry has
also reduced, this time by ↓5.4% compared with the three months ended February 2020. The main
contributing factors to this decrease were manufactured foods, beverages, and tobacco products (↓21.9%)
and primary mining and quarrying products (↓3.3%).
In summary, it appears that South Africa is maintaining a steady course as far as the economic outlook is
concerned. Volumes in most modalities increased compared to the same time last year; however, we are far
removed from the situation faced in 2020. Nevertheless, for business to truly return to 'normal', further
6 Johns Hopkins, Coronavirus Resource Centre. Coronavirus JJHU 7 Our World in Data, Coronavirus (Covid-19) Vaccinations. Our World in Data 8 Stolz, E. 22/04/2021. South Africa to continue with J&J vaccine as cabinet lifts suspension.
3
change is needed, especially on the health front. The aviation case is much the same as for the extended
supply chain. Hopefully, with global vaccine programmes accelerating, some markets will start to open
around the second half of the year. Unfortunately, as is the case for South Africa, widespread vaccinations
have not yet been as rapid as had been expected earlier in the year.
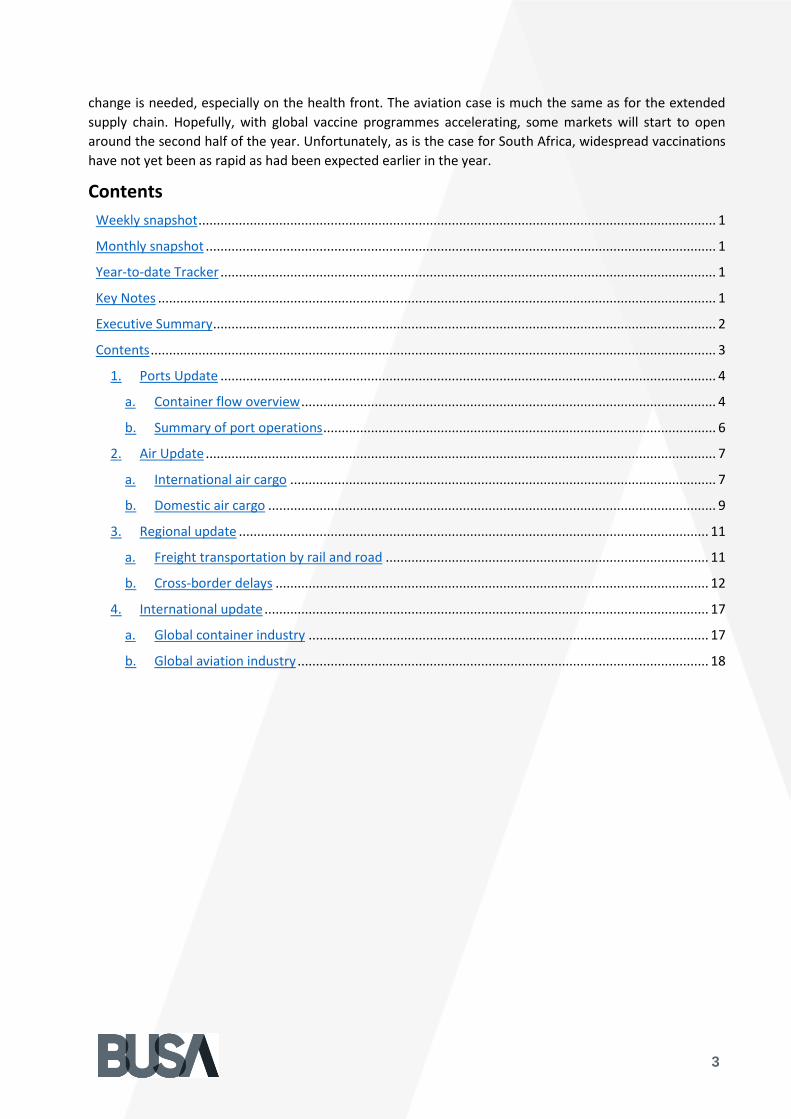
Contents
Weekly snapshot ............................................................................................................................................. 1
Monthly snapshot ........................................................................................................................................... 1
Year-to-date Tracker ....................................................................................................................................... 1
Key Notes ........................................................................................................................................................ 1
Executive Summary ......................................................................................................................................... 2
Contents .......................................................................................................................................................... 3
1. Ports Update ....................................................................................................................................... 4
a. Container flow overview ................................................................................................................. 4
b. Summary of port operations ........................................................................................................... 6
2. Air Update ........................................................................................................................................... 7
a. International air cargo .................................................................................................................... 7
b. Domestic air cargo .......................................................................................................................... 9
3. Regional update ................................................................................................................................ 11
a. Freight transportation by rail and road ........................................................................................ 11
b. Cross-border delays ...................................................................................................................... 12
4. International update ......................................................................................................................... 17
a. Global container industry ............................................................................................................. 17
b. Global aviation industry ................................................................................................................ 18

4
Ports Update
This section provides an overview of the flow of containerised cargo through South Africa's commercial
ports.
Container flow overview
The following two tables indicate the container flows reported for the last seven days and those projected
for the next seven days.
Table 2 - Container Ports - 7-day flow reported for 17 to 23 April 9
7-day flow forecast (17.04.2021 - 23.04.2021)
TERMINAL NO. OF CONTAINERS TO DISCHARGE (IMPORT)
NO. OF CONTAINERS TO LOAD (EXPORT)
DURBAN CONTAINER TERMINAL PIER 1: 4 853 4 397
DURBAN CONTAINER TERMINAL PIER 2: 10 752 13 900
CAPE TOWN CONTAINER TERMINAL: 5 411 4 750
NGQURA CONTAINER TERMINAL: 4 303 5 312
GQEBERHA CONTAINER TERMINAL: 972 760
TOTAL: 26 291 29 119
Source: Transnet, 2021. Updated 23/04/2021.
Table 3 - Container Ports - 7-day flow forecasted for 24 to 30 April10
7-day flow forecast (24.04.2021 - 30.04.2021)
TERMINAL NO. OF CONTAINERS TO DISCHARGE (IMPORT)
NO. OF CONTAINERS TO LOAD (EXPORT)
DURBAN CONTAINER TERMINAL PIER 1: 4 530 3 748
DURBAN CONTAINER TERMINAL PIER 2: 13 691 17 315
CAPE TOWN CONTAINER TERMINAL: 6 655 7 590
NGQURA CONTAINER TERMINAL: 3 081 3 949
GQEBERHA CONTAINER TERMINAL: 701 950
TOTAL: 28 658 33 552
Source: Transnet, 2021. Updated 23/04/2021.
An average of ~7,916 TEUs (↓7%) was handled per day for the last week (17-23 Apr, Table 2), with an
increased average of around ~8,887 TEUs (↑%12) expected to be handled for the next week (24-30 Apr,
Table 3). The same week in April 2020 – at around week 3 of the initial hard lockdown – showed a daily
average of approximately ~8,051 TEUs.
In general terms, our domestic container industry had a challenging week (see summary below). In contrast,
the narrative around elevated prices due to container imbalances, port congestion and low productivity
continues to affect trade (see the global situation below).
The following figure displays the rolling monthly average flows of total containerised cargo movement for
our commercial ports since the start of the nationwide lockdown.
9 It remains important to note that a fair percentage (approximately 28% according to the most recent TNPA figures for March) of containers are neither to be imported nor exported, but rather consist of empties and transhipments. Due to container imbalances, this proportion is fluctuating more than usual, and will have increased since December. 10 As noted in footnote 1.

5
Figure 3 - Monthly flow reported for total cargo movement (TEUs: April 2020 to Present; month-on-month)
Source: Calculated using data from Transnet, 2021. Updated 23/04/2021.
The figures below show the weekly container flows for the previous seven days and projections for the next
seven days. The short-term forecast predicts a slight increase for next week but showing a typical picture for
this time of year.
Figure 4 - 7-day flow reported for total cargo movement (17 to 23 April; per port; day-on-day)
Source: Calculated using data from the Transnet updates, 2021. Updated 23/04/2021.
0
20
40
60
80
100
120
140
Tho
usa
nd
s
DURBAN CONTAINER TERMINAL PIER 1 DURBAN CONTAINER TERMINAL PIER 2
CAPE TOWN CONTAINER TERMINAL NGQURA CONTAINER TERMINAL
PORT ELIZABETH CONTAINER TERMINAL Trendline
-2
0
2
4
6
8
10
12
14
17-Apr 18-Apr 19-Apr 20-Apr 21-Apr 22-Apr 23-Apr
Tho
usa
nd
s
7-day flow - 17 April to 23 April
DURBAN CONTAINER TERMINAL PIER 1 DURBAN CONTAINER TERMINAL PIER 2
CAPE TOWN CONTAINER TERMINAL NGQURA CONTAINER TERMINAL
PORT ELIZABETH CONTAINER TERMINAL

6
Figure 5 - 7-day flow reported for total cargo movement (24 to 30 April; per port; day-on-day)
Source: Calculated using data from the Transnet updates, 2021. Updated 23/04/2021.
Summary of port operations
An average of ~7,916 TEUs (↓7%) was handled per day for the last week (17-23 Apr, Table 2), with an
increased average of around ~8,887 TEUs (↑%12) expected to be handled for the next week (24-30 Apr,
Table 3). The same week in April 2020 – at around week 3 of the initial hard lockdown – showed a daily
average of approximately ~8,051 TEUs.
Weather delays
Over the weekend, Durban experienced some land and waterside operations delays at Piers 1 and 2. The
delays were primarily due to strong windy conditions, which started last week on Friday. The weather
improved over the weekend, giving DCT a reasonable chance for smooth operations early this week.
However, strong SE winds halted operations briefly again on Wednesday. It is forecast that conditions will
improve by the end of this week, shifting to SW winds around ±15km/h.
Cape Town port has been struggling due to smoke coming from the fire from Table Mountain, coupled with
strong SE winds. On Thursday morning, the port was fog bound for several hours. The weather cleared
towards the end of the week, providing better-operating conditions.
In the Eastern Cape, NCT experienced strong Northerly and Easterly winds throughout the week.
Fortunately, the winds are expected to subside over the weekend.
Cape Town Container Terminal (CTCT)
It was a trying time for the Port of Cape Town over the past week. Smoke originating from the fire from Table
Mountain and strong SE winds hampered operations to a significant extent. Since early Thursday morning,
the port has been intermittently fog-bound and was also left with only two tugs – one of which is currently
undergoing repairs. Despite these challenges and operational breakdowns of equipment, the port was fully
functional so far. During the last week or so, CTCT reportedly handled over 17,000 containers.
-2
0
2
4
6
8
10
12
14
16
24-Apr 25-Apr 26-Apr 27-Apr 28-Apr 29-Apr 30-Apr
Tho
usa
nd
s
7 day flow - 24 April to 30 April
DURBAN CONTAINER TERMINAL PIER 1 DURBAN CONTAINER TERMINAL PIER 2
CAPE TOWN CONTAINER TERMINAL NGQURA CONTAINER TERMINAL
PORT ELIZABETH CONTAINER TERMINAL

7
The delays at MPT over the past two weeks have resulted in some vessel owners and agents switching to
FPT to service their vessels. A total of nine vessels was handled at FPT last week, with a further six calling
this week. Luckily, the mobile cranes at MPT are once again fully operational after the struggles experienced
last week. The industry's change in fortune is welcomed as the MPT handled and sailed two vessels with no
vessels at anchor this week. The next vessel at MPT is expected to come in on Sunday. Stack occupancy at
CTCT reached 60% this week, with exports dominating. Once again, two dedicated truck lanes were
established for the fruit industry, and night runs were operated from Mondays to Saturdays (after gate
closure at 22:00 to 06:00).
Durban Container Terminal (DCT)
Durban operations were affected slightly by strong winds on Wednesday, with conditions improving
approaching the weekend. The reefer system is beginning to ramp up with the surge of export reefers
impacting accessibility to both piers. A meeting has been scheduled on Friday to address these accessibility
issues that could disrupt GP traffic. Stack occupancy has been at 100% again at Pier 1, with trans-shipment
containers taking up most of the available space. This high occupancy can lead to serious problems with
terminal fluidity. At Pier 2, stack occupancy has decreased to ~20%.
Eastern Cape Container Terminals
A high voltage substation is currently being installed at NCT berth 102, which will leave the berth non-
operational for some time. The Moormaster at D100 is still under repair, restricting access in the short-term
depending on vessel length. For the week, stack occupancy at NCT has decreased even further, standing
currently at ~20%.
Transnet Freight Rail (TFR)
Due to the recent unrest in Krugersdorp, the line from Mafikeng to Gaborone remained closed on
Wednesday and Thursday. Protesters were permitted to march from Itsoseng service road to Malibongwe
Drive and then head to South Africa Boulevard, causing nearby shopping centres to close due to safety
concerns. Increased drug operations in the area have motivated the community to call upon the municipality
and the SAPS to intervene more drastically. They demanded that SAPS conduct raids throughout the
neighbourhood to track down drug dens. Around 60 arrests were made on Thursday.
General
On Wednesday at DCT Pier 2, a transporters meeting was held with no noticeable positive conclusions
around the appointment system and availability of slots. Furthermore, regarding the upgrading process to
Navis Smart Platform 3.7, TPT confirmed that the expected shutdown would be planned for over the
weekend of the 15th and 16th of May. SAASOA still needs to be contacted regarding the request to have the
shipping lines extend the free time allowed for containers trapped in DCT over that period.
Air Update
a. International air cargo
The following table depicts the inbound and outbound air cargo flows to and from ORTIA for the week
starting 12 April. For comparative purposes, the average air freight cargo (inbound and outbound) handled
at ORTIA in March 2020 averaged about 731 309 kg per day11.
11 Note, when including statistics from South Africa’s other two international airports, Cape Town International and King Shaka (Durban) International airports, the total figure rises to 809 152 kg per day.

8
Table 4 - International inbound and outbound cargo from OR Tambo
Flows 12-Apr 13-Apr 14-Apr 15-Apr 16-Apr 17-Apr 18-Apr
Volume inbound 525 489 280 993 409 999 411 038 358 869 288 091 783 246
Volume outbound 207 402 263 026 254 445 296 691 290 420 285 000 737 369
Total handled per day 732 891 544 019 664 444 707 729 649 289 573 091 1 520 615
Courtesy of ACOC. Updated: 19/04/2021
The daily average volume of air cargo handled at ORTIA over the seven days starting 12 April amounted to
436 818 kg inbound and 333 479 kg outbound. This gives a total average of 770 297 kg per day or
approximately ~217% compared to April 2020 (and ~79% compared to April 2019). As Figure 1 above clearly
illustrates, international air cargo volumes show a significant year-on-year increase, terrific news for the
industry.
The following figure shows monthly international freight movement at ORTIA during the state of disaster,
with volumes generally trending upwards in the last few months.
Figure 6 - International inbound and outbound cargo from OR Tambo (thousands)
Courtesy of ACOC. Updated: 18/04/2021.
The following figure shows a summary of the devastating impact of the pandemic on air cargo. The figure
compares the total international freight for 2019 to 2020.
0
100
200
300
400
500
600
Inbound Outbound
9
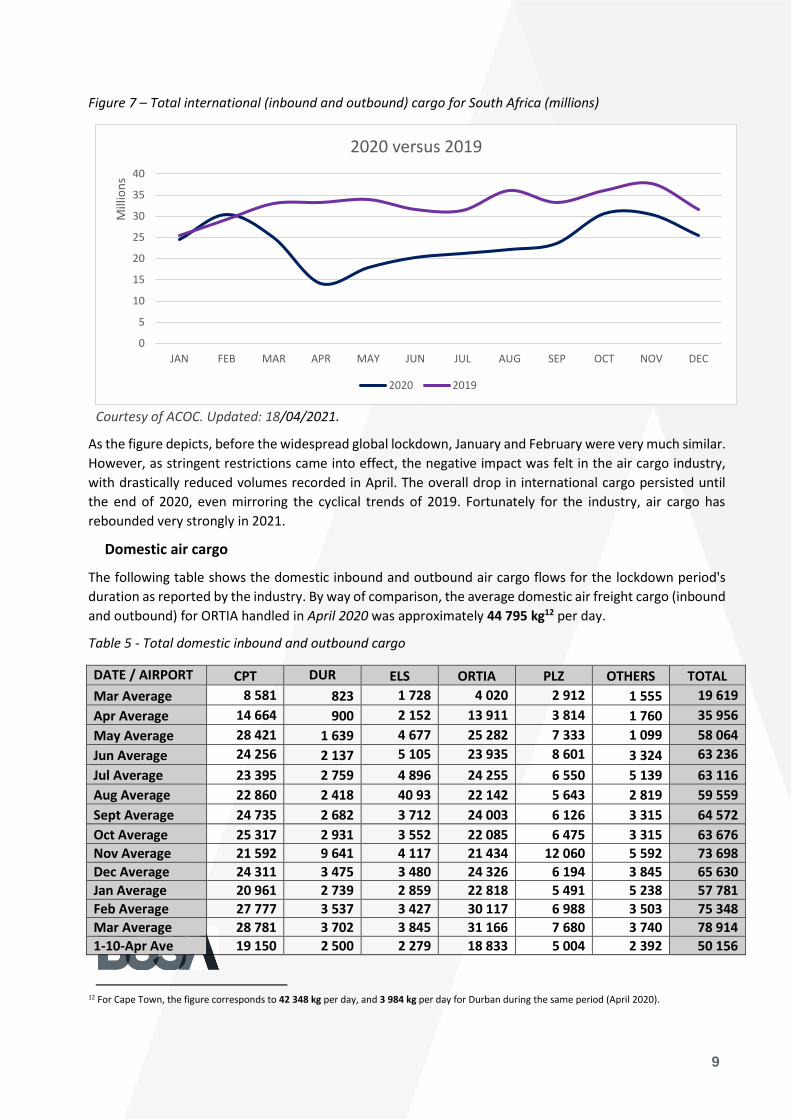
Figure 7 – Total international (inbound and outbound) cargo for South Africa (millions)
Courtesy of ACOC. Updated: 18/04/2021.
As the figure depicts, before the widespread global lockdown, January and February were very much similar.
However, as stringent restrictions came into effect, the negative impact was felt in the air cargo industry,
with drastically reduced volumes recorded in April. The overall drop in international cargo persisted until
the end of 2020, even mirroring the cyclical trends of 2019. Fortunately for the industry, air cargo has
rebounded very strongly in 2021.
Domestic air cargo
The following table shows the domestic inbound and outbound air cargo flows for the lockdown period's
duration as reported by the industry. By way of comparison, the average domestic air freight cargo (inbound
and outbound) for ORTIA handled in April 2020 was approximately 44 795 kg12 per day.
Table 5 - Total domestic inbound and outbound cargo
DATE / AIRPORT CPT DUR ELS ORTIA PLZ OTHERS TOTAL
Mar Average 8 581 823 1 728 4 020 2 912 1 555 19 619
Apr Average 14 664 900 2 152 13 911 3 814 1 760 35 956
May Average 28 421 1 639 4 677 25 282 7 333 1 099 58 064
Jun Average 24 256 2 137 5 105 23 935 8 601 3 324 63 236
Jul Average 23 395 2 759 4 896 24 255 6 550 5 139 63 116
Aug Average 22 860 2 418 40 93 22 142 5 643 2 819 59 559
Sept Average 24 735 2 682 3 712 24 003 6 126 3 315 64 572
Oct Average 25 317 2 931 3 552 22 085 6 475 3 315 63 676
Nov Average 21 592 9 641 4 117 21 434 12 060 5 592 73 698
Dec Average 24 311 3 475 3 480 24 326 6 194 3 845 65 630
Jan Average 20 961 2 739 2 859 22 818 5 491 5 238 57 781
Feb Average 27 777 3 537 3 427 30 117 6 988 3 503 75 348
Mar Average 28 781 3 702 3 845 31 166 7 680 3 740 78 914
1-10-Apr Ave 19 150 2 500 2 279 18 833 5 004 2 392 50 156
12 For Cape Town, the figure corresponds to 42 348 kg per day, and 3 984 kg per day for Durban during the same period (April 2020).
0
5
10
15
20
25
30
35
40
JAN FEB MAR APR MAY JUN JUL AUG SEP OCT NOV DEC
Mill
ion
s
2020 versus 2019
2020 2019

10
11-Apr-21 3 276 864 85 1 722 451 417 6 813
12-Apr-21 48 025 4 725 5 569 54 146 11 863 5 442 129 770
13-Apr-21 39 733 6 756 6 819 40 112 10 927 5 689 110 036
14-Apr-21 44 893 6 589 5 662 51 428 11 701 5 053 125 326
15-Apr-21 44 770 5 430 4 345 30 744 11 216 5 878 102 383
16-Apr-21 19 870 2 330 3 080 28 565 4 929 3 797 62 572
17-Apr-21 2 431 1 261 45 2 709 264 169 6 878
18-Apr-21 2 971 379 70 1 694 884 548 6 545
19-Apr-21 47 034 5 126 4 864 47 773 13 266 4 901 122 963
Grand Total 2 764 268 357 143 357 093 2 964 006 719 517 360
121 7 522 147
Courtesy of BAC. Updated: 20/04/2021.
Currently, the average domestic air cargo moved in the last week was ~76 672 kg per day, showing a
decrease of ↓7% compared to the previous week, which was affected by the Easter weekend slowdown.
Therefore, the weekly numbers constitute approximately ~84% compared to the same time the previous
year (~90% the previous week) and around ~41% compared to the same time in 2019.
The following figure highlights the total monthly domestic air cargo moved per airport as per the table above,
with a noticeable uptick in volumes for both CPT and JNB in February and March. April numbers only contain
19 days, which illustrates the continuation of the recent upward trend also experienced in the domestic
aviation industry.
Figure 8 - Total domestic inbound and outbound cargo13
Courtesy of BAC. Updated: 20/04/2021.
As with the international stats, the following figure shows a summary of the effect of the pandemic on the
domestic aviation industry. The figure compares the total domestic freight for 2019 to 2020.
13 Note, April only includes 19 days’ worth of data.
-
5
10
15
20
25
30
35
Tho
usa
nd
s
CPT DUR ELS JNB PLZ OTHERS

11
Figure 9 - Total domestic (JNB, CPT and DUR) cargo for South Africa (millions)
Courtesy of BAC. Updated: 20/04/2021.
Compared to the international overview, the domestic scene is somewhat different. The initial impact was
less severe; however, the domestic air cargo industry did not rebound until the start of 2021. Conversely,
the gap between 2019 and 2020 grew wider as the year went on.
Regional update
a. Freight transportation by rail and road
On Monday, 19 April, Stats SA released preliminary figures on the land transport (freight transportation by
rail and road) industry for February14. The headline figure shows that the volume of goods transported
(payload) decreased by ↓6.4% in February 2021 compared with February 2020. The corresponding income
decreased by ↓4.7% over the same period. These figures continue to show the devasting effect of the
pandemic on the freight industry. However, the negative trend runs deeper. The year-on-year percentage
change in payload has registered a negative return since July 2019, bar a 4.2% increase in December last
year. The following figure illustrates this continued decline.
14 StatsSA. 19/04/2021. Land transport.
0
2
4
6
8
10
12
JAN FEB MAR APR MAY JUN JUL AUG SEP OCT NOV DEC
Mill
ion
s
2020 versus 2019
2020 2019

12
Figure 10 – Freight transportation: year-on-year percentage change in payload
Source: Stats SA
Besides the decrease in the volume of goods transported, the accompanying income from freight
transportation has also decreased. In the three months to February 2021, income has decreased by ↓5.4%
compared with the three months ended February 2020. Stats SA notes that the main contributing factors to
this decrease were:
• Manufactured foods, beverages, and tobacco products (↓21.9%, contributing ↓2.6% to the total),
• Primary mining and quarrying products (↓3.3%, contributing ↓1.2% to the total).
These determinants do not come as a surprise, given the reduced overall activity within these sectors.
Moreover, the recurring alcohol bans running into the December holiday period also produced a marked
adverse impact. Worth noting is that, in compiling these statistics, Stats SA uses survey data on land
transportation. For the period in question, the collection rate was 85% in February. So, although not
comprehensive, these figures provide a good indication of the trends around the critical mass in the industry.
As with both the aviation and maritime industries, the road freight industry is more optimistic about the
outlook in the near term.
b. Cross-border delays
Significant events happening on the road this week included issues with Zimra's tracking seal activation at
Beit Bridge. Unfortunately for the industry, this has been an ongoing issue. Secondly, South Africa's poultry
exporters received a blow to operations. Last week, Botswana released a notice of immediate suspension of
importation and transit of all live poultry, birds, and poultry products from South Africa following an
outbreak of a strain of avian flu at a commercial chicken farm on the East Rand15. Both Namibia and
Mozambique have subsequently followed suit. However, unlike the other two countries, Namibia has only
suspended imports from Johannesburg's East Rand area.
15 Gilili, C. 20/04/2021. Bird flu outbreak puts poultry industry in jeopardy.

13
Besides these two significant events, investigations continue into cross-border delays experienced at several
SADC border posts on the regional road freight front. The following table uses geo-fencing data to summarise
delays experienced at several borders during the last week.
Table 6 - Delays16 summary – Selected SADC borders
Countries Border Queue Time (hh:mm)
Border Time (hh:mm)
HGV Arrivals per day
HGV Tonnage per day
Weekly HGV Arrivals
HGV Delay Hours
Queue Time Delays
Nam/SA Ariamsvlei/Nakop 1:00 27:00 100 3 000 700 17 500 700
SA/Zim Beit Bridge 0:00 17:00 943 28 290 6 601 99 015 -
Moz/Zam Cassacatiza/Mlolo 1:00 19:00 60 1 800 420 7 140 420
Zam/Zim Chirundu 6:00 25:00 616 18 480 4 312 99 176 25 872
Moz/Mal Dedza 1:00 20:00 50 1 500 350 6 300 350
SA/Bot Groblersbrug/Martins Drift 1:00 8:00 400 12 000 2 800 16 800 2 800
Zam/DRC Kasumbalesa 0:00 48:00 592 17 760 4 144 165 760 -
Zam/Bot Kazungula 0:00 43:00 212 6 360 1 484 60 844 -
SA/Bot Kopfontein/Tlokweng 5:00 25:00 100 3 000 700 16 100 3 500
Moz/Zim Machipanda/Forbes 0:00 6:00 320 9 600 2 240 8 960 -
Moz/Mal Milange 0:00 6:00 30 900 210 840 -
Zam/Tan Nakonde/Tunduma 0:00 0:00 500 15 000 3 500 -7 000 -
Zim/Moz Nyamapanda 0:00 7:00 100 3 000 700 3 500 -
SA/Moz Ressano Garcia 33:00 31:00 400 12 000 - 81 200 92 400
SA/Bot Skilpadshek/Pioneer Gate 8:00 20:00 300 9 000 770 37 800 16 800
Nam/Bot Trans Kalahari/Mamuno - 0:00 110 3 300 700 -1 540 -
Moz/Mal Zobue/Mwanza 2:00 23:00 100 3 000 700 14 700 1 400
4 933 147 990 34 531 627 095 144 242
Source: TLC & FESARTA, week ending 19/04/2021.
The following graph shows the weekly change in cross-border times from South Africa's perspective.
16 It should be noted that the root cause of the reported delays is uncertain at this point. Moreover, the delays can be multiple and widely distributed. Therefore, they cannot be exclusively attributed to a specific common cross-border constraint since we do not have a transparent view of the entire border process in granular detail. The causes of these bottlenecks typically include poor infrastructure, road congestion, lack of coordination between neighbouring countries and Customs (or OGA) stops, among other trade obstacles.

14
Figure 11 – Weekly cross-border delays from the South African side (delay in hours)
Source: TLC & FESARTA, week ending 19/04/2021.
Compared with previous weeks, the cross-border queue times have remained relatively stable, bar a
significant increase at the Lebombo/Ressano Garcia crossing. This situation is yet another repeat of slow
crossings into Mozambique, which has plagued the industry for much of the last year. The cross-border
transit times have stayed the same, except for a slight increase at Kopfontein. The same pattern of lengthy
cross-border transit times is repeated in the graph below, which illustrates the road freight industry's
estimated cost caused by border delays. The graphs show both the respective border crossings as well as
the collective corridors.
0
5
10
15
20
25
30
35
Weekly cross-border times from South Africa's side
Cross-border Queue Times (Hours) Cross-border Transit Time (Hours)

15
Figure 12 - Cross border delays (in hours)
Source: TLC & FESARTA, week ending 19/04/2021.
The image below shows the cross-border delays experienced in the region. The graphs show both the
individual border crossings as well as the collective corridors.
0
10
20
30
40
50
60
Cross-border Queue Times (Hours) Cross-border Transit Time (Hours)
Cross-border delays: Border Posts
Ariamsvlei Beit Bridge Cassacatiza/Mlolo Chirundu
Dedza Groblersbridge Kasumbalesa Kazungula
Kopfontein/Tlokweng Machipanda/Forbes Mchinji/Mwame Nakonde/Tunduma
Shesheke/Wenela Skilpadshek/Pioneer Gate Trans Kalahari/Mamuno Zobue/Mwanza
0
5
10
15
20
25
30
Cross-border Queue Times (Hours) Cross-border Transit Time (Hours)
Cross-border delays: Corridors
Beira Corridor Maputo Corridor Nacala Corridor North-South Trans Kalahari Trans Oranje

16
Figure 13 - Weekly cost of delays - North-South Corridor/Trans Kalahari Corridor/ Maputo Corridor)
Source: TLC & FESARTA, week ending 12/04/2021.
In summary, the cross-border queue time has averaged ~3.6 hours (which is higher than that experienced in
the previous week at ~2.1 hours) and cost the transport industry an estimated $2.9 million (R46.2 million).
In comparison, the average cross-border transit time has slightly decreased to an average of ~18.6 hours
(~20 hours last week), which cost the transport industry an estimated $12.5 million (R201.0 million). The
total cost for the week mentioned above amounts to an estimated R247 million (up by approximately R21
million from R226 million last week).
$- 500
$-
$ 500
$1 000
$1 500
$2 000
$2 500
$3 000
$3 500
Tho
usa
nd
s
Cross-border costs: Border Posts
Weekly Queue Time Delays @ $20 per hour Weekly Cost of Excess Border Delays @ $20 per hour
$-
$200
$400
$600
$800
$1 000
$1 200
Beira Corridor Maputo Corridor North-South Trans Kalahari Trans Oranje
Tho
usa
nd
s
Cross-border costs: Corridors
Weekly Queue Time Delays @ $20 per hour Weekly Cost of Excess Border Delays @ $20 per hour
17
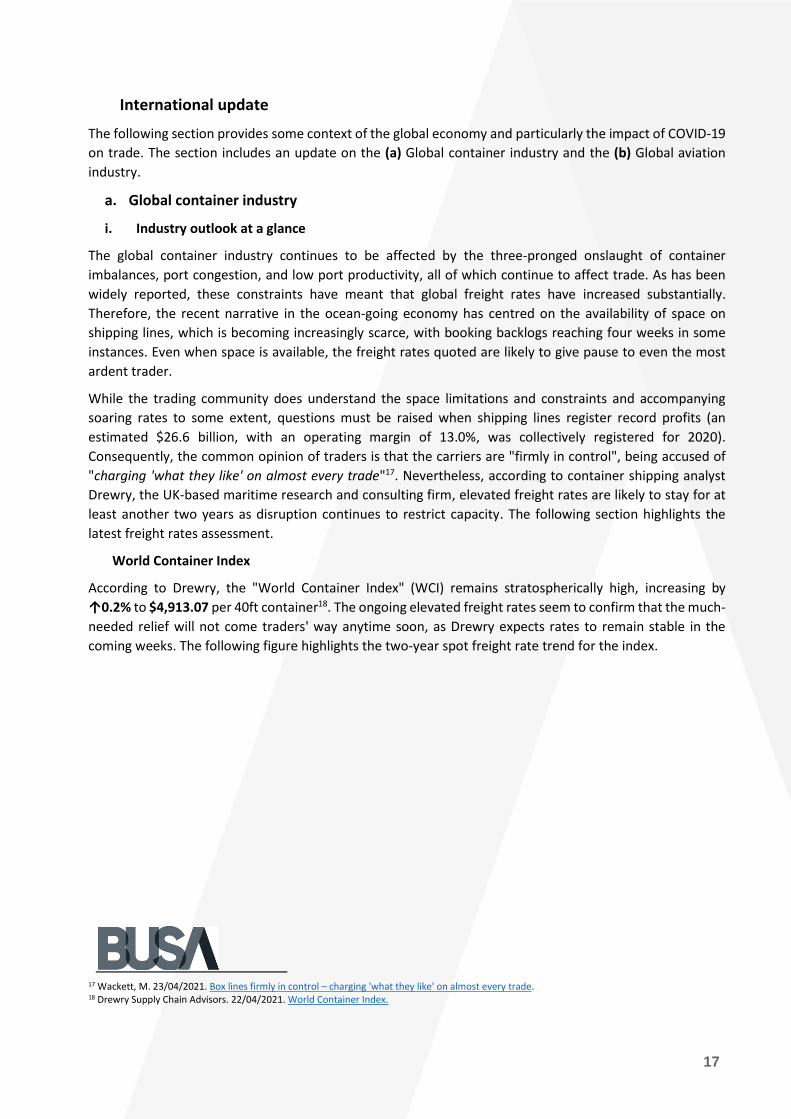
International update
The following section provides some context of the global economy and particularly the impact of COVID-19
on trade. The section includes an update on the (a) Global container industry and the (b) Global aviation
industry.
a. Global container industry
i. Industry outlook at a glance
The global container industry continues to be affected by the three-pronged onslaught of container
imbalances, port congestion, and low port productivity, all of which continue to affect trade. As has been
widely reported, these constraints have meant that global freight rates have increased substantially.
Therefore, the recent narrative in the ocean-going economy has centred on the availability of space on
shipping lines, which is becoming increasingly scarce, with booking backlogs reaching four weeks in some
instances. Even when space is available, the freight rates quoted are likely to give pause to even the most
ardent trader.
While the trading community does understand the space limitations and constraints and accompanying
soaring rates to some extent, questions must be raised when shipping lines register record profits (an
estimated $26.6 billion, with an operating margin of 13.0%, was collectively registered for 2020).
Consequently, the common opinion of traders is that the carriers are "firmly in control", being accused of
"charging 'what they like' on almost every trade"17. Nevertheless, according to container shipping analyst
Drewry, the UK-based maritime research and consulting firm, elevated freight rates are likely to stay for at
least another two years as disruption continues to restrict capacity. The following section highlights the
latest freight rates assessment.
World Container Index
According to Drewry, the "World Container Index" (WCI) remains stratospherically high, increasing by
↑0.2% to $4,913.07 per 40ft container18. The ongoing elevated freight rates seem to confirm that the much-
needed relief will not come traders' way anytime soon, as Drewry expects rates to remain stable in the
coming weeks. The following figure highlights the two-year spot freight rate trend for the index.
17 Wackett, M. 23/04/2021. Box lines firmly in control – charging 'what they like' on almost every trade. 18 Drewry Supply Chain Advisors. 22/04/2021. World Container Index.
18
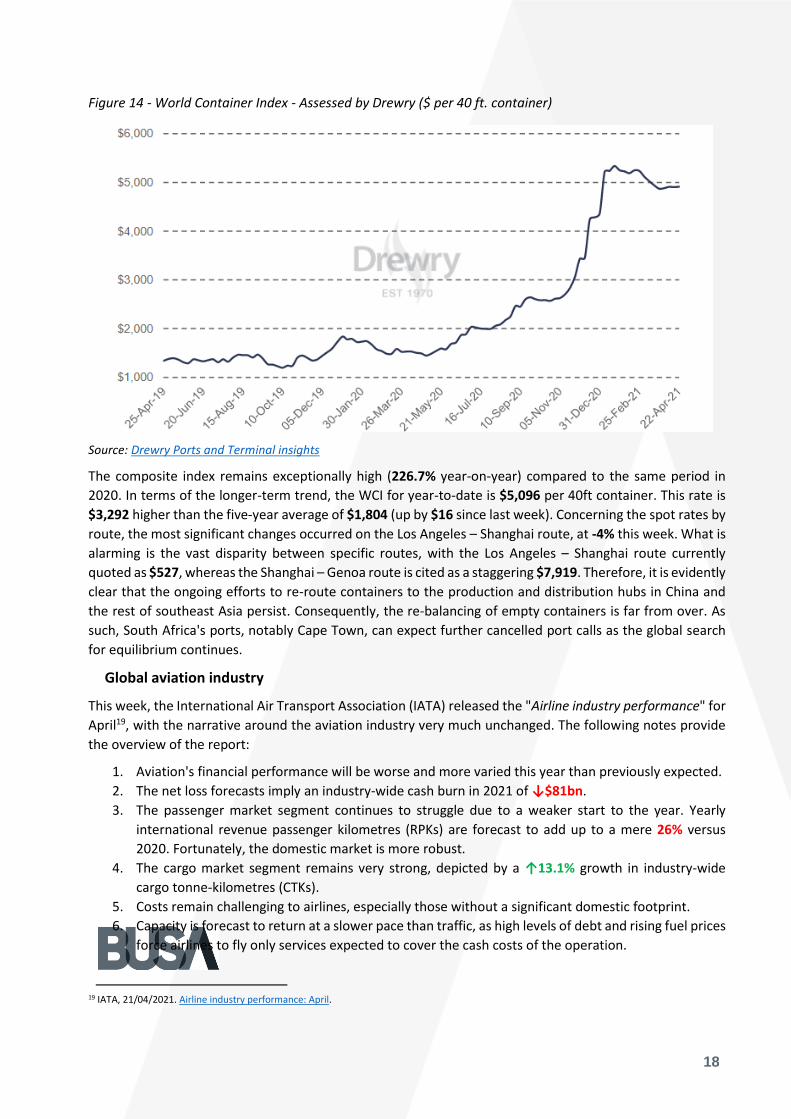
Figure 14 - World Container Index - Assessed by Drewry ($ per 40 ft. container)
Source: Drewry Ports and Terminal insights
The composite index remains exceptionally high (226.7% year-on-year) compared to the same period in
2020. In terms of the longer-term trend, the WCI for year-to-date is $5,096 per 40ft container. This rate is
$3,292 higher than the five-year average of $1,804 (up by $16 since last week). Concerning the spot rates by
route, the most significant changes occurred on the Los Angeles – Shanghai route, at -4% this week. What is
alarming is the vast disparity between specific routes, with the Los Angeles – Shanghai route currently
quoted as $527, whereas the Shanghai – Genoa route is cited as a staggering $7,919. Therefore, it is evidently
clear that the ongoing efforts to re-route containers to the production and distribution hubs in China and
the rest of southeast Asia persist. Consequently, the re-balancing of empty containers is far from over. As
such, South Africa's ports, notably Cape Town, can expect further cancelled port calls as the global search
for equilibrium continues.
Global aviation industry
This week, the International Air Transport Association (IATA) released the "Airline industry performance" for
April19, with the narrative around the aviation industry very much unchanged. The following notes provide
the overview of the report:
1. Aviation's financial performance will be worse and more varied this year than previously expected.
2. The net loss forecasts imply an industry-wide cash burn in 2021 of ↓$81bn.
3. The passenger market segment continues to struggle due to a weaker start to the year. Yearly
international revenue passenger kilometres (RPKs) are forecast to add up to a mere 26% versus
2020. Fortunately, the domestic market is more robust.
4. The cargo market segment remains very strong, depicted by a ↑13.1% growth in industry-wide
cargo tonne-kilometres (CTKs).
5. Costs remain challenging to airlines, especially those without a significant domestic footprint.
6. Capacity is forecast to return at a slower pace than traffic, as high levels of debt and rising fuel prices
force airlines to fly only services expected to cover the cash costs of the operation.
19 IATA, 21/04/2021. Airline industry performance: April.

19
As mentioned previously, approximately two-thirds of revenues were generated by the international market
pre-crisis. However, with the current stringent regulations as they are, these markets remain effectively
closed today. The industry continues to rely on cargo operations. This year's start was discouraging for
passenger operations, with domestic and international RPKs falling in January and February, responding to
the resurgence of virus cases and government travel restrictions. The following image illustrates the ongoing
struggles.
Figure 15 – Cargo tonne-kilometres (CTKs) and passenger revenue passenger-kilometres (RPKs), Jan 2020=100
Source: IATA Economics
Cargo, therefore, continues to be the driving force in aviation. Globally available seat kilometres (ASKs) are
forecast to rise 21.9% compared to a 26% rise in RPKs, allowing a surge in passenger load factors to 67.3%
(still below 2019's 82.6%). Furthermore, the overall weight load factor is forecast to rise slightly to 60.3%.
Still, a considerable way below the 66% IATA estimates to be breakeven on profitability in 2021 – even
though cash costs of operations are being covered.
The stringent regulations imposed by the government in terms of restrictions on international travel
continue to have a negative effect, as shown in the figure below. Restrictions were tightened across all
regions in January in response to the surge of new cases caused by the emergence of virus variants. In
addition, travel slumped on the important Chinese domestic market as the government instructed citizens
to remain at home during the Chinese New Year in response to a rise in new cases.

20
Figure 16 – International travel stringency index weighted by population (Jan 2020 – Marc 2021)
Source: IATA Economics
In summary, international travel will remain weak for the foreseeable future until international restrictions
are reduced. Collectively, IATA notes that most international air travel markets are at less than 15% of 2019
RPKs. Hopefully, with global vaccination programmes accelerating, some markets will start to open around
the second half of the year. Unfortunately, widespread vaccinations have not yet been as rapid as had been
expected in December. The April version of the "Airline industry performance" shows some revenue recovery
in 2021, mainly led by solid cargo revenues. Nevertheless, the aviation industry is forecast to only reach
about ~55% revenue levels of pre-crisis 2019, as the cargo revenues, despite increasing, are insufficient to
offset shrunken passenger revenues.