Embed Size (px)
Citation preview

Data Visualization
FOR IMPACTUS Trade & Development Agency
OPM.GOV √FEDERAL EMPLOYEE DEVELOPMENT

Why Visualize?

Program
Design
Data
CollectionEvaluation
Impact &
Performance
Improvement

Initial Study
Lots of Other Studies
Maybe they get financing
Implementation (perhaps in different format than originally conceived)
Great
Idea
Grantee
Personnel
All
Change
Financiers
request
additional
studies
If we’re lucky
stakeholders
respond to
surveys
ADDITIONAL
PLANNING
STEPS
Grantee adapts
recommendations
to market changes
Spinoff
projects
Project
Dead
Zone Treacherous
waters of
regulatory
approval/
negotiation/
finalizing legal
agreements

1 To distill the
music from the
noise
2 To ensure data
integrity

3 To enhance use
and drive
performance
How can we visualize data
on a shoestring budget?

Building Blocks


0% 20% 40% 60% 80% 100%
Vendor E
Vendor D
Vendor C
Vendor B
Vendor A
Figure 1:Survey Responses to Question 2A: “How Likely are you to Apply what you
learned in your training?” (N= 248)
Very Likely
Somewhat Likely
Neutral
Somewhat Unlikely
Very Unlikely
Building an Infogram: Step by Step

Remove Excess Lines
0% 20% 40% 60% 80% 100%
Vendor E
Vendor D
Vendor C
Vendor B
Vendor A
Figure 1:Survey Responses to Question 2A: “How Likely are you to Apply what you
learned in your training?” (N= 248)
Very Likely
Somewhat Likely
Neutral
Somewhat Unlikely
Very Unlikely

Choose Meaningful Colors
0% 20% 40% 60% 80% 100%
Vendor E
Vendor D
Vendor C
Vendor B
Vendor A
Figure 1:Survey Responses to Question 2A: “How Likely are you to Apply what you
learned in your training?” (N= 248)
Very Likely
Somewhat Likely
Neutral
Somewhat Unlikely
Very Unlikely

Tell the Story
0% 20% 40% 60% 80% 100%
Vendor E
Vendor D
Vendor C
Vendor B
Vendor A
Over half of those surveyed reported that they are likely or very likely to utilize the training they received. Vendor C achieved the highest rating, with over 73% of participants responding positively.

Simplify further, if needed
0% 20% 40% 60% 80% 100%
Vendor A
Vendor E
Vendor B
Vendor D
Vendor C
Over half of those surveyed reported that they are likely or very likely to utilize the training they received. Vendor C achieved the highest rating, with over 73% of participants responding positively.
73%
69%
53%
42%
36%


Infographics

Use the
grid to
your
advantage

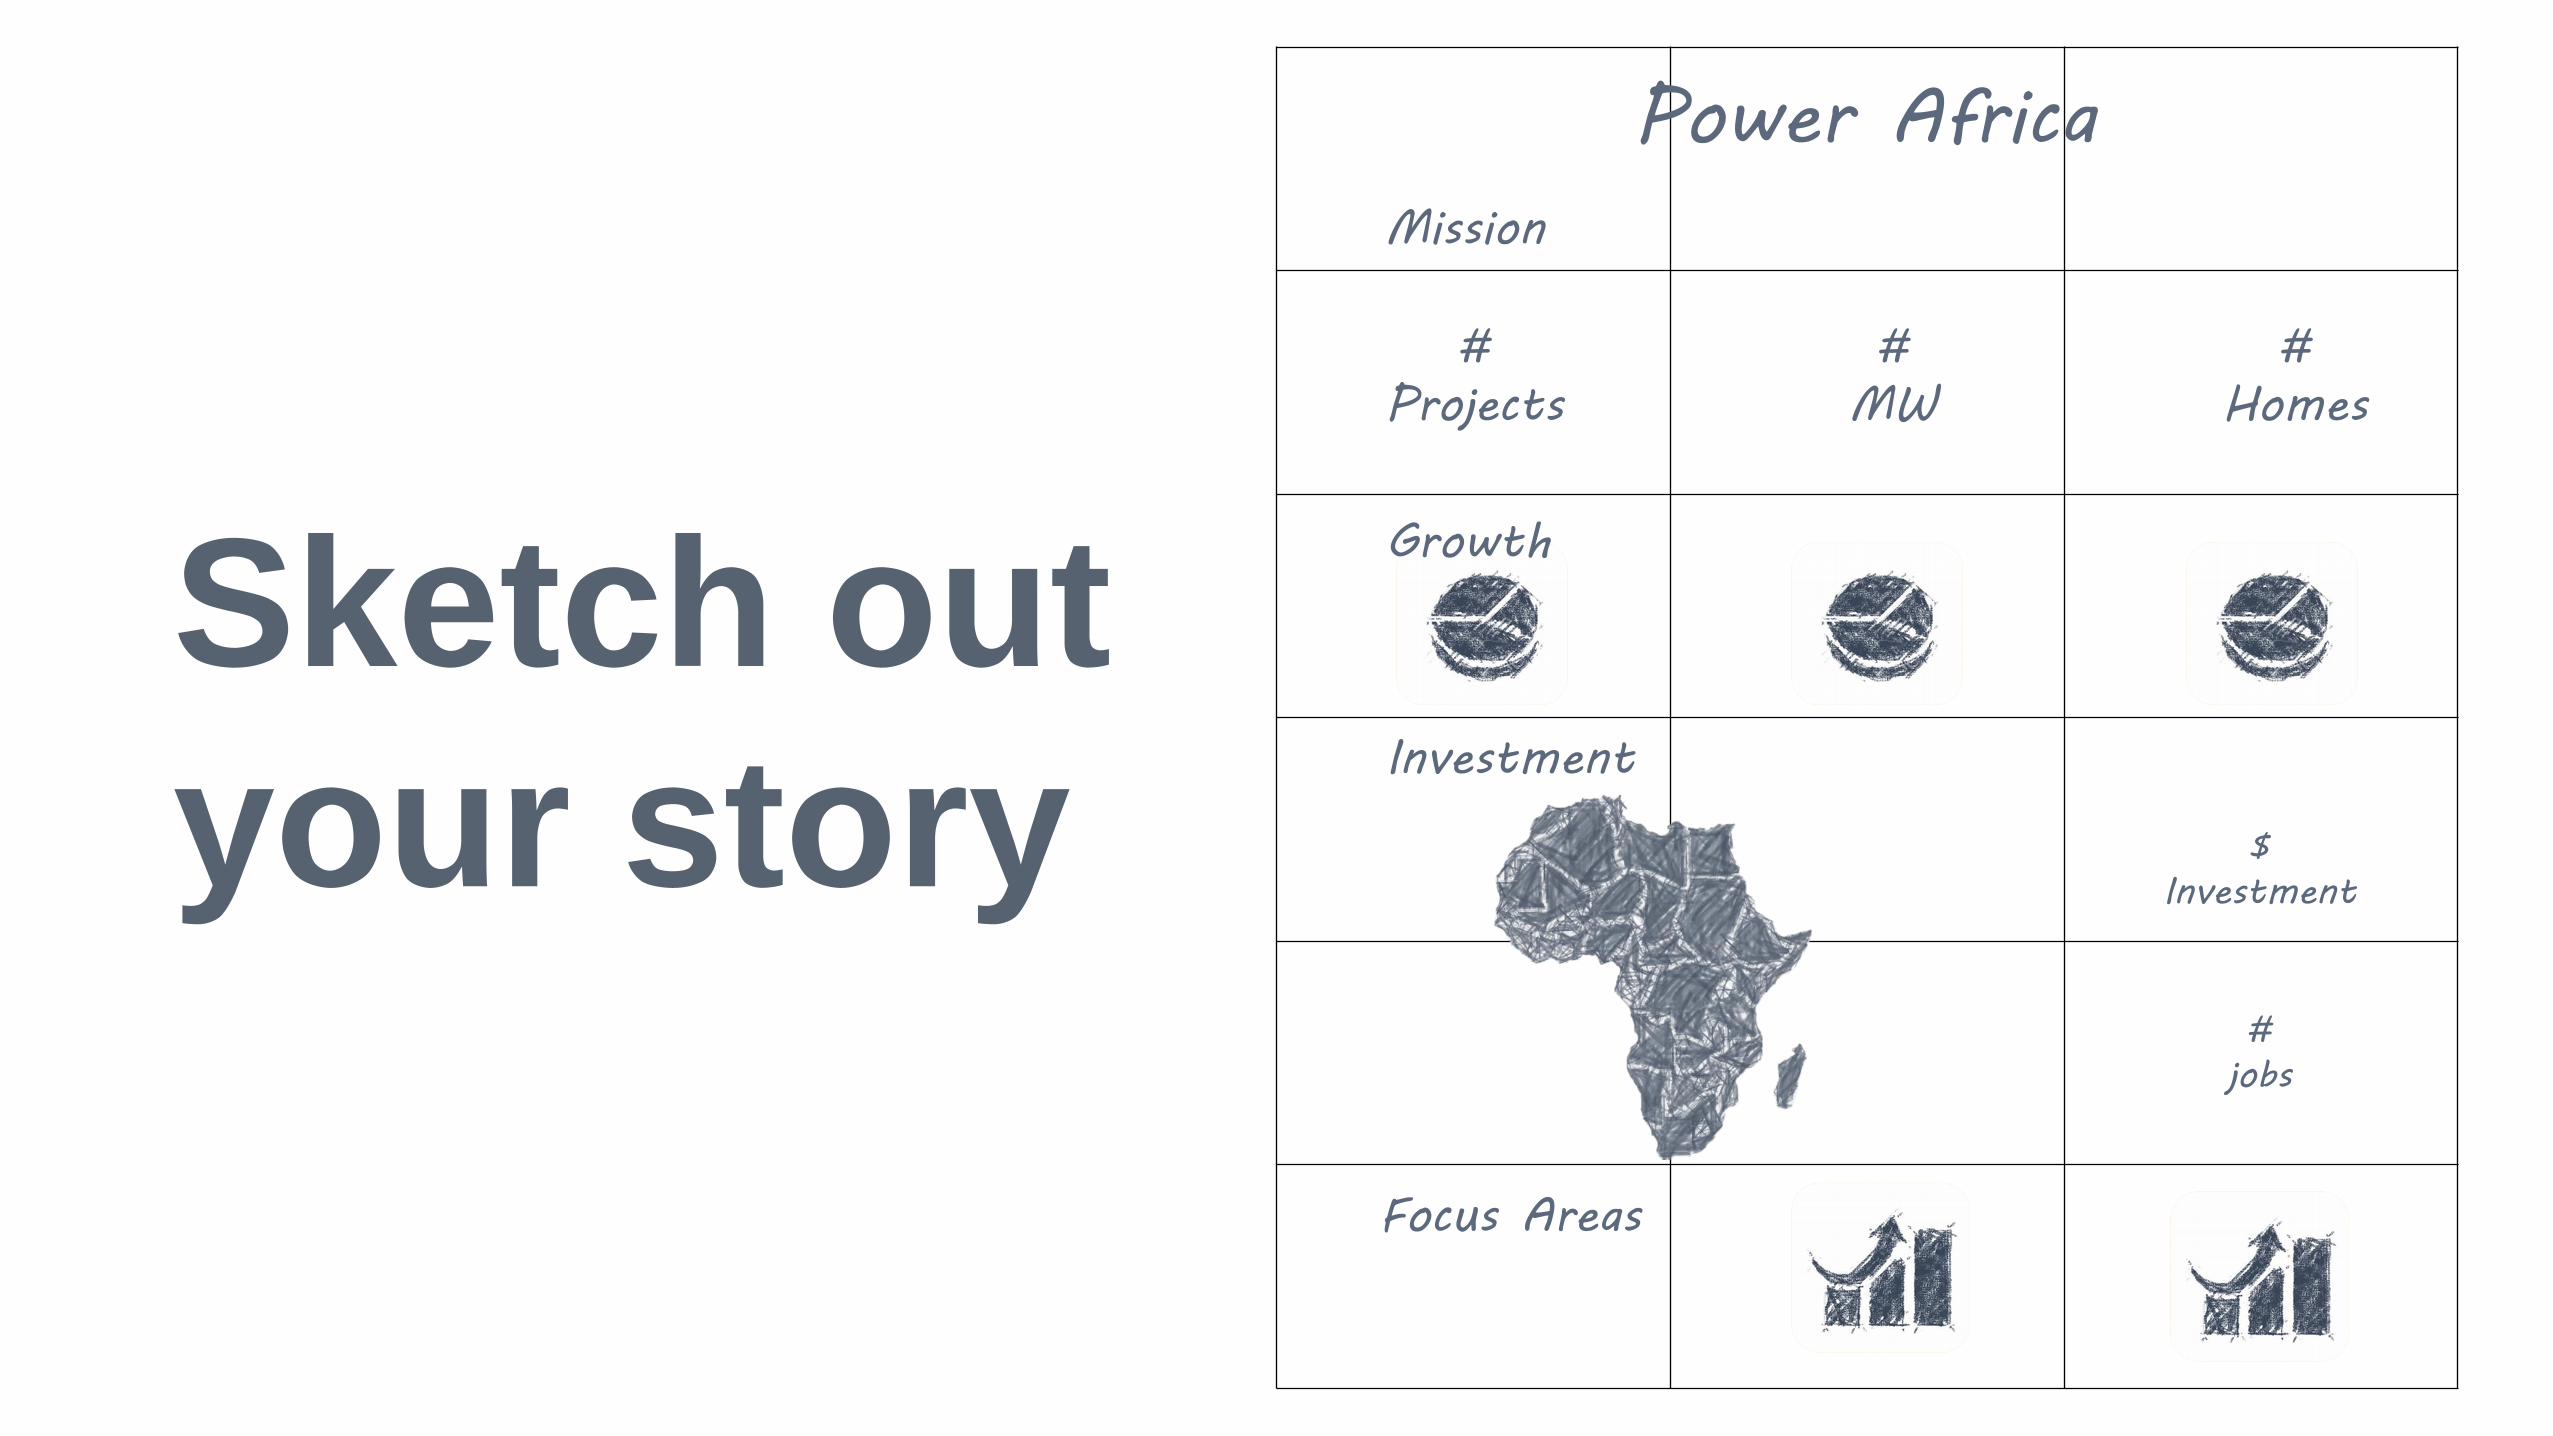
Sketch out
your story
Power Africa
Mission
#
Projects
#
MW
#
Homes
Investment
Growth
$
Investment
#
jobs
Focus Areas
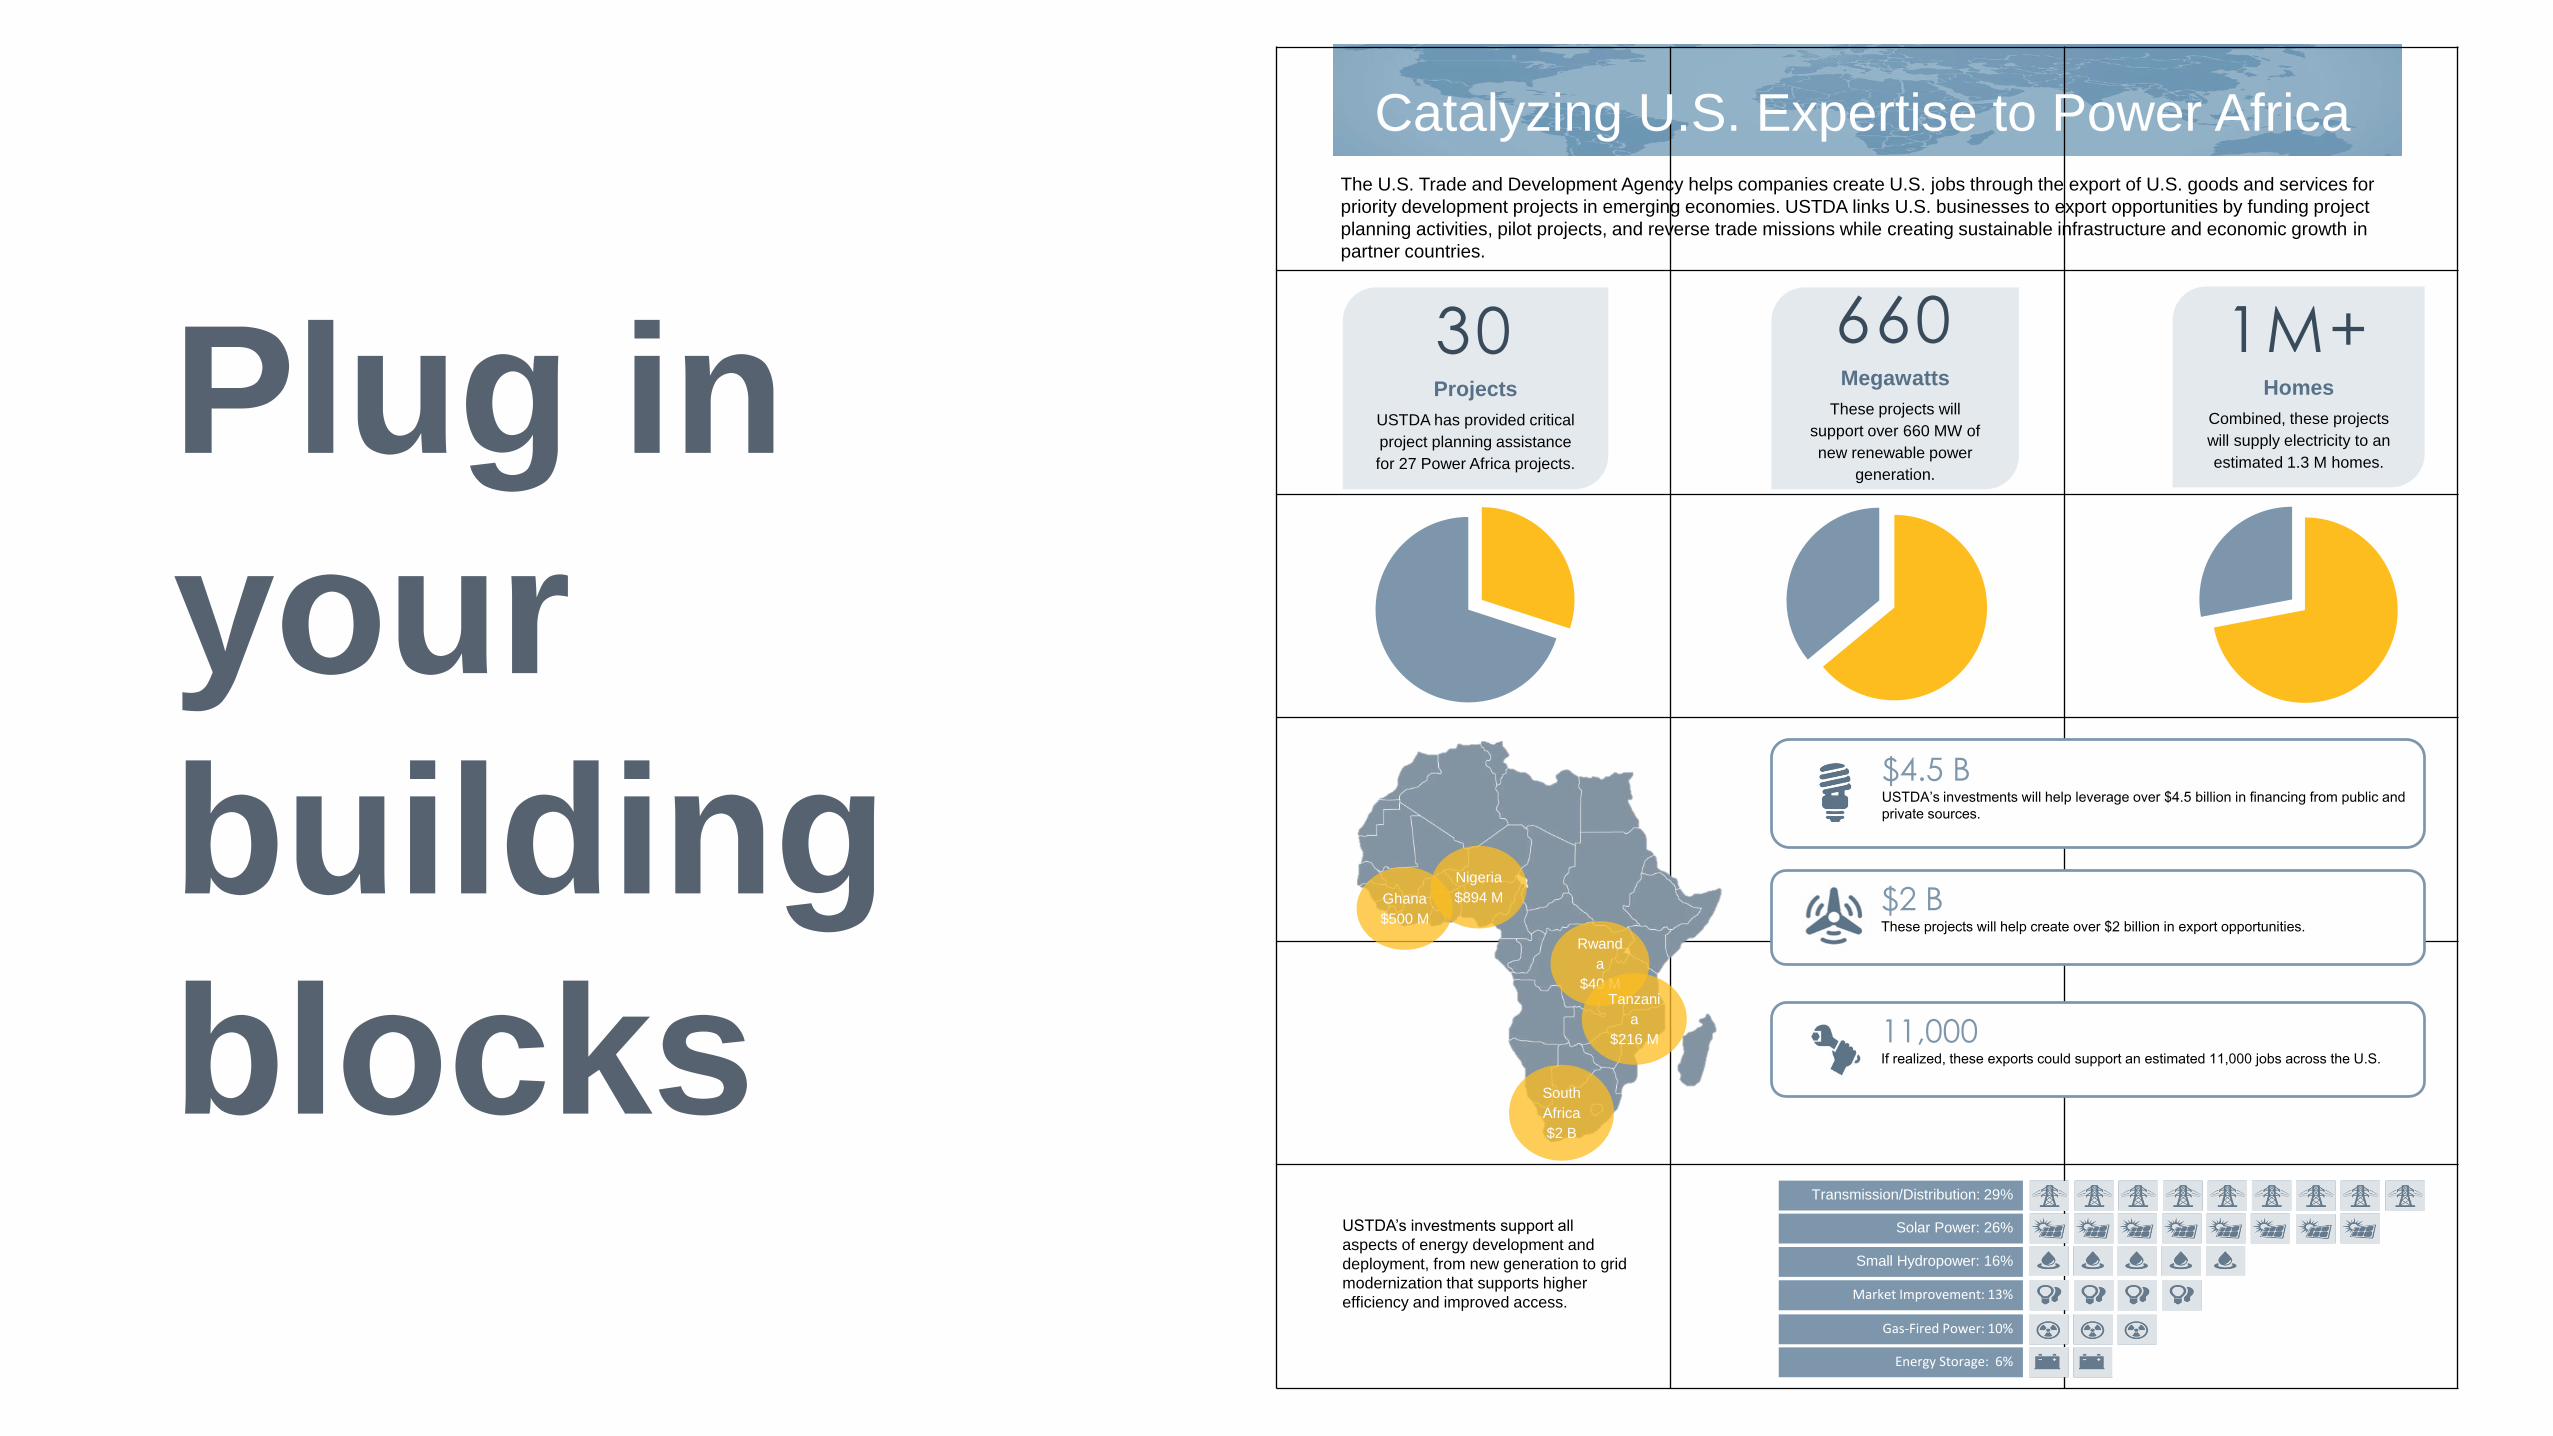
Plug in
your
building
blocks
30Projects
USTDA has provided critical
project planning assistance
for 27 Power Africa projects.
660 Megawatts
These projects will
support over 660 MW of
new renewable power
generation.
1M+Homes
Combined, these projects
will supply electricity to an
estimated 1.3 M homes.
Catalyzing U.S. Expertise to Power AfricaThe U.S. Trade and Development Agency helps companies create U.S. jobs through the export of U.S. goods and services for
priority development projects in emerging economies. USTDA links U.S. businesses to export opportunities by funding project
planning activities, pilot projects, and reverse trade missions while creating sustainable infrastructure and economic growth in
partner countries.
Ghana
$500 M
Nigeria
$894 M
South
Africa
$2 B
Rwand
a
$40 MTanzani
a
$216 M
Transmission/Distribution: 29%
Solar Power: 26%
Small Hydropower: 16%
Market Improvement: 13%
Energy Storage: 6%
Gas-Fired Power: 10%
$4.5 B USTDA’s investments will help leverage over $4.5 billion in financing from public and
private sources.
11,000If realized, these exports could support an estimated 11,000 jobs across the U.S.
$2 BThese projects will help create over $2 billion in export opportunities.
USTDA’s investments support all
aspects of energy development and
deployment, from new generation to grid
modernization that supports higher
efficiency and improved access.

30Projects
USTDA is providing critical
project planning assistance
for 30 Power Africa
projects
660 Megawatts
These projects will
support over 660 MW of
new low-carbon power
generation
1M+Homes
Combined, these projects
will supply electricity to
an estimated 1.3 M
homes
U.S. Trade and Development Agency
Catalyzing U.S. Expertise to Power Africa
USTDA’s MissionThe U.S. Trade and Development Agency helps companies create U.S. jobs through the export of U.S. goods and services for priority development projects in emerging economies.
Smart Grid: 29%
Solar Power: 26%
Small Hydro: 16%
Market Dev.: 13%
Energy Storage: 6%
Gas-Fired Power: 10%
USTDA supports all aspects of energy development and
deployment, from new generation to grid
modernization.
Nigeria
$894 M
South
Africa
$2 B
Rwanda
$40 M
Tanzania
$216 M
Ghana
$500 M
Through Power Africa, USTDA nearly tripled its funding for power projects:
2012 2013 2014
$4.5 B USTDA’s investments will help leverage over $4.5 billion in financing from public and private sources.
11,000If realized, these exports could support an estimated 11,000 jobs across the U.S.
$2 BThese projects will help create over $2 billion in export opportunities.

Ghana
$500 M
Nigeria
$894 M
South
Africa
$2 B
Rwanda
$40 M
Tanzania
$216 M
30Projects
USTDA has provided
critical project
planning assistance
for 27 Power Africa
projects.
660 Megawatts
These projects will
support over 660
MW of new
renewable power
generation.
1M+Homes
Combined, these
projects will supply
electricity to an
estimated 1.3 M
homes.
Through Power Africa, USTDA nearly tripled its funding for
power projects across the continent: USTDA’s
support will
help unlock
over $3.8
billion in
financing.
2012 2013 2014
Catalyzing U.S. Expertise to Power Africa

Dashboards


East Asia achieves the quickest timeline, with an average of 230
days from proposal to grant finalization. Across all regions, proposal
review takes the longest period of time.
0 50 100 150 200 250 300 350
EAST ASIA
SOUTH & SE ASIA
MENA/Europe
LATIN AMERICA & CARIBBEAN
SUBSAHARAN AFRICA

How much data?
How often do you need to refresh?
lots / oftenlittle / rarely
conditional
formatting
pivot
charts
software &
custom
solutions
static
reports
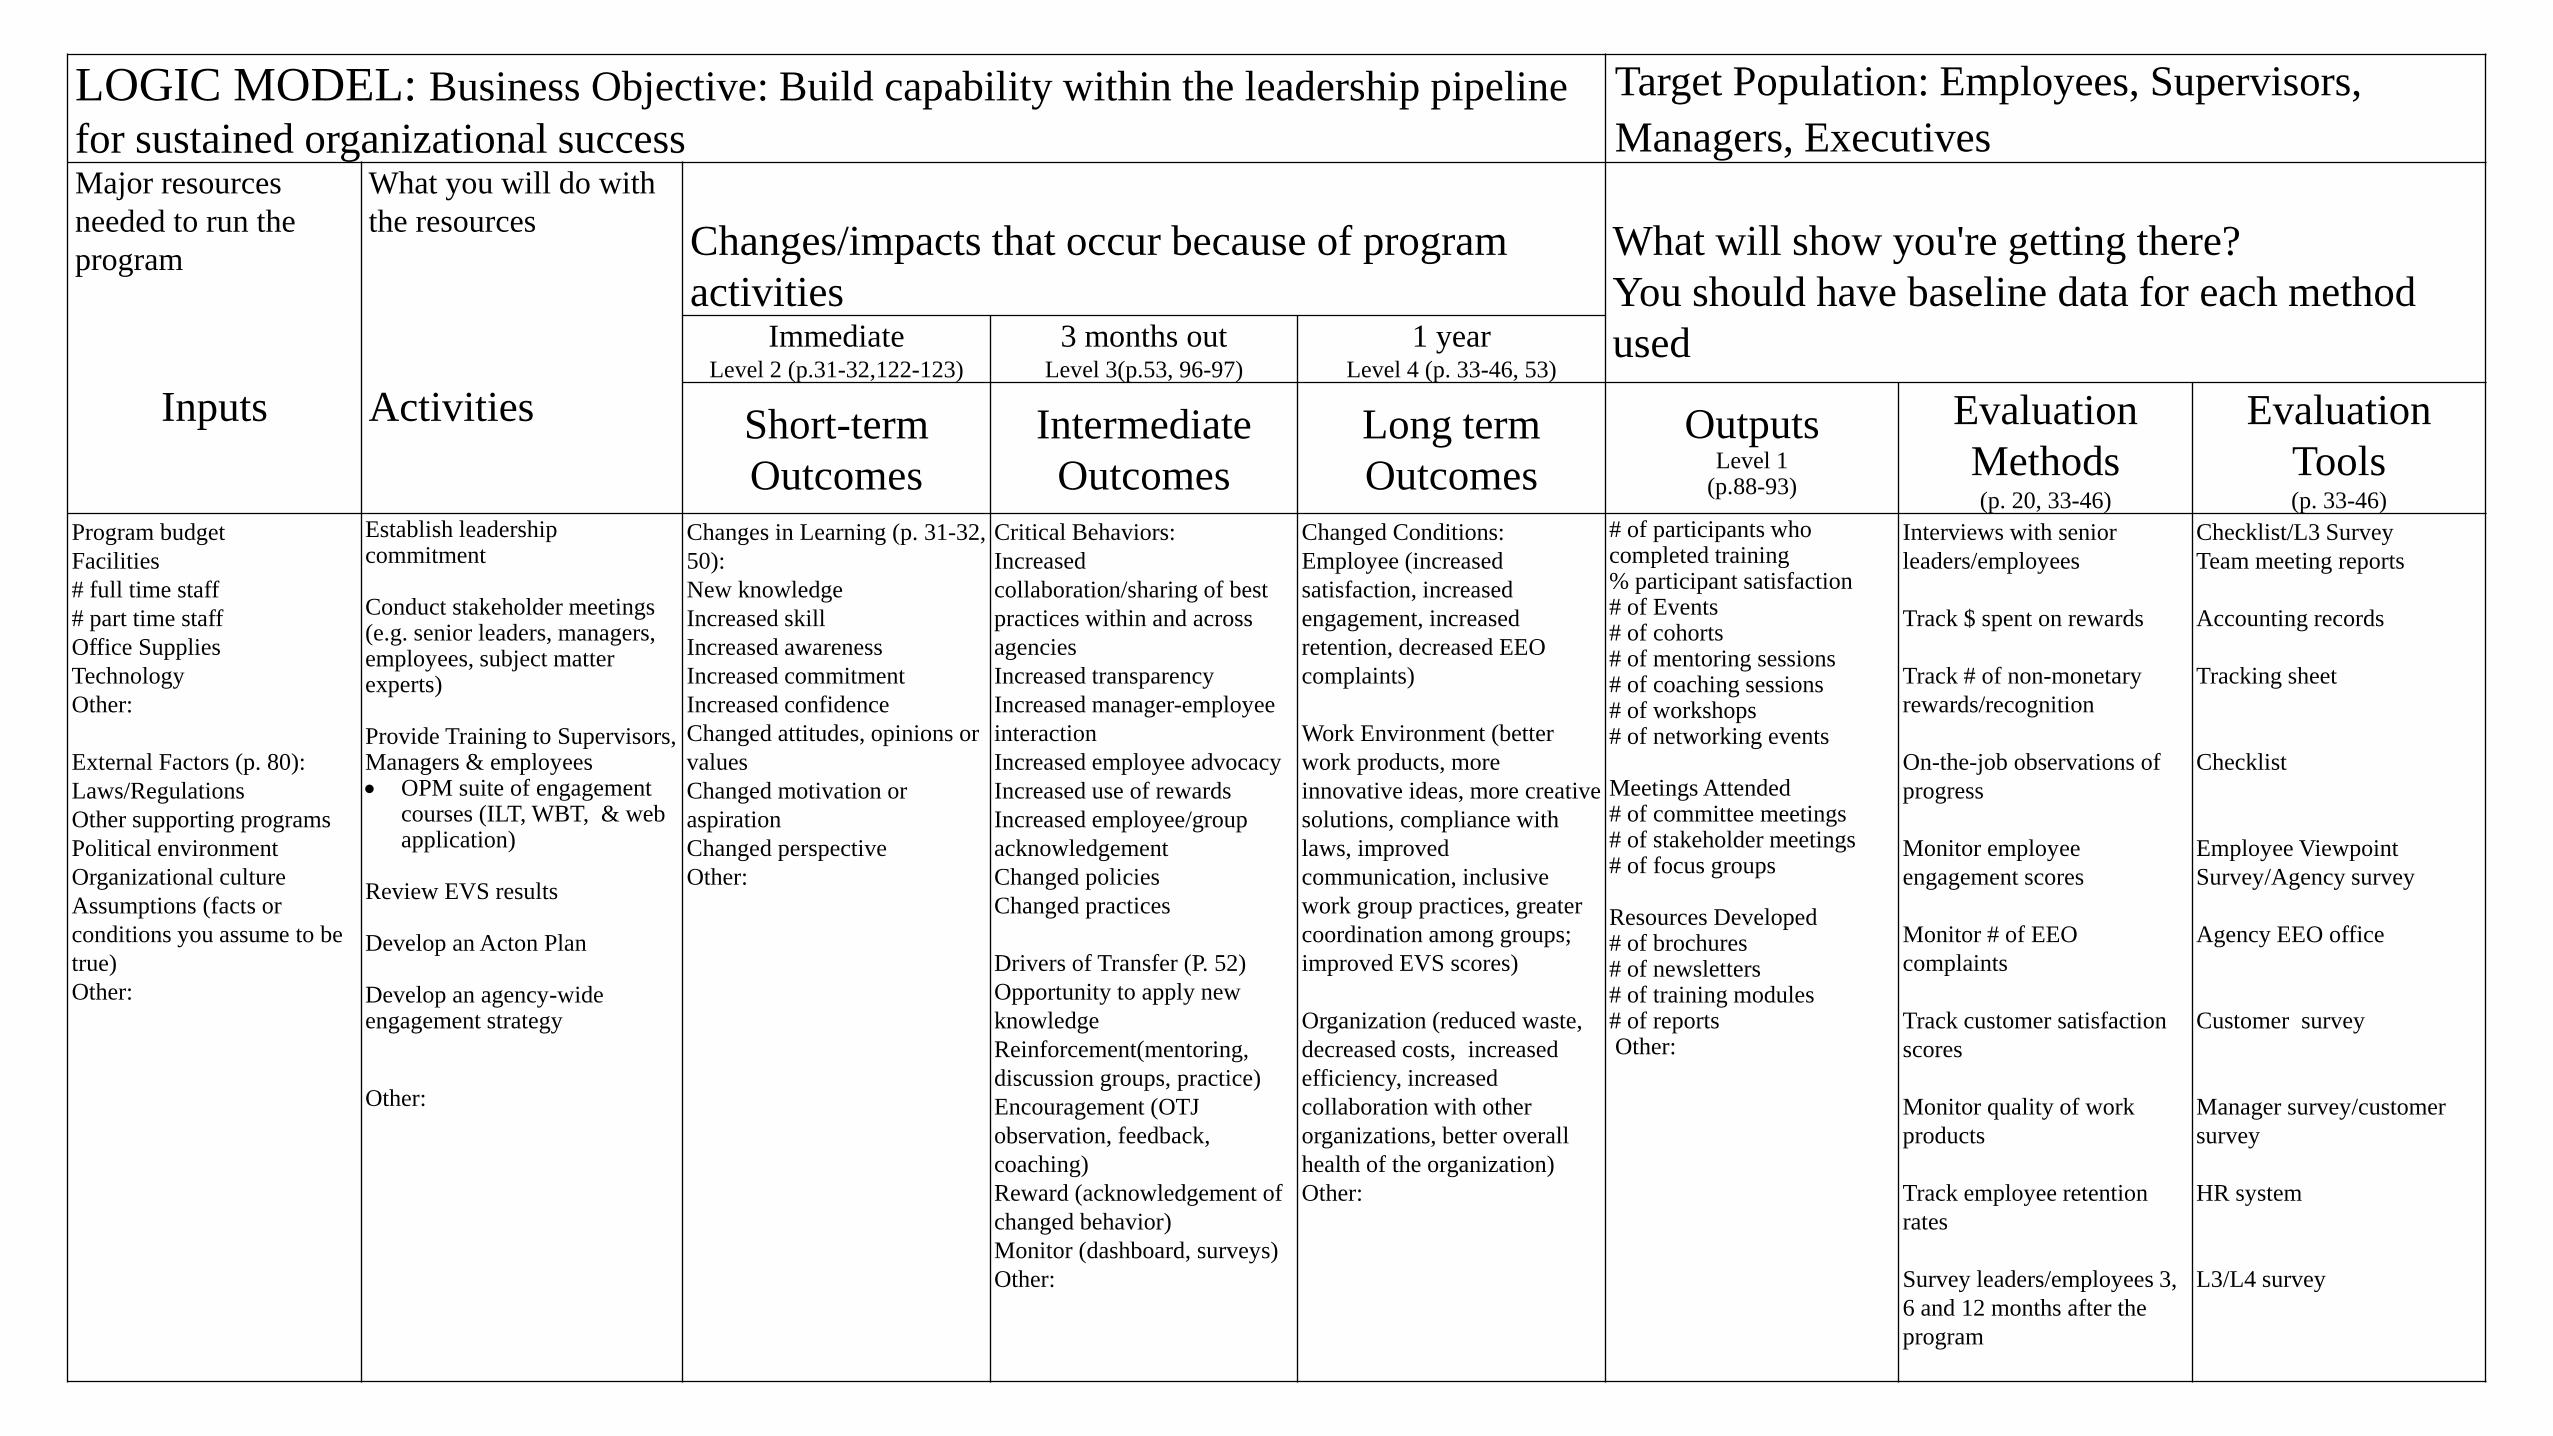
LOGIC MODEL: Business Objective: Build capability within the leadership pipeline
for sustained organizational success
Target Population: Employees, Supervisors,
Managers, Executives Major resources
needed to run the
program
Inputs
What you will do with
the resources
Activities
Changes/impacts that occur because of program
activities
What will show you're getting there?
You should have baseline data for each method
usedImmediateLevel 2 (p.31-32,122-123)
3 months outLevel 3(p.53, 96-97)
1 yearLevel 4 (p. 33-46, 53)
Short-term
Outcomes
Intermediate
Outcomes
Long term
Outcomes
OutputsLevel 1
(p.88-93)
Evaluation
Methods (p. 20, 33-46)
Evaluation
Tools(p. 33-46)
Program budget
Facilities
# full time staff
# part time staff
Office Supplies
Technology
Other:
External Factors (p. 80):
Laws/Regulations
Other supporting programs
Political environment
Organizational culture
Assumptions (facts or
conditions you assume to be
true)
Other:
Establish leadership commitment
Conduct stakeholder meetings (e.g. senior leaders, managers, employees, subject matter experts)
Provide Training to Supervisors, Managers & employees OPM suite of engagement
courses (ILT, WBT, & web application)
Review EVS results
Develop an Acton Plan
Develop an agency-wide engagement strategy
Other:
Changes in Learning (p. 31-32,
50):
New knowledge
Increased skill
Increased awareness
Increased commitment
Increased confidence
Changed attitudes, opinions or
values
Changed motivation or
aspiration
Changed perspective
Other:
Critical Behaviors:
Increased
collaboration/sharing of best
practices within and across
agencies
Increased transparency
Increased manager-employee
interaction
Increased employee advocacy
Increased use of rewards
Increased employee/group
acknowledgement
Changed policies
Changed practices
Drivers of Transfer (P. 52)
Opportunity to apply new
knowledge
Reinforcement(mentoring,
discussion groups, practice)
Encouragement (OTJ
observation, feedback,
coaching)
Reward (acknowledgement of
changed behavior)
Monitor (dashboard, surveys)
Other:
Changed Conditions:
Employee (increased
satisfaction, increased
engagement, increased
retention, decreased EEO
complaints)
Work Environment (better
work products, more
innovative ideas, more creative
solutions, compliance with
laws, improved
communication, inclusive
work group practices, greater
coordination among groups;
improved EVS scores)
Organization (reduced waste,
decreased costs, increased
efficiency, increased
collaboration with other
organizations, better overall
health of the organization)
Other:
# of participants who completed training% participant satisfaction# of Events# of cohorts# of mentoring sessions# of coaching sessions# of workshops # of networking events
Meetings Attended# of committee meetings# of stakeholder meetings# of focus groups
Resources Developed# of brochures# of newsletters# of training modules# of reportsOther:
Interviews with senior
leaders/employees
Track $ spent on rewards
Track # of non-monetary
rewards/recognition
On-the-job observations of
progress
Monitor employee
engagement scores
Monitor # of EEO
complaints
Track customer satisfaction
scores
Monitor quality of work
products
Track employee retention
rates
Survey leaders/employees 3,
6 and 12 months after the
program
Checklist/L3 Survey
Team meeting reports
Accounting records
Tracking sheet
Checklist
Employee Viewpoint
Survey/Agency survey
Agency EEO office
Customer survey
Manager survey/customer
survey
HR system
L3/L4 survey

Inputs Outputs Outcomes

Top Line Results
Inputs Outputs Outcomes
Historical Comparison
Breakdown/By Dept.
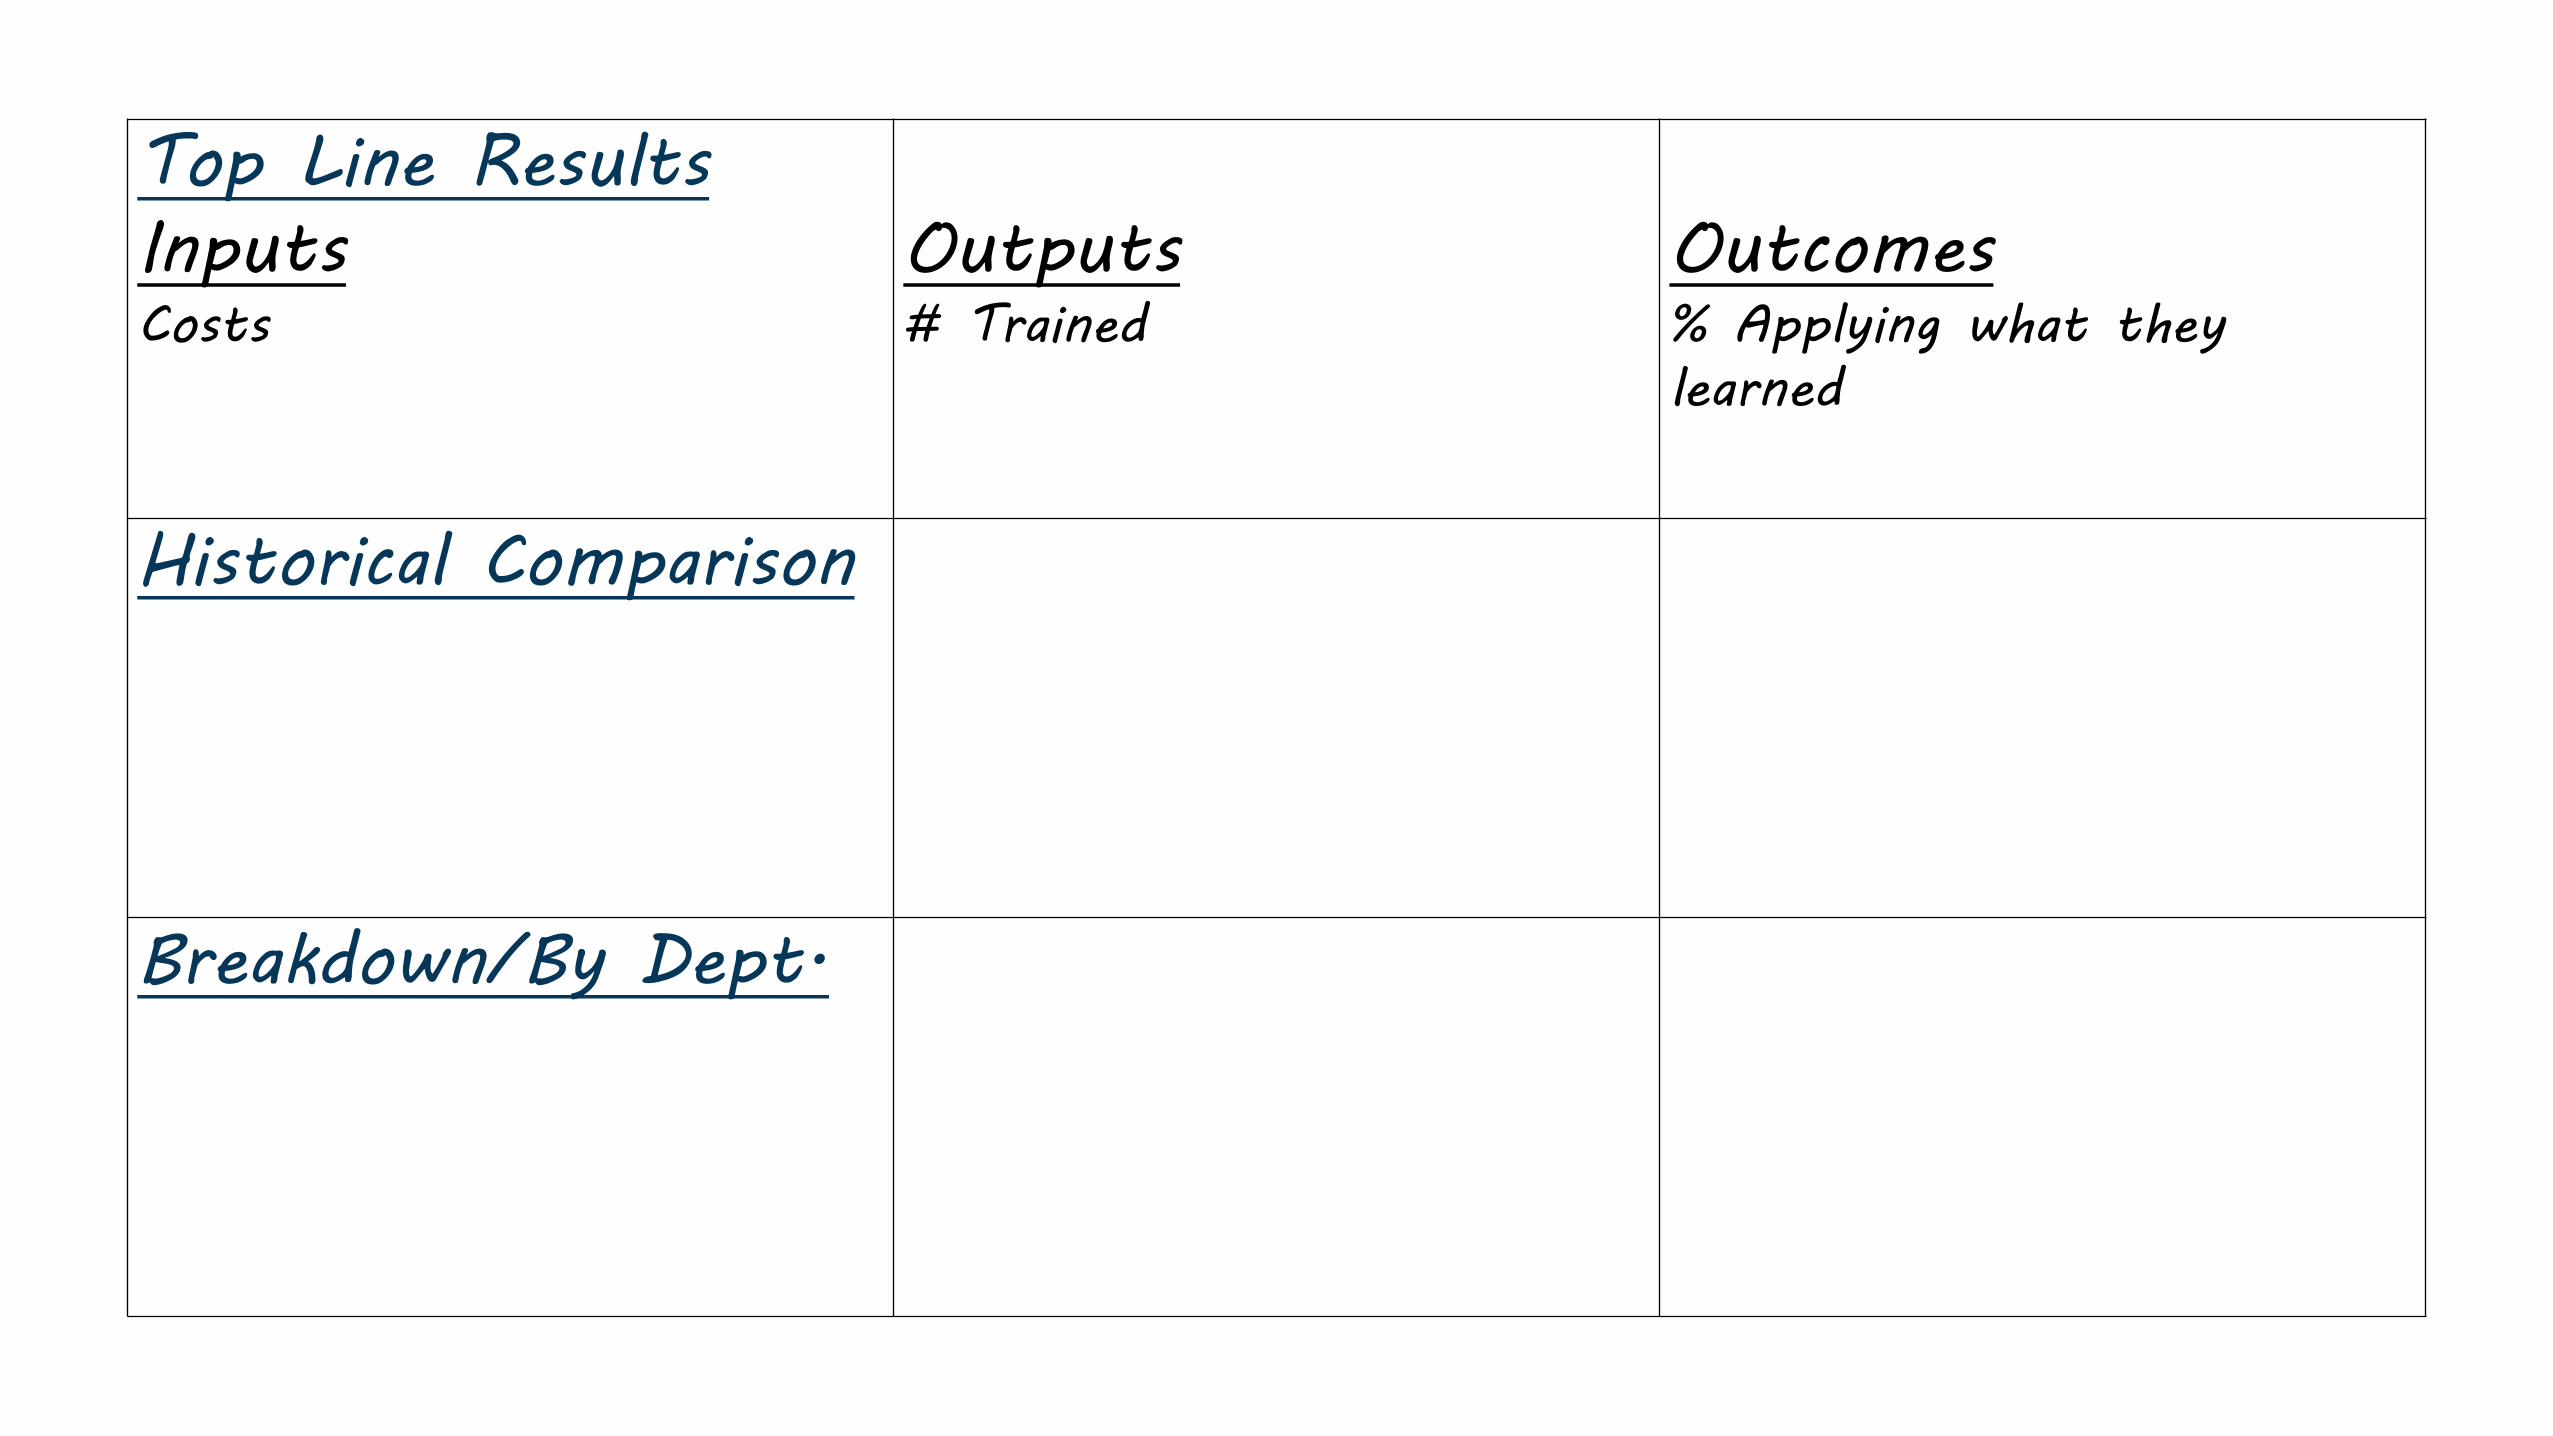
Top Line Results
InputsCosts
Outputs# Trained
Outcomes% Applying what they
learned
Historical Comparison
Breakdown/By Dept.

Top Line Results
InputsCosts
Outputs# Trained
Outcomes% Applying what they
learned
Historical Comparison
Direct costs & person hours # Completed/Certified
% Satisfied
Increased Retention
Surveys – Productivity, Use,
Effectiveness
Breakdown/By Dept.

Cost
$631,794
# Trained
358
% Applying what they
learned
298 Completed
114 Certified
76% Satisfied
Dept. A
Dept. B
2013
2014
2015
2016
Dept. D
Dept. C
Dept. B
Dept. A
% Completed % Effectiveness % Applied Use
Applied Use
Productivity Retention
Effectiveness

Dept. A
Dept. B
298 Completed
114 Certified
76% Satisfied
60%
2013
2014
2015
2016Applied Use
Productivity Retention
Dept. D
Dept. C
Dept. B
Dept. A% Completed % Effectiveness % Applied Use
$631,794Total Cost FY2016
358Total Number Trained FY2016 Applied
Use
Effectiveness
2013
2013
2016
2016

Better Reports

Where we started:

Where we are now:
$2 M
$35 M
$45 M
$80 M
$87 M
Given the initial high cost of U.S. locomotive equipment, a challenge is
showing foreign project sponsors the value of low life-cycle costs.
Railway projects are often hampered by interoperability issues, particularly
when dealing with legacy systems that utilize standard or meter-gauge.
U.S. content levels are difficult to determine for some rail equipment,
particularly locomotive kits and engines, given the many components and
diverse supply chains used in the manufacturing processes for such items.
Local content and labor requirements in some foreign markets serve as
impediments to U.S. exporters.
Tenders requiring design specifications often favor a single supplier.
Performance-based specifications, which define what a product is required
to do, but not how it is made, can help level the playing field for US
vendors.
Locomotives
Engines
Train Control
Systems
106Since 1981, USTDA
has supported 106
rail sector activities
$2.4 BThese projects
generated $2.4
billion in U.S. exports
380These exports came
from over 380 U.S.
companies.
PA
IL
MD
FL
AL
USTDA’s rail sector projects helped generate exports for
companies in 37 states, with Pennsylvania in the lead
Common exports:Key challenges to implementation and exports include: Growth over last decade:
Life-Cycle Cost
Legacy Systems
Diverse Supply
Chain
Local Content
Requirements
Imbalanced
Technical Specs. 0
2
4
6
8
10
12
14
16
2005 2008 2011 2014


Bottom
Line
Up
Front

Resources AEA Data Viz TIG Website eval.org/datavisualizationandreporting/home
Data Visualization Checklist by Ann Emery and Stephanie Evergreen
Presenting Data Effectivelyby Stephanie Evergreen
Tools Juice Analytics
Color Brewer 2.0
Adobe Color
Graphic River
Canva
Visual.ly

Connectwith us
address:
1000 Wilson Blvd
Suite 1600
Arlington, VA
contact:
www.ustda.gov
Kendra Kintzi
phone:
703-875-4357
Twitter:
Twitter.com/USTDA
Facebook:
facebook.com/USTDA

THANK YOUU.S. Trade and Development Agency
OPM.GOV √FEDERAL EMPLOYEE DEVELOPMENT