Embed Size (px)
Citation preview
Journal of Physics Conference Series
OPEN ACCESS
Data Quality Monitoring of the CMS TrackerTo cite this article Suchandra Dutta and the CMS Tracker Collaboration 2011 J Phys Conf Ser331 032039
View the article online for updates and enhancements
You may also likeFracture of Porous Ceramics Applicationto the Mechanical Degradation of SolidOxide Cell During Redox CyclingAmira Abaza Sylvain Meille Arata Nakajoet al
-
The activities and funding of IRPA anoverviewGeoffrey Webb
-
Post-Mortem Analysis of CommercialNMCGraphite Li-Ion Pouch Cells withinMat4Bat European ProjectAmaia Iturrondobeitia Freacutedeacuteric AguesseThomas Waldmann et al
-
This content was downloaded from IP address 3911993215 on 29122021 at 0910
Data Quality Monitoring of the CMS Tracker
Suchandra Dutta on behalf of the CMS Tracker CollaborationNational Central University Taipei Taiwan
E-mail SuchandraDuttacernch
Abstract The Data Quality Monitoring system for the Tracker has been developed withinthe CMS Software framework It has been designed to be used during online data taking aswell as during offline reconstruction The main goal of the online system is to monitor detectorperformance and identify problems very efficiently during data collection so that proper actionscan be taken to fix it On the other hand any issue with data reconstruction or calibration canbe detected during offline processing using the same tool The monitoring is performed usinghistograms which are filled with information from raw and reconstructed data computed at thelevel of individual detectors Furthermore statistical tests are performed on these histograms tocheck the quality and flags are generated automatically Results are visualized with web basedgraphical user interfaces Final data certification is done combining these automatic flags andmanual inspection The Tracker DQM system has been successfully used during cosmic datataking and it has been optimised to fulfill the condition of collision data taking In this paperwe describe the functionality of the CMS Tracker DQM system and the experience acquiredduring proton-proton collision
1 IntroductionThe Data Quality Monitoring (DQM) in an experiment ensures that the detector componentsand trigger system work optimally during data taking and certifies recorded data for physicsanalysis It is one of the most important tools and must be robust as it needs to functionthroughout the life time of the experiment It is required to be very efficient to spot problemsin the detector and trigger systems at the earliest possible stage of data acquisition and to issuealerts for the relevant experts so that immediate actions can be takenIn the Compact Muon Solenoid (CMS) at the Large Hadron Collider (LHC) at CERN the DQMis done in a common infrastructure and individual sub-detector or trigger DQM systems aredeveloped based on this infrastructure We shall discuss here the DQM system developed forthe Silicon Strip Tracker (SST) of CMS The SST consists of 15 K microstrip silicon detectormodules arranged in 10 cylindrical barrel layers and 12 end-cap disks on forward and backwardsides These detectors are read out by about 10 million electronic channels The complexity ofthe SST DQM system reflects the complexity of the Tracker system It was essential to developa few SST specific DQM tools to ensure optimal functionality of the SST
2 Data Quality Monitoring SchemeThe DQM framework in CMS is embedded in the CMS software environment (CMSSW) [1]and provides the basis for creation transportation and visualization of monitoring informationMonitoring is done in the form of histograms numbers or strings The Object Oriented analysisframework ROOT [2] is used for this purpose
International Conference on Computing in High Energy and Nuclear Physics (CHEP 2010) IOP PublishingJournal of Physics Conference Series 331 (2011) 032039 doi1010881742-65963313032039
Published under licence by IOP Publishing Ltd 1
Figure 1 Schematic view of the CMS DQM framework describing basic building blocks
The CMS Data Quality Monitoring system has three components as shown in figure 1 Thehistograms are created and filled by accessing event information Producer modulesHistograms are accessed by the Consumer module which performs further analysis and producessummary histograms andor numbers The module uses the Quality Test tool available in theDQM infrastructure to perform statistical tests on histograms comparing them with a referenceThe reference could be a histogram or a set of values like range mean rms etc The deviationfrom the reference is classified as Warning or Error depending on the severity and alarms aregeneratedThe histograms are visualised in web based Graphical User Interfaces (GUI) which is discussedin detail in section 4The data quality in CMS is monitored in real-time (online) during data taking as well as invarious stages of the offline processing of event data During data acquisition apart from afew specific cases a fraction of events are processed to have quick feedback on the detectorperformance The same DQM application is used during offline reconstruction within a fewhours of data taking where complete event statistics is available and fully reconstructed andcalibrated objects are accessible The main purpose here is to check the data in detail to spotreconstruction as well as calibration problems The output from both online and offline DQMapplications is visualised on the web GUI and also archived for future reference
3 Monitoring Information and OrganisationIn the SST DQM system [3] a number of Producer modules have been developed Each producermodule deals with a specific type of event information and the histograms are defined andfilled accordingly The monitoring information accessed from different levels of reconstructionconsists of
bull Raw Data Monitoring the basic event information with different error codes which ariseduring data unpacking
bull Digitisation Monitoring digitisation characteristics namely amplitude hottest and cooleststrips and number of digitised signals etc
International Conference on Computing in High Energy and Nuclear Physics (CHEP 2010) IOP PublishingJournal of Physics Conference Series 331 (2011) 032039 doi1010881742-65963313032039
2
bull Cluster Monitoring cluster properties like charge position width noise etcbull Track Monitoring reconstructed track parameters such as momentum track angles fit
qualities number of hits used in track fit etcbull Cluster Monitoring with Track the properties of on-track and off-track clusters are studied
Histograms are defined for individual detector modules as well as globally depending on thenature of the information The granularity of the SST is directly reflected in the number ofhistograms (sim 300 K) The geometrical structure of the tracker is followed to create a tree likefolder structure to store histograms Histograms related to individual tracker components areplaced inside the corresponding folder in order to facilitate quick and easy accessA dedicated consumer module has been developed in the SST DQM system One of itrsquos tasks isto create summary histograms combining information from individual detector level histogramsFor example the mean values of a given histogram type in the lowest level of the tree structureis accessed to fill new histograms at geometrically higher levels Summary histograms are veryefficient to locate a possible problem and save the time needed to go through individual detectorlevel histograms The consumer accesses the Quality Test flags from different levels of the SSTand finally combines them to produce a global flag This is used in data certification
4 Web Based Visualisation
Figure 2 SST specific page of the CMS DQM GUI where 7 groups of histograms are are shownusing SST layout The histograms represent overview of the SST performance The referencehistograms are superimposed in some cases and are shown as gray filled areas
The visualisation of DQM histograms is achieved in web based Graphical User Interfaces (GUIs)The main advantage of the web based GUI is that one just needs a standard web browser without
International Conference on Computing in High Energy and Nuclear Physics (CHEP 2010) IOP PublishingJournal of Physics Conference Series 331 (2011) 032039 doi1010881742-65963313032039
3
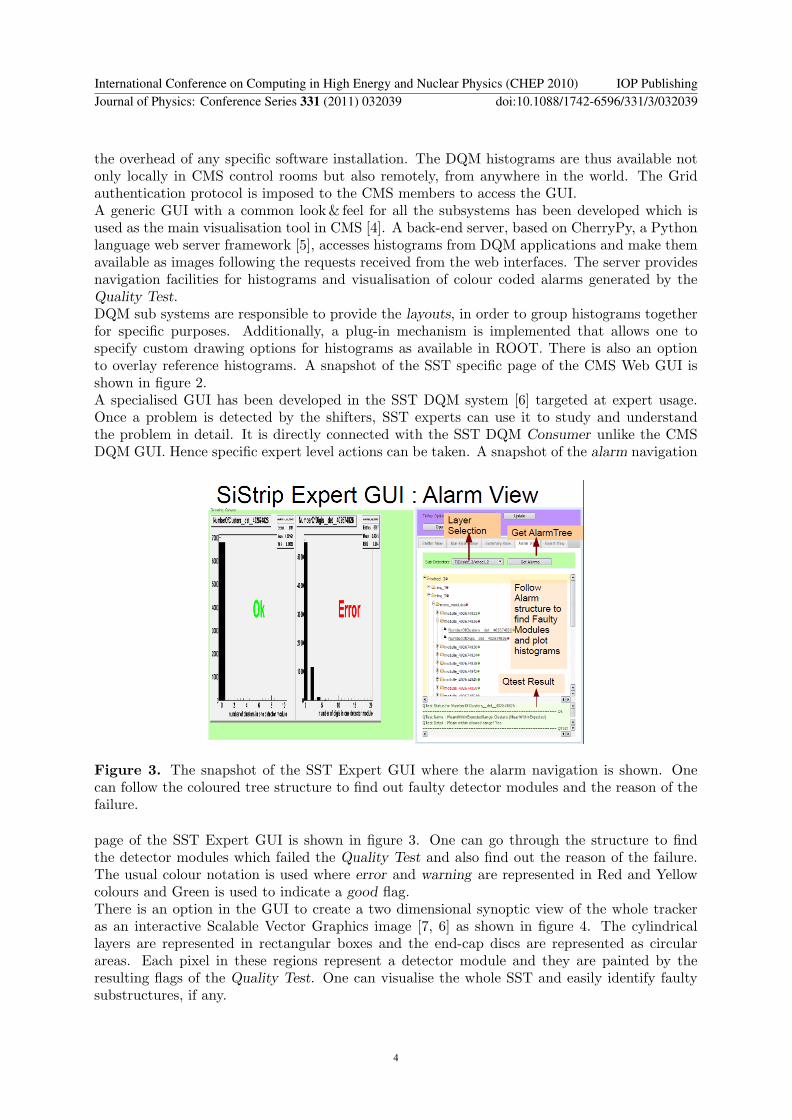
the overhead of any specific software installation The DQM histograms are thus available notonly locally in CMS control rooms but also remotely from anywhere in the world The Gridauthentication protocol is imposed to the CMS members to access the GUIA generic GUI with a common look amp feel for all the subsystems has been developed which isused as the main visualisation tool in CMS [4] A back-end server based on CherryPy a Pythonlanguage web server framework [5] accesses histograms from DQM applications and make themavailable as images following the requests received from the web interfaces The server providesnavigation facilities for histograms and visualisation of colour coded alarms generated by theQuality TestDQM sub systems are responsible to provide the layouts in order to group histograms togetherfor specific purposes Additionally a plug-in mechanism is implemented that allows one tospecify custom drawing options for histograms as available in ROOT There is also an optionto overlay reference histograms A snapshot of the SST specific page of the CMS Web GUI isshown in figure 2A specialised GUI has been developed in the SST DQM system [6] targeted at expert usageOnce a problem is detected by the shifters SST experts can use it to study and understandthe problem in detail It is directly connected with the SST DQM Consumer unlike the CMSDQM GUI Hence specific expert level actions can be taken A snapshot of the alarm navigation
Figure 3 The snapshot of the SST Expert GUI where the alarm navigation is shown Onecan follow the coloured tree structure to find out faulty detector modules and the reason of thefailure
page of the SST Expert GUI is shown in figure 3 One can go through the structure to findthe detector modules which failed the Quality Test and also find out the reason of the failureThe usual colour notation is used where error and warning are represented in Red and Yellowcolours and Green is used to indicate a good flagThere is an option in the GUI to create a two dimensional synoptic view of the whole trackeras an interactive Scalable Vector Graphics image [7 6] as shown in figure 4 The cylindricallayers are represented in rectangular boxes and the end-cap discs are represented as circularareas Each pixel in these regions represent a detector module and they are painted by theresulting flags of the Quality Test One can visualise the whole SST and easily identify faultysubstructures if any
International Conference on Computing in High Energy and Nuclear Physics (CHEP 2010) IOP PublishingJournal of Physics Conference Series 331 (2011) 032039 doi1010881742-65963313032039
4
Figure 4 Two dimensional synoptic view of the SST painted by Quality Test flags One caneasily identify faulty region as shown in one of the end-cap discs
5 Data CertificationIn CMS data certification is composed of manual and automatic components and is provided runby run The certification procedure is described in a block diagram in figure 5 The automatic
Figure 5 The certification procedure in CMS DQM system is represented in a block diagram
flag in a given run is derived from the Quality Test results In the SST a simple algorithm isused to combine individual results and a overall flag is created which represents the fraction ofperfectly working detectors The online and offline DQM shifters check selected set of histogramsdefined by the SST experts compare them with reference and provide manual feedback for eachrun Further manual input comes from the SST experts where SST specific tools are utilised tostudy the histograms in detail One such tool is the Historic DQM [8] where the trend of mean
International Conference on Computing in High Energy and Nuclear Physics (CHEP 2010) IOP PublishingJournal of Physics Conference Series 331 (2011) 032039 doi1010881742-65963313032039
5
or rms of a few SST observables are plotted as a function of run numbers and the outliers areidentified Bookkeeping of automatic and manual flags together with data taking conditions isdone in the CMS Run Registry [9] which has a database back-end
6 SummaryThe SST DQM system is performing excellently since data taking started in CMS The operationhas been very stable and the system provides key information about the SST performance andensures goodness of data for physics analysis Only 02 of data are marked bad for physicsanalysis by the SST DQM system which is mainly due to hardware failure and scheduledcalibration activities The system was prompt enough to spot them as problem or deviationfrom standard behaviour The system proved to be robust against several orders of magnitudeincrease in LHC peak luminosity
7 References
[1] CMS Physics Technical Design Report Volume I Detector Performance and Software CERNLHCC2006-001 CMS TDR 81 2 February 2006
[2] ROOT An Object-Oriented Data Analysis Framework httprootcernch[3] Data Quality Monitoring of the CMS Experiment the Tracker Case
S DuttaNuclear Physics B Proceedings Supplement 197 (2009) p271
[4] CMS data quality monitoring web serviceL Tuura G Eulisse1 and A Meyer2010 JPhysConf Ser 219 072055
[5] CherryPyA pythonic object-oriented HTTP framework 2009httpcherrypyorg
[6] The CMS tracker Data Quality Monitoring expert GUIF M Palmonari S DuttaNuclear Science Symposium Conference Record (NSSMIC) 2009 IEEEDigital Object Identifier 101109NSSMIC20095401981Publication Year 2009 Page(s) 602 - 604
[7] Use of Interactive SVG Maps and Web Services to Monitor CMS TrackerMS Menea G ZitoProceedings of IEEE-NPSS Real Time Conference 2005
[8] History Plotting Tool of Data Quality MonitoringD Giordano A-C Le Bihan A Pierro and M De MattiaNuclear Ins Methods in Physics Research A NIMA50295
[9] CMS Run Registry Data Certification Bookkeeping and Publication SystemV RapseviciusProceeding of CHEP10
International Conference on Computing in High Energy and Nuclear Physics (CHEP 2010) IOP PublishingJournal of Physics Conference Series 331 (2011) 032039 doi1010881742-65963313032039
6
Data Quality Monitoring of the CMS Tracker
Suchandra Dutta on behalf of the CMS Tracker CollaborationNational Central University Taipei Taiwan
E-mail SuchandraDuttacernch
Abstract The Data Quality Monitoring system for the Tracker has been developed withinthe CMS Software framework It has been designed to be used during online data taking aswell as during offline reconstruction The main goal of the online system is to monitor detectorperformance and identify problems very efficiently during data collection so that proper actionscan be taken to fix it On the other hand any issue with data reconstruction or calibration canbe detected during offline processing using the same tool The monitoring is performed usinghistograms which are filled with information from raw and reconstructed data computed at thelevel of individual detectors Furthermore statistical tests are performed on these histograms tocheck the quality and flags are generated automatically Results are visualized with web basedgraphical user interfaces Final data certification is done combining these automatic flags andmanual inspection The Tracker DQM system has been successfully used during cosmic datataking and it has been optimised to fulfill the condition of collision data taking In this paperwe describe the functionality of the CMS Tracker DQM system and the experience acquiredduring proton-proton collision
1 IntroductionThe Data Quality Monitoring (DQM) in an experiment ensures that the detector componentsand trigger system work optimally during data taking and certifies recorded data for physicsanalysis It is one of the most important tools and must be robust as it needs to functionthroughout the life time of the experiment It is required to be very efficient to spot problemsin the detector and trigger systems at the earliest possible stage of data acquisition and to issuealerts for the relevant experts so that immediate actions can be takenIn the Compact Muon Solenoid (CMS) at the Large Hadron Collider (LHC) at CERN the DQMis done in a common infrastructure and individual sub-detector or trigger DQM systems aredeveloped based on this infrastructure We shall discuss here the DQM system developed forthe Silicon Strip Tracker (SST) of CMS The SST consists of 15 K microstrip silicon detectormodules arranged in 10 cylindrical barrel layers and 12 end-cap disks on forward and backwardsides These detectors are read out by about 10 million electronic channels The complexity ofthe SST DQM system reflects the complexity of the Tracker system It was essential to developa few SST specific DQM tools to ensure optimal functionality of the SST
2 Data Quality Monitoring SchemeThe DQM framework in CMS is embedded in the CMS software environment (CMSSW) [1]and provides the basis for creation transportation and visualization of monitoring informationMonitoring is done in the form of histograms numbers or strings The Object Oriented analysisframework ROOT [2] is used for this purpose
International Conference on Computing in High Energy and Nuclear Physics (CHEP 2010) IOP PublishingJournal of Physics Conference Series 331 (2011) 032039 doi1010881742-65963313032039
Published under licence by IOP Publishing Ltd 1
Figure 1 Schematic view of the CMS DQM framework describing basic building blocks
The CMS Data Quality Monitoring system has three components as shown in figure 1 Thehistograms are created and filled by accessing event information Producer modulesHistograms are accessed by the Consumer module which performs further analysis and producessummary histograms andor numbers The module uses the Quality Test tool available in theDQM infrastructure to perform statistical tests on histograms comparing them with a referenceThe reference could be a histogram or a set of values like range mean rms etc The deviationfrom the reference is classified as Warning or Error depending on the severity and alarms aregeneratedThe histograms are visualised in web based Graphical User Interfaces (GUI) which is discussedin detail in section 4The data quality in CMS is monitored in real-time (online) during data taking as well as invarious stages of the offline processing of event data During data acquisition apart from afew specific cases a fraction of events are processed to have quick feedback on the detectorperformance The same DQM application is used during offline reconstruction within a fewhours of data taking where complete event statistics is available and fully reconstructed andcalibrated objects are accessible The main purpose here is to check the data in detail to spotreconstruction as well as calibration problems The output from both online and offline DQMapplications is visualised on the web GUI and also archived for future reference
3 Monitoring Information and OrganisationIn the SST DQM system [3] a number of Producer modules have been developed Each producermodule deals with a specific type of event information and the histograms are defined andfilled accordingly The monitoring information accessed from different levels of reconstructionconsists of
bull Raw Data Monitoring the basic event information with different error codes which ariseduring data unpacking
bull Digitisation Monitoring digitisation characteristics namely amplitude hottest and cooleststrips and number of digitised signals etc
International Conference on Computing in High Energy and Nuclear Physics (CHEP 2010) IOP PublishingJournal of Physics Conference Series 331 (2011) 032039 doi1010881742-65963313032039
2
bull Cluster Monitoring cluster properties like charge position width noise etcbull Track Monitoring reconstructed track parameters such as momentum track angles fit
qualities number of hits used in track fit etcbull Cluster Monitoring with Track the properties of on-track and off-track clusters are studied
Histograms are defined for individual detector modules as well as globally depending on thenature of the information The granularity of the SST is directly reflected in the number ofhistograms (sim 300 K) The geometrical structure of the tracker is followed to create a tree likefolder structure to store histograms Histograms related to individual tracker components areplaced inside the corresponding folder in order to facilitate quick and easy accessA dedicated consumer module has been developed in the SST DQM system One of itrsquos tasks isto create summary histograms combining information from individual detector level histogramsFor example the mean values of a given histogram type in the lowest level of the tree structureis accessed to fill new histograms at geometrically higher levels Summary histograms are veryefficient to locate a possible problem and save the time needed to go through individual detectorlevel histograms The consumer accesses the Quality Test flags from different levels of the SSTand finally combines them to produce a global flag This is used in data certification
4 Web Based Visualisation
Figure 2 SST specific page of the CMS DQM GUI where 7 groups of histograms are are shownusing SST layout The histograms represent overview of the SST performance The referencehistograms are superimposed in some cases and are shown as gray filled areas
The visualisation of DQM histograms is achieved in web based Graphical User Interfaces (GUIs)The main advantage of the web based GUI is that one just needs a standard web browser without
International Conference on Computing in High Energy and Nuclear Physics (CHEP 2010) IOP PublishingJournal of Physics Conference Series 331 (2011) 032039 doi1010881742-65963313032039
3
the overhead of any specific software installation The DQM histograms are thus available notonly locally in CMS control rooms but also remotely from anywhere in the world The Gridauthentication protocol is imposed to the CMS members to access the GUIA generic GUI with a common look amp feel for all the subsystems has been developed which isused as the main visualisation tool in CMS [4] A back-end server based on CherryPy a Pythonlanguage web server framework [5] accesses histograms from DQM applications and make themavailable as images following the requests received from the web interfaces The server providesnavigation facilities for histograms and visualisation of colour coded alarms generated by theQuality TestDQM sub systems are responsible to provide the layouts in order to group histograms togetherfor specific purposes Additionally a plug-in mechanism is implemented that allows one tospecify custom drawing options for histograms as available in ROOT There is also an optionto overlay reference histograms A snapshot of the SST specific page of the CMS Web GUI isshown in figure 2A specialised GUI has been developed in the SST DQM system [6] targeted at expert usageOnce a problem is detected by the shifters SST experts can use it to study and understandthe problem in detail It is directly connected with the SST DQM Consumer unlike the CMSDQM GUI Hence specific expert level actions can be taken A snapshot of the alarm navigation
Figure 3 The snapshot of the SST Expert GUI where the alarm navigation is shown Onecan follow the coloured tree structure to find out faulty detector modules and the reason of thefailure
page of the SST Expert GUI is shown in figure 3 One can go through the structure to findthe detector modules which failed the Quality Test and also find out the reason of the failureThe usual colour notation is used where error and warning are represented in Red and Yellowcolours and Green is used to indicate a good flagThere is an option in the GUI to create a two dimensional synoptic view of the whole trackeras an interactive Scalable Vector Graphics image [7 6] as shown in figure 4 The cylindricallayers are represented in rectangular boxes and the end-cap discs are represented as circularareas Each pixel in these regions represent a detector module and they are painted by theresulting flags of the Quality Test One can visualise the whole SST and easily identify faultysubstructures if any
International Conference on Computing in High Energy and Nuclear Physics (CHEP 2010) IOP PublishingJournal of Physics Conference Series 331 (2011) 032039 doi1010881742-65963313032039
4
Figure 4 Two dimensional synoptic view of the SST painted by Quality Test flags One caneasily identify faulty region as shown in one of the end-cap discs
5 Data CertificationIn CMS data certification is composed of manual and automatic components and is provided runby run The certification procedure is described in a block diagram in figure 5 The automatic
Figure 5 The certification procedure in CMS DQM system is represented in a block diagram
flag in a given run is derived from the Quality Test results In the SST a simple algorithm isused to combine individual results and a overall flag is created which represents the fraction ofperfectly working detectors The online and offline DQM shifters check selected set of histogramsdefined by the SST experts compare them with reference and provide manual feedback for eachrun Further manual input comes from the SST experts where SST specific tools are utilised tostudy the histograms in detail One such tool is the Historic DQM [8] where the trend of mean
International Conference on Computing in High Energy and Nuclear Physics (CHEP 2010) IOP PublishingJournal of Physics Conference Series 331 (2011) 032039 doi1010881742-65963313032039
5
or rms of a few SST observables are plotted as a function of run numbers and the outliers areidentified Bookkeeping of automatic and manual flags together with data taking conditions isdone in the CMS Run Registry [9] which has a database back-end
6 SummaryThe SST DQM system is performing excellently since data taking started in CMS The operationhas been very stable and the system provides key information about the SST performance andensures goodness of data for physics analysis Only 02 of data are marked bad for physicsanalysis by the SST DQM system which is mainly due to hardware failure and scheduledcalibration activities The system was prompt enough to spot them as problem or deviationfrom standard behaviour The system proved to be robust against several orders of magnitudeincrease in LHC peak luminosity
7 References
[1] CMS Physics Technical Design Report Volume I Detector Performance and Software CERNLHCC2006-001 CMS TDR 81 2 February 2006
[2] ROOT An Object-Oriented Data Analysis Framework httprootcernch[3] Data Quality Monitoring of the CMS Experiment the Tracker Case
S DuttaNuclear Physics B Proceedings Supplement 197 (2009) p271
[4] CMS data quality monitoring web serviceL Tuura G Eulisse1 and A Meyer2010 JPhysConf Ser 219 072055
[5] CherryPyA pythonic object-oriented HTTP framework 2009httpcherrypyorg
[6] The CMS tracker Data Quality Monitoring expert GUIF M Palmonari S DuttaNuclear Science Symposium Conference Record (NSSMIC) 2009 IEEEDigital Object Identifier 101109NSSMIC20095401981Publication Year 2009 Page(s) 602 - 604
[7] Use of Interactive SVG Maps and Web Services to Monitor CMS TrackerMS Menea G ZitoProceedings of IEEE-NPSS Real Time Conference 2005
[8] History Plotting Tool of Data Quality MonitoringD Giordano A-C Le Bihan A Pierro and M De MattiaNuclear Ins Methods in Physics Research A NIMA50295
[9] CMS Run Registry Data Certification Bookkeeping and Publication SystemV RapseviciusProceeding of CHEP10
International Conference on Computing in High Energy and Nuclear Physics (CHEP 2010) IOP PublishingJournal of Physics Conference Series 331 (2011) 032039 doi1010881742-65963313032039
6
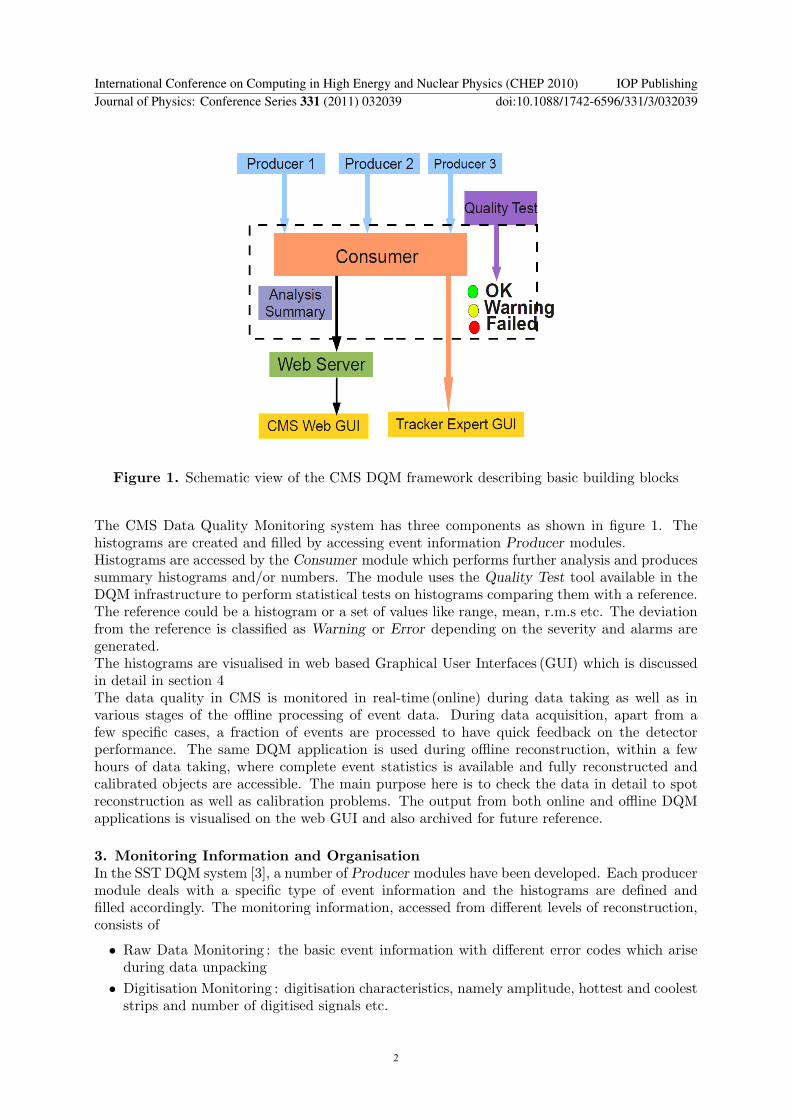
