Embed Size (px)
Citation preview
RESEARCH ARTICLE Open Access
Data mining polycystic ovary morphologyin electronic medical record ultrasoundreportsJay Jojo Cheng1* and Shruthi Mahalingaiah2,3,4
Abstract
Background: Polycystic ovary syndrome (PCOS) is characterized by hyperandrogenemia, oligo-anovulation, andnumerous ovarian cysts. Hospital electronic medical records provide an avenue for investigating polycystic ovarymorphology commonly seen in PCOS at a large scale. The purpose of this study was to develop and evaluate theperformance of two machine learning text algorithms, for classification of polycystic ovary morphology (PCOM) inpelvic ultrasounds.
Methods: Pelvic ultrasound reports from patients at Boston Medical Center between October 1, 2003 andDecember 12, 2016 were included for analysis, which resulted in 39,093 ultrasound reports from 25,535 uniquewomen. Following the 2003 Rotterdam Consensus Criteria for polycystic ovary syndrome, 2000 randomly selectedultrasounds were expert labeled for PCOM status as present, absent, or unidentifiable (not able to be determinedfrom text alone). An ovary was marked as having PCOM if there was mention of numerous peripheral follicles or ifthe volume was greater than 10 ml in the absence of a dominant follicle or other confounding pathology. Half ofthe labeled data was used to develop and refine the algorithms, and the other half was used as a test set forevaluating its accuracy.
Results: On the evaluation set of 1000 random US reports, the accuracy of the classifiers were 97.6% (95% CI: 96.5,98.5%) and 96.1% (94.7, 97.2%). Both models were more adept at identifying PCOM-absent ultrasounds than eitherPCOM-unidentifiable or PCOM-present ultrasounds. The two classifiers estimated prevalence of PCOM within thewhole set of 39,093 ultrasounds to be 44% PCOM-absent, 32% PCOM-unidentifiable, and 24% PCOM-present.
Conclusions: Although accuracy measured on the test set and inter-rater agreement between the two classifiers(Cohen’s Kappa = 0.988) was high, a major limitation of our approach is that it uses the ultrasound report text as aproxy and does not directly count follicles from the ultrasound images themselves.
Keywords: Machine learning, Data mining, Ultrasound, Polycystic ovary syndrome, Electronic medical record
BackgroundPolycystic ovary syndrome (PCOS) is a leading cause offemale infertility and one of the most common endo-crine disorders in women [1]. Affecting about 5–15% ofreproductive-age women, the syndrome is characterizedby hyperandrogenism, oligo-anovulation, and polycysticovary morphology (PCOM), and it is associated with anincreased risk for infertility, endometrial cancer, and
metabolic syndrome [2]. Despite its prevalence, the syn-drome’s etiology is not well understood and its diagnosisis contested [3].PCOM, in particular, plays a central role in the
ongoing deliberation: the two leading criteria, the 2003Rotterdam Consensus Criteria and the Androgen Excessand PCOS Society recommendations, diverge primarilyon the sufficiency of PCOM as a criterion in the diagno-sis of PCOS. There is recent evidence that the improvedresolution of newer ultrasound technology increases thenumber of observable follicles, thereby inflating theprevalence of PCOM [4]. Furthermore, PCOM is a
© The Author(s). 2019 Open Access This article is distributed under the terms of the Creative Commons Attribution 4.0International License (http://creativecommons.org/licenses/by/4.0/), which permits unrestricted use, distribution, andreproduction in any medium, provided you give appropriate credit to the original author(s) and the source, provide a link tothe Creative Commons license, and indicate if changes were made. The Creative Commons Public Domain Dedication waiver(http://creativecommons.org/publicdomain/zero/1.0/) applies to the data made available in this article, unless otherwise stated.
* Correspondence: [email protected] of Biostatistics and Medical Informatics, University of Wisconsin,702 West Johnson Street, Madison, WI 53792, USAFull list of author information is available at the end of the article
Cheng and Mahalingaiah Fertility Research and Practice (2019) 5:13 https://doi.org/10.1186/s40738-019-0067-7
relatively common finding in healthy women with robustearly follicular recruitment [5, 6]. For these reasons, somepropose increasing the follicle count cutoff or abandoningultrasound altogether in favor of other biomarkers, suchas serum anti-Müllerian hormone (AMH) [7, 8].The role of PCOM within the disease is difficult to
study in part because of the blood tests, pelvic ultra-sounds, and accurate menstrual data required for studieson PCOS. Existing electronic medical record (EMR) dataprovide an opportunity for a closer study of PCOM andsuggest appropriate diagnostic standards. Compared tothe high costs associated with collecting and interpretingnew ultrasound data, hospital data is abundant, readilyavailable, relatively inexpensive, and linkable with pa-tients’ other clinical data for longitudinal investigation.The major challenge with using EMR data is that infor-mation about PCOM is captured in formats not amen-able to traditional methods, such as ultrasound imagesand radiology text reports.In this study, we develop two text-based machine
learning algorithms for identifying PCOM in pelvicultrasound reports and compare them to human bench-marks. These tools work directly with text from thereport, leveraging the fact that even if a clinician maynot be actively reporting about PCOM in writing theultrasound report, its presence or absence can beinferred through reported volume measurements andwhat is written about the ovaries’ internal structure.
MethodsData and study designAll ultrasounds from October 1, 2003 to December 7,2016 were queried from the Boston Medical CenterClinical Data Warehouse. The start-date was selected toreflect the first day that ICD-9 codes were used and re-corded at Boston Medical Center. This query yielded 39,093 ultrasounds for 25,535 unique patients; in total, thistext corpus consisted of 3,707,837 words, with eachultrasound document containing an average of 95 words.Using a regular expression search, a standard practicefor string-searching algorithms, we found that out of 39,093 ultrasounds, only 6273 did not include three-dimensional volume measurements of the ovaries. Theseultrasounds were still included for classification. Thisstudy was approved by the Institutional Review Board ofBoston University School of Medicine and the BostonUniversity Medical Campus.
Reference label definitionOf the 39,093 ultrasounds, 2000 reports were randomlyselected to be hand-labeled by research staff supervisedby a board-certified reproductive endocrinology and in-fertility (REI) specialist. These labels served as the hu-man benchmarks for the study. Of these, 1000 randomly
selected ultrasounds were chosen to be a training set fordeveloping the algorithms and another 1000 randomlyselected ultrasounds were chosen to be a test set for anunbiased estimate of its performance.The 2003 Rotterdam Criteria define PCOM as the
“presence of 12 or more follicles in each ovarymeasuring 2-9 mm in diameter, and/or increasedovarian volume (10 mL).” [2] Following the Criteria,an ovary was labeled with one of three determina-tions: polycystic morphology (PCOM-present), freeof polycystic morphology (PCOM-absent), or un-identifiable in the current examination (unidentifi-able). We classified an ovary as PCOM if it wasgreater than 10 ml in volume in the absence of adominant follicle (or other confounding structure), or if itcontained a mention of classical PCOM appearance, suchas “string of pearls orientation,” or “numerous peripheralfollicles.” A determination of unidentifiable was made ifthe volume was greater than 10ml, but there was alsomention of a structure that confounded stromal volume(e.g. dominant follicle, dermoid cyst, hemorrhagic cyst,etc.), if there was no mention of ovaries, or if the ovarieswere not measured. This follows the Rotterdam consensusthat “If there is evidence of a dominant follicle (>10mm)or a corpus luteum, the scan should be repeated the nextcycle.” An ovary was considered PCOM-absent if it wassmaller than or equal to 10ml and did not describe clas-sical PCOM appearance.
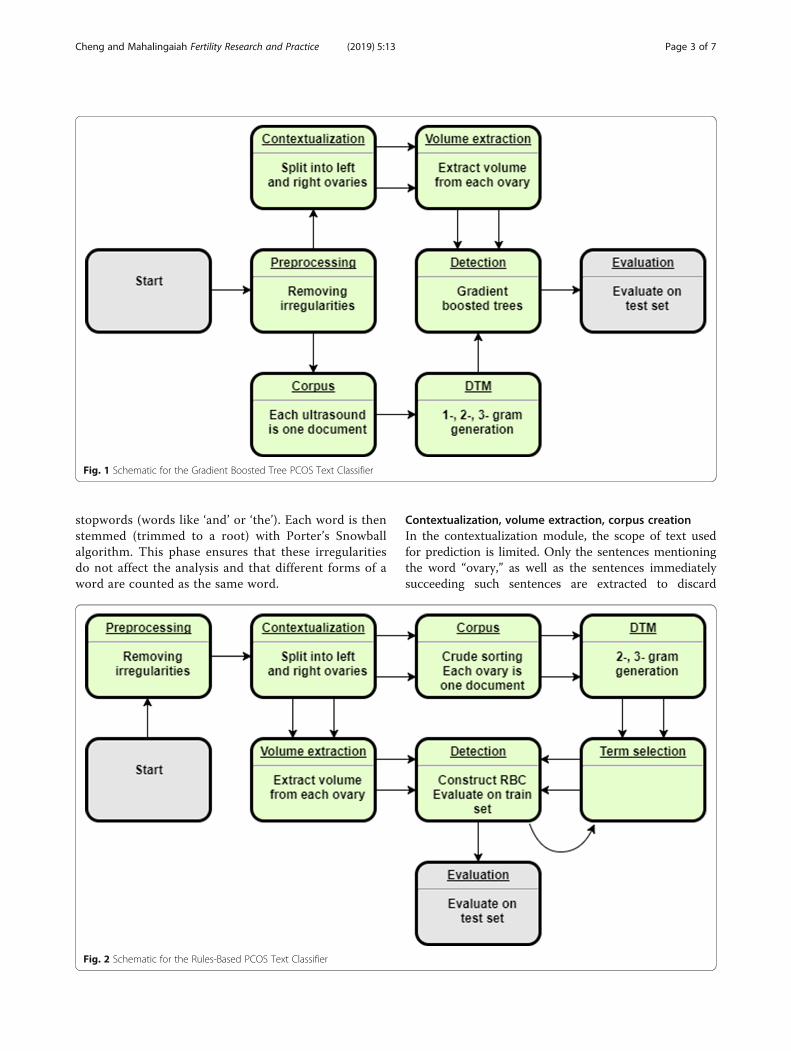
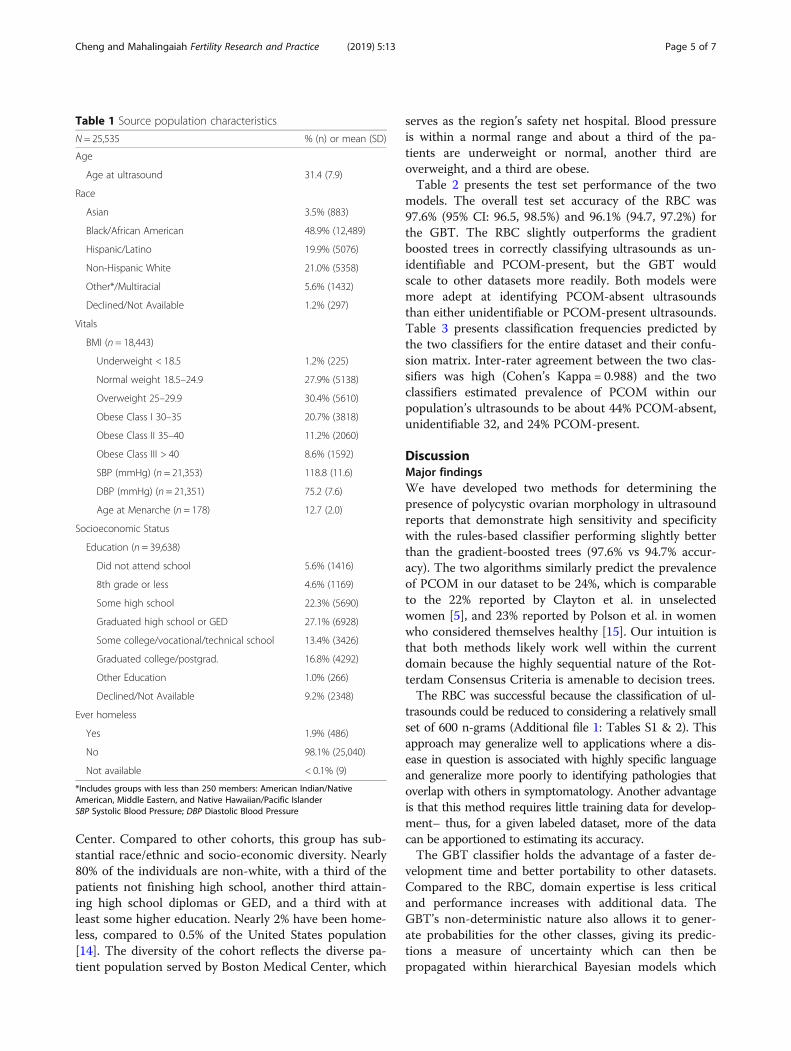
ModelsTo accomplish the classification task, two approacheswere used: (1) a rule-based classifier (RBC) that checksthe size of each ovary and detects important wordsappearing close to the word, “ovary,” which may indicatethe presence of PCOM or confounding structures, and(2) a gradient boosted tree model (GBT) that learnsfrom the frequencies of key terms and ovarian volumemeasurements within each report. Since neither algo-rithm uses the image directly and antral follicle countsnot always reported directly, follicle counts are not used.The overall architectures are depicted in Figs. 1 and 2,respectively.
Rule-based classifier (RBC)The rule-based classifier consists of several modules: apreprocessing phase, contextualization, volume extrac-tion, corpus and document-term matrix creation, termselection, detection, and final evaluation. The overallscheme is given in Fig. 1.
Text preprocessingIn the preprocessing phase, standard NLP techniquesfor cleaning are used, including removing irregularcharacters, nonstandard spaces, punctuation, and
Cheng and Mahalingaiah Fertility Research and Practice (2019) 5:13 Page 2 of 7
stopwords (words like ‘and’ or ‘the’). Each word is thenstemmed (trimmed to a root) with Porter’s Snowballalgorithm. This phase ensures that these irregularitiesdo not affect the analysis and that different forms of aword are counted as the same word.
Contextualization, volume extraction, corpus creationIn the contextualization module, the scope of text usedfor prediction is limited. Only the sentences mentioningthe word “ovary,” as well as the sentences immediatelysucceeding such sentences are extracted to discard
Fig. 1 Schematic for the Gradient Boosted Tree PCOS Text Classifier
Fig. 2 Schematic for the Rules-Based PCOS Text Classifier
Cheng and Mahalingaiah Fertility Research and Practice (2019) 5:13 Page 3 of 7

descriptions of other organs such as the uterus or kid-neys, which may also appear on pelvic ultrasounds. Next,regular expressions are used to group sentences with ei-ther the left or right ovary. The end-product of thismodule is a dataset with up to two entries correspondingto a single ultrasound (one for either ovary). Sentencesthat describe both ovaries are repeated and appear inboth rows. The group of sentences associated with a sin-gle ovary are henceforth referred to as a ‘document,’ andthe collection of these documents is the whole ‘corpus.’During the volume extraction phase, regular expres-
sions are used to extract 3-dimensional measurementsfrom the ultrasounds and to determine the correct unitof measurement. Volume of ovaries are calculated ac-cording to length � width � height � π6 [9]. Ovarian mea-surements with only 1- and 2-dimensions reported areexcluded (as a volume cannot be computed).
Document-term-matrix (DTM) creationIn order to use the volume cutoff of 10ml, we needed todistinguish between ovaries enlarged by increased stromalvolume (PCOM) and ovaries enlarged due to recruitmentof a dominant follicle or presence of abnormal pathology(e.g. hemorrhagic cysts and dermoids). The text that indi-cated the latter circumstance are called ‘volume con-founders.’ We constructed a comprehensive list of reasonsempirically using a document-term matrix (DTM). Thismatrix is essentially a frequency table of words in the doc-uments. The columns of the matrix correspond to everyword that appears at least once in the corpus (in at leastone document), and the rows correspond to each docu-ment. The cells correspond to the number of times theterm is used in the document. Using the DTM offers thedistinct advantage of generating all possible reasonsappearing in the dataset, implicitly accounting for the nat-ural language of the data. Typically the problem of listingthese reasons would be impossible to solve a priori.With the volumes extracted previously, the algorithm
finds 2-, and 3-g (2 and 3 word groupings) correlatedwith a large ovarian volume (> 10ml) were extractedinto a list [10]. We chose not to use 1-g in order todecrease the variance of the method. The list of 3-gcorrelated to “numerous peripheral follicles” and the listof 2-g most correlated with the phrases, “ovarian syn-drome,” “polycystic ovarian,” and “string of pearls” werealso extracted into a list in order to detect the notedpresence of PCOM. This module results in two lists ofn-grams: one for potential volume confounders and theother for potential descriptions of PCOM.
Term selection and detectionThe n-grams from these two lists were then curated soonly phrases that indicate the presence of polycystic
morphology or the presence of a volume confounderwere kept (Additional file 1: Tables S1 & 2). During thedetection phase, the relative counts of these phraseswere used to determine either the presence of volumeconfounding or polycystic morphology. This selection ofn-grams was iteratively refined on the training set.The rules for the detection algorithm then followed
the Rotterdam Consensus Criteria and used the ovarianvolume and presence of numerous follicles to determinethe presence of PCOM for each ovary (Additional file 1:Figure S3). Overall patient status for the given ultra-sound is determined from the status of both ovaries.The patient is determined to have PCOM on a givenultrasound if at least one ovary had PCOM.
EvaluationDuring the evaluation phase, predicted classification la-bels were compared to the hand-labeled test set of 1000ultrasounds for computing confusion matrices and ac-curacy statistics.
Gradient boosted tree classifier (GBT)Gradient boosting is a machine learning technique thatensembles many weak prediction models in an additive,stage-wise manner to produce a stronger model. At eachstage, new weak models are introduced to account for theerrors of previously existing weak models, allowing the en-semble to learn non-linearities [11, 12]. The schematic forgradient boosted tree model is given in Fig. 2. The GBTuses the same preprocessing module as the RBC. After theultrasound text is preprocessed, the corpus is generateddirectly without contextualization and splitting into leftand right ovaries. Thus, each ultrasound report corre-sponds to one document within the corpus. This was doneto see if the bilateral nature of detecting PCOM could belearned by the algorithm without explicitly programmingit. Similarly, a document-term matrix was generated fromall 1-, 2-, and 3-g without any human selection to see ifimportant phrases could be learned during training.The contextualization and volume extraction modules
were used to extract ovarian volumes as predictors forthe boosted tree algorithm. The GBT used the XGBoostlibrary with default parameters except for the number oftraining iterations, which was selected by minimizing the5-fold cross-validation (CV) error on the training data[13]. Hyperparameter tuning was briefly attempted, butabandoned because there were no significant improve-ments in CV training error compared to the extra com-putational cost. Additional file 1: Figure S4 shows themost important predictors learned by the GBT model.
ResultsTable 1 includes demographic and general health infor-mation about the source population at Boston Medical
Cheng and Mahalingaiah Fertility Research and Practice (2019) 5:13 Page 4 of 7
Center. Compared to other cohorts, this group has sub-stantial race/ethnic and socio-economic diversity. Nearly80% of the individuals are non-white, with a third of thepatients not finishing high school, another third attain-ing high school diplomas or GED, and a third with atleast some higher education. Nearly 2% have been home-less, compared to 0.5% of the United States population[14]. The diversity of the cohort reflects the diverse pa-tient population served by Boston Medical Center, which
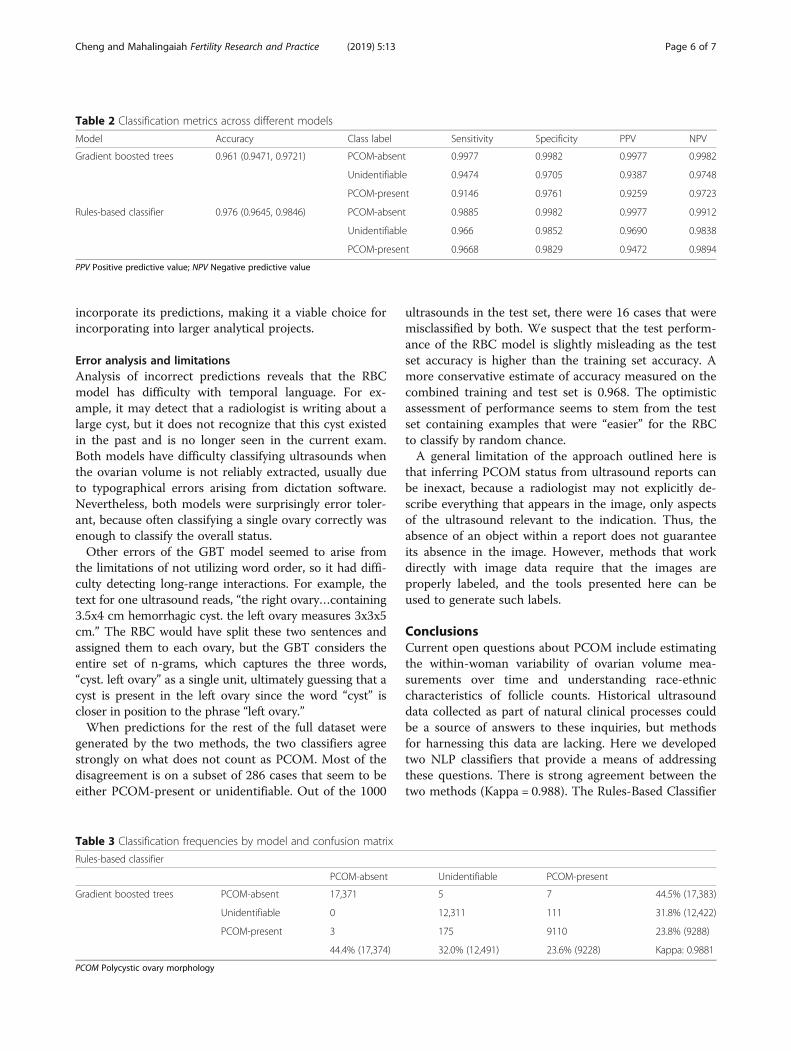
serves as the region’s safety net hospital. Blood pressureis within a normal range and about a third of the pa-tients are underweight or normal, another third areoverweight, and a third are obese.Table 2 presents the test set performance of the two
models. The overall test set accuracy of the RBC was97.6% (95% CI: 96.5, 98.5%) and 96.1% (94.7, 97.2%) forthe GBT. The RBC slightly outperforms the gradientboosted trees in correctly classifying ultrasounds as un-identifiable and PCOM-present, but the GBT wouldscale to other datasets more readily. Both models weremore adept at identifying PCOM-absent ultrasoundsthan either unidentifiable or PCOM-present ultrasounds.Table 3 presents classification frequencies predicted bythe two classifiers for the entire dataset and their confu-sion matrix. Inter-rater agreement between the two clas-sifiers was high (Cohen’s Kappa = 0.988) and the twoclassifiers estimated prevalence of PCOM within ourpopulation’s ultrasounds to be about 44% PCOM-absent,unidentifiable 32, and 24% PCOM-present.
DiscussionMajor findingsWe have developed two methods for determining thepresence of polycystic ovarian morphology in ultrasoundreports that demonstrate high sensitivity and specificitywith the rules-based classifier performing slightly betterthan the gradient-boosted trees (97.6% vs 94.7% accur-acy). The two algorithms similarly predict the prevalenceof PCOM in our dataset to be 24%, which is comparableto the 22% reported by Clayton et al. in unselectedwomen [5], and 23% reported by Polson et al. in womenwho considered themselves healthy [15]. Our intuition isthat both methods likely work well within the currentdomain because the highly sequential nature of the Rot-terdam Consensus Criteria is amenable to decision trees.The RBC was successful because the classification of ul-
trasounds could be reduced to considering a relatively smallset of 600 n-grams (Additional file 1: Tables S1 & 2). Thisapproach may generalize well to applications where a dis-ease in question is associated with highly specific languageand generalize more poorly to identifying pathologies thatoverlap with others in symptomatology. Another advantageis that this method requires little training data for develop-ment– thus, for a given labeled dataset, more of the datacan be apportioned to estimating its accuracy.The GBT classifier holds the advantage of a faster de-
velopment time and better portability to other datasets.Compared to the RBC, domain expertise is less criticaland performance increases with additional data. TheGBT’s non-deterministic nature also allows it to gener-ate probabilities for the other classes, giving its predic-tions a measure of uncertainty which can then bepropagated within hierarchical Bayesian models which
Table 1 Source population characteristics
N = 25,535 % (n) or mean (SD)
Age
Age at ultrasound 31.4 (7.9)
Race
Asian 3.5% (883)
Black/African American 48.9% (12,489)
Hispanic/Latino 19.9% (5076)
Non-Hispanic White 21.0% (5358)
Other*/Multiracial 5.6% (1432)
Declined/Not Available 1.2% (297)
Vitals
BMI (n = 18,443)
Underweight < 18.5 1.2% (225)
Normal weight 18.5–24.9 27.9% (5138)
Overweight 25–29.9 30.4% (5610)
Obese Class I 30–35 20.7% (3818)
Obese Class II 35–40 11.2% (2060)
Obese Class III > 40 8.6% (1592)
SBP (mmHg) (n = 21,353) 118.8 (11.6)
DBP (mmHg) (n = 21,351) 75.2 (7.6)
Age at Menarche (n = 178) 12.7 (2.0)
Socioeconomic Status
Education (n = 39,638)
Did not attend school 5.6% (1416)
8th grade or less 4.6% (1169)
Some high school 22.3% (5690)
Graduated high school or GED 27.1% (6928)
Some college/vocational/technical school 13.4% (3426)
Graduated college/postgrad. 16.8% (4292)
Other Education 1.0% (266)
Declined/Not Available 9.2% (2348)
Ever homeless
Yes 1.9% (486)
No 98.1% (25,040)
Not available < 0.1% (9)
*Includes groups with less than 250 members: American Indian/NativeAmerican, Middle Eastern, and Native Hawaiian/Pacific IslanderSBP Systolic Blood Pressure; DBP Diastolic Blood Pressure
Cheng and Mahalingaiah Fertility Research and Practice (2019) 5:13 Page 5 of 7
incorporate its predictions, making it a viable choice forincorporating into larger analytical projects.
Error analysis and limitationsAnalysis of incorrect predictions reveals that the RBCmodel has difficulty with temporal language. For ex-ample, it may detect that a radiologist is writing about alarge cyst, but it does not recognize that this cyst existedin the past and is no longer seen in the current exam.Both models have difficulty classifying ultrasounds whenthe ovarian volume is not reliably extracted, usually dueto typographical errors arising from dictation software.Nevertheless, both models were surprisingly error toler-ant, because often classifying a single ovary correctly wasenough to classify the overall status.Other errors of the GBT model seemed to arise from
the limitations of not utilizing word order, so it had diffi-culty detecting long-range interactions. For example, thetext for one ultrasound reads, “the right ovary…containing3.5x4 cm hemorrhagic cyst. the left ovary measures 3x3x5cm.” The RBC would have split these two sentences andassigned them to each ovary, but the GBT considers theentire set of n-grams, which captures the three words,“cyst. left ovary” as a single unit, ultimately guessing that acyst is present in the left ovary since the word “cyst” iscloser in position to the phrase “left ovary.”When predictions for the rest of the full dataset were
generated by the two methods, the two classifiers agreestrongly on what does not count as PCOM. Most of thedisagreement is on a subset of 286 cases that seem to beeither PCOM-present or unidentifiable. Out of the 1000
ultrasounds in the test set, there were 16 cases that weremisclassified by both. We suspect that the test perform-ance of the RBC model is slightly misleading as the testset accuracy is higher than the training set accuracy. Amore conservative estimate of accuracy measured on thecombined training and test set is 0.968. The optimisticassessment of performance seems to stem from the testset containing examples that were “easier” for the RBCto classify by random chance.A general limitation of the approach outlined here is
that inferring PCOM status from ultrasound reports canbe inexact, because a radiologist may not explicitly de-scribe everything that appears in the image, only aspectsof the ultrasound relevant to the indication. Thus, theabsence of an object within a report does not guaranteeits absence in the image. However, methods that workdirectly with image data require that the images areproperly labeled, and the tools presented here can beused to generate such labels.
ConclusionsCurrent open questions about PCOM include estimatingthe within-woman variability of ovarian volume mea-surements over time and understanding race-ethniccharacteristics of follicle counts. Historical ultrasounddata collected as part of natural clinical processes couldbe a source of answers to these inquiries, but methodsfor harnessing this data are lacking. Here we developedtwo NLP classifiers that provide a means of addressingthese questions. There is strong agreement between thetwo methods (Kappa = 0.988). The Rules-Based Classifier
Table 2 Classification metrics across different models
Model Accuracy Class label Sensitivity Specificity PPV NPV
Gradient boosted trees 0.961 (0.9471, 0.9721) PCOM-absent 0.9977 0.9982 0.9977 0.9982
Unidentifiable 0.9474 0.9705 0.9387 0.9748
PCOM-present 0.9146 0.9761 0.9259 0.9723
Rules-based classifier 0.976 (0.9645, 0.9846) PCOM-absent 0.9885 0.9982 0.9977 0.9912
Unidentifiable 0.966 0.9852 0.9690 0.9838
PCOM-present 0.9668 0.9829 0.9472 0.9894
PPV Positive predictive value; NPV Negative predictive value
Table 3 Classification frequencies by model and confusion matrix
Rules-based classifier
PCOM-absent Unidentifiable PCOM-present
Gradient boosted trees PCOM-absent 17,371 5 7 44.5% (17,383)
Unidentifiable 0 12,311 111 31.8% (12,422)
PCOM-present 3 175 9110 23.8% (9288)
44.4% (17,374) 32.0% (12,491) 23.6% (9228) Kappa: 0.9881
PCOM Polycystic ovary morphology
Cheng and Mahalingaiah Fertility Research and Practice (2019) 5:13 Page 6 of 7
predicts 44.4% (17,374) PCOM-absent, 32.0% (12,491)unidentifiable, and 23.6% (9228) PCOM-present and theGradient Boosted Tree model predicts 44.5% (17,383)PCOM-absent, 31.8% (12,422) unidentifiable, and 23.8%(9288) PCOM-present. These results are consistent tothe approximately 20% prevalence of PCOM in somestudies. We recommend that further research in auto-matic feature extraction for PCOS be directed towardsmethods for the raw ultrasound images themselves.
Supplementary informationSupplementary information accompanies this paper at https://doi.org/10.1186/s40738-019-0067-7.
Additional file 1: Table S1. Confounder - These are phrases thatindicate the presence of a volume confounder (words that indicate largevolume is due to something other than PCOS). Table S2. PCOS words -These are phrases that indicate presence of polycystic morphology.Figure S3. Pseudocode - This is the pseudocode for the rules-based clas-sifier routine. It implements the Rotterdam Consensus Criteria. Figure S4.Importance plot - The variables (word stems) determined to be most im-portant for classification using the gradient boosted tree classifier. Thetop two variables, eval_right and eval_left are variables about the left andright ovarian volume extracted from the text.
AbbreviationsAMH: Anti-Müllerian hormone; CV: Cross-validation; DTM: Document-termmatrix; EMR: Electronic medical record; GBT: Gradient boosted tree model;PCOM: Polycystic ovary morphology; PCOM-absent: Free of polycysticmorphology; PCOS: Polycystic ovary syndrome; RBC: Rule-based classifier;REI: Reproductive endocrinology and infertility; Unidentifiable: Unidentifiablein the current examination
AcknowledgementsWe would like to acknowledge Linda Rosen, the research manager of theClinical Data Warehouse for procuring the dataset and Erika Rodriguez forformatting the manuscript for submission.
Authors’ contributionsJJC developed and coded the algorithms. Both authors designed the study,collected the data, analyzed the data, drafted, revised the manuscript, andapproved the final version of the article.
FundingThis work was supported by the Eunice Kennedy Shriver National Institute ofChild Health and Human Development (NICHD), National Institutes of Health,Reproductive Scientist Development Program (RSDP) K12 HD000849.
Availability of data and materialsThe datasets used and/or analyzed during the current study are availablefrom the corresponding author on reasonable request.
Ethics approval and consent to participateThis study was approved by the Institutional Review Board of BostonUniversity School of Medicine and the Boston University Medical Campus.
Consent for publicationThis study does not contain any individual person’s data in any form.
Competing interestsThe authors have no conflicts of interest to declare.
Author details1Department of Biostatistics and Medical Informatics, University of Wisconsin,702 West Johnson Street, Madison, WI 53792, USA. 2Department ofObstetrics and Gynecology, Boston University School of Medicine, 85 EastConcord Street, Boston, MA 02118, USA. 3Department of Epidemiology,
Boston University School of Public Health, Talbot 3E, 715 Albany Street,Boston, MA 02118, USA. 4Department of Physiology & Biophysics, BostonUniversity School of Medicine, 700 Albany St. W302, Boston, MA 02118, USA.
Received: 3 June 2019 Accepted: 12 November 2019
References1. Azziz R, Carmina E, Dewailly D, Diamanti-Kandarakis E, Escobar-Morreale HF,
Futterweit W, Janssen OE, Legro RS, Norman RJ, Taylor AE, Witchel SF. Taskforce on the phenotype of the polycystic ovary syndrome of the androgenE, society P. the androgen excess and PCOS society criteria for thepolycystic ovary syndrome: the complete task force report. Fertil Steril. 2009;91(2):456–88.
2. Rotterdam EA-SPCWG. Revised 2003 consensus on diagnostic criteria andlong-term health risks related to polycystic ovary syndrome. Fertil Steril.2004;81(1):19–25.
3. Azziz R. PCOS: a diagnostic challenge. Reprod BioMed Online. 2004;8(6):644–8.
4. Balen AH, Laven JSE, Tan SL, Dewailly D. Ultrasound assessment of thepolycystic ovary: international consensus definitions. Hum Reprod Update.2003;9(6):505–14.
5. Chen T, Guestrin C. XGBoost: A Scalable Tree Boosting System. Proceedingsof the 22nd ACM SIGKDD International Conference on KnowledgeDiscovery and Data Mining; San Francisco, California, USA. 2939785: ACM;2016. p. 785–94.
6. Clayton RN, Ogden V, Hodgkinson J, Worswick L, Rodin DA, Dyer S, MeadeTW. How common are polycystic ovaries in Normal women and what istheir significance for the fertility of the population. Clin Endocrinol. 1992;37(2):127–34.
7. Dewailly D, Gronier H, Poncelet E, Robin G, Leroy M, Pigny P, DuhamelA, Catteau-Jonard S. Diagnosis of polycystic ovary syndrome (PCOS):revisiting the threshold values of follicle count on ultrasound and ofthe serum AMH level for the definition of polycystic ovaries. HumReprod. 2011;26(11):3123–9.
8. Dewailly D, Lujan ME, Carmina E, Cedars MI, Laven J, Norman RJ, Escobar-Morreale HF. Definition and significance of polycystic ovarian morphology: atask force report from the androgen excess and polycystic ovary syndromesociety. Hum Reprod Update. 2014;20(3):334–52.
9. Eilertsen TB, Vanky E, Carlsen SM. Anti-Mullerian hormone in the diagnosisof polycystic ovary syndrome: can morphologic description be replaced?Hum Reprod. 2012;27(8):2494–502.
10. Friedman JH. Greedy function approximation: a gradient boosting machine.Ann Stat. 2001;29(5):1189–232.
11. Khadduri J, Culhane DP, Holin MJ, Buron L, Cortes A, Poulin S. The AnnualHomeless Assessment Report to Congress. 2007.
12. Polson DW, Wadsworth J, Adams J, Franks S. Polycystic ovaries - a commonfinding in Normal women. Lancet. 1988;1(8590):870–2.
13. Schapire RE, Freund Y. Boosting: foundations and algorithms. AdaptComput Mach Le. 2012:1–527.
14. Turney PD, Pantel P. From frequency to meaning: vector space models ofsemantics. J Artif Intell Res. 2010;37:141–88.
15. van Santbrink EJP, Hop WC, Fauser BCJM. Classification ofnormogonadotropic infertility: polycystic ovaries diagnosed by ultrasoundversus endocrine characteristics of polycystic ovary syndrome. Fertil Steril.1997;67(3):452–8.
Publisher’s NoteSpringer Nature remains neutral with regard to jurisdictional claims inpublished maps and institutional affiliations.
Cheng and Mahalingaiah Fertility Research and Practice (2019) 5:13 Page 7 of 7