Embed Size (px)
Citation preview

Data Cleaning Methodology for Monthly Water-to-Oil and Water-to-Gas Production Ratios in Continuous Resource Assessments
By Brian A. Varela, Seth S. Haines, and Nicholas J. Gianoutsos
Open-File Report 2016–1204
U.S. Department of the Interior U.S. Geological Survey

i
U.S. Department of the Interior SALLY JEWELL, Secretary
U.S. Geological Survey Suzette M. Kimball, Director
U.S. Geological Survey, Reston, Virginia: 2017
For more information on the USGS—the Federal source for science about the Earth, its natural and living resources, natural hazards, and the environment—visit http://www.usgs.gov/ or call 1–888–ASK–USGS (1–888–275–8747).
For an overview of USGS information products, including maps, imagery, and publications, visit http://store.usgs.gov/.
Any use of trade, firm, or product names is for descriptive purposes only and does not imply endorsement by the U.S. Government.
Although this information product, for the most part, is in the public domain, it also may contain copyrighted materials as noted in the text. Permission to reproduce copyrighted items must be secured from the copyright owner.
Suggested citation: Varela, B.A., Haines, S.S., and Gianoutsos, N.J., 2017, Data cleaning methodology for monthly water-to-oil and water-to-gas production ratios in continuous resource assessments: U.S. Geological Survey Open-File Report 2016–1204, 11 p., https://doi.org/10.3133/ofr20161204.
ISSN 2331-1258 (online)

ii
Contents Abstract ......................................................................................................................................................... 1 Introduction .................................................................................................................................................... 1 Variations in Data Sources ............................................................................................................................ 2 Difficulties and Challenges of Disordered Data.............................................................................................. 3 Data Cleaning Strategy .................................................................................................................................. 4 Cleaning Algorithm ........................................................................................................................................ 6 Checking Completeness of Water-to-Oil/Gas Calculation ............................................................................. 9 Summary ..................................................................................................................................................... 11 References .................................................................................................................................................. 11
Figures 1. Box plot graph of preprocessed water-to-oil ratios ........................................................................... 5 2. Box plot graph of postprocessed water-to-oil ratios .......................................................................... 8 3. Flow chart showing logic of water-to-oil/gas program ..................................................................... 10

Data Cleaning Methodology for Monthly Water-to-Oil and Water-to-Gas Production Ratios in Continuous Resource Assessments
By Brian A. Varela, Seth S. Haines, and Nicholas J. Gianoutsos
Abstract Petroleum production data are usually stored in a format that makes it easy to determine
the year and month production started, if there are any breaks, and when production ends. However, in some cases, you may want to compare production runs where the start of production for all wells starts at month one regardless of the year the wells started producing. This report describes the JAVA program the U.S. Geological Survey developed to examine water-to-oil and water-to-gas ratios in the form of month 1, month 2, and so on with the objective of estimating quantities of water and proppant used in low-permeability petroleum production. The text covers the data used by the program, the challenges with production data, the program logic for checking the quality of the production data, and the program logic for checking the completeness of the data.
Introduction The U.S. Geological Survey (USGS) Energy Resources Program provides assessments of
technically recoverable petroleum resources in conventional and unconventional accumulations. To build on existing petroleum assessment methodology and complement continuous resource assessments, the USGS has developed a methodology to estimate the quantities of water and proppant required for petroleum production from low-permeability reservoirs typically requiring hydraulic fracturing, and the water volumes associated with petroleum production (Haines, 2015). This methodology examines water-to-oil and water-to-gas production ratios in an effort to better understand patterns of water usage and water production trends. These analyses provide critical information that helps determine flowback-volume recovery ratios and longer-term produced water-to-oil and water-to-gas ratios that are necessary for water and proppant assessments.
The USGS has access to proprietary databases containing information on oil and gas wells, fields, production, and, where available, monthly water production volumes. Because production volume data (oil, gas, and water) are normally recorded manually by field operators, there is always the possibility that this information is incorrect or inconsistent. Therefore, whenever dealing with well-production resources, there is always a need to understand the potential for data inconsistencies and data accuracy problems and to consider the reliability of data produced by third parties. The USGS developed an algorithm (described herein) to compile water-to-oil and water-to-gas data, quality check the said data, address or remove data
2
inconsistencies, and ensure the resultant data are reliable and representative of production ratios in a particular study area.
Documenting and automating the process steps and workflow to compile water-to-oil and water-to-gas production ratios allows assessors and researchers to efficiently process large amounts of data in a consistent manner and eliminate user or introduced errors. Because the process can create water-to-oil and water-to-gas production ratios depending on the type of production from the wells being studied, herein the output is referred to as “water-to-oil/gas.” A robust JAVA computer program (compatible with JAVA versions 6.0 or greater) was developed with scalable features to permit any list or input file in the correct format to be processed and evaluated for water-to-oil/gas information. JAVA 6.0 or greater is available from Oracle, Inc., at http://www.oracle.com/technetwork/java/javase/downloads/index.html. For example, the methodology can accommodate a list of all wells/producing entities in the Williston Basin in North Dakota, or can be extended to evaluate all wells/producing entities in the United States or any other user-derived input criteria. This methodology and corresponding algorithm allows the user to consistently evaluate, compare, and assess multiple basins throughout the country or internationally using a documented process for determining water-to-oil/gas ratios, flowback, treatment totals, and recovery ratios.
The following report examines data sources and common data issues, provides an overview of the data cleaning procedure, and describes the processing algorithm in detail. Graphical examples of the utility of this approach using data from the Bakken Formation of the Williston Basin are also provided. The documented JAVA source code (Varela, 2015) is also publicly available and can be found at https://doi.org/10.5066/F7TD9VG7.
Variations in Data Sources In the United States, oil and gas exploration is regulated and monitored at the State level
by individual State oil and gas commissions. Each State creates its own rules and regulations for the petroleum industry, including reporting requirements involving collection, storing, analysis, and dissemination of oil- and gas-related data. Most States require monthly reporting of oil and gas production data, but there are State variations in reporting requirements for water production. For example, some States, such as North Dakota, require the reporting of produced water on a monthly basis (along with oil and gas data) but other States, including Texas and Louisiana, require water production reporting only as part of annual or biannual production tests. A few States, such as Oklahoma and West Virginia, do not require any water production information.
In addition to diverse reporting requirements, there are differences in the reporting schedules for water production information. For example, some States require operators to report their production to the respective oil and gas commission within months of production, but others require operators to report production within one year. Further, reporting requirements in Texas and Louisiana apply to lease groups containing multiple wells, whereas other States require the reporting of information representing actual production for individual wells.
The primary database utilized by the USGS Energy Resources Program is provided by IHS Energy (Englewood, Colorado), an energy-related information and analysis firm that aggregates domestic and international petroleum information on oil/gas wells, hydrocarbon production, and other related analytics. The database is the Petroleum Information Data Model (PIDM) 2.5 data management system, which is available from IHS Energy, 15 Inverness Way East, Englewood, CO 80112. IHS does not collect data directly from operators, but compiles data

3
from a variety of sources, including State oil and gas commissions, and inspects the data for errors.
In the IHS database, each well has a unique American Petroleum Institute (API) number that is associated with one or more unique entity-identifier number(s) (ENTITY or ENTITIES) created by IHS, each of which corresponds to a specific formation that produces hydrocarbons within that well. A single API number may be tied to multiple ENTITIES because a single well can produce from multiple formations. IHS differentiates data based on well and production classifications. Well data include the characteristics of the well, including the physical location of the wellbore, formation tops, and so on, whereas production data include the monthly reported fluid production. In Texas and Louisiana, production is reported by lease rather than by individual well and each lease may include multiple wells, complicating granular analysis of water production usage. As a result, the double counting of produced volumes may be a potential pitfall that should be avoided. Data from Texas and Louisiana include production data from all wells in a particular lease (referred to as “unallocated”), with values proportionally distributed among the wells on that lease (referred to as “allocated”) using well tests from each well and estimated fluid production for each well.
Difficulties and Challenges of Disordered Data A key task associated with water and proppant assessments is to calculate water-to-
oil/gas ratios used in a particular well to establish a baseline for quantifying produced water as described by Haines (2015). This baseline is calculated by analyzing long-term trends in water-to-oil/gas ratios. Any monthly reported cumulative water production during the early months of production exceeding this baseline is considered flowback. The recovery ratio is calculated by dividing the amount of flowback by the volume of all treatment fluids.
To calculate flowback ratios, three key pieces of production and completion information are required: (1) volumes for monthly water, monthly oil, and (or) monthly gas production; (2) the dates associated with production; and (3) the treatment fluid volume totals that are keyed to the API number. Calculating water-to-oil/gas ratios and flowback for a single well can be challenging, especially in areas where hydrocarbons are produced from numerous formations and it is difficult to determine which production or completion treatment is associated with a specific formation or producing horizon. Flowback ratios require oil and (or) gas and water production values for at least the first 12 months for each well in the analysis. To calculate flowback ratios, a monthly produced-waters baseline is calculated using the water-to-oil/gas ratios for months 6 through 12, or another specified timeframe. After a produced-waters baseline is established, it is then used to compare production volumes for earlier months. Monthly water production exceeding the produced waters baseline is considered flowback. The amount of fluid in the flowback is divided by the total treatment amount composed of hydraulic fracturing and acid treatments, to determine the flowback ratio for each well.
A potential critical oil, gas, and water production data-quality issue is the accuracy and reliability of reported values. Data collected by field operators are reported to the State and then routed through multiple agencies and organizations that compile State, regional, or national oil and gas databases. As the number of transactions and amount of data handling increase, the risks of introducing errors, misreporting and transposing numbers and units, or misinterpreting production values represented in final databases also increase. Although it is nearly impossible to verify each number within the databases, we created an algorithm to examine, analyze, validate (where possible), and (or) remove suspect data. The algorithm looks at all the data for a single
4
well and produces a range of numbers that are “normal” for that well before removing any data points that fall outside that “normal” range.
In situations where a single well produces from many formations and production is reported as a single summed value (commingled production), determining which formation was subject to a listed hydraulic fracturing treatment can be difficult without additional information. Production data evaluations in areas such as the Bakken Formation of the Williston Basin are straightforward because each well corresponds with a single production entity and does not contain commingled production. Conversely, in the Eagle Ford Formation in southwest Texas, double counting of produced volumes can occur when calculating production totals because of reporting methods. The IHS database for Texas and Louisiana allocates production volumes to full lease groups rather than individual wells, and provides information on the number of wells on the lease and production tests for all wells on the lease.
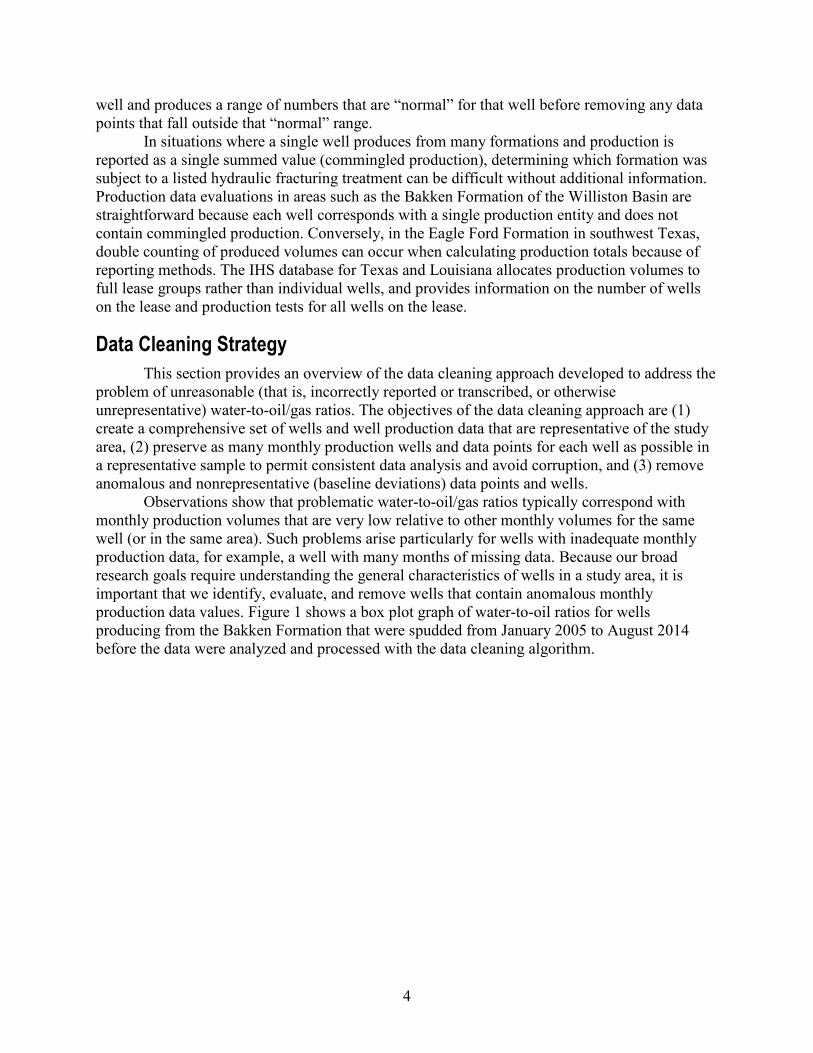
Data Cleaning Strategy This section provides an overview of the data cleaning approach developed to address the
problem of unreasonable (that is, incorrectly reported or transcribed, or otherwise unrepresentative) water-to-oil/gas ratios. The objectives of the data cleaning approach are (1) create a comprehensive set of wells and well production data that are representative of the study area, (2) preserve as many monthly production wells and data points for each well as possible in a representative sample to permit consistent data analysis and avoid corruption, and (3) remove anomalous and nonrepresentative (baseline deviations) data points and wells.
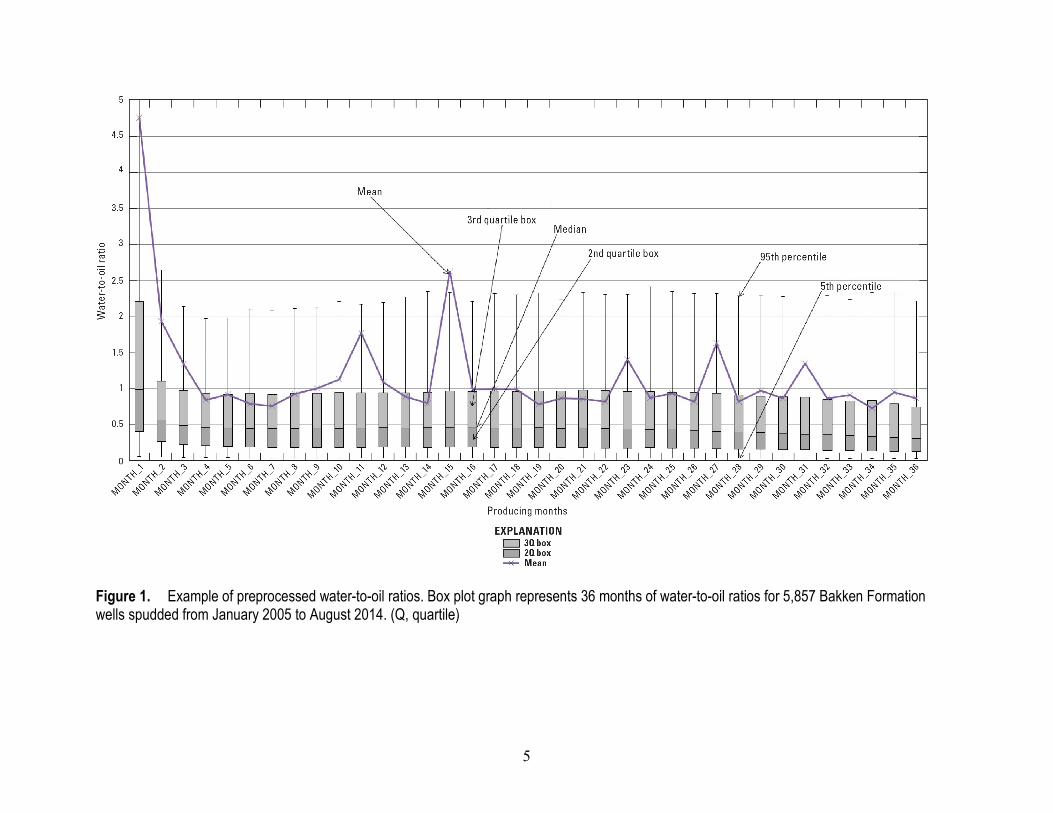
Observations show that problematic water-to-oil/gas ratios typically correspond with monthly production volumes that are very low relative to other monthly volumes for the same well (or in the same area). Such problems arise particularly for wells with inadequate monthly production data, for example, a well with many months of missing data. Because our broad research goals require understanding the general characteristics of wells in a study area, it is important that we identify, evaluate, and remove wells that contain anomalous monthly production data values. Figure 1 shows a box plot graph of water-to-oil ratios for wells producing from the Bakken Formation that were spudded from January 2005 to August 2014 before the data were analyzed and processed with the data cleaning algorithm.
5
Figure 1. Example of preprocessed water-to-oil ratios. Box plot graph represents 36 months of water-to-oil ratios for 5,857 Bakken Formation wells spudded from January 2005 to August 2014. (Q, quartile)
6
The first of the two main steps in the data cleaning process aims to identify and remove individual reported monthly production values that are considerably smaller than the majority of values for the same well. The algorithm that is used is described in detail in the Cleaning Algorithm section of this report. Some of these values may be misreported and others may be correctly reported values for months when production operations were occurring in a nonstandard manner. For the purposes of this study, this distinction is less important than the fact that these values are not representative of the well’s overall behavior. For each fluid of interest, water and either oil or gas, the median value of all reported monthly production quantities for each well was calculated. We then searched for and eliminated individual values among the monthly data that fall below a user-specified threshold value that is represented as a percentage of the median value. For example, if the median monthly water production for a particular well is 100 barrels, a user-specified threshold of 5 percent would mean that all monthly water production values for that well that are less than 5 barrels will be removed. For each well evaluated within the study area, this approach is applied to the monthly water production data and either gas or oil production data, depending on the primary hydrocarbon of interest.
The second step in the data cleaning process is to identify entire wells for which a large proportion of the monthly production data are absent and remove them from the data. As with the problems discussed in the previous paragraph, the distinction between reporting problems and correct reporting of anomalous behavior is less important than the fact that these wells are unrepresentative of the region as a whole. Any well for which the number of missing months of data exceeds a user-specified limit is discarded. This analysis is performed for water data and for either oil or gas data, whichever is the primary hydrocarbon of interest. Any well that fails the data completeness criterion is removed from the well group. The user may specify the rejection criterion either as a percentage of the total span of data (such as removing all wells that are missing greater than 30 percent of complete monthly data within the span of reporting) or as a total number of months (for example by removing all wells that are missing more than 4 months of data out of the first 12 months). This data completeness check is deliberately performed after the first data-cleaning step in order to simultaneously identify and remove wells that show an excessive number of months with low reported monthly production and (or) excessive months without data.
Cleaning Algorithm Figure 2 shows the same wells from figure 1 after the data were processed through the
cleaning algorithm. The cleaning algorithm is an extension of a water-to-oil or water-to-gas data compilation program that uses the output from the water-to-oil or water-to-gas program as its input. The first step in the algorithm is to establish a user-generated list of wells with one API and ENTITY for each record as a comma separated value (.CSV) file format. The CSV file is used to compile and run the JAVA program “WaterOil.java.” When the program is initialized, the JAVA program will solicit user input for the name of the CSV file, the length of time the production data represents (to a maximum of 30 years), and the value used to calculate the threshold volume specified as the percentage below the median value to be considered invalid. The threshold amount is calculated by multiplying the median by the user-specified percentage. The program creates the following output files containing the resulting information:

7
• one file for the original values in the form of water_month1/oil_month1, water_month2/oil_month2, and so on;
• one file for the original values of water/gas, if available; • one file for the calculated values for water_month1/oil_month1,
water_month2/oil_month2, and so on; • one file for the calculated values of water/gas, if available; • one file for the water values only in the form of water_month1, water_month2, and so on; • one file for the oil values only in the form of oil_month1, oil_month2, and so on; and • one file for the gas values only, if available.

8
Figure 2. Example of postprocessed water-to-oil ratios. Box plot graph represents 36 months of water-to-oil ratios for 5,857 Bakken Formation wells spudded from January 2005 to August 2014. (Q, quartile)
9
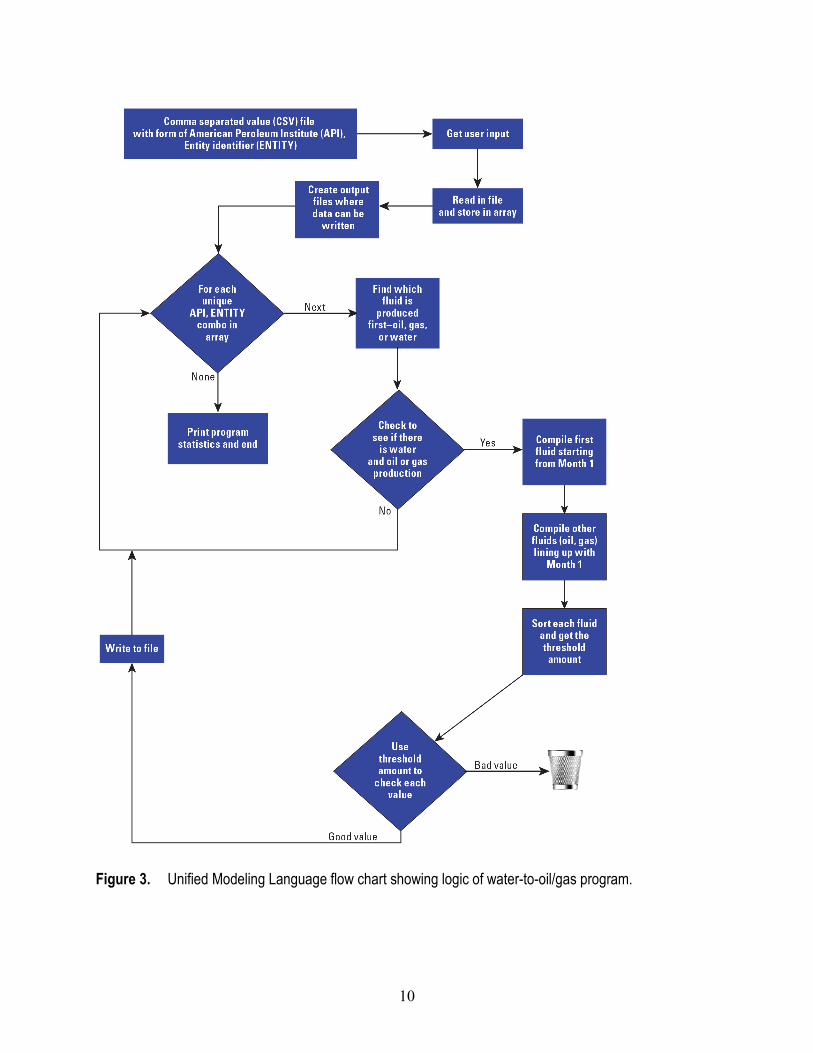
After the files are created, the program then reprocesses all unique API/ENTITY records. For each record, the program determines which fluid is reported first and which records contain water, oil, or gas and then designates the first reported fluid as month1. The program then checks to make sure the record contains produced water. If the record does not contain any produced water, the record is discarded. If the record does contain produced-water data, the program stores the values for all produced fluids in the form of month1, month2, and so on.
Once the data are stored, the program evaluates the monthly production values during the user-specified timeframe for each fluid and calculates the threshold amount by first calculating the median and then multiplying it by the user-specified percentage. For example, if the median value for a particular API/ENTITY record of oil is 150 barrels and the user entered 0.05 for 5 percent, the threshold value is 7.5 barrels (150 x 0.05 = 7.5). As a result, any months with less than or equal to 7 barrels (the PIDM database only contains whole numbers in reported production) for this particular record are not written to the output file. The program does not discard the month, but it does not write values less than or equal to the threshold amount to the file. After all fluid threshold values for a given record have been calculated, the program writes the values above the threshold amount to the files and repeats the steps for all unique API/ENTITY records until the list is exhausted. Once the program has run the process on all unique API/ENTITY records, it closes the files and displays the following on the screen: statistics on the total number of API and ENTITIES in the original file, the number of API or ENTITIES with duplicates, the amount of time the program ran, and the total number of API/ENTITY records that were written to the output file.
Checking Completeness of Water-to-Oil/Gas Calculation Before running the program used to check the completeness of water-to-oil/gas
calculations, the “WaterOil.java” program needs to be executed because the “Clean.java” program relies on the output from the “WaterOil.java” program. Once the user has the calculated water-to-oil/gas file, the user can initiate the JAVA program “Clean.java.” The first step is to solicit input from the user for the name of the input file and the acceptable number of months that can be missing from the total producing months, which can be entered either as a whole number of months or as a percentage of the total producing months. The user is also asked for the number of producing months that can be missing from the first 12 months as either a whole number or as a percentage. After receiving the user input, the program will load the wells and calculate water-to-oil/gas data in the format of month1, month2, and so on.
Once the program receives user input and the calculated water-to-oil/gas records, it will compare each record from the original calculated water-to-oil/gas data to determine if the user requirements are met. Then, for each record that meets the requirements, the record values are written to a new file. If a record does not meet the requirements, it is removed and the program proceeds to the next record. Because the cleaning program uses the water-to-oil or water-to-gas output from the water-to-oil and (or) water-to-gas program, the user needs to run the water-to-oil/gas algorithm first and then use the output to run the cleaning algorithm. Figure 3 provides a flow chart of the water-to-oil/gas data cleaning program.
10
Figure 3. Unified Modeling Language flow chart showing logic of water-to-oil/gas program.

11
Summary The U.S. Geological Survey developed a Java programming algorithm to augment and
expand its energy oil and gas assessment work and to help understand the interplay between petroleum production and water usage. The algorithm described in this report provides an automated approach for scanning and analyzing month-by-month water and petroleum production data. The purpose of the algorithm is to create water-to-oil/gas ratios for a given timeframe, as well as identify and eliminate individual records of production values or entire wells that are not generally representative of a given group of wells selected from large datasets or a geographic area. In addition, the data-cleaning portion of the algorithm allows for specific processing, handling, and printing of well data that meet user-specified time conditions. The algorithm allows the user to analyze large volumes of data in a documented, consistent, and efficient manner to examine and understand the short- and long-term trends of water usage within a basin.
References Haines, S.S., 2015, Methodology for assessing quantities of water and proppant injection, and
water production associated with development of continuous petroleum accumulations: U.S. Geological Survey Open-File Report 2015–1117, 18 p., accessed April 20, 2015, at https://doi.org/10.3133/ofr20151117.
Varela, B.A., 2015, Data cleaning methodology source code—Creating water-to-oil and water-to-gas ratios in sequence from start of production using the IHS PIDM database: U.S. Geological Survey data release, https://doi.org/10.5066/F7TD9VG7.
ISSN 2331-1258 (online) https://doi.org/10.3133/ofr20161204