Embed Size (px)
Citation preview
183World Trade OrganizationInternational Trade Statistics 2011
Download the data:www.wto.org/statistics
The data for this report comes from a variety of sources. How it is compiled and presented is explained in this chapter.
Composition, definitions & methodology
1. Composition of geographical and economic groupings 184
2. Definitions and methodology 188
3. Specific notes for selected economies 195
4. Statistical sources 198
184 World Trade OrganizationInternational Trade Statistics 2011
Download the data:www.wto.org/statistics
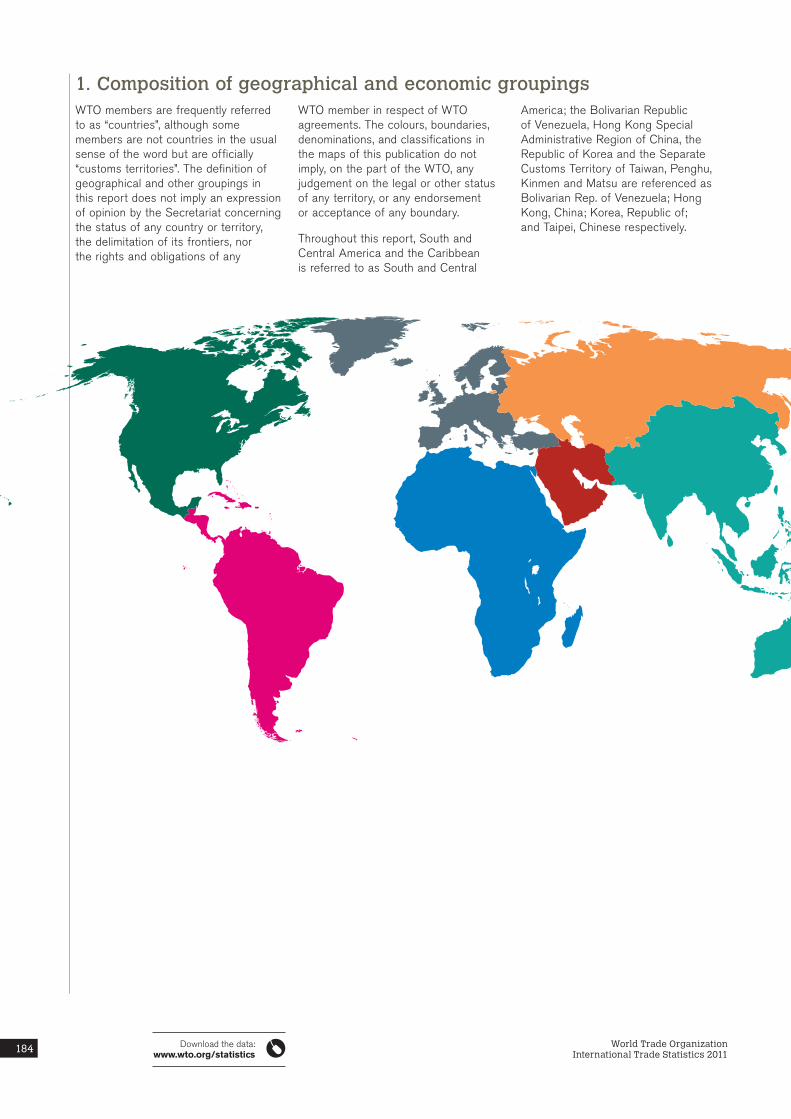
WTO members are frequently referred to as “countries”, although some members are not countries in the usual sense of the word but are officially “customs territories”. The definition of geographical and other groupings in this report does not imply an expression of opinion by the Secretariat concerning the status of any country or territory, the delimitation of its frontiers, nor the rights and obligations of any
WTO member in respect of WTO agreements. The colours, boundaries, denominations, and classifications in the maps of this publication do not imply, on the part of the WTO, any judgement on the legal or other status of any territory, or any endorsement or acceptance of any boundary.
Throughout this report, South and Central America and the Caribbean is referred to as South and Central
America; the Bolivarian Republic of Venezuela, Hong Kong Special Administrative Region of China, the Republic of Korea and the Separate Customs Territory of Taiwan, Penghu, Kinmen and Matsu are referenced as Bolivarian Rep. of Venezuela; Hong Kong, China; Korea, Republic of; and Taipei, Chinese respectively.
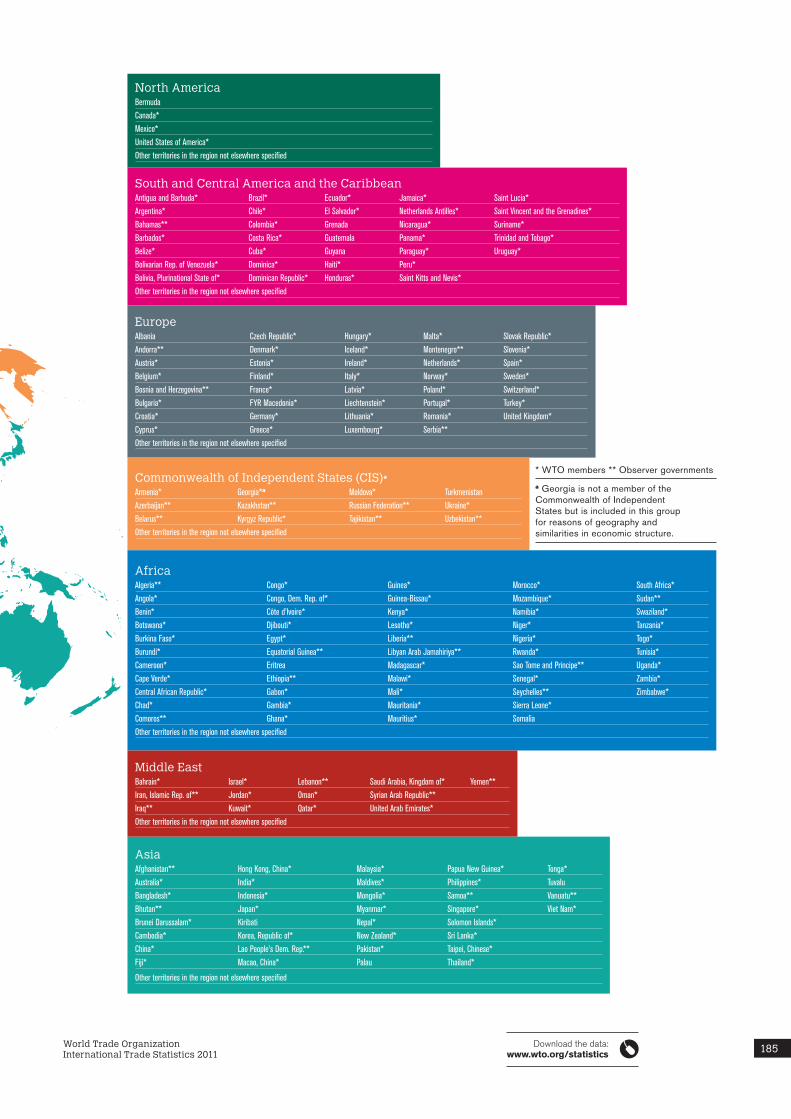
1. Composition of geographical and economic groupings
185World Trade OrganizationInternational Trade Statistics 2011
Download the data:www.wto.org/statistics
Asia Afghanistan** Hong Kong, China* Malaysia* Papua New Guinea* Tonga* Australia* India* Maldives* Philippines* Tuvalu Bangladesh* Indonesia* Mongolia* Samoa** Vanuatu**Bhutan** Japan* Myanmar* Singapore* Viet Nam* Brunei Darussalam* Kiribati Nepal* Solomon Islands* Cambodia* Korea, Republic of* New Zealand* Sri Lanka* China* Lao People’s Dem. Rep.** Pakistan* Taipei, Chinese* Fiji* Macao, China* Palau Thailand*
Other territories in the region not elsewhere specified
North America Bermuda Canada* Mexico* United States of America* Other territories in the region not elsewhere specified
South and Central America and the Caribbean Antigua and Barbuda* Brazil* Ecuador* Jamaica* Saint Lucia*Argentina* Chile* El Salvador* Netherlands Antilles* Saint Vincent and the Grenadines* Bahamas** Colombia* Grenada Nicaragua* Suriname*Barbados* Costa Rica* Guatemala Panama* Trinidad and Tobago* Belize* Cuba* Guyana Paraguay* Uruguay*Bolivarian Rep. of Venezuela* Dominica* Haiti* Peru* Bolivia, Plurinational State of* Dominican Republic* Honduras* Saint Kitts and Nevis* Other territories in the region not elsewhere specified
Europe Albania Czech Republic* Hungary* Malta* Slovak Republic*Andorra** Denmark* Iceland* Montenegro** Slovenia*Austria* Estonia* Ireland* Netherlands* Spain*Belgium* Finland* Italy* Norway* Sweden*Bosnia and Herzegovina** France* Latvia* Poland* Switzerland*Bulgaria* FYR Macedonia* Liechtenstein* Portugal* Turkey*Croatia* Germany* Lithuania* Romania* United Kingdom*Cyprus* Greece* Luxembourg* Serbia** Other territories in the region not elsewhere specified
Commonwealth of Independent States (CIS)a Armenia* Georgia*a Moldova* Turkmenistan Azerbaijan** Kazakhstan** Russian Federation** Ukraine* Belarus** Kyrgyz Republic* Tajikistan** Uzbekistan** Other territories in the region not elsewhere specified
Africa Algeria** Congo* Guinea* Morocco* South Africa* Angola* Congo, Dem. Rep. of* Guinea-Bissau* Mozambique* Sudan**Benin* Côte d’Ivoire* Kenya* Namibia* Swaziland*Botswana* Djibouti* Lesotho* Niger* Tanzania*Burkina Faso* Egypt* Liberia** Nigeria* Togo*Burundi* Equatorial Guinea** Libyan Arab Jamahiriya** Rwanda* Tunisia*Cameroon* Eritrea Madagascar* Sao Tome and Principe** Uganda* Cape Verde* Ethiopia** Malawi* Senegal* Zambia*Central African Republic* Gabon* Mali* Seychelles** Zimbabwe*Chad* Gambia* Mauritania* Sierra Leone* Comoros** Ghana* Mauritius* Somalia Other territories in the region not elsewhere specified
Middle East Bahrain* Israel* Lebanon** Saudi Arabia, Kingdom of* Yemen**Iran, Islamic Rep. of** Jordan* Oman* Syrian Arab Republic** Iraq** Kuwait* Qatar* United Arab Emirates* Other territories in the region not elsewhere specified
* WTO members ** Observer governments
a Georgia is not a member of the Commonwealth of Independent States but is included in this group for reasons of geography and similarities in economic structure.
186 World Trade OrganizationInternational Trade Statistics 2011
Download the data:www.wto.org/statistics
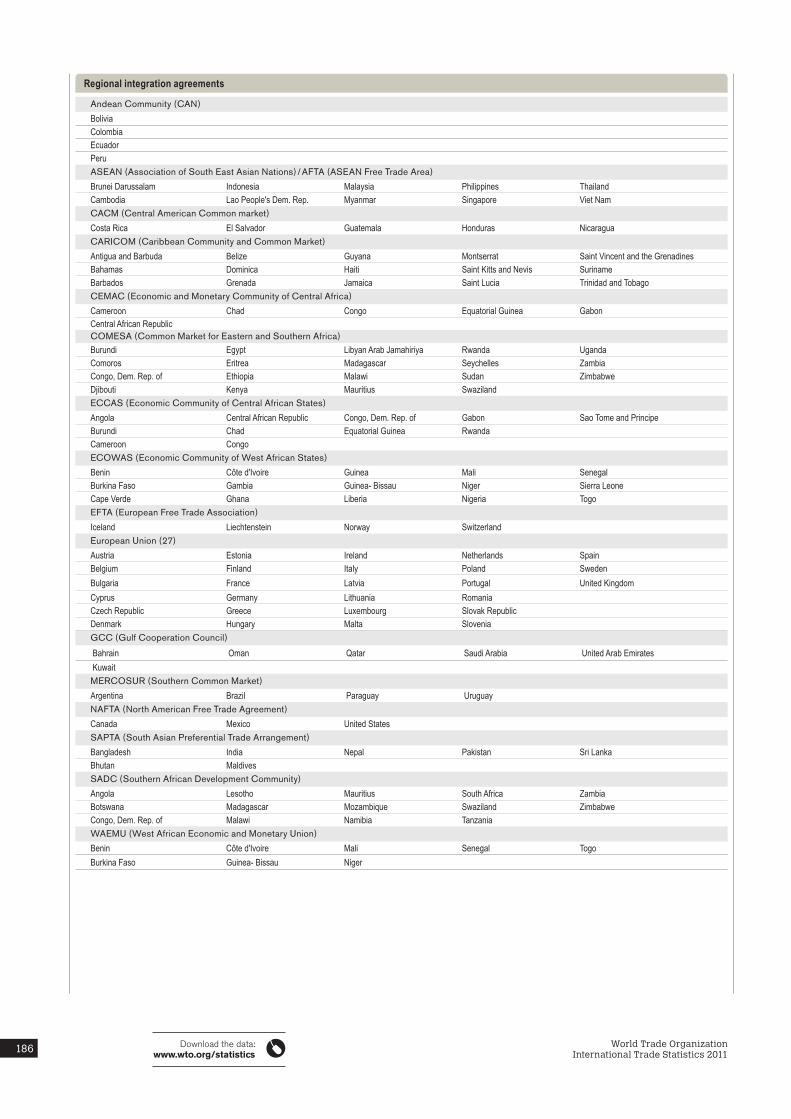
Andean Community (CAN)
BoliviaColombiaEcuadorPeruASEAN (Association of South East Asian Nations) / AFTA (ASEAN Free Trade Area)
Brunei Darussalam Indonesia Malaysia Philippines ThailandCambodia Lao People's Dem. Rep. Myanmar Singapore Viet NamCACM (Central American Common market)
Costa Rica El Salvador Guatemala Honduras NicaraguaCARICOM (Caribbean Community and Common Market)
Antigua and Barbuda Belize Guyana Montserrat Saint Vincent and the GrenadinesBahamas Dominica Haiti Saint Kitts and Nevis SurinameBarbados Grenada Jamaica Saint Lucia Trinidad and TobagoCEMAC (Economic and Monetary Community of Central Africa)
Cameroon Chad Congo Equatorial Guinea GabonCentral African RepublicCOMESA (Common Market for Eastern and Southern Africa)Burundi Egypt Libyan Arab Jamahiriya Rwanda UgandaComoros Eritrea Madagascar Seychelles ZambiaCongo, Dem. Rep. of Ethiopia Malawi Sudan ZimbabweDjibouti Kenya Mauritius SwazilandECCAS (Economic Community of Central African States)
Angola Central African Republic Congo, Dem. Rep. of Gabon Sao Tome and PrincipeBurundi Chad Equatorial Guinea RwandaCameroon CongoECOWAS (Economic Community of West African States)
Benin Côte d'Ivoire Guinea Mali SenegalBurkina Faso Gambia Guinea- Bissau Niger Sierra LeoneCape Verde Ghana Liberia Nigeria TogoEFTA (European Free Trade Association)
Iceland Liechtenstein Norway SwitzerlandEuropean Union (27)
Austria Estonia Ireland Netherlands SpainBelgium Finland Italy Poland SwedenBulgaria France Latvia Portugal United KingdomCyprus Germany Lithuania RomaniaCzech Republic Greece Luxembourg Slovak RepublicDenmark Hungary Malta SloveniaGCC (Gulf Cooperation Council)
Bahrain Oman Qatar Saudi Arabia United Arab Emirates Kuwait MERCOSUR (Southern Common Market)
Argentina Brazil Paraguay Uruguay NAFTA (North American Free Trade Agreement)
Canada Mexico United States SAPTA (South Asian Preferential Trade Arrangement)
Bangladesh India Nepal Pakistan Sri LankaBhutan MaldivesSADC (Southern African Development Community)
Angola Lesotho Mauritius South Africa ZambiaBotswana Madagascar Mozambique Swaziland ZimbabweCongo, Dem. Rep. of Malawi Namibia TanzaniaWAEMU (West African Economic and Monetary Union)
Benin Côte d'Ivoire Mali Senegal TogoBurkina Faso Guinea- Bissau Niger
Regional integration agreements
187World Trade OrganizationInternational Trade Statistics 2011
Download the data:www.wto.org/statistics
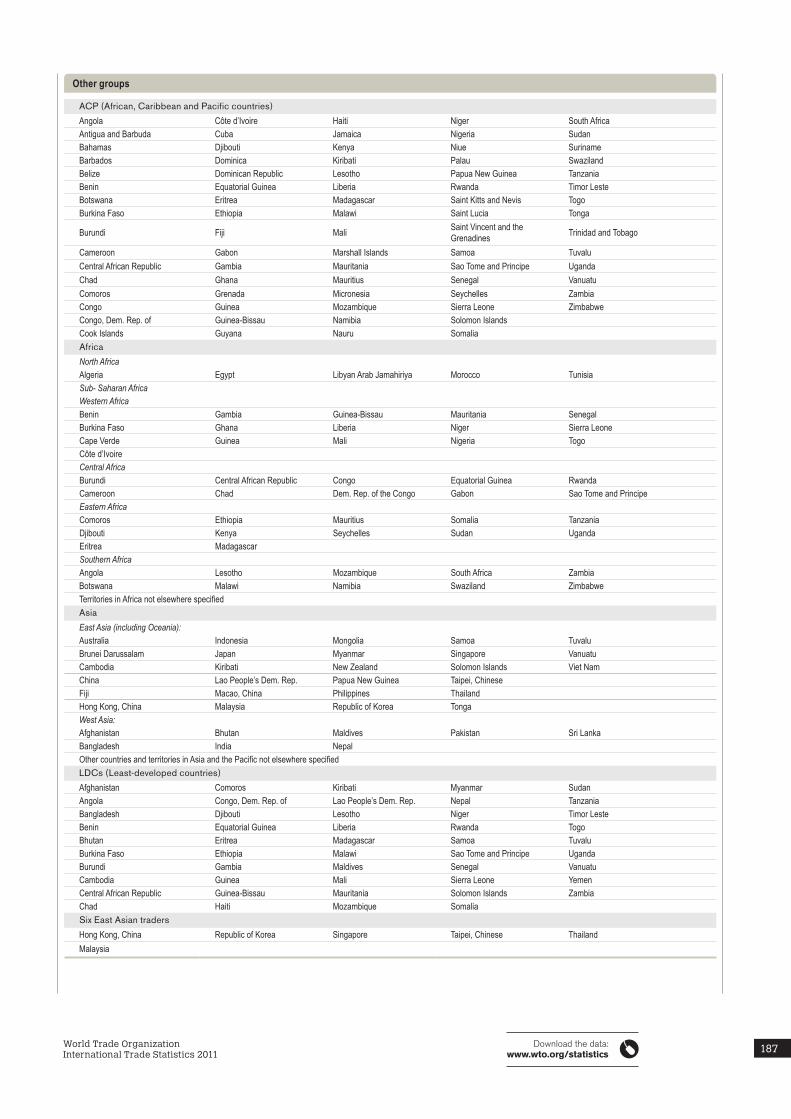
ACP (African, Caribbean and Pacific countries)
Angola Côte d’Ivoire Haiti Niger South AfricaAntigua and Barbuda Cuba Jamaica Nigeria SudanBahamas Djibouti Kenya Niue SurinameBarbados Dominica Kiribati Palau SwazilandBelize Dominican Republic Lesotho Papua New Guinea TanzaniaBenin Equatorial Guinea Liberia Rwanda Timor LesteBotswana Eritrea Madagascar Saint Kitts and Nevis TogoBurkina Faso Ethiopia Malawi Saint Lucia Tonga
Burundi Fiji Mali Saint Vincent and the Grenadines Trinidad and Tobago
Cameroon Gabon Marshall Islands Samoa TuvaluCentral African Republic Gambia Mauritania Sao Tome and Principe UgandaChad Ghana Mauritius Senegal VanuatuComoros Grenada Micronesia Seychelles ZambiaCongo Guinea Mozambique Sierra Leone ZimbabweCongo, Dem. Rep. of Guinea-Bissau Namibia Solomon IslandsCook Islands Guyana Nauru SomaliaAfrica
North AfricaAlgeria Egypt Libyan Arab Jamahiriya Morocco TunisiaSub- Saharan Africa Western AfricaBenin Gambia Guinea-Bissau Mauritania SenegalBurkina Faso Ghana Liberia Niger Sierra LeoneCape Verde Guinea Mali Nigeria TogoCôte d’IvoireCentral AfricaBurundi Central African Republic Congo Equatorial Guinea RwandaCameroon Chad Dem. Rep. of the Congo Gabon Sao Tome and PrincipeEastern AfricaComoros Ethiopia Mauritius Somalia TanzaniaDjibouti Kenya Seychelles Sudan UgandaEritrea MadagascarSouthern AfricaAngola Lesotho Mozambique South Africa ZambiaBotswana Malawi Namibia Swaziland ZimbabweTerritories in Africa not elsewhere specifiedAsia
East Asia (including Oceania): Australia Indonesia Mongolia Samoa TuvaluBrunei Darussalam Japan Myanmar Singapore VanuatuCambodia Kiribati New Zealand Solomon Islands Viet NamChina Lao People’s Dem. Rep. Papua New Guinea Taipei, ChineseFiji Macao, China Philippines ThailandHong Kong, China Malaysia Republic of Korea TongaWest Asia: Afghanistan Bhutan Maldives Pakistan Sri LankaBangladesh India NepalOther countries and territories in Asia and the Pacific not elsewhere specifiedLDCs (Least-developed countries)
Afghanistan Comoros Kiribati Myanmar SudanAngola Congo, Dem. Rep. of Lao People’s Dem. Rep. Nepal TanzaniaBangladesh Djibouti Lesotho Niger Timor LesteBenin Equatorial Guinea Liberia Rwanda TogoBhutan Eritrea Madagascar Samoa TuvaluBurkina Faso Ethiopia Malawi Sao Tome and Principe UgandaBurundi Gambia Maldives Senegal VanuatuCambodia Guinea Mali Sierra Leone YemenCentral African Republic Guinea-Bissau Mauritania Solomon Islands Zambia Chad Haiti Mozambique Somalia Six East Asian traders
Hong Kong, China Republic of Korea Singapore Taipei, Chinese Thailand Malaysia
Other groups
188 World Trade OrganizationInternational Trade Statistics 2011
Download the data:www.wto.org/statistics
2.1 Merchandise trade
2.1.1 Exports and imports Two systems of recording merchandise exports and imports are in common use. They are referred to as general trade and special trade and differ mainly in the way warehoused and re-exported goods are treated. General trade figures are larger than the corresponding special trade figures because the latter exclude certain trade flows, such as goods shipped through bonded warehouses.
To the extent possible, total merchandise trade is defined in this report according to the general trade definition. It covers all types of inward and outward movement of goods through a country or territory including movements through customs warehouses and free zones. Goods include all merchandise that either add to or subtract from the stock of material resources of a country or territory by entering (imports) or leaving (exports) the country’s economic territory. For further explanations, see United Nations International Trade
Statistics, Concepts and Definitions, Series M, N° 52, Revision 2.
Unless otherwise indicated, exports are valued at transaction value, including the cost of transportation and insurance to bring the merchandise to the frontier of the exporting country or territory (“free on board” valuation). Imports are valued at transaction value plus the cost of transportation and insurance to the frontier of the importing country or territory (“cost, insurance and freight” valuation).
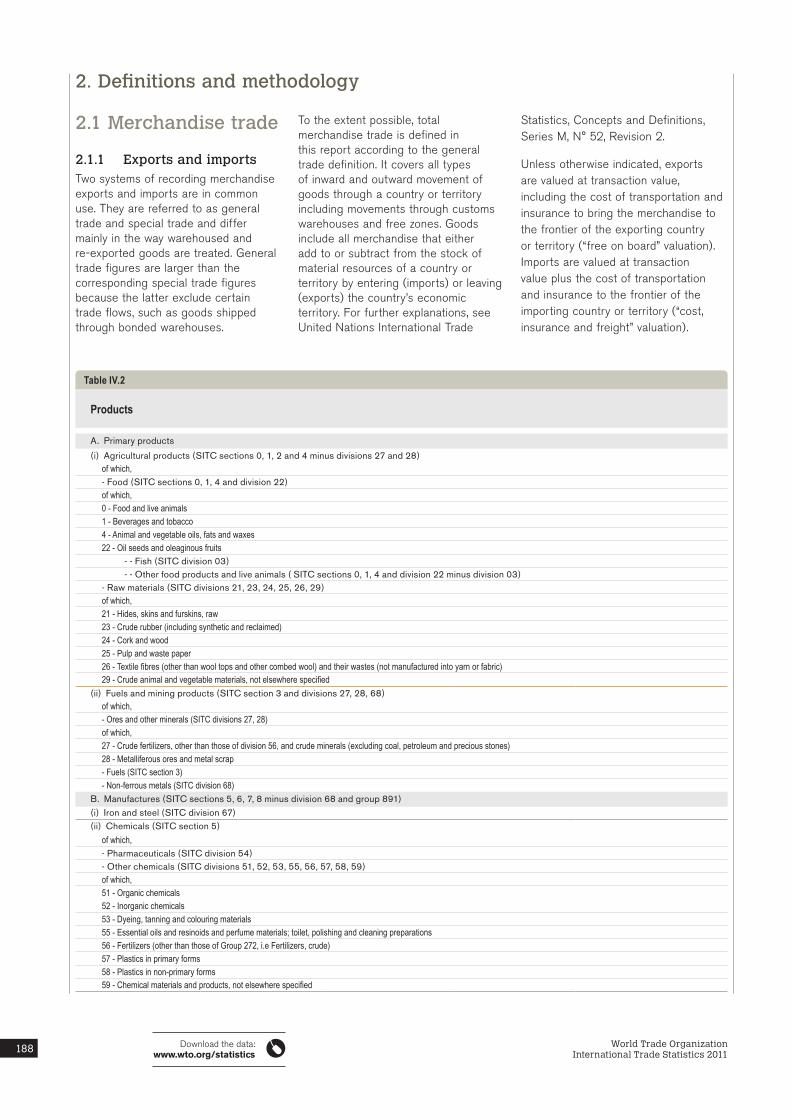
Products
A. Primary products
(i) Agricultural products (SITC sections 0, 1, 2 and 4 minus divisions 27 and 28)of which, - Food (SITC sections 0, 1, 4 and division 22)of which, 0 - Food and live animals1 - Beverages and tobacco4 - Animal and vegetable oils, fats and waxes22 - Oil seeds and oleaginous fruits
- - Fish (SITC division 03)- - Other food products and live animals ( SITC sections 0, 1, 4 and division 22 minus division 03)
- Raw materials (SITC divisions 21, 23, 24, 25, 26, 29)of which, 21 - Hides, skins and furskins, raw23 - Crude rubber (including synthetic and reclaimed)24 - Cork and wood25 - Pulp and waste paper26 - Textile fibres (other than wool tops and other combed wool) and their wastes (not manufactured into yarn or fabric)29 - Crude animal and vegetable materials, not elsewhere specified
(ii) Fuels and mining products (SITC section 3 and divisions 27, 28, 68)of which, - Ores and other minerals (SITC divisions 27, 28)of which, 27 - Crude fertilizers, other than those of division 56, and crude minerals (excluding coal, petroleum and precious stones)28 - Metalliferous ores and metal scrap- Fuels (SITC section 3)- Non-ferrous metals (SITC division 68)
B. Manufactures (SITC sections 5, 6, 7, 8 minus division 68 and group 891)(i) Iron and steel (SITC division 67)(ii) Chemicals (SITC section 5)
of which, - Pharmaceuticals (SITC division 54)- Other chemicals (SITC divisions 51, 52, 53, 55, 56, 57, 58, 59)of which, 51 - Organic chemicals52 - Inorganic chemicals53 - Dyeing, tanning and colouring materials55 - Essential oils and resinoids and perfume materials; toilet, polishing and cleaning preparations 56 - Fertilizers (other than those of Group 272, i.e Fertilizers, crude)57 - Plastics in primary forms58 - Plastics in non-primary forms59 - Chemical materials and products, not elsewhere specified
Table IV.2
2. Definitions and methodology
189World Trade OrganizationInternational Trade Statistics 2011
Download the data:www.wto.org/statistics
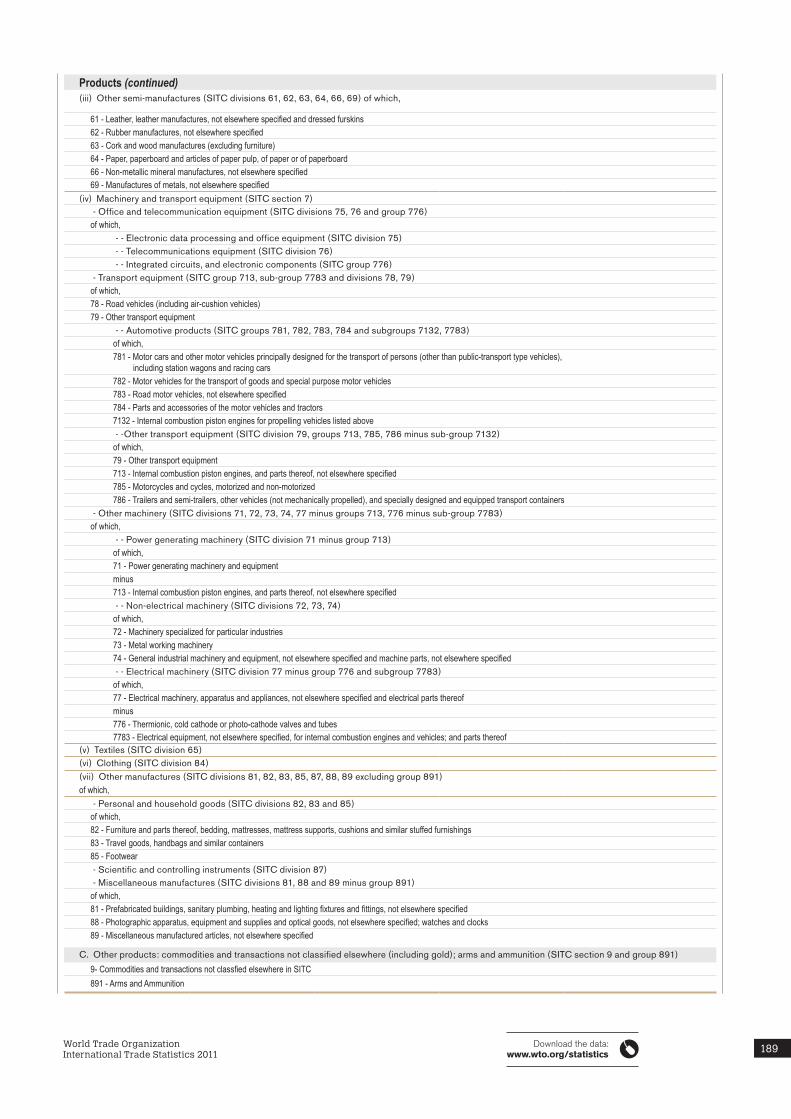
Products (continued) (iii) Other semi-manufactures (SITC divisions 61, 62, 63, 64, 66, 69) of which,
61 - Leather, leather manufactures, not elsewhere specified and dressed furskins62 - Rubber manufactures, not elsewhere specified63 - Cork and wood manufactures (excluding furniture)64 - Paper, paperboard and articles of paper pulp, of paper or of paperboard66 - Non-metallic mineral manufactures, not elsewhere specified69 - Manufactures of metals, not elsewhere specified
(iv) Machinery and transport equipment (SITC section 7) - Office and telecommunication equipment (SITC divisions 75, 76 and group 776)of which,
- - Electronic data processing and office equipment (SITC division 75) - - Telecommunications equipment (SITC division 76) - - Integrated circuits, and electronic components (SITC group 776)
- Transport equipment (SITC group 713, sub-group 7783 and divisions 78, 79)of which, 78 - Road vehicles (including air-cushion vehicles)79 - Other transport equipment
- - Automotive products (SITC groups 781, 782, 783, 784 and subgroups 7132, 7783)of which, 781 - Motor cars and other motor vehicles principally designed for the transport of persons (other than public-transport type vehicles), including station wagons and racing cars782 - Motor vehicles for the transport of goods and special purpose motor vehicles783 - Road motor vehicles, not elsewhere specified784 - Parts and accessories of the motor vehicles and tractors7132 - Internal combustion piston engines for propelling vehicles listed above - -Other transport equipment (SITC division 79, groups 713, 785, 786 minus sub-group 7132)of which, 79 - Other transport equipment713 - Internal combustion piston engines, and parts thereof, not elsewhere specified785 - Motorcycles and cycles, motorized and non-motorized786 - Trailers and semi-trailers, other vehicles (not mechanically propelled), and specially designed and equipped transport containers
- Other machinery (SITC divisions 71, 72, 73, 74, 77 minus groups 713, 776 minus sub-group 7783)of which,
- - Power generating machinery (SITC division 71 minus group 713)of which, 71 - Power generating machinery and equipmentminus713 - Internal combustion piston engines, and parts thereof, not elsewhere specified - - Non-electrical machinery (SITC divisions 72, 73, 74)of which, 72 - Machinery specialized for particular industries73 - Metal working machinery74 - General industrial machinery and equipment, not elsewhere specified and machine parts, not elsewhere specified - - Electrical machinery (SITC division 77 minus group 776 and subgroup 7783)of which, 77 - Electrical machinery, apparatus and appliances, not elsewhere specified and electrical parts thereofminus776 - Thermionic, cold cathode or photo-cathode valves and tubes7783 - Electrical equipment, not elsewhere specified, for internal combustion engines and vehicles; and parts thereof
(v) Textiles (SITC division 65)(vi) Clothing (SITC division 84)(vii) Other manufactures (SITC divisions 81, 82, 83, 85, 87, 88, 89 excluding group 891)of which,
- Personal and household goods (SITC divisions 82, 83 and 85)of which, 82 - Furniture and parts thereof, bedding, mattresses, mattress supports, cushions and similar stuffed furnishings83 - Travel goods, handbags and similar containers85 - Footwear - Scientific and controlling instruments (SITC division 87) - Miscellaneous manufactures (SITC divisions 81, 88 and 89 minus group 891)of which, 81 - Prefabricated buildings, sanitary plumbing, heating and lighting fixtures and fittings, not elsewhere specified88 - Photographic apparatus, equipment and supplies and optical goods, not elsewhere specified; watches and clocks89 - Miscellaneous manufactured articles, not elsewhere specified
C. Other products: commodities and transactions not classified elsewhere (including gold); arms and ammunition (SITC section 9 and group 891)
9- Commodities and transactions not classfied elsewhere in SITC 891 - Arms and Ammunition
190 World Trade OrganizationInternational Trade Statistics 2011
Download the data:www.wto.org/statistics
2.1.2 Products All product groups are defined according to Revision 3 of the Standard International Trade Classification (SITC). Throughout this report, other food products and live animals; beverages and tobacco; animal and vegetable oils, fats and waxes; oilseeds and oleaginous fruit are referred to as other food products; electronic data processing and office equipment is referred to as EDP and office equipment; and integrated circuits and electronic components is referred to as integrated circuits.
2.1.3 World trade networkThe world merchandise trade network by region and product from which Appendix tables A2 and A10 are derived is based on export data. The network is constructed in the following way:
First, total merchandise exports from each of the seven regions are aggregated from the individual country or territory figures published in Appendix table A6.
Next, the total merchandise exports of each region are distributed by destination and then by product. The regional and commodity breakdown is based on UNSD Comtrade database, EUROSTAT, GTIS GTA database, national statistics and Secretariat estimates.
During this process, the principal adjustments to the figures are as follows:
(i) Exports of ships to the open registry countries Panama and Liberia are re-allocated from each region’s exports to South and Central America and Africa to “unspecified destinations” (a category not shown separately).
(ii) China’s exports are adjusted to approximate their final destination.
(iii) Exports of non-monetary gold, where known, are included. When they cannot be broken down by destination, they are allocated to “unspecified destinations”.
(iv) South Africa’s trade does not include trade with the former Southern African Customs Union members.
(v) “Estimates for the Middle East include unrecorded re-exports of the United Arab Emirates which
accounted for 4 per cent of the region’s total exports in 2010. As of this publication, these are no longer distributed by product and destination and are instead included in unspecified products and destinations.”
2.1.4 Merchandise trade by product, region and major trading partner (Commodity and Appendix tables) Appendix tables are derived from UNSD Comtrade and EUROSTAT. For trade by product, world totals include shipments which have not been distinguished by origin or destination. For trade by region and partner, world totals include goods which have not been specified by product.
The following adjustment has been made to the figures:
Exports of ships to the open registry countries Panama and Liberia are reallocated from each economy’s exports to South and Central America and Africa to “unspecified destinations” (a category not shown separately).
The selection of each economy’s major trading partners is based on a ranking of total trade (exports plus imports) of each economy with their trading partners in 2009 (member States of the EU (27) are counted as one trading partner).
Commodity tables in Chapter II by product, region and major trading partner are also derived from UNSD Comtrade and Eurostat.
2.1.5 Merchandise trade and the goods account in balance of payments statistics Merchandise trade statistics serve as an input for the compilation of the goods account in the balance of payments (BOP) and the rest of the world account in the System of National Accounts (SNA).
The compilation of international merchandise trade statistics (IMTS) relies principally on customs records complemented, as appropriate, by additional sources to enhance their coverage (for instance, to include electricity, or trade in vessels and aircrafts). These statistics essentially reflect the physical movement of goods across borders, while National Accounts
and BOP statistics record transactions that involve change in ownership.
The goods account in the BOP is generally compiled on the basis of IMTS after they have been adjusted for coverage, timing, and valuation.
Coverage differences between BOP statistics and IMTS concern mainly:
• itemssuchasblueprints,videos,and tapes which are regarded as services within the BOP (hence are excluded from goods) whereas they are included in merchandise trade statistics at the value of the material support;
• goodsthatforpracticalreasonsareexcluded from merchandise trade but should in theory be recorded in BOP statistics, such as fish and salvage sold abroad by resident vessels, or imports of bunkers and stores acquired abroad for mobile equipment operated by residents;
• goodsundertheimprovementand repair trade regime should be excluded from IMTS, but they are to be included in the goods account at the value of the repair under the BPM5;
• anothercoveragedifferenceconcerns goods that are imported in an economy where they undergo processing operations, and are thereafter re-exported. IMTS recommends that these movements be recorded on a gross basis, whereas BPM5 distinguishes between goods that return to the country of origin (included within the goods account but reported separately) and those that are sent to a third economy (such flows are considered as trade in general merchandise between the economy of origin and final destination, and should be excluded from the goods account of the economy where the processing takes place).
The physical movement of goods across border measured in IMTS do not necessarily coincide in timing with changes in the ownership of goods. BPM5 therefore recommends the application of specific adjustments for such cases.
As far as valuation is concerned, the issue that affects most data comparability concerns the point of valuation, namely, whether goods
191World Trade OrganizationInternational Trade Statistics 2011
Download the data:www.wto.org/statistics
are valued at the importer’s border - that is at the cost, insurance and freight value - or at the free on board value at the exporter’s border. IMTS guidelines recommend the adoption of the c.i.f. valuation for imports whereas the fifth edition of the IMF’s Balance of Payments Manual (BPM5) requires the f.o.b. valuation. Additional adjustments may be made by BOP compilers to conform to the BPM5 requirement for a market price for valuing trade, processing trade, and with respect to currency conversion.
Once adjusted, merchandise trade is recorded in the goods category of the current account, along with services, income, and current transfers. Therefore, within the balance of payments framework transactions in both goods and services are harmonized and provide for comparable statistical series. Strictly speaking, it is not correct to aggregate the figures for commercial services and merchandise shown elsewhere in this report.
It should be noted that some economies still apply the concepts of the fourth edition of the Balance of Payments Manual, and thus do not include goods for processing and goods procured in port carriers in the goods account.
2.2 Trade in commercial services Depending on the location of the supplier and the consumer, the General Agreement on Trade in Services (GATS) defines four modes of supply. In addition to the cross-border supply (mode 1), where both the supplier and the consumer remain in their respective home territories, GATS also covers cases where consumers are outside their home territory to consume services (mode 2 – consumption abroad), or cases where service suppliers are in the territory of the consumers to provide their services, whether by establishing affiliates through direct investment abroad (mode 3 – commercial presence), or through the presence of natural persons (mode 4).
A country’s balance of payments, that is the services account, can be used to derive estimates covering trade in commercial services for modes 1, 2 and 4. The Balance of Payments does however not include most of the information on the local deliveries
of services through foreign affiliates that is required to estimate the size of mode 3. A framework for collecting these data, the “Foreign Affiliates Trade in Services (FATS) statistics”, has been developed and adopted by the international statistical community in 2002. Further information on these “new” statistics is developed below.
2.2.1 Trade in commercial services between residents and non residents of an economy
Exports and imports Exports (credits or receipts) and imports (debits or payments) of commercial services derived from statistics on international service transactions are included in the balance of payments statistics, in conformity with the concepts, definitions and classification of the fifth (1993) edition of the IMF Balance of Payments Manual.
Definition of commercial services in the balance of paymentsIn the fifth edition of the Balance of Payments Manual, the current account is subdivided into goods, services (including government services, not included elsewhere), income (investment income and compensation of employees), and current transfers. The commercial services category in this report is defined as being equal to services minus government services, not included elsewhere. Commercial services is further sub-divided into transportation services, travel, and other commercial services.
Transportation services covers sea, air and other including land, internal waterway, space and pipeline transport services that are performed by residents of one economy for those of another, and that involve the carriage of passengers, the movement of goods (freight), rentals (charters) of carriers with crew, and related supporting and auxiliary services
Travel includes goods and services acquired by personal travellers, for health, education or other purposes, and by business travellers. Unlike other services, travel is not a specific type of service, but an assortment of goods and services consumed by
travellers. The most common goods and services covered are lodging, food and beverages, entertainment and transportation (within the economy visited), gifts and souvenirs.
Other commercial services corresponds to the following components defined in BPM5:
(i) communications services includes telecommunications, postal and courier services. Telecommunications services encompasses the transmission of sound, images or other information by telephone, telex, telegram, radio and television cable and broadcasting, satellite, electronic mail, facsimile services etc., including business network services, teleconferencing and support services. It does not include the value of the information transported. Also included are cellular telephone services, Internet backbone services and on-line access services, including provision of access to the Internet;
(ii) construction covers work performed on construction projects and installation by employees of an enterprise in locations outside the territory of the enterprise (the one-year rule to determine residency is to be applied flexibly). In addition goods used by construction companies for their projects are included which implies that the “true” services component tends to be overestimated;
(iii) insurance services covers the provision of various types of insurance to non residents by resident insurance enterprises, and vice versa, for example, freight insurance, direct insurance (e.g. life) and reinsurance;
(iv) financial services covers financial intermediation and auxiliary services provided by banks, stock exchanges, factoring enterprises, credit card enterprises, and other enterprises;
(v) computer and information services is subdivided into computer services (hardware and software related services and data processing services), news agency services (provision of news, photographs, and feature articles to the media), and other information provision services (database services and web search portals);
(vi) royalties and licence fees, covering payments and receipts for the use of intangible non-financial
192 World Trade OrganizationInternational Trade Statistics 2011
Download the data:www.wto.org/statistics
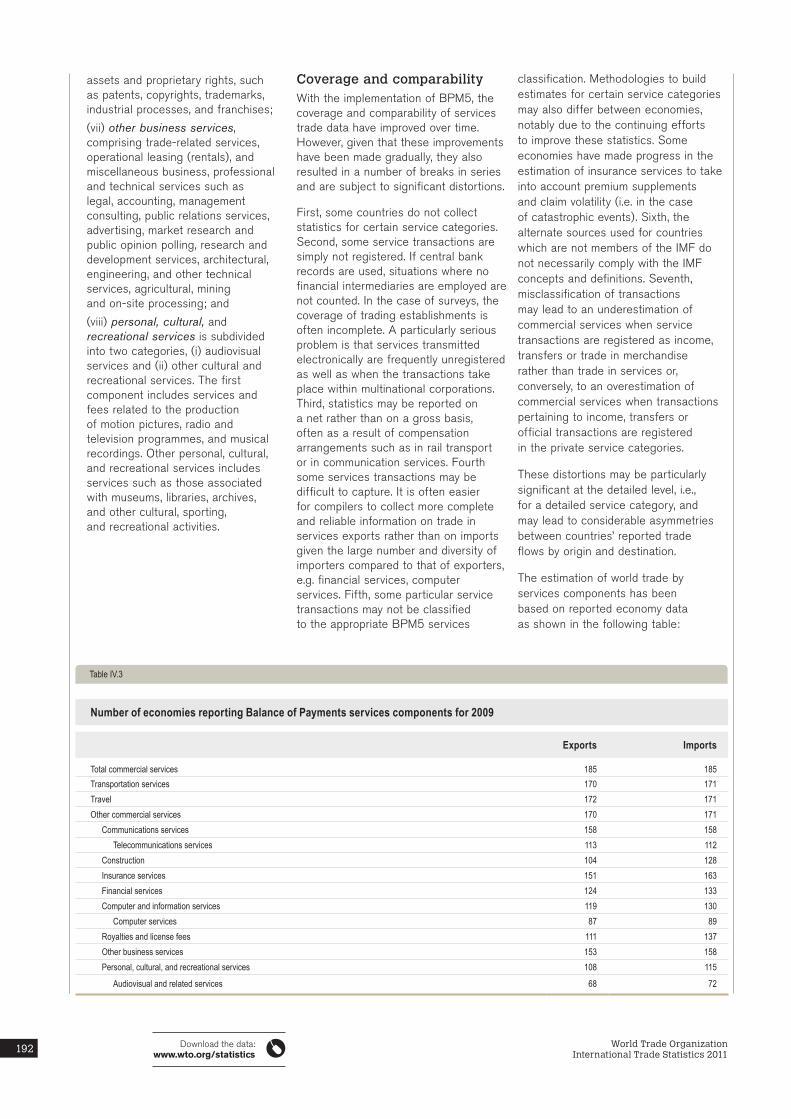
Table IV.3
Number of economies reporting Balance of Payments services components for 2009
Exports Imports
Total commercial services 185 185Transportation services 170 171Travel 172 171Other commercial services 170 171
Communications services 158 158Telecommunications services 113 112
Construction 104 128Insurance services 151 163Financial services 124 133Computer and information services 119 130
Computer services 87 89Royalties and license fees 111 137Other business services 153 158Personal, cultural, and recreational services 108 115
Audiovisual and related services 68 72
assets and proprietary rights, such as patents, copyrights, trademarks, industrial processes, and franchises;
(vii) other business services, comprising trade-related services, operational leasing (rentals), and miscellaneous business, professional and technical services such as legal, accounting, management consulting, public relations services, advertising, market research and public opinion polling, research and development services, architectural, engineering, and other technical services, agricultural, mining and on-site processing; and
(viii) personal, cultural, and recreational services is subdivided into two categories, (i) audiovisual services and (ii) other cultural and recreational services. The first component includes services and fees related to the production of motion pictures, radio and television programmes, and musical recordings. Other personal, cultural, and recreational services includes services such as those associated with museums, libraries, archives, and other cultural, sporting, and recreational activities.
classification. Methodologies to build estimates for certain service categories may also differ between economies, notably due to the continuing efforts to improve these statistics. Some economies have made progress in the estimation of insurance services to take into account premium supplements and claim volatility (i.e. in the case of catastrophic events). Sixth, the alternate sources used for countries which are not members of the IMF do not necessarily comply with the IMF concepts and definitions. Seventh, misclassification of transactions may lead to an underestimation of commercial services when service transactions are registered as income, transfers or trade in merchandise rather than trade in services or, conversely, to an overestimation of commercial services when transactions pertaining to income, transfers or official transactions are registered in the private service categories.
These distortions may be particularly significant at the detailed level, i.e., for a detailed service category, and may lead to considerable asymmetries between countries’ reported trade flows by origin and destination.
The estimation of world trade by services components has been based on reported economy data as shown in the following table:
Coverage and comparability With the implementation of BPM5, the coverage and comparability of services trade data have improved over time. However, given that these improvements have been made gradually, they also resulted in a number of breaks in series and are subject to significant distortions.
First, some countries do not collect statistics for certain service categories. Second, some service transactions are simply not registered. If central bank records are used, situations where no financial intermediaries are employed are not counted. In the case of surveys, the coverage of trading establishments is often incomplete. A particularly serious problem is that services transmitted electronically are frequently unregistered as well as when the transactions take place within multinational corporations. Third, statistics may be reported on a net rather than on a gross basis, often as a result of compensation arrangements such as in rail transport or in communication services. Fourth some services transactions may be difficult to capture. It is often easier for compilers to collect more complete and reliable information on trade in services exports rather than on imports given the large number and diversity of importers compared to that of exporters, e.g. financial services, computer services. Fifth, some particular service transactions may not be classified to the appropriate BPM5 services
193World Trade OrganizationInternational Trade Statistics 2011
Download the data:www.wto.org/statistics
First, total trade in commercial services from each of the seven regions is aggregated from the individual economy figures published. The breakdown of these data is then applied to missing countries before aggregating regional and world totals. Tables on major traders are based on reported data only.
Bilateral trade As from 2007, available reporters’ bilateral trade with the European Union refers to the EU(27).
Intra-trade of the European Union The principal source for trade in commercial services are the IMF’s Balance-of-Payments statistics. Intra-EU trade figures have been estimated from statistics included in the New Cronos database, July 2009.
2.2.2 Foreign affiliates trade in services statisticsThe new statistical framework on Foreign Affiliates Trade in Services (FATS) statistics is developed in the Manual on Statistics of International Trade in Services. The acronym FATS is also used for “foreign affiliates statistics”. Both refer to the same statistical framework, the former focusing on services. It analyses the universe of foreign affiliates for which foreign investors own more than 50 per cent of the voting power or equity interest. Depending on the compiler’s view, one can distinguish inward FATS, that is, activities of foreign-owned affiliates in the compiling economy, or, outward FATS, that is, foreign affiliates of the compiling economy active abroad. Variables such as sales, value added, number of employees, etc. are used to describe the affiliates’ activities. These variables are broken down by country of origin or destination of investments and also by type of primary activity of the affiliates. The United States also provide a breakdown of sales into total goods and total services products. FATS statistics are currently available mainly for OECD and a small number of non-OECD economies. However, given the recent development of these statistics, comparability and coverage of individual economy data may not always be complete. Availability of detailed data and long-time series varies considerably between economies. From a GATS perspective, the size of mode 3 in a given country can be approximated through the sales of services foreign-owned affiliates.
2.3 Other definitions and methods
2.3.1 Annual changes Throughout this report, average annual percentage changes are analogous to compound interest rates. In calculating the average annual rate of change between 2000 and 2009, for example, data for calendar year 2000 were taken as the starting point, and data for calendar year 2009 as the end point.
2.3.2 Prices Commodity price movements are primarily described by indices largely based on spot market prices, and therefore exclude transactions governed by longer-term contracts. Price indices for such commodities as food, beverages, agricultural raw materials, minerals, non-ferrous metals, fertilizers and crude petroleum are obtained from IMF Primary Commodity Prices (July 2011 release). Aggregates for all primary commodities and for non-fuel primary commodities are calculated using IMF weights (Appendix table A33).
Export and import prices by commodity group of Germany, Japan and the United States are sourced from national statistics. Aggregates are calculated by weighting the countries’ price indices with the export and import values of the countries’ respective base year (Appendix tables A34 and A35).
194 World Trade OrganizationInternational Trade Statistics 2011
Download the data:www.wto.org/statistics
2.3.3 World merchandise trade indices The volume indices and the deflators (i.e. price indices or unit values) are taken from a range of different international and national sources. The reported deflators and volume indices may not always be available for the most recent years or may differ in product coverage from the corresponding value indices.
Aggregation of the indices to obtain a world total is a two-tier process. First, export and import deflators from national and international sources are complemented with Secretariat estimates for missing data. They are then aggregated to obtain regional totals. The volume index for each region is obtained by dividing the respective trade value index for each region by the corresponding regional deflator.
Second, the total world merchandise volume index is obtained by deflating the world trade value with the aggregate of regional deflators. Throughout the aggregation process trade values of the previous year are used as weights.
2.3.4 World production Production of agriculture (including hunting, forestry and fish), mining and manufacturing is defined according to major Categories A, B, C and D of the International Standard Industrial Classification of all Economic Activities Revision 3 (ISIC). World production in these sectors is estimated by combining production indices published by the FAO, OECD, UNIDO and UNSD. The world index is derived through aggregation of the three sectors by using value added shares in 2000 as weights.
2.3.5 World gross domestic product World GDP growth is estimated as a weighted average of economies’ real GDP growth. The weights used are shares of economies in 2000 world nominal GDP converted to dollars at market exchange rates.
The use of official exchange rates which are not market-based for some major economies, together with the fluctuations of the United States dollar vis-à-vis major currencies, can have a significant impact on the weighting pattern. The increasing use of weights based on purchasing power parities (PPP) by other international organizations is meant to attenuate “anomalies” linked to these factors. In a period of widely diverging growth rates among countries and regions, the choice of the weighting pattern can have a marked influence on the global growth estimate. For the 2000-2009 period, global growth estimates based on PPP-weights indicate a significantly faster growth than estimates using weights based on GDP data measured at market exchange rates. This is because of differences in the two weighting patterns. Relative to weights based on GDP at market exchange rates, PPP weights are low for the transition economies – especially the successor States of the former USSR with a poor growth record, and high for major developing countries (in particular China) with above average growth.
2.3.6 Re-exports and re-importsUnder the system of general trade adopted in this report, re-exports are included in total merchandise trade (see Section II.1).
However, in the case of Hong Kong, China, the magnitude of its re-exports (amounting in 2010 to $386 billion), if included in regional or world aggregates, would adversely affect the analytical value of the statistics by introducing a significant element of double counting. Therefore, Hong Kong, China’s re-exports are excluded from the world and from Asia aggregates (unless otherwise indicated); only Hong Kong, China’s domestic exports and retained imports are included in the totals. For this reason, the figures for world exports and for exports of Asia shown in Appendix tables A2 and A10 are smaller than those in Appendix table A6. When retained imports are not published, an approximation is made on the basis of re-export values.
China reports imports from China (re-imports), a trade flow which accounted for 7.7 per cent ($106.9 billion) of its total merchandise imports in 2010. These imports consist of products which have been produced in China and thereafter temporarily exported. The product structure of China’s imports from China indicates that in absolute terms office and telecom equipment is the largest category ($49.0 billion) in this particular trade flow. The share of re-imports is particularly large in the imports of telecommunications equipment (37.8 per cent), EDP and office equipment (34.8 per cent), electrical machinery (25.7 per cent) and in textiles (19.4 per cent). Further information on these imports is provided in Box 2 of the International Trade Statistics 2005.
195World Trade OrganizationInternational Trade Statistics 2011
Download the data:www.wto.org/statistics
3. Specific notes for selected economies
3.1 Merchandise trade statistics of the European Union Beginning with the 2002 report, EU data compiled according to national statistical practices have been replaced, starting 1993, with data compiled by Eurostat in accordance with EU legislation. The concepts and definitions adopted by the EU are in line with the United Nations’ International Trade Statistics, Concepts and Definitions, Series M, N° 52, Revision 2. As a result, the conceptual differences between EU member states’ data have been substantially reduced. Moreover, for the EU as a whole, Eurostat data are more timely than the previous source, thus reducing substantially the amount of estimation included in the EU aggregate.
Since January 1993, statistics on the trade between the member states of the EU have been collected through the “Intrastat” system (see GATT 1994, International Trade Trends and Statistics). The coverage of this system, which relies on reports submitted by firms for transactions above a minimum value, is not as wide as the previous one, which was based on customs declarations. This is particularly noticeable on the import side. For example, prior to the adoption of the Intrastat system, reported intra-EU imports (c.i.f.) closely matched reported intra-EU exports (f.o.b.). However, from 1993 onwards, the reported value of intra-EU imports has been on average around 3 per cent lower than the value of intra-EU exports, indicating a substantial under-reporting of intra-EU imports. As a result of this inconsistency, the Secretariat has substituted intra-EU exports data for intra-EU imports at the aggregate EU level when estimating regional and world totals. However, this adjustment is not allocated between EU member countries. Hence, the sum of reported imports of individual EU members does not add to the figure for EU imports as a whole. This adjustment is also reflected in the volume estimates for the EU as a whole.
3.2 Merchandise trade of South Africa with SACU (South African Customs Union) South Africa’s merchandise exports (and imports) exclude shipments to (from) other SACU members (Botswana, Lesotho, Namibia and Swaziland). Partner statistics indicate that South African shipments amount to 80 percent of these countries’ total merchandise imports in 2002. This share – most likely – increased thereafter and represents an important trade flow for the African region. If South Africa’s exports would be adjusted for these shipments to SACU members, its total exports would be about $4 billion higher in 2010 and intra-African trade would be substantially higher, with intra-SACU trade being the largest intra trade flow for regional trade agreements in Africa.
3.3 Major breaks in data continuity of merchandise tradeBeginning 2003, Singapore includes merchandise trade with Indonesia. Beginning 2008, Indonesia’s imports are reported according to the general trade system.
With respect to the Russian Federation, considerable uncertainty remains about the accuracy of foreign trade statistics, especially as regards imports. A large proportion of the reported data on imports consists of official estimates of inflows of goods which enter the economy without being registered by the customs authorities. Such adjustments to import data accounted for 8 per cent of the officially reported totals in 2010; and, on the export side, for about 1 per cent of total reported exports.
Merchandise trade flows between the European Union member States include trade associated with fraudulent VAT declaration, which concerns mainly office and telecommunications equipment. Between 2006 and 2007, intra-EU merchandise trade statistics have been particularly affected by a considerable reduction in this fraudulent trade in the United Kingdom.
196 World Trade OrganizationInternational Trade Statistics 2011
Download the data:www.wto.org/statistics
3.4 Trade in services of the United States Over recent years the United States Bureau of Economic Analysis has continuously improved its trade in commercial services estimates.
In 2010, the United States revised its goods and services accounts to reflect the reclassification of certain transactions from services to goods. In particular, in previously published statistics, certain exports and imports of military-related goods were recorded on a transactor basis and were combined with other services transactions in the services account. In addition, expenditures on goods and services by foreign air and ocean carriers in U.S. ports (exports) and by U.S. air and ocean carriers in foreign ports (imports) were included in “other” transportation services. Beginning with statistics for 1999, fuel expenditures by foreign and U.S. air and ocean carriers were reclassified from “other” transportation services to goods. A number of changes in terms of content were also introduced. Beginning with 2006 and continuing with 2007 surveys of transactions in selected services and transactions in financial services, transactions with affiliated and unaffiliated persons are collected on the same form and in the same detail. This in particular reduces the potential for duplicate reporting or omissions. It is important to note that given this major revision, some time series were significantly revised and for some other detailed services items, including both affiliated and non affiliated trade, data are not available prior to 2006.
Another major revision was introduced in 2003, when the United States revised its methodology for estimating trade in insurance services. The new methodology measures insurance services as premiums less normal claims. Normal claims comprise two components: “regularly occurring claims” that are calculated as an average of all claims paid during the previous six years, and a share of “catastrophic claims” that is added-on to “regularly occurring claims” in equal increments over the two decades following their event.
As comprehensive data collection on insurance services started in 1986, the first six-year average of “regularly occurring claims” could only be calculated for 1992. As a result, time series on trade in insurance services, and consequently on other commercial services, have been revised back to 1992. To complete the 2003 revision, in 2004 the United States added to insurance services an estimate of premium supplements (or income earned on technical reserves of insurance companies). Insurance companies provide financial protection to policy holders through the pooling of risk and provide financial intermediation services through the investment of reserves. The income is treated as accruing to the policy holders who pay it back to the insurers as supplements to premiums to cover the full cost of insurance. The investment income of insurance companies is not output in and of itself; it is used to impute the value of the implicit component of insurance services attributable to financial intermediation.
3.5 Travel exports and transportation services exports and imports of Japan In order to enhance the coverage of estimates of travel exports and imports, the Bank of Japan and the Japanese Ministry of Finance reviewed their compilation methodology, notably by including results from a new expenditure survey of foreign travellers as of 2003. This revision had a major impact on the estimates for travel exports. This methodology was reviewed in 2007 based on the results of a new survey (International Travelers’ Survey on Expenditures) which are used in the new compilation method to directly estimate the amounts spent by travelers to pay for goods and services. This applies to exports and imports data as from 2006. In order to maintain consistent growth rates, data shown in this report for Japanese 1995-2005 travel trade and trade in commercial services include provisional Secretariat estimates referring to the new compilation methodology (i.e. after January 2006) applied by the Japanese authorities and therefore they differ from 1995-2005 figures available elsewhere. As from 2009, Japan’s travel exports and imports data reflect the results of new surveys.
Data shown for transportation services in this report are consistent with revised 1996-2004 data published in 2006 by the Bank of Japan (based on a new methodology for measuring sea freight fares).
197World Trade OrganizationInternational Trade Statistics 2011
Download the data:www.wto.org/statistics
3.6 Trade in other commercial services of IndiaIn the course of 2004, the Reserve Bank of India released new data following the introduction of a new reporting system to improve the coverage of Indian trade in services statistics (mainly affecting the item other business services). The data shown in tables for India for “computer services” refer to WTO Secretariat estimates. The Indian figures reported by the Reserve Bank of India and international agencies refer to “software services” (covering Information Technology (IT) and IT enabled services). The coverage of “software services” does not correspond to the definition of computer services in international guidelines. WTO secretariat estimates are drawn from the software figure which is broken down into a computer/IT component included in the item “computer services”, and an IT enabled services component included under the item “miscellaneous business, professional and technical services” (under “other business services”). This breakdown is done on the basis of the information published in the annual RBI report “Survey on Computer Software & Information Technology Services Exports”.
3.7 Trade in commercial services of United Arab EmiratesCommercial services trade statistics of United Arab Emirates only cover transportation and travel.
3.8 Trade in commercial services of NigeriaNew data from 2005 compiled on the basis of BPM5 recommendations were released by the Bank of Nigeria in 2007. This results in a break in series for Nigerian data in 2005.
3.9 Trade in commercial services of South AfricaIn 2006 the Reserve Bank of South Africa improved its commercial services estimates, and revised its data back to 2001 (resulting in a break in series for that year).
3.10 Trade in other commercial services of BahrainNew data compiled from 2004 for other commercial services items, resulting in a break in series for that year.
3.11 Trade in other commercial services of OmanIn 2008 new data compiled (new national data from new survey of corporate firms in 2007) for other commercial services items, resulting in a break in series for 2005 for exports and 2003 for imports.
3.12 Trade in commercial services of the Islamic Republic of IranStarting with 2004, Iran compiles data according to the recommendations of the BPM5.
3.13 Trade in commercial services of the Kingdom of Saudi ArabiaNew data are compiled from 2005 according to BPM5 principles. Prior to 2008 a number of items (e.g. financial services, other business services) were still not all classified according to the BPM5 definitions and some items were received net.
3.14 Trade in financial servicesFor Singapore (from 1995), and Switzerland, (from 1999) data on trade in financial services include Financial Intermediation Services Indirectly Measured (FISIM). This is not in accordance with BPM5 recommendations.
For Australia, 2009 data include FISIM due to the country’s transition to BPM6.
198 World Trade OrganizationInternational Trade Statistics 2011
Download the data:www.wto.org/statistics
4. Statistical sourcesMost frequently used sources for statistics are:
EUROSTAT, Comext and on-line databases FAO, FAOSTAT Agriculture database FAO, Production Yearbook GTIS, Global Trade Atlas database IMF, Balance of Payments Statistics IMF, International Financial Statistics IMF, World Economic Outlook database OECD, Main Economic Indicators OECD, Measuring Globalisation: The Role of Multinationals in OECD Economies OECD, Monthly Statistics of International Trade OECD, National Accounts OECD, Statistics on International Trade in Services OECD/IEA, Energy Prices & Taxes UNECE, Economic Survey of Europe UNECLAC, Overview of the Economies of Latin America and the Caribbean UNIDO, National Accounts Statistics Database UNSD, Comtrade database (for OECD members the UNSD-OECD Joint Trade Data Collection and Processing system) UNSD, International Trade Statistics Yearbook UNSD, Monthly Bulletin of Statistics UNSD, Servicetrade database World Bank, World Development Indicators
These sources are supplemented by national publications and other international databases and Secretariat estimates.
Figures for total merchandise trade are largely derived from IMF, International Financial Statistics. Data on merchandise trade by origin, destination and product are mainly obtained from Eurostat’s Comext database, the Global Trade Atlas and UNSD’s Comtrade database. Some inconsistencies in the aggregate export and import data for the same country or territory between sources are inevitable. These can be attributed to the use of different systems of recording trade, to the way in which for example IMF and UNSD have converted data expressed in national currencies into dollars, and revisions which can be more readily incorporated in the IMF data.
Statistics on trade in commercial services are mainly drawn from the IMF Balance of Payments Statistics. Data for European Union members, EU candidate and EU observer countries as well as the EU(27) aggregate are drawn from Eurostat’s on-line database from 2004. For other economies that do not report to the IMF (e.g., Chinese Taipei) data are drawn from national sources. Estimations for missing data are mainly based on national statistics. Statistics on trade in commercial services by origin and destination are also derived from national statistics.
GDP series in current dollars are mainly derived from the World Bank World Development Indicators, supplemented in some cases with statistics from the IMF World Economic Outlook database.
Acknowledgements are due to the Food and Agriculture Organization, the International Monetary Fund, the Organisation for Economic Co-operation and Development, the Statistical Office of the European Communities, the United Nations Economic Commission for Europe, the United Nations Economic Commission for Latin America and the Caribbean, the United Nations Statistics Division, the United Nations Industrial Development Organization, the World Intellectual Property Organization and the World Bank whose assistance in supplying advance information has greatly facilitated the work of the Secretariat. Acknowledgements are also due to national institutions for providing advance statistics.
Closing date for merchandise trade statistics (Customs basis) and commercial services (Balance of Payments basis) is 15 July 2011. For foreign affiliates trade in services statistics the closing date is 16 August 2011.