Embed Size (px)
Citation preview

HANDBOOK
DATA ANALYTICS AND DIGITAL
FINANCIAL SERVICES
PART 01DATA METHODS
AND APPLICATIONS
PART 01DATA METHODS
AND APPLICATIONS
PART 02DATA PROJECT FRAMEWORKS
PART 02DATA PROJECT FRAMEWORKS
Pub
lic D
iscl
osur
e A
utho
rized
Pub
lic D
iscl
osur
e A
utho
rized
Pub
lic D
iscl
osur
e A
utho
rized
Pub
lic D
iscl
osur
e A
utho
rized

ACKNOWLEDGEMENTS
IFC and The MasterCard Foundation’s Partnership for Financial Inclusion would like to acknowledge the generous support of the institutions who participated in the case studies for this handbook: Airtel Uganda, Commercial Bank of Africa, FINCA Democratic Republic of Congo, First Access, Juntos, Lenddo, MicroCred, M-Kopa, Safaricom, Tiaxa, Tigo Ghana, and Zoona. Without the participation of these institutions, this handbook would not have been possible.
IFC and The MasterCard Foundation would like to extend special thanks to the authors Dean Caire, Leonardo Camiciotti, Soren Heitmann, Susie Lonie, Christian Racca, Minakshi Ramji, and Qiuyan Xu, as well as to the reviewers and contributors: Sinja Buri, Tiphaine Crenn, Ruth Dueck-Mbeba, Nicolais Guevara, Joseck Mudiri, Riadh Naouar, Laura Pippinato, Max Roussinov, Anca Bogdana Rusu, Matthew Saal, and Aksinya Sorokina. Lastly, the authors would like to extend a special thank you to Anna Koblanck and Lesley Denyes for their extensive editing support.
ISBN Number: 978-0-620-76146-8First Edition 2017

HANDBOOK
DATA ANALYTICS AND DIGITAL
FINANCIAL SERVICES

4 DATA ANALYTICS AND DIGITAL FINANCIAL SERVICES
Resources
Managing a
data project
ForewordThis is the third handbook on digital financial services (DFS) produced and published by the Partnership for Financial Inclusion, a joint initiative of IFC and The MasterCard Foundation to expand microfinance and advance DFS in Sub-Saharan Africa. The first handbook in the series, the Alternative Delivery Channels and Technology Handbook, provides a comprehensive guide to the components of digital financial technology with particular focus on the hardware and software building blocks for successful deployment. The second handbook, Digital Financial Services and Risk Management, is a guide to the risks associated with mobile money and agent banking, and offers a framework for managing these risks. This handbook is intended to provide useful guidance and support on how to apply data analytics to expand and improve the quality of financial services.
This handbook is designed for any type of financial services provider offering or intending to offer digital financial services. DFS providers include all types of institutions such as microfinance institutions, banks, mobile network operators, fintechs and payment service providers. Technology-enabled channels, products and processes generate hugely valuable data on customer interactions; at the same time, linkages to the increasingly available pools of external data can be enabled. The handbook offers an overview of the basic concepts and
identifies usage trends in the market,
and also illustrates a range of practical
applications and cases of DFS providers
that are translating their own or external
data in to business insights. It also offers a
framework to guide data projects for DFS
providers that wish to leverage data insights
to better meet customer needs and to
improve operations, services and products.
The handbook is meant as a primer on data
and data analytics, and does not assume
any previous knowledge of either. However,
it is expected that the reader understands
DFS, and is familiar with the products, the
function of agents, aspects of operational
management, and the role of technology.
The handbook is organized as follows:
Introduction: Introduces the handbook
and establishes the broad platform and
definitions for DFS and data analytics.
Part 1: Data Methods and Applications
Chapter 1.1: Discusses data science in the context of DFS and provides an overview of the data types, sources and methodologies and tools used to derive insights from data.
Chapter 1.2: Describes how to apply data analytics to DFS. The chapter summarizes techniques used to derive market insights from data, and describes the role data can play in improving the operational management of DFS. The chapter includes seminal, real-life examples and case studies of lessons learned by practitioners in the field. It ends with an outline of how practitioners can use data to develop algorithm-based credit scoring models for financial inclusion.
Part 2: Data Project Framework
Chapter 2.1: Offers a framework for data project implementation and a step-by-step guide to solve practical business problems by applying this framework to derive value from existing and potential data sources.
Chapter 2.2: Provides a directory of data sources and technology resources as well as a list of performance metrics for assessing data projects. It also includes a glossary that provides descriptions of terms used in the handbook and in industry practice.
Conclusion: Includes lessons learned from data projects thus far, drawing on IFC’s experience in Sub-Saharan Africa with the MasterCard Foundation’s Partnership for Financial Inclusion program.
Dat
a analytics
& m
ethods Data
applications
DATA ANALYTICS AND DIGITAL FINANCIAL SERVICES 5
CONTENTS
FOREWORD 4
ACRONYMS 7
EXECUTIVE SUMMARY 10
INTRODUCTION 14
PART 1: DATA METHODS AND APPLICATIONS 16
Chapter 1.1: Data, Analytics and Methods ............................................................................................................................. 16
Defining Data 16
Sources of Data 19
Data Privacy and Customer Protection 23
Data Science: Introduction 26
Methods 29
Tools 32
Chapter 1.2: Data Applications for DFS Providers .......................................................................................................... 34
1.2.1 Analytics and Applications: Market Insights 36
1.2.2 Analytics and Applications: Operations and Performance Management 54
1.2.3 Analytics and Applications: Credit Scoring 79
Resou
rcesD
ata applications
Data an
alytics and m
ethods
Man
aging a data project

6 DATA ANALYTICS AND DIGITAL FINANCIAL SERVICES
PART 2: DATA PROJECT FRAMEWORKS 100
Chapter 2.1: Managing a Data Project ...................................................................................................................................100
The Data Ring 100
Structures and Design 102
GOAL(S) 104
Quadrant 1: TOOLS 107
Quadrant 2: SKILLS 112
Quadrant 3: PROCESS 117
Quadrant 4: VALUE 124
APPLICATION: Using the Data Ring 126
Chapter 2.2: Resources ......................................................................................................................................................................... 136
2.2.1 Summary of Analytical Use Case Classifications 136
2.2.2 Data Sources Directory 137
2.2.3 Metrics for Assessing Data Models 141
2.2.4 The Data Ring and the Data Ring Canvas 141
CONCLUSIONS AND LESSONS LEARNED 145
GLOSSARY 149
AUTHOR BIOS 157

DATA ANALYTICS AND DIGITAL FINANCIAL SERVICES 7
ACRONYMSADC Alternative Delivery Channel
AI Artificial Intelligence
AML Anti-Money Laundering
API Application Programming Interface
ARPU Average Revenue Per User
ATM Automated Teller Machine
BI Business Intelligence
CBA Commercial Bank of Africa
CBS Core Banking System
CDO Chief Data Officer
CDR Call Detail Records
CFT Countering Financing of Terrorism
CGAP Consultative Group to Assist the Poor
COT Commission on Transaction
CRISP-DM Cross Industry Standard Process for Data Mining
CRM Customer Relationship Management
CSV Comma-separated Values
DB Database
DFS Digital Financial Services
DOB Date of Birth
DRC Democratic Republic of Congo
ETL Extraction-Transformation-Loading
EU European Union
FI Financial Institution

8 DATA ANALYTICS AND DIGITAL FINANCIAL SERVICES
FSD Financial Sector Deepening
FSP Financial Services Provider
FTC Federal Trade Commission
GLM Generalized Linear Model
GPS Global Positioning System
GSM Global System for Mobile Communications
GSMA Global System for Mobile Communications Association
ICT Information and Communication Technology
ID Identification Document
IFC International Finance Corporation
IP Intellectual Property
IT Information Technology
JSON JavaScript Object Notation
KCB Kenya Commercial Bank
KPI Key Performance Indicator
KRI Key Risk Indicator
KYC Know Your Customer
LOS Loan Origination System
MEL Monitoring, Evaluation and Learning
MFI Microfinance Institution
MIS Management Information System
MNO Mobile Network Operator
MSME Micro, Small and Medium Enterprise
MVP Minimum Viable Product
NDA Non-Disclosure Agreement

DATA ANALYTICS AND DIGITAL FINANCIAL SERVICES 9
NLP Natural Language Processing
NPL Non-Performing Loan
OLA Operating Level Agreement
OTC Over the Counter
P2P Person to Person
PAR Portfolio at Risk
PBAX Private Branch Automatic Exchange
PIN Personal Identification Number
POS Point of Sale
PSP Payment Service Provider
QA Quality Assurance
RCT Randomized Control Trial
RFP Request for Proposal
SIM Subscriber Identity Module
SLA Service Level Agreements
SME Small and Medium Enterprise
SMS Short Message Service
SNA Social Network Analysis
SQL Structured Query Language
SVM Support Vector Machine
SVN Support Vector Network
TCP Transmission Control Protocol
TPS Transactions Per Second
UN United Nations
USSD Unstructured Supplementary Service Data

10 DATA ANALYTICS AND DIGITAL FINANCIAL SERVICES
International Finance Corporation (IFC) supports institutions seeking to develop digital financial services (DFS) for the expansion of financial inclusion and is engaged in multiple projects across a range of markets through its portfolio of investments and advisory projects. As of 2017, through its work with The MasterCard Foundation and other partners, IFC works with DFS providers across Sub-Saharan Africa on expanding financial inclusion through digital products and services. Interactions with clients as well as the broader industry in the region and beyond have identified the need for a handbook on how to use the emerging field of data science to unlock value from the data emerging from these implementations. Even though data analytics offers an opportunity for DFS providers to know their customers at a granular level and to use this knowledge to offer higher-quality services, many practitioners are yet to implement a systematic, data-driven approach in their operations and organizations. There are a few examples that have received a lot of attention due to their success in certain markets, such as the incorporation of alternative data in order to evaluate credit risk of new types of customers. However, the promise of data goes beyond one or two specific case applications. Common barriers to the application of data insights for DFS include a lack of knowledge, scarcity of skill and discomfort with an unfamiliar approach. This handbook seeks to provide an overview of the opportunity for data to drive financial inclusion, along with steps that practitioners can take to begin to adopt a data-driven approach into their businesses and to design data-driven projects to solve practical business problems.
In the past decade, DFS have transformed the customer offering and business model of the financial sector, especially in developing countries. Large numbers of low-income people, micro-entrepreneurs, small-scale businesses, and rural populations that previously did not have access to formal financial services are now digitally banked by a range of old and new financial services providers (FSPs), including non-traditional providers such as mobile network operators (MNOs) and emerging fintechs. This has proven to impact quality of life as illustrated in Kenya, where a study conducted by researchers at the Massachusetts Institute of Technology (MIT) has demonstrated that the introduction of technology-enabled financial services can help reduce poverty.1 The study estimates that since 2008,
1 Suri and Jack, ‘The Long Run Poverty and Gender Impacts of Mobile Money’, Science Vol. 354, Issue 6317 (2015): 1288-1292.
Executive Summary
“Let the dataset change your mindset.” – Hans Rosling

DATA ANALYTICS AND DIGITAL FINANCIAL SERVICES 11
access to mobile money services that allow users to store and exchange money increased daily per capita consumption levels for 194,000 people, or roughly two percent of Kenyan households, in effect, lifting them out of extreme poverty. The impact was most prominent among households headed by women, often considered particularly economically marginalized. This is a good argument for broader and deeper financial inclusion in Sub-Saharan Africa and other emerging economies. Data and data analytics can help achieve this.
It is estimated that approximately 2.5 quintillion bytes of data are produced in the world every day.2 To get a sense of the quantity, this amount of data exceeds 10 billion high-definition DVDs. Most of these data are young – 90 percent of the world’s existing data were created in the last two years.3 The recent digital data revolution extends as much to the developing world as to the developed world. In 2016, there were 7.8 billion mobile phone subscriptions in the world, of which 74 percent were in developing nations.4 The future is expected
to be even richer in data. As the costs of smartphones fall, mobile internet access is set to rise from 44 percent in 2015 to 60 percent in 2020. In Sub-Saharan Africa, smartphone usage is predicted to rise from 25 percent in 2015 to 50 percent of all connections by 2020.5 Everyday objects are also increasingly being enabled to send and receive data, connecting and communicating directly with one another and through user-interfaces in smart-phone applications, known as the Internet of Things.6 While this is primarily a developed country phenomenon, there are also examples from the developing world. In East Africa for example, there are solar devices that produce information about the unit’s usage and DFS repayments made by the owner. Data are then used to perform instant credit assessments that can ultimately drive new business. For DFS providers, data can be drawn from an ever-expanding array of sources: transactional data, mobile call records, call center recordings, customer and agent registrations, airtime purchase patterns, credit bureau information, social media posts, geospatial data, and more.
These emerging sources of data have the capacity to positively impact financial inclusion. Analytics can improve the business processes of institutions that serve low-income households by allowing them to identify and engage new customers more efficiently. Thus, data can help financial institutions (FIs) acquire new and previously excluded people. It also deepens financial inclusion as existing customers increase their use of financial products. At the same time, policymakers and other public stakeholders can now obtain a detailed view of financial inclusion by looking at access, usage and other trends. This evidence can play a role in developing future policies and strategies to improve financial inclusion.
The increased availability of data presents challenges as well as opportunities. The major challenge is how to leverage the utility of data while also ensuring people’s privacy. A large proportion of newly available data are passively produced as a result of our interactions with digital services such as mobile phones, internet searches, online purchases,
2 ‘The 4 Vs of Big Data’, IBM Big Data Hub, accessed April 3, 2017, https://www-01.ibm.com/software/data/bigdata/what-is-big-data.html3 ‘The 4 Vs of Big Data’, IBM Big Data Hub, accessed April 3, 2017, https://www-01.ibm.com/software/data/bigdata/what-is-big-data.html4 ‘The Mobile Economy 2017’, GSMA Intelligence5 ‘Global Mobile Trends’, GSMA Intelligence6 Internet of Things. In Wikipedia, The Free Encyclopedia, accessed April 3, 2017, https://en.wikipedia.org/w/index.php?title=Internet_of_things&oldid=773435744
Executive Summary

12 DATA ANALYTICS AND DIGITAL FINANCIAL SERVICES
and electronically stored transactions.
Characteristics about individuals can be
inferred from complex algorithms that
make use of these data, made possible
due to advances in analytical capability.
Thus, privacy is further compromised
by the fact that primary generators of
data are unaware of the data they are
generating and the ways in which they can
be used. As such, companies and public
sector stakeholders must put in place
the appropriate safeguards to protect
privacy. There must be clear policies
and legal frameworks both at national
and international levels that protect the
producers of data from attacks by hackers
and demands from governments, while
also stimulating innovation in the use of
data to improve products and services.
At the institutional level as well, there should
be clear policies that govern customer opt
in and opt out for data usage, data mining,
re-use of data by third parties, transfer,
and dissemination.
The usage of data is relevant across the
life cycle of a customer in order to gain
a deeper understanding of their needs
and preferences. There are three broad
applications for data in DFS: developing
market insights, improving operational
management and credit scoring. The
handbook makes extensive use of case
studies in order to demonstrate the use of
data analytics for practitioners. Notably,
the universe of data is ever-expanding and
analytical capabilities are also improving
with gains in technological capacity.
As such, the potential for the use of data
extends far beyond the applications
described in this handbook.
Developing data-driven market insights
is key to developing a customer-centric
business. Understanding markets and
clients at a granular level will allow
practitioners to improve client services and
resolve their most important needs, thereby
unlocking economic value. A customer-
centric business understands customer
needs and wants, ensuring that internal
and customer-facing processes, marketing
initiatives and product strategy is the result
of data science that promotes customer
loyalty. From an operations perspective,
data play an important role in automating
processes and decision-making, allowing
institutions to become scalable quickly
and efficiently. Here data also play an
important role in monitoring performance
and providing insights into how it can be
improved. Finally, widespread internet
and mobile phone usage are sources of
new data, which allow DFS providers to
make a more accurate risk assessment of
previously excluded people who do not
have formal financial histories to support
their loan applications.
The handbook describes the steps that
practitioners may take to understand the
essential elements required to design a
data project and implement it in their own
institutions. Two tools are introduced to
guide project managers through these steps:
the Data Ring and the complementary Data
Ring Canvas. The Data Ring is a visual checklist,
whose circular form centers the ‘heart’ of
any data project as a strategic business goal.
The goal-setting process is discussed,
followed by a description of the core
resource categories and design structures
needed to implement the project. These
elements include hard resources, such as
the data itself, along with software tools,
processing and storage hardware; as well
as soft resources including skills, domain
expertise and human resources needed
for execution. This section also describes
how these resources are applied during
project execution to tune results and
deliver value according to a defined
implementation strategy.

DATA ANALYTICS AND DIGITAL FINANCIAL SERVICES 13
The complementary tool incorporates these structural design elements into a Canvas, a space where project managers can articulate and lay-out the key resources and definitions in an organized and interconnected way. The tools help to define the interconnected relationships across project design structures – to visually see how the pieces link together, to identify where gaps may exist, or where resource requirements need adjustment. The Canvas approach also serves as a communications tool, providing a high-level project design schematic on one sheet of paper that may be updated and discussed throughout project implementation.
Finally, resource tables are provided. The data directory enumerates prominent sources of data available to DFS practitioners and a brief overview of their potential application in a data project. The technology database lists essential tools in the data science industry and prominent commercial products for data
management, analysis, visualization and dashboard reporting. There is also a list of metrics for assessing data models that would be commonly discussed by external consultants or analytic vendors. Copies of the Data Ring tools may be downloaded for reference or use.
The handbook makes extensive use of case studies in order to illustrate the experiences of a diverse set of DFS providers in implementing data projects within their organizations. While these practitioners are primarily based in Africa and are offering DFS to their customers in the form of mobile money or agent banking, this is not to say that data driven insights cannot be used by any type of FSP using different business models. A common thread seen in all of these cases is that institutions can systematically develop their data capabilities starting with small steps. Becoming a data-led organization with competitive data-driven activities is a journey that requires
long-term vision and commitment.
It may require changes to organizational
culture and upgrades to existing internal
capacities. Importantly, institutions must
ensure that processes through which data
are collected, stored and analyzed respect
individual privacy.
The handbook is intended to provide useful
guidance and support to DFS providers to
expand financial inclusion and to improve
institutional performance. Data science
offers a unique opportunity for DFS
providers to know their customers, agents
and merchants as well as improve their
internal operational and credit processes,
using this knowledge to offer higher-
quality services. Data science requires
firms to embrace new skills and ways of
thinking, which may be unfamiliar to them.
However, these skills are acquirable and
will allow DFS practitioners to optimize
both institutional performance and
financial inclusion.

14 DATA ANALYTICS AND DIGITAL FINANCIAL SERVICES
Previously unbanked individuals in emerging markets are increasingly accessing formal financial services through digital channels. Ubiquitous computing power, pervasive connectivity, mass data storage, and advanced analytical technologies are being harnessed to deliver tailored financial products and services more efficiently and more directly to a broader range of customers; collectively, these products and services are referred to as digital financial services (DFS). DFS providers, i.e., institutions that leverage DFS to provide financial services, comprise a diverse set of institutions including traditional FSPs, such as banks and microfinance institutions (MFIs), as well as emerging FSPs such as MNOs, fintechs and payment service providers (PSPs).
Data is a term used to describe pieces of information, facts or statistics that have been gathered for any kind of analysis or reference purpose. Data exist in many forms, such as numbers, images, text, audio, and video. Having access to data is a competitive asset. However, it is meaningless without the ability to interpret it and use it to improve customer centricity, drive market insights and extract economic value. Analytics are the tools that bridge the gap between data and insights. Data science is the term given to the analysis of data, which is a creative and exploratory process that borrows skills from many disciplines including business, statistics and computing. It has been defined as ‘an encompassing and multidimensional field that uses mathematics, statistics, and other advanced techniques to find meaningful patterns and knowledge in recorded data’.7 Traditional business intelligence (BI) tools have been descriptive in nature, while advanced analytics can use existing data to predict future customer behavior.
The interdisciplinary nature of data science implies that any data project needs to be delivered through a team that can rely on multiple skill sets. It requires input from the technical side. However, it also requires involvement from the business team. As Figure 1 illustrates, the translation of data into value for firms and financial inclusion is a journey. Understanding the sources of data and the analytical tools is only one part of the process. This process is incomplete without contextualizing the data firmly within the business realities of the DFS provider. Furthermore, the provider must embed the insights from analytics into its decision-making processes.
7 ‘Analytics: What is it and why it matters?’, SAS, accessed April 3, 2017,
https://www.sas.com/en_za/insights/analytics/what-is-analytics.html
Introduction

DATA ANALYTICS AND DIGITAL FINANCIAL SERVICES 15
For DFS providers, data analytics presents a unique opportunity. DFS providers are particularly active in emerging markets and increasingly serve customers who may not have formal financial histories such as credit records. Serving such new markets can be particularly challenging. Uncovering the preferences and awareness levels of new types of customers may take extra time and effort. As the use of digital technology and smartphones expands in emerging markets, DFS providers are particularly well-positioned to take advantage of data and analytics to expand customer base and provide a higher-quality service. Data analytics can be used for a specific purpose such as credit scoring, but can also
be employed more generally to increase operational efficiency. Whatever the goal, a data-driven DFS provider has the ability to act based on evidence, rather than anecdotal observation or in reaction to what competitors are doing in the market.
At the same time, it is important to raise the issue of consumer protection and privacy as the primary producers of data may often be unaware of the fact that data are being collected, analyzed and used for specific purposes. Inadequate data privacy can result in identity theft and irresponsible lending practices. In the context of digital credit, policies are required to ensure that people understand the implications of the
data they are sharing with DFS providers and to ensure that they have access to the same data that the provider can access. In order to develop policies, stakeholders such as providers, policymakers, regulators, and others will need to come together to discuss the implications of privacy concerns, possible solutions and a way forward. For those in the financial inclusion sector, providers can proactively educate customers about how information is being collected and how it will be used, and pledge to only collect data that are necessary without sharing this information with third parties.
Introduction
Figure 1: The Data Value Chain: From Data to Decision-Making
DECISION-MAKING
Data Applications
Analytics

16 DATA ANALYTICS AND DIGITAL FINANCIAL SERVICES
Resources
Managing a
& m
ethods
Dat
a analytics
applications
data project
Data
PART 1 Data Methods and Applications
Chapter 1.1: Data, Analytics and Methods
The increasing complexity and variety of data being produced has led to the development of new analytic tools and methods to exploit these data for insights. The intersection of data and their analytic toolset falls broadly under the emerging field of data science. For digital FSPs who seek to apply data-driven approaches to their operations, this section provides the background to identify resources and interpret operational opportunities through the lens of the data, the scientific method and the analytical toolkit.
Defining DataData are samples of reality, recorded as measurements and stored as values. The manner in which the data are classified, their format, structure and source determine which types of tools can be used to analyze them. Data can be either quantitative or qualitative. Quantitative data are generally bits of information that can be objectively measured, for example, transactional records. Qualitative data are bits of information about qualities and are generally more subjective. Common sources of qualitative data are interviews, observations or opinions, and these types of data are often used to judge customer sentiment or behavior. Data are also classified by their format. In the most basic sense, this describes the nature of the data; number, image, text, voice, or biometric, for example. Digitizing data is the process of taking these bits of measured or observed ‘reality’ and representing them as numbers that computers understand. The format of digitized data describes how a given measurement is digitally encoded. There are many ways to encode information, but any piece of digitized information converts things into numbers that can drive an analysis, thus serving as a source of potential insight for operational value. The format classification is critical because that format describes how to turn the digital information back into a representation of reality and how to use the right data science tools to obtain analytic insights.

DATA ANALYTICS AND DIGITAL FINANCIAL SERVICES 17
To be available for analysis, data must be stored. They can be stored in either a structured or unstructured way. Structured data have a set of attributes and relationships that are defined during the database design process; these data fit into a predetermined organization, also known as a schema. In a structured database, all elements in the database will have the same number of attributes in a specific sequence. Transactional data are generally structured; they have the same characteristics and are saved in the same way. Structured data are more easily queried and analyzed. Unstructured data are not organized according to predetermined schemas. They are flexible to grow in form and shape, where reliable attributes may or may not exist. This makes them more difficult to analyze; but this is an advantage as more data are quickly generated from new sources such as social media, emails, mobile applications, and personal devices. Unstructured data have the advantage of being able to be saved as-is, without the need to check if they satisfy any organizational rules. This makes storing them fast and flexible. There are also data that are considered semi-structured data. Consider a Twitter tweet, for example, which is limited to 140 characters. This is a predetermined organizational structure, and the service is programmed to check that each and every tweet satisfies this requirement. However, the content of what is written in a tweet is neither
predefined nor enforced; this practically infinite combination of words and letters exemplifies unstructured data. As a whole, the tweet is therefore semi-structured data.
Data are also classified by their source. FSPs tend to categorize data sources as either traditional or non-traditional, where traditional data sources refer to internal data sources such as core account management system transactions, client surveys, registration forms, or demographic information. Traditional data sources also includes external sources such as credit bureaus. They are typically structured data. Non-traditional data, or alternative data, can be structured, semi-structured or unstructured, and they may not always be related to financial services usage. Examples of these kinds of data include voice and short message service (SMS) usage data from MNOs, satellite imagery, geospatial data, social media data, emails, or other proxy data. These types of data sources are increasingly used by FSPs to extend or deepen customer understanding, or are used in combination with traditional data for operational insights. For example, an MFI that wishes to partner with a dairy cooperative to extend loans to dairy farmers might use milk yields as a proxy for salary in order to assess the ability to provide credit to farmers who lack any formal credit history.8
8 Transcript of the session ‘Deploying Data to Understand Clients Better’ The MasterCard Foundation Symposium on
Financial Inclusion 2016, accessed April 3 2017 http://mastercardfdnsymposium.org/resources/

18 DATA ANALYTICS AND DIGITAL FINANCIAL SERVICES
Big data is typically the umbrella term used to describe the vast scale and unprecedented nature of the data that are being produced. Big data has five characteristics. Early big data specialists identified the first three characteristics listed below and still refer to ‘the three-Vs’ today. Since then, big data characteristics have grown to the longer list of five:
1. Volume: The sheer quantity of data currently produced is mindboggling. The maturity of these data are also increasingly young, meaning that the amount of data that are less than a minute old is rising consistently. It is expected that the amount of data in the world will increase 44 times between 2009 and 2020.
2. Velocity: A large proportion of the data available are produced and made available on a real-time basis. Every minute, 204 million emails are sent. As a consequence, these data are processed and stored at very high speeds.
3. Variety: The digital age has diversified the kinds of data available. Today, 80 percent of the data that are generated are unstructured, in the form of images, documents and videos.
4. Veracity: Veracity refers to the credibility of the data. Business managers need to know that the data they use in the decision-making process are representative of their customers’ needs and desires. It is therefore important to ensure a rigorous and ongoing data cleaning process.
5. Complexity: Combining the four attributes above requires complex and advanced analytical processes. Advanced analytical processes have emerged to deal with these large datasets.
What is Big Data?
1.1_DATA ANALYTICS AND METHODS

DATA ANALYTICS AND DIGITAL FINANCIAL SERVICES 19
Sources of DataThis section focuses on the key sources
of information that DFS providers might
consider for possible operational or market
insights. Importantly, a data source should
not be considered in isolation; combining
multiple sources of data will often lead to
an increasingly nuanced understanding of
the realities that the data encode. Chapter
2.2 on DFS data collection and storage
provides an overview of the most common
traditional and alternative sources of data
available to DFS providers.
Traditional Sources of Data
As mentioned above, FSPs have traditionally
sourced data from customer records,
transactional data and primary market
research. Much of the credit-relevant data
have been stored as documents (hard or
soft paper copies), and only basic customer
registration and banking activity data were
kept in centralized databases. A challenge
for FSPs today is to ensure that these types
of traditional data are also stored in a digital
format that facilitates data analysis. This
may require a change in how the data are
collected, or the introduction of technology
that converts data to a digital format.
Although new technology is available to
digitize traditional data, digitization may
be too big a task for legacy data.
Client and Agent Data
Practitioners collect a vast amount of information about their customers during registration and loan application processes for both business reasons and to comply with regulation. Similarly, they also collect information about their agents as part of the application process and during monitoring visits. For both categories, this may include variables such as gender, location and income. Some of these data are verified by official documents, while some are discussed and captured during interviews. In the case of borrowers, much of this client information is captured digitally in a loan origination system (LOS) or an origination module in the core banking system (CBS). It is surprisingly common for such information to remain only on paper or in scanned files.
Third Parties
Credit bureaus and registries are excellent sources of objective and verifiable data. They provide a credibility check on the information reported by loan applicants and can often reveal information that the applicant may not willingly disclose. Most credit bureau reports and public registries can now be queried online with relevant data accessed digitally. However, a challenge is that not all emerging markets have fully functioning credit reporting infrastructure.
Primary Market Research
Market research is generally used to better understand customers and market segments, track market trends, develop products, and seek customer feedback. It can be either qualitative or quantitative, and it may be helpful to understand both how and why customers use products. Mystery shopping is a common market research method to test whether agents provide good customer service, while some DFS providers seek direct customer feedback with surveys that create a Net Promoter Score gauging how willing customers are to recommend a product or service.
Call Center Data
Call center data are a good source for understanding what issues customers face and how they feel about a provider’s products and customer service. Call center data can be analyzed by categorizing call types and resolution times and by using speech analytics to examine the audio logs. Call center data are particularly useful to understand issues that customers, agents or merchants are having with products or new technology that has just
been launched.

20 DATA ANALYTICS AND DIGITAL FINANCIAL SERVICES
Transactional Databases
Transactional data offer information on
activity levels and product usage trends.
Simple comparisons of transaction by value
versus volume may offer very different
insights into consumer behavior. For FIs
such as banks or MFIs, data on customers’
usage of bank accounts (deposits, debits
and credits) and other services (cards, loans,
payments, and insurance) are normally
captured in the CBS. Use of bank accounts
and services leaves objective data trails
that can be analyzed for patterns signaling
different levels of financial capacity and
sophistication. Different usage patterns
may also signal different levels of risk.
To process loan applications, FIs may require
documentation from other institutions
such as credit bureaus, however these tend
to be on paper and are difficult to digitize.
Alternative Sources of Data
As more of our communication and business is done via mobile phones, tablets and computers, there are more sources of digitized data that may provide insight into the financial capacity and character of customers. These sources can tell us how people spend their time and money, and where and with whom they spend it.
MNO Call Detail Records (CDRs)
From their core operations, MNOs have access to CDRs and coordinates of Cell Towers. MNOs analyze CDRs to conduct targeted marketing campaigns and promotions and to adjust pricing, for example. At a minimum, a CDR includes 1) voice calls, talk time, data services usage and SMS data on sender, receiver, time, and duration, and 2) airtime, data top-up information including time, location and
denomination. In addition, this information can be matched to cell tower signals to generate locations of customer activity. MNOs that offer mobile money services have access to both CDR data and the DFS transactional database, and when combined for analysis, this information is more likely to help predict customer activity and usage than simple demographic data. In some markets, MNOs and FSPs partner with each other to benefit from the combined data. Airtime top-ups can, for example, be a good indicator of discretionary income. Customers who run their airtime down to zero and routinely and frequently make small top-ups are likely to have less discretionary income than those who top-up less frequently but in larger installments.
Figure 2: Examples of Prominent Data Formats Used in Data Analytics
1.1_DATA ANALYTICS AND METHODS
Number Image Text Voice Biometric

DATA ANALYTICS AND DIGITAL FINANCIAL SERVICES 21
Agent-assisted Transaction Data
Understanding which locations and agents are the most active can provide insights to help improve agent network performance. For many DFS providers, agents are the primary face to the customer, and tracking the pattern of agent usage and activity may reveal insights about both customer preferences and agent performance. Such information may be directly recorded from mobile phones, point of sale (POS) devices or transaction-point computers. Alternatively, it could be indirectly associated, such as agent registration forms, needing to be merged into the transactional data pipeline for an analysis to be conducted.
Geospatial Data
Geospatial data refers to data that contain locational information, such as global positioning system (GPS) coordinates, addresses, cities, and other geographic or proximity identifiers. In recent years, very granular geospatial data have allowed DFS providers to examine and cross-reference
demand-side factors such as level of financial inclusion, customer location, levels of poverty, and mobile voice and data usage, with supply-related factors such as agent activity, rural or urban characteristics, presence of infrastructure, and similar. This can offer insights that may be helpful to customer acquisition and marketing strategies, agents or branch expansion, and competitor or general market analysis. Geospatial data can offer more granular insights than typical socio-economic indicators, which are generally only available in aggregate format.
Social Media Profiles
Increasingly, potential and existing customer markets are developing online and maintain a presence on social media sites such as Facebook, Twitter and LinkedIn. Online behavior data may offer information on customer feedback, attitudes, lifestyles, goals, and how financial services can play a role in customer lives. Social media network data include data on social connectedness, traffic initiated,
and online web behavior including the timing, location, frequency, and sequence of a website or a series of websites. Social media may also be indicative of an individual’s socio-economic status. For example, people with a LinkedIn profile that has many connections may, on average, be lower-risk than those without. That is not because signing up for a LinkedIn account indicates an ability to service debt per se, but rather because LinkedIn targets professionals and, on average, professionals earn higher wages than laborers. Public profiles from social media can also be useful to verify contact details and basic personal customer information. Social media as a data source has its limitations though. FSPs can generally only gain access to the social media accounts of customers who opt in, and it may be difficult to get enough customers to agree to this to build a large enough database for meaningful analysis. Some customers may also not be active on social media, because of choice or circumstances. Profile data, even when available, may also be biased.

22 DATA ANALYTICS AND DIGITAL FINANCIAL SERVICES
Sources of Operational Data
There are many business processes required to run a DFS operation, with each department working towards completing tasks and meeting performance targets while relying on data from multiple sources. Possible external and internal data sources are illustrated in the figure below and listed in fuller detail in Chapter 2.2. Each department both generates and consumes data across this ecosystem. Some of the most important data sources are:
Core System Data
The core system provides the bulk of the data. The transactional engine is responsible for managing the workflow of transactions and interactions, sending as much granular data and metadata as feasible to the relevant databases. This includes the movement of funds plus fees and commissions, as well as any business rules around commission splits and tax rules. It should also provide fully auditable workflow trails of non-financial activities such as Personal Identification Number (PIN) changes, balance enquiries, mini-statements, and data downloads, as well as internal functions such as transfers of funds between accounts.
Business Intelligence (BI) System Reports
When DFS products are new and there is a
relatively low volume of data, it is common
for businesses to create customized
reports from raw data using simple tools
such as Excel. As the business and data
grow, and the analysis required becomes
more complex, this soon becomes
unmanageable. Most large DFS systems
will put in place a data warehouse that uses
BI systems to draw on multiple sources of
data, which come with some basic reports
as well as the ability to customize.
Technical Log Files
A rich source of data can be found in the
technical log files. More advanced DFS
providers proactively use dashboards to
continuously assure system health and
provide early fault detection. It is also
common to have performance monitors
and alerts built into the monitoring system
that can provide valuable information.
Providers that only access these data when
specific forensic analysis is required miss
out on available and useful data.
Peripheral Internal Data
Private Branch Automatic Exchange (PBAX) Data
The PBAX controls the calls coming into a call center, and it can provide data on the volume of incoming calls, number of calls dropped before they are answered and the amount of time spent on calls. These data are vital for the efficient planning of shift patterns and size, as well as overall team performance measurement and improvement.
Ticketing Systems
The ticketing system tracks the process of resolving business problems, and provides a wealth of information, from the types of problems that occur, to issue
resolution times.
1.1_DATA ANALYTICS AND METHODS

DATA ANALYTICS AND DIGITAL FINANCIAL SERVICES 23
Data Privacy and Customer ProtectionThe new analytical and data collection methodologies raise several questions related to customer privacy rights and consumer protection. First, as discussed earlier, much of the data produced and collected are done so passively, that is to say, without the knowledge of the producer of the data. Sometimes, these data can be shared with third parties without the knowledge of the data producer. This can have negative implications on the individual’s ability to obtain loans or insurance. The problem is compounded when the individual is unaware of this negative information or does not have recourse to dispute the negative information. There are currently no standard opt-in policies for data sharing. Some DFS providers with apps that are installed on the mobile phones of their customers may be able to sweep customer internet usage information and other data including SMS messages, contacts and location data, among others.
With the diversity of DFS providers, not all providers fall under the same supervisory regime, thereby leading to differing data privacy policies for each. Some of the breaches to individual rights to privacy could have negative reputational impacts.
In Kenya, many digital credit providers have emerged to meet the demand for credit, but operate outside the regulatory purview of the central bank.9 One such provider included in their terms and conditions that the provider was free to post the names of defaulters on their website and post directly to the social media walls of defaulters. In cases such as this one, customers may not be aware that they are agreeing to suspend their privacy rights until it is too late. This can be particularly true in developing country contexts where both literacy and awareness of the issues are low.
Notably, even in countries where user consent is prevalent, consumers may not understand the permissions they are granting. As an example, users in sophisticated markets may not be aware of all of the applications in their smartphone that make use of location data. Research shows that 80 percent of mobile users have concerns over sharing their personal information while using the mobile internet or apps.10 Nevertheless, 82 percent of users agree to privacy notices without reading them because they tend to be too long or use terminology that is unfamiliar. Due to security concerns and the stated willingness of customers to stop using apps they find too intrusive or lacking in security, most apps nowadays offer simple ways to opt in and opt out.
9 Ombija and Chege, ‘Time to Take Data Privacy Concerns Seriously in Digital Lending’, Consultative Group Against Poverty Blog, October 24, 2016, accessed April 3, 2017,
https://www.cgap.org/blog/time-take-data-privacy-concerns-seriously-digital-lending10 ‘Mobile Privacy: Consumer research insights and considerations for policymakers’, GSMA
Figure 3: Example of Request to Save and Access User Location History Data via Google Maps App

24 DATA ANALYTICS AND DIGITAL FINANCIAL SERVICES
Privacy laws, where they exist, vary widely by jurisdiction and even more so by degree of enforcement. In the context of developed markets, in the European Union (EU) the right to privacy and data protection is heavily regulated and actively enforced,11 while in the United States no
comprehensive federal data protection law exists. The EU issued data protection regulations in 2016, which mandate that all data producers should be able to receive back the information they provide to companies, to send the information to other companies, and to allow companies
to exchange the information with each other where technically possible.12 This kind of regulation provides empowerment to the consumer while enhancing competition, as consumers can now move between providers with their transaction history intact. In the United States, the
Figure 4: Examples of Smartphone Application Permissions Settings
Camera
Contacts
Location
Microphone
Phone
SMS
Storage
App Permissions App Permissions App Permissions
ON
ON
ON
OFF
OFF
OFF
OFF
Body Sensors
Camera
Contacts
Location
Microphone
Phone
SMS
Calendar
Camera
Contact
Location
Microphone
Phone
SMS
ON
ON
OFF
OFF
OFF
ON
ON
ON
ON
OFF
OFF
OFF
OFF
ON
11 Regulation governing data protection in the EU includes the EU Data Protection Directive 95/46 EC and the EU Directive on Privacy and Electronic Communications 02/58 EC
(as amended by Directive 2009/136)12 Regulation (EU) 2016/679 of the European Parliament and of the Council (2016), accessed April, 3 2017,
http://eur-lex.europa.eu/legal-content/EN/TXT/PDF/?uri=CELEX:32016R0679&from=EN
1.1_DATA ANALYTICS AND METHODS

DATA ANALYTICS AND DIGITAL FINANCIAL SERVICES 25
Federal Trade Commission (FTC) is the regulating body on data privacy. However, the FTC Code of Fair Information Principles is only a set of recommendations for maintaining privacy-friendly, consumer-oriented data collection practices – it is not enforceable by law. In the absence of any federal overarching privacy rule, the United States has developed federal and state statutes and regulations to address personal information privacy and data security, both in a general sense and on an industry-sector basis to which every relevant business must adhere.
When it comes to Sub-Saharan Africa, Ghana, South Africa and Uganda seem to stand out as having the best regional practices. What sets these three countries apart is the fact that regulation is guided by a customer centricity principle and, as such, regulation focuses on:
• Empowering the consumer to make pertinent decisions about their personal data usage, especially in relation to automated decision-making
• Stipulating clear mechanisms through which the consumer can seek compensation
• Giving the customer the ‘right to be forgotten’
Cross-border flows of data constitute a delicate issue, especially as they can affect national security matters. Regulation in countries such as Angola, South Africa and Tanzania specifically stipulates that data can only be transferred to countries where the law provides the same or higher standards of protection for the personal data in question. Zambia goes even further by forbidding any off-shore transfers of data that are not anonymized.13 At the other end of the spectrum, the proposed Kenya Bill on Data Protection of 2016 has been harshly criticized by experts for including no provision for extraterritorial jurisdiction.14
Nevertheless, customer data privacy is a new policy area, and countries such as Mozambique and Zimbabwe still rely on the Constitution to interpret privacy rights as a result of not having dedicated regulatory bills. In this context, emerging markets frequently look to more established markets and regulators for cues on how to address the issues at hand.
Given this context, but aware of the differences between technology usage in emerging and developed markets, the United Nations (UN) has offered some general guidance in terms of policy
development. The UN emphasizes the need to accelerate the development and adoption of legal, technical, geospatial, and statistical standards in regard to:
• Openness and the exchange of metadata
• Protection of human data rights15
Thus, at the moment, no uniform policy exists to govern data privacy issues. The first step to understanding privacy’s implications is to ensure a sector-wide discussion involving DFS providers, regulators, policymakers, other public sector stakeholders, investors, and development FIs in order to devise solutions and standards. At the same time, in the financial inclusion sector, DFS providers must acknowledge that while data represent an opportunity to improve the bottom line, they also underscore an obligation to add value. This can be achieved by using the data to improve access to financial services. DFS providers can attempt to educate the people about how their personal information will be used while only collecting information that is necessary.
13 ‘Global Data Privacy Directory’, Norton Rose Fulbright14 Francis Monyango, ‘Consumer Privacy and data protection in E-commerce in Kenya’, Nairobi Business Monthly, April 1, 2016, accessed April 3, 2017,
http://www.nairobibusinessmonthly.com/politics/consumer-privacy-and-data-protection-in-e-commerce-in-kenya/15 ‘A World That Counts: Mobilizing the Data Revolution for Sustainable Development’, United Nations Secretary-General’s Independent Expert Advisory Group on a Data Revolution
for Sustainable Development

26 DATA ANALYTICS AND DIGITAL FINANCIAL SERVICES
Data Science: IntroductionData science is the interdisciplinary use of scientific methods, processes and systems to extract insights and knowledge from various forms of data to solve specific problems. It combines numerical science such as statistics and applied mathematics, with computer science and business and
sector expertise. It is an exploratory and creative discipline, driven to find innovative solutions to complex issues through an analytical approach. The science of data refers to the scientific method of analysis: data scientists engage in problem solving by setting a testable hypothesis and assiduously testing and refining that hypothesis to obtain reliable and validated results.
Makeobservations
What do I see in nature? This can be from one’s
own experiences, thoughts or reading.
Figure 5: The Scientific Method, the Analytic Process that is Similarly Used for ‘Data Science’
Thinking of interesting questions
Why does that pattern occur?
Formulate hypotheses
What are the general causes of the
phenomenon I am wondering about?
Develop testable predictions
If my hypothesis is correct then I expect
a,b,c.
Gather data totest predictions
Relevant data found from literature, new
observations / formal experiments.
Thorough testing required replication to verify results.
Communicate results
Draw conclusions and report findings for others
to understand and replicate.
Refine, alterexpand or reject
hypotheses
01
02
03
04
05
06
1.1_DATA ANALYTICS AND METHODS

DATA ANALYTICS AND DIGITAL FINANCIAL SERVICES 27
The term data scientist was coined in 2008 by DJ Patil and Jeff Hammerbacher to describe their job functions at LinkedIn and Facebook. They emphasized that their roles were not just about crunching numbers and finding patterns in those numbers, but they applied a creative
and exploratory process to build connections across those patterns. “Data science is about using complex data to tell stories,” said Patil, adding that it drew as much from journalism as from computer science. For this reason, Patil and Hammerbacher considered an alternative title for their jobs: Data Artist.
Data Science
Figure 6: Data Science, the Intersection of Several Disciplines
In order to deliver BI, all data-related analysis must start by defining business goals and identifying the right business questions, or hypothesis. The scientific method provides helpful guidance (see Figure 5). Importantly, it is not a linear process. Instead, there is always a learning and feedback loop to ensure incremental improvement. This is key to obtaining insights that enable evidence-based and reliable decision-making. Chapter 2.1 of this handbook provides a step-by-step process for implementing data projects for DFS providers, utilizing the Data Ring methodology.
Data science facilitates the use of new methods and technologies for BI, and
useful insights can be derived from data large and small, traditional and alternative. Faster computers and complex algorithms augment analytic possibilities, but neither replace nor displace time-tested tools and approaches to deliver data-driven insights to solve business problems. Rather, it is important to understand the strengths that different tools offer and to augment them appropriately to obtain the desired results in a timely and cost-efficient manner.
Figure 7 provides a high-level description of BI analytical methods, classified by their operational use and relative sophistication. Many categories and their associated techniques and implementations overlap, but it is still useful to break them into four
principle use cases: descriptive, diagnostic,
predictive, and prescriptive. The least complex
methodologies are often descriptive in
nature, providing historical descriptions
of institutional performance, aggregated
figures and summary statistics. They are
also least likely to offer a competitive
advantage, but are nevertheless critical for
operational performance monitoring and
regulatory compliance. On the opposite
end, the most innovative and complex
analytics are prescriptive, optimized for
decision-making and offering insights
into future expectations. This progression
also helps to classify the deliverables and
implementation strategy for a data project,
which is discussed further in Chapter 2.1.
Statistics /
Mathematics
Computer
ScienceBusiness
Expertise
DataScience

28 DATA ANALYTICS AND DIGITAL FINANCIAL SERVICES
Data Science Analytic Framework for Business Intelligence
Figure 7: The Four Categories of Business Analytics
Descriptive Diagnostic Predictive Prescriptive
Tech
niq
ues
Com
peti
tive
Adv
anta
ge
Alerts, querying, searches, reporting, static visualizations, dashboards, tables, charts, narratives, correlations, simple statistical analysis
Regression analysis, A B testing, pattern matching, data mining, forecasting, segmentation
Machine learning, SNA, geospatial pattern recognition, interactive visualizations
Graph analysis, neural networks, machine and deep learning, AI
DescriptiveAnalytics
DiagnosticAnalytics
PredictiveAnalytics
PrescriptiveAnalytics
Information Optimization
Complexity of Analytics
What happened?What is happening now?
Why did it happen?
What will happen in the future?
How can we make it happen?
Reports
Traditional BI
Modeling
Integrated systems
1.1_DATA ANALYTICS AND METHODS

DATA ANALYTICS AND DIGITAL FINANCIAL SERVICES 29
MethodsThe analytical use cases outlined in Figure 7 help determine the method, time, cost, and complexity of data projects. The following methods are generally included in the data scientist’s toolbox, and help to match broad methods with analytical purposes. These methods are especially relevant for discussions with external consultants or solutions providers to help frame what they are delivering or to evaluate a proposal.
Descriptive Analytics
Descriptive analysis offers high-level aggregate reports of historical records and answers questions about what occurred. Key Performance Indicators (KPIs) are also within this category.
• Descriptive Statistics: Also known as summary statistics, descriptive statistics include averages, summations, counts, and aggregations. Correlation statistics that show relationships between variables also help to describe data.
• Tabulation: The process of arranging data in a table format is known as tabulation. Cross-tabulation summarizes data from one or more sources into a concise format for analysis or reporting, often aggregating values. It is a method for segmentation, allowing aggregates
to be tabulated by gender or location, for example, or other segments of interest. Excel uses the term ‘pivot table’ to describe this type of analysis.
Diagnostic Analytics
Finding key drivers or understanding changing data patterns is diagnostic analysis. It is about asking why something happened; for example, asking why transaction patterns changed to determine if there is not only correlation, but causation. Diagnostic analysis usually requires more sophisticated methods and research designs, as described below.
• A | B Testing: This is a statistical method where two or more variants of an experiment are shown to users at random to determine which performs better for a given conversion goal. A|B testing allows businesses to test two different scenarios and compare the results. It is a very useful method for identifying better promotional or marketing strategies between tested options.
• Regression: Statistical regression is one of the most basic types of modeling, and is very powerful. It enables multi-variable analysis to estimate relationships between a dependent variable, usually
a metric of business interest, and a set of independent variables with which it correlates. Identifying statistically significant16 variables can guide strategy, focus goals and estimate outcomes.
• Segmentation: Segmentation is a method of classifying groups into sub-groups based on defined criteria, behavior or characteristics. Segmentation can help to identify customer demographic or product usage categories, with quantified and statistically meaningful thresholds. This is often used in conjunction with regression analysis or more sophisticated modeling techniques to predict to which segment an as-yet-unidentified prospective customer could belong.
• Geospatial: This method groups data according to their location on a map, or in relationship to place and proximity. This can also help to identify customer and behavioral segments, such as from where and to where they send money, or which branches they tend to visit. Combined with more advanced techniques it can also enable location-based services to proactively engage customers who are near people or places of interest.
16 Statistically significant is the likelihood that a relationship between two or more variables is caused by something other than random chance
30 DATA ANALYTICS AND DIGITAL FINANCIAL SERVICES
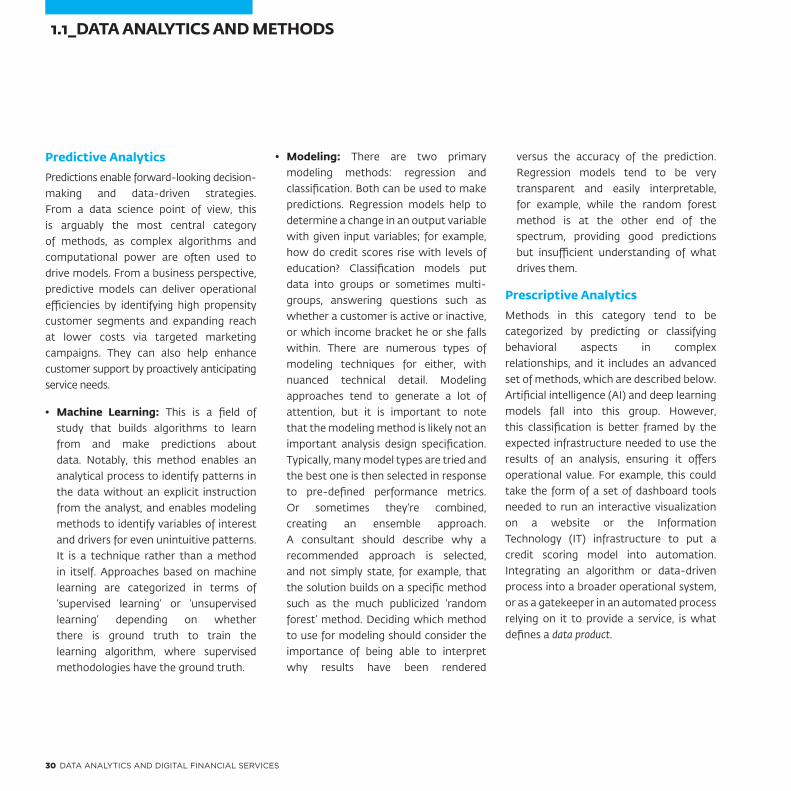
Predictive Analytics
Predictions enable forward-looking decision-making and data-driven strategies. From a data science point of view, this is arguably the most central category of methods, as complex algorithms and computational power are often used to drive models. From a business perspective, predictive models can deliver operational efficiencies by identifying high propensity customer segments and expanding reach at lower costs via targeted marketing campaigns. They can also help enhance customer support by proactively anticipating service needs.
• Machine Learning: This is a field of study that builds algorithms to learn from and make predictions about data. Notably, this method enables an analytical process to identify patterns in the data without an explicit instruction from the analyst, and enables modeling methods to identify variables of interest and drivers for even unintuitive patterns. It is a technique rather than a method in itself. Approaches based on machine learning are categorized in terms of ‘supervised learning’ or ‘unsupervised learning’ depending on whether there is ground truth to train the learning algorithm, where supervised methodologies have the ground truth.
• Modeling: There are two primary modeling methods: regression and classification. Both can be used to make predictions. Regression models help to determine a change in an output variable with given input variables; for example, how do credit scores rise with levels of education? Classification models put data into groups or sometimes multi-groups, answering questions such as whether a customer is active or inactive, or which income bracket he or she falls within. There are numerous types of modeling techniques for either, with nuanced technical detail. Modeling approaches tend to generate a lot of attention, but it is important to note that the modeling method is likely not an important analysis design specification. Typically, many model types are tried and the best one is then selected in response to pre-defined performance metrics. Or sometimes they’re combined, creating an ensemble approach. A consultant should describe why a recommended approach is selected, and not simply state, for example, that the solution builds on a specific method such as the much publicized ‘random forest’ method. Deciding which method to use for modeling should consider the importance of being able to interpret why results have been rendered
versus the accuracy of the prediction. Regression models tend to be very transparent and easily interpretable, for example, while the random forest method is at the other end of the spectrum, providing good predictions but insufficient understanding of what drives them.
Prescriptive Analytics
Methods in this category tend to be categorized by predicting or classifying behavioral aspects in complex relationships, and it includes an advanced set of methods, which are described below. Artificial intelligence (AI) and deep learning models fall into this group. However, this classification is better framed by the expected infrastructure needed to use the results of an analysis, ensuring it offers operational value. For example, this could take the form of a set of dashboard tools needed to run an interactive visualization on a website or the Information Technology (IT) infrastructure to put a credit scoring model into automation. Integrating an algorithm or data-driven process into a broader operational system, or as a gatekeeper in an automated process relying on it to provide a service, is what defines a data product.
1.1_DATA ANALYTICS AND METHODS

DATA ANALYTICS AND DIGITAL FINANCIAL SERVICES 31
Researchers at the search engine Google wondered if there could be a correlation between people searching for words such as ‘coughing,’ ‘sneezing’ or ‘runny nose’ – symptoms of flu – and the actual prevalence of influenza. In the United States, the spread of influenza has lagging data; people fall sick and visit the doctor, then the doctor reports the statistics, and so the data capture what has already happened. Could models driven by search words provide real-time data as influenza was actually spreading? This approach to reducing time lags in data is known as nowcasting. For issues such as seasonal flu, the public health
benefits are obvious. The model was a success and was released publicly as Google Flu Trends. Google’s impressive big data modeling was prominently featured in the scientific journal Nature in 2008. Six years later, however, the failure of the same model was prominently described in the journal Science. What happened between 2008 and 2014?
The number of internet users grew substantially over these six years and the search patterns of 2008 did not remain constant. The core issue was that Google Flu Trends was developed using unsupervised machine learning techniques: 45 search phrases drove
the model, identified as statistically powerful correlations in 2008. But many of these search terms were actually predictors of seasons, and seasons in turn correlated with the flu. When flu patterns shifted earlier or later than had been the case in 2008, those search terms were no longer correlating as strongly with the flu. Combined with changing user demographics, the model became unreliable. Google Flu Trends was left on autopilot, using unsupervised learning methods, and the statistical correlations weakened over time, unable to keep up with shifting patterns.
Industry Lessons: Google’s Got the FluPredictive Modeling and Model Tuning: Reliability Risks of Unsupervised Models
When using similar methods for business decisions or for public health matters, it is important to keep in mind that loss of reliability over time can present significant risks.

32 DATA ANALYTICS AND DIGITAL FINANCIAL SERVICES
• Text Mining (Natural Language Processing): Text mining is the process of deriving high-quality information from text. Text may help to identify customer opinions and sentiments about products using social media posts, twitter or customer relationship management (CRM) messages. Natural Language Processing (NLP) combines computational linguistics and AI methods to help computers understand text information for processing and analysis.
• Social Network Analysis (SNA): This is the process of quantitative and qualitative analysis of a social network. For business purposes, SNA can be employed to avoid churn, detect fraud and abuse, or to infer attributes, such as credit worthiness based on peer groups.
• Image Processing: This approach uses computer algorithms to perform analysis for the purpose of classification, feature extraction, signal analysis, or pattern recognition. Businesses can use this to recognize people in pictures to help with fraud detection, or to detect geographic features relevant for agent placement using satellite images.
ToolsData science and its methods are developed with computer programming languages, or the algorithms run on computational platforms. The data that feed these algorithms is drawn from databases. The data scientist’s toolkit also includes hard knowledge about technical computing and the soft skills required to develop and deploy data algorithms. The technical specifications of these tools are beyond the scope of DFS data analytics. Nevertheless, some prominent technologies are highlighted to note a few tools that data scientists are likely to use. Successful data products require a combination of methods, tools and skills, as will be further discussed in Chapter 2.1: Managing a Data Project.
Hard Tools
• Databases: The structure of the data will guide the appropriate database solution. Structured data are typically served by relational databases with fixed schemas that can support integral data reliability, which can help analysts identify data value anomalies – or prevent them from saving erroneous data in the first
The Random Forest Method
The random forest method has generated a lot of excitement in data science because
it tends to drive highly accurate models. It is a form of classification model that uses a tree-type or flowchart-type decision structure combined with randomized selection approaches to identify an optimal path between the desired result and a ‘forest’ set of input variables. It is important to understand that some data science modeling methods are easily understood in a business context, while others are not. The random forest method may, for example, generate highly accurate models, but its complexity yields a ‘black box’ that makes it very difficult to interpret. This could potentially be problematic for a credit scoring model; it might identify the most credit-worthy people given the input data, but may not help to describe what makes these people credit-worthy or what determines the credit recommendation.
1.1_DATA ANALYTICS AND METHODS

DATA ANALYTICS AND DIGITAL FINANCIAL SERVICES 33
place. Relational databases organize datasets into tables that are related to each other by a key, that is, a metadata attribute shared across the tables. Enterprise data warehouse solutions and transaction data storage commonly use relational databases. Prominent products include: Oracle, SQL Server and MySQL. Unstructured data are typically served by non-relational databases that lack rigid schemas, commonly referred to as NoSQL databases. They provide advantages in scale and distribution, and are often relied on for big data and interactive online applications. As big datasets get bigger, hard disk space becomes limited and the computational time it takes to search takes longer. The advantage of NoSQL databases is that they are designed to be horizontally scalable, meaning that another computer, or two, or a hundred, can be seamlessly added to grow the storage space and computer power to search them. While relational solutions can also be scaled and distributed, they’re often more complex to manage and tune when data are saved across multiple computers. Prominent NoSQL products include: Hadoop, MongoDB and BigTable.
• Frameworks: These are sets of
software packages that combine a data
storage solution with an application
programming interface (API) that
integrate management or analytical
tools into the database. In other words,
these are single-source solutions to
manage and analyze data. Prominent
products include Spark and Hive. Hadoop,
mentioned above, is something between
a NoSQL database and a framework.
It is used to manage and scale distributed
data using a search approach known as
MapReduce, a method developed by
Google to store and query data across
their vast data networks.
• Cloud Computing: Third-party vendors
offer hosting solutions that provide
access to computational power, data
storage and frameworks. This is an
excellent solution for firms that want
to engage in more sophisticated data
analytics, especially big data, but do not
have the ability to invest in computer
servers and hire technicians to manage
them. Prominent products include:
Amazon Web Services (AWS), Cloudera,
Microsoft Azure and IBM SmartCloud.
Soft Tools• Languages: ‘R’ and Python are two
programming languages that have become essential to data science. Both offer the benefits of fast prototyping and exploratory analysis that can get data projects quickly up and running. Both also include add-on libraries built for data science, enabling sophisticated machine learning or modeling techniques with relative programming simplicity. Frameworks and databases also have their own sets of programming languages. SQL is needed for relational database systems, while other solutions may require Java, Scala, Python, or for Hadoop, Pig.
• Design and Visualization: Core data science languages usually include visualization libraries to help explore data patterns and to visualize final results. As many data projects produce interactive dashboards or data-driven monitoring tools, a number of vendors offer turnkey solutions. Some product providers include: IBM, Microsoft, Tableau, Qlik, Salesforce, DataWatch, Platfora, Pyramid, and BIME, among others, some of which are exemplified in the operational case studies in Chapter 1.2.

34 DATA ANALYTICS AND DIGITAL FINANCIAL SERVICES
Resources
Managing a
& m
ethods
Dat
a analytics
applications
data project
Data
PART 1 Chapter 1.2: Data Applications for DFS Providers
This chapter covers the three main areas in which data analytics allows firms to be customer-centric, thus building a better value proposition for the customer and generating business value for the DFS provider. It looks first at the role data insights can play in improving the DFS provider’s understanding of its customers. Second, it illustrates how data can play a greater role in the day-to-day operations of a typical DFS provider. Finally, it discusses the usage of alternative data in credit assessments and decisions. These sections will present a number of use cases to demonstrate the potential data science holds for DFS providers, but they are by no means exhaustive. The business possibilities that data science offer are limited only by the availability of the data, methods and skills required to make use of data. Presented below are a number of examples to encourage DFS providers to begin to think about ways in which data can help their existing operations reach the next level of performance and impact.
Figure 8 illustrates how data analytics can play a role in supporting decision-making throughout a DFS business, along the customer lifecycle and corresponding operational tasks. As such, data play a key role in helping DFS providers become more customer-centric. It goes without saying that all organizations depend on customer loyalty. Customer centricity is about establishing a positive relationship with customers at every stage of the interaction, with a view to drive customer loyalty, profits and business. Essentially, customer-centric services provide products that are based on the needs, preferences and aspirations of their segment, embedding this understanding into the operational processes and culture.

DATA ANALYTICS AND DIGITAL FINANCIAL SERVICES 35
Acquire
Target the customers most likely to take
up DFS
Figure 8: Opportunities for Data Applications Exist Throughout the Customer Life Cycle
Measure marketing impactInspire
DevelopRetainImprove
customer activity
Building closer relationships with
valuable customers
Pricing strategy
Examinecustomer feedback
Building loyalty programs
Reduce customer attribution
Identify need for product/process enhancements
Predicting customer behavior
Customer- Centric DFS
Provider
The Customer Life Cycle

36 DATA ANALYTICS AND DIGITAL FINANCIAL SERVICES
Being responsive to customers is key to customer centricity. It is useful to understand why customers leave and when they are most likely to leave so that appropriate action can be taken. Some customers will inevitably leave and become former customers. Using data analytics to understand how these customers have behaved throughout the customer lifecycle can help providers develop indicators that will alert the business when customers are likely to lapse. It may also offer insights into which of these customers the provider may be able to win back and how to win them back.
DFS providers often cater to people who previously lacked access to banks or other financial services as well as other underserved customers. This poses special challenges for providers as they first establish trust and faith in a new system for their customers. Such customers may have irregular incomes, be more susceptible to economic shocks and may have different expenditure trends. Finally, the need for
consumer protection for this segment is higher because they could have less access to information, lower levels of literacy, and higher risk for fraud when compared to other segments. DFS providers will need to understand the particular needs of these customers and then design operational processes that reflect this understanding. Thus, understanding customers and delivering customer value is crucial for DFS providers, and data can help them become more customer-centric.
1.2.1 Analytics and Applications: Market InsightsThis section demonstrates how to use data to develop a more precise and nuanced understanding of clients and markets, which in turn can help a provider to develop products and services that are aligned with customer needs. As described in the previous chapter, DFS providers have access to valuable customer data in a variety of
forms. These data can be manipulated and analyzed to offer granular market insights. Such analysis usually involves a diverse set of methods, and both quantitative and qualitative data. This section starts with a case study to illustrate how small steps to incorporate a data-driven approach can bring greater precision to understanding customer preferences. It is followed by a discussion on how data can be used to understand customer engagement with a DFS product in order to improve customer activity and reduce customer attrition. Next, it explains how to use customer segmentation to identify specific groups within the customer base and how to use this knowledge to improve targeting efforts. This is followed by a discussion of how DFS providers can harness new technologies to predict financial behavior and improve customer acquisition. Finally, this section examines ways to interpret customer feedback to improve existing products and services.
1.2_DATA APPLICATIONS

DATA ANALYTICS AND DIGITAL FINANCIAL SERVICES 37
Zoona is a PSP with operations in Zambia, Malawi and Mozambique, where it aims to become the primary provider of money transfers and simple savings accounts for the masses. Marketing is often a time-consuming and resource-intensive activity, and it can be difficult to measure impact. Zoona dealt with some of these challenges by using a customer-centric approach to test three different marketing strategies for a new deposit product called Sunga. First, it ran a three-month pilot of the Sunga product in one area, later extending the pilot to another three towns to test three different marketing strategies, all in order to identify the most impactful approach for the nationwide launch.
The first strategy was called ‘Instant Gratification’, and it awarded all customers opening an account a free bracelet as well as a high chance of receiving a small cashback reward each time they made a deposit. In the second strategy, called ‘Lottery’, customers had a low chance of winning a large prize, with only four winners selected over two months. The third approach involved account-opening ambassadors who went to high-activity areas, such as markets, to encourage people to open accounts.
Statistics from the first month of this extended pilot are presented below. The numbers have been indexed against the initial pilot town, so 1.3
indicates results 30 percent better than the baseline pilot. The analysis shows that the lottery methodology was the least popular, while the highest number of opened accounts was credited to the ambassador strategy. These accounts also had high deposit values. Zoona also looked at customer activity rates, measured as the number of deposits per account. The instant gratification approach was the clear winner. In Figure 9, November 24, is the date depositors began winning small cashback rewards every time they deposited into their accounts: the blue line shows deposits rising significantly.
CASE 1Zoona - Testing Marketing Strategies for Optimal ImpactDeveloping Hypotheses for Successful Marketing Messages and Testing Them
Comparing Marketing Strategies, Results Table
INDEXED (first 30 days) # Registrations Deposit Value
Pilot 1.0 1.0
P1: Instant Gratification 1.4 1.9
P2: Lottery 1.1 1.8
P3: Ambassador 3.0 3.8
Table 1: Comparing Results, ‘ambassador’ strategy increases account openings 300% over baseline

38 DATA ANALYTICS AND DIGITAL FINANCIAL SERVICES
The outcome of the analysis was further supported by follow-up calls to customers. The feedback revealed that instant gratification also drove word-of-month marketing, as 88
percent of those in the instant gratification group told a family or friend about the product. As a result, the nationwide marketing strategy now combines both the ‘Ambassador’
and ‘Instant Gratification’ strategies – the first to drive account openings, and the second to drive customer activity levels.
Figure 9: Results of the Customer Incentives Marketing Campaign Testing Trials
PILOTP1: IGP2: LOTTERYP3: AMBASSADOR
Registration Town
Date
No.
Dep
osit
s pe
r A
ccou
nt Observe Rise in Blue Line
24 November 2016
Nov 01 Nov 14 Nov 28 Dec 01 Dec 14 Dec 28
2.0
1.9
1.8
1.7
1.6
1.5
1.4
1.3
1.2
1.1
1.0
This case study illustrates that a rigorous approach to test marketing strategies does not need to involve complicated methodologies. Rather, a systematic approach and planning using quick iteration of techniques measured by customer response rates can create measurable insights. It also highlights the benefit of combining methodologies to arrive at the desired customer behavior.
1.2_DATA APPLICATIONS
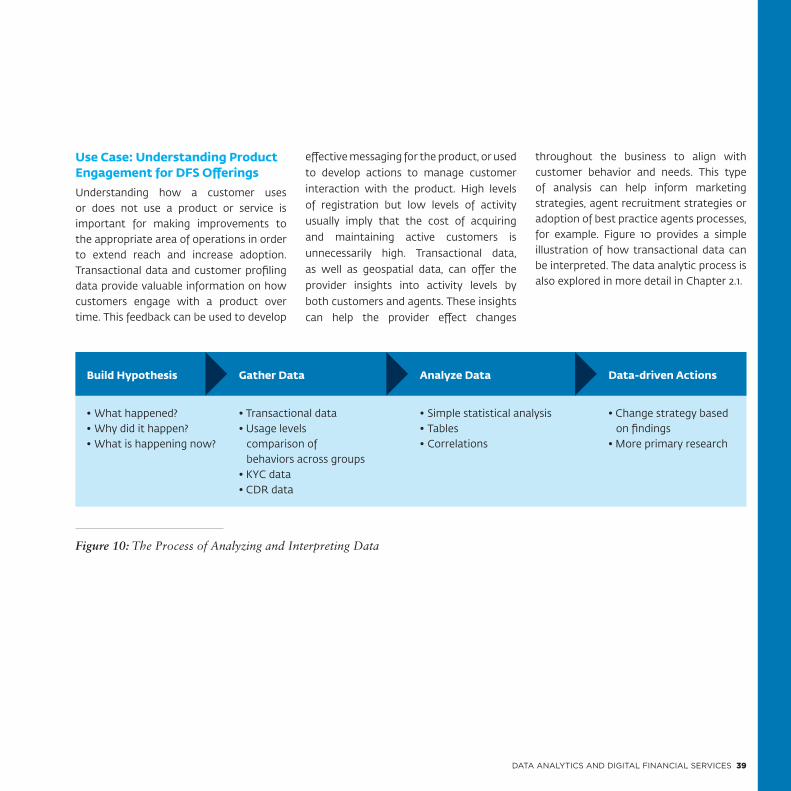
DATA ANALYTICS AND DIGITAL FINANCIAL SERVICES 39
Use Case: Understanding Product Engagement for DFS Offerings
Understanding how a customer uses or does not use a product or service is important for making improvements to the appropriate area of operations in order to extend reach and increase adoption. Transactional data and customer profiling data provide valuable information on how customers engage with a product over time. This feedback can be used to develop
effective messaging for the product, or used to develop actions to manage customer interaction with the product. High levels of registration but low levels of activity usually imply that the cost of acquiring and maintaining active customers is unnecessarily high. Transactional data, as well as geospatial data, can offer the provider insights into activity levels by both customers and agents. These insights can help the provider effect changes
throughout the business to align with customer behavior and needs. This type of analysis can help inform marketing strategies, agent recruitment strategies or adoption of best practice agents processes, for example. Figure 10 provides a simple illustration of how transactional data can be interpreted. The data analytic process is also explored in more detail in Chapter 2.1.
Build Hypothesis
• What happened?• Why did it happen?• What is happening now?
Gather Data
• Transactional data• Usage levels
comparison of behaviors across groups
• KYC data• CDR data
Analyze Data
• Simple statistical analysis• Tables• Correlations
Data-driven Actions
• Change strategy based on findings
• More primary research
Figure 10: The Process of Analyzing and Interpreting Data

40 DATA ANALYTICS AND DIGITAL FINANCIAL SERVICES
Improving Customer Activity
A simple transactional analysis as seen above may, for example, reveal that highly active customers are associated with specific agents. To be able to act on this information, it will be necessary to find out why this is the case. Could it be because of best practices adopted by the agents, because of geographical location, or because of some other variable? As an example, interviews could be conducted to better understand agent techniques, and geospatial data could be used to better understand the impact of location on agent and customer activity. Very high or very low activity groups often indicate the need for deeper research and focus group discussions to understand the reasons behind them.
Reducing Customer Attrition
Looking closely at transactional data can provide clues as to why customers are leaving the service and how to retain them. The frequency with which customers interact with a service can indicate whether they have just been acquired, are active customers of the service, or need to be won back into the service. Different messages and channels are relevant to customers in each of these stages. Generally, keeping existing customers is far less expensive
than acquiring new ones. Large numbers of never-transacted customers indicate inadequate targeting at the recruitment stage. A high number of lapsed customers may indicate other limitations in the service offering, which can be improved by small product or process enhancements.
Use Case: Segmentation
Segments can be delineated by demographic markers, behavioral markers such as DFS usage patterns, geographic data, or other external data from MNOs such as usage and purchase of airtime and data. Understanding segments is necessary to uncover needs and wants of specific groups as well as to design well-targeted sales and marketing strategies. Insights from segmentation, intended to expand revenue-generating prospects in each unique segment, are critical inputs for an institution’s strategic roadmap. Customer segmentation is a crucial aspect of becoming a customer-centric organization that serves customers well, makes smart investment decisions and maintains a healthy business.
In principle, many DFS providers recognize the importance of segmentation. However, in practice, most DFS providers either serve the mass market in developing
country contexts as one single segment, or use basic demographic segmentation to understand customers. The reason for the limited incorporation of segmentation into customer insight generation is twofold. First, beleaguered DFS providers in highly competitive markets may be encouraged by the success of certain products and may feel compelled to adopt a product-centric approach, rather than a customer-centric focus, to their businesses. Thus, DFS providers may neglect to think about the different possible uses for their offerings depending on customer needs and concerns. Rather, they may choose to highlight very particular use cases and messages for a product. For example, while M-Pesa’s mobile money transfer product was very successful in Kenya, MNOs in other markets have not had the same success, emphasizing the need to look at market and customer behavior and needs market-by-market before rolling out products. Second, there is a lack of awareness about how to effectively segment client base and how to use this segmentation analysis. Segmentation does not need to be complicated or expensive. Practitioners should clearly define business goals, which can lead the segmentation exercise.
1.2_DATA APPLICATIONS

DATA ANALYTICS AND DIGITAL FINANCIAL SERVICES 41
Customer Segmentation
Figure 11: Examples of DFS Customer Segments, by Product Activity
Super User
Sends money every two weeks to children studying in the city
NEEDS
Loyalty program
Passive User
Receives money from employer & withdraws immediately
NEEDS
Information on product
Lapsed User
Changed SIM, doesn’t understand product, used once, never used again
NEEDS
Information on product, additional help from agent
The following framework presented by the Consultative Group to Assist the Poor (CGAP) illustrates how different types of segmentation can be employed by a practitioner depending on their needs:17
Type of Segmentation
Example Data Needs Advantages Disadvantages
Demographic • Rural vs. Urban• Male vs. Female• Old vs. Young
Registration and Know Your Customer (KYC) information
• Simple• Data are easy to find
• Lack of uniformity within groups
• Less insightful
Behavioral • Never transacted vs. dormant vs. active users
• Savers vs. withdrawers
• Transactional DB • Data are easy to find• Easy to ascribe value to the
customer
• Lack of insight into the customer’s life, needs, aspirations
• Less useful for marketing messages
Demographic and Behavioral
• Students• Migrant workers sending
money home
• Registration and KYC information
• Transactional DB• Primary Market Research
• Ascribes value to a customer and provides insights on their life and needs
• Easier to develop marketing messages
• Data are relatively harder to find
• Might have overlapping segments
Psychographic • Women who want a safe place to save
• Customers who believe access to mobile money implies higher status
• Budget conscious
• Deep and rich historical transactional data
• Primary research
• Strongly responsive to customer aspirations
• Strong value proposition• Easier to develop marketing
messages
• Difficult to find data• Might have overlapping
segments• Could be very dynamic
segment, i.e., wants could change
17 CGAP (2016). Customer Segmentation Toolkit
Table 2: CGAP Customer Segmentation Framework

42 DATA ANALYTICS AND DIGITAL FINANCIAL SERVICES
Tigo Cash launched in Ghana in April, 2011, and is the second-largest mobile money provider in terms of registered users. Despite high registration rates, getting customers to do various transactions through mobile money remains a key challenge and focus. Client registration rates, and maintaining activity rates, remained a key goal after launching
the service. An actively transacting client base is not only a challenge in Ghana; the GSMA estimates global activity rates are as low as 30 percent.
In 2014, Tigo Cash Ghana partnered with IFC for a predictive analysis to identify mobile voice and data users that had high probability to become active mobile money users. To do this,
six months and nearly two terabytes of CDRs and transactional data were analyzed by a team of data scientists.
Results from the analysis suggest that differences exist between customers across a large number of metrics of mobile phone use, social network structure and individual and group mobility. There are strong differences
CASE 2Tigo Cash Ghana Increases Active Mobile Wallet UsageCustomer Segmentation Models Improve Customer Acquisition and Activation
Figure 12: Current, Predicted and Top Districts of Mobile Money Usage
District-Level Adoption Rate: Tigo Cash Predicted Adoption (based on CDR): Tigo Cash Top Target Districts: Tigo Cash
1.2_DATA APPLICATIONS

DATA ANALYTICS AND DIGITAL FINANCIAL SERVICES 43
An institutional approach to customer acquisition and retention can be fundamentally changed and improved, simply by making use of existing data to make more informed operational decisions.
between voice and data-only subscribers, inactive mobile money subscribers and active mobile money subscribers. A strong correlation can be observed between high users of traditional telecoms services and the likelihood of those users to also become active regular mobile money users.
With the help of machine learning algorithms, the research team identified matching profiles among voice and data-only customers who are not yet mobile money subscribers, but who are likely to become active users. The team also geo-mapped the data (see below) for further analysis. Moreover, the analysis of CDRs and transactional data was complemented by surveys to not only understand what happened, but why.
Determinants of Mobile Money Adoption
The need for further customer education and product adaptation is something that came out clearly through the individual surveys. Only a small proportion of mobile money users reported that agent non-availability
prevented them from using mobile money services. Low levels of usage were more closely linked to people’s lack of awareness of the mobile money value proposition or perceptions that they did not have enough money to use the services.
New Customers
Predictive modeling resulted in 70,000 new active mobile money users due to the one-time model use. The results mapped out the pool of likely mobile money adopters, and identified locations where below-the-line marketing activities were achieving the highest impact. Having an ex-ante idea of marketing potential in different areas avoids the overprovision of sales personnel and increases marketing efficiency. The data-driven approach delivered a smarter and more informed way to target existing telephone subscribers to adopt mobile money.
Improved Activity Rates
SMS usage, and high-volume voice and mobile data usage are key factors that were used to identify
potential active mobile money users. What started as an analysis of historical CDRs, delivered proof-of-concept value and led to a developed data-driven approach that allowed Tigo Cash to exceed the 65 percent activity mark among its mobile money clients. The active customer base grew from 200,000 prior to the exercise, to over 1 million active customers within 90 days.
Institutional Mindset Shift
As a mobile money provider, Tigo Cash has become a top performer in Ghana. The output of the collaboration became the foundation of all of Tigo Cash Ghana’s customer acquisition work. Above all, the data analysis showed the value of knowing customers. Tigo Cash Ghana plans to increase its internal data science capacity as well as to further improve its customer understanding with additional primary research. The goal has now shifted from registering new customers who are expected to be active, to thinking ahead about ways to keep activity levels high in a sustainable way.

44 DATA ANALYTICS AND DIGITAL FINANCIAL SERVICES
Targeted Marketing Programs
Targeting the right market groups, with the right advertising and marketing campaigns, can greatly increase the effectiveness of a campaign in terms of uptake and usage. Using a combination of data sources, DFS providers can segment transactional data by demographic parameters in order to identify strategic groups within their customer base. Marketing programs can be customized to target these groups, often with greater efficiency and effectiveness than standard approaches. DFS providers have been known to combine segment knowledge with data on profitability in order to focus marketing efforts on segments that are likely to optimize profits. Similarly, other DFS providers have used customer life cycles to make the right product offers to the right customers. The main challenge here is to find what customer groups care about in order to design an appropriate marketing campaign. While the universe of data available to DFS providers is growing every day, in the absence of analysis to shed light on this, once the customer groups are identified, DFS providers can use primary research to identify what the segments care about. All customer data can be used to develop targeted marketing programs. However, results are likely to be sharper if the analysis is done on the members of specific customer segments.
Loyalty and Promotional Campaigns
There may be customer segments that conduct a very high number of transactions on the DFS channel. These segments may desire loyalty rewards for specific transactions such as payments at certain kinds of merchants. Alternatively, the DFS provider may be able to nudge other segments towards certain kinds of transactions by offering promotional campaigns. Specific transactions in the database and customer profiles would help identify which groups would benefit from such campaigns.
High-value Customers Relationships
Segmenting customers based on profitability is a common application of the segmentation process. Additionally, one can assess the groups that are likely to become important in the future. DFS providers can use this information to increase their market share of this group and to decrease resource allocation to less profitable groups. The data needed for this kind of analysis are customer demographics, transactional data and data around customer profitability.
This is equally applicable to identifying high-performing agents based on segmentation. Working with FINCA in the Democratic
Republic of Congo (DRC), IFC analyzed agent transaction data and registration forms in the DRC to show that being a woman and being involved in a service-oriented business are highly correlated with being a higher-performing agent.18
Product or Process Enhancements
Classifying customers into segments also allows DFS providers to pay greater attention to the specific needs of a representative cohort. In a bigger group, these needs may get lost – but paying attention to smaller segments allows DFS providers to sharpen their focus and explore underserved or ignored needs and wants. For example, within a group of people not using a service, there might be those who are lapsed customers, or those who transacted a few times but then stopped using the service. Talking to these users might reveal a need to make small changes in the product or process. Alternatively, customers in one segment may use the full suite of products offered by a DFS provider, while another segment may use only one or two of these products. In such cases, segmentation provides insight for targeted market research and product development with the objective of unlocking customer demand.
18 Harten and Rusu Bogdana, ‘Women Make the Best DFS Agents’. IFC Field Note 5, The Partnership for Financial Inclusion
1.2_DATA APPLICATIONS

DATA ANALYTICS AND DIGITAL FINANCIAL SERVICES 45
Market Opportunity and Priority Products
Once the segmentation exercise is complete, DFS providers can assess the extent to which their product offering meets the needs and wants of each segment. They can estimate which segments represent the greatest opportunity over time and how competitive their offering is within these crucial growth segments. Thus, an analysis based on segmentation can play a powerful role in the strategic roadmap of a DFS provider.
Traditional demographic segmentation – which can be age-based, income-based or geography-based – is useful, but experience shows that demographic segmentation is less predictive of an institution’s future relationship with a customer than segmentation based on behavioral characteristics. Grouping
customers based on demographics tends to treat all customers in a group as the same, irrespective of their level of activity on the channel. Demographics can also be static in nature, where – particularly in the world of tech-enabled financial access – customer behavior is dynamic and ever-changing.
Access to transactional databases can transform traditional segmentation into a powerful tool to generate customer insights. With the increased availability of data, new data analysis tools and multiple channels available to customers, DFS providers now have the option of using individual behavioral information. This information better predicts people’s financial needs and usage. Furthermore, it reflects the changing needs and activities of the customer. However, behavioral data may not have a lot of information about customer needs and aspirations, thus
making it difficult to develop insightful
messaging around these segments.
Conducting a customer database
segmentation exercise requires dedicated
resources and a detailed plan. Notably,
segmentation strategies that make use
of multiple sources of data are most
successful in usefully and accurately
describing customer groups. Thus, the
process to develop customer segmentation
must incorporate this approach. Data
analysis plays an important role in this
process, as it allows DFS providers to
segment exactly by the variables that
play a role in driving usage and uptake.
This report only discusses the role of data
analysis in facilitating this process, but it
is important to note that those segments
can be created through multiple kinds of
research and analysis.

46 DATA ANALYTICS AND DIGITAL FINANCIAL SERVICES
Airtel Money, Airtel Uganda’s DFS offering, was launched in 2012. Initial uptake was low, with only a fraction of its 7.5 million GSM subscribers registering for the service. Activity levels were also low, with around 12.5 percent active users. IFC and Airtel Uganda collaborated on a research study to use big data analytics and predictive modeling to identify existing GSM customers who were likely to become active users of Airtel Money.
The project analyzed six months of CDR and Airtel Money transactions. The analysis sought to segment highly active, active and non-active mobile money users. The study identified three differentiating categories: GSM activity levels, monthly mobile spending and user connectedness. Using machine learning methods, a predictive model
was able to identify potential active users with 85 percent accuracy. This yielded 250,000 ‘high-probability’, new and active Airtel Money customers from the GSM subscriber base for Airtel to reach with targeted marketing. Geospatial and customer network analysis helped to identify new areas of strategic interest, mapped against new uptake potential.
The machine learning model identified some variables with high statistical reliability, but they made little business sense, like ‘voice duration entropy’. As a result, a supplementary analysis delivered business rules metrics, or indicators that had good correlation to potential activity and also had high relationships with business KPIs. Each metric had a numeric cutoff point to target customers above or
below a given cutoff. While not as accurate as the sophisticated model, it provided a solid ‘quick cut’ that could be used against KPIs to rapidly assess expectations.
Finally, the study analyzed the corridors of mobile money movement within the region. It found that 60 percent of all transfers happen within a 19 kilometer radius in and around Kampala. Understanding this need for short-distance remittances also informed Airtel Money’s marketing efforts for P2P transfers. Moreover, this network analysis of P2P transactions identified other towns and rural areas with activity corridors that could drive strategic engagements beyond Kampala for Airtel to focus on growing.
CASE 3Airtel Money - Increasing Activity with Predictive Customer Segmentation ModelsMachine Learning Segmentation Model Delivers Operational Value and Strategic Insight
1.2_DATA APPLICATIONS

DATA ANALYTICS AND DIGITAL FINANCIAL SERVICES 47
Figure 13: Network analysis (left) of P2P flows between cities and robustness of channel. Also pictured, geospatial density of Airtel Money P2P transactions (center), compared with GSM use distribution (right). Data as of 2014.
Kam
pala
Mityana MbararaM
baleM
asindiG
ulu
Seet
a
Jinja
Masaka
CDR Customers LocationP2P Transactions Sent Out by Source Number
Advanced data analytics can provide insights into active and highly active customer segments that can drive propensity models to identify potential customers with high accuracy. Network and geospatial analysis can deliver insights to prioritize strategic growth planning.

48 DATA ANALYTICS AND DIGITAL FINANCIAL SERVICES
Use Case: Forecasting Customer Behavior
Predictive modeling is a decision-
making tool that uses past customer
data to determine the probability of
future outcomes. DFS providers evaluate
multidimensional customer information in
order to pinpoint customer characteristics
that are correlated with desired outcomes.
As part of modeling, each customer
is assigned a score or ranking that
calculates the customer’s likelihood to take
a certain action.
For a customer-centric institution, predictive
modeling can inform how it understands and
responds to client needs. However, there
remain a few impediments that prevent it
from being more widely used. There has
been a perception – that is now gradually
changing among DFS providers – that
providers already know their client base well
enough to understand what products and
marketing campaigns work. Alternatively,
some DFS providers look at what has
worked elsewhere and try to replicate similar
products and services in their own markets.
Many providers are also unsure about exactly
how and where to start the process.
Predictive analysis can help practitioners achieve the following goals:
• New customer acquisition
• Developing an optimal product offering
• Identifying customer targets and predicting customer behavior
• Preventing churn
• Estimating impact of marketing
New Acquisition and Identifying Targets
As evidenced by research and practitioner experience, practitioners have successfully registered large numbers of new clients for their DFS services. However, transforming these registered customers into active customers remains a difficult task that only a few DFS providers have been able to master. On average, about one third of registered customers have conducted a single transaction in the last 90 days.19 One of the reasons identified for these low levels of activity is inadequate targeting at the recruitment stage. Most DFS offerings target the vast mass market. As such, they are able to sign up a large number of customers, but have had limited success converting these clients into an active and profit-generating customer base.
Predictive analysis could help identify customers at the acquisition stage who are much more likely to become active users in the future through a statistical technique known as response modeling. Response modeling uses existing knowledge of a potential customer base to provide a propensity score to each potential customer. The higher the score, the more likely the customer will become an active user. MNOs who are DFS providers have used this kind of modeling to predict which members of their voice and data customer base are likely to become active users of their DFS service. The model is predicated on the hypothesis that customers who are likely to spend more on voice and data are also likely to adopt DFS. Using CDR data, the model is able to predict with a high degree of accuracy how likely a customer is to become an active user of DFS.
Developing Optimal Product Offerings
There are predictive models that can be used to discover what bundles of products are likely to be used together by customers. Thus, the model will identify segments that tend to use only a single product such as P2P transfers and others
19 ‘State of the Industry Report on Mobile Money’, Decade Edition 2006 - 2016, GSMA
1.2_DATA APPLICATIONS

DATA ANALYTICS AND DIGITAL FINANCIAL SERVICES 49
who make use of multiple products, such as deposit services, airtime purchase and P2P transfers. However, the second group may never use the service for microloans. This is information that the DFS provider can use for marketing purposes and product development.
Predicting Customer Behavior
This analysis can also be used to understand future value potential for each customer. This includes the lifetime customer value, customer loyalty, expected purchase and usage behavior, and expected response to campaigns and programs. Similarly, DFS providers can increase their up-sell and cross-sell opportunities by predicting future usage through the current basket of products and patterns in use. Determining which bundles of products work together through transactional data analysis also presents an opportunity for cross-selling. For example, a PSP may find that users are using the wallet as a storage account, an indication that these customers may be serviced more effectively through a savings account.
This information can be used across several operational functions: campaign and marketing design, financial projections, customer investment allocation, and future product development. This kind of prediction can also be used at the individual
customer level or at the aggregate level to
a segment as a whole.
Notably, a comprehensive predictive
analysis of lifetime customer value requires
a high level of active customers across
product and channel areas. This may not
yet be realistic for many DFS providers.
However, as organizations grow, being
able to forecast future customer patterns
and trends will not only become possible,
but imperative to grow a healthy business.
Thus, being aware of this functionality
can help DFS providers incorporate it
into their decision-making process as and
when relevant.
Preventing Churn
Customer churn happens when a customer
leaves the service of a DFS provider.
The cost of churn includes both the lost
future revenue from the customer, as well
as the marketing and acquisition costs
related to replacing the lost customer.
Additionally, at the time of churn, revenues
earned from the customer may not have
covered the acquisition of that customer.
Thus, analytics around customer churn
have two objectives: predicting which
customers are going to churn, and
understanding which marketing steps are
likely to convert a customer at a high risk of
churning into a retained customer.
Estimating Marketing Impact
Marketing for DFS tends to be resource-intensive given its relative newness in many markets. This is furthered by the realization that a product requires awareness-building before achieving customer acceptance. Without a tool to measure success, managers are forced to rely on gut feelings and high-level sales data in order to assess the value of their marketing efforts. Given that customers are now interacting with DFS providers on multiple channels, digital and otherwise, it is also challenging to isolate the effects of specific campaigns, as customers are exposed to multiple messages at any given point in time.
Predictive modeling allows for the measurement of marketing impact on customer behavior. Depending on the data available, the analysis can allow DFS providers to estimate ‘lift,’ or an increase in sales that can be attributed to marketing. Predictive modeling will identify how specific marketing measures can impact customer behavior across segments. It may demonstrate, for instance, that a certain marketing action or advertising on a certain channel may have a much higher response from certain segments as compared with the average response from the population.

50 DATA ANALYTICS AND DIGITAL FINANCIAL SERVICES
Personalized Marketing Messages
The previous sections have already discussed how targeted marketing can use a deeper understanding of customer segments. Personalized marketing is targeted marketing at an extremely individualized level, where an individual customer’s wants and needs are being anticipated using their past behavior and other reported information. Many potential customers have limited experience with financial services and are often suspicious of its ability to be relevant to their lives. Personalized messaging allows DFS providers to ‘speak’ to their customers as if they know them, thus enabling DFS providers to win customer trust. Additionally, customers are able to have a highly tailored relationship with their provider. In competitive markets, personalized messages would help build an affinity for one service over another. Customers are much more likely to respond to messaging that responds to their interests, rather than impersonalized messaging that refers to a very high-level,
non-specific value proposition for DFS.
Finally, the right marketing message will
pull the customer to take action based on
the messages they receive, presumably
because they speak to the underlying pain
points of the customer.
Some personalized messages may fail in
their targeted objectives, as unsolicited
messages can easily be ignored, or worse,
may cause negative associations with the
DFS provider. Thus, personalized messages
need to be carefully crafted and targeted
in order to ensure they are reaching
customers who require the information.
How can DFS providers personalize
marketing messages?
1. Collect Data and Identify Customers: First, DFS providers need to collect
data about their customers. The
sources for these data include
customer transactions, demographic
data, preferences, and social media inputs.
2. Understand Customers: Then, DFS
providers need to examine these data
and consider segmentation into groups
based on common characteristics.
3. Develop Messages and Interact with Customers: DFS providers should then
develop messages for customers and
identify the appropriate channels to
deliver messages to their customer base.
The next step is to engage with the
customer base through the messaging.
4. Test the Efficacy of Messaging: The
impact of the message can be measured
using A|B testing. Personalization must
be accompanied by testing so that it is
possible to assess its impact.
5. Refine the Message: Customer feedback
and the measurement of impact must
feed into further message refinement.
1.2_DATA APPLICATIONS

DATA ANALYTICS AND DIGITAL FINANCIAL SERVICES 51
Juntos, a Silicon Valley technology company, partnered with DFS providers to build trusting relationships with end users; improving overall customer activity rates. Globally, many DFS providers experience high inactivity and low engagement. This discourages providers, whose investments may not be seeing sufficient financial return and whose customers may have access to services of which they are not making sufficient use. Juntos offers a solution to this problem by using personalized customer engagement messages based on data-driven segmentation strategies that deliver quantified results.
Good data underpin this approach. First, Juntos conducts ethnographic research to better understand customers in the market. Engagements are always informed by quantitative data provided by the DFS partner, qualitative behavioral research done in-country and from learnings drawn from global experience. Having developed an initial understanding of the end user, Juntos conducts a series of randomized control trials (RCTs) prior to full product launch. These controlled experiments are designed to test content, message timing or delivery patterns, and to identify the most effective approach to customer engagement.
To begin, messages are delivered to users, and users can reply to those messages. This develops the required trust relationship. More importantly, those responses are received by an automated Juntos ‘chatbot’ that analyzes the results according to three KPIs:
• Engagement Rates: What percent of users replied to the chatbot? How often did they reply?
• Content of Replies: What did the responses say? What information did they share or request?
• Transactional Behavior: Did transactional behavior change after receiving messages for one week? One month? Two months?
CASE 4Juntos Delivers Scalable and Personalized Customer Engagement MessagesData Sources: Qualitative and Quantitative Data Improve Segmentation and Outreach

52 DATA ANALYTICS AND DIGITAL FINANCIAL SERVICES
These experiments enable Juntos to understand which inactive clients became active because of Juntos message outreach, and to understand which messages enabled higher, more consistent activity. For example, a control message is sent to a randomly selected group of users: “You can use your account to send money home!” Others might draw from service data to include the customer’s name: “Hi John, did you know that you can use your account to send money home?” Perhaps other data will be incorporated within the message: “You last used your account 20 days ago, where would you like to send money today?” These are merely
examples, but they show how a generic message compares with a personalized message with a time-sensitive prompt. Juntos’ baseline ethnographic data improve qualitative understanding of customers, helping build the hypothesis around which messages are likely to resonate, then putting those messages to statistical test.
The first question is whether the test messages yield statistically better results compared with the generic control message. When the answer is “yes,” it is important to dive one step deeper and ask about the respondent and surveying across segments such as rural or urban; male
or female; income range; and usage patterns, merging this information with ethnographic data on consumer sentiment.
By testing a wide variety of messages, Juntos is able to segment user groups according to messages that show statistical improvement in usage over time. This means that high-engagement messages can be crafted for everyone from rural women, to young men, to high-income urbanites. The Juntos approach is tailored for each context and is continuously tuned to nimbly accommodate customers who change their interactions over time.
Collecting qualitative customer sentiment and market data improves understanding of customer behavior, which helps providers craft messages that people like to see. Statistical hypothesis testing identifies which messages resonate best with specific groups, enabling personalized messaging for targeted audiences.
1.2_DATA APPLICATIONS

DATA ANALYTICS AND DIGITAL FINANCIAL SERVICES 53
Use Case: Understanding Customer Feedback and Text Analytics
DFS providers can also extract usable insights about customer preferences and attitudes through new algorithm-based techniques called text mining, or text analytics. Today, many companies can access information about customer likes and dislikes through social media, emails, websites, and from call center conversation transcripts. Notably, these methods have been applied in developed country contexts in Europe and North America. However, DFS providers in emerging markets may also want to analyze these data to help grow business. Text analysis may also be done manually. With advances in technology, these methods are likely to become cheaper and more adaptable to developing country contexts and languages.
The most common application for text analytics is across two methods:
1. Text Summarization Methods: These methods provide a summary of all of the key information in a text. This summary can be created by either using only the original text (extractive approach) or by using text that is not present in the text (abstractive approach).
2. Sentiment Analysis: Sentiment analysis or ‘opinion mining’ is an algorithm-based tool used to evaluate language, both spoken and written, to determine if the opinion expression is positive, negative, or neutral and to what extent. Through this analysis, DFS providers understand how customers feel about their products, how they relate to the brand and how these attitudes are changing over time. Of particular interest are any peaks or troughs in the sentiment analysis.
Currently, evaluations from text analytics can be applied across three areas:
Product and Service Enhancement
DFS providers could make quick improvements to products and services if they could hear directly from customers. Social media, emails and other direct feedback mechanisms are a great way to immediately and directly hear from customers. Market research can be a limited source of customer feedback in this respect.
Word-of-mouth Marketing
Word-of-mouth marketing remains the most trusted form of advertising for many customers. For products and DFS providers that have large existing customer bases, motivating satisfied customers to
boost word-of-mouth marketing is not difficult. However, for new products, like DFS, providers need to find a method to catalyze the education levels among potential customer bases, especially among customers who build enthusiasm and momentum for the product within the target customer base. Typically, customers are more motivated to spread the word about one or two specific use cases; they will rarely spread a generic message about the brand. Social media feeds and other web-based information can be used to identify influencers by their connectedness, level and nature of interaction and potential reach. This kind of analysis is dependent on unstructured social network data, data from review sites and data from blogs.
Marketing Impact and Monitoring Feedback
Opinion mining allows DFS providers to understand the thinking process of huge numbers of customers. Through sentiment analysis, it is possible to track what customers are saying about new products, commercials, services, branding, and other aspects of marketing. This analysis can also be used to understand how the market perceives competitor products and services. These data from social media, blogs, review websites, and other websites in the social sphere are also unstructured.

54 DATA ANALYTICS AND DIGITAL FINANCIAL SERVICES
1.2.2 Analytics and Applications: Operations and Performance ManagementThe operations team is responsible for running ‘the engine room,’ which is core to the DFS business because it performs a myriad of tasks, including: collecting data, storing data and ensuring its fluid connectivity among various systems and applications for the DFS provider’s entire IT environment; constantly monitoring data quality; onboarding and managing agent performance; ensuring that the technology is operating as designed; providing customer support; delivering the information and tools needed by the commercial team, including performance measurement, risk monitoring and regulatory reporting; resolving issues; efficiently monitoring indicators, exceptions and anomalies; managing risk; and ensuring that the business meets its regulatory obligations. This cannot be done efficiently without access to accurate data, presented in a form that is relevant, easily digestible and timely.
Figure 14: Operations Tasks
Agent Lifecycle
Customer Lifecycle
Develop & Manage Product
Technical Operations
E-Money Reconciliation
Billing, Revenue, Commission
Risk & Compliance
Business PartnerLifecycle
Operations Tasks
The operations team has an important role in organizational structure, being independent from other core functions and also integrated in major business activities. The nature of the team’s responsibilities require technical skills, as well as knowledge of business. This combination enables meaningful data interpretations that can eventually help in the decision-making processes of key business stakeholders.
This section describes the role that data can play in optimizing the day-to-day operations of a typical DFS provider. It starts by describing how data can be turned into useful information, giving real life examples of data analysis in action. This includes some tips on best practice in DFS data usage. As the use of data dashboards becomes increasingly common, it provides insights into dashboard creation and content.
Use Case: Visualizing Performance With Dashboards
It is often said that a picture is worth a thousand words. Thus, finding a graphical way to represent data is a powerful way to communicate information and trends quickly, which is critical for constant monitoring of business performance and key for identifying risks before they develop. Well-structured dashboards, tailored towards various groups of users, should reflect demand from the business units and help them make more informed decisions.
1.2_DATA APPLICATIONS

DATA ANALYTICS AND DIGITAL FINANCIAL SERVICES 55
Turning data into graphs and other forms of visualization makes it easier to communicate the information revealed and also helps spot trends and anomalies in the data. Many people in the organization do not have the time or the resources to analyze the data themselves; they simply want the answers to questions that will help them do their job more effectively.
A dashboard gives a snapshot of the KPIs relevant to a department or to the overall business. If there is rarely a need to take action based on the reported data, the dashboard metrics are probably incorrect. In order to design robust dashboards, it is important to incorporate feedback from the ultimate users, in order to meet their specific needs. Without this feedback, the dashboards might become obsolete and all efforts to develop them would be wasted. Therefore, dashboard development is a joint venture between the operations and business teams, which might go through several iterations to circle down the feedback loop of the various stakeholders.
Some dashboards need to be real-time. For example, a technical operations team needs to act on alerts raised in real time: customer care managers actively assess call volumes to assign team work and manage incidents, risk management teams are constantly informed about missed repayments, and sales teams can take early actions on low-
activity accounts to activate the customer and not let the account become dormant. Some of these dashboards would allow end users to manipulate the data to visualize various data cuts and segments. Often, these kinds of dashboards are presented live on a large screen on the team floor for everyone to see. For field staff, where internet access may be of variable quality, online dashboards can be downloaded and cached locally for use in the field.
Other management dashboards provide insights by analyzing data from the previous day, week, month, or year, and hence can be delivered in multiple ways, including reports, presentations or via an online portal. Consequently, each department and project team needs dashboards personalized to the department’s goals and initiatives. Typically, as a minimum, DFS solutions should have multiple operations dashboards covering the following areas, each providing role-based access by specific audiences:
• Risk: Revenue leakage; Non-performing loans (NPLs); Anti-money laundering (AML) insights; capital adequacy; fraud detection
• Finance: Profit and loss insights; e-money oversight
• Marketing: Customer insights and trends for various offerings
• Sales: Agent performance; merchant and biller performance; sales team performance
• Operations: Agent liquidity management
• Customer Care: Call center statistics and insights
• Technical Operations: Technical operations insights
Off-the-shelf data management tools have advanced enormously over the last few years. It is likely that standard dashboards are available as part of the technology vendor package. In order to gain the deeper insights required and to do so in a reproducible manner, there are two standard approaches:
1. Return to the Vendor: There is often budget available for vendors to make changes to the dashboards, but multiple department requests and multiple vendor clients vying for attention can lead to capacity issues and delays.
2. Use Excel to Manipulate Raw Reports Downloaded from System ‘Data Cubes’: When a question is given to the business decision support team, it will create a custom dashboard and deliver a report or PowerPoint presentation to attempt an answer. This is another ad hoc form of dashboard creation.

56 DATA ANALYTICS AND DIGITAL FINANCIAL SERVICES
The latest generation of data management tools allow the freedom to investigate areas of interest without needing expertise in data manipulation. However, underlying databases need to be designed and optimized to successfully deploy and use these types of tools. Whatever the data management process or system being used, these are the points to consider when creating a dashboard:
1. Think About Answering “So What?”: The results should be actionable, not just ‘nice to know.’ Many dashboards only show the current status of the business and do not give context of previous results or time-based trends.
2. Decide What Question is Being Answered Before Starting: Often, reports are a dumping ground for all the data that are available, whether they are useful or not. These types of reports do not contain the motivational metrics and measures that increase performance.
3. Design the Report to Tell a Story: Once the right data are measured and collected, the report should contain eye-catching information to lead the reader to the most important points. Make it visual, interesting and helpful.
Standard Operations Reports
In order to improve their businesses, DFS providers are trying to find the answer to questions such as:
• What was the transaction volume and value?
• How many customers and agents were active?
• What revenue did we make?
• How does this compare with last month and with the budget?
• Are any risk indicators outside of acceptable ranges?
• Are there any recurring unusual transactions, any spikes in activity or any anomalies that signal unusual activity?
The starting point is to focus on the KPIs, or metrics with quantifiable targets that operational strategy is working to achieve and against which performance is judged. The overall business KPIs should directly relate to the strategic goals of the organization and, as a result, determine the specific KPIs of each department. The most useful data are those that can be turned into the information needed to make decisions. Before creating a report,
one should identify exactly what one wants to know and confirm that action will be taken as a result of obtaining the data.
Well-structured departmental KPIs provide the operations teams with insights from which they can measure performance versus targets. They help teams understand what is happening on the ground and where there is the potential for improvement.
The standard KPI reports about the main business drivers are usually segmented by operational area. The focus KPIs of each respective operational area are in Table 3.
1.2_DATA APPLICATIONS

DATA ANALYTICS AND DIGITAL FINANCIAL SERVICES 57
Table 3: Focus KPIs by Operational Area
Department Topics of Focus for KPIs
Finance and Treasury Revenue, interest income and expenses, fees and commissions, amount held on deposit, transaction volume and value, customer and agent volume (active), indirect costs, and issuing e-money for non-banks, bank statement reconciliation
Business Partner Lifecycle (merchants, billers, switches, partner banks, other PSPs)
Recruitment, activity levels, issue resolution, performance management, reconciliation and settlement
Customer Lifecycle Management KYC management, activity levels, transactional behavior, issue resolution (customer services), and account management
Technical Operations Monitoring product performance, monitoring partner service levels, change management, partner integration, fault resolution, incident management, and user access management
Credit Risk Portfolio risk structure, non-performing loans, write-offs and risk losses, loan provisioning
Operational Risk and Compliance Operational risk management, suspicious activity monitoring and follow up, regulatory compliance, due diligence, and ad hoc investigations
Agent Network (DFS specific) Lifecycle
Recruitment, activity levels, float management, issue resolution, performance management, reconciliation and settlement, and audit
Other Depending on the nature of the DFS, other reports may be required, for example, organizations extending credit will perform credit rating, debt recovery and related tasks
Depending on the business strategy and departmental objectives, a selection of the above data are presented as the business and departmental KPIs. These may, ideally, be presented as dashboards, or as a suite of reports. It is important for each department to segregate their data into KPIs and support data as there is
always a temptation to include peripheral data, which are not strictly needed to understand the health of their department, within management reports. This can be distracting or lead to inappropriate prioritization. The support data are vital to help understand the drivers of the KPIs and determine how they can best be
improved, but they generally do not need to be reported to a wider audience unless there is a specific point to be made. A good example of this is the approach illustrated with MicroCred’s use of data dashboards.

58 DATA ANALYTICS AND DIGITAL FINANCIAL SERVICES
CASE 5MicroCred Uses Data Dashboards for Better Management SystemsData Visualizations and Dashboards for Daily Performance and Fraud Monitoring
Figure 15: Example of MicroCred Dashboard Data
MicroCred is a microfinance network focused on financial inclusion across Africa and Asia. In Senegal, it operates a growing microfinance business offering financial services to people who lack access to banks or other financial services. Reach has been extended across the country by creating a network of over 500 DFS agents. The agent’s POS devices can perform both over-the-counter (OTC) transactions for bill payments and remittances, and also facilitate deposit and withdrawals to MicroCred accounts. Transaction confirmation is provided through SMS receipt. By late 2016, nearly one third of customers had registered their account to use the agent channel, and over one quarter were actively using agent outlets to conduct transactions. This generated significant operational and channel performance data.
1.2_DATA APPLICATIONS

DATA ANALYTICS AND DIGITAL FINANCIAL SERVICES 59
Visualization tools and interactive dashboards can be integrated into data management systems and provide dynamic, tailored reports that serve operations, management and strategic performance monitoring.
MicroCred was an early adopter of next-generation data management systems, acquiring and implementing BIME, a visualization tool to help optimize operations. It enabled MicroCred to develop interactive dashboards, tailored to answer specific operational questions.
MicroCred most frequently uses two dashboards:
Daily Operations Dashboard
This gives a daily perspective on the savings and loan portfolios, highlighting any issues. It presents data over a three-month period, but can be adjusted according to user needs. This dashboard uses automated alerts to warn the operations team of potential problems. The reports, customized for operational teams, include measures such as:
• Tracking KPIs, including transaction volumes, commissions and fees
• Agent activity, with alerts to show non-transacting and under-performing agents
• Suspicious activity and potential fraud alerts, such as unusual agent or customer activity
• Monitoring of DFS enrollment process, with focus on unsuccessful enrollments
• Geographical spread of transactions
Monthly Strategic Dashboard
This gives a longer-term, more strategic view and is mainly used by the management team to visualize more complex business-critical measures. It was developed to consider behavior over the customer lifecycle, including how usage of the service evolves as customers become more familiar with both the technology and the services on offer. It is also possible to easily perform ad hoc analyses to follow up on any
questions raised by the data presented in the dashboards. It focuses on:
• Usage of MicroCred branches versus agents
• Customer adoption and usage of DFS
• Deployment of the DFS channel
• Evolution of fundamental KPIs versus long-term goals
With visualization tools like BIME, it is simple to create graphs to illustrate operational data, making it easier to spot trends and anomalies, and to communicate them effectively. Implementing the data management system also presented some challenges, both technical and cultural. MicroCred recommends that a step-by-step approach is adopted, starting with some basic dashboards, and building up over time to more sophisticated dashboards.

60 DATA ANALYTICS AND DIGITAL FINANCIAL SERVICES
Data Used in Dashboards
There are two main levels of data recording required to develop the dashboards: transaction and customer level. They serve different goals, but both are important.
Transaction Data
Transaction data are characterized by high frequency and heterogeneity. However, DFS providers should aim to standardize transaction typology in order to track product profitability, monitor and analyze customer (and agent) behavior, and raise early warning signals of account underperformance or low activity. Transaction types should be clearly differentiated and should be easily identifiable in the database, even when the transactions look technically similar. For example, a common cause of confusion occurs when there are multiple ways of getting funds into a customer account, such as incoming P2P, bulk payments or cash-ins, but all data are combined and simply reported as ‘deposits.’ These three transaction types should be treated separately because of their very different impact on revenue – one is a direct cost, one a source of revenue and one potentially cost neutral – and because of their implications for the marketing strategy.
Customer Data
Having a unique customer identifier is
crucial, especially when the dashboard is
sourcing data from multiple applications.
Through data integration, providers can
control data integrity to ensure quality data
recording, which is necessary for tracking
portfolio concentration, calculating product
penetration, cross-selling and sales staff
coverage, and analyzing other important
metrics. There are generally two large
groups of data that need to be recorded
on a customer level: demographic and
financial. Full lists of data metrics can be
found in Chapter 1.2. The combination
of transaction-level and customer-level
data can provide useful insights about the
behavior of certain customer segments
and can lead to optimal performance
management.
Use Case: Agent Performance Management
Agent management is probably the
most challenging aspect of providing
successful digital financial services, as it
requires regular hands-on intervention by
a field sales team as well as back-office
operations support. It can be problematic
to disseminate information, because the
team and the agents are geographically dispersed with varying levels of connectivity and are often equipped with fairly basic technology. Nevertheless, their data needs are many. Relationship managers, aggregators and agents with multiple outlets in multiple locations need performance and float management information. Field sales force workers who infrequently return to the office to access information remotely. The agent needs information on their own performance in terms of transaction and customer count, volume of business, efficiency of sales (conversion), and profitability. Potentially, information on the cash replenishment services available, particularly in markets where agents can provide e-money float and cash management services to each other, will be useful. In markets with independent cash management partners, agents also need to be armed with data on float levels.
Agent performance management needs granular data, linked directly to the teams responsible for managing the outlets. Agent performance data need to be easily segmented in the same way that the sales team is structured; each section and individual can see their own performance.
1.2_DATA APPLICATIONS

DATA ANALYTICS AND DIGITAL FINANCIAL SERVICES 61
This is the basis for setting performance targets that can be accurately assessed and rewarded. In the example below, both the teams and the people responsible for each level of the agent hierarchy, from sales director to district sales representatives, need accurate, timely data relating directly to their responsibilities. The most useful information the sales team can be given relates to the agents for which they are responsible.
Agent Coverage Gaps
There are no definitive answers for the optimal number of agents needed for each customer to have reasonably easy access to an agent and for each agent to have enough customers to generate an acceptable income. Research points to somewhere between 200 and 600 active customers per active agent as optimal for DFS providers, depending on market conditions. A key sales task is to monitor the agent and customer data, controlling the growth and location of agent outlets to ensure that they are in line with customer activity.
Identifying the Strongest Agents
Quality agents should be rewarded for their efforts. Incentives including marketing activities and over-riders, or performance-related bonuses, can be based on these data. Having personalized agent targets based on local market conditions, and having a way to clearly show the agent how they are performing against their own targets and their peers, can be very powerful. Targets include liquidity and customer activity. A key characteristic of a good agent is that they rarely run out of e-money or cash float. Agent aggregator targets should be based on the liquidity management activity they are contracted to support as well as their agent team’s performance.
Identifying the Weakest Agents
In most markets, around 80 percent of agents are active. This means that customers wishing to transact with the other 20 percent of agents will probably be unable to do so because there is insufficient float or an absent agent. Underperforming agents need either to be brought to an
acceptable standard, or if this proves impossible, retired from service. Because lack of e-money liquidity has strong correlation with non-performance, a key metric often used for agent performance analysis is the number of days ‘out of stock’ per month (that is, float levels below a threshold value).
This kind of agent data analysis is very effective, but quite detailed and often performed manually, which can be slow and labor intensive. Providing the sales team with automated data management tools that they can use in the field, as well as personalized performance metrics, can be powerful. The Zoona case study demonstrates these points well.

62 DATA ANALYTICS AND DIGITAL FINANCIAL SERVICES
CASE 6Zoona Zambia - Optimizing Agent Performance ManagementData Culture: An Integrated Data-driven Approach to Products, Services and Reporting
Zoona is the leading DFS provider in Zambia, offering OTC transactions through a network of dedicated Zoona agents. Agent services include: customer registration, sending and receiving remittance payments, providing cash in and cash out for accounts, and disbursing bulk payments from third parties, such as salaries and G2P payments. Zoona has a data-driven company culture and tasks a centralized team of data analysts to constantly refine the sophistication and effectiveness of its services and operations.
Agent Location
Zoona has developed an in-house simulator to determine the optimum location for agent kiosks. The approach uses Monte Carlo20 simulations to test millions of possible agent location scenarios to identify which configurations
maximize business growth. Factors such as the number of customers served per day by existing agents and queue lengths are used to determine local demand and potential for growth until saturation is reached. To ensure reliability, modeled scenarios are cross-referenced with input from the field sales team, which has local knowledge of the area and the outlets under the most pressure. In key locations, the team also uses Google Maps and physically walks along the streets, observing how busy they are and where the potential hot spots may be. For example, thousands of people may arrive at a bus depot, then disperse in various directions; Zoona maps the more popular routes, creating corridors where potential customers are likely to be found. Zoona also maps the location of competitors on these routes.
Agent Lifecycle
A relatively new agent on a main road may not be as productive as a mature agent in a busy marketplace, due to location and the mature agent having developed a loyal customer base. However, a robust DFS service needs agents in both locations – and the targets set for each agent should be realistic and achievable. Zoona analyzes agent data to project future performance expectations for agent segments, such as urban and rural, producing ‘performance over time’ curves for each agent, down to the suburb level. These support good agent management KPIs.
Liquidity Management
Agents require a convenient source of liquidity to serve transactions, so proximity to nearby banks or Automated Teller Machines (ATMs) is included in placement scenarios.
20 Monte Carlo simulations take samples from a probability distribution for each variable to produce thousands of possible outcomes. The results are analyzed to get probabilities of
different outcomes occurring.
1.2_DATA APPLICATIONS

DATA ANALYTICS AND DIGITAL FINANCIAL SERVICES 63
Analytics can support many aspects of operations and product development: optimized agent placement, performance management and tools that create incentives for voluntary data reporting. A data-driven company culture drives integration.
Difficulty replenishing float can also be due to an overconcentration of agents, who collectively strain nearby float sources and undermine value for the local agent network. The Zoona simulations look at both scenarios as part of optimization. Furthermore, through understanding that agent float is a key driver of agent performance, Zoona is piloting an innovative solution for collecting both an agent’s cash and electronic float balances to help agents manage their float more effectively. This provides agents with access to performance management tools, which are developed using the QlikView data management visualization toolkit. It provides Zoona with data that agents might otherwise not wish to report.

64 DATA ANALYTICS AND DIGITAL FINANCIAL SERVICES
Agent Back Office Management
The agent back office team is responsible for all of the tasks required to set up new agents, then manage their ongoing DFS interactions. Often, this also includes sourcing the data needed by the sales team (above). To be effective, they need a lot of data, including both standard reports and access to data to run ad hoc reports focused on specific queries. As well as providing the sales team data, they also need to measure how long their many business processes take, in order to ensure their team has capacity to deliver against internal service levels. This is achieved by measuring issues raised by type and volume, and measuring issue resolution time, often via a ticketing system.
Business Partner Back Office
For the purpose of back office management, various types of non-agent business partners can be combined. These include billers and other PSPs, merchants, organizations using the DFS for business management purposes, including payroll and other bulk payments, and other FIs, including banks and DFS providers. The business partner management back office team is responsible for similar tasks as agent management, but with different
regulatory requirements (and no need for float management). Consequently, the key metrics they need are similar to those for agents, but with some different business processes and targets.
Agent Efficiency Optimization
Data can be used more effectively by agent management teams when they have mobile and online access to these data. Some of these tasks include:
• Planning the workload
• Check in and out of the agent outlets on field visits
• Update or verify location and other demographic information for the outlet
• Show customized performance statistics to the agent directly upon arrival
• Show commission earned both to date and for the month
• Show revenue earned on the customers that the agent is serving
• Allow them to add photos to the database
• Fill in basic Quality Assurance (QA) agent survey measures directly
• Notify that KYC information is in transit
• Set new performance targets and
incentives
• Submit agent service requests and
queries directly to the operations team
• Capture prospects for new agent outlet
locations
Access to this kind of data can result in more
motivated and successful agents as well as
improve overall DFS business performance.
Important questions can be addressed,
like: “How much e-money float do agents
need?” In order to manage cash and digital
floats, it is useful to understand the busiest
times of day, week and month, and to
provide guidance on their expected float
requirements. It is also helpful to have flags
on the system such that if an agent’s float
falls below a minimum level, an automated
alert is received by the person responsible
for the agent’s float management. In more
sophisticated operations, algorithms can
be used to proactively predict how much
float each agent will need each day and to
advise them of the optimal starting balance
either before trading commences or after
trading closes. This can also be done for the
amount of cash that the agent is likely to
need to service cash-out.
1.2_DATA APPLICATIONS
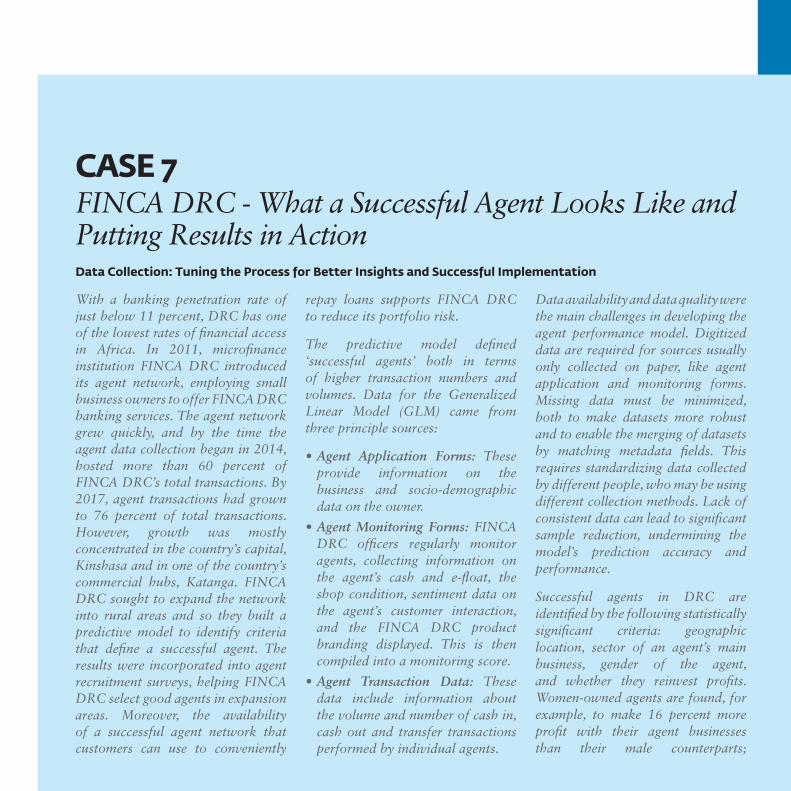
DATA ANALYTICS AND DIGITAL FINANCIAL SERVICES 65
With a banking penetration rate of just below 11 percent, DRC has one of the lowest rates of financial access in Africa. In 2011, microfinance institution FINCA DRC introduced its agent network, employing small business owners to offer FINCA DRC banking services. The agent network grew quickly, and by the time the agent data collection began in 2014, hosted more than 60 percent of FINCA DRC’s total transactions. By 2017, agent transactions had grown to 76 percent of total transactions. However, growth was mostly concentrated in the country’s capital, Kinshasa and in one of the country’s commercial hubs, Katanga. FINCA DRC sought to expand the network into rural areas and so they built a predictive model to identify criteria that define a successful agent. The results were incorporated into agent recruitment surveys, helping FINCA DRC select good agents in expansion areas. Moreover, the availability of a successful agent network that customers can use to conveniently
repay loans supports FINCA DRC to reduce its portfolio risk.
The predictive model defined ‘successful agents’ both in terms of higher transaction numbers and volumes. Data for the Generalized Linear Model (GLM) came from three principle sources:
• Agent Application Forms: These provide information on the business and socio-demographic data on the owner.
• Agent Monitoring Forms: FINCA DRC officers regularly monitor agents, collecting information on the agent’s cash and e-float, the shop condition, sentiment data on the agent’s customer interaction, and the FINCA DRC product branding displayed. This is then compiled into a monitoring score.
• Agent Transaction Data: These data include information about the volume and number of cash in, cash out and transfer transactions performed by individual agents.
Data availability and data quality were the main challenges in developing the agent performance model. Digitized data are required for sources usually only collected on paper, like agent application and monitoring forms. Missing data must be minimized, both to make datasets more robust and to enable the merging of datasets by matching metadata fields. This requires standardizing data collected by different people, who may be using different collection methods. Lack of consistent data can lead to significant sample reduction, undermining the model’s prediction accuracy and performance.
Successful agents in DRC are identified by the following statistically significant criteria: geographic location, sector of an agent’s main business, gender of the agent, and whether they reinvest profits. Women-owned agents are found, for example, to make 16 percent more profit with their agent businesses than their male counterparts;
CASE 7FINCA DRC - What a Successful Agent Looks Like and Putting Results in Action Data Collection: Tuning the Process for Better Insights and Successful Implementation

66 DATA ANALYTICS AND DIGITAL FINANCIAL SERVICES
1.2_DATA APPLICATIONS
the value of their business inventory is 42 percent higher. They were also found to put more money back into their business inventory, rather than keeping it in a bank account that yields little interest. This resulted in about 5 percent higher total average transaction value per month.
These results were implemented to improve and streamline the agent selection process, which ultimately helped to expand the network into rural areas by incorporating factors into agent surveys and roll-out strategy. By 2016, the agent network had grown to host 70 percent of total transactions. The model identified location as a key criterion, revealing another research opportunity. As a follow-on study, FINCA DRC and IFC will use a RCT methodology to identify optimal agent placement location.
Comparing data on agent’s profiles against agent metrics can highlight key characteristics that lead to enhanced agent performance. Integrating these learnings with agent targeting and management processes ensures the full leveraging of data for performance management.

DATA ANALYTICS AND DIGITAL FINANCIAL SERVICES 67
Use Case: Back Office Management
Process Automation
Even though DFS providers are putting a lot of effort in to developing front end automation (mobile, online banking), some still struggle to develop highly automated back end functions. Automated tasks that can assist back-office operations – such as loan underwriting and origination, transaction processing and automated reconciliation – have tremendous value. Providers are now moving towards robotic automation of the simple and repeat processes, which can be carried out much more cheaply and accurately by machines than by humans. According to AT Kearney, Robotic Process Automation (RPA) makes operations 20 times faster than the average humans and includes benefits of 25 percent to 50 percent cost savings for those who adopt.21 Various areas of automation can generally be grouped within automation of data recording and data processing.
The primary focus of data recording lies in digitizing paper-based work flows. We observe that many providers still use paper-based application forms to collect account opening information. Multiple errors that occur along the manual entry process force these forms through multiple loops of rework. Eventually, after going
through a several-step verification process, key information is recorded in the system manually by the front or middle-office, creating additional burden on staff and causing inefficient time allocation. These forms then have to be stored in a physical warehouse and maintained for a certain period of time. Streamlining and simplifying the data collection process through the front end interface and through a system of built-in data checks increases efficiency and reduces labor costs. Of course, in order to record the data in a robust manner, IT architecture must be strong enough to correctly classify, check and store data.
Data processing can be automated at almost all stages of the customer relationship. Establishing standard verification steps can speed up account opening and account changes, and credit decisions for certain segments can be triggered by well-structured, tested scoring models. Furthermore, action heat maps can automate disbursements, and automated request and feedback forms can digitize account closures. Advanced analytics, which are described in the previous chapter and can include lead generation for sales campaigns or multichannel management, may be used to uncover untapped opportunities and risks within the portfolio. Once identified,
automated notifications can be sent either to the front-office staff or to customers directly. For example, for churn prevention, customers who are approaching dormancy status can receive reactivation text messages or emails. Borrowers can receive notifications about upcoming payments or better-priced products available for refinancing. Some functions requiring human interventions, such as financial and business analysis and personal relationship management, will complement and benefit from the automated process.
Risk Monitoring and Regulatory Compliance
In the aftermath of the 2008 financial crisis, national regulators have been continuously tightening regulation of the financial industry to protect both customers and the industry in general. Increased capital, liquidity and transparency requirements put heavy burden on the regulated financial industry while creating a competitive advantage for non-regulated players, such as financial technology providers. Subsequently, banks have to budget higher compliance costs for adhering to regulatory requirements. Regulatory reporting requires pooling data from various systems, including: financial ledger, accounting system, treasury, asset quality monitoring, and collections databases,
21 ‘Robotic Process Automation: Fast, Accurate, Efficient’, A.T. Kearney, accessed April 3, 2017,
https://www.atkearney.com/financial-institutions/ideas-insights/robotic-process-automation

68 DATA ANALYTICS AND DIGITAL FINANCIAL SERVICES
among others. Regular stress tests require strong IT infrastructure with a high capacity to store and process large amounts of data. Moreover, KYC compliance requires real-life data-feeds for timely and safe decision-making. Data necessary for measuring and monitoring market, credit, AML, and liquidity risks are ideally housed in a unified repository to enable a DFS provider to have a complete picture of risk across its entire portfolio. This unified repository also enables the DFS provider to run scenario analyses and stress tests to meet regulatory requirements. Regulatory compliance incurs direct costs through the higher cost of capital, as well as indirect costs, such as
establishing reporting processes, allocating staff time and, in some cases, investment in new technology.
Fraud Prevention
With global trends moving towards cloud computing, data governance and protection becomes increasingly important. DFS providers have to pay closer attention to customer transaction behavior. They must also perform KYC compliance in order to detect potential fraudulent activities – such as money laundering and false identity – while avoiding or reducing operational and financial risks. New cybersecurity interventions and regulations
will require DFS providers to develop and maintain tools aimed at protecting external threats and potential criminal activities. Maintaining and aggregating the appropriate data necessary to build fraud prevention and operational risk models can reduce DFS provider exposure. Real-time data streaming and processing enables them to detect fraud faster and more precisely, thus reducing potential risks of losses. For example, if a customer’s credit or debit cards are being used from an unusual geographical location or at unusual frequency, DFS providers can alert the customer and potentially block the processing of these suspicious transactions.
In the context of DFS providers that offer P2P services, providers can use a variety of tools to determine whether transactions are fraudulently being deposited into someone else’s account in order to bypass fees. Instead of using their account and paying fees, there is a deposit (from an agent account) directly into the recipient account. Transaction speed can give a basic indication; if money is deposited into an account and then withdrawn again in a very short period of time, there is a fairly good chance that it was a direct deposit. Transaction location gives an even better indication because if the location
of the agents doing the deposit and withdrawal is some distance apart, it is unlikely, or even impossible, that the customer could have traveled between those points in the interval between transactions. It should be possible to create alerts for this kind of behavior, and agents who do unusually high numbers of direct deposits can be followed up. This will not catch transactions between customers living in close proximity, so many DFS providers also perform mystery shopper research to better understand direct deposit levels.
Data Tracking for Fraud Detection
1.2_DATA APPLICATIONS

DATA ANALYTICS AND DIGITAL FINANCIAL SERVICES 69
Use Case: User Interaction Management
Managing customers through the lifecycle, encouraging increased usage, and managing new behavior falls within the remit of the marketing team. However, there is also an operational aspect to customer management that is predominantly a concern for the customer service, risk and technical teams. These teams are responsible for ensuring that the user interaction is as designed, detecting and fixing any issues. They are also responsible for managing the user interaction for business customers and internal users.
In this regard, it is important to define the ‘normal’ expected usage and behavior of the system so forecasts can be made for both technical and commercial planning. Measures are usually set from the top down, such as monthly business targets and strategic goals. With that said, some outcome metrics need to be gathered from the ‘bottom up’, such as measurements of the average usage of a service. As previously discussed, using averages can be misleading, and behavior may need to be broken into sectors, and then aggregated into an ‘average view’ of activity against which plans can be made. For example, the technical team needs to know both the expected number of transactions per
day and also the likely busy periods so they can ensure the system can cope with the peaks.
Defining ‘normal behavior’ patterns is fundamental to risk management. Activity patterns that stray from the agreed norms, particularly transactional and service use data, should be flagged. These patterns should be reviewed to determine whether the unusual behavior was legitimate, or a potential case of fraud. As well as customer and agent behavior, it is also wise to profile ‘normal activity’ for employee interactions in the system. For example, is one employee looking at significantly more customer records than a ‘normal’ employee in the same role, or accessing the system outside of their normal shift patterns? This abnormal activity could point to potential fraudulent activity.
Customer Service Efficiency Improvements
Customer service teams in the call centers are the employees closest to the DFS customer on a day-to-day basis. Because of this, they can provide early warning of any major issues that may arise. Often, they will be the first to learn of a system fault or fraudulent agent behavior, so a process is needed to alert the appropriate team of any potential issues based on the (sense-checked) information received from customers. These teams are
also likely to hear about minor service-affecting problems that prevent customers from transacting optimally, such as lack of agents, restrictive transaction limits and short transaction timeouts. It is therefore important to collect statistical data on the calls received, including complaints and suggestions. Leveraging this type of data is exemplified in Case 8.
Monitoring the number of calls as the service grows helps to determine how many call center representatives are needed. For some busy services, only a proportion of the calls presented actually make it to a customer care line. In this case, the calls attempted versus the calls presented is an important figure as this indicates either a major issue or inadequate staffing. The most frequently reported call center issues are forgotten PINs, lost phones or cards, transactions sent to the wrong recipients, and lost voucher codes. The number of calls that can be taken is dependent on the speed of the back-office system and how quickly it can respond in resolving the issue. As call center costs are generally high, the data they provide should be used to speed up the issue resolution process and to increase the number of calls each representative can take. These data can also be used to improve the user experience so that the customer makes fewer mistakes.

70 DATA ANALYTICS AND DIGITAL FINANCIAL SERVICES
CASE 8Safaricom M-Pesa - Using KPIs to Improve Customer Service and ProductsUsing Data Analytics to Identify Operational Bottlenecks and Prioritize Solutions
M-Pesa in Kenya was the pioneer of DFS at scale, with 20.7 million customers, a thirty-day active base of 16.6 million,22 and revenue reported in 2016 of $4.5 billion.23 When Safaricom launched the service in 2007, there were no templates or best practices; everything was designed from scratch. Continuous operational improvement was essential as the service scaled.
Uptake for the service was unexpectedly high from the start, with over 2 million customers in its first year, beating forecasts by 500 percent. This growing demand forced rapid scale, and required operations to proactively anticipate scaling
problems in both the technology and business processes, as a bad customer experience could quickly erode customer trust. Data-driven metrics supported the team to plan and guide operations appropriately.
As service uptake was unexpectedly high from the start, the number of calls to the customer service call center was correspondingly much higher than anticipated, resulting in a high volume of unanswered calls. This problem established a KPI that the customer care team needed to resolve to acceptable levels.
The problem was first tackled by recruiting additional staff, but recruitment alone could not keep
pace with the increase in customer numbers. To identify bottlenecks and prioritize solutions, the team analyzed their data. PABX call data and issue resolution records were examined and found the following:
• Length of Call Time: The average call was taking 4.5 minutes, around double the length of time budgeted for each call.
• Key Issues for Quick Resolution: The two key call types to be tackled for optimization were customers forgetting PINs and customers sending money to the wrong phone number; this covered 85 percent to 90 percent of long calls coming into the call center.
22 Richard Mureithi, ‘Safaricom announces results for the financial year 2016’. Hapa Kenya, May 12, 2017, accessed April 3, 2017,
http://www.hapakenya.com/2016/05/12/safaricom-announces-results-for-the-financial-year-2016/23 Chris Donkin, ‘M-Pesa continues to dominate Kenyan market’. Mobile World Live, January 25, 2017, accessed April 3, 2017,
https://www.mobileworldlive.com/money/news-money/m-pesa-continues-to-dominate-kenyan-market/
1.2_DATA APPLICATIONS

DATA ANALYTICS AND DIGITAL FINANCIAL SERVICES 71
Managing by KPIs is a critical element of operations. Analyzing the data behind KPIs in detail can help to identify operational bottlenecks, and may even reveal other operational factors that push metrics beyond thresholds. Understanding the data that drive a KPI can make them more useful.
The analysis accomplished two things. First, bottlenecks were successfully identified, passing key insights into operations. Second, other operational issues were uncovered, mainly, the extent to which customers erroneously sent money and forgot their pins. Managing against the Unanswered Calls KPI therefore delivered broader operational benefits.
Using the analytic results, operations implemented a resolution strategy. First, by understanding lengthy versus short problem types, difficult issues could be rapidly identified and passed quickly to a back-office team. This reduced customer wait times and bottlenecks, allowing more customers to be processed per day. Second, operations and product development teams worked to reduce times across all call types. This was achieved by improving technical infrastructure and user interface, mitigating the problems that caused lengthy calls. The combination of initiatives reduced the Call Length KPI and number of Unanswered Calls KPI, shifting both to acceptable levels despite customer numbers continuing to grow beyond forecasted levels.

72 DATA ANALYTICS AND DIGITAL FINANCIAL SERVICES
Use Case: Technical Operations Data
By its very nature, a DFS service needs to be available 24 hours a day, seven days a week, and is normally designed to process large volumes of system interactions, both financial and non-financial. For this reason, the service needs to be proactively monitored with preventative action taken to ensure continuous service availability. Data from service diagnostics are typically used to perform this analysis. Technical performance dashboards need to be updated in real-time to show system health. They should be automatically monitored and engineered to alert the responsible functions and people if a potential problem is spotted. The concept of using data to ‘understand normal’ is used to proactively detect faults in various layers of the service, and automatic monitoring solutions are set up to detect when threshold settings are breached. For example, if a DFS system normally processes a given number of transactions per second (TPS) every Thursday evening, but one Thursday the figure is much lower, it signals that there is likely a problem that requires action.
Trends can be used to predict performance issues while also identifying specific incidents; because of this, the team must also consider performance over time. Trend analysis is vital in capacity planning, and system usage and growth patterns give important clues as to when extra system capacity will be needed. Whether
the system is outsourced or an internal development, it is important that the technical team monitor service levels and capacity trends, planning remedial actions. The key data normally required include system availability, planned and unplanned downtime, transaction volume, and peak and sustained capacity.
Transactions and Interactions
A transaction is a financial money movement, usually the act of debiting one account and crediting
another. In order to make that happen, the user has to interact with the system. Those interactions can themselves offer insights, and are frequently used in digital product development of smartphone and web services to help understand the customer better.
DFS interactions, even using basic phones, can be measured and can provide useful data about the customer experience for a service. For example, it is possible to measure interactions such as ‘abandoned attempts to perform a financial transaction’, then diagnose what prevented the customers from completing these transactions. Another example is when customer services interact with the system on a customer’s behalf, for example, resetting a forgotten PIN. These interactions are rarely measured, but can also provide useful insights to improve service operations.
Successful DFS services have good communication between the commercial and technical teams. The commercial team should proactively discuss their marketing plans and forecasts as well as any competitive activity in order to prepare the technical team for potential volume changes. Regular meetings (at least quarterly) are needed to review the latest volume forecasts based on the previous quarter’s results and planned marketing activity. This enables the technical team to plan accordingly. The technical team must, in turn, advise any partners that may be affected by a change in forecast. This is particularly relevant to the MNO partners, as there have been several instances of unmanageable SMS volume requirements during unusually successful promotions. Similarly, if technical changes or overhauls are planned, marketing needs to be aware and should avoid activities that might put additional strain on the system at that time.
Lessons Learned from Operations and Performance Management
Record the Business Benefit of Airtime Sales: Reports can be misleading when customers use DFS to buy airtime. Depending on the core business of the DFS provider, selling prepaid airtime can either be a source of revenue or a cost savings. For non-MNOs, each airtime sale will attract a small commission, as they are acting as an airtime distributor. This income should
1.2_DATA APPLICATIONS
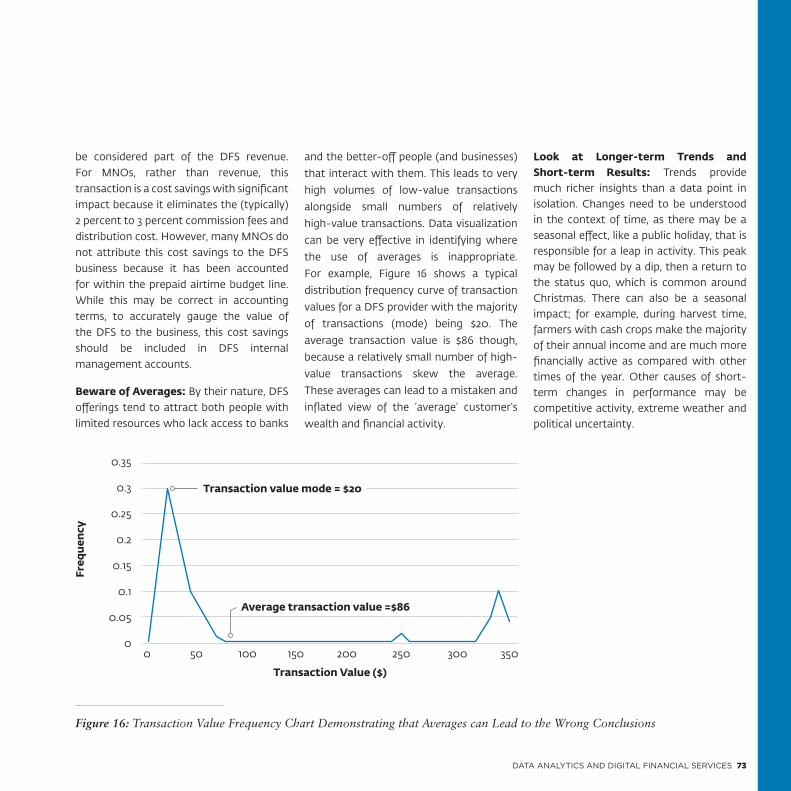
DATA ANALYTICS AND DIGITAL FINANCIAL SERVICES 73
be considered part of the DFS revenue. For MNOs, rather than revenue, this transaction is a cost savings with significant impact because it eliminates the (typically) 2 percent to 3 percent commission fees and distribution cost. However, many MNOs do not attribute this cost savings to the DFS business because it has been accounted for within the prepaid airtime budget line. While this may be correct in accounting terms, to accurately gauge the value of the DFS to the business, this cost savings should be included in DFS internal management accounts.
Beware of Averages: By their nature, DFS offerings tend to attract both people with limited resources who lack access to banks
and the better-off people (and businesses)
that interact with them. This leads to very
high volumes of low-value transactions
alongside small numbers of relatively
high-value transactions. Data visualization
can be very effective in identifying where
the use of averages is inappropriate.
For example, Figure 16 shows a typical
distribution frequency curve of transaction
values for a DFS provider with the majority
of transactions (mode) being $20. The
average transaction value is $86 though,
because a relatively small number of high-
value transactions skew the average.
These averages can lead to a mistaken and
inflated view of the ‘average’ customer’s
wealth and financial activity.
Look at Longer-term Trends and Short-term Results: Trends provide much richer insights than a data point in isolation. Changes need to be understood in the context of time, as there may be a seasonal effect, like a public holiday, that is responsible for a leap in activity. This peak may be followed by a dip, then a return to the status quo, which is common around Christmas. There can also be a seasonal impact; for example, during harvest time, farmers with cash crops make the majority of their annual income and are much more financially active as compared with other times of the year. Other causes of short-term changes in performance may be competitive activity, extreme weather and political uncertainty.
Figure 16: Transaction Value Frequency Chart Demonstrating that Averages can Lead to the Wrong Conclusions
0.35
0.3
0.25
0.2
0.15
0.1
0.05
0
Transaction Value ($)
Freq
uen
cy
Transaction value mode = $20
Average transaction value =$86
0 50 100 150 200 250 300 350

74 DATA ANALYTICS AND DIGITAL FINANCIAL SERVICES
Beware of Vanity Metrics: Vanity metrics might look good on paper, but they may give a false view of business performance. They are easily manipulated and do not necessarily correlate to the data that really matter, such as engagement, acquisition cost, and, ultimately, revenues and profits. A typical example of DFS vanity metrics is reporting registered, rather than active, customers. Also, reporting total agents instead of active agents. Only by focusing on the real KPIs and critical metrics is it possible to properly understand the company’s health. If a business focuses on the vanity metrics, it can get a false sense of success.
Service Level Data Must Be Relevant to the Business Objectives: Each operations team collects a wealth of data about how its system is performing. However, in complex, multi-partner DFS, they may not consider the end-to-end service performance and its effect on user experience. For a customer, the performance indicator that is of relevance is the end-to-end transaction performance; did the transaction complete, and how long did it take? It is surprising how few DFS measure this end-to-end transaction performance given its pivotal role in establishing and maintaining customer trust, establishing acceptance of the DFS
and maintaining the reputation of the business. Figure 17 illustrates the issue for a customer using their phone to pay a bill. In this case, there are three ‘system owners’ involved: an MNO providing connectivity, the DFS providing the transaction, and the biller being paid.
Each system returns its own efficiency data, but the customer experience may be quite different if there are hand-off delays between systems. Another common example is when MNOs provide Unstructured Supplementary Service Data
(USSD) sessions with either too short a
timeout or a USSD dropout fault so some
customers physically cannot complete a
transaction in the time allocated. It should
be straightforward in a supplier-vendor
relationship to ask for data that will show
relevant information, for example, USSD
dropouts or transaction queues. However,
it is often a critical issue in DFS provision
that there are no direct or comprehensive
service level agreements (SLA), which
can sometimes make it impossible to
understand information in this detail.
Figure 17: Transaction Time: System Measures versus Customer Experience
MNO delivers transaction
request
DFS provider confirms details & forwards
transaction information
Utility billings system
confirms the transaction
can proceed
DFS provider completes the
transaction
MNO delivers transaction
confirmation
Technical
Timeline
Customer
Timeline
Time = t1 + t2 + t3 + t4 + t5
t1 t2 t3 t4 t5
1.2_DATA APPLICATIONS

DATA ANALYTICS AND DIGITAL FINANCIAL SERVICES 75
Filtering the Data Deluge: Every interaction with a DFS system can generate a large number of data points. Some of these will be financial, and some will record what interface is being used, or even how long it takes the user to navigate the user experience. The intensity of information gathered rises vastly as systems make increasing use of more advanced user interfaces, such as smartphones. This can lead to information overload and ‘filter failure’ – essentially, an inability to see the woods for the trees. This, along with constraints around securing the necessary resources to manage these new data feeds, is the reason why so little of this information is being used by the business for decision-making. Collating and correlating external information with in-house data can lead to a loss of key insights.

76 DATA ANALYTICS AND DIGITAL FINANCIAL SERVICES
CASE 9M-Kopa Kenya - Innovative Business Models and Data-driven StrategiesData-driven Business Culture Incorporates Analytics Across Operations, Products and Services
Established in Kenya in 2011, M-Kopa started out as a provider of solar-powered home energy systems, principally for lighting while also charging small items like mobile phones and radios. The business combines machine-to-machine technology, using embedded SIM cards with a DFS micro-payment solution, meaning the technology can be monitored and made available only when advance payment is received. Customers buy M-Kopa systems using ‘credits’ via the M-Pesa mobile money service, then pay for the systems using M-Pesa until the balance is paid off and the product is owned. In recent years, the business has expanded into other areas including the provision of home appliances and loans, using customer-owned solar units as refinancing collateral. These products are offered
to customers who have built an ‘ability-to-pay’ credit score metric, as assessed by their initial system purchase and subsequent repayment. M-Kopa is now also available in Uganda, Tanzania and Ghana.
M-Kopa uses data proactively across the business to improve operational efficiency. Its databases amass information about customer demographics, customer dependence on the device and repayment behavior. Each solar unit automatically transmits usage data and system diagnostic information to M-Kopa, informing them when, for example, the lights are on. All of this can be analyzed to improve quality of service, operational efficiency and understanding of customer behavior.
Technical Capacity Management
An analysis of customer usage and repayment behavior shows that users prefer to buy credits in advance in order to secure reliable power for the days ahead. By knowing when customers are likely to pay (and how far in advance), M-Kopa can forecast expectations and plan accordingly, ensuring their customers will not be affected by announced M-Pesa outages that might prevent these payments from posting.
Customer Service
M-Kopa devices communicate battery data when they check in, and data analysis allows customer service to check whether the units are operating as intended and allows proactive and preventative maintenance that can be performed remotely:
1.2_DATA APPLICATIONS

DATA ANALYTICS AND DIGITAL FINANCIAL SERVICES 77
A data-driven corporate culture is necessary to integrate analytics and reporting throughout the entire enterprise. This helps to leverage data sources and analytics across multiple areas to engage new customers, manage sales teams, provide better customer service, and develop new products.
• If a customer complains that they are not receiving the expected amount of power, battery dashboards are used to diagnose the problem. For example, the battery is not being charged fully during daylight hours.
• Despite good manufacturing quality controls, there are always variations in battery performance when units are in the field, determined by factors such as usage patterns, or environmental conditions. M-Kopa has created predictive maintenance algorithms to detect sub-optimal battery performance, allowing it to intervene and arrange for a free replacement before battery ‘failure’ occurs.
Sales Team Management
The field sales team sells M-Kopa products and services directly to customers. Sales representatives use a smartphone app to log all of their activities digitally, in real time. This allows a detailed understanding of their performance and fast turnaround when dealing with issues. Dynamic online performance measures and league tables can be broken down by individual and are available to the sales management team and team leaders to encourage performance improvements through gamification.24 The app also allows team members to track their commission and any additional bonuses and incentives.
Targeting Likely Customers for Additional Sales
The customer repayment behavior can provide a lot of information about financial health and credit-worthiness. Battery data show a customer’s dependence on the device for lighting, which adds a deeper level of understanding. This information is used to identify and actively target existing customers for upgrades and additional services. M-Kopa also shares this information with credit bureaus to help provide customers with a credit rating.
24 Gamification is the application of game-design elements and game principles in non-game contexts. More examples within DFS can be found from studies on the CGAP website:
https://www.cgap.org/blog/series/gamification-and-financial-services-poor/

78 DATA ANALYTICS AND DIGITAL FINANCIAL SERVICES
Storing System Interactions: Even a few years ago, when many DFS offerings were being launched, data capture and storage was relatively expensive and cumbersome, and so data that was not immediately needed to run a business was not retained. New technology allows cheap and plentiful data storage. Though normally ignored, there are also new tools for analyzing data that are in logfiles on servers that make it possible, with the right tools, to correlate multiple sources of data to provide richer information about services. It is strongly recommended that DFS providers collect and store every bit of data they can about every system interaction, even those that were declined. Whilst it may not seem useful or relevant to current operations, it may well be of value at a future date for advanced data analytics or fraud forensics.
Non-repudiation principles require that these changes must be recorded as additional events, rather than attempting to edit previously finalized records. For example, if commission needs to be clawed back from an agent, this should be recorded explicitly as a separate (but linked) activity, rather than silently paying a smaller amount, or simply adjusting the commission payable file.
Combining Data to Add Context: Combining DFS provider data with data from partners can have many operational benefits. For example, where there is
collaboration with an MNO, there is also information on where the sender and recipient were physically located, the SIM card used, the kind of phone used, potential call records, and customer recharge patterns. As many markets have a strict SIM card registration mandate, the customer KYC information can also be used to complete and cross-reference records. While some of these parameters are not of primary importance to transactions, these data are useful in determining system anomalies; for example, if a customer normally transacts from a particular phone, and that phone has changed, it may be that the transaction is fraudulent. Further evidence may be gathered by cross-referencing the location where the transaction took place with the customer’s normal location log.
There can be challenges in trying to correlate data from different sources, which require consideration during the database design process. For example, even when the MNO is part of the same organization as the DFS provider, data sharing can be an issue because the two systems have not been designed to provide information services to one another. Retrospectively trying to link the telecoms data from a customer system interaction with the DFS financial transaction information is not simple. This is usually because there is no common piece of data linking the two records, and
even clocks time-stamping the event on the two systems are unlikely to be perfectly synchronized. Because of this, many systems only perform data combining activity by exception, usually for fraud investigations on a case-by-case basis. However, the additional context provided by combined data can add layers of value, particularly in the case of proactive fraud monitoring. Making it easier to combine data so that it can be used in ‘business-as-usual’ operational activities is worth considering, particularly for more mature DFS operations.
Failed Attempts: It is common for DFS providers to retain the data associated with successful transactions, where the requested activity was completed. However, failed transactions can also provide insights. The reasons why particular transactions were declined can point to very specific needs, such as the need to provide targeted information and education, a technical fault, or a shortcoming in the service design that needs to be amended to provide a more intuitive user experience.
In order to perform these advanced analytics, every bit of information about every system interaction should be collected and stored, even if its relevance is not immediately obvious.
1.2_DATA APPLICATIONS

DATA ANALYTICS AND DIGITAL FINANCIAL SERVICES 79
Single Source of Truth: When there are multiple systems, it is common to have the same data duplicated in multiple places. This is often because current infrastructure makes it hard to combine data sources any other way. This data duplication can lead to issues regarding ‘source of truth,’ in other words, questions around which source of data to trust when there is conflicting information. All systems are occasionally subject to errors, and when there is a dispute over transaction details or a debate whether funds were transferred, there has to be clear agreement about whose data should be believed. Working
through these details is part of any project that combines and compares sources of information; it is also important to clearly understand whether a record is final or can still be updated. Incorrectly treating a non-final record as final can lead to havoc in data analysis, creating mistrust in the platform integrity.
1.2.3 Analytics and Applications: Credit ScoringCredit scoring may be broadly described as the study of past borrower behavior
and characteristics to predict future behavior of new and existing borrowers.25 The emergence of big data and the sources and formats of these data have presented additional approaches to the credit scoring process. Incorporating these alternative data sources drives alternative credit scoring models. This section looks at how data drives credit scoring, and which types of data work best for various needs. The fundamental credit scoring relationships are represented as a timeline in the figure below.
Figure 18: Timeline Definition of Credit Scoring
25 Schreiner, ‘Credit scoring for microfinance: Can it work?’, Journal of Microfinance/ESR Review, Vol. 2.2 (2009): 105-118
Past
Borrower Characteristics
Present Future
Loan Repayment Behavior
Borrower Characteristics
Loan Repayment Behavior

80 DATA ANALYTICS AND DIGITAL FINANCIAL SERVICES
Below are the key points illustrated in
Figure 18:
1. Past: Data (or, in their absence,
experience) is studied to understand
which borrower characteristics are most
significantly related to repayment risk.
This study of the past informs the choice
of factors and point weights in the
scorecard.
2. Present: The scorecard (built on past
borrower characteristic data) is used to
evaluate the same characteristics in new
loan applicants. The result is a numeric
score that is used to place the applicant
in a ‘risk group’, or range of scores with
similar observed repayment rates.
3. Future: The model assumes that new
applicants with the same characteristics
as past borrowers will exhibit the same
repayment behavior as those past
borrowers. Therefore, the past observed
delinquency rate for a given risk group is
the predicted delinquency rate for new
borrowers in that same risk group.
An entire handbook can be written on credit scoring, and indeed several thorough and accessible texts have been published on the topic over the past decade.26 In addition, CGAP recently published an introduction to credit scoring in the context of digital financial services.27 For the purpose of this handbook, the remainder of this credit section focuses on:
1. How data are turned into credit scores
2. How data are being used to meet credit assessment challenges in developing markets
Scorecard Development
Credit scorecards are developed by looking at a sample of data on past loans that have been classified as either ‘good’ or ‘bad’. A common definition of ‘bad’ (or ‘substandard’) loans is ‘90 or more consecutive days in arrears’,28 but for scorecard development, a bad loan should be described as one (given hindsight) that the FIs would choose not to make again in the future. For each new loan applicant,
the scoring model will calculate and report what percentage of past borrowers with the same combination of borrower characteristics were ‘bad’.
It is important to conduct analysis on both the good and the bad loans. Studying the risk relationships in credit data is as simple as looking at the numbers of good and bad loans for different borrower characteristics. The more bad loans as a share of total loans for a given borrower characteristic, the more risk.
The cross-tabulation, or contingency table, is a simple analytical tool that can be used to build and manage credit scorecards. Table 4 shows the number of good and bad loans across ranges of values for an example MNO data field, in this case, time since registration on the mobile network. Suppose the expectation is that applicants with a longer track record on the mobile network will be lower risk (usually longer track records, whether in employment, in business, in residence, or as a bank customer, are linked to lower risk).
26 See for example: Siddiqi, ‘Credit risk scorecards: developing and implementing intelligent credit scoring’, John Wiley and Sons, Vol. 3 (2012). Anderson, ‘The credit scoring toolkit: Theory
and practice for retail credit risk management and decision automation’, Oxford University Press, 200727 ‘An Introduction to Digital Credit: Resources to Plan a Deployment’, Consultative Group Against Poverty via Slide Share, June 3, 2016, accessed April 3, 2017,
http://www.slideshare.net/CGAP/an-introduction-to-digital-credit-resources-to-plan-a-deployment28 For DFS and micro lenders, the ‘bad’ loan definition can often be a much shorter delinquency period such as 30 or 60-days in consecutive arrears. Product design (including penalties
and late fees) and the labor involved in collection processes will influence the point at which a client is better avoided, or ‘bad’.
1.2_DATA APPLICATIONS

DATA ANALYTICS AND DIGITAL FINANCIAL SERVICES 81
Table 4: Loan Cross-tabulation
R0w <= 2 Months > 2 Months and <= 1 Year
> 1 Year and <= 2 Years
> 2 Years and >= 3 Years
> 3 Years Row Total
A Goods 115 161 205 116 203 800
B Bads 48 48 50 24 30 200
C Bad Rate 29.4% 23.0% 19.8% 17.3% 12.7% 20.0%
D Total 163 210 255 140 233 1,000
E % Total Loans 16.3% 21.0% 25.5% 14.0% 23.3%
Table 4 can be read as follows:
Row A: Number of good contracts in group (column)
Row B: Number of bad contracts in group (column)
Row C: Number of bad contracts (row B) / Number of total contracts (row D)
Row D: Number of total contracts (row A + row B)
Row E: Total contracts in the group (column) divided by all contracts (1,000)
To conduct analysis, the next step is to look for sensible and intuitive patterns. For example, the bad rate in row C of Table 4 clearly decreases as the time passed since network registration increases. This matches the initial expectation. An easy way to think about each group’s
risk is to look at its bad rate relative to the 20 percent (average) bad rate by time since registration:
• Less than 2 months, the bad rate is 29 percent, one and half times the average.
• Between 1 year and 2 years, the bad rate of 19.8 percent, or average risk.
• More than 3 years, the bad rate is 12.7 percent, a little over half the average risk.
In traditional credit scorecard development, analysts look for simple patterns – including steadily rising or falling bad rates – that make business (and common) sense. Credit scorecards developed in this way translate nicely to operational use as business tools that are both transparent and well-understood by management. An alternative approach to scorecard development is data
mining, or using more complex machine-learning algorithms for any relationships in a data set, whether understood by a human analyst or not. Although a purely machine-learning approach might result in improved prediction in some situations, there are also difficult-to-measure but practical advantages to business and risk management fully understanding how scores are calculated.
Cross-tabulation or similar analysis of single predictors is the core building block of credit scoring models.29 Creating cross-tabulations like those in the example above is easy using any commercial statistical software or the free open-source ‘R’ software.
29 In fact, logistic regression coefficients can be calculated directly from a cross-tabulation for a single variable
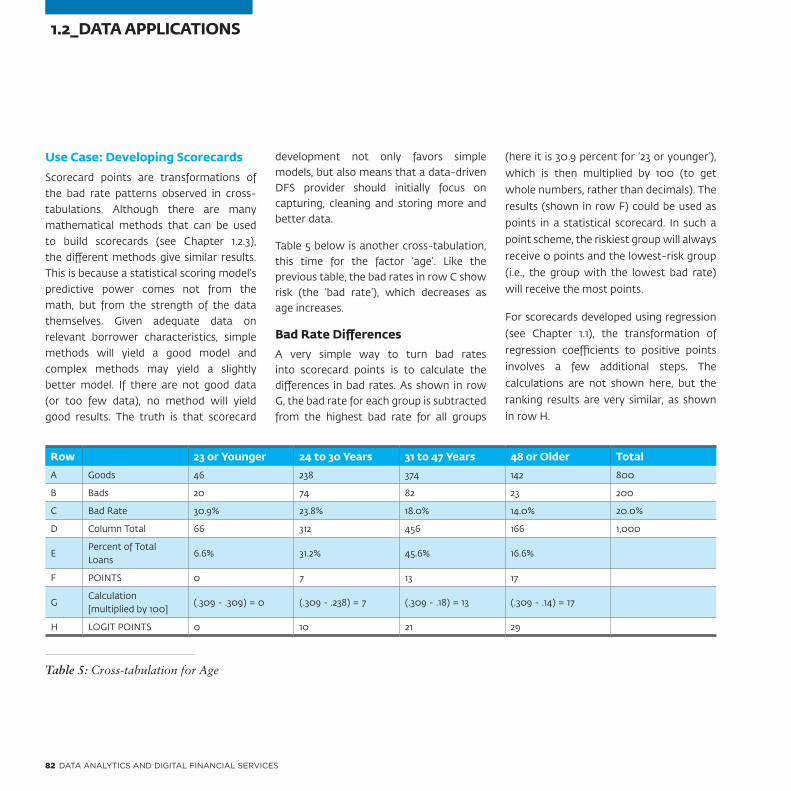
82 DATA ANALYTICS AND DIGITAL FINANCIAL SERVICES
Use Case: Developing Scorecards
Scorecard points are transformations of the bad rate patterns observed in cross-tabulations. Although there are many mathematical methods that can be used to build scorecards (see Chapter 1.2.3), the different methods give similar results. This is because a statistical scoring model’s predictive power comes not from the math, but from the strength of the data themselves. Given adequate data on relevant borrower characteristics, simple methods will yield a good model and complex methods may yield a slightly better model. If there are not good data (or too few data), no method will yield good results. The truth is that scorecard
development not only favors simple models, but also means that a data-driven DFS provider should initially focus on capturing, cleaning and storing more and better data.
Table 5 below is another cross-tabulation, this time for the factor ‘age’. Like the previous table, the bad rates in row C show risk (the ‘bad rate’), which decreases as age increases.
Bad Rate Differences
A very simple way to turn bad rates into scorecard points is to calculate the differences in bad rates. As shown in row G, the bad rate for each group is subtracted from the highest bad rate for all groups
(here it is 30.9 percent for ‘23 or younger’),
which is then multiplied by 100 (to get
whole numbers, rather than decimals). The
results (shown in row F) could be used as
points in a statistical scorecard. In such a
point scheme, the riskiest group will always
receive 0 points and the lowest-risk group
(i.e., the group with the lowest bad rate)
will receive the most points.
For scorecards developed using regression
(see Chapter 1.1), the transformation of
regression coefficients to positive points
involves a few additional steps. The
calculations are not shown here, but the
ranking results are very similar, as shown
in row H.
Row 23 or Younger 24 to 30 Years 31 to 47 Years 48 or Older Total
A Goods 46 238 374 142 800
B Bads 20 74 82 23 200
C Bad Rate 30.9% 23.8% 18.0% 14.0% 20.0%
D Column Total 66 312 456 166 1,000
EPercent of Total Loans
6.6% 31.2% 45.6% 16.6%
F POINTS 0 7 13 17
GCalculation [multiplied by 100]
(.309 - .309) = 0 (.309 - .238) = 7 (.309 - .18) = 13 (.309 - .14) = 17
H LOGIT POINTS 0 10 21 29
Table 5: Cross-tabulation for Age
1.2_DATA APPLICATIONS

DATA ANALYTICS AND DIGITAL FINANCIAL SERVICES 83
The larger the differences in bad rates across groups, the more points a risk factor receives in a scorecard. Using the simple method of ‘bad rate differences’ (described above), we can see in Table 6 below, ‘bureau credit score’ takes a maximum of 39 points, while ‘marital status’ takes a maximum of only eight points. This is because there are much larger differences in the highest and lowest bad rates for credit history than there are for marital status.
Factors that get the Most Points in Credit Scorecards
Table 6: Examples of Scorecard Factor Importance
Bureau Credit Scores
Group < 590 Points 590 - 670 Points 671 - 720 Points > 720 Points Sample Bad Rate
Bad Rate 39% 23% 13% 0% 20%
POINTS 0 16 26 39
Marital Status
Group Divorced Unmarried Married Widowed Sample Bad Rate
Bad Rate 25% 24% 19% 17% 20%
POINTS 0 1 6 8
Since risk-ranking across algorithms is often very similar, many professionals prefer to use simpler methods in practice. Leading credit scoring author David Hand has pointed out that: “Simple methods typically yield performance almost as good as more sophisticated methods, to the extent that the difference in performance may be swamped by other sources of uncertainty that generally are not considered.”30 The long-standing, widespread practice of using logistic regression for credit scoring speaks to the ease with which such models are presented as scorecards. These scorecards are well-understood by management and can be used to proactively manage the risks and rewards of lending.
30 David Hand, ‘Classifier technology and the illusion of progress’, Statistical Science, Vol. 21.1 (2006): 1-14

84 DATA ANALYTICS AND DIGITAL FINANCIAL SERVICES
When there are no historic data, but the provider has a good understanding of the borrower characteristics driving risk in the segment, an expert scorecard can do a reasonably good job risk-ranking borrowers.
An expert scorecard uses points to rank borrowers by risk, just as a statistical scorecard does. The main difference (and an important one) is that without past data, including data on delinquencies, there is no way for the FI to know with certainty if its understanding (or expectation) of risk relationships is correct.
For example, if we know age is a relevant risk driver for consumer loans and we have seen (in practice) that risk generally decreases with age, we could create age groups similar to those in Table 5. In this scenario, we assign points using a simple scheme where the group perceived as riskiest always gets zero points and the lowest-risk group always gets 20 points. In this case, an expert scorecard weighting of the ‘age’ variable might look like Table 7 below. These points are not so different from the statistical points for age shown in rows F and H of Table 5.
Expert Scorecards
Table 7: ‘Expert’ Points for ‘Age’
23 or Younger 24 to 30 Years 31 to 47 Years 48 or Older
POINTS 0 7 15 20
As long as risk-ranking is correct for each individual risk factor in an expert scorecard, the score from an expert scorecard will risk-rank borrowers similar to how a statistical scorecard ranks them.31 This means expert scorecards can be a useful tool to launch a new product for which there is no historic data. They are also a good way for DFS providers that are intent on being data-driven to reap some benefits of scoring – including improved efficiency and consistency – while building a better database.
31 Usually using expert judgment alone, providers incorrectly specify the risk-ranking relationship of one or more factors. Once performance (loan repayment) data are collected, it can
be used to correct any misspecified relationships, which will lead to improved risk-ranking of the resulting statistical model.
1.2_DATA APPLICATIONS

DATA ANALYTICS AND DIGITAL FINANCIAL SERVICES 85
Choosing a Set of Risk Factors
While the specific data fields available for credit scoring will vary greatly by product, segment and provider, generally scoring model data should be:
• Highly relevant
• Easy to consistently collect
• Objective, not self-reported
Some types of data tend to be good predictors of loan repayment across segments and markets. Table 8 presents some of these along with their commonly observed risk patterns.
The ‘best’ set of single variable predictors
are combined into a multivariate model.
While this can be done algorithmically
to maximize prediction, an appealing
approach for DFS providers is to choose
a set of factors that together create
a comprehensive risk profile for the
borrower,32 along the lines of the popular
five Cs of credit: capacity, capital, collateral,
conditions, and character. Such a model is
easy-to-understand for bankers and bank
management, and is consistent with risk
management frameworks such as the
Basel Capital Accords.
As each individually strong predictor is added to a multi-factor model, its risk-ranking improves. However, after a relatively small number of good individual predictors (typically 10 to 20), the incremental improvement for each additional factor drops rather sharply. Even if we purposefully select factors that do not seem highly correlated to one another, in reality, many of the factors will be correlated to some degree, leading to the diminishing returns of additional factors.
Type of Data Factor Risk Relationship
Behavioral
Purchases Risk decreases as disposable income increases
Deposits and account turnover Risk decreases as deposit and turnover increases
Credit history Risk decreases as positive credit history increases
Bill payment Risk decreases in line with timeliness of bill payments
Track RecordTime in residence, job, business Stability reduces risk
Time as client Clients with longer relationship are lower risk
Demographics
AgeRisk decreases with age and increases again around retirement age (mainly due to health risks)
Marital status Married people are more often settled and stable, which lowers risk
Number of dependentsIncreasing number of dependents can increase risk (particularly for single people), but in some cultures it instead lowers risk (greater safety net)
Home ownership Home owners are less risky than renters
Table 8: Data that are Often Effective for Credit Scoring
32 Siddiqi, ‘Credit risk scorecards: developing and implementing intelligent credit scoring’, John Wiley and Sons, Vol. 3 (2012)

86 DATA ANALYTICS AND DIGITAL FINANCIAL SERVICES
When a FI has enough data, it should give preference to data points that:
• Are objective and can be observed directly, rather than being elicited by the applicant
• Evidence relationships to credit risk that confirm expert or intuitive judgment
• Cost less to collect
• Can be collected from most, if not all, applicants
• Do not discriminate based on factors the borrower cannot control (i.e., age, gender, race) or that are potentially divisive (i.e., religion, ethnicity, language)
Use Case: Nano-Loans
Since banks must report nano-loan repayments to bureaus and central banks, nano-lending has brought millions of people who previously lacked access to banks into the formal financial sector across the world, establishing credit history that is a stepping stone to unlocking access to other types of loan products. However, some are concerned that nano-loans create a cycle of debt for low-income individuals. Several million people with bad nano-lending experiences could become blacklisted at local credit bureaus, which greater endorses the need for consumer protection.
This section looks at how data are being used to overcome some of the challenges that have long been barriers to financial inclusion. In particular, it is the digital data generated by mobile phones, mobile money and the internet that are helping put millions who have never had bank accounts or bank loans on the radar of formal FIs.
The case studies that follow investigate how MNO, social media and traditional banking data have been used to launch new products, to help more borrowers become eligible for formal loans and to evaluate small businesses, which are less homogeneous than individual consumers.
Credit Challenge 1: Verifying Income and Expenses
A significant retail lending challenge in developing markets is obtaining trustworthy data on new customer cash flow, for people and businesses alike. Cash flow, or income left after expenses, is the primary source of loan repayment and therefore a focus of retail lending models. Income levels are also used to determine how much financing an individual can afford.
The growth in mobile telephony and mobile money usage – particularly in Africa and
Asia – has created verifiable third-party digital records of actual payment patterns, such as top-ups and mobile money payments. These data, held by MNOs, provide a sketch of a SIM-user’s cash flows. POS terminals and mobile money tills can also paint a somewhat more complete picture of cash flows for merchants.
The following two cases look at how digital data have helped open huge markets for consumer nano-loans.
When you know how much money a person or company is dealing with on a daily, weekly and monthly basis, you can better estimate what loan size they will be able to afford.
1.2_DATA APPLICATIONS

DATA ANALYTICS AND DIGITAL FINANCIAL SERVICES 87
Commercial Bank of Africa (CBA) and mobile operator Safaricom were early to recognize the power of mobile phone and mobile money data.
M-Shwari, the first highly successful digital savings and loan product, is well known to followers of ‘fintech’ and financial inclusion. It has given small credit limits over mobile phones called nano-loans to millions of borrowers, bringing them into the formal financial sector. Similar products have since been launched in other parts of Africa, and new competition has crowded the market in Kenya. M-Shwari’s story is also an excellent study in using data creatively to bring a new product to market.
Modeling the Unknown
Credit scoring technology looks at past borrower characteristics and repayment behavior to predict future loan repayment. What about the case where there is no past repayment behavior? MNOs have extensive data on their clients’ mobile phone and, in many cases, mobile money usage, but it is less clear how that data can be used to predict the ability and willingness to repay a loan without data on the payment of past obligations.
By definition, there is no product-specific past data for a new product. One way to still use credit scoring with a new product is to use expert judgment and domain knowledge to build an ‘expert scorecard’, a tool that guides lending decisions based
on borrower risk-rankings. See call-out box on page 84.
Another way to use credit scoring with a new product is to study a set of relevant client data, such as MNO data, in relation to loan repayment information, such as:
• General Credit History or a Bureau Report: This only works for clients with a file in the bureau.
• Similar Credit Products: Another credit product similar enough to be relevant to the new product can be used as a gauge. While past repayment of that product may or may not be representative of future repayment of the new product, it may be an acceptable approximation, or ‘proxy’, for initial modeling purposes.
CASE 10M-Shwari Launches a Market for Nano LoansData Solutions to Assess the Creditworthiness of Borrowers with no Formal Credit History

88 DATA ANALYTICS AND DIGITAL FINANCIAL SERVICES
The first M-Shwari scorecard was developed using Safaricom data and the repayment history of clients that had used its Okoa Jahazi airtime credit product.33 The two products were clearly different, as shown in Table 9 below.
The M-Shwari product offered borrowers more money, flexibility of use and time to repay. The assumption was that those who had successfully used the very small Okao Jahzi loans
would be better risks for the larger loan product.
The first M-Shwari credit scoring model developed with the Okoa Jahazi data,34 together with conservative limit policies and well-designed business processes, enabled the launch of the product, which quickly became massively successful.
CBA expected the scorecard based on Okoa Jahazi data to be
redeveloped as soon as possible using the repayment behavior of the M-Shwari product itself. Some behaviors predictive of airtime credit usage did not translate directly to M-Shwari usage, and appropriate changes to the model based on the actual M-Shwari product usage data reduced non-performing loans by 2 percent. M-Shwari continues to update its scorecard periodically, based on new information.
M-Shwari’s successful launch and development illustrates that there are ways to use data-driven scoring solutions for completely new segments. It also reinforces the general truth about credit scoring that a scorecard is always a work in process. No matter how well a scorecard performs on development data, it should be monitored and managed using standard reports and be fine-tuned whenever there are material changes in market risks or in the types of customers applying for the product.
33 Cook and McKay, ‘How M-Shwari works: The story so far’, Consultative Group to Assist the Poor and Financial Sector Deepening 34 Mathias, ‘What You Might Not Know’, Abacus, September 18, 2012, accessed April 3, 2017, https://abacus.co.ke/okoa-jahazi-what-you-might-not-know/
Table 9: Okao Jahzi and M-Shwari Product Comparison
Product Okao Jahzi M-Shwari
Amount The lower of airtime spends over the last 7 days or 100 Kenyan shillings
100 to 10,000 Kenyan shillings
Purpose Used for airtime only Used for any purpose
Repayment Term 72 hours 30 days
1.2_DATA APPLICATIONS

DATA ANALYTICS AND DIGITAL FINANCIAL SERVICES 89
The M-Shwari nano-loan product succeeded, thanks to the timely confluence of:
• Access to MNO Data: CBA had a first-mover advantage due to its strong partnership with Safaricom. Today, Safaricom sells its MNO data to all banks in Kenya.
• A Well-designed Product: Small, short-term products are better fits for credit scoring, particularly for new products. Rapid feedback on the target population’s repayment performance enables timely model redevelopment and controls risk.
• Good Systems and People: The M-Shwari management team is lean and flexible, bringing together a unique combination of management and technical skills as well as the systems to ensure smooth implementation.
• Leveraging Outside Resources: Financial Sector Deepening (FSD) Kenya supported CBA with risk modeling expertise crucial to developing the first scoring model and transferring skills to M-Shwari’s team.
While M-Shwari’s success story is inspiring, there are many DFS providers that would like to get into the nano-lending space but may find it difficult. These DFS providers may not have relationships with MNOs or may lack the in-house ability to design digital savings and loans products and scoring models. The next case describes how vendors are facilitating the entry of DFS providers into mass-market nano-lending.
90 DATA ANALYTICS AND DIGITAL FINANCIAL SERVICES
CASE 11Tiaxa Turn-key Nano-lending ApproachDeveloping Data Products and Services Through Outsourced Subscription Services
Recognizing that many FIs in developing markets lack the resources to approach the DFS market using only internal resources, Tiaxa is offering its patented NanoCredits™ within a ‘turn-key’ solution that includes:
• Product design
• Customer acquisition (based on proprietary scoring models)
• Portfolio credit risk management
• Hardware and software deployment
• Around-the-clock managed service
• Funding facility for the portfolio (in some African markets)
Tiaxa brings together FIs and MNOs and forms three-way partnerships whereby:
• MNOs provide the data that drives their credit decision models
• FIs provide the necessary lending licenses (and formal financial sector regulation) and funding
• Tiaxa provides the end-to-end nano-loan product solution
In addition to providing the nano-loan product design and scoring models based on MNO data, in most cases, Tiaxa assumes and
manages portfolio credit risk. Loss risk is managed by directly debiting borrower MNO accounts to work out delinquencies, which are disclosed to borrowers in the product terms and conditions. Their long-term partnership business model works on terms that vary from profit-sharing to fee-per-transaction models.
Data Driving Tiaxa’s Scoring Models
While MNO datasets vary across countries and markets, the datasets that inform Tiaxa’s proprietary models typically will include some combination of the following types of data:
1.2_DATA APPLICATIONS
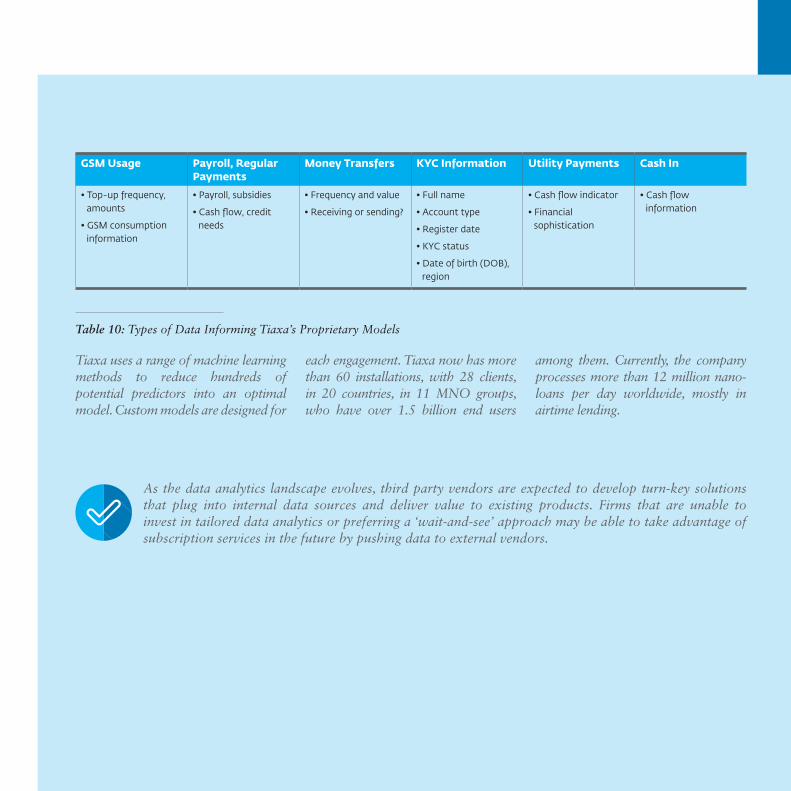
DATA ANALYTICS AND DIGITAL FINANCIAL SERVICES 91
As the data analytics landscape evolves, third party vendors are expected to develop turn-key solutions that plug into internal data sources and deliver value to existing products. Firms that are unable to invest in tailored data analytics or preferring a ‘wait-and-see’ approach may be able to take advantage of subscription services in the future by pushing data to external vendors.
Tiaxa uses a range of machine learning methods to reduce hundreds of potential predictors into an optimal model. Custom models are designed for
each engagement. Tiaxa now has more than 60 installations, with 28 clients, in 20 countries, in 11 MNO groups, who have over 1.5 billion end users
among them. Currently, the company processes more than 12 million nano-loans per day worldwide, mostly in airtime lending.
Table 10: Types of Data Informing Tiaxa’s Proprietary Models
GSM Usage Payroll, Regular Payments
Money Transfers KYC Information Utility Payments Cash In
• Top-up frequency, amounts
• GSM consumption information
• Payroll, subsidies
• Cash flow, credit needs
• Frequency and value
• Receiving or sending?
• Full name
• Account type
• Register date
• KYC status
• Date of birth (DOB), region
• Cash flow indicator
• Financial sophistication
• Cash flow information

92 DATA ANALYTICS AND DIGITAL FINANCIAL SERVICES
For FIs, the choice between working with vendors or working directly with MNOs to reach the nano-loan segment can only be made by considering market conditions and available resources. Some of the pros and cons of each approach are presented below.
Use Case: Alternative Data
Alternative data sources are showing promise for identity verification and basic risk assessment. Another way DFS providers
collect data from new applicants is to
ask them directly to provide information.
These requests can take the form of:
• Application Forms
• Surveys
• ‘Permissions’ to Access Device Data: This
can include permissions to access media
content, call logs, contacts, personal
communications, location information,
or online social media profiles
These non-traditional online data sources can and are being used to offer identity verification services and credit scores. The story of social network analytics firm Lenddo provides more background and some insight into how social media data can add value in the credit process.
Approach Opportunities Challenges
Working with MNO Data • Full control of products• Potentially more profitable
Need in-house skills in:
• Product development
• Risk modeling
Need systems and software to manage DFS products
Working with Vendor • Provides product, modeling and systems know-how
• Makes lending decisions
• Ready software solutions
• Dependence on vendor
• Model details may not be shared
• Technical skills not transferred
Table 11: Working with MNOs or Vendors: Opportunities and Challenges
1.2_DATA APPLICATIONS

DATA ANALYTICS AND DIGITAL FINANCIAL SERVICES 93
Lenddo co-founders Jeffrey Stewart and Richard Eldridge initially conceived the idea while working in the business process outsourcing industry in the Philippines in 2010. They were surprised by the number of their employees regularly asking them for salary advances and wondered why these bright, young people with stable employment could not get loans from formal FIs.
The particular challenge in the Philippines was that the country had neither credit bureaus nor national identification numbers. If people did
not use bank accounts or services – and less than 10 percent did – they were ‘invisible’ to formal FIs and unable to get credit. In developing their idea, Lenddo’s founders were early to recognize that their employees were active users of technology and present on social networks. These platforms generate large amounts of data, the statistical analysis of which they expected might help predict an individual’s credit worthiness.
Lenddo loan applicants give permission to access data stored on their mobile phones. The applicant’s
raw data are accessed, extracted and scored, but then destroyed (rather than stored) by Lenddo. For a typical applicant, their phone holds thousands of data points that speak to personal behavior:
• Three Degrees of Social Connections
• Activity (photos and videos posted)
• Group Memberships
• Interests and Communications (messages, emails and tweets)
More than 50 elements across all social media profiles provide 12,000 data points per average user:
CASE 12Lenddo Mines Social Media Data for Identity Verification and Risk ProfilingUsing Advanced Analytic Techniques and Alternative Data Sources for New Products
Table 12: Social Media Data Point Averages Per Average User
Across All Five Social Networks:
• 250+ first-degree connections
• 800+ second-degree connections
• 2,700+ third-degree connections
• 372 photos, 18 videos, 13 groups, 27 interests, 88 links, 18 tweets
7,900+ Total Message Communications:
• 250+ first-degree connections
• 5,200+ Facebook messages, 1,100+ Facebook likes
• 400+ Facebook status updates, 600+ Facebook comments
• 250+ emails

94 DATA ANALYTICS AND DIGITAL FINANCIAL SERVICES
Data Usage
Confirming a borrower’s identify is an important component of extending credit to applicants with no past credit history. Lenddo’s tablet-format app asks loan applicants to complete a short digital form asking their name, DOB, primary contact number, primary email address, school and employer. Applicants are then asked to onboard Lenddo by signing in and granting permissions to Facebook. Lenddo’s models use this information to verify customer identity in under than 15 seconds. Identity verification can significantly reduce fraud risk, which is much higher for digital loan products, where there is no personal contact
during the underwriting process. An example from Lenddo’s work with the largest MNO in the Philippines is presented below.
Lenddo worked with a large MNO to increase the share of postpaid plans it could offer its 40 million prepaid subscribers (90 percent of total subscribers). Postpaid plan eligibility depended on successful identity verification, and Telco’s existing verification process required customers to visit stores and present their identification document (ID) cards, which were then scanned and sent to a central office for verification. The average time to complete the verification process was 11 days.
Lenddo’s SNA platform was used to provide real-time identity verification in seconds based on name, DOB and employer. This improved the customer experience, reduced potential fraud and errors caused by human intervention, and reduced total cost of the verification process.
In addition to its identify verification models, Lenddo uses a range of machine learning techniques to map social networks and cluster applicants in terms of behavior (usage) patterns. The end result is a LenddoScore™
that can be used immediately by FIs to pre-screen applicants or to feed into and complement a FI’s own credit scorecards.
These algorithms turn an initially large number of raw data points per client into a manageable number of borrower characteristics and behaviors with known relationships to loan repayment.
1.2_DATA APPLICATIONS
DATA ANALYTICS AND DIGITAL FINANCIAL SERVICES 95
Use Case: Credit Scoring for Small Business
The examples discussed so far have focused on digital products aimed at mass-market consumers and merchants. The stream of behavioral data created in digital channels has understandably generated the most excitement about data analytics opportunities. However, most FIs also have ample opportunity to make better use of data in credit analysis and risk management of traditional and offline products that include, but are not limited to:
• Consumer Loans
• Credit Cards
• Micro, Small and Medium Enterprise (MSME) Loans and Leases
• Small Agriculture Loans and Leases
• Value-chain and Supply Chain Finance
For these products, FIs have traditionally collected a wealth of data, but not necessarily digitized or systemized its
capture, analysis and storage. In the best cases, LOS software facilitates digital capture of traditional data in a way conducive to data analysis, including credit scorecard development. As value chain and supply chain payments become digitized, there is an opportunity to leverage these data to project cash flows and build credit scores.
Credit Scoring Methodologies
FIs have several options for using the data they already collect for credit risk modeling. Three of the most common solutions are to develop proprietary credit scorecards either through internal expertise, by working with outside consultants or by outsourcing credit scoring to a third- party vendor.
Develop Proprietary Credit Scorecards
Banks in leading financial markets (for example, South Africa, North America, Continental Europe, and Singapore) employ
large teams that develop and maintain models, including separate models for application decision support, ongoing portfolio management (behavioral) and provisioning. As a first step to developing models in-house, FIs may opt to use external consultants to do initial developments and to build capacity with internal staff to take it forward.
Many DFS providers have data, data analysts, and in-house IT specialists capable of managing their own scoring systems. What those teams tend to lack is experience in credit scorecard development. Good data analytics projects require expert knowledge to succeed. Outsourced assistance can help knowledge transfer build in-house expertise as part of project support. When working with external consultants, DFS providers must ensure that the necessary tools and skills are transferred to the internal teams so that the scorecards can be managed and monitored going forward.

96 DATA ANALYTICS AND DIGITAL FINANCIAL SERVICES
A recent IFC project with a bank in Asia exemplifies how the process can work:
1. The bank shared its past portfolio data with the consultant.
2. The consultant prepared the data for analysis using the open-source ‘R’ statistical software.
3. The bank convened a credit scoring working group to work with the consultant. In a workshop setting, the consultant and working group analyzed and selected risk factors for consumer and micro-business lending scorecards.
4. The bank recruited a new analyst to take primary responsibility for the scorecards (and the analyst also participated in the ‘R’ workshops).
5. The credit scoring working group and consultant reviewed the resulting models’ strengths and weaknesses to align usage strategies with the bank’s business targets and risk appetite.
6. With initial guidance from the consultant, the bank and its local software provider developed a software platform to deploy the scorecard.
7. The consultant provided remote support in scorecard monitoring and management.
The pros and cons of such arrangements include:
A Closer Look at Proprietary Scorecards
Pros:
• Bank learns the necessary skills to take ownership of the models
• Bank has complete control over its scorecards
• The scorecards are fully transparent
Cons:
• Requires active engagement of senior and junior managers
• Requires staff training or the onboarding of data analytics and risk modeling specialists
• Requires additional deployment software, such as an LOS with scoring functionality
• In-house development brings long-term maintenance requirements
Outsource Credit Scoring to a Vendor
Most vendors offer custom model
development using bureau data
(where available), the bank’s own data,
as well as third-party data such as CDR
data. Vendors normally also provide
scorecard deployment software and
maintain the models for the FI. Working
with credit scoring vendors outsources
scoring expertise and software
platforms, often bringing new data
that would otherwise be unattainable.
It also brings international experience
and immediate credibility to the
scoring solution.
Following is an example of First Access’
work with a bank in East Africa in the
small business lending segment, a
segment for which MNO data alone is
not enough to comprehensively assess
the applicant’s credit risk.
1.2_DATA APPLICATIONS
Table 13: The Pros and Cons of Proprietary Scorecards

DATA ANALYTICS AND DIGITAL FINANCIAL SERVICES 97
Many FIs are interested in using credit scoring to increase the consistency and efficiency of credit assessment for small loans. However, fewer FIs in developing markets have the in-house skills to develop and deploy scorecards efficiently without some outside help.
As mentioned above, working with external credit scoring vendors outsources the scoring expertise and software platforms, and also often brings international experience and immediate credibility to the scoring solution.
First Access is one of many credit scoring vendors, but one of the relatively few that focuses on the particular challenges facing frontier markets. Founded in July 2012, the
company initially worked extensively with Vodacom Tanzania, levering its MNO data to develop an auto-decision tool for DFS providers that serves low-income customers with no formal credit history. Since then, it has expanded its presence to the DRC, Malawi, Nigeria, Uganda, and Zambia, working more extensively on scoring solutions for the micro and small business segment.
First Access worked with a bank in East Africa to develop a scorecard for its small business (micro) lending, focused on loans of up to $3,000. The bank took an average of six days to assess loan applications, and in addition to lengthy wait times, its NPLs had been increasing. Like many banks in emerging markets, it had no tools for screening or scoring
clients, and thus used one process for all applicants coming in the door.
First Access studied the bank’s historic portfolio data for the segment and built a scoring algorithm using only the information available at the time of each loan application – without including additional data normally gathered in time-consuming visits to the site of the applicant’s business, a common feature of a microloan underwriting process. At the wish of the bank, the model ranked applicants into five risk segments.
A ‘blind test’ of all matured microloans, disbursed over the previous six months, indicated that the scores ranked borrowers by risk, as indicated by the bad rates in Table 14 below.
Table 14: Microloan Borrower Rankings by Risk
Risk Segment A B C D E
PAR (Portfolio at Risk) 1.00% 3.53% 9.97% 22.42% 26.78%
CASE 13First Access: Credit Scoring with a Full-service VendorOutsourcing Data Expertise and Working with External Partners

98 DATA ANALYTICS AND DIGITAL FINANCIAL SERVICES
Using the scoring algorithm, each applicant could be immediately scored and assigned to one of the risk segments. The bank adjusted its credit assessment process to offer same-day approval for its repeat customers in segments A and B, which made up 22 percent of loan applicants. The time of approval for this client group was reduced from an average of six days to one day, which improved customer experience and the efficiency and satisfaction of the bank’s staff.
Since the algorithm’s results in practice have validated the original blind test, the bank is expanding the use of the algorithm to conduct more same-day loan approvals and rejections for repeat and new customers. Fast-tracking groups A and B has increased the institution’s efficiency in underwriting micro loans by 18 percent, and both groups have outperformed their blind test results, with combined PAR1 of 1.26 percent instead of the expected 3 percent.
The First Access software platform enables FIs to configure and manage their own custom scoring algorithms and use their own data on their customer base and loan products. First Access is currently developing new tools for its platform to give FIs more control and transparency to manage their decision rules, scoring calculation and risk thresholds, with ongoing monitoring of the algorithm’s performance. Such performance analytics dashboards can help FIs better manage risk in response to changes in the market.
An outsourced approach to developing data products provides fast solutions and skilled know-how, but may also bring longer-term maintenance risks, intellectual property (IP) issues and a requirement that project designs are scoped in detail up front to ensure useful deliverables.
Pros:
• Access to world-class modeling skills and international experience
• Provide deployment software
• Potentially shorten time needed to develop and implement scorecard
• Manage and monitor the scorecard and software
Cons:
• Bank does not own model and usually does not know the scoring calculation
• Ongoing costs of model usage and intermittent model development
Table 15: Pros and Cons of Outsourcing Credit Scoring to a Vendor
1.2_DATA APPLICATIONS

DATA ANALYTICS AND DIGITAL FINANCIAL SERVICES 99
Accessibility and Privacy
There are two core challenges to using new forms of digital data: accessibility and privacy. To benefit from new sources of digital data, FSPs must gain access to these data in a format that can be analyzed. Two of the main ways to access such data are to either purchase the data or to collaborate with the vendor. Some MNOs, such as Kenya’s Safaricom, sell pre-processed aggregate data fields – such as monthly average spend or call usage – directly to FSPs. Some vendors also process large raw data sets drawn from MNOs, social media and device data, and turn these into
usable, sellable customer profiles. Privacy
concerns have limited the availability of
some data, and there is no guarantee that,
for example, social media data will remain
an accessible data source for credit models
in the future. Facebook has already taken
steps to limit the amount of data third-
party services can pull from user profiles,35
and the data it makes accessible through
its API can legally only be used for identity
verification. In the United States, the
FTC, which monitors rules on credit and
consumer data, has indicated that social
networks risk being subject to regulation
as consumer reporting agencies if their
data are used as loan criteria.36
35 Seetharaman and Dwoskin, ‘Facebook’s Restrictions on User Data Cast a Long Shadow’, Wall Street Journal, September 21 201536 ‘Facebook Settles FTC Charges That It Deceived Consumers By Failing To Keep Privacy Promises’, Federal Trade Commission News Site, November 29, 2011, accessed April 3, 2017,
https://www.ftc.gov/news-events/press-releases/2011/11/facebook-settles-ftc-charges-it-deceived-consumers-failing-keep/

100 DATA ANALYTICS AND DIGITAL FINANCIAL SERVICES
Managing a Resourc
es
& m
ethods
Dat
a analytics
applications
Data
data project
PART 2Data Project Frameworks
Chapter 2.1: Managing a Data Project
The Data RingManaging any project is complex and requires the right ingredients; business intuition, experience, technical skills, teamwork, and capacity to handle unforeseen events will determine success. There is no recipe for success. With that said, there are ways to mitigate risks and maximize results by leveraging organizational frameworks for planning and by applying good, established practices. This also holds true for a data project. This section introduces the core components necessary to plan a well-managed data project using a visual framework called the Data Ring.
The framework’s organizational components draw from industry best practices, recognizing general resource requirements and process steps that are common across most data projects. It shares commonalities with Cross Industry Standard Process for Data Mining (CRISP-DM), a data analytics process approach that rose to prominence after its release in 1996 and was widely used in the early 2000s.37 Its emphasis on data mining and the computational tools prevalent two decades ago has resulted in the method’s use diminishing considerably with the rise of big data and contemporary data science techniques. CRISP-DM’s original website went offline around 2014, leaving an absence of a specific industry standard for today’s data projects.
The Data Ring framework leverages concepts from established industry methods, with a modernized approach for today’s technologies and the needs of data science teams.
37 Cross Industry Standard Process for Data Mining. In Wikipedia, The Free Encyclopedia, accessed April 3, 2017,
https://en.wikipedia.org/wiki/Cross_Industry_Standard_Process_for_Data_Mining/
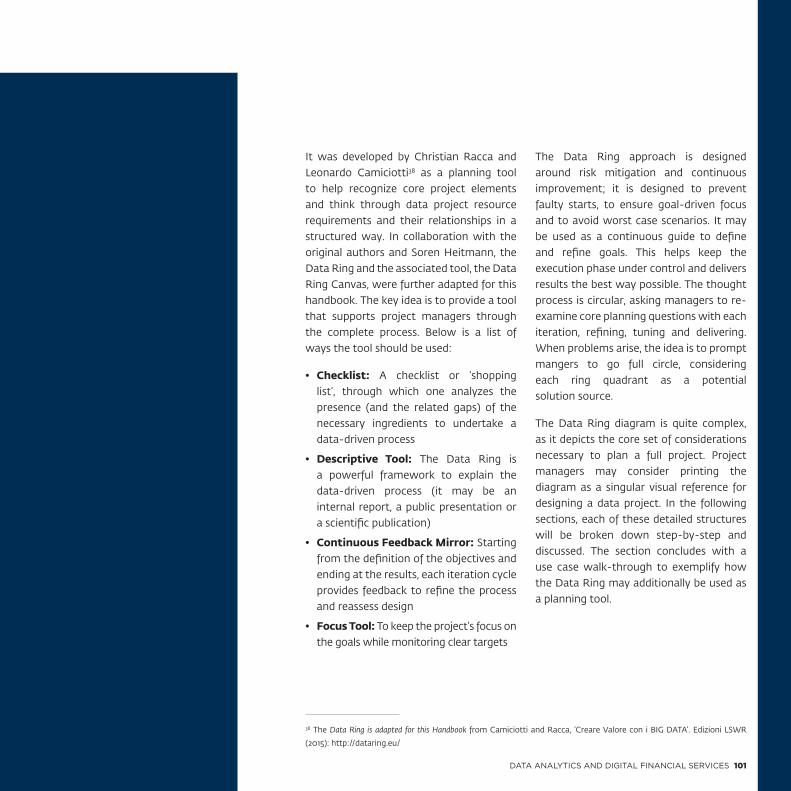
DATA ANALYTICS AND DIGITAL FINANCIAL SERVICES 101
It was developed by Christian Racca and Leonardo Camiciotti38 as a planning tool to help recognize core project elements and think through data project resource requirements and their relationships in a structured way. In collaboration with the original authors and Soren Heitmann, the Data Ring and the associated tool, the Data Ring Canvas, were further adapted for this handbook. The key idea is to provide a tool that supports project managers through the complete process. Below is a list of ways the tool should be used:
• Checklist: A checklist or ‘shopping list’, through which one analyzes the presence (and the related gaps) of the necessary ingredients to undertake a data-driven process
• Descriptive Tool: The Data Ring is a powerful framework to explain the data-driven process (it may be an internal report, a public presentation or a scientific publication)
• Continuous Feedback Mirror: Starting from the definition of the objectives and ending at the results, each iteration cycle provides feedback to refine the process and reassess design
• Focus Tool: To keep the project’s focus on the goals while monitoring clear targets
The Data Ring approach is designed around risk mitigation and continuous improvement; it is designed to prevent faulty starts, to ensure goal-driven focus and to avoid worst case scenarios. It may be used as a continuous guide to define and refine goals. This helps keep the execution phase under control and delivers results the best way possible. The thought process is circular, asking managers to re-examine core planning questions with each iteration, refining, tuning and delivering. When problems arise, the idea is to prompt mangers to go full circle, considering each ring quadrant as a potential solution source.
The Data Ring diagram is quite complex, as it depicts the core set of considerations necessary to plan a full project. Project managers may consider printing the diagram as a singular visual reference for designing a data project. In the following sections, each of these detailed structures will be broken down step-by-step and discussed. The section concludes with a use case walk-through to exemplify how the Data Ring may additionally be used as a planning tool.
38 The Data Ring is adapted for this Handbook from Camiciotti and Racca, ‘Creare Valore con i BIG DATA’. Edizioni LSWR
(2015): http://dataring.eu/

102 DATA ANALYTICS AND DIGITAL FINANCIAL SERVICES
Structures and Design
Five Structural Blocks
The Data Ring illustrates the goal in the
center, encircled by four quadrants. It has
five structural blocks: Goal, Tools, Skills,
Process, and Value. The four quadrants
sub-divide into 10 components: Data,
Infrastructure, Computer Science, Data Science,
Business, Planning, Execution, Interpretation,
Tuning, and Implementation. A project
plan should aim to encapsulate these
components and to deeply understand their
interconnected relationships. The Ring’s
organizational approach helps project
managers define resources and articulate
these relationships; each component is
provided with a set of guiding framework
questions, which are visually aligned
perpendicular to the component. These
guiding framework questions serve as a
graphical resource planning checklist.
Goal: Central Block
Setting clear objectives is the foundation
of every project. For a data-driven solution
to a problem, without quantitative and
measurable goals, the entire data analysis
process is at high risk of failure. This
translates into little knowledge value added
and can cause misleading interpretations.
Tools and Skills
The upper blocks of the Ring are focused on assessing the ‘hard’ and ‘soft’ resources required to implement a data project:
• Hard Resources: Including the data themselves, software tools, processing, and storage hardware
• Soft Resources: Including skills, domain expertise and human resources for execution
Process and Value
The lower blocks of the Ring are focused on implementation and delivery, although these consist of three concrete activities:
1. Planning the project execution
2. Generating and handling the data – the execution phase
3. Interpreting and tuning the results to implement the project goal and extract value
Circular Design
A central element of the Data Ring is its circular design. This emphasizes the idea of continuous improvement and iterative optimization. These concepts are especially critical for data projects, forming established elements of good-practice project design and planning. This is because the result of any data project is, simply put, more data. Take a credit scoring model,
for example. Numeric data are inputted: age, income, and default rate history, for example. The outputs are credit scores, or more numeric data. The process is data in, data out.
In fact, this principle of data in, data out is continuously applicable throughout the data project. It can be applied to every intermediate analytic exploration and hypothesis test, beyond mere descriptions of starting and ending conditions. The Data Ring’s circular process similarly illustrates an iterative approach that aims at refining, through cycles, the understanding of phenomena through the lens of data analysis. This allows a description of causes (data in) and effects (data out), and the identification of non-obvious emergent behaviors and patterns. The Data Ring’s five core organizational blocks are designed to plan and achieve balance between specificity and flexibility throughout the data project’s lifecycle.
Practically speaking, project planning should consider each ring’s block in sequence, iterating toward the overall plan. The circular approach aims at laying out what steps are needed to achieve a minimum viable process. That is, where data can be put into the system, analyzed and satisfactory results obtained – and then repeated without breaking the system;
2.1_MANAGING A DATA PROJECT

DATA ANALYTICS AND DIGITAL FINANCIAL SERVICES 103
for example, with a refreshed dataset a few months later that includes new customers. Once established, the project can then iterate to the next level to deliver a minimum viable product (MVP). This is the most basic data product.
A data product is a model, algorithm or procedure that takes data and reliably feeds the results back into the environment through an automated process. In other words, its output results are integrated into a broader operational context without manual computation. This is what sets a data product apart from a singular analysis. A data product might be simple – like an interactive dashboard visualization – but there are also highly complex data products, where credit scores feed into semi-automated loan decision-making processes, influencing new client generation with data fed back into the credit scoring model to guide new lending decisions. The fact that data products are consumers of their own results affirms their circular principle. The stock of data grows with each iteration. This also emphasizes the Data Ring’s organizational focus with the goal positioned at the center, guiding which data to analyze and whether or not the time has come to stop iterating and judge the goal achieved.
Figure 19: The Data Ring, a Visual Planning Tool for Data Projects
The Data Ring
Benchmark
Metrics and DefinitionsBudget and Timing
Partnerships and Sourcing
Data GovernanceSe
ctor
Exp
erti
sePr
ivac
y an
d Le
gal
Socia
l Scie
nce
Data Visualiz
ation
Communication
GOAL(S)
Data
Out
put
Struct
ure a
nd P
roce
ssData Input
Formats
Accessibility
Data PipelineStorage
Framew
orks
TOOLS
SKILLS
PROCESSVALUE
Computer Science Business Data Science
D
ata
Infra
structure
Execution P
lann
ing
Implem
entation Tuning Interpretation
FIT
OP
S
RESULTS
USE
1 234

104 DATA ANALYTICS AND DIGITAL FINANCIAL SERVICES
GOAL(S)Goal setting is the first step of project planning. The project needs to know where it is going in order to know when it has arrived. To some extent, a fate-based approach to data analysis, especially when dealing with complex structures, processes and organizations, might lead to unexpected discoveries and unplanned trajectories. Discovery is indeed an important factor for data projects, permitting exploration and allowing
the data science team to ‘play’ with the data. With that said, it should be done in a structured way, through exploratory hypothesis testing, by emulating the scientific method (See Chapter 1.1, The Scientific Method).
Reaching the goal signals project completion. With an iterative approach, it is especially important to know how a completed project looks in order to avoid getting stuck in the refinement loop. Setting satisfactory metrics and definitions helps guide the project’s path and will warn of risks if the project starts to go astray. As with operational management, the project should both monitor and assess its KPIs throughout the iterative process, ensuring these reference points continue to serve the project the best way possible.
Goal Setting
The goal is a proposed data-driven solution to a strategic problem in order to produce value. The operational needs of the project are reflected by the structural blocks and guiding questions of the Data Ring. This translates into clear resource needs, human skills and concrete processes, which are all oriented by the problem statements that the project seeks to solve. It is likely the goal statement and problem statement will be defined vis-à-vis the other: consider if the intended goal will deliver the sought
solution; reflect on the nuances of the strategic problem; refine either or both accordingly. It helps to break down larger problems into more discrete issues, for a clear goal to resolve a clear problem.
Strategic Problem Statement
The idea of, ‘pitch the problem before the solution’ helps drive this focus and helps communicate to stakeholders what the pain is and who has this problem. Once the problem is discussed, explaining the solution becomes simple. Below are two DFS strategic problem examples:
• Sample Problem: Existing customers have low mobile money activity rates
• Sample Problem: Potential customers are excluded from accessing microcredit products
Goal Statement
In the context of a data project, the goal is to deliver a data-driven process and product of some specification. This sets the project’s path. It is also important to know if the path is a good one; in other words, if the product is based on a reasonable hypothesis about why it works and why results are reliable. A goal statement has two parts: product specification and its strategic hypothesis. Here are two proposed solutions to the previous problem statements:
Start Small. For new data projects,
a Minimum Viable Product
(MVP) is the recommended goal.
This is a basic and modest goal,
created to test if a data-driven
product concept has merit. Once
achieved, project managers may
consider the same Data Ring
concepts to scale up the MVP to
a prototype.
2.1_MANAGING A DATA PROJECT

DATA ANALYTICS AND DIGITAL FINANCIAL SERVICES 105
• Proposed Solution: A minimum viable customer segmentation prediction model to identify high-propensity active users to increase activity rates
• Proposed Solution: A production-level customer credit scoring algorithm for automated microloan issuance
Process and Product Specification
As detailed above, the two data products exemplified are a customer segmentation prediction model and a customer credit scoring algorithm. These are specified by their scale, which helps describe how ‘big’ the project is, or how it integrates into broader systems.
Scale may be considered along the following progression:
• Process: input data that reliably yield results data through an automated process
• MVP: a product concept and process whose results evidence essential value
• Prototype: a product concept with basic implementation, usability and reliability
• Product: a proved concept with reliable implementation and demonstrated value proposition
• Production: a product systematically implemented and delivered to users or customers
Framing the goal in terms of scale helps to define both resource requirements and how overarching project components need to fit together. A MVP proof of concept might be delivered on a single laptop in a few weeks. In comparison, production-level scale might require special data servers, experts to maintain them and legal oversight to ensure data security. Nevertheless, producing a MVP requires hard and soft resources (i.e., infrastructure and people), organized according to a minimum viable process. This means defining clear organizational roles, management and reporting relationships. This is how a data-driven solution to a strategic problem is operationalized, how technical challenges are identified and solved, and how to ensure that the concrete product delivers strategic value.
Hypothesis
What these data products do is driven by an underlying hypothesis, which is only implicit in these two examples. Identifying high-propensity active users has an operational hypothesis; there is a correlation between the variables that define these customer segments and activity rates. For example, customers with high voice talk time have higher activity rates. This is a statistically testable hypothesis and ultimately the onus of the data science team to demonstrate. If the correlation is strong and reliable,
this goal-driven hypothesis gives the data product credibility and reliability. A similar hypothesis might be constructed for a credit scoring model to test the hypothesis, for example: customers with small social networks have higher loan default rates. Hypothesis setting is by no means limited to algorithm-based data projects. A visualization dashboard also has a hypothesis, with respect to the relationships between the data that aim to be visualized. Such a hypothesis may not be statistically tested by algorithms, but the reliability of the visualization is predicated on these relationships being consistent and valid over time. Because of this, the visualization will continue to tell a meaningful story or guide useful decision-making.
The principle of ‘reproducible research’ has become prominent among data scientists. Reproducible research describes transparent, repeatable approaches to analysis and how results are obtained in the first scale step of ‘process’. In principle, this is to enable independent results validation, which may be relevant for regulatory or audit purposes. This is why the first step in iteration when using the Data Ring is to articulate a minimum viable process; it sets the project to achieve reliable results upon which the product’s essential value is based. This process equally supports data

106 DATA ANALYTICS AND DIGITAL FINANCIAL SERVICES
products to immediately see if and when hypotheses become unreliable, which may prompt re-fitting models to ensure ongoing reliability.
Goal Risks and Mitigations
Setting project goals in terms of hypotheses that are formulated, tested and refined helps to mitigate common risks in data projects. The risks of inadequate goal setting are:
Risk: Not Goal-driven
The main risk is the absence of a strategic project motivation and goal, or non-goals. In other words, this risk encapsulates motivations to do something meaningful with the data because of the appeal, in order to engage popular buzzwords, because the competitors are doing it, or just because it is scientifically or technologically sound – yet the motivations lack a value-driven counterpart. This approach could lead to unusable results or squandered budgets while it presents a missed opportunity to leverage the analysis to deliver goal-driven results that are relevant to the organization. For those particularly motivated to do something, it is not uncommon to bring aboard external resources who are simply tasked to discover something interesting. This can risk results that are not only unusable, but wrong, as open-ended exploration may permit biased analysis or forced results in the drive to deliver.
Mitigation: Know what the project aims to accomplish. If the team wants to do something but is unsure where to start, they should engage a data operations specialists to review the data and help shed light on what types of relevant insights they could provide the business. The goal of the project is generally proved by the measurability of the results, but it is important to note that hypothesis testing often proves false. This is a good thing. Either iterate and succeed, or accept that the idea does not work and go back to the drawing board. This is superior to a good or interesting result based on bad data.
Risk: Lack of Focus
Equally related to non-goal project risks are projects whose goals are too general, ill-defined or overly flexible and changing. The goal sets the direction and outlines what will be achieved. Lack of clarity may lead to teams getting distracted or analyzing ancillary questions, thus delivering ancillary results. Taking this into consideration, some flexibility must exist for iterative goal refinement, and to allow for exploring and capitalizing on serendipitous discovery. Lack of focus can also be the result of a problem-solution mismatch. This is when the underlying strategic problem may not be precisely defined, or where the proposed goal
solution has a logical inconsistency, such as a weak business or strategic relationship with the problem it is intended to resolve.
Mitigation: Set clear, precise goals with business relevance incorporated into each of the problem-product-hypothesis components. Ensure they can be refined through an iterative approach and revisit these as the project progresses. Further, be sure there is ongoing goal relevance as business strategy independently evolves. Plan for exploration and flexibility within the project execution. Setting exploratory boundaries is key, as they ensure projects do not go off course, while still permitting opportunity for discovery. This is also supported by the specific measurement units and associated targets, or KPIs, for both intermediate objectives and overall goal achievement.
Risk: Not Data-driven
Renowned economist Roland Coase stated: “If you torture the data long enough, it will confess.” The risk is forcing data to reveal what one expects in an attempt to validate desired knowledge, behavior or organization. Turning to a data-driven approach means being ready to observe evidence as it emerges from data analysis. In other words, analyzing projects, processes or procedures through
2.1_MANAGING A DATA PROJECT

DATA ANALYTICS AND DIGITAL FINANCIAL SERVICES 107
data might lead to results that are not
aligned with current beliefs, thoughts or
strategy, forcing an organization to make
a deep change.
Mitigation: Emulate the scientific
method to set time-bound project
objectives supported by hypotheses
that are rigorously tested. Ensure the
execution strategy uses the concept of
reproducible research to better enable
repeatability and independent validation
of results. Also, ensure project sponsors
fully understand that finding valuable
patterns is not guaranteed.
Risk: Not Pragmatic
Goals should be realistic with respect
to the project resources and sponsor
expectations, for example, appropriate
competency, infrastructure or budget.
Mitigation: Ensure that product scale is
considered as part of the goal statement.
This helps bound the project and push
project managers to match resources
and requirements. Additionally, ensure
an information and communication
technology (ICT) specialist performs a
technical IT assessment of the project
design to ensure pragmatism between
the project goal and the technical tools
sourced to deliver it.
Quadrant 1: TOOLS
The world and its dynamic phenomena can be observed and fragmented into data. In other words, data are just samples of reality, recorded as measurements and stored as values. In addition, complex systems belie further knowledge, which is embedded in the collective behavior of different system components. Individual components may reveal nothing, but patterns emerge from observing the whole system.
The data revolution has provided an exponential increase in the volume, velocity and variety of digital data. This increased availability of digital data allows higher granularity and precision in the comprehension of processes, activities
and their interrelated relations. To yield knowledge and value from their analysis, data must be stored, described in a proper way and made accessible. This requires a suitable technical infrastructure to be put in place to manage the data, their accessibility and computation. This also permits access to whole system analysis and the tantalizing patterns that can drive value. The first quadrant of the Data Ring asks project managers to consider their data and the technical infrastructure needed to analyze it through two components: data and infrastructure.
Tools: Data
Data are the fundamental input (and output) of a data project. The Data Ring’s guiding questions are grouped by two principles: accessibility and format. These are critical elements that deeply affect resource needs and process decisions.
First, it is necessary to know how the data are described, their properties, and if they represent numbers, text, images, or sound. Also, if they are structured or unstructured. The data must also be understandable to humans and must exist in a digitized, machine-usable format. These basic parameters are relevant for data of all sizes and shapes. These are critical factors for determining the best technical infrastructure to use for the project. See Chapter 1 for additional discussion on data formats.
Figure 20: Data Ring Quadrant 1: TOOLS

108 DATA ANALYTICS AND DIGITAL FINANCIAL SERVICES
Recently, the concept of big data became prominent. This is a useful concept, but its prominence has also created misconceptions. Particularly, that the simple availability of a large or ‘big’ amount of data can increase knowledge or provide better solutions to a problem. Sometimes this is true. However, sometimes it is not. Though big data can provide results, it is also true that ‘small’ data can successfully deliver project goals. It is important for the project manager to ensure that the right (and sufficient) data are available for the job and that the right tools are in place.
The definition of ‘big’ is constantly shifting, so dwelling on the term itself rarely benefits a project. What is most useful about the big data concept is understanding that the bigger a dataset is, the more time it will take to analyze. With that in mind, a bigger dataset also requires more specific technical team capacities and the more complex, sophisticated or expensive technical infrastructure to manage it. Data ‘bigness’ can also relate to a goal’s scale; a MVP may be attainable with only a snapshot of data, but production may expect continuous high-velocity transactional data. This is an important element of the project design process; having terabytes of streaming data does not imply sufficiency to meet a project’s goal.
The following framing questions help identify sources of data and scope them in terms of project resource requirements. If internal data systems do not capture what is assumed, this forces project resource planning to shift by identifying new required data resources:
• What data are produced or collected through core activities?
• How are those data produced (e.g., which products, services, touch points)?
• Are the data stored and organized or do they pass through the process?
• Are the data in machine-readable form, ready for analysis?
• Are the data clean, or are there irregularities, missing or corrupt values or errors?
• Are the available data statistically representative, to permit hypothesis testing?
• What is the relation between data size and performance needs?
These questions are exemplary of the effort necessary in the initial phase in order to successfully acquire, clean and prepare the dataset(s) for subsequent analysis. Depending on how much control is available in the whole data-driven process, this preparation phase will be
longer or shorter, which means higher or lower project costs. Inadequate upfront data planning can result in ballooning costs down the line; revisions could mean needing to select different computational infrastructure or different team capacities.
Data Accessibility
Data must be accessed in order to be used. It may sound trivial, but this issue is complex and needs to be considered at the very beginning of each data-driven process to ensure results are on time and on budget – or if results are even possible. Customer privacy, requesting and granting data-use permissions and establishing who has both ownership and legal interest once data access permissions are granted are factors that make data accessibility complex, inconsistent across regulatory environments, and subject to ethical concerns. Data accessibility may be judged according to three factors:
Legal
Regulations might prevent an excellent and well-designed data-driven analysis from being carried out in its entirety. This would interrupt the process at an intermediate phase, thus making it vital to be aware of legal constraints from the beginning.
Ownership of data must be established, identifying who has permission to analyze
2.1_MANAGING A DATA PROJECT

DATA ANALYTICS AND DIGITAL FINANCIAL SERVICES 109
them for insights. If IP agreements are in place, they need to cover both existing and derivative works. If the analysis is a research collaboration, publication agreements should be in place, including clarity on what constitutes proprietary information and what may be made public.
Ethical use of the information may also carry legal constraints. Data regarding people, groups or organizations must be treated carefully, putting safety as the first consideration. Data privacy regulations may also influence how data may or may not be transferred from owner to analyst, such as whether they can be sent electronically or by physical storage. Additionally, regulations may outline procedures for data leaving national borders, being routed via third parties, or being stored on servers located in specific countries.
Technological
Barriers can exist if the data format is misaligned with the selected technology for data processing and analysis. As a simple example, a NLP algorithm cannot be meaningfully applied to image data. More practically, databases are generally optimized for specific types of data; and some technologies aren’t designed to work together, similar to building a workflow aimed at mixing Apple and
Microsoft products. This may result in costs and inefficiencies, and may create extra problems to solve by trying forced alignments.
Digital data are required in order to analyze them at machine scale and speed. There may be some nuanced exceptions to the rule and AI is pushing these boundaries.
Compatibility is needed between the data format and the technology used to manage them. Even if datasets are digitized, they might be isolated and inaccessible due to incompatible technological choices made by different departments of the same company, government or organization. Sometimes obsolete systems might be in place, which can also prevent interactions with modern solutions, languages and protocols. The amount of effort to harmonize the technological infrastructure might be a non-trivial barrier from a time-cost perspective.
Strategic
Actors might seek to preserve a competitive advantage by intermediating access to their data assets. This usually takes shape in one of three ways: by requiring special hardware or software to read proprietary data formats; by controlling how the data can be used; or by requiring special licensing fees. Whereas technological factors might
offer a work-around – albeit sometimes complex or inefficient – strategic factors are still often established to deliberately ensure access is only possible according to the data owner’s specification, or perhaps access denied entirely.
Data Format
Digital data can be represented in many different forms and a data format describes data’s human-understood parameters (i.e., text, image, video, biometric). Often, the format is referred to by the three or four-letter suffix at the end of a computer file. Format may also refer to data storage structures and databases more generally, for example: Oracle, MongoDB and JSON. (See Chapter 1.1, Defining Data)
There are numerous data formats, especially including storage and processing approaches. Data format is determined strongly by business or organizational context and, in particular, by the people responsible for managing the data creation, storage and processing. For project managers, recognizing format fragmentation and incompatibility issues is key to establishing the data alignment required for well-designed projects. Understanding the values recorded in a dataset, as well as more general dataset metadata, helps project managers to plan properly.

110 DATA ANALYTICS AND DIGITAL FINANCIAL SERVICES
A data point’s value refers to the intrinsic content of a data record. This content may be expressed in numerical, time or textual form, called the data type. For data analysis, the crucial factor is that these underlying values are not affected by systematic errors or biases due to infrastructure or human-related glitches. Generally, project managers do not consider how data are collected or whether instrumentation is well-tuned. It is relevant to understand how these underlying measurements are made and to ensure there is proper knowledge transfer between data owners and data analysts about key measurement issues. As a practical example, if a system went down during an IT upgrade, then this upgrade will be reflected by a dramatic drop in transactions. Analysts need to be aware of this information to interpret the anomaly correctly. Anomalies in data values greatly influence the process of data cleaning and related project planning.
Metadata are ‘data about the data,’ which includes all of the additional background information that enriches a dataset and makes it more understandable. The header title columns in an Excel sheet are metadata (the titles are themselves text data that describe the values in the following rows). For example, imagine a dataset with the labels, ‘agent name’ and ‘transaction volume’, proceeded by a column of numbers
with no header. Are those numbers related to transaction values, perhaps the times when the transactions took place? If the project seeks to visualize volumes on a map, agent location also becomes a data requirement; the computational process must be able to ask the dataset to provide all location values. If the location category is not comprised of defined metadata, then the process will not be able to find any GPS coordinates to plot. The solution could be simple, say, adding a ‘location’ title to this unnamed column. In this way, project teams can add contextualized information to datasets and provide more detailed descriptions of the data (i.e., metadata) that the analytic process can then ask questions about and use. In this sense, metadata are just another dataset. Metadata are special because they are inherently connected to the underlying dataset, which enables this question-and-answer process to take place. This is just an example; metadata are more than just column headers. Even in Excel, metadata exist about the spreadsheet being worked on, for example, file size, date created and author are all examples of metadata. Such underlying metadata enable file searching and sorting, for example, the operating system can ask for all the files modified in the last week. The answers are obtained through the file’s metadata.
Understanding how datasets are connected via metadata is a key element of project design and key to identifying gaps and opportunities for analysis. Metadata help identify where additional data may be required to deliver project goals, and how to link in new datasets when required. Metadata help to identify efficiencies where supplementary datasets may already exist; licensing third-party data may fill gaps and derivative or synthetic metadata could be created to help contextualize project datasets. For project managers, it is important to know when and where metadata are likely to exist. If they are not a part of initial datasets, it may be best to ask the data owners for this information, rather than contextualize it as part of the project work.
Tools: Infrastructure
As previously explained, data are the fundamental input (and output) of a data project. Where data physically go and come out from is the infrastructure. Data are digital information that need to be acquired, stored, processed and calculated using informatics tools running on virtual or physical computers.
The technological infrastructure has to be appropriate for the objectives that arise as far as the volume, the variety and the velocity
of data are concerned. The infrastructure
2.1_MANAGING A DATA PROJECT

DATA ANALYTICS AND DIGITAL FINANCIAL SERVICES 111
resources enable the usability of the data
and strongly affect the ‘power’ and the
effectiveness of the scientific algorithms
and mathematical models applied. Generic
data-driven infrastructure is built by these
core blocks:
Data Pipeline
The data pipeline is a functional chain of
hardware or software where each element
receives input data, processes it, then
forwards it to the next item. It is how data
are uploaded into the analytic process; the
data pipeline includes the upload process,
tools to crunch the numbers, how the
numbers are downloaded, and how they
are then fed into an operational process.
For example, this pipeline delivers the
technical integration of a data product
into broader corporate systems. The
pipeline must be planned to ensure a
reliable process that takes in raw data and
delivers usable results. The project should
ensure that a schematic or flow diagram is
written to describe the pipeline’s functional
implementation. The initial upload into the
pipeline generally marks the operational
start of a data project, beginning with the
data Extraction-Transformation-Loading
(ETL) process. The ETL is a procedural plan,
set as part of the project’s data governance,
which is discussed in more depth later.
Storage
A database or file system is called storage, or the infrastructure element for storing data. Storage affects how data are saved and retrieved and these input-output processes are critical for designing a well-performing system. It takes time to write data to a disk, and when a query arrives, it takes time to search for the answer and send it to the next step on the data pipeline. The right database tools are often guided by the nature of the data themselves, their format and their structure. Additionally, how the data are used plays a role in storage; an archiving system aims to compress as much data into a volume as cheaply as possible, while a transactional database ensures speed and reliability so customers are not kept waiting. Frameworks also guide database choice by providing built-in tools optimized for specific storage solutions and designs.
Frameworks
A framework is a solution set designed for a group of problems. Technically, it is a set of predefined libraries and common tools to enable writing code and programs more quickly and easily. In the area of big data, these include platforms that collect tools, libraries and features in order to simplify the data management and manipulation processes (e.g., Apache Spark, Apache
Hadoop, Hortonworks, Cloudera. See Chapter 2.2.3, Technology Database). It is worth noting that a project may integrate multiple frameworks. Using an established framework is recommended because this avoids the need to program common tools from scratch, which can be an enormous time and cost savings. The trade-off is that the project approach must adapt to the framework’s way of solving the set of problems it was designed to address, which may or may not perfectly fit the precise needs of the project. Selecting the wrong framework risks mismatching its solutions approach with the project’s problems, introducing inefficiencies.
Frameworks are typically designed around hardware specifications, and they ultimately run on computers that crunch the numbers for the data project. While raw computing power is equally a critical element of the project’s infrastructure, it is best to first plan the data pipeline, storage requirements and frameworks necessary to accomplish the project needs. Adequate computing specifications tend to fall into place afterward. Infrastructure design and management is usually not the role of project managers, but they do need to ensure capacities and resources are available to meet project needs. This is why an IT assessment is specifically indicated as part of managing risks and setting pragmatic goals. Relying on internal IT

112 DATA ANALYTICS AND DIGITAL FINANCIAL SERVICES
teams or ensuring relevant capacity on the data project team is critical to help assess infrastructure requirements and technical needs, including scalability, fault tolerance, distribution, or environment isolation. These technical terms are relevant for large-scale enterprise computational infrastructure; MVP goals can be achieved with much less. Even small data projects are likely to engage enterprise architecture around the data pipeline. The data a project needs will almost certainly feed in from corporate systems, and this needs to be well-scoped, planned and coordinated with IT teams.
Quadrant 2: SKILLS
Data-driven projects need data scientists. With that said, ‘data scientist’ is a relatively vague and broad title, one that is still being defined. Meanwhile, industry and media have generated hype about big data, machine learning and a host of technologies, while also creating a broader awareness on data’s tremendous potential value. This has created pressure to invest in these resources in order to keep up with the competition. It is critical for the data-driven project manager to be aware that very specific sets of skills and technical experience are needed to deliver a data project’s requirements. Equally critical, they must be aware that many of these fields of expertise are dynamically forming in lockstep with technology’s rapid change. The second quadrant of the Data Ring asks project managers to consider the human resources needed to deliver the project through three components: computer science, data science and business.
The Team
Assembling the right mix of skills sets is a challenge for data project managers because of the dynamic evolution of technology, ever-increasing dataset sizes and the skills required to derive value from these resources.
A data scientist is usually a team of people dealing with data. Beyond a single
competency, this usually requires an interdisciplinary team of technical experts that strongly interact with all the units – single person or group – that manage data from acquisition to visualization.
Teams are dynamic and collaborative, and it is difficult to keep pace with innovation and the development of new skillsets, emergent expertise and growing hyper-specialization. Outsourcing capacities can achieve required dynamism and fit-for-purpose skillsets. Alternatively, retaining or building core in-house data science generalists can help ensure successful collaboration across a team of multidisciplinary data specialists and business operations.
An open, scientific and data-driven culture is required. A proper scientific approach and a data culture must exist within the team and, ideally, within the entire company. Because good goal setting is predicated on emulating the scientific method and exploratory hypothesis testing, the data science team must be driven by a sense of curiosity and exploration. The project manager must ensure that curiosity is directed and kept on target.
The following framing questions will help project managers identify resources and needs:
Figure 21: Data Ring Quadrant 2: SKILLS
2.1_MANAGING A DATA PROJECT

DATA ANALYTICS AND DIGITAL FINANCIAL SERVICES 113
• Who is responsible for managing the data in the enterprise? How?
• Are there any ongoing collaborations with research institutions or qualified organizations to perform the data science activities?
• Which recruiting channels exist as far as data-driven professionals are concerned?
• How is data culture fostered inside the company, and who is involved?
• How is multidisciplinary collaboration facilitated in project planning and execution?
• How is scientific validity ensured in choosing algorithms and mathematical data representations (modeling)? Is a qualified person ensuring the results are true?
• Who ensures good practices are in place and algorithms are programmed efficiently?
• Is there an open collaboration between the data-driven team and other business units?
A complete, highly interdisciplinary team is difficult to achieve, and most firms are unlikely to have full breadth of relevant skills sets to draw on demand. Understanding these gaps is usually the first step to being aware of the full potential and planning outsourcing investments, which is considered a part of process planning.
Skills: Computer Science Data are digital pieces of information that need to be acquired, stored, processed, and managed through computing tools, programming and scripting languages and databases. Therefore, skills should include knowledge about:
Cloud Computing When data sources are big or huge, normal programming tools and local computational resources, such as personal computers, become rapidly insufficient. ‘In-cloud’ solutions are a practical and effective answer to this problem, but they mean mastering essential knowledge about virtualization systems, scaling paradigms and framework programming. (See Chapter 2.2.3, Technology Database)
Scripting Languages Working with computing infrastructure means coding. Python or ‘R’ are often the best options to fast-prototype and explore data patterns. These are likely choices for a MVP goal and early-stage project development. Both scripting languages have become deeply established as necessary data science tools, and the team should ideally ‘speak’ both. (See Chapter 2.2.3, Technology Database)
Certain corporate infrastructures and certification requirements might require different coding choices such as Scala,
Java or C++. This can be an issue for a goal’s scale; beyond prototyping and implementation in production, enterprise-level programming solutions will invariably be required, as well as the skills to implement. This also likely means that coding refactoring, or translating between computer languages, may be required as well as strong interactions between the data team and the IT and engineering staff members.
Databases and Data Storage
Chapter 1 discusses structured versus unstructured data. A data project may draw on both, which are respectively handled by relational databases and non-relational databases. Using these tools requires different skillsets. Data sourced from enterprise transactional databases is likely to come from relational databases. Increasingly, even internal data, such as KYC or biometric information, may be stored by either solution, depending on collection method. However, a credit scoring algorithm that seeks to use social network data is likely to draw on unstructured data from non-relational data sources.
Version Control and Collaboration
Versioning tools are essential for organized code evolution, maintenance and teamwork and are thus essential for good project planning.

114 DATA ANALYTICS AND DIGITAL FINANCIAL SERVICES
Skills: Data Science
Scientific Tools
Different contexts will require a specific mix according to project needs, but the following are broad academic areas that data projects are likely to need to draw from:
• Solid Foundation of Statistics: used for hypothesis testing and model validation
• Network Science: a discipline that uses nodes and edges to mathematically represent complex networks; critical for any social network data or P2P-type transaction mapping
• Machine Learning: a discipline that uses algorithms to learn from data behaviors without an explicit pre-defined cosmology; most projects that deliver a model or algorithm
• Social science, NLP, complexity science, and deep learning are also desirable skills that could play a key role in specific areas of interest
Curiosity and Scientific Mind
Attitude and behavioral competencies are critical factors for a successful data science team. People who seek to explore, mine, aggregate, integrate – and thus, identify patterns and connections – will drive
superior results. In other words, some
general ‘hacking skills’ are an added value
for the data science team; simply put, the team should possess a mental approach to problem solving and an internal drive to find patterns through methodical analysis.
Furthermore, scientific validation is essential for a data project, and data scientists should have a scientific mind. That is, a methodical approach to asking and answering questions and a drive to test and validate results. Importantly, team members should find motivation in the results and openness to whatever interpretation a sound analysis of the data yields, even if the findings might contradict initial expectations. In line with the scientific method, this approach should be embodied in behavioral competencies, for example: making observations; thinking of interesting questions; formulating hypothesis; and developing testable predictions.
Design and Visualization
This requires a multidisciplinary skillset in terms of both technical and business needs. On the technical side, ‘DataViz’ should not be considered exclusively as the final part of the project aimed at beautifying the results. It is relevant throughout exploration and prototyping, and is well-incorporated at periodic project stages, which makes it a core skillset for data scientists to identify patterns.
Skills: Business
Goal setting is essentially related to delivering business-relevant results and benchmarking against appropriate metrics and KPIs. Knowing how to connect these metrics to project execution is the very purpose of doing the project. This requires the project team to have sound business knowledge. A clear business perspective is also essential for results interpretation – and ultimately to use and implement the project to deliver value. With respect to skills, the key message is that a ‘junction person’ needs to intermediate data, technical specialists, business management and strategy in order to translate data insights for non-technical people; this intermediary’s role also articulates business needs in terms of algorithms and technical solutions back to the team. There is a growing expertise called data operations that encapsulates this role.
Privacy and Legal
Except for the cases in which datasets are released with an open license – explicitly enabling usage, remix and modification –such as through open data initiatives, the issues related to privacy, data ownership, and rights of use for a specific purpose are not negligible (See legal barriers to the data – in Data Accessibility on page 117). Corporate legal specialists should be consulted to ensure all stakeholder
2.1_MANAGING A DATA PROJECT

DATA ANALYTICS AND DIGITAL FINANCIAL SERVICES 115
concerns are properly addressed. With this said, big data and privacy issues are pushing into new territory, and legislation aimed at regulating the data approach is still developing. Many companies today are building their data-driven businesses by leveraging legal gaps in local laws. This can present risks if laws change, while also presenting opportunities, by working to build an enabling environment.
In terms of skillsets, the project team members should each have some basic legal awareness. This allows for identification of potential problems and enables constructive dialogue with
the legal professionals in charge. Legal
awareness is particularly relevant when
securing external consultants and when
ensuring Non-Disclosure Agreements
(NDAs) are thorough, follow regulation,
and can be upheld. From both an internal
and external perspective, data can also be a
source of fraud. Fraud cases are increasingly
technically sophisticated and data-driven.
Though a data science team does want
hacker skills as part of a balanced skillset,
it does not want actual hackers. It is critical
that the full team is well-versed on legal
considerations and both legally and morally
accountable to adhering to them.

116 DATA ANALYTICS AND DIGITAL FINANCIAL SERVICES
In 2006, America Online (AOL), an internet service provider, made 20 million search queries publicly available for research. People were anonymized by a random number. In a New York Times article, journalists Michael Barbaro and Tom Zeller describe how customer number 4417749 was identified and subsequently interviewed for their article. While user 4417749 was anonymous, her searches were not. She was an avid internet user, looking up identifying search terms: ‘numb fingers’; ‘60 single men’; ‘dog that urinates on everything’. Searches included people’s names and other specific information including, ‘landscapers in Lilburn, Georgia, United States of America’. No individual search is identifying, but for a sleuth – or a journalist – it is easy to identify the sixty-something women with misbehaving dogs and nice yards in Lilburn, Georgia.
Thelma Arnold was found and affirmed the searchers were hers. It was a public relations debacle for AOL.
Another data breach made headlines in 2014 when Vijay Pandurangan, a software engineer, de-anonymized 173 million taxi records released by the city of New York for an Open Data initiative. The data was encrypted using a technique that makes it mathematically impossible to reverse-engineer the encrypted value. The dataset had no identifying search information like Arnold, but the encrypted taxi registration numbers had a publically known structure: number, letter, number, number (e.g., 5H32). Pandurangan calculated that there were only 23 million combinations, so he simply fed every possible input into the encryption algorithm until it yielded matching outputs. Given today’s
computing power, he was able to de-anonymize millions of taxi drivers in only two hours.
Netflix, an online movie and media company, sponsored a crowdsourced competition challenging data scientists to improve by 10 percent its internal algorithm to predict customer movie rating scores. One of the teams de-anonymized the movie watching habits of encrypted users for the competition. By cross-referencing the public Internet Movie Database (IMDB), which provides a social media platform for users to rate movies and write their own reviews, users were identified by the patterns of identically rated sets of movies in the respective public IMDB and encrypted Netflix datasets. Netflix settled lawsuits filed by identified users and faced consumer privacy inquiries brought by the United States government.
Properly anonymizing data is very difficult, with many ways to reconstruct information. In these examples, cross-referencing public resources (Netflix), brute force and powerful computers (New York Taxis), and old-fashioned sleuthing (AOL) led to privacy breaches. If data are released for open data projects, research or other purposes, great care is needed to avoid de-anonymization risks and serious legal and public relations consequences.
Industry Lessons: De-anonymizing DataData Privacy and Consumer Protection: Anonymizing User Data is Necessary, and Difficult
2.1_MANAGING A DATA PROJECT
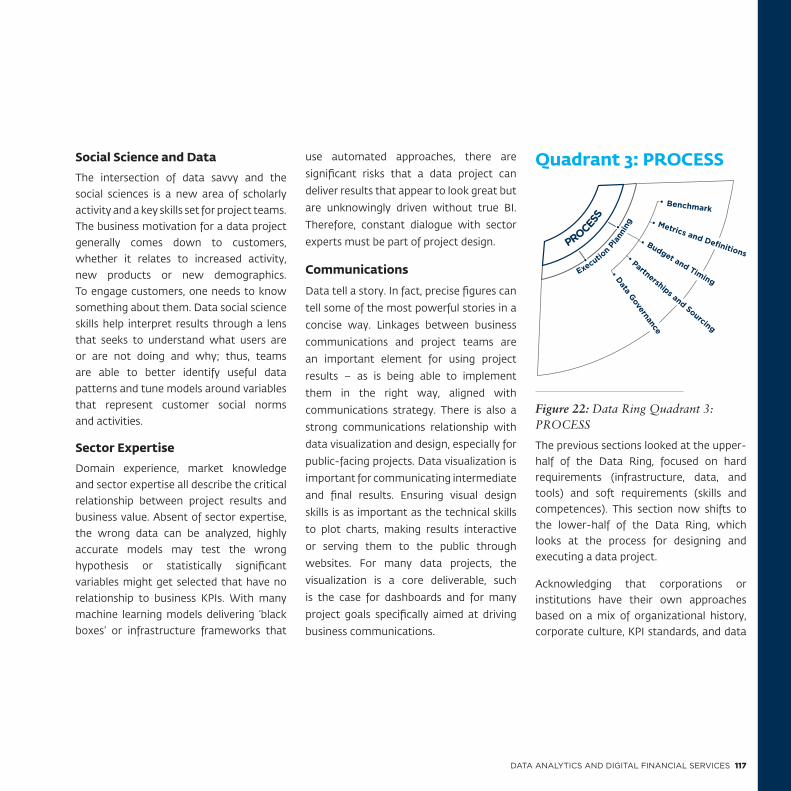
DATA ANALYTICS AND DIGITAL FINANCIAL SERVICES 117
Social Science and Data
The intersection of data savvy and the social sciences is a new area of scholarly activity and a key skills set for project teams. The business motivation for a data project generally comes down to customers, whether it relates to increased activity, new products or new demographics. To engage customers, one needs to know something about them. Data social science skills help interpret results through a lens that seeks to understand what users are or are not doing and why; thus, teams are able to better identify useful data patterns and tune models around variables that represent customer social norms and activities.
Sector Expertise
Domain experience, market knowledge and sector expertise all describe the critical relationship between project results and business value. Absent of sector expertise, the wrong data can be analyzed, highly accurate models may test the wrong hypothesis or statistically significant variables might get selected that have no relationship to business KPIs. With many machine learning models delivering ‘black boxes’ or infrastructure frameworks that
use automated approaches, there are
significant risks that a data project can
deliver results that appear to look great but
are unknowingly driven without true BI.
Therefore, constant dialogue with sector
experts must be part of project design.
Communications
Data tell a story. In fact, precise figures can
tell some of the most powerful stories in a
concise way. Linkages between business
communications and project teams are
an important element for using project
results – as is being able to implement
them in the right way, aligned with
communications strategy. There is also a
strong communications relationship with
data visualization and design, especially for
public-facing projects. Data visualization is
important for communicating intermediate
and final results. Ensuring visual design
skills is as important as the technical skills
to plot charts, making results interactive
or serving them to the public through
websites. For many data projects, the
visualization is a core deliverable, such
is the case for dashboards and for many
project goals specifically aimed at driving
business communications.
Quadrant 3: PROCESS
The previous sections looked at the upper-half of the Data Ring, focused on hard requirements (infrastructure, data, and tools) and soft requirements (skills and competences). This section now shifts to the lower-half of the Data Ring, which looks at the process for designing and executing a data project.
Acknowledging that corporations or institutions have their own approaches based on a mix of organizational history, corporate culture, KPI standards, and data
Figure 22: Data Ring Quadrant 3: PROCESS

118 DATA ANALYTICS AND DIGITAL FINANCIAL SERVICES
governance regulations, the following are considered general good practices to enable data-driven projects and their deliverables.
Data projects must define their deliverables, the results of project Planning and Execution. These results intermediate between Process and the subsequent block that aims at turning them into business Value. The following list specifies eight elements common to many data projects. Where applicable, these should be in a project’s deliverables timeline, or specified within terms of reference for outsourced capacity.
Dataset(s)
Datasets are all the data that were collected or analyzed. Depending on the size, collection method and nature of the data, the format of the dataset or datasets can vary. These should all be documented, with information on where they are located – such as on a network, or a cloud – and how to access them. Raw input data will need to be ‘cleaned’, a process discussed in the execution section below. Cleaned datasets should be considered as specific deliverables, along with scripted methods or methodological steps applied to clean the data. Finally, aggregated datasets and methods might also be considered as
specific deliverables. These are needed to help project sponsors see what was done to the data and possibly to detect errors. Additionally, these support follow-on projects or derivative analyses that build on cleaned, pre-aggregated data.
Questionnaires and Collection Tools
Projects that require primary data collection, both quantitative and qualitative, may need to use or develop data collection tools, such as survey instruments, questionnaires, location check-in data, photographic reports, or focus group discussions or interviews. These instruments should be delivered, along with the data collected, including all languages, translations and transcripts. These are needed to permit follow-on surveys or consistent time-series questions, and they also provide necessary audit or verification documents if questions arise on the data collection methods at a later stage.
Data Inventory Report
This is a report with a summary of the data that were used for analysis. This report includes the type, size and date of files. It should include discussions of major anomalies or gaps in the data, as well as an assessment of whether anomalies may be statistically biased or present risks
to interpretation. It may include charts that plot principle data points for core segments, such as transactions over time disaggregated by product type to show trends, spikes, dips, and gaps. Delivered early on in the execution process, the data inventory report is an opportunity to discuss potential project risks due to the underlying data as well as strategies for course-correction and need for data refinement or re-acquisition. It is especially helpful to scope data cleaning requirements and strive to adjust for anomalies in a statistically unbiased way.
Data Dictionary
The data dictionary consolidates information from all data sources. It is a collection of the description of all data items, for example, tables. This description usually includes the name of the data field, its type, format, size, the field’s definition, and if possible, an example of the data. Data fields that constitute a set should list all possible values. For example, if a transaction dataset has a column called ‘product’ that lists whether a transaction was a top-up, a peer-to-peer, a cash-out, then the dictionary would list all product values and describe their respective codes observed in the data, such as TUP, P2P, and COT, respectively. For data that are not in a discrete set, like money, then a min-max
2.1_MANAGING A DATA PROJECT

DATA ANALYTICS AND DIGITAL FINANCIAL SERVICES 119
range value is usually provided, along with its unit of measure, such as the currency type. Relationships with other datasets should also be specified, where possible. For example, a customer’s account number data field might be present in product transaction datasets and also in KYC datasets. Specifying this connection helps to understand how data can be merged, or to identify where additional metadata requirements may be needed to facilitate such a merge. The data dictionary is typically delivered in conjunction with the data inventory report, supporting a project’s strategic design discussion, risk assessment or additional data requirements in its early stages.
Exploratory Analyses and Logbook
This is a set of plots, charts, or table data summarizing the main characteristics of a specific enquiry or hypothesis test. All the descriptive statistics of the data could also be included, for example, averages, medians or standard deviations. The exploratory analysis part of identifying trends and discovered patterns within the data is necessary for refining analytic hypotheses, contextualizing metadata or identifying ‘features’ that are used in a model. Exploratory analysis is performed as part of initial project execution, and it often continues through to project completion.
Exploratory results typically support
intermediate deliverables or project
milestone assessments. These results may
also be summarized to help articulate
project status and progress by highlighting
questions under current exploration as
well as questions that have already been
addressed. A logbook of exploratory
initiatives and principle findings is useful in
this regard.
Model Validation Charts and Performance Metrics
For model-based data projects, this is
a list of charts with the most relevant
performance metrics of the predictive
model. See the Chapter 2.2.3: Metrics for
Assessing Data Models for a list of the
top-10 model performance metrics and
definitions. These charts and metrics
will be used to evaluate the efficacy and
reliability of the model. Validation charts
may include the gain and lift charts, and the
performance metrics will depend on the
particular project. These may include, for
example, Kolmogorov-Smirnov test (KS),
Receiver Operating Characteristic (ROC)
curve, or Gini coefficient. This information
is necessary to assess goal-completion
milestones. The model’s approval for
production use or next-step iteration
should be made in terms of these metrics.
Analytic Deliverables: Results, Algorithms, Whitelists and Visualizations
These are the actual results of the project. A customer segmentation project may include a whitelist of customers to target and their associated propensity scores as well as possible geolocation information to advise a marketing campaign. A credit scoring algorithm delivers result sets for users specified in control and treatment datasets and the code for the model itself, or a visualization including scripts to plot KPIs and animate them and webscripts or other components for a user interface. Each project will have its own set of nuanced deliverables. These must be defined as part of the project’s process design.
Final Analysis Report and Implementation Cost-benefit Discussion
This is the final report presenting analysis results, answering the questions and referring to the goals that were set and agreed on at the beginning of the project. This should be delivered in conjunction with the analytic deliverables. In addition to discussing methodology, process, findings, and solutions to key challenges, the final report should articulate the core value proposition of the analytic deliverables. This may include: efficiency gains and
120 DATA ANALYTICS AND DIGITAL FINANCIAL SERVICES
cost savings from improved data-driven
marketing; forecasting increased lending
opportunities; or productivity benefits
from dashboards. The final report should
be considered with respect to the project’s
implementation strategy, to reflect on the
cost-benefit of the value proposition in
the analytic deliverables and the resource
requirements to implement them at the
scale expected by the project.
Process: Planning
The following considerations are particularly
relevant for planning data projects and
helping to specify the scope of intermediate
and final deliverables.
Benchmarks
Understanding who else had a similar
problem and how it was approached
and solved is crucial in the planning the
execution phase. Scientific literature is
an immense source of information and
the boundaries between research and
operational application often overlap in the
data field. From the project management
perspective, benchmarking means
analyzing business competitors and their
activities in the data field, ensuring that
the project is aligned with the company’s
practices and internal operations. In lay
terms, don’t reinvent the wheel.
Metrics and KPIs
Metrics are the parameters that drive project execution and determine if the project is successful. For example: rejecting null hypothesis at a 90 percent confidence target; achieving a model accuracy rate of 85 percent; or response time on a credit score decision below two seconds. Ex-ante metrics setting avoids the risks related to post-validation when, due to vague thresholds, project owners deliver ‘good enough’ results. This is often in an effort to justify the investment, or even worse, affirm results against belief, insisting they should work. See Chapter 2.2.3: Metrics for Assessing Data Models, which provides a list of top-10 metrics used in data modeling projects. Metrics related to user experience are also important, but must be specific to project context. For example, when assessing how long is acceptable for a user to wait for an automated credit scoring decision, faster is better. Still though, it needs to be a defined KPI ex-ante to enable the project team to deliver a well- tuned product.
Budget and Timing
The planning and management control must take into consideration the almost-permanent open state of data projects. Goals and targets show an end point, but until it is reached, a data project is often
about a continuous re-modulation on the basis of improving problem awareness and definition. Some may believe that if they re-tune it differently, next time they can hit 85 percent. Some others may think they could add new customer data to improve the model. This fluid situation does not help in estimating budgets, but budget parameters should be used by project managers as a dial to tune efforts, commitment and space in order to test different hypotheses. Upfront investments should understand this exploratory and iterative process and its risks. The concept of product scale also helps mitigate this risk; start small, iterate up. It may risk inefficiencies to scale and refactor, but it also mitigates budgetary risks such as buying new computers only to later find that the hypothesis does not hold.
Timeline planning has similar considerations to budget planning. Again, the trade-off is between giving space to exploration and research by keeping an alignment to goals and metrics. A project management technique from the software industry known as the ‘agile approach’ is useful for data projects. This approach looks at project progression through self-sustainable cycles where output is something measurable and testable. This helps to frame an exploration in a specific cycle.
2.1_MANAGING A DATA PROJECT

DATA ANALYTICS AND DIGITAL FINANCIAL SERVICES 121
Partnerships, Outsourcing and Crowdsourcing
This point is particularly important from the
project resource perspective. Asking project
design questions about requirements and
their sufficiency helps to identify the gaps
for project managers to fill. Notably, this
is not limited to human resources. Cloud
computing is outsourced computational
hardware. Even data can be externally
sourced, whether by licensing it from
vendors or by establishing partnerships
that enable access. Crowdsourcing is
an emerging technique to solicit entire
data teams with very wide exploratory
bounds, usually with the goal of delivering
pure creativity and innovative solutions
to a fixed problem for a fixed incentive.
As examples, Kaggle is a prominent pioneer
for crowd-sourced data science expertise;
or Amazon’s ‘Mechanical Turk’ service for
crowd-sourced small tasks or surveys.
An important element to consider is
Intellectual Property (IP). Rights should
be specified in contractual agreements.
This includes both existing IP as well as IP
created through the project. Consider the full
process and execution phase along the data
pipeline. IP encompasses more than final
deliverable results; it includes scripts and
computer codes written to perform the
analysis, and even intermediate datasets,
aggregates and segmentations that feed
into other processes.
Data Governance
This is how and when the data get used and
who has access to them. Data governance
planning should consult broader
corporate policy, legal requirements and
communications policies. The purpose of
the plan is to permit data access to the
project team and delivery stakeholders,
while balancing against data privacy and
security needs. The data governance plan
is usually affected by the project’s scale,
where bigger projects may have much
more risk than smaller projects. A main
challenge is that the data science approach
benefits from access to as much data as
is available in order to bridge datasets
and explore patterns. Meanwhile, more
data and more access also pose more
risk. Project data governance should also
specify the ETL plan. This also encompasses
transportation, or planning for the physical
or digital movement, which must consider
transit through policy or regulatory
environments, such as from a company in
Africa to an outsourced analytics provider
in Europe. The plan should consider the
following principles:
• Encryption: Sensitive or identifying information should be encrypted, obfuscated, or anonymized, and maintained through the full data pipeline.
• Permissions: Access to datasets should be defined on a granular basis by team roles, or by access point (i.e., from within corporate firewalls, versus from external networks).
• Security: Datasets placed into the project’s ‘sandbox’ environment should have their own security apparatus or firewall, and ability to authenticate privileged access.
• Logging: Access and use should be logged and auditable, enabled for analysis and reporting.
• Regulation: The plan should ensure regulatory requirements are met, and NDAs or legal contracts should be in place to cover all project stakeholders. Customer rights and privacy must also be considered.
Process: Execution
Exactly as the Data Ring depicts a cyclical process, the Execution phase in many data projects tends to reflect a sort of loop within the loop. What is usually called a ‘data analysis’ is actually more of
a collection of progressive and iterative

122 DATA ANALYTICS AND DIGITAL FINANCIAL SERVICES
steps. It is a path of hypotheses exploration and validation until a result achieves the defined target metrics.
The Execution phase most closely resembles established frameworks for data analysis, such as CRISP-DM or other adaptations.39 Project managers who prefer to use a
specific analytic process framework, or whose projects may be better served by a given approach, can easily incorporate these frameworks into the Data Ring’s project design specification here in the execution phase. The following steps are otherwise provided as a general good practice data analytic execution process.
Cleaning, Exploring and Enriching the Data
This step is where the data science team really starts. The chance that a dataset is perfectly responsive to the study needs is rare. The data will need to be cleaned, which has come to mean:
a. Processing: Convert the data into a common format, compatible with the processing tools.
b. Understand: Know what the data are by checking the metadata and available documentation.
c. Validate: Identify errors, empty fields and abnormal measurements.
d. Merge: Integrate numeric (machine-readable) descriptions of events performed manually by people during the data collection process in order to provide a clear explanation of all events.
e. Combine: Enrich the data with other data, whether from the same company, from the public domain, or elsewhere.
f. Exploratory Analysis: Use data visualization techniques to partially explore data and patterns.
g. Iterate: Iterate until errors are accounted and a process is in place to go reliably from raw data to project-ready data. This is the minimum viable process.
39 Related data analytic process methods include, for example: ‘Knowledge Discovery in Databases Process’ (KDD Process) by Usama Fayyad; ‘Sample, Explore, Modify, Model, Assess’
(SEMMA) by SAS Institute; ‘Analytics Solutions Unified Method for Data Mining/Predictive Analytics’ (ASUM-DM) by IBM; ‘Data Science Team Process’ (DSTP) by Microsoft
Hypothesis setting
Cleaning, exploring, enriching the data
Running data science toolsResults understanding
Hypothesis validation?
Execution
2.1_MANAGING A DATA PROJECT
Figure23: The Data Ring Execution Process

DATA ANALYTICS AND DIGITAL FINANCIAL SERVICES 123
Running Data Science Tools
This is where data scientists apply their expertise. Machine learning, data mining, deep learning, NLP, network science, statistics, or (usually) a mix of the aforementioned are applied. When developing data projects that include predictive models, it is necessary to have a model validation strategy in place before the model is run. This enables the project hypothesis to be statistically tested. Practically, the dataset that drives the model must be segmented into a ‘control’ set and a ‘treatment’ set using randomized selection. A 20 percent to 80 percent split is a common, basic approach. The model is trained on the treatment set. Then, the model can run on the control set, and the model’s predicted values can be compared to the control set’s known values. This is how accuracy rates are calculated and how a hypothesis may be tested.
Results Understanding, Interpretation and Representation
The results interpretation will be discussed in more detail in the following section in terms of delivering business Value. From the process perspective, results understanding focuses on ensuring an alignment between the results obtained and the expected output of the process execution; and ensuring that they’re computationally valid (i.e., controlling arithmetic errors, or
coding bugs). The output of any analytic calculation or process, whether big or small, will yield:
• Unusable (or incorrect) Results
• Trivial or Already-known Results
• Usable Results that Feed into Next Steps
• Unexpected Results (to be investigated with a new pipeline, new data or new approach)
The project design should recognize these possible outcomes and be prepared to deal with each case. Barring unusable results, all other outcome categories are likely to merit a presentation or reporting task in order to make it comprehensible to others, including internal team members, managers, customers, and general audience. This usually means a written summary, table, graph, or animation, which are mediums to present and explain results. Data visualization experts play a key role in this process, as it is not just a matter of beautifying results. The difficult task is to create compelling, interactive and visual layers to succinctly add to the broader project narrative, which should constitute a project problem statement unto itself.
The execution phase is also the opportunity to reassess project plans, again noting that data projects are best delivered using an iterative approach. The execution phase
of a project is what will test the project’s
design process and approach, pushing for
revision when the unexpected arises. The
Data Ring framework can also help think
through execution problems to identify
solutions; its concepts are not restricted
to upfront planning. The associated Data
Ring Canvas (discussed in 2.1: Application)
is designed with this intention, to provide a
template that can be updated continuously
to reflect the project’s status throughout
project execution.
Metrics Assessment and Next Steps
Only through a quantitative and precise
initial definition of project goals and
metrics can project efficacy be judged.
If the results are not satisfactory, the
process has to start again. This evaluate-
and-iterate step is always critical, but has
additional considerations when external
firms are sourced. Deliverables may be
judged inadequate despite the work
quality. Accountability of delivered results
must be agreed up front, as should the
degree of leeway to continue iterating in
pursuit of satisfactory results. Exactly as
their part in the hypothesis setting first
step of this execution loop, data project
managers again play a key role in keeping
the scientists focused on main goals and
empowering future iterations.

124 DATA ANALYTICS AND DIGITAL FINANCIAL SERVICES
Quadrant 4: VALUE
Value is the last part of the Data Ring or, by design, the starting point for future iterations to add or implement components or scale-up the design. This step articulates how the results of process execution are ultimately transformed into ‘information’, and then ‘knowledge and value’ that can be implemented.
This value-creation component of the results is usually one of the substantial differences between a traditional data analysis or BI project and an advanced analytics process, particularly in the big data space. This is because project deliverables are rarely defined in terms of
written reports, at least not exclusively. Data project deliverables are usually characterized by dashboards, predictive models or data-driven decision-making levers, automatization tools and, ideally, powerful business insights. In other words, a data project rarely ends with recommendations. Instead, it delivers modules to be operationalized.
Value: Interpretation
The first step following an execution stage focuses on understanding the value-proposition inherent in the results and what may be needed to refine these outputs or their underlying processes to deliver the Goal. A number could mean nothing or everything, depending on interpretation. Understanding results is not a simple explanation of phenomena. Instead, it means placing results in business context and embracing the complexity of real operations. This also requires a transparent, collaborative approach, discussing the results with all project stakeholders to determine what they mean from all angles. Keeping in mind the role of data operations (see Business Skills), it is not uncommon that data scientists may have difficulty explaining the operational relevance of results to managers. If an important finding is made, its value must be successfully communicated to management, who can drive it into action.
Value: Tuning
Understanding results is just the initial task. Data-derived knowledge must be turned into concrete actions that are manifested by tools, models and algorithms. Because of the iterative, exploratory approach of a data project, the first time a final outcome is successfully reached, it will invariably have rough edges that need to be tuned into a smooth operating tool. Tuning focuses on three areas:
Data Input
The choice and the quality of input data can decisively determine the effectiveness of the algorithms used to perform the analysis. Consider machine learning, where the algorithms develop a learning attitude following a training phase that uses a subset of data. Therefore, by working with data, operations progressively learn to collect better data. Improving the raw data and minimizing anomalies, collection methods, manual inputs and collection errors, will result in more finely tuned results over time.
Infrastructure, Skills and Process
After the first execution iterations, there will be a better understanding of the effectiveness of the team allocated to the project, data governance processes, as well as available software and hardware tools.
Figure 24: Data Ring Quadrant 4: VALUE
2.1_MANAGING A DATA PROJECT

DATA ANALYTICS AND DIGITAL FINANCIAL SERVICES 125
Also, there will be increased understanding
of how the overall project organization
works together. Inefficiencies will be
revealed and, as discussed previously,
all areas of the project can serve as
potential solution sources. Generally,
tuning strives for all components to
work increasingly well together. This is
done through: better team organization;
stronger communication; increased team
competencies; and technology, either
better methods, increased computational
power, or all of the above.
Data Output
Finally, the output data should be
reviewed. It is important that output
results are not biased or affected by errors
(human or otherwise), bad integration
between different steps of the process or
even common coding bugs. Often, this
means reviewing and fixing the input
data. Although, the analytic process is very
capable of introducing its own anomalies.
This is both a validation check and a
tuning opportunity. Ultimately, reviewing
output supports overall organization and
reliability, such as ensuring that a final
visualization displays the correct results
100 percent of the time and under all
conditions, for example.
Value: Implementation
Implementation Strategy
To generate a real impact, the implementation strategy must be designed starting from the beginning, as part of goal setting. This issue must be kept in mind throughout the process. Avoid the risk of obtaining brilliant data that cannot be used in practice. A key aspect for the implementation strategy is to ensure management buy-in. Presumably, allocating resources provides a certain level of commitment. With that said, because stakeholders have been assured there are no guaranteed results from exploratory processes, the implementation strategy needs to ensure continuous support and strong communication around intermediate findings.
Analytic types, as discussed in Chapter 1.1, can also be relevant for thinking about how results get used:
• Descriptive: Summarizing or aggregating information
• Diagnostic: Identifying sub-sets of information based on specific criteria
• Predictive: Usually building on predictive sub-sets, combined with decision-levers
• Prescriptive: Fully integrated into automated systems; a piece of operations
These descriptors can guide implementation strategy, formulating what the use case looks like. This is also an important component of generating buy-in from management. For example, if the use case envisions full automation, the project design questions must ask that infrastructure and resources are sufficient to implement a fully automated algorithm. If investing in a new data center is needed to run the algorithm and deliver just-in-time credit decisions, buy-in to ensure that the project results are used could be difficult, whereas a use case strategy based on a small-scale pilot implemented with existing resources might make an easier case.
Cost-benefit
The anticipated value proposition should be articulated in the initial design. At the outset, this may be in general terms, for example: an efficiency gain, a cost reduction or customer retention. As the project develops and results are obtained and tuned, the value proposition may become quantified. Once the goal is achieved, this will help define what has actually been obtained and the value that it represents. The same process should be considered for using the results. In the beginning, some general infrastructure or system requirements may be envisioned. Once the project is mature, the value must be weighed against the cost of implementing the solution.
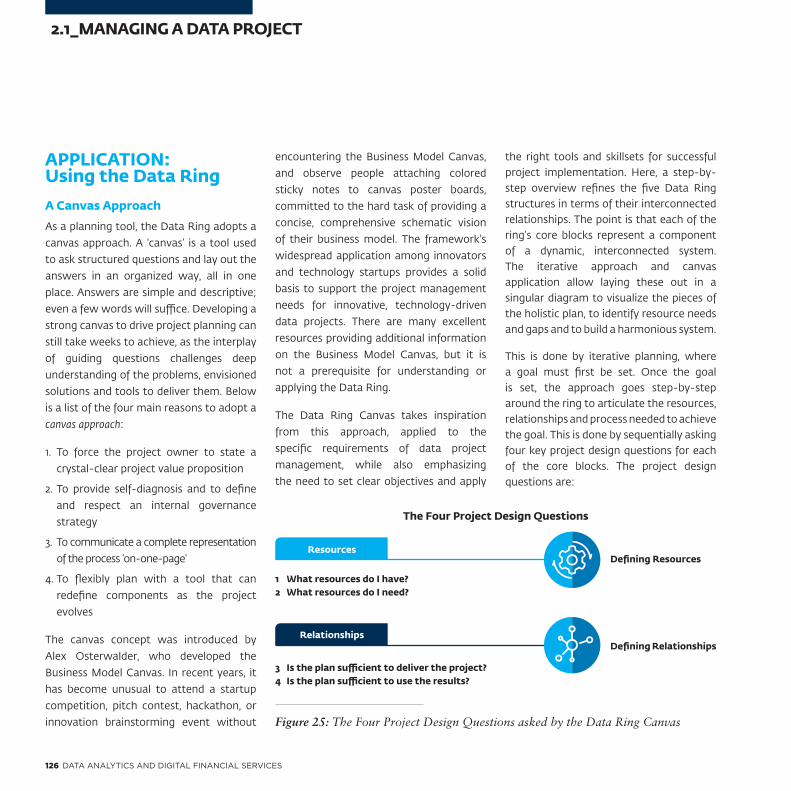
126 DATA ANALYTICS AND DIGITAL FINANCIAL SERVICES
APPLICATION: Using the Data Ring
A Canvas Approach
As a planning tool, the Data Ring adopts a
canvas approach. A ‘canvas’ is a tool used
to ask structured questions and lay out the
answers in an organized way, all in one
place. Answers are simple and descriptive;
even a few words will suffice. Developing a
strong canvas to drive project planning can
still take weeks to achieve, as the interplay
of guiding questions challenges deep
understanding of the problems, envisioned
solutions and tools to deliver them. Below
is a list of the four main reasons to adopt a
canvas approach:
1. To force the project owner to state a
crystal-clear project value proposition
2. To provide self-diagnosis and to define
and respect an internal governance
strategy
3. To communicate a complete representation
of the process ‘on-one-page’
4. To flexibly plan with a tool that can
redefine components as the project
evolves
The canvas concept was introduced by
Alex Osterwalder, who developed the
Business Model Canvas. In recent years, it
has become unusual to attend a startup
competition, pitch contest, hackathon, or
innovation brainstorming event without
encountering the Business Model Canvas,
and observe people attaching colored
sticky notes to canvas poster boards,
committed to the hard task of providing a
concise, comprehensive schematic vision
of their business model. The framework’s
widespread application among innovators
and technology startups provides a solid
basis to support the project management
needs for innovative, technology-driven
data projects. There are many excellent
resources providing additional information
on the Business Model Canvas, but it is
not a prerequisite for understanding or
applying the Data Ring.
The Data Ring Canvas takes inspiration
from this approach, applied to the
specific requirements of data project
management, while also emphasizing
the need to set clear objectives and apply
the right tools and skillsets for successful project implementation. Here, a step-by-step overview refines the five Data Ring structures in terms of their interconnected relationships. The point is that each of the ring’s core blocks represent a component of a dynamic, interconnected system. The iterative approach and canvas application allow laying these out in a singular diagram to visualize the pieces of the holistic plan, to identify resource needs and gaps and to build a harmonious system.
This is done by iterative planning, where a goal must first be set. Once the goal is set, the approach goes step-by-step around the ring to articulate the resources, relationships and process needed to achieve the goal. This is done by sequentially asking four key project design questions for each of the core blocks. The project design questions are:
Resources
Relationships
1 What resources do I have?2 What resources do I need?
3 Is the plan sufficient to deliver the project?4 Is the plan sufficient to use the results?
Defining Resources
Defining Relationships
Figure 25: The Four Project Design Questions asked by the Data Ring Canvas
2.1_MANAGING A DATA PROJECT
The Four Project Design Questions

DATA ANALYTICS AND DIGITAL FINANCIAL SERVICES 127
Before closing this section, it is important to remember the most common mistake made when using these types of business tools: do not focus too much on the canvas completion. Simply put, the Data Ring Canvas – like the Business Model Canvas – is only a means, not the objective itself.
Defining and Linking Resources
Defining Resources
The first two questions identify project resource requirements. These are identified by sequentially asking the first guiding question: “What data do I have?...What skills are available to the project?...What internal processes are already in place?...” The guiding questions for each component should be considered in order to detail the planning process. This includes asking, “What value do I have?” Answering perhaps not in terms of results already achieved, but at the outset, this may be a useful, relevant question. There might be tuning methods to draw on from related projects, or perhaps there are pre-existing commitments from management to drive implementation. These should be considered among initial Value resources that drive overall planning.
Once resources are scoped across each block, the questions iterate:
• What data do I need?
• What skills do I need?
• What budget, benchmark, data
governance, or ETL plan do I need?
This is especially critical for value, as
exploring required value underlies the
project motivation. Also, value ties in with
the resources that are acquired through
the project’s own analytic results. Planning
project needs in terms of value also helps to
define both intermediate and final project
deliverables, including the development
of reports or knowledge products. This
sequential, iterative approach helps to
identify gaps and acquisition requirements
as they arise in steps, building the overall
plan incrementally.
Linking Resources
With resources specified for each
structural block, a project plan should aim
to deeply understand their interconnected
relationships. The last two project design
questions reflect on these relationships;
that is, given the resources envisioned in
one category block, the need to explore
if the resources in the other categories
are sufficiently linked together. If not,
requirements and linkages may need to be
adjusted vis-à-vis one another. These four
linkages are specified in the Figure 26: fit,
ops, results, and use. Each linkage should
be specified to complete the Data Ring
Canvas and articulate a holistic project
plan. These are described to the right:
Data Ring Relationships
FIT: Tools and Skills
All of the project’s hard and soft resources must be able to work together, a relationship described by Fit. It might seem obvious, but practical experience shows that the resources assessment phase is often underestimated. Different pieces of hardware and software need to ‘speak’ to one another. People must also speak, not only to communicate with each other within the team, but also to use technical infrastructure. The canvas should specify the primary scripting and
Figure 26: Highlighting Resource Linkages in the Data Ring Canvas

128 DATA ANALYTICS AND DIGITAL FINANCIAL SERVICES
database languages, as well as the specific framework methods needed to deliver the project. Notably, these languages must be common across teams and tools.
The tools and skills should also fit the project’s goal scope. The main risk related to an incorrect assessment of the resources is pushing advanced hardware components, fully developed software solutions or human skills (e.g., data scientists) to the project without proper integration with existing infrastructures and domain experts. The recommended starting goal for a minimum viable process and product helps mitigate this risk by goal setting around smaller resources; the idea is to explore ideas and test product concepts. Once proved, one can incrementally scale up the process and the product with the hard and soft resources needed to go to the next level.
OPS: Skills and Process
Project operations, or Ops, is the process where people tackle the actual computations and data exploration necessary to deliver the project. These activities are driven by the specific analytic questions and operational problems that the project team is working to resolve. For example, a credit scoring project would likely have a specific operational problem to calculate variables that correlate with loan default rates. Similarly, a visualization might have the technical problem of how to
plot an agent network on a map. Ops looks at what people are doing. The Process block articulates how people take action in terms of time, budget, procedural or definitional requirements. The project operations link to Skills in that identifying viable solutions to the operational problems requires relevant know-how about the topic. The canvas ops should specify the project’s core operational problems that must be tackled, linked by the skills needed to tackle them and the process to get them done.
RESULTS: Process and Value
The computational Results of the process execution will be turned into value. The canvas should list the specific results that are expected, whether it is an algorithm, model, visualization dashboard, or analytic report. Value is achieved through the process of how results are interpreted, tuned and implemented. Model validation approaches link with the selected model’s type of data results. The model choice is linked by the definitions and metric targets established in Process and the business interpretability and use implementations that create Value. Numeric results and their interpretation carry the risk of not being able to correctly understand the results obtained. There is also a risk when turning these results into decisions or business levers that deliver value. To ensure results are interpretable for business needs, the canvas must consider its key deliverables and may include additional resources that
facilitate value interpretation, such as a final analytic report. Additional data results or supplementary models may also need to be specified to ensure a strong relationship between the Process and Value blocks.
USE: Value and Tools
The fourth project design question looks past delivery, toward achieving value from the project’s Use. The project’s design must be sufficient to use the output of the data product. A visualization dashboard will run on a computer, for example, that is connected to an internal intranet or the broader web. A web server will put it online so people can use it. The data it visualizes will be stored somewhere, to which the dashboard must connect and access the data. IT staff will maintain these servers. These resources may or may not be identified in terms of what is needed to deliver the project itself. The fourth project design question helps to identify implementation gaps that could emerge upon project completion, ensuring these considerations are made as part of up front project planning. Use links the Value the project delivers with the Tools needed to feed the project’s output data into the implementation system. This is especially important for projects drawing from outsourced solutions, where implementation support needs must be scoped within initial procurement. The canvas Use should specify how the implementation strategy connects to implementation tools.
2.1_MANAGING A DATA PROJECT

DATA ANALYTICS AND DIGITAL FINANCIAL SERVICES 129
This project management case draws on the Airtel Money Uganda case presented in Chapter 1.2, Case 3. This project was designed and managed by IFC’s Financial Inclusion research team based in Africa. The use case below walks through each of the Data Ring’s project design questions and considers the specifics of this project. A completed Data Ring Canvas reflects this process, articulating the key project resources and design relationships in a single visualization. While this canvas is for a completed project, the process of using a canvas approach is dynamic; writing and erasing components as misalignments force new design and requirement considerations. In addition, using sticky notes is a good approach, as they permit easy additions and new design elements while also allowing for movement on the canvas until a satisfactory plan is achieved.
Goal Setting: Where the Data Ring Starts
A goal is a solution for a strategic problem, and the project’s purpose is to deliver that solution. In this example, the problem was low Airtel Money activity rates. IFC proposed a solution: a model to define the statistical profile of an active user and matching that profile against non-users within the existing GSM subscriber base. Once identified, these customers could be efficiently targeted as high-propensity Airtel Money users. Because it was unknown if this profile match was possible, it was important to set a modest scope aimed at a proof of concept:
• The Goal: To develop a minimum viable customer segmentation prediction model to identify high-propensity active users that would increase activity rates
• The Hypothesis: There is a correlation between GSM activity and Airtel Money activity behavior (i.e., statistical profiles can be created and matched)
Resource Identification
IFC was not in possession of Airtel data ex-ante, having only a commitment from the Airtel partnership to provide access to CDR and Airtel Money transaction data. While both IFC and Airtel have substantial IT infrastructure for their operations, these were not available for project requisition. The IFC team tasked a data operations specialist to manage the project, bringing relevant skills across computer science, data science and the DFS business. IFC DFS specialists, financial inclusion research specialists and regional experts familiar with the local market and customer behaviors supported the project. During process planning,
CASE 14Managing the Airtel Money Big Data Project

130 DATA ANALYTICS AND DIGITAL FINANCIAL SERVICES
the operational problem was known ex-ante: low Airtel Money activity. The team also had existing benchmark data from a similar data project delivered for Tigo Ghana (see Chapter 1.2, Case 2: Tigo Cash Ghana, Segmentation), which helped to set project management metrics, like an 85 percent accuracy target for the envisioned model. The model’s definitions also specified ‘30-day activity’ as its dependent variable. Finally, budget was allocated through the IFC advisory project, funded by Bill and Melinda Gates Foundation; a six-month timeline was set.
Resource Exploration
Through the IFC-Airtel project partnership, the team negotiated access to six-months of historical CDR and Airtel Money data, approximately one terabyte, to be extracted from Airtel relational databases and delivered in CSV format. This necessitated a big data technical infrastructure and the data science skills to analyze it. IFC issued a competitive Request for Proposal (RFP) to outsource these technical
elements, for which Cignifi, Inc. was selected. Cignifi brought: additional infrastructure resources, with their big data Hadoop-Hive clusters; sector experience working with MNO CDR data; skills in ‘R’ and Python; statistics and machine learning; and resources for data visualization. The IFC-Airtel-Cignifi team then set a data governance and ETL plan that was advised by legal and privacy requirements. This plan sent the Cignifi team to Kampala, Uganda to work with Airtel’s IT team to: understand their internal databases; define the data extract requirements; encrypt and anonymize sensitive data; and then transfer these data to a physical, secured hard drive to be loaded onto Cignifi’s servers. The project’s value expectations were specified in the RFP for a data output listing user propensity scores, known as a ‘whitelist’. Additional analytics were also specified, including a social network mapping and geospatial analysis.
Plan Sufficiency: Delivery
Sufficiency review helps to ensure alignment across all the planned
resources, processes and results. Importantly, it helps to pre-identify points that anticipate refinement during the implementation process. It also helps reassess key process areas when issues are uncovered during the analytic execution and require adjustments to the plan.
The data governance plan expected refinement; the project’s analytic and execution phase was 10 weeks, but was planned relative to the data acquisition start date, meaning project timing would be affected by actual date and any ETL issues. The data pipeline also had uncertain sufficiency; planning the pipeline and allocating technical resources was not possible until the final data could be examined and their structure known. This is a common bottleneck. Anticipating these uncertainties, the value add specified an inception deliverable: a ‘data dictionary’ that discussed all acquired data descriptions and relationships, and that would be used to refine project sufficiency once these details were known. The execution phase of any data project is where surprises test
2.1_MANAGING A DATA PROJECT

DATA ANALYTICS AND DIGITAL FINANCIAL SERVICES 131
the project plans. As this is to be expected, the project also specified an early deliverable in the form of an interim data report, which would provide high-level descriptive statistics and findings of initial exploratory analysis, anomalies or gaps in the data. The interim data report would also include anything unexpected that might require a strategic adjustment.
Plan Sufficiency: Implementation
The project’s MVP goal sought to test whether the modeling approach was relevant for Airtel and the Uganda DFS market. In this sense, the plan in place was sufficient. The project would deliver (a) a final report, with key findings and analysis (b) a whitelist: a dataset of Airtel’s millions of GSM clients – by an encrypted identifier – each with an associated propensity score of how likely they were predicted to actively use Airtel Money.
The plan in place was not sufficient in the sense that resources were pre-allocated to use the whitelist
information in marketing campaigns, if the analysis proved successful. The delivery strategy was agreed with Airtel management: a final meeting would allow presentation and discussion of the analytic report, and Airtel’s IT team would take the whitelist to base next steps on the findings.
Project Execution: Planning Adjustments
Realities on the ground require project plan adjustment. The following challenges were discovered during project execution and required revising the plan to ensure all project areas were sufficiently working toward goal achievement.
After the initial dataset was secured, the data pipeline process found irregularities. The extraction process somehow inserted empty lines into the raw datasets. While the data could be loaded successfully, it interpreted incorrectly; numerous data gaps existed even though that was not the case. This required changes to the ETL process. The fix
revealed a more significant error. The first month’s dataset did have serious gaps, and this issue required revising the data governance ETL plan and overall project design. The original project plan specified October 2014 through March 2015 data. The solution was to discard October data entirely and work with Airtel to extract data for April in order to maintain the six-month time series necessary to ensure a statistically reliable model. It was also discovered that, according to plan, the data themselves were insufficient. The geospatial and network analysis required tower location data. It was discovered that the Airtel Money datasets did not record the location of where transactions were made, only the time they took place. The Cignifi team contextualized these metadata by creatively matching timestamps in the Airtel Money data with timestamps of voice calls for matched users in the GSM data. The team used a 30-minute window, which provided a location coordinate that was reliable within a 30-minute time-distance from the location of

132 DATA ANALYTICS AND DIGITAL FINANCIAL SERVICES
the Airtel Money transaction. In discussion with the IFC team, it was agreed that this was acceptable for the analysis to proceed, although it relied on the assumption that most people, on average, were not traveling great distances in the 30-minute period between making an Airtel Money transaction and making a phone call.
The tuning phase required a number of significant changes. The summary statistics of the first-round results appeared unusual to the DFS specialists; they did not match behavior patterns the social science experts were familiar with. It was discovered that the original project definitions had ambiguously specified ‘active user’ in such a way that the analysis team modeled an output in terms of a DFS transaction within 30 days of the Airtel Money account opening date, rather than a
transaction within any 30-day period over the entire dataset. This required the model design to be redone. This was ultimately a benefit, as the initial analysis also revealed that cash in and cash out transactions were not providing the desired statistical robustness to achieve the project’s accuracy metrics. The IFC-Cignifi team agreed to redo the models using the redefined active users and to refocus on P2P transactions, as they were deemed to provide the greatest accuracy and, importantly, to define propensity scores for the highest revenue-generating customer segment. Moreover, an additional model was added for ‘highly active users,’ or those who transacted at least once per 30 days over a consecutive three-month period. Although a small group, these users generated nearly 70 percent of total Airtel Money revenue; the additional
model aimed to identify these high-value customers.
Finally, the results interpretation led to an additional project results deliverable: business rules. As discussed in the related Airtel case, the model’s machine learning algorithms established a number of significant variables that were difficult to interpret in a business sense. The IFC team considered that the deliverable to Airtel management could be enhanced by ensuring the model and associated whitelist propensity scores articulate the statistical profile of active users in business terms that align with business-relevant KPIs. Cignifi delivered three quick segmentation metrics with ‘cut points’ to profile users by: number of voice calls per month; total voice revenue per month; and total monthly voice call duration.
2.1_MANAGING A DATA PROJECT

DATA ANALYTICS AND DIGITAL FINANCIAL SERVICES 133
FIT
OPSU
SE
RESULTS
Identifying towerlocation proxy
GOAL
A Completed Canvas: The Airtel Big Data Project Design, Using the Data Ring Canvas
Figure 27: A Completed Data Ring Canvas for the Airtel Big Data Phase I Project
#DATA 1 TB anonymized CDR and Airtel money transaction data over 6 months
#INFRASTRUCTUREAirtel: Oracle
#INFRASTRUCTURECignifi: Hadoop, Spark, AWS, Proprietary methods
Decision meeting
Marketing CampaignSystem using whitelist
#IMPLEMENTATIONTargeted marketingcampaigns
#TUNINGDifferent models: GLM, Random Forest, Ensemble
#INTERPRETATIONValidation out of timeand out of sample
PL-SQL, R, Python, Pig, Ggplot
#BUSINESS IFC: Data OPS, DFS
#DATA SCIENCECignifi: Statistics,Data Science, Viz
#COMPUTER SCIENCEAirtel: ICT (ETL)Cignifi: Managing big data, encryption
Customer segmentation model to identify users with high propensity to increase
activity rates
Profiling active Airtel Money customers
Mapping geo-spatially P2P flows
Customer Whitelistpropensity scores
Analytic report
#DEFINITIONS‘Active’, ‘Highly Active’ users
#PARTNERSHIP/OUTSOURCINGIFC, Airtel, Cignifi (3-way communication)
#TIME&BUDGET 6 months | $ from Bill & Melinda Gates Foundation
#EXECUTIONMachine learning model with 85 percent accuracy
The Data Ring Canvas Airtel Big Data IFC Dec 2015 7Project name: Designed by: Date: Version:
‘Business rules’
#INTERPRETATIONFinancial Inclusion growth strategy
©2017 International Finance Corporation.
Data Analytics and Digital Financial Services Handbook (ISBN: 978-0-620-76146-8).
This work is licensed under a Creative Commons Attribution-NonCommercial-ShareAlike 4.0 International (CC BY-NC-SA 4.0) License.The Data Ring Canvas is a derivative of the Data Ring from this Handbook, adapted by Heitmann, Camiciotti and Racca under (CC BY-NC-SA 4.0) License.View more here: https://creativecommons.org/licenses/by-nc-sa/4.0/

134 DATA ANALYTICS AND DIGITAL FINANCIAL SERVICES
Project Delivery
The model whitelist identified approximately 250,000 highest-propensity users to target as expected active mobile money users. Across the full whitelist of several million GSM users, the top 30 percent of propensity scores predicted uptake for ‘highly active’ P2P users to generate an estimated 1.45 billion Ugandan shillings from P2P transactions; and 4.68 billion Ugandan shillings from cash-out, or approximately $1.7 million in additional annual revenue.
The project findings were strong and compelling. However, the implementation strategy was only defined as a decision point. The
delivery date coincided with an existing marketing campaign, putting the whitelist results on hold. Airtel Money subscribers grew significantly over the following several months, which diminished the value of the whitelist since many new customers were onboarded through business-as-usual marketing. Over this time, GSM subscribers also grew, which provided millions of new potential Airtel Money users. IFC and Airtel agreed to a Phase II analysis in late 2016. The project goal is similar, with an added analytic component built on Phase I, designed to examine uptake and distribution patterns of Airtel Money across time and geography.
2.1_MANAGING A DATA PROJECT

DATA ANALYTICS AND DIGITAL FINANCIAL SERVICES 135

136 DATA ANALYTICS AND DIGITAL FINANCIAL SERVICES
Managing a Resourc
es
& m
ethods
Dat
a analytics
applications
Data
data project
PART 2Chapter 2.2: Resources
2.2.1 Summary of Analytical Use Case Classifications
Summary of Analytical Use Case Classifications
Classification Question Addressed Techniques Implementation
Descriptive • What happened?• What is happening now?
Alerts, querying, searches, reporting, static visualizations, dashboards, tables, charts, narratives, correlations, simple statistical analysis
Reports
Diagnostic • Why did it happen? Regression analysis, A|B testing, pattern matching, data mining, forecasting, segmentation
Traditional BI
Predictive • What will happen in the future?
Machine learning, SNA, geospatial, pattern recognition, interactive visualizations
Modeling
Prescriptive • What should be done to make a certain outcome happen?
Graph analysis, neural networks, machine, and deep learning, AI
Integrated Solutions, Automated Decisions

DATA ANALYTICS AND DIGITAL FINANCIAL SERVICES 137
2.2.2 Data Sources Directory
Source: Core Banking and MNO Systems
Structure: Typically structured data, using relational databases.
Format: Digital data, which may be extracted in various formats for reporting or analysis. Legacy data might include paper-based registrations, or scanned registration forms.
Name Data Examples
Biller Data About Clients Duration of contract; payment history; purchase types Enhanced marketing insights; potential to create credit score using biller data
Client Registration Status Registration status (e.g., active, dormant, never used) Marketing insights; business performance monitoring; regulatory compliance
Customer KYC Name; address; DOB; sex; income Marketing insights; regulatory compliance
Account Status Account type; activity status (active, dormant, aging of activity, dormant with balance)
Marketing insights; business performance monitoring; regulatory compliance
Account Activity Account balance; monthly velocity; average daily balance
Marketing insights; credit scoring; regulatory compliance
Financial Transaction Data (direct)
Volume and value of deposits; withdrawals; bill payments; transfers; or other financial transactions
Business and financial performance monitoring; regulatory compliance; marketing insights; credit scoring
Financial Transaction Data (indirect)
Failed transactions; declined transactions; channel used; time of day
Product performance and product design issues; training and communications needs
E-money Data E-money floats; reconciliations; float transfers between agents
Agent performance management; fraud and risk management
Non-financial Activities PIN change; balance request; statement request Marketing insights; efficiency improvements; product development
Loan Origination Loan type; loan amount; collateral used; length; interest rate
Marketing insights; portfolio performance monitoring; credit scoring; new loan assessment
Loan Activity Loan balance; loan status; source of loan repayment transaction
Marketing insights; portfolio performance monitoring; credit scoring; new loan assessment

138 DATA ANALYTICS AND DIGITAL FINANCIAL SERVICES
Source: Mobile Money System
Structure: Typically structured data, using relational databases.
Format: Digital data, which may be extracted in various formats for reporting or analysis. Legacy data might include paper-based registrations, or scanned registration forms.
Name Data Examples
Customer KYC Name; address; DOB; sex; income Marketing insights; regulatory compliance
Registration Status Activity status (active, dormant, aging of activity, dormant with balance)
Marketing insights; business performance monitoring; regulatory compliance
Wallet Activity Wallet balance; monthly velocity; average daily balance
Marketing insights; credit scoring; regulatory compliance
Transaction Data Volume and value of cash in; cash out; bill payments; P2P; transfer; airtime top-up or other financial transactions
Business and financial performance monitoring; regulatory compliance; marketing insights; credit scoring
E-money Data E-money floats; reconciliations; float transfers between agents
Agent performance management; fraud and risk management
Source: Agent Management System
Structure: Typically structured data, using relational databases.
Format: Digital data, which may be extracted in various formats for reporting or analysis. Legacy data might include paper-based registrations, scanned registration forms, or agent monitoring or performance reports.
Name Data Examples
Agent Activities (direct) Agent transaction volume and value; float transfer; float deposit and withdrawal; float balance; days with no float
Sales and marketing insights; credit scoring; agent performance management
Agent Activities (indirect) PIN change; balance request; statement request; create new assistant
Sales and marketing insights; agent performance management
Merchant Activities (direct) Merchant transaction volume and value; number of unique customers
Sales and marketing insights; credit scoring; merchant performance management
Merchant Activities (indirect) PIN change; balance request; statement request; create new assistant
Sales and marketing insights; merchant performance management
Technical System Data Number of TPS; transaction queues; processing time Capacity planning; performance monitoring versus SLA; identify technical performance issues
Agent and Merchant Visit Reports by Sales Personnel
Presence of merchandising materials; assistants knowledge; cash float size; may more commonly include semi-structured or unstructured data, such as paper-based monitoring reports
Customer insights; agent performance management
2.2_RESOURCES

DATA ANALYTICS AND DIGITAL FINANCIAL SERVICES 139
Source: Customer Relationship Management (CRM) System
Structure: Often incorporating both structured and semi-structured data that uses relational database or file-based storage systems, such as voice recordings or issue summaries tagged by structured categories.
Format: Digital data, commonly, although semi-structured and unstructured data may not be available for reporting (such as for voice recordings).
Name Data Examples
Call Center Records Issues log; type of issues; time to resolution (may include semi-structured data in reports)
Customer insights; operational and performance management; system improvements
PBAX Number of call center calls; length of calls; queue wait times; dropped calls
Operational and performance management
Customer Care Feedback Data Number of calls; call type statistics; issue resolution statistics
Identify: technical performance and product design issues; training and communications needs; third party (e.g., agent, biller) issues
Agent and Merchant Feedback Data
Number of agent or merchant calls; call type statistics; issue resolution statistics
Identify: technical performance and product design issues; agent training and communications needs; client issues
Communication Channel Interactions
Volume of website hits; call center volumes; social media inquiries; live chat requests
Customer insights; operational and performance management; system improvements
Qualitative Communication Data
Type of inquiries; customer satisfaction; social media reviews
Customer insights
Source: Customer Records
Structure: Often incorporating both structured, semi-structured and unstructured data, ranging from: KYC documents that may include variety of personal information depending on document type; to market or customer surveys; to focus group notes.
Format: A wide variety of formats may be used to store customer record data, including relational databases, file storage systems or scanned or paper documents.
Name Data Examples
KYC Documents ID; proof of salary; proof of address Regulatory compliance; demographic and geographic segmentation
Registration and Application Forms
Open DFS account; loan application Regulatory compliance; demographic and geographic segmentation
Qualitative Research Client interviews; focus groups Marketing and product insights
Quantitative Research Awareness and usage studies; pricing sensitivity studies; pilot tests
Marketing and product insights

140 DATA ANALYTICS AND DIGITAL FINANCIAL SERVICES
Source: Agent and Merchant Records
Structure: Often incorporating both structured, semi-structured and unstructured data, ranging from: KYC documents that may include variety of personal information depending on document type; to market or merchant surveys; to focus group notes.
Format: A wide variety of formats may be used to store agent or merchant record data, including relational databases, file storage systems or scanned or paper documents.
KYC Documents Articles of incorporation; tax returns; KYC documents; bank statements
Regulatory compliance; demographic and geographic segmentation
Registration Forms Register as DFS agent or merchant Regulatory compliance; demographic and geographic segmentation
Qualitative Research Agent interviews; focus groups Sales, marketing and product insights
Quantitative Research Mystery shopper research Sales, marketing and product insights
Source: Third Party Partners
Structure: Third party may take any form or structure, depending on the content, source and vendor providing it.
Format: Formats may range from common .CSV formats to proprietary access APIs and delivery methods.
Name Data Examples
Biller Data About Clients (utilities)
Duration of contract; payment history; purchase types Enhanced marketing insights; potential to create credit score using biller data
Payer Client Data About Clients (employer, government)
Payroll history; duration of regular payments Enhanced marketing insights; credit scoring
Client Information Repositories (e.g., credit bureau, watch-lists, police records)
KYC data; credit rating; previous fraudulent activity Credit scoring; fraud investigations; risk management
Geospatial Data (satellite data) Regional demographics; population density; topography; infrastructure such as roads and electricity; financial access points
Market insights; agent management
Social Media and Social Networks
Type and frequency of network activities; personal information; number of connections; type of connections
Market insights; credit scoring
2.2_RESOURCES

DATA ANALYTICS AND DIGITAL FINANCIAL SERVICES 141
2.2.3 Metrics for Assessing Data Models
TOP-10 LIST OF PERFORMANCE METRICS FOR ASSESSING DATA MODELS
Metric Definition
Receiver Operating Characteristic (ROC) Curve
The ROC curve is defined as the plot between the true positive rate and the false positive rate. It illustrates the performance of the model as its discrimination threshold is varied. The greater the area between the ROC curve and the baseline, the better the model.
AUC Area Under the Curve (AUC) measures the area under the ROC curve. It provides an estimate of the probability that the population is correctly ranked. It represents the ability of the model to produce good relative instance ranking. Value equal to one is a perfect model.
KS The Kolmogorov-Smirnov (KS) statistical test measures the maximum vertical separation between the cumulative distribution of ‘goods’ and ‘bads.’ It represents the ability of the model to separate the ‘good’ population of interest from the ‘bad’ population.
Lift Chart It measures the effectiveness of a predictive model calculated as the ratio between the positive predicted values over the number of positives in the sample for each threshold. The greater the area between the lift curve and the baseline, the better the model.
Cumulative Gains It measures the effectiveness of a predictive model calculated as the percentage of positive predicted value for each threshold. The greater the area between the cumulative gain curve and the baseline, the better the model.
Gini coefficient The Gini coefficient is related to the AUC; G (i)=2AUC-1. It also provides an estimate of the probability that the population is correctly ranked. Value equal to one is a perfect model. This is the statistical definition for what drives the economic Gini Index for income distribution.
Accuracy Accuracy is the ability of the model to make a prediction correctly. It is defined as the number of correct predictions over all predictions made. This measure works only when the data are balanced (i.e., same distribution for good and bad).
Precision Precision is the probability that a randomly selected instance is positive, or good. It is defined as the ratio of the total of true predicted positive instances to the total of predicted positive instances.
Recall Recall is the probability that a randomly selected instance is good or positive. It is defined as the ratio of the total of true predicted positive instances to the total of positive instances.
Root-Mean-Square Error (RMSE)
The RMSE is a measure of the difference between values predicted by a model and the values actually observed. The metric is used in numerical predictions. A good model should have a small RMSE.
2.2.4 The Data Ring and the Data Ring Canvas The Data Ring and the Data Ring Canvas tools are also available for download from the website of the Partnership for Financial Inclusion here: www.ifc.org/financialinclusionafrica
The following tear-out page provides a copy of the Data Ring and Data Ring Canvas to use.

142 DATA ANALYTICS AND DIGITAL FINANCIAL SERVICES
2.2_RESOURCES
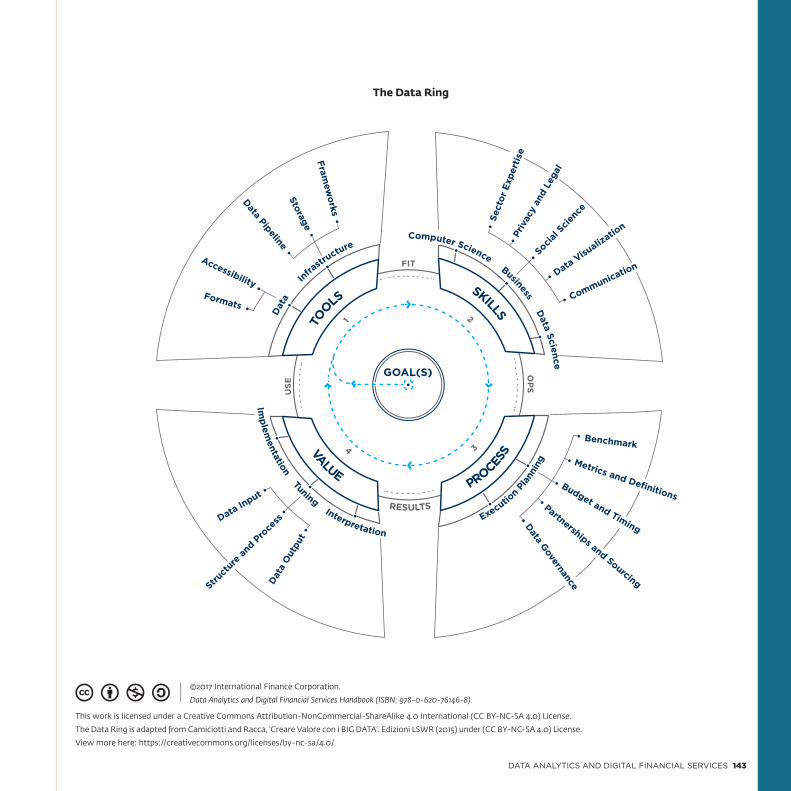
DATA ANALYTICS AND DIGITAL FINANCIAL SERVICES 143
©2017 International Finance Corporation.
Data Analytics and Digital Financial Services Handbook (ISBN: 978-0-620-76146-8).
This work is licensed under a Creative Commons Attribution-NonCommercial-ShareAlike 4.0 International (CC BY-NC-SA 4.0) License.
The Data Ring is adapted from Camiciotti and Racca, ‘Creare Valore con i BIG DATA’. Edizioni LSWR (2015) under (CC BY-NC-SA 4.0) License.
View more here: https://creativecommons.org/licenses/by-nc-sa/4.0/
The Data Ring
Benchmark
Metrics and DefinitionsBudget and Timing
Partnerships and Sourcing
Data Governance
Sect
or E
xper
tise
Priv
acy
and
Lega
l
Socia
l Scie
nce
Data Visualiz
ation
Communication
GOAL(S)
Data
Out
put
Struct
ure a
nd P
roce
ssData Input
Formats
Accessibility
Data PipelineStorage
Framew
orks
TOOLS
SKILLS
PROCESSVALUE
Computer Science Business Data Science
D
ata
Infra
structure
Execution P
lann
ing
Implem
entation Tuning Interpretation
FITO
PS
RESULTS
USE
1 2
34

144 DATA ANALYTICS AND DIGITAL FINANCIAL SERVICES
2.2_RESOURCES
FITO
PSUSE
RESULTS
The Data Ring Canvas
GOAL(S)
©2017 International Finance Corporation.
Data Analytics and Digital Financial Services Handbook (ISBN: 978-0-620-76146-8).
This work is licensed under a Creative Commons Attribution-NonCommercial-ShareAlike 4.0 International (CC BY-NC-SA 4.0) License.
The Data Ring Canvas is a derivative of the Data Ring from this Handbook, adapted by Heitmann, Camiciotti and Racca under (CC BY-NC-SA 4.0) License.
View more here: https://creativecommons.org/licenses/by-nc-sa/4.0/
Project name: Designed by: Date: Version:

DATA ANALYTICS AND DIGITAL FINANCIAL SERVICES 145
Conclusions and Lessons LearnedThe universe of data is expanding on an hourly basis. The analytical capacity of computing is also becoming more and more advanced, and the cost of data storage is falling. The data analytics potential described in this handbook – and in these cases – highlight how DFS providers can leverage data large and small to build new services and achieve greater efficiencies in their current operations by incorporating data-driven approaches. Practitioners should strive to adopt a data-driven approach across their business. This will bring greater precision to their activities and an evidence-based approach to decision-making.
Building a Data-driven Culture
Organizational culture is crucial. Organizations need to foster a data-friendly environment where the power of data is celebrated, and where people are empowered and encouraged to explore in order to find ways to improve outcomes. As a result, there is the need to invest in operational team skills, tools and ideas in order to do data justice. Organizational leadership must clearly articulate the vision and the fundamental standards that will form the foundation of its data management program. Leadership must also form a strong commitment to developing the company’s data capacities, both in terms of vision and budget.
Additionally, it is essential there is a clearly defined department or individual with influence within the organization driving the process. Some organizations that are further along the maturity curve have chosen to create a senior level position called Chief Data Officer (CDO); this person works closely with senior leadership to manage all data related strategy and management.
The organization should look at its current capacities and experience in order to clearly articulate the future. Important considerations include the size of the organization as well as existing IT resources such as skills and experience. Additionally, moving to a data-driven approach will involve big changes for organizational culture, specifically around how data are shared and how decisions are made. The organization will need to be prepared to provide ongoing support during the change and should be prepared to manage expectations from staff and management. Current levels of data management maturity are also important. The DFS provider may wish to look at current data sources, reporting framework and usage of data in decision-making to place themselves on the maturity curve. Understanding where one sits on the data management maturity scale will help the provider develop a roadmap leading toward the desired goal.
Becoming data-driven also includes reviewing the existing staff skillset and assessing team member levels of comfort with technology and computing. Existing staff can be trained to handle new technologies. They are ideally placed to apply new technologies to old problems because they already know the organization, its market and its challenges. Typically, staff will require classroom and ongoing on-the-job training in data management. The DFS provider may wish to identify staff members who have an aptitude and the right attitude for adopting new technology-enabled practices, then prepare a plan for intensive skills development.
No matter where an organization is in its adoption of data-driven analytics, there is scope to systematically incorporate data into its processes and decision-making. Practitioners can take small steps to begin to rigorously test their clients’ needs and preferences, to monitor performance internally and to understand the impact of their business activities. Most crucially, the goals an organization sets for tracking business performance must be quantifiable and measurable.
All Data Are Good Data
Data analytics offers an opportunity for DFS providers to gain a much more granular understanding of their customers.

146 DATA ANALYTICS AND DIGITAL FINANCIAL SERVICES
These insights can be used to design better processes and procedures that align with customer needs and preferences. Data analytics is about understanding customers, with the aim of that customer deriving greater value from the product.
Notably, combining insights from different methodologies and data sources can enrich understanding. As an example, while quantitative data can provide insights into what is happening, qualitative data and research will elucidate why it is happening. Similarly, several DFS providers have used a combination of predictive modeling and geolocation analysis to identify the target areas where they must focus their marketing efforts.
For the vast mass market that DFS providers serve, in many cases there may not be formal financial history or repayment data history to use as a base. In these situations, alternative data can allow DFS providers to verify cash flows through proxy information, such as MNO data. Here, DFS providers have the choice of working directly with an MNO or with a vendor. The decision depends on the respective markets as well as the institution’s preparedness. Many providers may not have the technical know-how to design scoring models based on MNO data – in this case, partnering with a vendor who provides this service is a good option.
Using Data Visualization
A picture is worth a thousand words, or perhaps, a thousand numbers. Using visualizations to graphically illustrate the results from standard data management reports can help decision-making and monitoring. Graphical representations allow the audience to identify trends and outliers quickly. This holds true with respect to internal data science teams who are exploring the data, and also for broader communications, when data trends and results can have more impact than tables by visualizing relationships or data-driven conclusions.
A chart or a plot is a data visualization, in its most basic sense. With that said, ‘visualization’ as a concept and an emerging discipline is much broader, both with respect to the tools available and the results possible. For example, an infographic may be a data visualization in many contexts, but it is not necessarily a plot. In some cases, this breadth may also include mixed media. A pioneer in this area, for example, is Hans Rosling, whose work to combine data visualization with interactive mixed-media story telling earned him a place on Time’s 100 most influential people list.40 These elements of dynamism and interactivity have elevated the field of data visualization far above charts and plots, even though the field also encompasses these more traditional tools.
Data visualization is related to but separate from data dashboards. A dashboard would likely include one or more discrete visualizations. Dashboards are go-to reference points, often serving as entry points to more detailed data or reporting tools. This is where KPIs are visualized to provide at-a-glance information, typically for managers who need a concise snapshot of operational status. Simple dashboards can be implemented in Excel, for example. Usually the dashboard concept refers to more sophisticated data representations, incorporating the ideas of interactivity and dynamism that the broader concept of data visualization encompasses. Additionally, more sophisticated dashboards are likely to include real-time data and responsiveness to user queries. While data visualization and data dashboards are inherently related and often overlapping, it is also important to recognize that they are conceptually different and judged by different criteria. Doing this helps certify the right tools are applied for the right job, and ensures vendors and products are procured for their intended purposes.
Data Science is Data Art
Chapter 1 noted the history of ’data science’ as a term. Interestingly, those who coined it vacillated between calling the discipline’s practitioners ‘data scientists’ and ‘data artists’. While data science won the official title, it is important to
40 Hans Rosling. In Wikipedia, the Free Encyclopedia, accessed April 3, 2017, https://en.wikipedia.org/wiki/Hans_Rosling
2.2_RESOURCES

DATA ANALYTICS AND DIGITAL FINANCIAL SERVICES 147
recognize that creativity, design and even artistic sensibility remain critical to the field. Following the above discussion of data visualization, the process of turning bits of data into informative, interactive, aesthetically pleasing and visually engaging tools require both technical skills and creative insights. In reference to Rosling, the process of making data visualization the leading character in what can most rightly be described as a theatrical performance further underlines the interplay between data science and data art. The role of the data scientists, regardless of functional title, is to draw on technical skill and creative intuition to explore patterns, extract value from those relationships and communicate their importance.
This dualism of structured organization and emergent patterns describes one of the overarching complexities of many data projects. On the one hand, there is the need for clear goals, defined architecture and precise expertise to ensure project delivery is on time and on budget. On the other hand, there is the very important need for open-ended flexibility to enable discovering patterns, exploring new ideas, mining data to uncover possible anomalies, testing hypotheses, and creatively designing visualizations to tell the data’s story.
Global Industry
The field of data science has existed for less than a decade, with the term itself only
coming to prominence in 2008 (see Figure 6 in Part 1). Since then, smartphones have become ubiquitous, computing power has grown substantially and storage costs have plummeted. Technology companies have introduced new products that have been rapidly assimilated into daily life, such as Google Maps, Apple’s FaceTime video chat and Amazon’s at-home AI, Alexa. Data-driven products are rapidly taking hold in all sectors, as large datasets and data science tools deliver innovative value in established markets. The mid-2000s saw the emergence of data analytics grow prominently beyond the tech industry, particularly making early strides in the Fast Moving Consumer Goods sector, such as among grocery and department stores. Global industry has changed in a few short years, summarized by the widely publicized observation by Tom Goodwin: “Uber, the world’s largest taxi company, owns no vehicles. Facebook, the world’s most popular media owner, creates no content. Alibaba, the most valuable retailer, has no inventory. And Airbnb, the world’s largest accommodation provider, owns no real estate. Something interesting is happening.” Data-driven solutions have enabled new entrants to disrupt established sectors, and technology companies continue to push the envelope.
Alternative credit scoring methods are finding new data sources that enable products to reach new customer
segments, often drawing from social media technology. Marketing strategies are tuned by rigorous statistical A|B testing, which was promulgated by companies like Amazon or Yahoo! to refine their website designs. Additionally, geographic customer segmentation analysis, mapping P2P flows, and identifying optimal agent placement, are all aided by geospatial analysis and the tools that deliver Google Maps and OpenStreetMap technology. As technology continues to evolve, DFS providers can anticipate new solutions will emerge to help better understand customers, reach larger markets and deliver products and services tuned to customer needs.
Data for Financial Inclusion
In the financial inclusion sector, data are important because the target customer base often lacks access to banks or other financial services or has limited exposure and is unfamiliar with financial services. Their needs and expenditure patterns are diverse and different. Data allows DFS providers to create products and services that better reflect customer preferences and aspirations. DFS has changed access and affordability of financial services in emerging markets by serving the needs of low-income clients, thereby increasing financial inclusion.
Data brings with it the opportunity to improve financial inclusion. However, this must be done while ensuring consumer

148 DATA ANALYTICS AND DIGITAL FINANCIAL SERVICES
protection and data privacy are not compromised. Data are being produced and collected passively through digital devices such as cell phones and computers, among others. Many stakeholders have expressed concern that low-income households, the primary producers of these data in the financial inclusion context, may not be aware that these data are being collected, analyzed and monetized. In the absence of a uniform policy, there are differing standards applied across provider types and some instances where consumer rights have been violated. With the proliferation of data analytics, it is critical that all stakeholders – DFS providers, regulators, policymakers, development finance institutions, and investors – discuss the issues associated to data privacy and consumer protection in order to find solutions. Some practitioners may feel pressured to adopt new technology or methodologies to keep up with the prevailing trends or because of actions taken by their competitors. Needless to say, such efforts could be nullified if the organization does not have the technical skill to manage the project or does not have the ability to act on the basis of the insights. Thus, practitioners should identify the business problems they are trying to resolve, assess what data and analytical capability they currently possess, and then make decisions about how to implement the data project. The business goal must be at the heart of any data management project.
2.2_RESOURCES

DATA ANALYTICS AND DIGITAL FINANCIAL SERVICES 149
GlossaryTerm Explanation
A|B Testing A|B testing is a method to check two different versions of a product or service to assess how a small change in product attributes can impact customer behavior. This kind of experimentation allows DFS providers to choose multiple variations of a product or service, statistically test the resulting uptake on customers and compare results across target groups.
Active Account An account that is active has been used for at least one transaction in the previous period, usually reported as 30-day active or 90-day active. It does not include non-financial transactions such as changing a PIN code.
Agent A person or business contracted to process transactions for users. The most important of these are cash in and cash out (that is, loading value into the mobile money system, and then converting it back out again). In many instances, agents also register new customers. Agents usually earn commissions for performing these services. They also often provide front-line customer service, such as teaching new users how to complete transactions on their phones. Typically, agents will conduct other kinds of business in addition to mobile money. Agents will sometimes be limited by regulation, but small-scale traders, MFIs, chain stores, and bank branches serve as agents in certain markets. Some industry participants prefer the terms ‘merchant’ or ‘retailer’ to avoid certain legal connotations of the term ‘agent’ as it is used in other industries. (GSMA, 2014).
Alternate Delivery Channel
Channels that expand the reach of financial services beyond the traditional branch. These include ATMs, Internet banking, mobile banking, e-wallets, some cards; POS device services, and extension services.
Anti-Money Launderingand Combating theFinancing of Terrorism(AML/CFT)
AML/CFT are legal controls applied to the financial sector to help prevent, detect and report money-laundering activities. AML/CFT controls include maximum amounts that can be held in an account or transferred between accounts in any one transaction, or in any given day. They also include mandatory financial reporting of KYC for all transactions in excess of $10,000, including declaring the source of funds, as well as the reason for transfer.
Algorithm In mathematics and computer science, an algorithm is a self-contained sequence of actions to be performed. Algorithms perform calculations, data processing or automated reasoning tasks.
Alternative Data Non-financial data from MNOs, social media, and their transactional DBs. Access to other alternative data such as payment history and utility bills can also enable the creation of credit scores for clients who may be otherwise unserviceable.
Application ProgramInterface (API)
A method of specifying a software component in terms of its operations by underlining a set of functionalities that are independent of their respective implementation. APIs are used for real-time integration to the CBS or management information system (MIS), which specify how two different systems can communicate with each other through the exchange of ‘messages’. Several different types of APIs exist, including those based on the web, Transmission Control Protocol (TCP) communication, direct integration to a DB, or proprietary APIs written for specific systems.
Artificial Intelligence (AI) AI is an area of computer science that emphasizes the creation of intelligent machines that work and react like humans.
Average An average is the sum of a list of numbers divided by the number of numbers in the list. In mathematics and statistics, this would be called the arithmetic mean.
Average Revenue Per User (ARPU)
ARPU is a measure used primarily by MNOs, defined as the total revenue divided by the number of subscribers.
Big Data Big data are large datasets, whose size is measured by five distinct characteristics: volume, velocity, variety, veracity, and complexity.

150 DATA ANALYTICS AND DIGITAL FINANCIAL SERVICES
Byte It is a unit of digital information, considered a unit of memory size. It consists of 8 bits, and 1024 bytes equals 1 kilobyte.
Call Center A centralized office used for the purpose of receiving or transmitting a large volume of requests by telephone. As well as handling customer complaints and queries, it can also be used as an alternative delivery channel (ADC) to improve outreach and attract new customers via various promotional campaigns.
Call Detail Records (CDR) This is the MNO record of a voice call or an SMS, with details such as origin, destination, duration, time of day, or amount charged for each call or SMS.
Channel The customer’s access point to a FSP, namely who or what the customer interacts with to access a financial service or product.
Complexity Combining the four big data attributes (volume, velocity, variety, and veracity) requires advanced analytical processes. There are a variety of analytical processes that have emerged to deal with these large datasets. Analytical processes target specific types of data such as text, audio, web, and social media. Another methodology that has received extensive attention is around machine learning, where an algorithm is created and fed to a computer along with historical data. This allows the algorithm to predict relationships between seemingly unconnected variables.
Credit History A credit history is a record of a borrower’s repayment of debts; responsible repayment is interpreted as a favorable credit history, while delinquency or defaults are factors that create a negative credit history. A credit report is a record of the borrower’s credit history from a number of sources, traditionally including banks, credit card companies, collection agencies, and governments.
Credit Scoring A statistical analysis performed by lenders and FIs to access a person’s credit worthiness. Lenders use credit scoring, among other things, to arrive at a decision on whether to extend credit. A person’s credit score is a number between 300 and 850, with 850 being the highest credit rating possible.
Digital Financial Services (DFS)
The use of digital means to offer financial services. DFS encompasses all mobile, card, POS, and e-commerce offerings, including services delivered to customers via agent networks.
Dashboard A BI dashboard is a data visualization tool that displays the current status of metrics and KPIs for an enterprise. Dashboards consolidate and arrange numbers, metrics and sometimes performance scorecards on a single screen.
Data Data is an umbrella term that is used to describe any piece of information, fact or statistic that has been gathered for any kind of analysis or for reference purposes. There are many different kinds of data from a variety of different sources. Data are generally processed, aggregated, manipulated, or consolidated to produce information that provides meaning.
Data Analytics Data analytics refers to qualitative and quantitative techniques and processes used to generate information, enhance productivity and create business gains. Data are extracted and categorized to identify and analyze behavioral data and patterns, and data analytics techniques vary according to organizational requirements.
Data Architecture Data architecture is a set of rules, policies, standards, and models that govern and define the type of data collected and how it is used, stored, managed, and integrated within an organization and its DB systems. It provides a formal approach to creating and managing the flow of data and how it is processed across an organization’s IT systems and applications.
Data Cleansing Data cleansing is the process of altering data in a given storage resource to make sure it is accurate and correct.
Data Cube In computing, multi-dimension data, often with time as a third dimension of columns and rows. In business operations, this is a generic term that refers to corporate systems that enable users to specify and download raw data reports. Many include drag-and-drop fields to design a reporting request or simple data aggregations.

DATA ANALYTICS AND DIGITAL FINANCIAL SERVICES 151
Data Lake A data lake is a massive, easily accessible, centralized repository of large volumes of structured and unstructured data.
Data Management Data management is the development, execution and supervision of plans, policies, programs, and practices that control, protect, deliver, and enhance the value of data and information assets.
Data Mining Data mining is the computational process of discovering patterns in large datasets. It is an interdisciplinary subfield of computer science. The overall goal of the data mining process is to extract information from a dataset and transform it into an understandable structure for further use.
Data Privacy Data privacy, also called information privacy, is the aspect of IT that deals with the ability an organization or individual has to determine what data in a computer system can be shared with third parties.
Data Processing Data processing is, generally, the collection and manipulation of items of data to produce meaningful information. In this sense, it can be considered a subset of information processing, or the change (processing) of information in any manner detectable by an observer.
Data Scraping It is a technique in which a computer program extracts data from human-readable output coming from another digital source such as a website, reports or computer screens.
Data Scientist A data scientist is an individual, organization or team that performs statistical analysis, data mining and retrieval processes on a large amount of data to identify trends, figures and other relevant information.
Data Security Data security refers to protective digital privacy measures that are applied to prevent unauthorized access to computers, DBs, websites, and any other place where data are stored. Data security also protects data from corruption. Data security is an essential aspect of IT for organizations of every size and type.
Data Storage Data storage is a general term for archiving data in electromagnetic or other forms, for use by a computer or device. Different types of data storage play different roles in a computing environment. In addition to forms of hard data storage, there are now new options for remote data storage, such as cloud computing, that can revolutionize the ways users access data.
Data Warehouse A collection of corporate information and data derived from operational systems and external data sources. A data warehouse is designed to support business decisions by allowing data consolidation, analysis and reporting at different aggregate levels.
Descriptive Analytics, Methodologies
The least complex analytical methodologies are descriptive in nature; they provide historical descriptions of the institutional performance, analysis around reasons for this performance and information on the current institutional performance. Techniques include alerts, querying, searches, reporting, visualization, dashboards, tables, charts, narratives, correlations, as well as simple statistical analysis.
Electronic Banking The provision of banking products and services through digital delivery channels.
E-money Short for ‘electronic money,’ it is stored value held on cards or in accounts such as e-wallets. Typically, the total value of e-money issued is matched by funds held in one or more bank accounts. It is usually held in trust, so that even if the provider of the e-wallet service was to fail, users could recover the full value stored in their accounts.
E-wallets An e-money account belonging to a DFS customer and accessed via mobile phone.

152 DATA ANALYTICS AND DIGITAL FINANCIAL SERVICES
Exabyte (EB) The Exabyte (EB) is a multiple of the unit byte for digital information. In the International System of Units, the prefix exam indicates multiplication by the sixth power of 1000 (1018). Therefore, one EB is one quintillion bytes (short scale). The symbol for the Exabyte is EB.
Financial Institution (FI) A provider of financial services including credit unions, banks, non-banking FIs, MFIs, and mobile FSPs.
File Transfer Protocol (FTP)
File Transfer Protocol (FTP) is a client-server protocol used for transferring files to, or exchanging files with a host computer. FTP is the Internet standard for moving or transferring files from one computer to another using TCP or IP networks.
Float (Agent Float) The balance of e-money, or physical cash, or money in a bank account that an agent can immediately access to meet customer demands to purchase (cash in) or sell (cash out) electronic money.
Geospatial Data Information about a physical object that can be represented by numerical values in a geographic coordinate system.
Global System for Mobile Communications Association (GSMA)
The GSM Association (commonly referred to as ‘the GSMA’) is a trade body that represents the interests of mobile operators worldwide. Approximately 800 mobile operators are full GSMA members and a further 300 companies in the broader mobile ecosystem are associate members.
Hypothesis A hypothesis is an educated prediction that can be tested.
Image Processing Image processing is a somewhat broad term that refers to using analytic tools as a means to process or enhance images. Many definitions of this term specify mathematical operations or algorithms as tools for the processing of an image.
Key Performance Indicator (KPI)
A KPI is a measurable value that demonstrates how effectively a company is achieving key business objectives. Organizations use KPIs at multiple levels to evaluate their success at reaching targets. High-level KPIs may focus on the overall performance of the enterprise, while low-level KPIs may focus on processes in departments such as sales, marketing or a call center.
Key Risk Indicator (KRI) A KRI is a measure used to indicate how risky an activity is. It differs from a KPI in that the latter is meant as a measure of how well something is being done, while the former indicates how damaging something may be if it occurs and how likely it is to occur.
Know Your Customer (KYC)
Rules related to AML/CFT that compel providers to carry out procedures to identify a customer and assess the value of the information for detecting, monitoring and reporting suspicious activities.
Linear Regression Mathematical technique for finding the straight line that best fits the values of a linear function, plotted on a scatter graph as data points.
Machine Learning Machine learning is a type of AI that provides computers with the ability to learn without being explicitly programmed. Machine learning focuses on the development of computer programs that can change when exposed to new data.
Market Segmentation The process of defining and subdividing a large homogeneous market into clearly identifiable segments having similar needs, wants or demand characteristics. Its objective is to design a marketing mix that precisely matches the expectations of customers in the targeted segment.
Master Agent A person or business that purchases e-money from a DFS provider wholesale and then resells it to agents, who in turn sell it to users. Unlike a super agent, master agents are responsible for managing the cash and electronic-value liquidity requirements of a particular group of agents.
Merchant A person or business that provides goods or services to a customer in exchange for payment.

DATA ANALYTICS AND DIGITAL FINANCIAL SERVICES 153
Metadata Metadata describes other data. They provide information about a certain item’s content. For example, an image may include metadata that describe how large the picture is, the color depth, the image resolution, when the image was created, and other data.
Microfinance Institution (MFI)
A FI specializing in banking services for low-income groups, small-scale businesses, or people.
Mobile Banking The use of a mobile phone to access conventional banking services. This covers both transactional and non-transactional services, such as viewing financial information and executing financial transactions. Sometimes called ‘m-banking’.
Mobile Money Service,Mobile Financial Service
A DFS that is provided by issuing virtual accounts against a single pooled bank account as e-wallets, that are accessed using a mobile phone. Most mobile money providers are a MNO or a PSP.
Mobile Network Operator (MNO)
A company that has a government-issued license to provide telecommunications services through mobile devices.
Mobile Phone Type - Feature Phone
A feature phone is a type of mobile phone that has more features than a standard mobile phone but is not equivalent to a smartphone. Feature phones can provide some of the advanced features found on a smartphone such as a portable media player, digital camera, personal organizer, and Internet access, but do not usually support add-on applications.
Mobile Phone Type - Smartphone
A mobile phone that has the processing capacity to perform many of the functions of a computer, typically having a relatively large screen and an operating system capable of running a complex set of applications, with internet access. In addition to digital voice service, modern smartphones provide text messaging, e-mail, web browsing, still and video cameras, MP3 players, and video playback with embedded data transfer, GPS capabilities.
Mobile Phone Type - Standard Phone
A basic mobile phone that can make and receive calls, send text messages and access the USSD channel, but has very limited additional functionality.
Monte Carlo Methods Models that use randomized approaches to model complex systems by setting a probabilistic weight to various decision points in the model. The results show a statistical distribution pattern that may be used to predict the likelihood of certain results given the inputs into the system being modeled. These models are typically used for optimization problems or probability analysis.
Natural Language Processing (NLP)
The field of study that focuses on the interactions between human language and computers is called Natural Language Processing, or NLP for short. It sits at the intersection of computer science, AI and computational linguistics. NLP is a field that covers a computer’s understanding and manipulation of human language.
Non-parametric Methodology
A commonly used method in statistics where small sample sizes are used to analyze nominal data. A non-parametric method is used when the researcher does not know anything about the parameters of the sample chosen from the population.
Open Data Open data are data that anyone can access, use or share.
Point of Sale (POS) Electronic device used to process card payments at the point at which a customer makes a payment to the merchant in exchange for goods and services. The POS device is a hardware (fixed or mobile) device that runs software to facilitate the transaction. Originally these were customized devices or personal computers, but increasingly include mobile phones, smartphones and tablets.
Person to Person (P2P) Person-to-person funds transfer.

154 DATA ANALYTICS AND DIGITAL FINANCIAL SERVICES
Parametric Statistics Parametric statistics is a branch of statistics that assumes sample data comes from a population that follows a probability distribution based on a fixed set of parameters. Most well-known elementary statistical methods are parametric.
Pattern Recognition In IT, pattern recognition is a branch of machine learning that emphasizes the recognition of data patterns or data regularities in a given scenario. It is a subdivision of machine learning and it should not be confused with an actual machine learning study. Pattern recognition can be either ‘supervised,’ where previously known patterns can be found in a given data, or ‘unsupervised,’ where entirely new patterns are discovered.
Peripheral Data Typically, the most useful peripheral data sources are call center data, data from CRM (ticketing systems), information from the knowledge base of frequently asked questions, from approval mails, blacklist and whitelist trackers, or shared Excel trackers.
Predictive Analytics, Methodologies
Predictive analytics provide much more complex analysis of existing data to provide a forecast for the future. Techniques include regression analysis, multivariate statistics, pattern matching, data mining, predictive modeling, and forecasting.
Predictive Modeling Predictive modeling is a process that uses data mining and probability to forecast outcomes. Each model is made up of a number of predictors, which are variables that are likely to influence future results. Once data has been collected for relevant predictors, a statistical model is formulated.
Prescriptive Analysis, Methodologies
Prescriptive analysis goes a step further – it provides information to feed into optimal decisions for a set of predicted future outcomes. Techniques include graph analysis, neural networks, machine, and deep learning.
Primary and Secondary Research
Primary research is original data collected through its own approach, often a study or survey. Secondary research uses existing results from previously conducted studies and data collection.
Probability Probability is the measure of the likelihood that an event will occur. Probability is quantified as a number between zero and one (where ‘0’ indicates impossibility and ‘1’ indicates certainty). The higher the probability of an event, the more certain that the event will occur.
Psychographic Segmentation
Psychographic segmentation involves dividing the market into segments based on different personality traits, values, attitudes, interests, and consumer lifestyles.
Psychometric Scoring Model
Psychometrics refers to the measurement of knowledge, abilities, attitudes, and personality traits. In psychometric scoring models, psychometric principles are applied to credit scoring by using advanced statistical techniques to forecast an applicant’s probability of default.
Qualitative Data Data that approximates or characterizes, but does not measure the attributes, characteristics, or properties of a thing or phenomenon. Qualitative data describes, whereas quantitative data defines.
Quantitative Data Data that can be quantified and verified, and is amenable to statistical manipulation. Qualitative data describes, whereas quantitative data defines.
Randomized Controlled Trial (RCT)
A randomized controlled trial is a scientific experiment where the people participating in the trial are randomly allocated to different intervention contexts and then compared to each other. Randomization minimizes selection bias during the design of the scientific experiment. The comparison groups allow the researchers to determine any effects of the intervention when compared with the no intervention (control) group, while other variables are kept constant.

DATA ANALYTICS AND DIGITAL FINANCIAL SERVICES 155
Scientific Method Problem solving using a step-by-step approach consisting of (1) identifying and defining a problem, (2) accumulating relevant data, (3) formulating a hypothesis, (4) conducting experiments to test the hypothesis, (5) interpreting the results objectively, and (6) repeating the steps until an acceptable solution is found.
Semi-structured Data Semi-structured data are a form of structured data that do not conform to the formal structure of data models associated with relational DBs or other forms of data tables. Nonetheless, they contain tags or other markers to separate semantic elements and enforce hierarchies of records and fields within the data.
Service Level Agreements (SLAs)
A SLA is the service contract component between a service provider and customer. SLAs provides specific and measurable aspects related to service offerings. For example, SLAs are often included in signed agreements between internet service providers and customers. SLA is also known as an Operating Level Agreement (OLA) when used in an organization without an established or formal provider-customer relationship.
Short Message Service (SMS)
A ‘store and forward’ communication channel that involves the use of the telecom network and short message peer to peer (SMPP) protocol to send a limited amount of text between phones or between phones and servers.
Small and Medium Enterprises (SMEs)
Small and medium-sized enterprises, or SMEs, are non-subsidiary, independent firms that employ less than a given number of employees. This number varies across countries.
Social Network Analysis (SNA)
Social network analysis, or SNA, is the process of investigating social structures through the use of network and graph theories. It characterizes networked structures in terms of nodes (individual actors, people, or things within the network) and the ties, edges, or links (relationships or interactions) that connect them.
Standard Deviation In statistics, the standard deviation is a measure that is used to quantify the amount of variation or dispersion of a set of data values. A low standard deviation indicates that the data points tend to be close to the mean (or average) of the set, while a high standard deviation indicates that the data points are spread out over a wider range of values.
Statistical Distribution The distribution of a variable is a description of the relative number of times each possible outcome will occur in a number of trials.
Structured Data Structured Data refers to any data that resides in a fixed field within a record or file. This includes data contained in relational DBs.
Super Agent A business, sometimes a bank, which purchases electronic money from a DFS provider wholesale and then resells it to agents, who in turn sell it to users.
Supervised Learning Supervised learning is a method used to enable machines to classify objects, problems or situations based on related data fed into the machines. Machines are fed data such as characteristics, patterns, dimensions, color and height of objects, people, or situations repetitively until the machines are able to perform accurate classifications. Supervised learning is a popular technology or concept that is applied to real-life scenarios. Supervised learning is used to provide product recommendations, segment customers based on customer data, diagnose disease based on previous symptoms, and perform many other tasks.
Support Vector Machines (SVM)
A support vector machine, or SVM, is a machine learning algorithm that analyzes data for classification and regression analysis. SVM is a supervised learning method that looks at data and sorts it into one of two categories. An SVM outputs a map of the sorted data with the margins between the two as far apart as possible. SVMs are used in text categorization, image classification, handwriting recognition, and in the sciences. A support vector machine is also known as a support vector network (SVN).

156 DATA ANALYTICS AND DIGITAL FINANCIAL SERVICES
Text Mining Analytics Text mining, also referred to as text data mining and roughly equivalent to text analytics, is the process of deriving high-quality information from text. High-quality information is typically derived through the devising of patterns and trends through means such as statistical pattern learning. Text mining usually involves: structuring the input text (usually parsing, along with the addition of some derived linguistic features and the removal of others, and subsequent insertion into a DB); deriving patterns within the structured data; and evaluation and interpretation of the output.
Traditional Data Traditional data refers to commonly used structured internal data (such as transactional) and external data (such as information from credit bureaus) that are used in the decision-making process. It may include data that are generated from interaction with clients such as surveys, registration forms, salary, and demographic information.
Unstructured Data Usually refers to information that does not reside in a traditional row-column DB. Unstructured Data files often include text and multimedia content. Examples include: e-mail messages, word processing documents, videos, photos, audio files, presentations, webpages, and many other kinds of business documents.
Unsupervised Learning Unsupervised learning is a method used to enable machines to classify both tangible and intangible objects without providing the machines with any prior information about the objects. The things machines need to classify are varied, such as customer purchasing habits, behavioral patterns of bacteria, or hacker attacks. The main idea behind unsupervised learning is to expose the machines to large volumes of varied data and allow them to learn and infer from the data. However, the machines must first be programmed to learn from data.
UnstructuredSupplementary ServiceData (USSD)
A protocol used by GSM mobile devices to communicate with the service provider’s computers or network. This channel is supported by all GSM handsets, enabling an interactive session consisting of a two-way exchange of messages based on a defined application menu.
Variety The digital age has diversified the kinds of data available. Traditional, structured data fit into existing DBs that are meant for well-defined information that follows a set of rules. For example, a banking transaction has a time stamp, amounts and location. However, today, 90 percent of the data that is being generated is ‘unstructured,’ meaning it comes in the form of tweets, images, documents, audio files, customer purchase histories, and videos.
Velocity A large proportion of data are being produced and made available in real time. By 2018, it is estimated that 50,000 gigabytes of data are going to be uploaded and downloaded on the internet every second. Every 60 seconds, 204 million emails are sent. As a consequence, these data have to be stored, processed, and analyzed at very high speeds, sometimes at the rate of tens of thousands of bytes every second.
Veracity Veracity refers to the trustworthiness of the data. Business managers need to know that the data they use in the decision-making process is representative of their customer segment’s needs and desires. Thus, data management practices in businesses must ensure that the data cleaning process is ongoing and rigorous. This will safeguard against the inclusion of misleading or incorrect data in the analysis.
Volume The sheer quantity of data that are being produced is mind-boggling. It is estimated that approximately 2.5 quintillion bytes of data are produced every day. To get a sense of the quantity, this amount of data would fill approximately 10 million Blu-ray discs. The maturity of these data have gotten increasingly younger, which is to say, that the amount of data that are less than a minute old has been rising consistently. In fact, 90 percent of these data have been produced in the last two years. It is expected that the amount of data in the world will rise by 44 times between 2009 and 2020.

DATA ANALYTICS AND DIGITAL FINANCIAL SERVICES 157
DEAN CAIRECredit Scoring Specialist, IFC
Dean worked for the past 15 years as a credit scoring consultant, 12 with the company DAI Europe and thereafter as an independent consultant. Over this time, he has helped clients from 77 financial institutions in 45 countries develop more than 100 custom credit scoring models for the following segments: consumer loans (including DFS), standard asset leases, micro enterprise loans, small business loans (including digital financial merchant services), agriculture loans and equipment leases (including DFS), microloans to solidarity groups, and large loans to unlisted companies. Dean strives to transfer model development and management skills to FI counterparts so that they can take full ownership of the models and manage them into the future.
LEONARDO CAMICIOTTI Executive Director, TOP-IX Consortium
Reporting to the Board of Directors, Leonardo is responsible for the strategic, administrative and operational activities of the TOP-IX Consortium. He manages the TOP-IX Development Program, which fosters new business creation by providing infrastructural support (i.e. internet bandwidth, cloud computing, and software prototyping) to startups and promotes innovation projects in different sectors, such as big data and high-performance computing, open manufacturing and civic technologies. Previously, he was Research Scientist, Strategy and Business Development Officer and Business Owner at Philips Corporate Research. He graduated in Electronic Engineering from the University of Florence and holds an MBA from the University of Turin.
Author Bios

158 DATA ANALYTICS AND DIGITAL FINANCIAL SERVICES
SOREN HEITMANNOperations Officer, IFC
Soren leads the IFC-MasterCard Foundation partnership applied research and integrated Monitoring, Evaluation and Learning (MEL) program. He works at the nexus of data-driven research and technology to help drive learning and innovation for IFC’s DFS projects in Sub-Saharan Africa. Previously, Soren led results measurement for IFC’s Risk VPU and the Regional Monitoring and Evaluation Portfolio Management team for Europe and Central Asia. He has a background in database management, software engineering and web technology, which he now incorporates into his work providing data operations support to IFC clients. Soren holds a degree in Cultural Anthropology from Boston University and an MA in Development Economics from Johns Hopkins SAIS.
SUSIE LONIE Digital Financial Services Specialist, IFC
Susie spent three years in Kenya creating and operationalizing the M-PESA mobile payments service, after which she facilitated its launch in several other markets including India, South Africa and Tanzania. In 2010, Susie was the co-winner of The Economist Innovation Award for Social and Economic Innovation for her work on M-PESA. She became an independent DFS consultant in 2011 and works with banks, MNOs and other clients on all aspects of providing financial services to people who lack access to banks or other financial services in emerging markets, including mobile money, agent banking, international money transfers, and interoperability. Susie works on DFS strategy, financial evaluation, product design and functional requirements, operations, agent management, risk assessment, research evaluation, and sales and marketing. Her degrees are in Chemical Engineering from Edinburgh and Manchester, United Kingdom.

CHRISTIAN RACCA Design Engineer, TOP-IX Consortium
Christian manages the TOP-IX BIG DIVE program aimed at providing training courses for data scientists, data-driven education initiatives for companies, organizations and consultancy projects in the (big) data-exploitation field. After graduating in telecommunication engineering at Politecnico di Torino, Christian joined TOP-IX Consortium, working on data streaming and cloud computing, and later on web startups. He has mentored several projects on business model, product development and infrastructure architecture and cultivated relationships with investors, incubators, accelerators and the Innovation ecosystem in Italy and Europe.
MINAKSHI RAMJI Associate Operations Officer, IFC
Minakshi leads projects on DFS and financial inclusion within IFC’s Financial Institutions Group in Sub-Saharan Africa. Prior to this, she was a consultant at MicroSave, a financial inclusion consulting firm based in India, where she was a Senior Analyst in their Digital Financial Services practice. She also worked at the Centre for Microfinance at IFMR Trust in India, focused on policy related to access to finance issues in India. She holds a master’s degree in Economic Development from the London School of Economics and a BA in Mathematics from Bryn Mawr College in the United States.
QIUYAN XU Chief Data Scientist, Cignifi
Qiuyan Xu is the Chief Data Scientist at Cignifi Inc., leading the Big Data Analytics team. Cignifi is a fast-growing financial technology start-up company in Boston, United States, that has developed the first proven analytic platform to deliver credit and marketing scores for consumers using mobile phone behavior data. Doctor Xu has expertise in big data analysis, cloud computing, statistical modeling, machine learning, operation optimization and risk management. She served as Director of Advanced Analytics at Liberty Mutual and Manager of Enterprise Risk Management at Travelers Insurance. Doctor Xu holds a PhD in statistics from the University of California, Davis and a Financial Risk Manager certification from The Global Association of Risk Professionals.

www.ifc.org/financialinclusionafrica
CONTACT DETAILS
Anna Koblanck
IFC, Sub-Saharan Africa
2017