Embed Size (px)
Citation preview
A CRITICAL APPRAISAL OF CATCHESAND ECOSYSTEM IMPACTS
EDITED BY
D A N I E L PA U LY A N D D I R K Z E L L E R

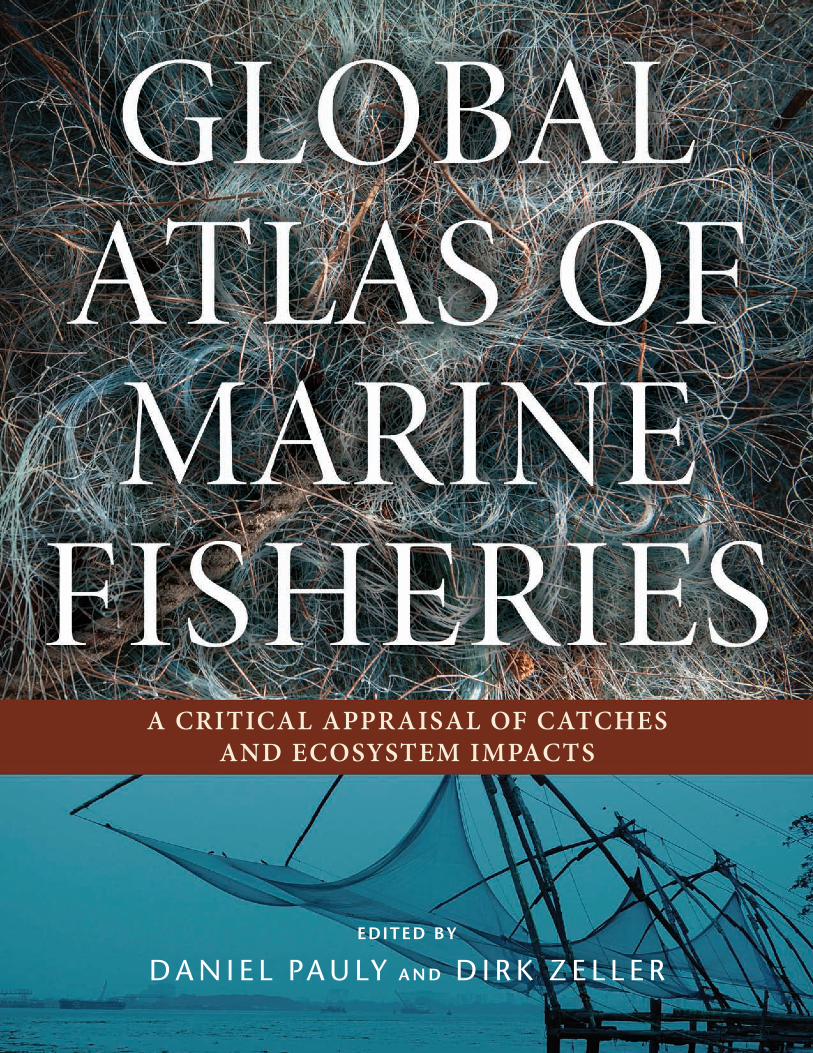
GLOBAL ATLAS OF MARINE FISHERIES

The State of the World’s Oceans Series;
Daniel Pauly, series editor. Also in this series:
Five Easy Pieces: How Fishing Impacts
Marine Ecosystems by Daniel Pauly
In a Perfect Ocean: Fisheries and Ecosystem in the
North Atlantic by Daniel Pauly and Jay Maclean
GLOBAL ATLAS OF MARINE FISHERIES
ECOSYSTEM IMPACTS AND ANALYSIS
EDITED BY DANIEL PAULY AND DIRK ZELLER
Washington | Covelo | London
Copyright © 2016 Daniel Pauly and Dirk Zeller
All rights reserved under International and Pan-American Copyright Conventions. No part of this book may be reproduced in any form or by any means without permission in writing from the publisher: Island Press, 2000 M Street, NW, Suite 650, Washington, DC 20036
ISLAND PRESS is a trademark of the Center for Resource Economics.
Library of Congress Control Number2016941218
Design and typesetting by 2K/DenmarkPrinted on recycled, acid-free paper
Manufactured in the United States of America10 9 8 7 6 5 4 3 2 1
Keywords: catch reconstructions, Food and Agriculture Organization (FAO), high seas fisheries management, mariculture, marine biodiversity, marine reserves
global atlas of marine fisheries · vii
CONTENTS
Foreword . . . . . . . . . . . . . . . . . . . . . . . . . . . . . . . . . . . . . . . . . xi
Preface . . . . . . . . . . . . . . . . . . . . . . . . . . . . . . . . . . . . . . . . . . xiv
Acknowledgments . . . . . . . . . . . . . . . . . . . . . . . . . . . . . . . . xvi
PART I. GLOBAL ACCOUNTS
Chapter 1 . . . . . . . . . . . . . . . . . . . . . . . . . . . . . . . . . . . . . . . . . . 1 On the Importance of Fisheries Catches, with a Rationale for Their Reconstruction D. Pauly
Chapter 2 . . . . . . . . . . . . . . . . . . . . . . . . . . . . . . . . . . . . . . . . . 12 Marine Fisheries Catch Reconstruction: Definitions, Sources, Methods, and Challenges D. Zeller and D. Pauly; with ‘boxes‘ by other Sea Around Us
team members
chapter 3 . . . . . . . . . . . . . . . . . . . . . . . . . . . . . . . . . . . . . . . . . 34 global catches of large pelagic fishes, with emphasis on the high seas F. Le Manach, P. Chavance, A. Cisneros-Montemayor,
A. Lindop, A. Padilla, L. Schiller, D. Zeller, and D. Pauly
Chapter 4 . . . . . . . . . . . . . . . . . . . . . . . . . . . . . . . . . . . . . . . . . 46 The Distribution of Exploited Marine Biodiversity M. L. D. Palomares, W. W. L. Cheung, V. W. Y. Lam,
and D. Pauly
Chapter 5 . . . . . . . . . . . . . . . . . . . . . . . . . . . . . . . . . . . . . . . . . 59 The Sea Around Us Catch Database and Its Spatial Expression V. W. Y. Lam, A. Tavakolie, M. L. D. Palomares, D. Pauly,
and D. Zeller
Chapter 6 . . . . . . . . . . . . . . . . . . . . . . . . . . . . . . . . . . . . . . . . . 68 The Economics of Global Marine Fisheries U. R. Sumaila, A. Cisneros-Montemayor, A. J. Dyck,
A. S. Khan, V. W. Y. Lam, W. Swartz, and L. C. L. Teh
viii · global atlas of marine fisheries
Chapter 7 . . . . . . . . . . . . . . . . . . . . . . . . . . . . . . . . . . . . . . . . . 76 Global Evaluation of High Seas Fishery Management S. Cullis-Suzuki and D. Pauly
Chapter 8 . . . . . . . . . . . . . . . . . . . . . . . . . . . . . . . . . . . . . . . . . 86 Global-Scale Responses and Vulnerability of Marine Species and Fisheries to Climate Change W. W. L. Cheung and D. Pauly
Chapter 9 . . . . . . . . . . . . . . . . . . . . . . . . . . . . . . . . . . . . . . . . . 98 Modeling the Global Oceans with the Ecopath Software Suite: A Brief Review and Application Example M. Colléter, A. Valls, V. Christensen, M. Coll, D. Gascuel,
J. Guitton, C. Piroddi, J. Steenbeek, J. Buszowski, and D. Pauly
Chapter 10 . . . . . . . . . . . . . . . . . . . . . . . . . . . . . . . . . . . . . . . 110 Jellyfish Fisheries: A Global Assessment L. Brotz
Chapter 11 . . . . . . . . . . . . . . . . . . . . . . . . . . . . . . . . . . . . . . . . .125 Global Seabird Population and their Food Consumption M. Paleczny, V. Karpouzi, E. Hammill, and D. Pauly
Chapter 12 . . . . . . . . . . . . . . . . . . . . . . . . . . . . . . . . . . . . . . . . . 137 A Global Analysis of Mariculture Production and Its Sustainability, 1950–2030 B. Campbell, J. Alder, P. Trujillo, and D. Pauly
Chapter 13 . . . . . . . . . . . . . . . . . . . . . . . . . . . . . . . . . . . . . . . . .152 Pollutants in the Seas Around Us S. Booth, W. W. L. Cheung, A. P. Coombs-Wallace,
V. W. Y. Lam, D. Zeller, V. Christensen, and D. Pauly
Chapter 14 . . . . . . . . . . . . . . . . . . . . . . . . . . . . . . . . . . . . . . . . 171 Toward a comprehensive estimate of global marine fisheries catches D. Pauly and D. Zeller
global atlas of marine fisheries · ix
PART II. COUNTRIES & TERRITORIES ACCOUNTS
fisheries by country and territory, 1950–2010 . . . . . 183
Acronyms and Glossary . . . . . . . . . . . . . . . . . . . . . . . . . . . 459
Geographic index . . . . . . . . . . . . . . . . . . . . . . . . . . . . . . . . . 479
subject index . . . . . . . . . . . . . . . . . . . . . . . . . . . . . . . . . . . . . 489

global atlas of marine fisheries · xi
FOREWORD
Josh Reichert, Pew Charitable Trusts
In the autumn of 1997, I convened a small group of some of the world’s most respected marine scientists to answer two questions:• Is it possible to assess changes taking
place in the world’s oceans at regular intervals, looking at a broad number of factors that can provide a portrait of changing ocean health? If so, how would one go about it?
• Is it possible to determine with some degree of accuracy what is driving these changes, and what would be the outcome both for ocean life and human society if these causative factors were left unchecked?With one exception, the members of the
group said it was not doable without very large investments in monitoring technology, for which there was no recognizable donor other than governments, which would be unlikely to provide the funds needed. The one exception was Daniel Pauly, who, in his indomitable fashion, said it was possible to undertake this kind of analysis for ocean fisheries. Even for data-poor fisheries, of which there are many, he indicated that it is possible to reconstruct the past in order to compare it with the present and to infer likely future changes. Though not perfect, this kind of reconstruction and forecasting can provide a reasonable sense of how marine fisheries have changed over time, what the populations of specific species look like today, and where we are headed if our management of these resources does not change.
Late in the afternoon, the meeting came to an end, and the participants all left, with the exception of Daniel, whom I asked to stay for a brief discussion on some of the points he had made earlier in the day. That “brief discussion”
turned into a professional relationship that has endured to this day. Daniel, and the Sea Around Us team, have produced some of the most groundbreaking fisheries science of the past 50 years and in the process have changed the way we think about the management of marine fish and the ocean systems on which they depend.
The goal of the Sea Around Us is to provide a portrait of the major changes that have taken place in populations of fish over time, primarily as a result of fishing, and to better understand the consequences of these changes to the broader ecosystems from which these fish are being taken.
The motivation behind the project was the absence of accurate and comprehensive infor-mation about the status of the world’s ocean fisheries and the need for such information if we are to manage these resources prudently in the years ahead. Daniel and his colleagues at the Fisheries Centre of the University of British Columbia thought that the “official” effort to assess the state of the world’s marine fisheries, which is undertaken by the Food and Agriculture Organization (FAO) of the United Nations, is flawed in very significant ways. First and foremost, the species that are the primary focus of FAO are caught overwhelmingly by large-scale, industrial fishers. However, this is only a fraction of the global marine catch. The FAO data do not include many of the recreational artisanal and subsistence fisheries, despite the fact that these “small-scale” fisheries make up about one quarter of the global marine catch and one third of the part of that catch that is destined for human consumption. Similarly, it does not include estimates of, or even placeholders for, illegally caught fish or fish that are not formally reported (estimated at one out of every five fish caught). Finally, it also fails to

xii · global atlas of marine fisheries
include discards, that is, fish that are thrown back into the sea, dead or dying, because they are not what the fishers are looking for. In short, the landing data sent to the FAO by its member countries, which form the base of its biannual State of the World’s Fisheries and Aquaculture (SOFIA), tend to be strongly un-derreported.
The significance of this is profound for sev-eral reasons. First, these global catch statistics condition the way we look at and manage marine fisheries. For example, if we are not aware of the catches made by small-scale fish-eries, we will underestimate the contribution of artisanal and subsistence fisheries to food security and of recreational fisheries to the tourism industry. This underestimation then justifies the neglect of these fisheries, despite their crucial contribution to local economies. Similarly, measures against illegal fishing are hard to justify—not least because of their cost—if the size of the illegal catches is not estimated.
The goal of the Sea Around Us, when it was initially launched, was to produce a more comprehensive and accurate historical portrait of the world’s marine fisheries than that re-ported by the FAO and to put in place a system that would enable that portrait to be updated regularly. We underestimated the time needed for this project. It has taken longer than an-ticipated to gather the data, but like a jigsaw puzzle whose image gradually reveals itself, the project slowly began to unveil a crisis taking place in the world’s oceans, one that can be met only by profound changes in the way we view and manage fisheries worldwide.
Daniel Pauly and his team of researchers have been able to quantify catches from the key fishing sectors worldwide: artisanal (small-scale fisheries), subsistence (small-scale fish-eries), recreational (small-scale fisheries), and
industrial (large-scale fisheries). The results of this analysis have fundamentally changed the way we define the scope of the fisheries crises and its solution.
What these data reveal is that developed countries underreport what is caught in their waters, often by as much as 50%, and develop-ing countries underreport by 70%–200%. This profound difference is declining, however, as the landing statistics supplied to FAO by its member countries have improved over time. This is fortunate, because such discrepancies cannot be maintained for any length of time without introducing a grave disconnect be-tween what we think we know and what really occurs in the water.
Recognizing these deficiencies enables us to overcome them. This upward reassessment of global catches also provides a sense of just how productive the oceans really are and a measure of optimism that we could enjoy high catches in the future if we rebuild depleted stocks and manage resources more prudently.
Daniel and his colleagues have produced the most comprehensive picture to date of the changing status of global fisheries. It is a sobering picture, but there is a silver lining. If we are less greedy and do not continuously overtax what they are capable of producing, the world’s oceans have the potential to recov-er much of their former bounty.
Whether we take advantage of this oppor-tunity is a political decision, far more than it is a technical one. For many years, we have failed to adequately measure what we are taking out of the world’s oceans. We no longer have an excuse to do so. This global fisheries atlas tells a story of the decline of abundance and provides a series of concepts and tools that will help governments better measure the size of their catches and their impact on marine ecosystems. Thus, this atlas represents good
global atlas of marine fisheries · xiii
science in the service of good conservation. It is a tool that can help us to better understand and document what is happening in the oceans so that we can manage marine fisheries in ways that will restore their productivity as opposed to accentuating their decline.
We would be wise to heed the insights con-tained in this atlas. Failure to do so will lead
us further down a path we are now traveling, at an even faster pace. We know well where that path goes. The other road has a far better destination. It will take patience, discipline, political will, and short-term sacrifice. But it has a future that will provide for both people and nature, as opposed to the other path, which has none.
xiv · global atlas of marine fisheries
PREFACE
The atlas you are holding in your hands presents key results of the Sea Around Us, a research activity initiated at the University of British Columbia by the Pew Charitable Trusts, currently funded mainly by the Paul G. Allen Family Foundation, and devoted to studying and documenting human impacts on marine ecosystems, especially those caused by fisheries, and to propose policies to mitigate those impacts.
In the first 2 years of its existence, from mid-1999 to mid-2001, the Sea Around Us concen-trated on the North Atlantic and attempted to answer the following six questions:1 What are the total fisheries catches from
the ecosystems, including reported land-ings, unreported landings, and discards at sea?
2 What are the biological impacts of these withdrawals of biomass for the remain-ing life in the ecosystems?
3 What would be the likely biological and economic impacts of continuing current fishing trends?
4 What were the former states of these ecosystems before the expansion of large-scale commercial fisheries?
5 How do the present ecosystems rate on a scale from “healthy” to “unhealthy”?
6 What specific policy changes and management measures should be imple-mented to avoid worsening of the present situation and improve ecosystems’ health?
First, answers to these questions were pub-lished, for the North Atlantic, as a book in 2003,1 and having passed this test, we began to apply the methods the Sea Around Us developed to answer these six questions for the global ocean.
In the process, we gradually realized that a key dataset we and most other researchers working on international fisheries were using—the global fisheries catch statistics assembled and disseminated annually since 1950 by the Food and Agriculture Organization of the United Nations (FAO)—was biased in a profound way. We hasten to add that FAO is not at fault: The bias, which works against small-scale fisheries (i.e., artisanal, subsistence, and recreational), is caused largely by most of its member countries not comprehensively including the catch of such fisheries in their annual data submission to FAO.
Thus, answering question 1 for the global ocean involved developing a global dataset that, in addition to including statistics that FAO provides, would also explicitly cover small-scale fisheries. Also, as appropriate for ecosystem-based management, we had to include in our database time series of fisheries discards, which FAO has documented globally in successive reports but kept outside its main database (which thus remains largely a data-base of “landings” rather than catches).
Our approach for answering question 1 was to perform (or encourage our colleagues throughout the world to perform) catch re-constructions whose scientific rationale and technical features are discussed in chapters 1 and 2 of this atlas, respectively. More than two hundred peer-reviewed journal articles, book chapters, reports, and working papers (all available at www.seaaroundus.org) that this work generated are summarized on pp. 185 to 457 of this atlas. These summaries de-scribe, in the form of one-page accounts, the marine fisheries of the Exclusive Economic Zones (EEZs) of 273 countries (or parts thereof) and island territories, covering about 40% of the surface of the ocean, where about 95% (by weight) of the world marine catch is being
global atlas of marine fisheries · xv
taken. Complementing these summaries, chapter 3 describes the assembly of catch data documenting the industrial fisheries for large pelagics (mainly tuna), much of it on the high seas, outside the EEZs.
Jointly, these contributions demonstrate convincingly that the global marine fisheries catches are much higher than reported in official statistics; some of the implications for research and policy are briefly explored in chapter 14, which thus deals with question 6. Chapters 4 and 5 then cover various topics that the Sea Around Us worked on to address ques-tions 2 to 5, some explicitly, others implicitly.
Because of its broad scope, we hope this atlas and its underlying data will be useful to researchers and students interested in comparative analyses of fisheries and marine biodiversity, and to the staff of international
organizations, whether governmental or nongovernmental, with a stake in fisheries governance and marine conservation.
As for the Sea Around Us, our close association with the Pew Charitable Trusts ended in 2014, and we are now funded mainly by the Paul G. Allen Family Foundation. Also, the focus of the Sea Around Us has shifted from documenting fisheries’ impacts on the oceans to mitigating these impacts, in collaboration with various governments and civil society. Information on our progress therein, along with the data underlying the graphs and analyses presented here, can be also found on our website (www .seaaroundus.org). Note, finally, that our home at the University of British Columbia changed from the Fisheries Centre, which regrettably ceased to exist in June 2015, to a new Institute for the Oceans and Fisheries.
Daniel PaulyDirk Zeller
Note
1. Pauly, D., and J. Maclean. 2003. In a Perfect Ocean: Fisheries and Ecosystem in the North Atlantic Ocean. Island Press, Washington, DC.
xvi · global atlas of marine fisheries
ACKNOWLEDGMENTS
We sincerely thank the Pew Charitable Trusts for supporting the Sea Around Us for more than 15 years, from mid-1999 to 2014. The funda-mental trust that this support reflects was extremely valuable to us. It made us feel ap-preciated and resulted in more effective work. It enabled us to be creative and to think big, to tackle the long-term global fisheries issues that none of our colleagues could address, all without being monitored through short-term metrics.
We thank Ms. Rebecca Rimel, president and CEO of the Pew Charitable Trusts for her long-term support; Dr. Joshua Reichert for his inspiration and for formulating the six-point mission statement that has been our guiding star throughout; and Dr. Rebecca Goldburg for skillfully mediating between the different styles of an environmental advocacy organization and a university-based research group. We also thank the many dedicated Pew staffers with whom we established excellent relationships throughout the years and with whom we hope to continue collaborating in the future, if under different circumstances.
From mid-2014 on, the Paul G. Allen Family Foundation has provided the bulk of the support for the Sea Around Us, enabling a smooth transition for which we are extremely thankful. Also, the Paul G. Allen Family Foun-dation funded a complete overhaul of the Sea Around Us website (www.seaaroundus.org), implemented by outstanding staff at Vulcan Inc., enabling the visualization and effective delivery to users of the catch and related data generated by the Sea Around Us and featured in this atlas.
The work on this atlas received additional support from numerous foundations and other organizations, notably the Rockefeller Foundation, the Prince Albert II of Monaco Foundation, the Khaled bin Sultan Living
Oceans Foundation, the MAVA Fondation pour la Nature, the Baltic 2020 Foundation, the National Geographic Society, the World Wild-life Fund for Nature, the Natural Resources Defense Council, Conservation International, the Bay of Bengal Large Marine Ecosystem Project, United Nations Environment Pro-gramme (UNEP), and the Intergovernmental Oceanographic Commission (IOC) of the United Nations Educational, Scientific and Cultural Organization (UNESCO), and several others.
A huge number of people were associated with the creation of this atlas, notably the 325 different authors of the national catch reconstructions on pp. 185 to 457 of this atlas. Unfortunately, we cannot do more here than thank them en bloc. Within the Sea Around Us, the following scientists, former graduate students of Daniel Pauly, research assistants, and volunteers, past and present, contributed extensively to the catch reconstructions: Dalal Al-Abdul-razzak, Melanie Ang, Andrea Au, Houman Azar, Sarah Bale, Milton Barbosa, Sebastian Baust, Dyhia Belhabib, Brajgeet Bhathal, Lea Boistol, Lisa Boonzaier, Shawn Booth, Ciara Brennan, Vania Budimartono, Elise Bultel, Annadel Cabanban, Devraj Chaitanya, Wil-liam Cheung, Andrés Cisneros-Montemayor, Mathieu Colléter, Duncan Copeland, Kendyl Crawford, Ester Dividovich, Beau Doherty, Bridget Doyle, Leonie Färber, Katia Freire, Manuela Funes, Darah Gibson, Rhona Govender, Krista Greer, Andrea Haas, Sara Harper, Claire Hornby, Davis Iritani, Jennifer Jacquet, Boris Jovanović, Myriam Khalfallah, Kristin Kleisner, Danielle Knip, Daniel Kuo, Vicky Lam, Frédéric Le Manach, Alasdair Lindop, Stephanie Lingard, Jessica Mac-Donald, Ashley McCrea-Strub, Dana Miller, Elizabeth Mohammed, George Nguyen,
global atlas of marine fisheries · xvii
Devon O’Meara, Allan Padilla, Maria Lourdes Palomares, Lo Persson, Ciara Piroddi, Robin Ramdeen, Nazanin Roshan Moniri, Peter Rossing, Laurenne Schiller, Soohyun Shon, Patricia Sun, Wilf Swartz, Eric Sy, Louise
Teh, Lydia Teh, Pablo Trujillo, Gordon Tsui, Aylin Ulman, Sadiq Vali, Liesbeth van der Meer, Liane Veitch, Nicolas Winkler, Yunlei Zhai, and Kyrstn Zylich. To them go our heartfelt thanks.


chapter 1 · 1
CHAPTER 1
ON THE IMPORTANCE OF FISHERIES CATCHES, WITH A RATIONALE
FOR THEIR RECONSTRUCTION1
Daniel PaulySea Around Us, Fisheries Centre, University of British Columbia, Vancouver, BC, Canada
Fishing must generate a catch, whether it is done by West African artisanal fishers supplying a teeming rural market, by the huge trawler fleets in Alaska that supply international seafood markets, by women gleaning on a reef flat in the Philippines to feed their families, or by an Australian angler bragging about it in a bar. Indeed, a fishery is defined by the amount and kind of fish caught and by their monetary value. This is how we judge a fishery’s importance, com-pared with other fisheries and other sectors of the economy. It seems clear that the health of a fishery should by measured by changes in the magnitude and species composition of catches, along with other information, such as the growth and mortality of the fish that are exploited. Yet a debate has been recently raging about whether to use catch data to infer the status of fisheries, causing great confusion among fisheries scientists and managers. If the muddle continues, it could undermine the credibility of fisheries science.
The key role of catch data is the reason why the Food and Agriculture Organization (FAO) first began compiling fishery statistics soon after the agency was founded in 1945. A part of the United Nations’ attempt to “quantify the world” (Ward 2004), these compendia
turned, in 1950, into the much-appreciated FAO Yearbook of Fisheries Catch and Landings. The findings are based on annual data submis-sions by FAO member countries, vetted and harmonized by its staff. In contrast with the many international databases used to track major food crops (e.g., rice, wheat, maize), the Yearbook has been, to this day, the only global database of wild-caught fish and other marine species. As such, the Yearbook is widely cited as the major source for inferences on the status of fisheries in the world (Garibaldi 2012).
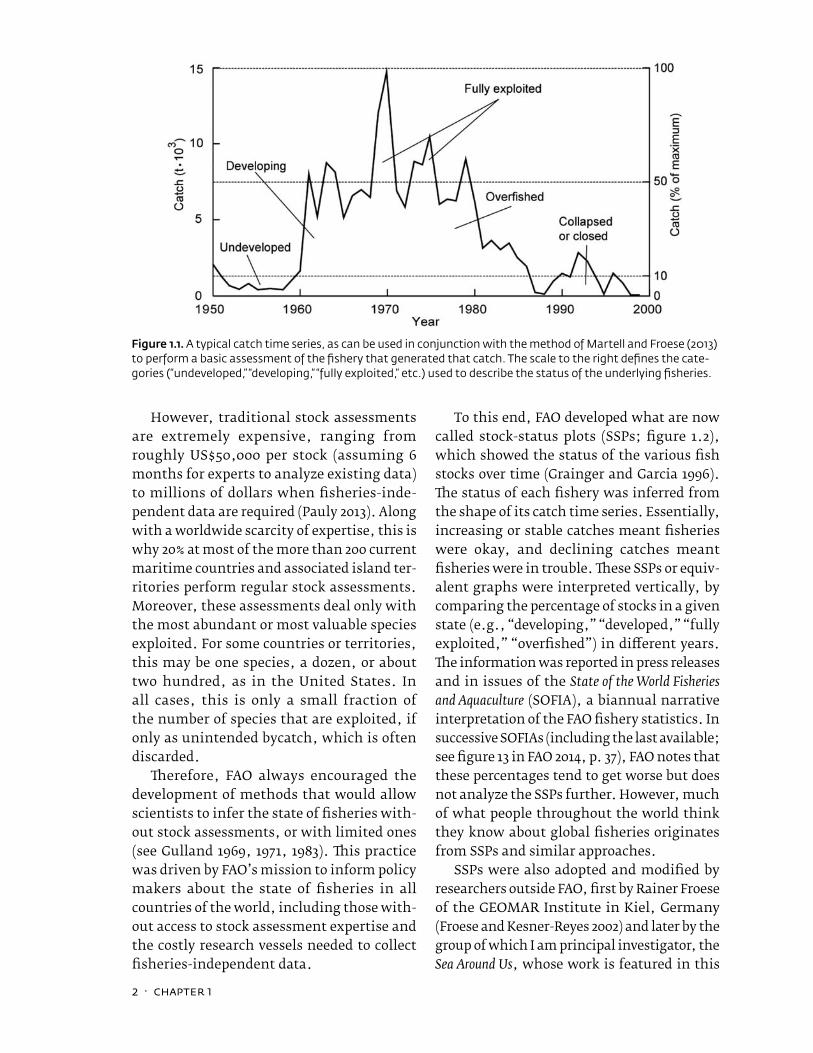
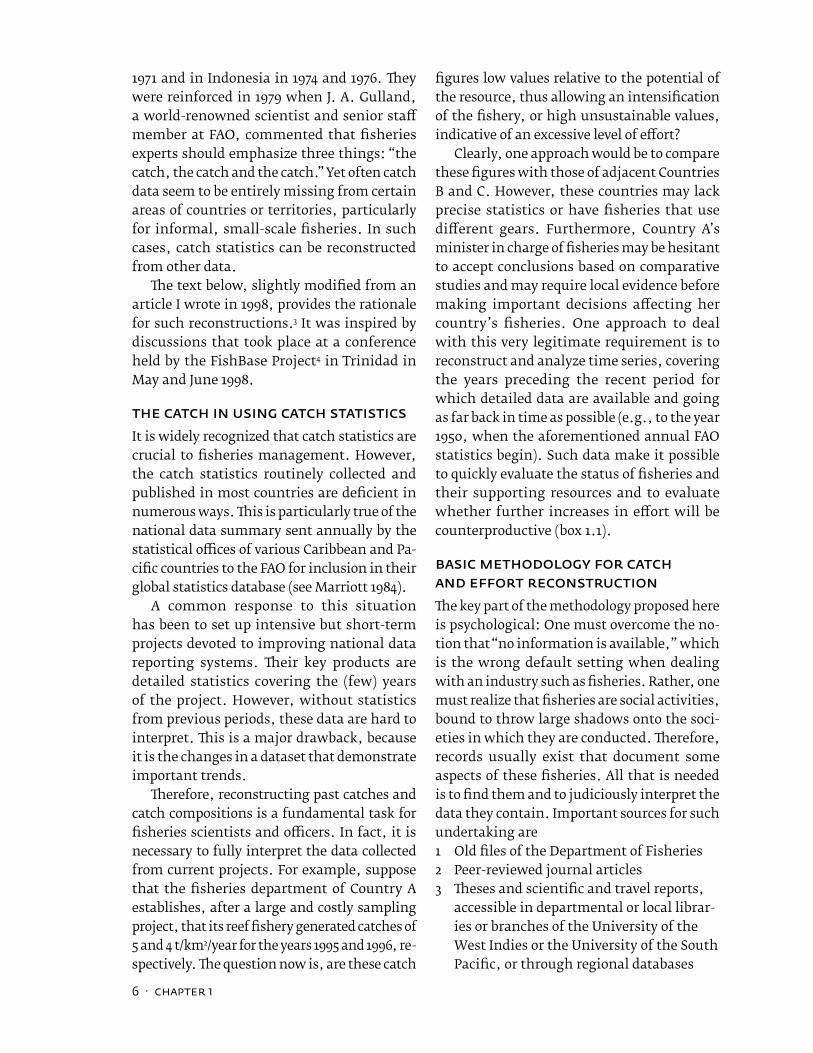
However, in many countries, particularly in the developing world, the government’s role in monitoring their fisheries seems to end with the annual ritual of filling in catch report forms and sending them to FAO, as parodied in Marriott (1984). For others, mainly developed countries, collecting catch data from fishing ports and markets is only a start, and the bulk of their fishery-related research is in the form of “stock assessments.” This term refers to a series of analytic procedures using a variety of data, often time series of commercial catch (figure 1.1), complemented by information on the age, size, or structure of the fish in that catch, tag and recapture data, stock abundances deduced through mathematical models or by fishery research vessels, and so on. The purpose is to infer the biomass of the populations or stocks that are being exploited and to propose levels of total allowable catch (TAC, or quota).
2 · chapter 1
However, traditional stock assessments are extremely expensive, ranging from roughly US$50,000 per stock (assuming 6 months for experts to analyze existing data) to millions of dollars when fisheries-inde-pendent data are required (Pauly 2013). Along with a worldwide scarcity of expertise, this is why 20% at most of the more than 200 current maritime countries and associated island ter-ritories perform regular stock assessments. Moreover, these assessments deal only with the most abundant or most valuable species exploited. For some countries or territories, this may be one species, a dozen, or about two hundred, as in the United States. In all cases, this is only a small fraction of the number of species that are exploited, if only as unintended bycatch, which is often discarded.
Therefore, FAO always encouraged the development of methods that would allow scientists to infer the state of fisheries with-out stock assessments, or with limited ones (see Gulland 1969, 1971, 1983). This practice was driven by FAO’s mission to inform policy makers about the state of fisheries in all countries of the world, including those with-out access to stock assessment expertise and the costly research vessels needed to collect fisheries- independent data.
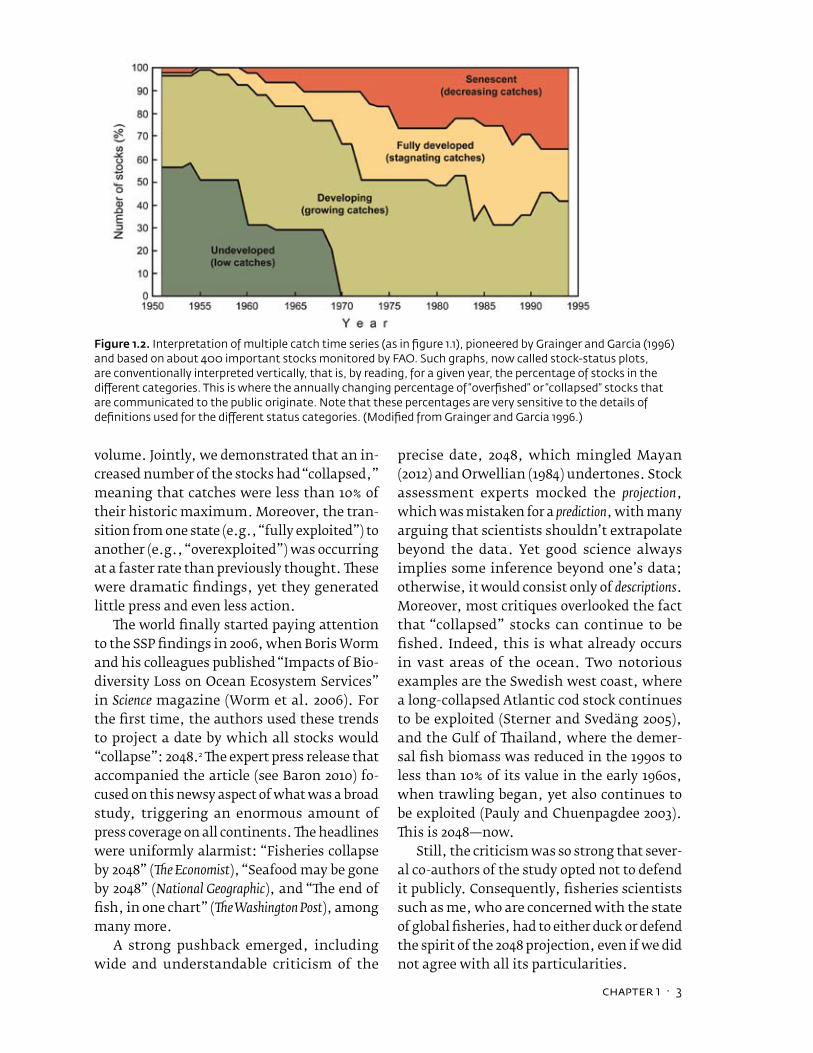
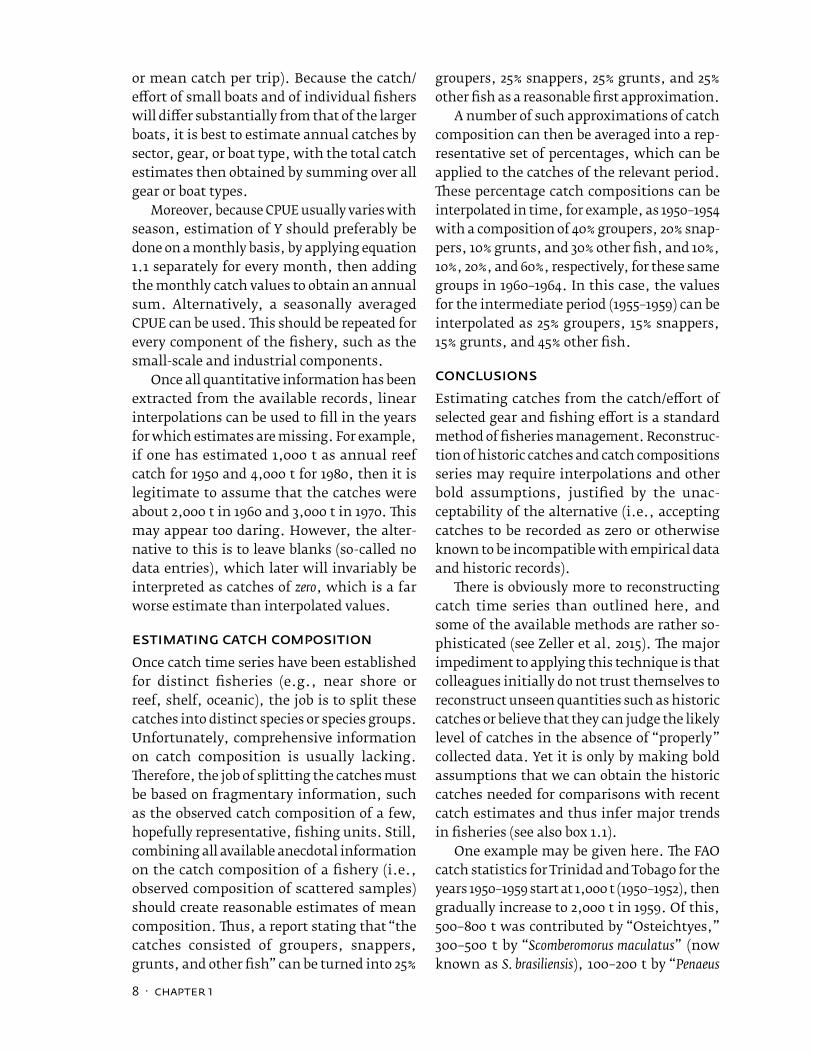
To this end, FAO developed what are now called stock-status plots (SSPs; figure 1.2), which showed the status of the various fish stocks over time (Grainger and Garcia 1996). The status of each fishery was inferred from the shape of its catch time series. Essentially, increasing or stable catches meant fisheries were okay, and declining catches meant fisheries were in trouble. These SSPs or equiv-alent graphs were interpreted vertically, by comparing the percentage of stocks in a given state (e.g., “developing,” “developed,” “fully exploited,” “overfished”) in different years. The information was reported in press releases and in issues of the State of the World Fisheries and Aquaculture (SOFIA), a biannual narrative interpretation of the FAO fishery statistics. In successive SOFIAs (including the last available; see figure 13 in FAO 2014, p. 37), FAO notes that these percentages tend to get worse but does not analyze the SSPs further. However, much of what people throughout the world think they know about global fisheries originates from SSPs and similar approaches.
SSPs were also adopted and modified by researchers outside FAO, first by Rainer Froese of the GEOMAR Institute in Kiel, Germany (Froese and Kesner-Reyes 2002) and later by the group of which I am principal investigator, the Sea Around Us, whose work is featured in this
Figure 1.1. A typical catch time series, as can be used in conjunction with the method of Martell and Froese (2013) to perform a basic assessment of the fishery that generated that catch. The scale to the right defines the cate-gories (“undeveloped,” “developing,” “fully exploited,” etc.) used to describe the status of the underlying fisheries.
chapter 1 · 3
volume. Jointly, we demonstrated that an in-creased number of the stocks had “collapsed,” meaning that catches were less than 10% of their historic maximum. Moreover, the tran-sition from one state (e.g., “fully exploited”) to another (e.g., “overexploited”) was occurring at a faster rate than previously thought. These were dramatic findings, yet they generated little press and even less action.
The world finally started paying attention to the SSP findings in 2006, when Boris Worm and his colleagues published “Impacts of Bio-diversity Loss on Ocean Ecosystem Services” in Science magazine (Worm et al. 2006). For the first time, the authors used these trends to project a date by which all stocks would “collapse”: 2048.2 The expert press release that accompanied the article (see Baron 2010) fo-cused on this newsy aspect of what was a broad study, triggering an enormous amount of press coverage on all continents. The headlines were uniformly alarmist: “Fisheries collapse by 2048” (The Economist), “Seafood may be gone by 2048” (National Geographic), and “The end of fish, in one chart” (The Washington Post), among many more.
A strong pushback emerged, including wide and understandable criticism of the
precise date, 2048, which mingled Mayan (2012) and Orwellian (1984) undertones. Stock assessment experts mocked the projection, which was mistaken for a prediction, with many arguing that scientists shouldn’t extrapolate beyond the data. Yet good science always implies some inference beyond one’s data; otherwise, it would consist only of descriptions. Moreover, most critiques overlooked the fact that “collapsed” stocks can continue to be fished. Indeed, this is what already occurs in vast areas of the ocean. Two notorious examples are the Swedish west coast, where a long-collapsed Atlantic cod stock continues to be exploited (Sterner and Svedäng 2005), and the Gulf of Thailand, where the demer-sal fish biomass was reduced in the 1990s to less than 10% of its value in the early 1960s, when trawling began, yet also continues to be exploited (Pauly and Chuenpagdee 2003). This is 2048—now.
Still, the criticism was so strong that sever-al co-authors of the study opted not to defend it publicly. Consequently, fisheries scientists such as me, who are concerned with the state of global fisheries, had to either duck or defend the spirit of the 2048 projection, even if we did not agree with all its particularities.
Figure 1.2. Interpretation of multiple catch time series (as in figure 1.1), pioneered by Grainger and Garcia (1996) and based on about 400 important stocks monitored by FAO. Such graphs, now called stock-status plots, are conventionally interpreted vertically, that is, by reading, for a given year, the percentage of stocks in the different categories. This is where the annually changing percentage of “overfished” or “collapsed” stocks that are communicated to the public originate. Note that these percentages are very sensitive to the details of definitions used for the different status categories. (Modified from Grainger and Garcia 1996.)
4 · chapter 1
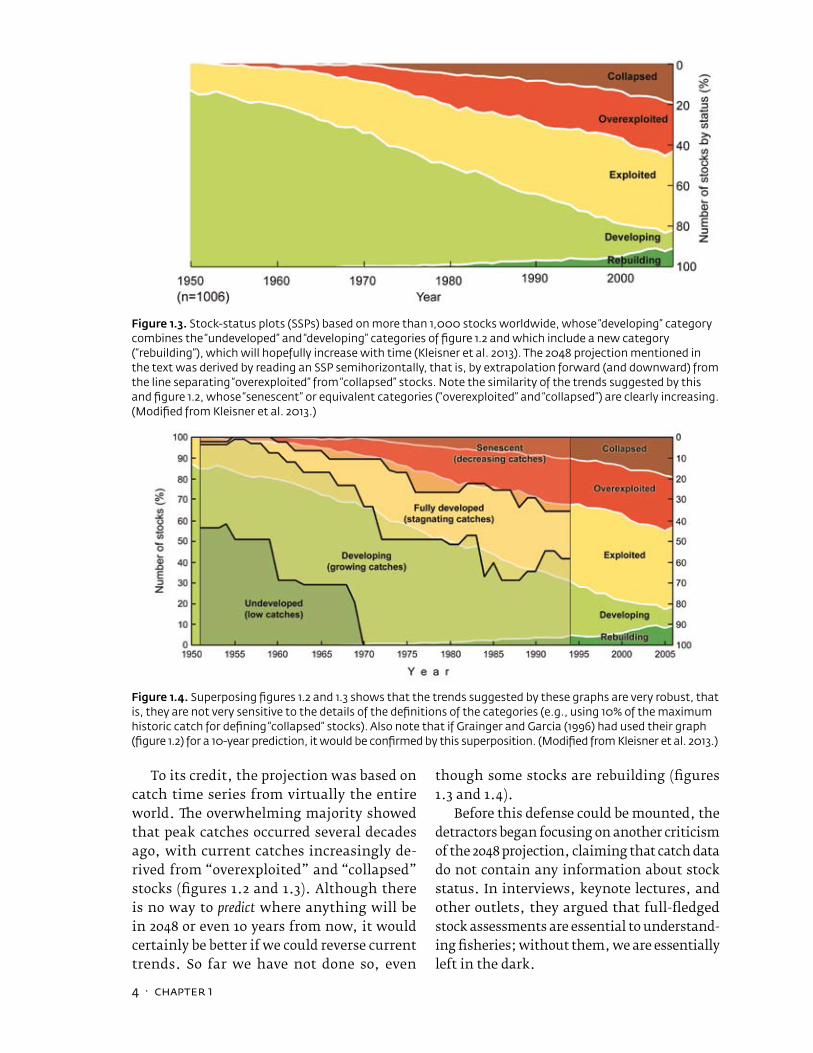
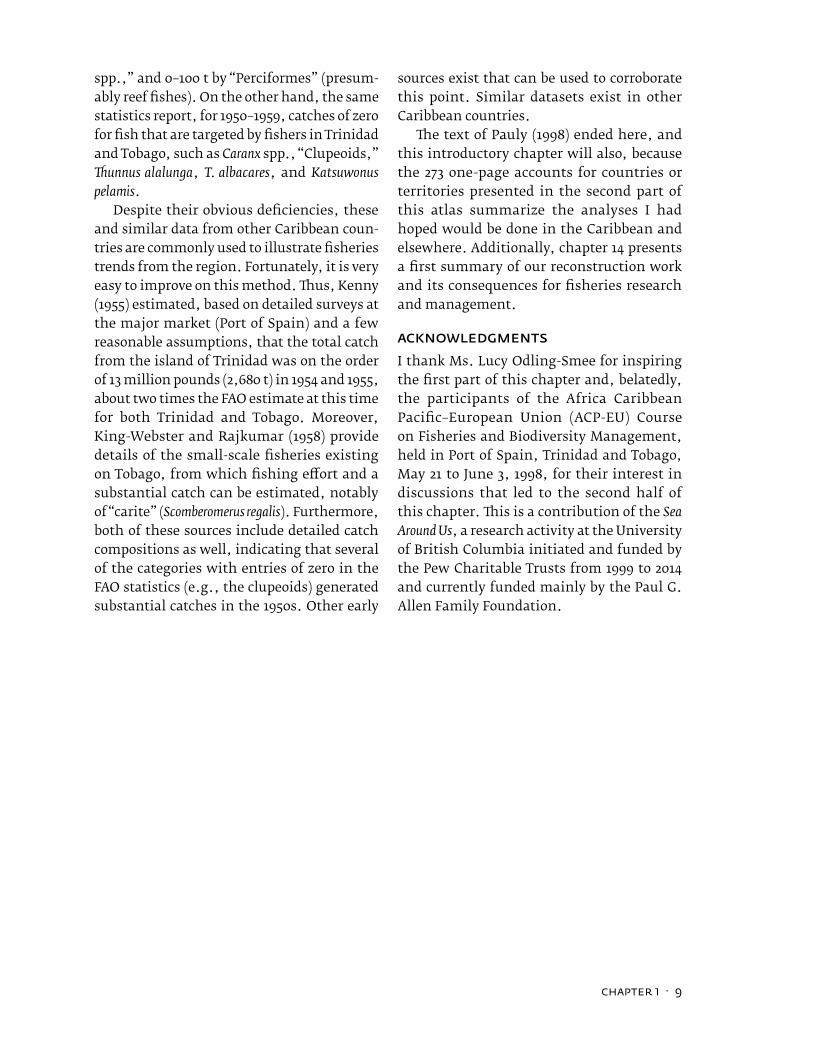
To its credit, the projection was based on catch time series from virtually the entire world. The overwhelming majority showed that peak catches occurred several decades ago, with current catches increasingly de-rived from “overexploited” and “collapsed” stocks (figures 1.2 and 1.3). Although there is no way to predict where anything will be in 2048 or even 10 years from now, it would certainly be better if we could reverse current trends. So far we have not done so, even
though some stocks are rebuilding (figures 1.3 and 1.4).
Before this defense could be mounted, the detractors began focusing on another criticism of the 2048 projection, claiming that catch data do not contain any information about stock status. In interviews, keynote lectures, and other outlets, they argued that full-fledged stock assessments are essential to understand-ing fisheries; without them, we are essentially left in the dark.
Figure 1.3. Stock-status plots (SSPs) based on more than 1,000 stocks worldwide, whose “developing” category combines the “undeveloped” and “developing” categories of figure 1.2 and which include a new category (“rebuilding”), which will hopefully increase with time (Kleisner et al. 2013). The 2048 projection mentioned in the text was derived by reading an SSP semihorizontally, that is, by extrapolation forward (and downward) from the line separating “overexploited” from “collapsed” stocks. Note the similarity of the trends suggested by this and figure 1.2, whose “senescent” or equivalent categories (“overexploited” and “collapsed”) are clearly increasing. (Modified from Kleisner et al. 2013.)
Figure 1.4. Superposing figures 1.2 and 1.3 shows that the trends suggested by these graphs are very robust, that is, they are not very sensitive to the details of the definitions of the categories (e.g., using 10% of the maximum historic catch for defining “collapsed” stocks). Also note that if Grainger and Garcia (1996) had used their graph (figure 1.2) for a 10-year prediction, it would be confirmed by this superposition. (Modified from Kleisner et al. 2013.)
chapter 1 · 5
This is a case of allowing the perfect to become the enemy of the good. Even without perfect data, we can infer when fisheries are in serious trouble and make efforts to conserve them. After all, maintaining catches is the raison d’être of fisheries science. One can and should infer, at least tentatively, the status of fisheries from the catch data—if this is all we have (see figure 1.1; Froese et al. 2012, 2013; Kleisner et al. 2013). It is a mistake to assume that we must remain in Muggle-like ignorance unless we have access to the magic of stock assessments.
Accepting this doctrine would put us at the mercy of stock assessment models that can be fatally flawed. For example, the models used to study the Canadian northern cod fishery in the 1990s (Walters and Maguire 1996) were con-sidered the best in the world. In fact, experts thought the models were so good that it was not necessary to consider the catch data from the coastal trap fisheries, which could not, like the trawlers, follow the cod to where they retreated as their numbers declined. Thus, the stock assessment experts were as surprised as the general public when the fishery had to be closed. The trawlers had decimated the stock under their noses, which they could have seen if they had analyzed the coastal trap data. Note that it is not even faulty stock assessments that are at issue here; it is the notion that one type of approach is so good that it makes all other approaches superfluous.
More importantly, this doctrine would dis-courage efforts to improve the quality of fish-eries statistics worldwide, which is bemoaned by FAO in successive issues of SOFIA. It would also thwart attempts to manage, to the extent possible, the fisheries of developing countries. If leading fisheries scientists claim that catch data are useless, why would resource-starved governments invest in reforming and improv-ing their statistical systems?
This flawed thinking would affect not only developing countries but also the community of stock assessment experts themselves. With-out the collection of catch data, experts could end up either with beautiful stock assessment
models applied to lousy data, as in the north-ern cod example above, or needing more of the costly fishery-independent data that can be used to correct for misreported commercial catch data (Beare et al. 2005).
We gain nothing from the notion that only a select group has the key to understanding fisheries, especially if that key cannot open any doors outside a small number of devel-oped countries. Such claims undermine the credibility of the many fisheries scientists throughout the world who attempt to extract actionable insights from sparse data and to advise their governments on how to manage their fisheries even if they cannot afford for-mal stock assessments.
Fortunately, there is a solution: We all agree that many stocks need to be rebuilt and that doing so would lead to sustainable increases of catches and economic benefits (Sumaila et al. 2012). In fact, the more depleted the stocks currently are, the more is to be gained by rebuilding them.
Moreover, our systematic reevaluation of the FAO statistics suggests that developed countries tend to underreport their catches by about 30%–50% (Zeller et al. 2011), and many de-veloping countries underreport by 100%–500% (Cisneros-Montemayor et al. 2013; Pauly and Zeller 2014; Zeller et al. 2007, 2015). (One nota-ble exception is China, which overreports its catches because officials are rewarded for high yields.) This new perspective suggests that fisheries play a far more important role in the rural economy of developing countries than previously assumed and that rebuilding deplet-ed fish populations on a grand scale would have greater benefits than so far imagined (other implications are presented in chapter 14).
Consequently, more attention should be given to the reliable collection of catch data throughout the world. In particular, we need to devise cost-effective systems to acquire accurate fisheries catch data, along with an-cillary data on fishing effort, and its economic equivalent, catch value and fishing cost.
These ideas have been apparent to me since my first field experience in Ghana in
6 · chapter 1
1971 and in Indonesia in 1974 and 1976. They were reinforced in 1979 when J. A. Gulland, a world-renowned scientist and senior staff member at FAO, commented that fisheries experts should emphasize three things: “the catch, the catch and the catch.” Yet often catch data seem to be entirely missing from certain areas of countries or territories, particularly for informal, small-scale fisheries. In such cases, catch statistics can be reconstructed from other data.
The text below, slightly modified from an article I wrote in 1998, provides the rationale for such reconstructions.3 It was inspired by discussions that took place at a conference held by the FishBase Project4 in Trinidad in May and June 1998.
The Catch in Using Catch StatisticsIt is widely recognized that catch statistics are crucial to fisheries management. However, the catch statistics routinely collected and published in most countries are deficient in numerous ways. This is particularly true of the national data summary sent annually by the statistical offices of various Caribbean and Pa-cific countries to the FAO for inclusion in their global statistics database (see Marriott 1984).
A common response to this situation has been to set up intensive but short-term projects devoted to improving national data reporting systems. Their key products are detailed statistics covering the (few) years of the project. However, without statistics from previous periods, these data are hard to interpret. This is a major drawback, because it is the changes in a dataset that demonstrate important trends.
Therefore, reconstructing past catches and catch compositions is a fundamental task for fisheries scientists and officers. In fact, it is necessary to fully interpret the data collected from current projects. For example, suppose that the fisheries department of Country A establishes, after a large and costly sampling project, that its reef fishery generated catches of 5 and 4 t/km2/year for the years 1995 and 1996, re-spectively. The question now is, are these catch
figures low values relative to the potential of the resource, thus allowing an intensification of the fishery, or high unsustainable values, indicative of an excessive level of effort?
Clearly, one approach would be to compare these figures with those of adjacent Countries B and C. However, these countries may lack precise statistics or have fisheries that use different gears. Furthermore, Country A’s minister in charge of fisheries may be hesitant to accept conclusions based on comparative studies and may require local evidence before making important decisions affecting her country’s fisheries. One approach to deal with this very legitimate requirement is to reconstruct and analyze time series, covering the years preceding the recent period for which detailed data are available and going as far back in time as possible (e.g., to the year 1950, when the aforementioned annual FAO statistics begin). Such data make it possible to quickly evaluate the status of fisheries and their supporting resources and to evaluate whether further increases in effort will be counterproductive (box 1.1).
Basic Methodology for Catch and Effort ReconstructionThe key part of the methodology proposed here is psychological: One must overcome the no-tion that “no information is available,” which is the wrong default setting when dealing with an industry such as fisheries. Rather, one must realize that fisheries are social activities, bound to throw large shadows onto the soci-eties in which they are conducted. Therefore, records usually exist that document some aspects of these fisheries. All that is needed is to find them and to judiciously interpret the data they contain. Important sources for such undertaking are1 Old files of the Department of Fisheries2 Peer-reviewed journal articles3 Theses and scientific and travel reports,
accessible in departmental or local librar-ies or branches of the University of the West Indies or the University of the South Pacific, or through regional databases
chapter 1 · 7
4 Records from harbormasters and other maritime authorities with information on numbers of fishing craft (small boats by type, large boats by length class or engine power)
5 Records from the cooperative or private sectors (e.g., companies exporting fisheries products, processing plants, importers of fishing gear)
6 Old aerial photos from geographic or other surveys (to estimate numbers of boats on beaches and along piers)
7 Interviews with old fishers
Estimating CatchesAnalysis of the scattered data obtained from these sources should be based on the simple notion that catch in weight (Y) is the product of catch/effort (U, also known as CPUE) times effort (f), or
Y = Uf. (1.1)
This implies that one should obtain from sources 1–7 estimates of the effort (how many fishers, boats, or trips) of each gear type and multiply it by the mean catch/effort of that gear type (e.g., mean annual catch per fisher
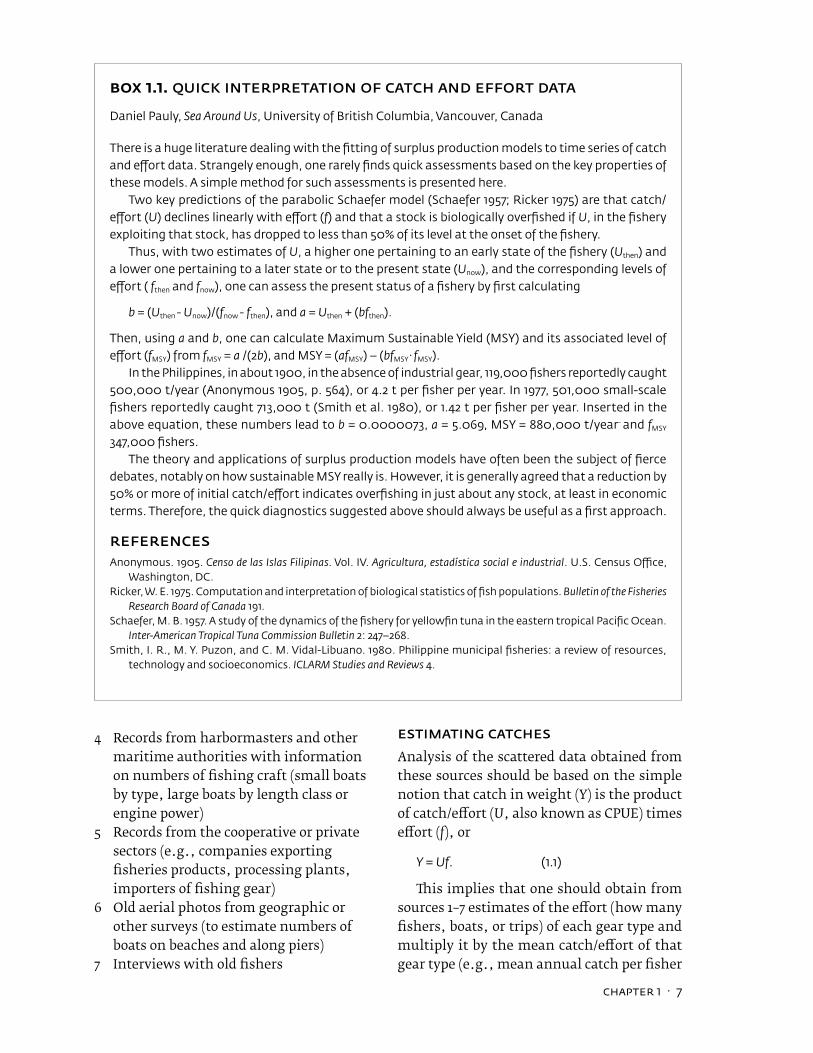
Box 1.1. Quick interpretation of catch and effort data
Daniel Pauly, Sea Around Us, University of British Columbia, Vancouver, Canada
There is a huge literature dealing with the fitting of surplus production models to time series of catch and effort data. Strangely enough, one rarely finds quick assessments based on the key properties of these models. A simple method for such assessments is presented here.
Two key predictions of the parabolic Schaefer model (Schaefer 1957; Ricker 1975) are that catch/effort (U) declines linearly with effort (f) and that a stock is biologically overfished if U, in the fishery exploiting that stock, has dropped to less than 50% of its level at the onset of the fishery.
Thus, with two estimates of U, a higher one pertaining to an early state of the fishery (Uthen) and a lower one pertaining to a later state or to the present state (Unow), and the corresponding levels of effort ( fthen and fnow), one can assess the present status of a fishery by first calculating
b = (Uthen - Unow)/(fnow - fthen), and a = Uthen + (bfthen).
Then, using a and b, one can calculate Maximum Sustainable Yield (MSY) and its associated level of effort (fMSY) from fMSY = a /(2b), and MSY = (afMSY) – (bfMSY ∙ fMSY).
In the Philippines, in about 1900, in the absence of industrial gear, 119,000 fishers reportedly caught 500,000 t/year (Anonymous 1905, p. 564), or 4.2 t per fisher per year. In 1977, 501,000 small-scale fishers reportedly caught 713,000 t (Smith et al. 1980), or 1.42 t per fisher per year. Inserted in the above equation, these numbers lead to b = 0.0000073, a = 5.069, MSY = 880,000 t/year- and fMSY 347,000 fishers.
The theory and applications of surplus production models have often been the subject of fierce debates, notably on how sustainable MSY really is. However, it is generally agreed that a reduction by 50% or more of initial catch/effort indicates overfishing in just about any stock, at least in economic terms. Therefore, the quick diagnostics suggested above should always be useful as a first approach.
ReferencesAnonymous. 1905. Censo de las Islas Filipinas. Vol. IV. Agricultura, estadística social e industrial. U.S. Census Office,
Washington, DC.Ricker, W. E. 1975. Computation and interpretation of biological statistics of fish populations. Bulletin of the Fisheries
Research Board of Canada 191.Schaefer, M. B. 1957. A study of the dynamics of the fishery for yellowfin tuna in the eastern tropical Pacific Ocean.
Inter-American Tropical Tuna Commission Bulletin 2: 247–268.Smith, I. R., M. Y. Puzon, and C. M. Vidal-Libuano. 1980. Philippine municipal fisheries: a review of resources,
technology and socioeconomics. ICLARM Studies and Reviews 4.
8 · chapter 1
or mean catch per trip). Because the catch/effort of small boats and of individual fishers will differ substantially from that of the larger boats, it is best to estimate annual catches by sector, gear, or boat type, with the total catch estimates then obtained by summing over all gear or boat types.
Moreover, because CPUE usually varies with season, estimation of Y should preferably be done on a monthly basis, by applying equation 1.1 separately for every month, then adding the monthly catch values to obtain an annual sum. Alternatively, a seasonally averaged CPUE can be used. This should be repeated for every component of the fishery, such as the small-scale and industrial components.
Once all quantitative information has been extracted from the available records, linear interpolations can be used to fill in the years for which estimates are missing. For example, if one has estimated 1,000 t as annual reef catch for 1950 and 4,000 t for 1980, then it is legitimate to assume that the catches were about 2,000 t in 1960 and 3,000 t in 1970. This may appear too daring. However, the alter-native to this is to leave blanks (so-called no data entries), which later will invariably be interpreted as catches of zero, which is a far worse estimate than interpolated values.
Estimating Catch CompositionOnce catch time series have been established for distinct fisheries (e.g., near shore or reef, shelf, oceanic), the job is to split these catches into distinct species or species groups. Unfortunately, comprehensive information on catch composition is usually lacking. Therefore, the job of splitting the catches must be based on fragmentary information, such as the observed catch composition of a few, hopefully representative, fishing units. Still, combining all available anecdotal information on the catch composition of a fishery (i.e., observed composition of scattered samples) should create reasonable estimates of mean composition. Thus, a report stating that “the catches consisted of groupers, snappers, grunts, and other fish” can be turned into 25%
groupers, 25% snappers, 25% grunts, and 25% other fish as a reasonable first approximation.
A number of such approximations of catch composition can then be averaged into a rep-resentative set of percentages, which can be applied to the catches of the relevant period. These percentage catch compositions can be interpolated in time, for example, as 1950–1954 with a composition of 40% groupers, 20% snap-pers, 10% grunts, and 30% other fish, and 10%, 10%, 20%, and 60%, respectively, for these same groups in 1960–1964. In this case, the values for the intermediate period (1955–1959) can be interpolated as 25% groupers, 15% snappers, 15% grunts, and 45% other fish.
ConclusionsEstimating catches from the catch/effort of selected gear and fishing effort is a standard method of fisheries management. Reconstruc-tion of historic catches and catch compositions series may require interpolations and other bold assumptions, justified by the unac-ceptability of the alternative (i.e., accepting catches to be recorded as zero or otherwise known to be incompatible with empirical data and historic records).
There is obviously more to reconstructing catch time series than outlined here, and some of the available methods are rather so-phisticated (see Zeller et al. 2015). The major impediment to applying this technique is that colleagues initially do not trust themselves to reconstruct unseen quantities such as historic catches or believe that they can judge the likely level of catches in the absence of “properly” collected data. Yet it is only by making bold assumptions that we can obtain the historic catches needed for comparisons with recent catch estimates and thus infer major trends in fisheries (see also box 1.1).
One example may be given here. The FAO catch statistics for Trinidad and Tobago for the years 1950–1959 start at 1,000 t (1950–1952), then gradually increase to 2,000 t in 1959. Of this, 500–800 t was contributed by “Osteichtyes,” 300–500 t by “Scomberomorus maculatus” (now known as S. brasiliensis), 100–200 t by “Penaeus
chapter 1 · 9
spp.,” and 0–100 t by “Perciformes” (presum-ably reef fishes). On the other hand, the same statistics report, for 1950–1959, catches of zero for fish that are targeted by fishers in Trinidad and Tobago, such as Caranx spp., “Clupeoids,” Thunnus alalunga, T. albacares, and Katsuwonus pelamis.
Despite their obvious deficiencies, these and similar data from other Caribbean coun-tries are commonly used to illustrate fisheries trends from the region. Fortunately, it is very easy to improve on this method. Thus, Kenny (1955) estimated, based on detailed surveys at the major market (Port of Spain) and a few reasonable assumptions, that the total catch from the island of Trinidad was on the order of 13 million pounds (2,680 t) in 1954 and 1955, about two times the FAO estimate at this time for both Trinidad and Tobago. Moreover, King-Webster and Rajkumar (1958) provide details of the small-scale fisheries existing on Tobago, from which fishing effort and a substantial catch can be estimated, notably of “carite” (Scomberomerus regalis). Furthermore, both of these sources include detailed catch compositions as well, indicating that several of the categories with entries of zero in the FAO statistics (e.g., the clupeoids) generated substantial catches in the 1950s. Other early
sources exist that can be used to corroborate this point. Similar datasets exist in other Caribbean countries.
The text of Pauly (1998) ended here, and this introductory chapter will also, because the 273 one-page accounts for countries or territories presented in the second part of this atlas summarize the analyses I had hoped would be done in the Caribbean and elsewhere. Additionally, chapter 14 presents a first summary of our reconstruction work and its consequences for fisheries research and management.
AcknowledgmentsI thank Ms. Lucy Odling-Smee for inspiring the first part of this chapter and, belatedly, the participants of the Africa Caribbean Pacific–European Union (ACP-EU) Course on Fisheries and Biodiversity Management, held in Port of Spain, Trinidad and Tobago, May 21 to June 3, 1998, for their interest in discussions that led to the second half of this chapter. This is a contribution of the Sea Around Us, a research activity at the University of British Columbia initiated and funded by the Pew Charitable Trusts from 1999 to 2014 and currently funded mainly by the Paul G. Allen Family Foundation.
10 · chapter 1
REFERENCESBaron, N. 2010. Escape from the Ivory Tower:
A Guide to Making Your Science Matter. Island Press, Washington, DC.
Beare, D. J., C. L. Needle, F. Burns, and D. G. Reid. 2005. Using survey data independently from commercial data in stock assessment: an example using haddock in ICES Division Vi(a). ICES Journal of Marine Science 62(5): 996–1005.
Cisneros-Montemayor, A., M. A. Cisneros-Mata, S. Harper, and D. Pauly. 2013. Extent and implication of IUU catch in Mexico’s marine fisheries. Marine Policy 39: 283–288.
FAO. 2014. The State of World Fisheries and Aqua-culture. Food and Agriculture Organization of the United Nations, Rome.
Fox, A. 1995. Linguistic Reconstruction: An Introduc-tion to Theory and Methods. Oxford University Press, Oxford, England.
Froese, R., and K. Kesner-Reyes. 2002. Impact of Fishing on the Abundance of Marine Species. ICES CM 2002/L:12, Copenhagen, Denmark.
Froese, R., D. Zeller, K. Kleisner, and D. Pauly. 2012. What catch data can tell us about the status of global fisheries. Marine Biology 159(6): 1283–1292.
Froese, R., D. Zeller, K. Kleisner, and D. Pauly. 2013. Worrisome trends in global stock status continue unabated: a response to a com-ment by R. M. Cook on “What catch data can tell us about the status of global fisheries.” Marine Biology 160: 2531–2533.
Garibaldi, L. 2012. The FAO global capture production database: a six-decade effort to catch the trend. Marine Policy 36(3): 760–768.
Grainger, R. J. R., and S. M. Garcia. 1996. Chroni-cles of marine fishery landings (1950–1994): trend analysis and fisheries potential. FAO Fisheries Technical Paper 359.
Gulland, J. A. 1969. Manual of methods for fish stock assessment. Part 1: fish population analysis. FAO Manuals in Fisheries Science 4.
Gulland, J. A. 1971. The Fish Resources of the Oceans. FAO/Fishing New Books, Farnham, Surrey, UK.
Gulland, J. A. 1983. Fish Stock Assessment: A Manual of Basic Methods. John Wiley & Sons, New York.
Kenny, J. S. 1955. Statistics of the Port-of-Spain wholesale fish market. Journal of the Agricul-tural Society (June): 267–272.
King-Webster, W. A., and H. D. Rajkumar. 1958. A preliminary survey of the fisheries of the island of Tobago. Caribbean Commission Central Secretariat, Port of Spain. Unpublished ms.
Kleisner, D. Zeller, K., R. Froese, and D. Pauly. 2013. Using global catch data for inferences on the world’s marine fisheries. Fish and Fisheries 14(3): 293–345.
Marriott, S. P. 1984. Notes on the completion of FAO Form Fishstat NS1 (national summary). Fishbyte, Newsletter of the Network of Tropical Fisheries Scientists 2(2): 7–8. Reprinted in Zylich, K., D. Zeller, M. Ang, and D. Pauly (eds.). 2014. Fisheries catch reconstructions: islands, part IV. Fisheries Centre Research Reports 22(2): 157, University of British Columbia, Vancouver.
Martell, S., and R. Froese. 2013. A simple method for estimating MSY from catch and resilience. Fish and Fisheries 14(4): 504–514.
Palomares, M. L. D., W. W. L. Cheung, V. W. Y. Lam, and D. Pauly. 2015. The distribution of exploited marine biodiversity. Pp. 46–58 in D. Pauly and D. Zeller (eds.), Global Atlas of Marine Fisheries: Ecosystem Impacts and Analysis. Island Press, Washington, DC.
Pauly, D. 1998. Rationale for reconstructing catch time series. EC Fisheries Cooperation Bulletin 11(2): 4–7. [Available in French as “Approche raisonné de la reconstruction des séries temporelles de prises,” pp. 8–10.]
Pauly, D. 2013. Does catch reflect abundance? Yes, it is a crucial signal. Nature 494: 303–306.
Pauly, D., and R. Chuenpagdee. 2003. Development of fisheries in the Gulf of Thailand Large Marine Ecosystem: analysis of an unplanned experiment. Pp. 337–354 in G. Hempel and K. Sherman (eds.), Large
chapter 1 · 11
Marine Ecosystems of the World 12: Change and Sustainability. Elsevier Science, Amsterdam.
Pauly, D., and D. Zeller. 2014. Accurate catches and the sustainability of coral reef fisheries. Current Opinion in Environmental Sustainability 7: 44–51.
Sterner, T., and H. Svedäng. 2005. A net loss: policy instruments for commercial cod fishing in Sweden. AMBIO: A Journal of the Human Environment 34(2): 84–90.
Sumaila, U. R., W. W. L. Cheung, A. Dyck, K. M. Gueye, L. Huang, V. Lam, D. Pauly, U. T. Srinivasan, W. Swartz, R. Watson, and D. Zeller. 2012. Benefits of rebuilding global marine fisheries outweigh costs. PLoS ONE 7(7): e40542.
Walters, C. J., and J.-J. Maguire. 1996. Lessons for stock assessments from the northern cod collapse. Review in Fish Biology and Fisheries 6: 125–137.
Ward, M. 2004. Quantifying the World: UN Ideas and Statistics. United Nations Intellectual History Project Series. Indiana University Press, Bloomington.
Watkins, C. 2000. The American Heritage Dictionary of Indo-European Roots, 2nd ed. Houghton Mifflin, Boston.
Worm, B., E. B. Barbier, N. Beaumont, J. E. Duffy, C. Folke, B. S. Halpern, J. B. C. Jackson, H. K. Lotze, F. Micheli, S. R. Palumbi, E. Sala, K. A. Selkoe, J. J. Stachowicz, and R. Watson. 2006. Impacts of biodiversity loss on ocean ecosystem services. Science 314: 787–790.
Zeller, D., S. Booth, and D. Pauly. 2007. Fisheries contribution to GDP: underestimating small-scale fisheries in the Pacific. Marine Resources Economics 21: 355–374.
Zeller, D., S. Harper, K. Zylich, and D. Pauly. 2015. Synthesis of under-reported small-scale fisheries catch in Pacific-island waters. Coral Reefs 34(1): 25–39.
Zeller, D., P. Rossing, S. Harper, L. Persson, S. Booth, and D. Pauly. 2011. The Baltic Sea: esti-mates of total fisheries removals 1950–2007. Fisheries Research 108: 356–363.
Notes1. Cite as Pauly, D. 2015. On the importance of fisheries catches, with a rationale for their reconstruction. Pp. 1–11 in D. Pauly and D. Zeller (eds.), Global Atlas of Marine Fish-eries: A Critical Appraisal of Catches and Ecosystem Impacts. Island Press, Washington, DC.2. This analysis, by Large Marine Ecosystem (LME) using FAO catch data spatialized by the Sea Around Us, was performed by Dr. Reg Watson, then a member of the Sea Around Us, who thus became a co-author of Worm et al. (2006).3. The word reconstruction is here taken over from his-toric linguistics (a field that I have an amateur’s interest in), wherein extinct languages (Proto-Austronesian, Proto-Bantu, or Proto-Indo-European) are “reconstruct-ed” from words in the daughter languages and rules about phonetic shifts (see Fox 1995; Watkins 2000). One is never sure about the final product but can still offer it to one’s colleagues for further scrutiny. It is the same for reconstructed catches.4. See Palomares et al. (2015).

fisheries by country and territory, 1950–2010 · 183
FISHERIES BY COUNTRY AND TERRITORY, 1950–2010
The following 273 pages present single-page summaries of the fisheries in the Exclusive Economic Zones (EEZs) of maritime countries, or parts thereof, including the overseas territories of metropolitan countries. These summaries are arranged alphabetically, from Albania to Yemen (Red Sea), and the geographic index on pages 478–487 allows the reader to find a place whose summary may not be where it was expected, or which is mentioned in the summaries. The groups of EEZs presented in these summaries include a (coastal) ecosystem each, characterized by its geomorphological and oceanographic features, populated by a characteristic flora and fauna, and subjected to specific stresses from 1950 to 2010. Although the most significant impact is often fishing, hurricanes, tsunamis, and other major natural events are noted, along with wars, civil or not. Most of these summaries have the same authors as the reconstruction publications from which they are taken. All of the summaries have in common that they name and define the geographic entity in question (including its relationship to a larger entity, if appropriate), then present a small map (“figure 1”) to define its EEZ or EEZ-equivalent marine area, as well as the continental shelf areas (to 200 m depth).
The catches in each country’s or territory’s EEZ are then described in the text and in “figure 2A” in terms of their magnitude in the 1950s and 2000s (taken to include the year 2010), with intermediate extremes (peaks or troughs) explicitly mentioned; the sectoral composition of this catch, that is, industrial and small-scale (artisanal, subsistence, and recreational); the disposition of the catch (landed or discarded); and the ratio of the reconstructed catch to the official landings reported by the FAO or other agencies on behalf of that country or territory. In each figure 2 caption, the uncertainty scores (as defined in table 2.1) associated with the (do-mestic) catch estimates are given by sector and disposition (Ind. = industrial; Art. = artisanal;
Sub. = subsistence; Rec. = recreational, and Dis. = discards), for three periods (1950–1969, 1970–1989, 1990–2010). Figure 2B presents the catches by fishing country (domestic and foreign fleets) exploiting the EEZ in question. Note, however, that the estimates of foreign catches will be indicative only. Foreign catches, especially when they are made illegally (as is often the case), tend to be far more uncertain than domestic catches, with regard to the years such catches are taken, the quantities taken, and even the nationalities of the fleets that do the taking (or the nationality of the beneficial ownership of these fleets). The website of the Sea Around Us (www.seaaroundus .org) will present updated versions of these foreign catches, which may differ from those presented here. The website also includes an option for providing feedback, which can also be used by readers of this atlas.
Finally, figure 2C presents the taxonomic com-position of the catch taken in these EEZ “chunks,” that is, species or groups caught. Note that the catches refer to marine and brackish waters (estu-aries and coastal lagoons) but not freshwater, that plants and vertebrates other than fishes (e.g., marine mammals, sea turtles) are not included, and that the products of sea farming or ranching, that is, mariculture, are not included either (but see chapter 12). The taxonomic resolution of figure 2C is limited, and readers wanting more details will find them at www.seaaroundus.org. Also note that, in a few cases, figure 2 may consist of only one or two panels.
For legibility’s sake, and to save space, the scale label of the ordinate (y-scale) of figure 2 does not include trailing zeroes. Rather, the legend’s scale is of the form t∙10n, where n indicates the number of trailing zeroes. Thus, n corresponds to the factor by which the tonnage along the y-scale should be multiplied: 1 = 10, 2 = 100, 3 = 1,000, etc.
We generally do not discuss the status of the fisheries, except in cases that are obvious and have been widely commented upon. After
the description of the catches, the text often alludes to a major issue specific to the fisheries of the country or territory in question, or an interesting fact about it or the resources it exploits; the glossary on pp. 459 to 477 should be consulted for unfamiliar terms or acronyms. The references always include a citation to the articles or reports from which the summary was extracted (available from www.seaaroundus .org), to which references were added from the same or other sources, usually to reinforce a point unique to that summary.
Many of these reconstruction reports were made available, pending formal publication, via the Fisheries Centre Research Reports or the Fisheries Centre Working Papers series of the University of British Columbia (UBC), in Vancouver, Canada. To save space, these two series will be cited without reference to UBC; they can all be obtained from our website. The editors thank Mr. Chris Hoornaert for creating the maps cited as figure 1 in the 273 summaries that follow and Evelyn Liu for the time series graphs cited as figure 2.
184 · fisheries by country and territory, 1950–2010
albania · 185
ALBANIA1
Dimitrios K. Moutopoulos,a Brady Bradshaw,b and Daniel Paulyc
aTechnological Educational Institute of Western Greece, Department of Aquaculture and Fisheries, Messolonghi, Greece bInvestigative Team, The Black Fish, Amsterdam, The Netherlands & Center for Marine Science, University
of North Carolina, Wilmington cSea Around Us, University of British Columbia, Vancouver, Canada
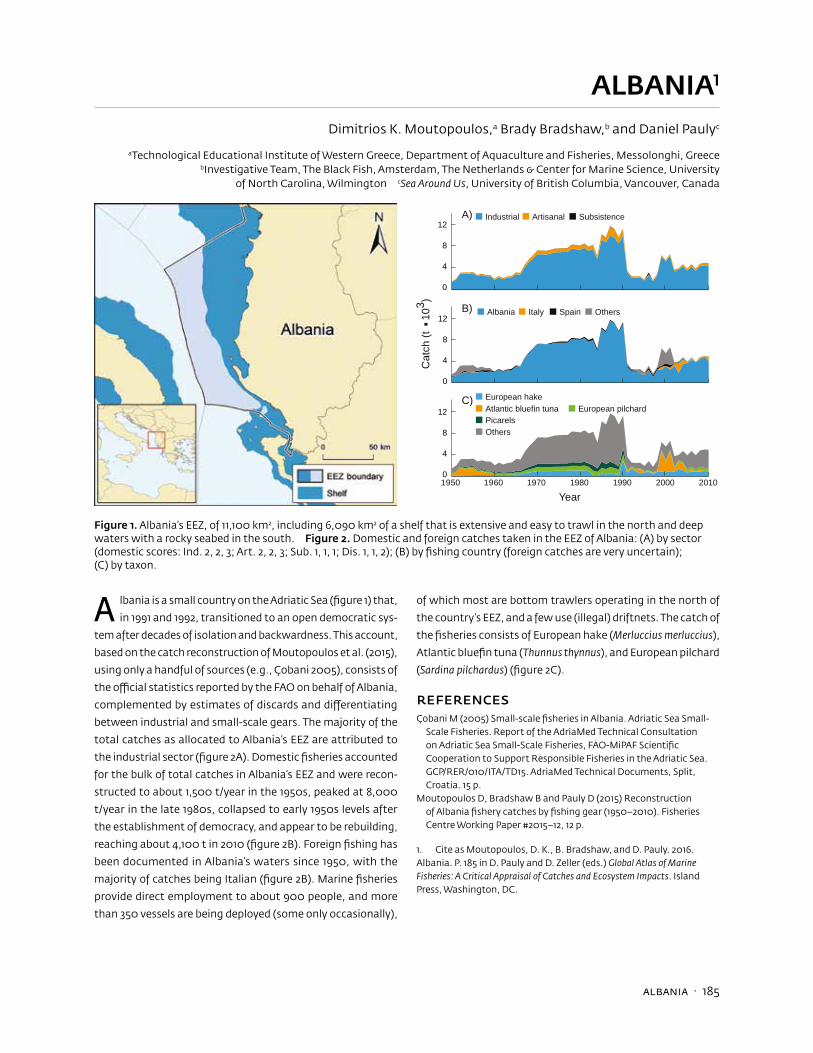
A lbania is a small country on the Adriatic Sea (figure 1) that,
in 1991 and 1992, transitioned to an open democratic sys-
tem after decades of isolation and backwardness. This account,
based on the catch reconstruction of Moutopoulos et al. (2015),
using only a handful of sources (e.g., Çobani 2005), consists of
the official statistics reported by the FAO on behalf of Albania,
complemented by estimates of discards and differentiating
between industrial and small-scale gears. The majority of the
total catches as allocated to Albania’s EEZ are attributed to
the industrial sector (figure 2A). Domestic fisheries accounted
for the bulk of total catches in Albania’s EEZ and were recon-
structed to about 1,500 t/year in the 1950s, peaked at 8,000
t/year in the late 1980s, collapsed to early 1950s levels after
the establishment of democracy, and appear to be rebuilding,
reaching about 4,100 t in 2010 (figure 2B). Foreign fishing has
been documented in Albania’s waters since 1950, with the
majority of catches being Italian (figure 2B). Marine fisheries
provide direct employment to about 900 people, and more
than 350 vessels are being deployed (some only occasionally),
of which most are bottom trawlers operating in the north of
the country’s EEZ, and a few use (illegal) driftnets. The catch of
the fisheries consists of European hake (Merluccius merluccius),
Atlantic bluefin tuna (Thunnus thynnus), and European pilchard
(Sardina pilchardus) (figure 2C).
ReferencesÇobani M (2005) Small-scale fisheries in Albania. Adriatic Sea Small-
Scale Fisheries. Report of the AdriaMed Technical Consultation on Adriatic Sea Small-Scale Fisheries, FAO-MiPAF Scientific Cooperation to Support Responsible Fisheries in the Adriatic Sea. GCP/RER/010/ITA/TD15. AdriaMed Technical Documents, Split, Croatia. 15 p.
Moutopoulos D, Bradshaw B and Pauly D (2015) Reconstruction of Albania fishery catches by fishing gear (1950–2010). Fisheries Centre Working Paper #2015–12, 12 p.
1. Cite as Moutopoulos, D. K., B. Bradshaw, and D. Pauly. 2016. Albania. P. 185 in D. Pauly and D. Zeller (eds.) Global Atlas of Marine Fisheries: A Critical Appraisal of Catches and Ecosystem Impacts. Island Press, Washington, DC.
1950 1960 1970 1980 1990 2000 2010
0
4
8
12
0
4
8
12
0
4
8
12
Year
Cat
ch (t
. 103 )
A)
B)
C) European hakeEuropean pilchard
PicarelsAtlantic bluefin tuna
Others
ItalyAlbania Spain
ArtisanalIndustrial Subsistence
Others
Figure 1. Albania’s EEZ, of 11,100 km2, including 6,090 km2 of a shelf that is extensive and easy to trawl in the north and deep waters with a rocky seabed in the south. Figure 2. Domestic and foreign catches taken in the EEZ of Albania: (A) by sector (domestic scores: Ind. 2, 2, 3; Art. 2, 2, 3; Sub. 1, 1, 1; Dis. 1, 1, 2); (B) by fishing country (foreign catches are very uncertain); (C) by taxon.
212 · Cambodia
CAMBODIA1
Lydia C. L. Teh, Soohyun Shon, Kyrstn Zylich, and Dirk Zeller
Sea Around Us, University of British Columbia, Vancouver, Canada
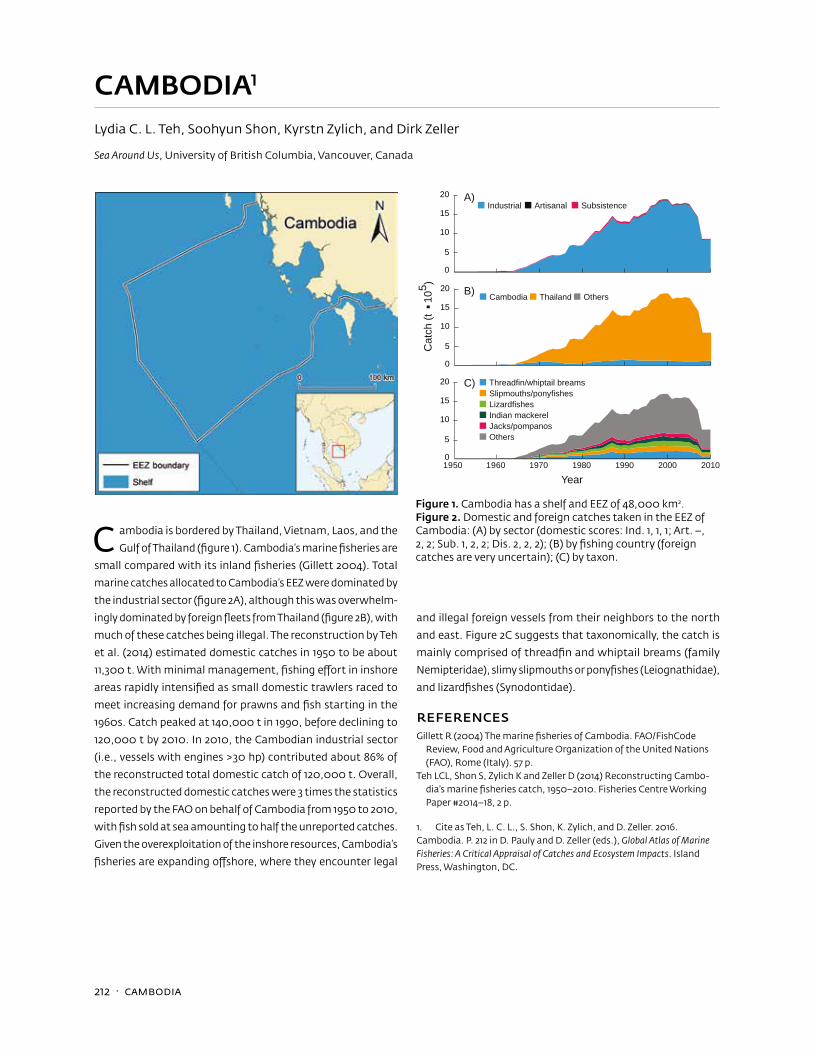
C ambodia is bordered by Thailand, Vietnam, Laos, and the
Gulf of Thailand (figure 1). Cambodia’s marine fisheries are
small compared with its inland fisheries (Gillett 2004). Total
marine catches allocated to Cambodia’s EEZ were dominated by
the industrial sector (figure 2A), although this was overwhelm-
ingly dominated by foreign fleets from Thailand (figure 2B), with
much of these catches being illegal. The reconstruction by Teh
et al. (2014) estimated domestic catches in 1950 to be about
11,300 t. With minimal management, fishing effort in inshore
areas rapidly intensified as small domestic trawlers raced to
meet increasing demand for prawns and fish starting in the
1960s. Catch peaked at 140,000 t in 1990, before declining to
120,000 t by 2010. In 2010, the Cambodian industrial sector
(i.e., vessels with engines >30 hp) contributed about 86% of
the reconstructed total domestic catch of 120,000 t. Overall,
the reconstructed domestic catches were 3 times the statistics
reported by the FAO on behalf of Cambodia from 1950 to 2010,
with fish sold at sea amounting to half the unreported catches.
Given the overexploitation of the inshore resources, Cambodia’s
fisheries are expanding offshore, where they encounter legal
and illegal foreign vessels from their neighbors to the north
and east. Figure 2C suggests that taxonomically, the catch is
mainly comprised of threadfin and whiptail breams (family
Nemipteridae), slimy slipmouths or ponyfishes (Leiognathidae),
and lizardfishes (Synodontidae).
ReferencesGillett R (2004) The marine fisheries of Cambodia. FAO/FishCode
Review, Food and Agriculture Organization of the United Nations (FAO), Rome (Italy). 57 p.
Teh LCL, Shon S, Zylich K and Zeller D (2014) Reconstructing Cambo-dia’s marine fisheries catch, 1950–2010. Fisheries Centre Working Paper #2014–18, 2 p.
1. Cite as Teh, L. C. L., S. Shon, K. Zylich, and D. Zeller. 2016. Cambodia. P. 212 in D. Pauly and D. Zeller (eds.), Global Atlas of Marine Fisheries: A Critical Appraisal of Catches and Ecosystem Impacts. Island Press, Washington, DC.
Figure 1. Cambodia has a shelf and EEZ of 48,000 km2. Figure 2. Domestic and foreign catches taken in the EEZ of Cambodia: (A) by sector (domestic scores: Ind. 1, 1, 1; Art. –, 2, 2; Sub. 1, 2, 2; Dis. 2, 2, 2); (B) by fishing country (foreign catches are very uncertain); (C) by taxon.
1950 1960 1970 1980 1990 2000 2010
0
5
10
15
20
0
5
10
15
20
0
5
10
15
20
Year
Cat
ch (t
. 105 )
A)
B)
C)Slipmouths/ponyfishesThreadfin/whiptail breams
Indian mackerelLizardfishes
Jacks/pompanosOthers
ThailandCambodia
ArtisanalIndustrial Subsistence
Others
Congo (ex-Zaïre) · 227
CONGO (EX-ZAÏRE)1
Dyhia Belhabib, Sulan Ramdeen, Daniel Pauly
Sea Around Us, University of British Columbia, Vancouver, Canada
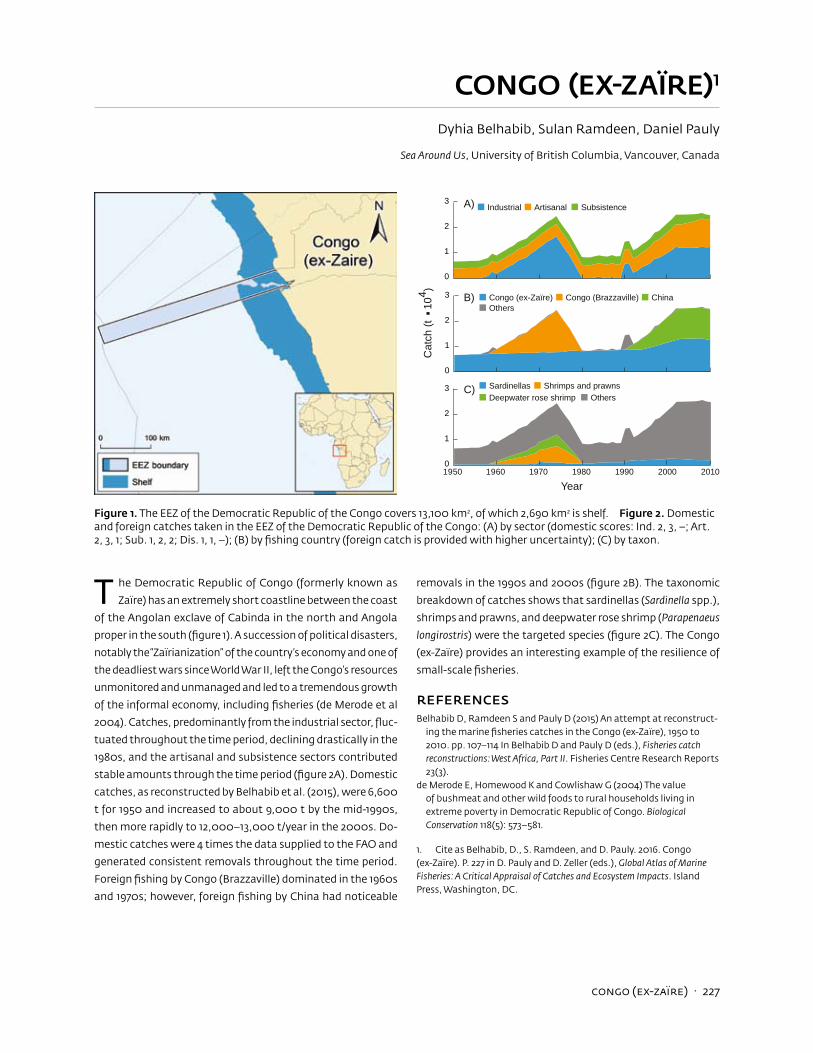
T he Democratic Republic of Congo (formerly known as
Zaïre) has an extremely short coastline between the coast
of the Angolan exclave of Cabinda in the north and Angola
proper in the south (figure 1). A succession of political disasters,
notably the “Zaïrianization” of the country’s economy and one of
the deadliest wars since World War II, left the Congo’s resources
unmonitored and unmanaged and led to a tremendous growth
of the informal economy, including fisheries (de Merode et al
2004). Catches, predominantly from the industrial sector, fluc-
tuated throughout the time period, declining drastically in the
1980s, and the artisanal and subsistence sectors contributed
stable amounts through the time period (figure 2A). Domestic
catches, as reconstructed by Belhabib et al. (2015), were 6,600
t for 1950 and increased to about 9,000 t by the mid-1990s,
then more rapidly to 12,000–13,000 t/year in the 2000s. Do-
mestic catches were 4 times the data supplied to the FAO and
generated consistent removals throughout the time period.
Foreign fishing by Congo (Brazzaville) dominated in the 1960s
and 1970s; however, foreign fishing by China had noticeable
removals in the 1990s and 2000s (figure 2B). The taxonomic
breakdown of catches shows that sardinellas (Sardinella spp.),
shrimps and prawns, and deepwater rose shrimp (Parapenaeus
longirostris) were the targeted species (figure 2C). The Congo
(ex-Zaïre) provides an interesting example of the resilience of
small-scale fisheries.
ReferencesBelhabib D, Ramdeen S and Pauly D (2015) An attempt at reconstruct-
ing the marine fisheries catches in the Congo (ex-Zaïre), 1950 to 2010. pp. 107–114 In Belhabib D and Pauly D (eds.), Fisheries catch reconstructions: West Africa, Part II. Fisheries Centre Research Reports 23(3).
de Merode E, Homewood K and Cowlishaw G (2004) The value of bushmeat and other wild foods to rural households living in extreme poverty in Democratic Republic of Congo. Biological Conservation 118(5): 573–581.
1. Cite as Belhabib, D., S. Ramdeen, and D. Pauly. 2016. Congo (ex-Zaïre). P. 227 in D. Pauly and D. Zeller (eds.), Global Atlas of Marine Fisheries: A Critical Appraisal of Catches and Ecosystem Impacts. Island Press, Washington, DC.
1950 1960 1970 1980 1990 2000 2010
0
1
2
3
0
1
2
3
0
1
2
3
Year
Cat
ch (t
. 104 )
A)
B)
C) Shrimps and prawnsSardinellasDeepwater rose shrimp Others
Congo (Brazzaville)Congo (ex-Zaïre)
ArtisanalIndustrial Subsistence
ChinaOthers
Figure 1. The EEZ of the Democratic Republic of the Congo covers 13,100 km2, of which 2,690 km2 is shelf. Figure 2. Domestic and foreign catches taken in the EEZ of the Democratic Republic of the Congo: (A) by sector (domestic scores: Ind. 2, 3, –; Art. 2, 3, 1; Sub. 1, 2, 2; Dis. 1, 1, –); (B) by fishing country (foreign catch is provided with higher uncertainty); (C) by taxon.
240 · Dominican Republic
DOMINICAN REPUBLIC1
Liesbeth van der Meer, Robin Ramdeen, Kyrstn Zylich, and Dirk Zeller
Sea Around Us, University of British Columbia, Vancouver, Canada
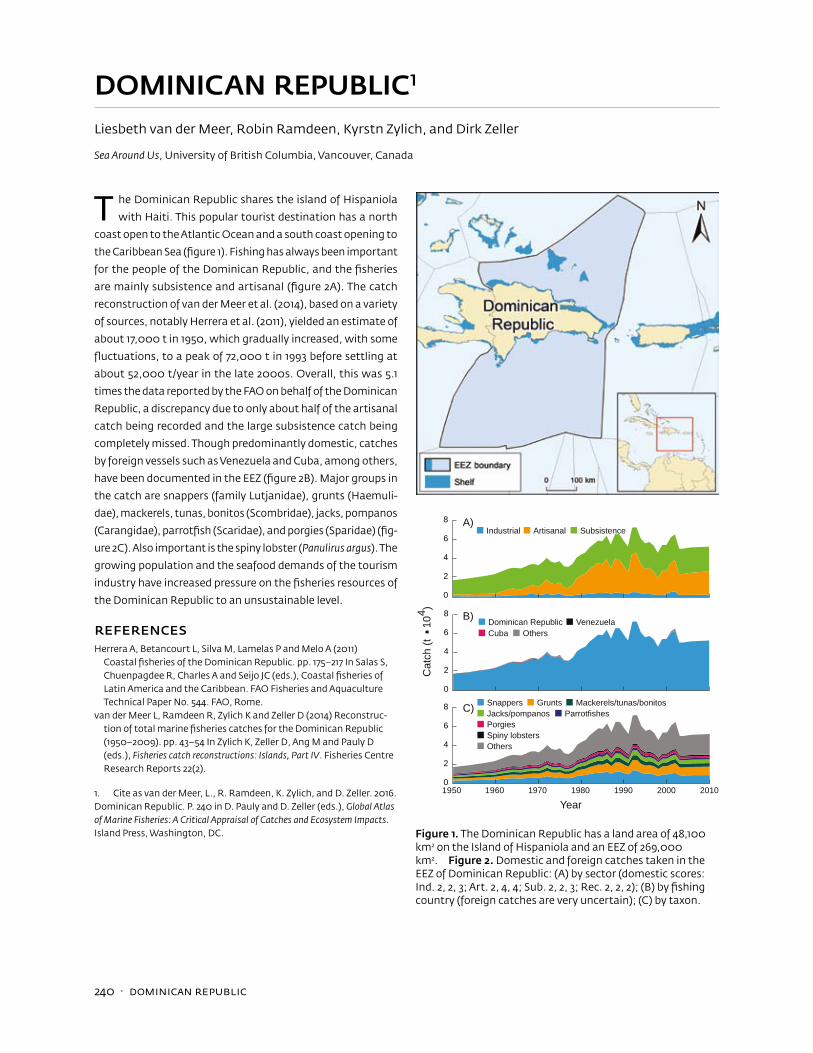
T he Dominican Republic shares the island of Hispaniola
with Haiti. This popular tourist destination has a north
coast open to the Atlantic Ocean and a south coast opening to
the Caribbean Sea (figure 1). Fishing has always been important
for the people of the Dominican Republic, and the fisheries
are mainly subsistence and artisanal (figure 2A). The catch
reconstruction of van der Meer et al. (2014), based on a variety
of sources, notably Herrera et al. (2011), yielded an estimate of
about 17,000 t in 1950, which gradually increased, with some
fluctuations, to a peak of 72,000 t in 1993 before settling at
about 52,000 t/year in the late 2000s. Overall, this was 5.1
times the data reported by the FAO on behalf of the Dominican
Republic, a discrepancy due to only about half of the artisanal
catch being recorded and the large subsistence catch being
completely missed. Though predominantly domestic, catches
by foreign vessels such as Venezuela and Cuba, among others,
have been documented in the EEZ (figure 2B). Major groups in
the catch are snappers (family Lutjanidae), grunts (Haemuli-
dae), mackerels, tunas, bonitos (Scombridae), jacks, pompanos
(Carangidae), parrotfish (Scaridae), and porgies (Sparidae) (fig-
ure 2C). Also important is the spiny lobster (Panulirus argus). The
growing population and the seafood demands of the tourism
industry have increased pressure on the fisheries resources of
the Dominican Republic to an unsustainable level.
ReferencesHerrera A, Betancourt L, Silva M, Lamelas P and Melo A (2011)
Coastal fisheries of the Dominican Republic. pp. 175–217 In Salas S, Chuenpagdee R, Charles A and Seijo JC (eds.), Coastal fisheries of Latin America and the Caribbean. FAO Fisheries and Aquaculture Technical Paper No. 544. FAO, Rome.
van der Meer L, Ramdeen R, Zylich K and Zeller D (2014) Reconstruc-tion of total marine fisheries catches for the Dominican Republic (1950–2009). pp. 43–54 In Zylich K, Zeller D, Ang M and Pauly D (eds.), Fisheries catch reconstructions: Islands, Part IV. Fisheries Centre Research Reports 22(2).
1. Cite as van der Meer, L., R. Ramdeen, K. Zylich, and D. Zeller. 2016. Dominican Republic. P. 240 in D. Pauly and D. Zeller (eds.), Global Atlas of Marine Fisheries: A Critical Appraisal of Catches and Ecosystem Impacts. Island Press, Washington, DC.
1950 1960 1970 1980 1990 2000 2010
0
2
4
6
8
0
2
4
6
8
0
2
4
6
8
Year
Cat
ch (t
. 104 )
A)
B)
C) GruntsSnappersJacks/pompanos
Mackerels/tunas/bonitosParrotfishes
PorgiesSpiny lobstersOthers
Dominican Republic Venezuela
ArtisanalIndustrial Subsistence
Cuba Others
Figure 1. The Dominican Republic has a land area of 48,100 km2 on the Island of Hispaniola and an EEZ of 269,000 km2. Figure 2. Domestic and foreign catches taken in the EEZ of Dominican Republic: (A) by sector (domestic scores: Ind. 2, 2, 3; Art. 2, 4, 4; Sub. 2, 2, 3; Rec. 2, 2, 2); (B) by fishing country (foreign catches are very uncertain); (C) by taxon.
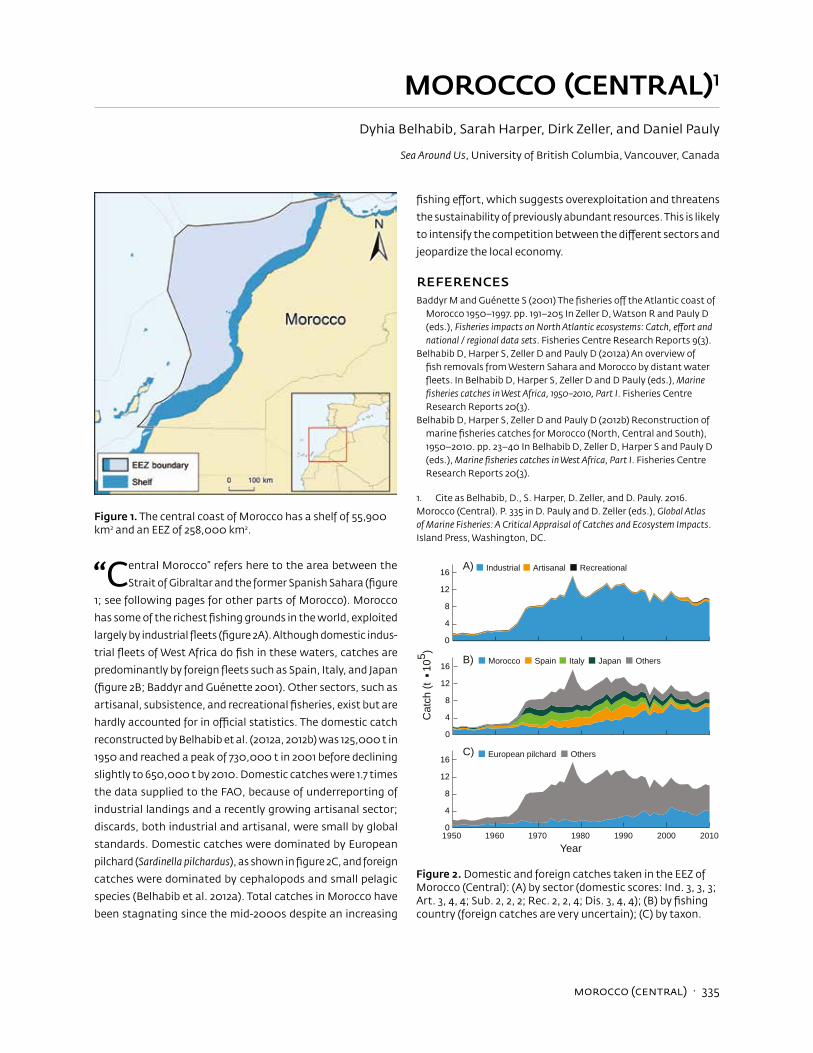
Morocco (Central) · 335
MOROCCO (CENTRAL)1
Dyhia Belhabib, Sarah Harper, Dirk Zeller, and Daniel Pauly
Sea Around Us, University of British Columbia, Vancouver, Canada
“Central Morocco” refers here to the area between the
Strait of Gibraltar and the former Spanish Sahara (figure
1; see following pages for other parts of Morocco). Morocco
has some of the richest fishing grounds in the world, exploited
largely by industrial fleets (figure 2A). Although domestic indus-
trial fleets of West Africa do fish in these waters, catches are
predominantly by foreign fleets such as Spain, Italy, and Japan
(figure 2B; Baddyr and Guénette 2001). Other sectors, such as
artisanal, subsistence, and recreational fisheries, exist but are
hardly accounted for in official statistics. The domestic catch
reconstructed by Belhabib et al. (2012a, 2012b) was 125,000 t in
1950 and reached a peak of 730,000 t in 2001 before declining
slightly to 650,000 t by 2010. Domestic catches were 1.7 times
the data supplied to the FAO, because of underreporting of
industrial landings and a recently growing artisanal sector;
discards, both industrial and artisanal, were small by global
standards. Domestic catches were dominated by European
pilchard (Sardinella pilchardus), as shown in figure 2C, and foreign
catches were dominated by cephalopods and small pelagic
species (Belhabib et al. 2012a). Total catches in Morocco have
been stagnating since the mid-2000s despite an increasing
fishing effort, which suggests overexploitation and threatens
the sustainability of previously abundant resources. This is likely
to intensify the competition between the different sectors and
jeopardize the local economy.
ReferencesBaddyr M and Guénette S (2001) The fisheries off the Atlantic coast of
Morocco 1950–1997. pp. 191–205 In Zeller D, Watson R and Pauly D (eds.), Fisheries impacts on North Atlantic ecosystems: Catch, effort and national / regional data sets. Fisheries Centre Research Reports 9(3).
Belhabib D, Harper S, Zeller D and Pauly D (2012a) An overview of fish removals from Western Sahara and Morocco by distant water fleets. In Belhabib D, Harper S, Zeller D and D Pauly (eds.), Marine fisheries catches in West Africa, 1950–2010, Part I. Fisheries Centre Research Reports 20(3).
Belhabib D, Harper S, Zeller D and Pauly D (2012b) Reconstruction of marine fisheries catches for Morocco (North, Central and South), 1950–2010. pp. 23–40 In Belhabib D, Zeller D, Harper S and Pauly D (eds.), Marine fisheries catches in West Africa, Part I. Fisheries Centre Research Reports 20(3).
1. Cite as Belhabib, D., S. Harper, D. Zeller, and D. Pauly. 2016. Morocco (Central). P. 335 in D. Pauly and D. Zeller (eds.), Global Atlas of Marine Fisheries: A Critical Appraisal of Catches and Ecosystem Impacts. Island Press, Washington, DC.
Figure 2. Domestic and foreign catches taken in the EEZ of Morocco (Central): (A) by sector (domestic scores: Ind. 3, 3, 3; Art. 3, 4, 4; Sub. 2, 2, 2; Rec. 2, 2, 4; Dis. 3, 4, 4); (B) by fishing country (foreign catches are very uncertain); (C) by taxon.
Figure 1. The central coast of Morocco has a shelf of 55,900 km2 and an EEZ of 258,000 km2.
1950 1960 1970 1980 1990 2000 2010
0
4
8
12
16
0
4
8
12
16
0
4
8
12
16
Year
Cat
ch (t
. 105 )
A)
B)
C) European pilchard Others
ItalyMorocco Spain
ArtisanalIndustrial Recreational
Japan Others
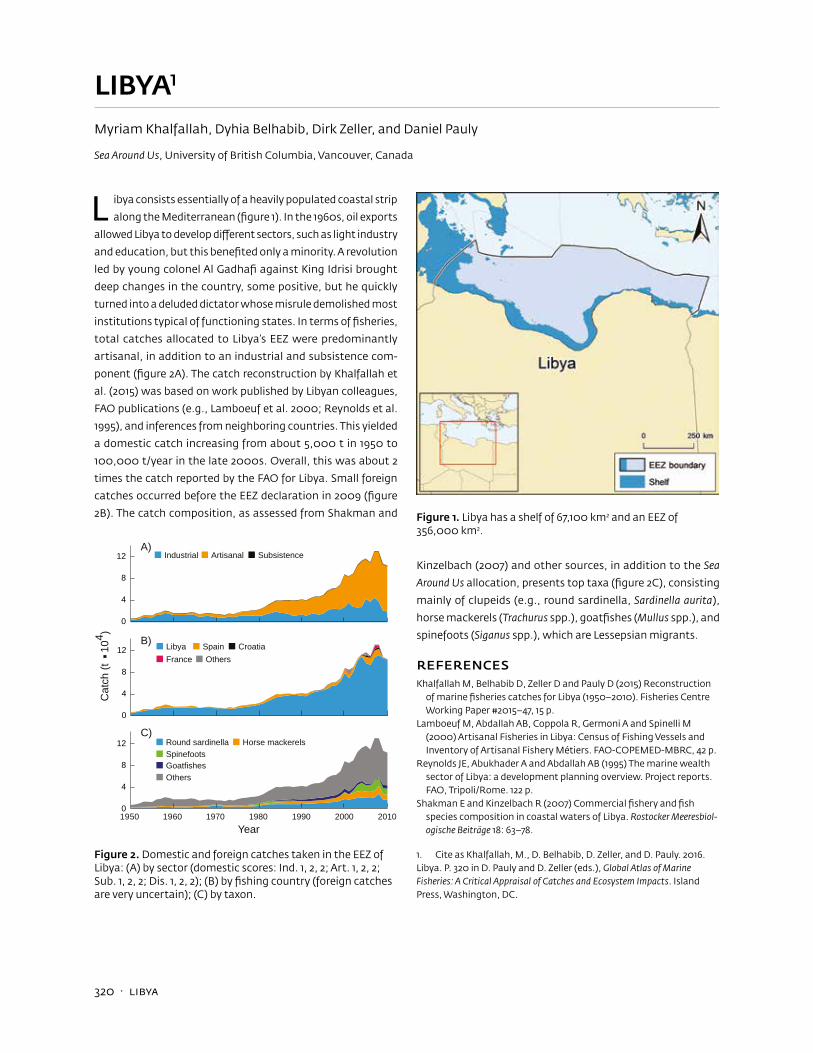
320 · Libya
LIBYA1
Myriam Khalfallah, Dyhia Belhabib, Dirk Zeller, and Daniel Pauly
Sea Around Us, University of British Columbia, Vancouver, Canada
L ibya consists essentially of a heavily populated coastal strip
along the Mediterranean (figure 1). In the 1960s, oil exports
allowed Libya to develop different sectors, such as light industry
and education, but this benefited only a minority. A revolution
led by young colonel Al Gadhafi against King Idrisi brought
deep changes in the country, some positive, but he quickly
turned into a deluded dictator whose misrule demolished most
institutions typical of functioning states. In terms of fisheries,
total catches allocated to Libya’s EEZ were predominantly
artisanal, in addition to an industrial and subsistence com-
ponent (figure 2A). The catch reconstruction by Khalfallah et
al. (2015) was based on work published by Libyan colleagues,
FAO publications (e.g., Lamboeuf et al. 2000; Reynolds et al.
1995), and inferences from neighboring countries. This yielded
a domestic catch increasing from about 5,000 t in 1950 to
100,000 t/year in the late 2000s. Overall, this was about 2
times the catch reported by the FAO for Libya. Small foreign
catches occurred before the EEZ declaration in 2009 (figure
2B). The catch composition, as assessed from Shakman and
Kinzelbach (2007) and other sources, in addition to the Sea
Around Us allocation, presents top taxa (figure 2C), consisting
mainly of clupeids (e.g., round sardinella, Sardinella aurita),
horse mackerels (Trachurus spp.), goatfishes (Mullus spp.), and
spinefoots (Siganus spp.), which are Lessepsian migrants.
ReferencesKhalfallah M, Belhabib D, Zeller D and Pauly D (2015) Reconstruction
of marine fisheries catches for Libya (1950–2010). Fisheries Centre Working Paper #2015–47, 15 p.
Lamboeuf M, Abdallah AB, Coppola R, Germoni A and Spinelli M (2000) Artisanal Fisheries in Libya: Census of Fishing Vessels and Inventory of Artisanal Fishery Métiers. FAO-COPEMED-MBRC, 42 p.
Reynolds JE, Abukhader A and Abdallah AB (1995) The marine wealth sector of Libya: a development planning overview. Project reports. FAO, Tripoli/Rome. 122 p.
Shakman E and Kinzelbach R (2007) Commercial fishery and fish species composition in coastal waters of Libya. Rostocker Meeresbiol-ogische Beiträge 18: 63–78.
1. Cite as Khalfallah, M., D. Belhabib, D. Zeller, and D. Pauly. 2016. Libya. P. 320 in D. Pauly and D. Zeller (eds.), Global Atlas of Marine Fisheries: A Critical Appraisal of Catches and Ecosystem Impacts. Island Press, Washington, DC.
1950 1960 1970 1980 1990 2000 2010
0
4
8
12
0
4
8
12
0
4
8
12
Year
Cat
ch (t
. 104 )
A)
B)
C)Horse mackerelsRound sardinella
SpinefootsGoatfishesOthers
SpainLibya Croatia
ArtisanalIndustrial Subsistence
France Others
Figure 2. Domestic and foreign catches taken in the EEZ of Libya: (A) by sector (domestic scores: Ind. 1, 2, 2; Art. 1, 2, 2; Sub. 1, 2, 2; Dis. 1, 2, 2); (B) by fishing country (foreign catches are very uncertain); (C) by taxon.
Figure 1. Libya has a shelf of 67,100 km2 and an EEZ of 356,000 km2.
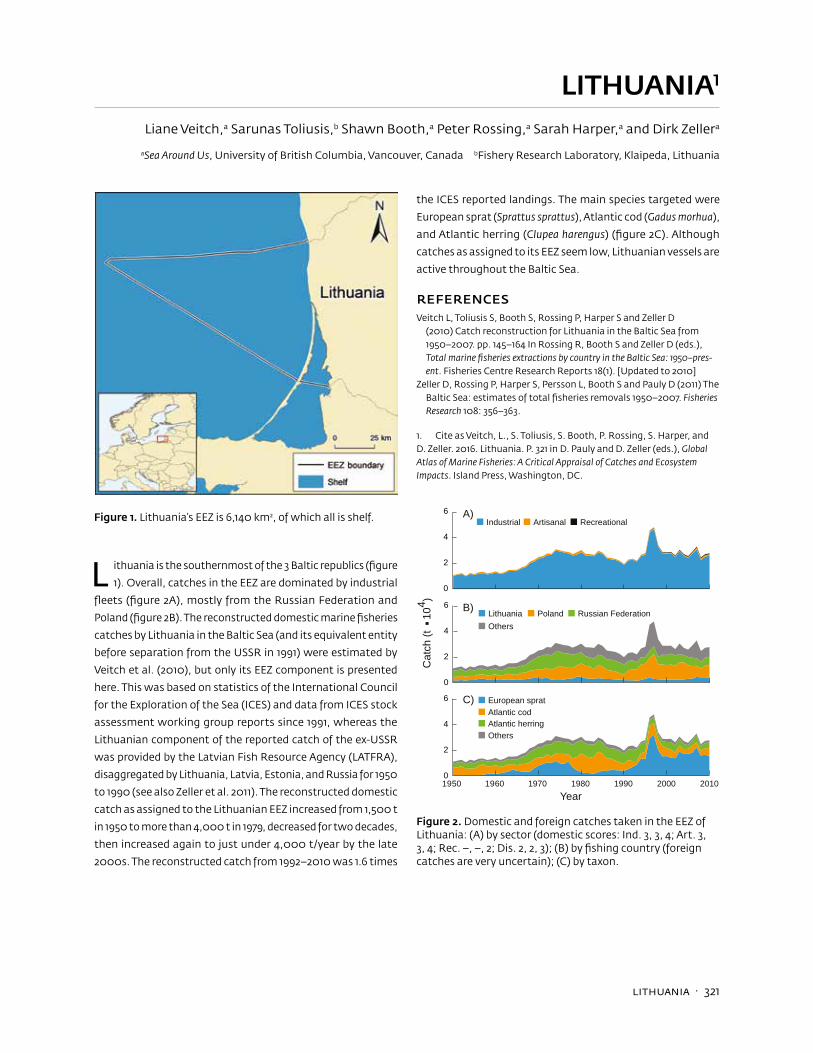
Lithuania · 321
LITHUANIA1
Liane Veitch,a Sarunas Toliusis,b Shawn Booth,a Peter Rossing,a Sarah Harper,a and Dirk Zellera
aSea Around Us, University of British Columbia, Vancouver, Canada bFishery Research Laboratory, Klaipeda, Lithuania
L ithuania is the southernmost of the 3 Baltic republics (figure
1). Overall, catches in the EEZ are dominated by industrial
fleets (figure 2A), mostly from the Russian Federation and
Poland (figure 2B). The reconstructed domestic marine fisheries
catches by Lithuania in the Baltic Sea (and its equivalent entity
before separation from the USSR in 1991) were estimated by
Veitch et al. (2010), but only its EEZ component is presented
here. This was based on statistics of the International Council
for the Exploration of the Sea (ICES) and data from ICES stock
assessment working group reports since 1991, whereas the
Lithuanian component of the reported catch of the ex-USSR
was provided by the Latvian Fish Resource Agency (LATFRA),
disaggregated by Lithuania, Latvia, Estonia, and Russia for 1950
to 1990 (see also Zeller et al. 2011). The reconstructed domestic
catch as assigned to the Lithuanian EEZ increased from 1,500 t
in 1950 to more than 4,000 t in 1979, decreased for two decades,
then increased again to just under 4,000 t/year by the late
2000s. The reconstructed catch from 1992–2010 was 1.6 times
the ICES reported landings. The main species targeted were
European sprat (Sprattus sprattus), Atlantic cod (Gadus morhua),
and Atlantic herring (Clupea harengus) (figure 2C). Although
catches as assigned to its EEZ seem low, Lithuanian vessels are
active throughout the Baltic Sea.
ReferencesVeitch L, Toliusis S, Booth S, Rossing P, Harper S and Zeller D
(2010) Catch reconstruction for Lithuania in the Baltic Sea from 1950–2007. pp. 145–164 In Rossing R, Booth S and Zeller D (eds.), Total marine fisheries extractions by country in the Baltic Sea: 1950–pres-ent. Fisheries Centre Research Reports 18(1). [Updated to 2010]
Zeller D, Rossing P, Harper S, Persson L, Booth S and Pauly D (2011) The Baltic Sea: estimates of total fisheries removals 1950–2007. Fisheries Research 108: 356–363.
1. Cite as Veitch, L., S. Toliusis, S. Booth, P. Rossing, S. Harper, and D. Zeller. 2016. Lithuania. P. 321 in D. Pauly and D. Zeller (eds.), Global Atlas of Marine Fisheries: A Critical Appraisal of Catches and Ecosystem Impacts. Island Press, Washington, DC.
1950 1960 1970 1980 1990 2000 2010
0
2
4
6
0
2
4
6
0
2
4
6
Year
Cat
ch (t
. 104 )
A)
B)
C) European spratAtlantic codAtlantic herringOthers
PolandLithuania Russian Federation
ArtisanalIndustrial Recreational
Others
Figure 2. Domestic and foreign catches taken in the EEZ of Lithuania: (A) by sector (domestic scores: Ind. 3, 3, 4; Art. 3, 3, 4; Rec. –, –, 2; Dis. 2, 2, 3); (B) by fishing country (foreign catches are very uncertain); (C) by taxon.
Figure 1. Lithuania’s EEZ is 6,140 km2, of which all is shelf.