Embed Size (px)
DESCRIPTION
OFFICE OF DISASTER PREPAREDNESS AND EMERGENCY MANAGEMENT November 2001 P REPARED BY : T HE M ITIGATION P LANNING AND R ESEARCH D IVISION O FFICE OF D ISASTER PREPAREDNESS AND E MERGENCY M ANAGEMENT 1 RECOMMENDATIONS REFERENCES GENERAL CHARACTERISTICES CONCLUSION ECONOMIC IMPACT RAINFALL DATA SITE INVESTIGATIONS 2.0 3.0 5.0 6.0 7.0 8.0 9.0 2 L IST OF FIGURES 3
Citation preview

1
DAMAGE ASSESSMENT
REPORT
OCTOBER 29 – NOVEMBER 5, 2001 RAINS
PREPARED BY: THE MITIGATION PLANNING AND RESEARCH DIVISION OFFICE OF DISASTER PREPAREDNESS AND EMERGENCY MANAGEMENT
November 2001
O F F I C E O F D I S A S T E R P R E P A R E D N E S S A N D
E M E R G E N C Y M A N A G E M E N T

2
TABLE OF CONTENTS
1.0 INTRODUCTION
1.1 Background 1.2 Aims and Objectives 1.3 Methodology
2.0 RAINFALL DATA 3.0 GENERAL CHARACTERISTICES
3.1 Profiles of the affected parishes Portland St. Mary St. Ann St. Catherine
4.0 TYPES OF HAZARDS AND AREAS AFFECTED 4.1 Introduction 4.2 Factors that caused flooding 4.3 Factors that caused landslides
5.0 ECONOMIC IMPACT 6.0 RECOMMENDATIONS
6.1 Landslides 6.2 Flooding 6.3 Vulnerability and Risk Assessment 6.4 Siting of developments
7.0 CONCLUSION 8.0 REFERENCES 9.0 SITE INVESTIGATIONS APPENDICES APPENDIX 1 – REPORT WATER RESOURCES AUTHORITY 1998 FLOOD REPORT APPENDIX 2 - CONCLUSION AND RECOMMENDATIONS NEPA OCT. NOV. FLOOD REPORT 2001 APPENDIX 3 –REPORT NATIONAL WORKS AGENCY APPENDIX 4 – REPORT FROM MINISTRY OF EDUCATION APPENDIX 5 – REPORT HEALTH SECTOR NEEDS ASSESSMENT LIST OF TABLES TABLE :1 PRELIMINARY RAINFALL REPORT FOR OCT. 27 – 30
TH 2001
TABLE :2 30 YEAR (1951-80) MEAN PARISH RAINFAL MM TABLE :3 SHOWING AGRICULTURE LOSSES FROM OCT. – NOV. 2001 RAINS TABLE :4 SHOWING COST TO REHABILITATE ROADS TABLE :5 SUMMARY OF INFRASTRUCTURE REHABILITATION COSTS TABLE :6 NWC DAMAGE TO FACILITIES OCT. 29 – NOV. 5
TH RAINS 2001
TABLE :7 C AND W PLANT AFFECTED BY FLOOD RAINS TABLE :8 ISSUES ASSOCIATED WITH HURRICANE MICHELLE TABLE :9 SHOWING SCHOOLS TYPE OF DAMAGE AND LOSSES OCT. NOV. 2001 RAINS TABLE :10 SUMMARY OF WELFARE TABLE :11 SUMMARY OF DAMAGE LOSSES TO SECTORS

3
LIST OF FIGURES FIGURE :1 CROP LOSSES TO AGRICULTURE SECTOR FIGURE :2 LIVESTOCK ANALYSIS FIGURE :3 FARMERS AFFECTED FIGURE :4 COST TO REHABILITATE ROADS FIGURE :5 SUMMARY OF INFRASTRUCTURE DAMAGE FIGURE :6 BAR GRAPH SHOWING TYPES OF SCHOOLS AFFECTED FIGURE :7 TYPE OF DAMAGE AND COST FIGURE :8 TOTAL DAMAGE COSTS OF EDUCATIONAL FACILITIES BY PARISH AFFECTED FIGURE :9 PIE CHART SHOWING LOSSES TO SECTORS

4
1.0 BACKGROUND Jamaica’s rainfall is derived from several weather phenomenon. The major rainy period is during the hurricane season that starts from June 1
st to November 30
th. Heavy rains also occur during the months
November to April and are due to cold frontal systems that descend from the north. Over the period October 29
th to November 5
th heavy
1 and at times violent rainfall impacted Jamaica mainly
the Northeastern parishes. The heavy rainfall during this period was as result of the development of Hurricane Michelle. The report from the Meteorological Office indicates that the majority of the most intense rainfall across the parishes occurred in the early developmental stages of the Hurricane and not during its general northward track as it passed west of the island. Agriculture and road/bridge infrastructures were damaged or destroyed in most parishes. Portland and St. Mary were reported as the parishes that were worst affected with preliminary estimated flood damage loss of $2,229,298,962.26 J Dollars. Several families were evacuated due to flooding for example, in the Bybrook community in Portland, and two persons were reported dead. 1.2 AIMS AND OBJECTIVES The aim of this report is to focus on the damage caused by landslides and floods from the rains of October 29
th - to November 5
th 2001, in several north- northwestern communities, these parishes are:
• Portland • St. Mary • Trelawny • St. Ann • St. Catherine • St. Andrew
The report is to document the damage that resulted from the event and to make recommendations on appropriate mitigation strategies that could be implemented in these areas. This report will be written in two parts:
1. Focus on the activities that caused flooding and 2. The damage cost of the disaster event.
A second report will focus on recovery and rehabilitation and will form the second part of the complete document. The objectives are to:
1. Identify the causes of the landslides and flooding. 2. Determine the vulnerability caused by the landslide. 3. Identify the needs and priorities for mitigation and emergency preparedness. 4. Determine the economic impact of landslides and floods in each parish.
1.3 METHODOLOGY Preliminary information concerning effects of the heavy rains was collected and recorded from distress reports from residents in the affected areas. Confirmation from response authorities like the JDF and JFB was also used to compare reports and to plan appropriate responses. Primary research was done directly in the field as site investigations. Pictures and details of the incidences were taken. Parishes that were visited were: Portland, and St. Mary. Representatives who were present
1 Rainfall intensity: light – less than 2mm/h; moderate 2 –10 mm/h; heavy –more than 10mm/h; violent – more than 50mm/h Source:
National Meteorological Service 2001 – Report on Severe Weather Event.

5
in the field were; the Parish Council Coordinator or representative, Parish Disaster Coordinator, Regional Coordinator and persons from the Mines and Geology Division and the Water Resources Authority. Secondary research was also through reports from agencies such as the Meteorological office Water Resources Authority and National Works agency. DESCRIPTION OF THE EVENT 2.1 Report On Severe Weather Event October 28 – November 05, 2001
Introduction Over the period October 28 to November 05, heavy
1 – and at times violent – rainfall fell over
Jamaica, particularly northeastern parishes, causing extensive destruction to several sectors of the economy, viz infrastructure, agriculture and tourism. The heavy rainfall during this period was a direct result of the development of Hurricane Michelle. It is noteworthy that the majority of, and most intense rainfall across northeastern parishes, fell during the early development stages of Hurricane Michelle, and not actually during its general northward track as it passed west of the island (Source: NMS, 2002)
2.2 The Event
Michelle was the 13th named Tropical Storm of the 2001 Hurricane Season, however as a tropical
depression the low-pressure produced disturbed weather across the western Caribbean including Jamaica with North eastern parishes receiving heavy flood rains on the 28
th and 29
th October. The
heavy showers accompanying the system affected Portland, St. Mary, St. Ann and to a lesser extent St. Andrew, St. Catherine and St. Thomas. Table 1 highlights the rainfall figures from October 27
th –
30th. Average rainfall over the period October 27
th to November 5
th was 1924mm for the collective
parishes of Portland, St. Mary, St. Ann, St. Andrew, St. Catherine and St. Thomas. Table 1: Preliminary Rainfall Report for October 27-30, 2001.
OCTOBER STATION PARISH
27th 28
th 29
th 30
th
Orange River St. Mary - 142.0 300.3 33.3 Brimmer Hall - 107.8 208.4 13.7 Industry 9.8 96.0 230.0 32.0 Boscobel 39.4 96.5 162.8 38.1 Agualta Vale - 47.4 345.9 19.6 Runaway Bay
St. Ann - 102.0 184.4 40.4
Laughlands - 142.2 172.2 32.0 Discovery Bay
- 54.4 131.8 57.8
Fern Gully - 171.0 238.3 20.9 Lawrence Tavern
St. Andrew - 79.5 58.0 3.0
Guys Hill St. Catherine - 40.0 170.0 - Damhead - 23.5 9.0 - Tulloch Estate
- 26.0 22.7 -
Enfield (United Estate)
- 124.0 37.5 -
Passley Portland - 19.6 137.7 49.9
1 Rainfall intensity: light – less than 2mm/h; moderate – 2 to 10 mm/h; heavy – more than 10mm/h; violent – more than
50mm/h.

6
OCTOBER STATION PARISH
27th 28
th 29
th 30
th
Gardens Moore Town 0.0 186.6 300.1 31.3 Comfort Castle
0.0 244.8 277.1 55.4
Spring Garden
2.5 0.0 428.2 92.6
Port Antonio 0.0 20.0 62.0 12.4 Orange Valley
Trelawny - 40.0 50.5 50.0
*Figures represent amounts in millimeters. Table 2: 30-year (1951-80) Mean Parish Rainfall (millimetres)
RAINFALL (MM) PARISH
OCTOBER NOVEMBER Portland
373
477
St. Mary 209 263 St. Ann 177 214 St. Andrew 287 187 St. Catherine 238 121 St. Thomas 368 232
A comparison of Tables 1 and 2 shows that for some stations in St. Mary daily rainfall values (on October 29) exceeded the 30-year mean for October. Orange River, Brimmer Hall, Industry and Agualta Vale all surpassed the 1951 to 1980 average of 209 mm; while Spring Garden in Portland exceeded the 30-year mean by 55 mm on the 29
th of October. A simplified computation of rainfall
rates, assuming uniformity throughout the respective days, would seem to imply accumulations of 10.2, 5.9, and 7.1 millimetres per hour (mm/hr) respectively for Portland, St. Mary and St. Ann on October 28, increasing to 17.8, 14.4 and 9.9 mm/hr on October 29 (Source: NMS 2002).
The low-pressure system intensified into Tropical Storm and then hurricane Michelle by November and as a result the flash flood warnings continued for the island until November 5
th when Hurricane
Michelle moved further North over the Atlantic Ocean.
Although St. Mary received more rainfall than Portland for the period October 28th
to November 5th ,
flooding and damages to infrastructure and agriculture was more devastating in Portland.
By the 1st of November rainfall amounts had decreased significantly across the island. Flooding
however, had continued in the northeastern parishes as both natural and artificial waterways were not able to adequately channel the accumulated rainfall.
3.0 GENERAL CHARACTERISTICS 3.1 Profiles of the Affected Parishes
PORTLAND
Location: The Northeast tip of the island. Area: Approx. 814 sq.km Land-use: Agriculture contributes to the main financial sector of the economy.

7
Rivers: The main rivers are the Rio Grande, Swift, Buff Bay and Spanish River. Other minor rivers flowing through the parish include Daniels, Little Spanish, Priestmans and Back Rivers.
Elevation: Blue Mountain Peak – 7402 ft.
Catherine Peak – 5000 ft.
Geology: White Limestone, Yellow Limestone and Sedimentary Rocks are the dominant geological formations in this parish. The sedimentary formations are Richmond, Wagwater and Cretaceous Sedimentary rocks. Volcanics are also present in small amounts. This Parish has a high fault density that contributes to the instability of the land. This factor of instability is seen especially in the hilly interiors (source: Parish Profiles Prepared by JIS)
Because of the parish’s position on the island, Portland experiences hard lashes of bad weather. Cloud masses laden with moisture are forced to rise when they reach the mountains of Portland; at that height the moisture is cooled and then condensation of the moisture takes place; this subsequently produces rain, most of which falls in the Portland area. The amount and intensity of the rains are just some factors for the instability of the land and soil in this area.
Landslides were reported on the eastern side of the parish where sedimentary formations- Richmond, Wagwater, and Cretaceous Sedimentary formations are located.
ST. MARY
Location: Northeast of Jamaica. Area: 657.86 sq km Land-use: Tourism is now the fastest growing sector of the economy.
Agriculture remains the backbone of the Parish’s economy.
Geology: The Parish can be noticeably divided into two sections: 1. The geological formations on the eastern side of the parish consist mainly of sedimentary rocks (sandstone, siltstone or shale). Two of the major formations are the Wagwater and the Richmond formations. Under tropical conditions these formations tend to weather easily and erode during periods of heavy rainfall. Intricate surface drainage is also another topographic feature recognized in the eastern section of this Parish. The eastern section of the parish experienced landslides especially the District of Richmond.
2. The geological formation on the western section of the parish is made up of the White Limestone Group. This formation is not as unstable as the formations located on the eastern section of the parish. The texture ranges from chalky and marly beds to brecciated types to very hard to compact rocks. This section has predominantly underground features. Landslides were not reported from this section.
ST. ANN
Location: The north coast of the island. Area: 1212.6 sq. km Land-use: Agriculture, cultivation is predominantly confined to the crown lands in the hill.
Livestock is also produced.

8
Geology: White Limestone Group is the main formation found in this parish. There are several popular hills and mountains in this area. This includes the Dry Harbour Mountain, Mount Alba, Irons Mountain, Murray Mountain, Mount Diablo and Mount Zion. There were no landslides reported in this area. This may be due to the stability of the limestone. Flooding though, occurred along the roadways.
Rivers and Waterfalls: From these mountains and hills numerous rivers originate, the Whiter,
Great, Dunns, Roaring, Caver and the Pedro rivers. The more popular waterfalls are Dunns River Falls, the Llandovery and the Roaring River Falls.
ST. CATHERINE
Location: South Coast of Jamaica Area: 1191 sq. km. Land-use: Agriculture, St. Catherine is one of the major sugar producing parishes.
Industry – the largest salt producing plant in the Caribbean is located in this parish.
Geography: The Linstead Basin makes up one of the largest and most important basins in Jamaica – the Rio Cobre Basin. This area comprises over 300 sq. miles and includes extensive agricultural lands. St. Catherine Plains occupy the southern part of the Rio Cobre River Basin.
Geology: The North of the Parish is mainly made up of White Limestone whereas the south is
made up of Alluvium deposits. Note though that the Hellshire area is predominantly White Limestone. A minor landslide was reported in this Parish.
4.0 TYPES OF HAZARDS AND AREAS AFFECTED Impact of the hazards 4.1 Introduction Landslides debris flows and flooding are the main hazards that affected the parishes. . Evidence of this can be seen with the rainfall of October 28th – November 5
th 2001 which caused widespread damage across
most parishes but particularly devasted the parish of Portland and St. Mary. This section will describe that impact of floods and landslides on human systems. 4.2 FACTORS CAUSING FLOODING Flooding was reported in Portland, St. Mary, St. Ann, St. Thomas, St. Andrew and St. Catherine Trewlany, Hanover, and Clarendon. A number of Factors influenced that extent of the flooding. These include:-
• METEOROLOGICAL AND CLIMATIC CONDITIONS ASSOCIATED WITH THE SEVERE WEATHER SYSTEM. • LOCATION OF RESIDENTIAL AREAS IN FLOOD PLAIN OR FLOOD WAY • THE LACK OF MAINTENANCE OF DRAINAGE NETWORKS • FAULTY DRAINAGE AND OTHER HYDRAULIC STRUCTURAL DESIGN AND CONSTRUCTION • REDUCED CONVEYANCE CAPACITY OF THE NATURAL AND MAN-MADE CHANNELS
METEOROLOGICAL AND CLIMATIC CONDITIONS ASSOCIATED WITH THE SEVER E WEATHER SYSTEM
1. The counter clockwise wind-flow pattern into the center of the system drew warm moist air from the eastern Pacific and southern Caribbean Sea into the Jamaica area.

9
2. Specific to Portland and St. Mary, is the presence of the Blue Mountain Ridge. The mountain range acted as a barrier and zone of convergence to surface wind; forced the warm moist air to rise, thereby producing relief rainfall in the process.
3. The southeasterly breeze was enhanced by the near southerly flow from the system. The Northern side of the mountain range became the distinctive leeward side, setting up the development of a leeside trough which is a low pressure area that forms on the leeward side of mountain ranges when the wind flow is nearly perpendicular to the ridge thus producing more rainfall
4. The near stationary position of the system during the formative stages to being Hurricane Michelle 5. The additional rainfall on already saturated soils which triggered more flooding and landslides
4.3 AREAS AFFECTED BY FLOODING PORTLAND - Fellowship, San San, Berrydale, Orange Bay, Fruitful Vale, Spring Garden, Shrewsbury, Hope Bay near bridge, Claverty Cottage, Swift River Skibob, Spring Gardens, Buff Bay Kingston & St. Andrew - Castleton, Brandon Hill, Robertsfield, Florence Hill Havendale, Mannings Hill Road, March Pen Road, Industrial Village, Long Lane, Seaview Gardens, Woodlawn Avenue, Morecambe Avenue, Glendale, Riverside Drive, Gore Terrace, Patrick City, Almonda Terrace, Windward Road/Rockfort, Columbus Drive, Gore Terrace, Longwood Avenue, Pembroke Hall, Bayshore – Harbour View, White Avenue Drive, Waltham Park Road, Spanish Town Road, Baldwin Crescent, New Haven, Benbow Crescent, Hope Boulevard, Colbeck Avenue, Hampton Crescent, Stafford Close, Washington Gardens St. Mary -Lewisburg, Coloraine Crossing/Oracabessa entire Annotto Bay, Sections of Port Antonio, Enfield, Friendship Gap Trewlany - Jackson Town, Clarkes Town, Falmouth, Carey Park community Hanover - Cousins Cove, and Green Island St. Ann - Runaway Bay, Great Pond, Cardiff Hall, Lime hall, Content Gardens, Mamme Bay, Discovery Bay, Browns Town, Shaw Park, Lime Bottom, Walkers Wood – Fern Gully, Steer Town, Hollywood, Lydford – Orange Park, Laycox St. St. Catherine - Waterford, Passage Fort, Braeton – Phase 1, Greater Portmore 6E, 2W, 3W, 2E Caymanas Gardens, Old Braeton, Newland, Bridgeport, Independence City, Westchester, Sunny Side St. Thomas - Yallahs Bulls Bay Albion, Poormans’s Corner, Danvers Pen Clarendon - Vere - Longwood 4.4 Factors Causing Flooding The Water Resources Authority conducted a review of the 1998 flood Event as a comparison to the flood event of October – November 2001. The findings of this report are outlined below:-
4.4.1 Review of recommendations of the 1998 Flood Reports
The report indicated that the 1998 flooding in Portland was greatly amplified because of:
1) Extensive debris blocking hydraulic structures and reducing the conveyance capacity of the
natural and manmade channels. The debris resulted from landslide and the remains from the logging activities in the upper catchments.
2) Encroachment of Floodway and floodplains. 3) Faulty drainage and other hydraulic structural design and construction
The present Oct-Nov 2001 flooding was induced by much more intense rainfall with higher return periods than the previous floods. Rainfall intensity gauge at Bellevue in Portland recorded 622mm or 24.5 inches of

10
rain in 24hrs on 29/10. Highest intensity was 96mm (3.78 inch) in one hour. Comparisons with existing rainfall frequencies for nearby stations showed that this far exceeded a 50-year event. The flood hazard was again amplified by the very same factors that existed during the 98 floods and very little was done to reduce vulnerability and exposure (See Appendix 1 outlines the Contents of the 1998 Portland Flood Report). 4.5 FACTORS CAUSING LANDSLIDES Landslides were reported in the parishes mentioned already in this report. These landslides were triggered by the heavy rains, which saturated the soils. In the parish of Portland areas affected are located within 4 watershed management units namely
• Swift River, Spanish River, Rio Grande, Pencar These watershed units receive the highest rainfall in the country. The geology of the area coupled with the heavy torrential rains and weather systems greatly impacted the area. 4.6 AREAS AFFECTED BY LANDSLIDES Swift River Watershed Management Unit Portland
• Rivers - Swift River and its tributaries the Back River and Bantama. • Communities affected within this watershed Swift River, Bloomfield, Chelsea, Shirley Castle,
Shrewsbury, Fruitful Vale and Grants Gate. • Damage was due to landslides, flooding and deposition of debris. Sand and rubble (river shingle) up
to 3 m high was deposited throughout the community including the interior of buildings and burying parked vehicles. A massive landslide at Grants Gate covered four houses.
Spanish River Watershed Management Unit
• River and tributaries - Spanish River and its tributaries the Mabess River • Communities affected - Chepstowe, Claverty Cottage, Bangor Ridge, Bybrook and Skibo with
Bybrook being the most severely affected. Mabess River brought down an excessive amount of soil and other debris some 2-3.5 m high depositing this material on the main road and in buildings along it. The river doubled its normal width sweeping away land(for example the Anglican Church and the burial plot behind the church).
• Damage - Several homes were destroyed by floodwaters and debris, the road network was affected by landslides.
Rio Grande Watershed Management Unit
• River: - Rio Grande and its tributaries the Back Rio Grande and Sandy River
• Communities affected - Berridale, Grants Level and Fellowship. Pencar - Buff Bay Watershed Management Unit Rivers - Dry River, White River Landslides of varying sizes occurred at Stanton, Tranquillity, Belvedere and Mt. Vernon
• Portland Shirley Castle, Toms River, Bybrook, Bloomfield, Anns Delight, Bangor Ridge, Chepstow, St. Bernard Bellevue, Berwick Spring, Clifton Hill.
• Kingston and St. Andrew - Hermitage, Rose Hall, Mount Airy, Golden Spring, Friendship, Florence, Cavaliers, Lawrence Tavern Craig Hill Shooters Hill Junction Road
• St. Mary - Broadgate – Georgia Road in vicinity of Westmoreland Bridge, Cool Spring – Dressikie, Mount Rose – Comfort Valley, Scotts Hall/Ireland Rock River
• St. Ann - Lime Hall - Lumsden • St. Elizabeth - Red Ground
Houses, roads, crops and farmland were affected in this management unit. In Buff Bay blocked drains led to flooding of the town. The river overflowed its banks scouring the roadway at Enfield and washing away livestock and agricultural crops. The river eroded its banks washing away large acreages of land at Craig

11
Mill (See Appendix 2 Conclusion and Recommendations from NEPA Report Oct – Nov 2001 Flood Report) 5.0 ECONOMIC SITUATION IN THE COUNTRY 5.1 Economic Impact Flooding landslides and debris flows produce a net work of inter-related impacts which span many sectors of the economy. The damage impact can be listed as economic, environmental and social. 5.2 SECTOR DAMAGE The agricultural sector is one of the major foundations to support growth in the economy. the rains of october 29 – November 5
th had again significantly affected this sector with losses totalling $533,200,108. 00
1910.9 hectares of crops were damaged. The total number of farmers that were affected total 12 829 with the highest numbers in Portland, St. Andrew, and St. Elizabeth. It must be noted however that St. Elizabeth was not highlighted as one of the parishes seriously affected from he server weather. Table: 3 Showing Agricultural Losses from Oct- Nov Flood Rains 2001
Parish Crop Loss Ha
Value Ja$ Livestock
Value Soil Con.
Value Ja$
Roads km
Value Remarks farmers affected
Portland
355.0 38,800,000 26,500 18,250,000 4,000 ch
4.800,000
94.6 3,300
St. Mary 103.1 43,638,200
9,825 2,916,000
35.2 15,300, 000
1,054
St. Catherine
51.0 5,020,000 6,360 541,700
13.2
16,500, 000
650
St. Thomas
140.8 15, 193, 500
- 1,142,700 50 3,350,000 1,099
St. Ann 86.4 9,406,000 2,871 183,000 15.7 26,000,000 688 St. Andrew
267.0 135,100,000
944 1,150,000 42.8 2,455,000
3,000
Westmoreland
78.5 12,905,000 4,270 64.3 636
Hanover 67.0 11,165,000
5,107 1,433,000 19.4 14,410,000 750
St. Elizabeth
516.8 55,195,243 1,930 1,344,000 26.3 23,000,000 1,449
Clarendon
62.5 13,101,765 3,695 815,000 6 1,315,000
Manchester
34.7 1,584,000 - 33.7 24,000,000 541
St. James
83.0 21,324,000 - 1,011,000 562
TOTAL 1,910.9 375,637,708
64, 605 28,421, 400
4,000 CH
4,800,000
395.2 km
124,341,000
12628
Source: RADA 2001

12
CROP ANALYSIS
Figure:1 Livestock Analysis
Figure: 2
Crop Losses to Agricultural SectoCrop Losses to Agricultural SectoCrop Losses to Agricultural SectoCrop Losses to Agricultural Sectorrrr
St . Cat her ine
3%
St . Elizabet h
28%
Clarendon
3%
Manchest er
2% St . James
4% Port land
19%
St . Mary
6%
St . Thomas
8%St . Ann
5%St . Andrew
14%
Westmoreland
4%
Hanover
4%
Port land St . Mary St . Cat her ine St . Thomas St . Ann St . Andrew West moreland Hanover
St . Elizabet h Clarendon Manchest er St . James
Losses in Livestock
Port land
43%
St . Mary
16%
St . Cat her ine
10%
St . Thomas
5%
St . Ann
2%
St . Andrew
7%
West moreland
0%
Hanover
8%
St . Elizabet h
3%
Clarendon
6%St . James
0%
Manchest er
0%
Port land St . Mary St . Cat herine St . Thomas St . Ann St . Andrew West moreland
Hanover St . Elizabet h Clarendon Manchest er St . James

13
Figure: 3 5.3 PHYSICAL INFRASTRUCTURE 5.3.1 ROADS, BRIDGES, DRAINS, AND GULLIES The physical infrastructure was severely affected as a result of the Rains of October – November 2001. This sector received the most extensive damage through all the parishes that were affected. The major damage that affected the road network include:
1. Roads affected directly by landslides 2. Roads significantly eroded 3. Drain walls to be repaired 4. Damage to bridges 5. Damage to flood control works and gullies.
The cost for rehabilitation of roads, bridges gullies that were damaged is estimated at J$1,493,376,408. The information below was taken from a report that was prepared by the National Works agency which summarizes the damage done to the Main and Parish Council road network as well as the damage done to bridges, sea defense works, river training works, drainage structures and gullies. 5.3.2 Roads Affected by Land Slips/Flooding etc. Approximately 241 main roads and over 200 PC roads were affected by landslides, and flooding. The total costs to re-open the roads affected by slippage and flooding is estimated at $13.18 million dollars.
3,300
1,054
650
1,099
688
3,000
636
750
1,449
0
541
562
0 500 1,000 1,500 2,000 2,500 3,000 3,500
Farmers affected
Fa
rme
rs A
ffe
cte
d
Pa
ris
he
s
Farmers Affected Rains October 29th - November 5th 2001St. James
Manchester
Clarendon
St. Elizabeth
Hanover
Westmoreland
St. Andrew
St. Ann
St. Thomas
St. Catherine
St. Mary
Portland

14
5.3.3 Roads Significantly Eroded/Drains/Walls Repaired Required A number of roads were severely affected by scouring of the existing surface as well as damage to the drainage infrastructure and retaining walls. The costs associated with the rehabilitation of these roads by parish is shown below: Table: 4 Showing Costs to Rehabilitate Roads Figure: 4 Cost to Rehabilitate Roads by Parish
Parish Main Roads Rehabilitation
PC Roads Total
St. Mary 149,039,500 105,624,114 St. Andrew 40,622,000 67,605,739 Portland 88,417,000 108,110,939 St. Catherine 51,010,000 53,880,741 St. Ann 30,960,000 44,417,197 St. Thomas 25,208,000 14,395,757 Trelawny 7,700,000 14,198,207 St. James 42,250,000 25,810,065 Clarendon 9,432,000 32,784,730 Westmoreland 1,860,569 24,326,381 Manchester 2,000,000 31,690,105 St. Elizabeth 2,000,000 25,630,807 Hanover 4,000,000 15,085,587 Kingston 25,044,170 Total 479,544,039 563,560,369
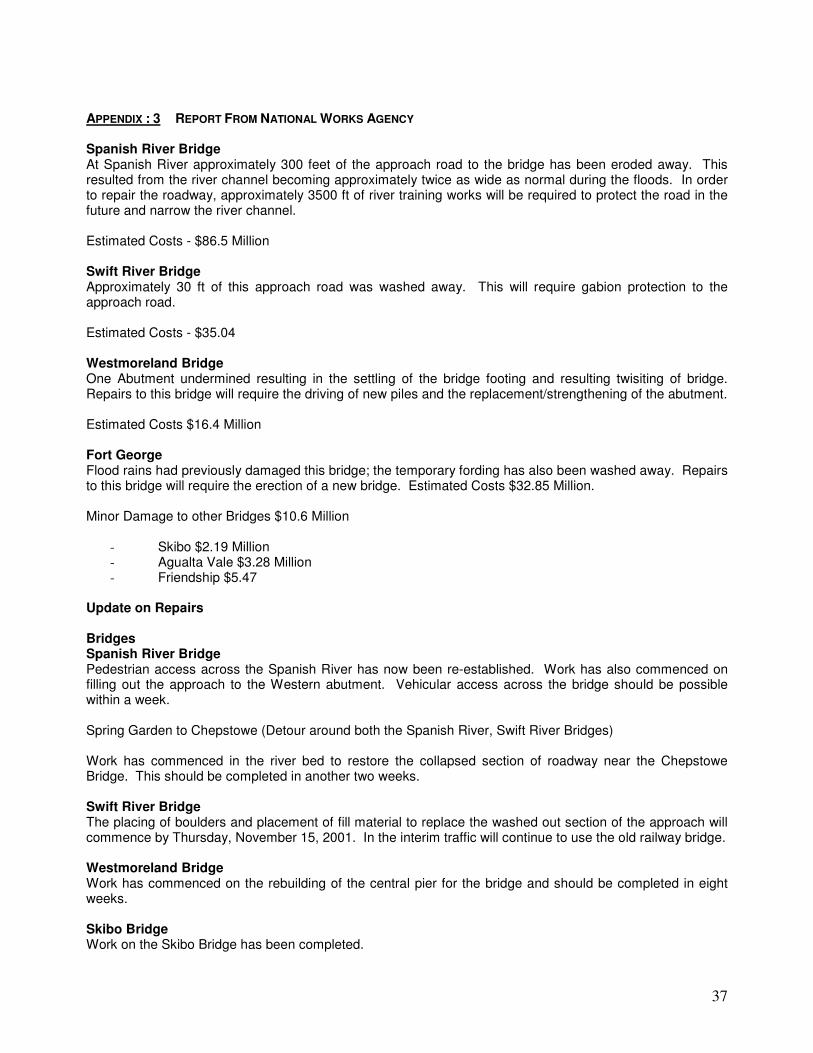
5.3.4 Bridges As a result of the flood rains 6 bridges were affected, the total damage to these bridges is approximately: $181 Million Dollars. The major bridge repairs are listed below: Bridges Damage Spanish River Bridge Estimated Costs - $86.5 Million Swift River Bridge Estimated Costs - $35.04 Westmoreland Bridge Estimated Costs $16.4 Million Fort George Estimated Costs $32.85 Million Minor Damage to other Bridges $10.6 Million
• Skibo $2.19 Million • Agualta Vale $3.28 Million • Friendship $5.47
(See Appendix: 3 Detailed Report From NWA) 5.3.5 Flood Control Works/Gullys As a result of the alluvial nature of our embankments extensive damage was done as a result of rivers overflowing their banks or changing course. The areas affected were primarily in Portland and St. Mary. The total damage done is $220 Million. A number of major gullies have also been damaged primarily in the corporate area the total required to repair these is approximately $35 Million. 5.3.6 Summary The following table summarizes the overall damage to the infrastructure:

15
Table: 5 Summary Of Infrastructure Rehabilitation Costs Figure :5 Summary of infrastructure Damage
Activity Main Road Rehabilitation P.C. Road Rehabilitation Bridges River Training Works Including Critical Repairs Cost to reopen Roads
Total Costs J$ 479,544,039 563,560,369 181,770,000 255,320,000 13,182,000
Total 1,493,376,408 5.4 UTILITIES
5.4.1 WATER REPORTS FROM THE NATIONAL WATER COMMISION REVEALED THAT THE FOLLOWING SYSTEMS IN THE
VARIOUS PARISHES WERE DAMAGED. THIS CAN BE SEEN IN TALBE BELOW. THE TOTAL COSTS OF
RESTORATION OF SYSTEM TO DATE TOTALLED $95M. ASSESSMENT OF THE YALLAS PIPE LINE IS STILL
ONGOING HOWEVER THE DAMAGE TOTALED $25M
Table: 6 NWC Damage to Facilities October – November Rains 2001
PARISH WATER SUPPLIES DAMAGES Damage Costs
Portland Shirley Castle, Claverty Cottage, Yhanside Bybrook/Skibo Bangor Ridge Black Hill Lennox/Orange Bay Orange Hill/Chewstowe New Eden Claverty to Clifton Hill Gap/Smithfield Happy Grove to Belmont Packie River to Eddingham Road to Fairy Hill Beach Foundout to Barnett
St. Mary
St. Catherine St. Thomas St. Ann St. Andrew Westmoreland Hanover
St. Elizabeth Clarendon Pipes leading from pump facilities 330,000.00 Manchester St. James Source: NWC 2001
5.4.2 Electricity
Reports from the Jamaica Public Service (JPS Co) indicate that their systems sustained damages estimated at$6.8 Million. The break down of the damages cost reflected approximately $1.2 M in damage to their systems and a cost of $5.6M to restore and relocate lines. Some of the damage was as a result of burnt poles due to lightening and erosion.
5.4.3 Telephone

16
Over the period of flooding, October – November 2001, Cable and Wireless reported damage to the telephone system totalling $537,527.00. The damage to exchanges and locations is highlighted in table below.
Table: 7 PLANT AFFECTED BY FLOOD RAINS – NER/WER, OCTOBER 2001
EXCHANGE LOCATION DEFECT CORRECTION STATUS OF WORK
NO. OF CUSTOMERS AFFECTED
ESTIMATED COST
Discovery Bay
Rio Bueno Bridge
Pole and Push Brace Dislocated
Reset Pole and Push Brace
Completed None $ 3,524.00
Runaway Bay
Main Road/Exchange Road Intersection
Damaged Cables
Replace Damaged Cables
Temporary Restoration Effected
45 $400,000.00
Claremont Higgin Town Pole washed out
Pole Relocated/Replaced
Completed None $ 16,773.45
Tower Main Road – Rio Nuevo – Gayle
Trees fell on Cable
Replaced Broken Cable
Completed None $ 65, 726.54
Ocho Rios Dunn’s River Main Road
Poles washed out
Two poles were replaced
Completed None $ 30,299.55
Highgate Heywood Hall
Dislocated Guy
Replace guy pole
To be completed by 16/11/01
None $ 3,524.00
Belfield 3 poles partially washed out
Poles to be replanted
To be completed by 16/11/01
None $11,000.00
Port Antonio Main road between Orange Bay and St. Margaret’s Bay
Trees fell on the cable
Trees cut and area cleared
Completed None $10,000.00
TOTAL
$540,847.54

17
Table: 8 ISSUES ASSOCIATED WITH HURRICANE MICHELLE
EXCH LOCATION ISSUE ACTION STATUS COST YAL Yallahs
Fording Ducts and cable washed out across fording, 394 disruptions
Option 1 recovery plan in progress. Restoration expected by 11/11/01 if conditions are favourable JO# 1149934 refers.
Temp restoration completed 12/11/01
Temp Repairs = $450,000 Permanent Restoration Est. = $3,700,000
SHL Tom’s River to Castleton
Tom’s River to Castleton. Fibre and dist/cables down. Pole line rehab required
Fibre and distribution cable restored. Rehab of pole line in progress. JO# 6149947 refers.
Completed $150,000
MNA Lindos Gap Three poles and cables down. Affecting 400 pr E/S and 100 pr D/S
Re-instate plant Completed Charges booked to Mntc. Approx. $50,000
SHL Lawrence Tavern
Three poles and cables down
Re-instate plant Completed Charges booked to Mntc. Approx. $10,000
MOR Amity Hall and Spring Gardens, St. Thomas
Trees fallen on fibre cable
Re-instate plant Completed Charges booked to Mntc. Approx. $5,000
WSH Washington Blvd vicinity of Coreville Gardens
Pole wash out. Cable down.
Re-instate plant Completed Charges booked to Mntc. Approx. $50,000
SHL Cavaliers Landslide. Cable down 200 + 50 + 10 prs.
Re-instate plant JO#6149941 refers.
Completed $70,000
SHL Airy Castle Road
Cable damaged 260m 10 prs + 90m 50 pr + 85m 100pr damaged
Re-instate plant JO #6144048 refers.
Completed $75,000
5.5 Transportation
With the event of October – November 2001, the transport linkage especially with the affected parishes of Portland and St. Mary were severely affected. Many roads were rendered impassible. Many of the communities were affected and without alternate access routes. These communities possess a strong agricultural and eco tourism base, the ability or inability to move people and goods resulted in economic losses. In short people and goods were stranded, hence limiting the function of the income generating sources and creating a loss of foreign exchange.

18
5.6 COMMERCE AND TOURISM IN PORTLAND APPROXIMATELY 210 RAFTS WERE LOST WHICH TOTALLED $420,000.00 IN DAMAGES. OTHER
PROPERTY LOSSES ARE STILL BEING ASSESSED. 5.7 SOCIAL INFRASTRUCTURE
5.7.1 Social Infrastructure and Impacts
Every community has as some of its most significant development facilities social and physical (engineering) infrastructure. The social infrastructure seeks to develop the personality of the man and thereby enhance his inter-personal relationship, morals, ethics, and integrity. Social infrastructure include: homes, churches, schools, health services, police stations, post offices and in the case of disasters shelters. 5.7.2 EDUCATIONAL FACILITIES
Impact On Educational Institutions Island wide The severe flooding experienced in the parishes of Portland and St. Mary and to a lesser extent in other northern and western parishes impacted negatively upon the ability of the educational institutions to function normally as in many cases they were inaccessible to vehicular traffic. Most of the damage to schools which were already in poor condition was made worse as the already porous roofs were made more so by the heavy rainfall. Debris was deposited on some of the school properties and soil erosion was evident in a number of cases. Provisions have been put in place to allow the students who were affected and unable to attend school to be temporally taught at the nearest accessible high school. This has put a strain on existing infrastructure and has resulted in the need for additional furniture at the relevant schools, that were already suffering a shortage of student’s furniture. The schools that have opened their doors to the affected students are:
• Annotto Bay High, St. Mary High, St. Mary Technical • Marymount High, Buff Bay High
The estimated cost of remedial work is Twenty Million Dollars ($20,000,000.00) Four hundred (400) students desks and chairs are required at a cost of ($1,250,000.00). If any relocation of affected persons in Portland is carried out a review of the need for school places in the affected areas will need to be done to determine any future development projects. Table: 9 Showing type of Damage and losses Oct. – Nov. 2001 Rains NAME OF SCHOOL
PARISH
RURAL
URBAN
ESTIMATED COST
TYPE OF DAMAGE
Belvedere All Age
Portland
*
500,000
Electrical
Buff Bay Primary
Portland
* 1,500,000 Roofing and Electrical
Nonsuch All Age
Portland
* 300,000 Latrines
Windsor Forest Primary
Portland
* 600,000 Latrines
Windsor Castle All Age
Portland
* 1,500,000 Latrines and Roofing
Sub-Total 4,400,000 Annotto Bay St. * 1,000,000 Sewage disposal and roofing

19
NAME OF SCHOOL
PARISH
RURAL
URBAN
ESTIMATED COST
TYPE OF DAMAGE
Primary Mary Brainard All Age
St. Mary
* 1,200,000 Land Slippage Retaining Wall
Bromley Primary
St. Mary
* 200,000 Roofing
Islington High St. Mary
* 900,000 Roofing
Ramble All Age
St. Mary
* 400,000 Roofing
Robins Bay All Age
St. Mary
* 900,000 Roofing
Rose Bank Primary
St. Mary
* 300,000 Roofing
St. Mary High St. Mary
* 5,000,000 Land Slippage Retaining Wall and Sewage Disposal System
Woodside All Age
St. Mary
* 600,000 Roofing
Sub-Total 10,200,000 Duckenfield Primary
St. Thomas
* 1,250,000 Roofing
Hayfield All Age
St. Thomas
* 350,000 Roofing
Wilmington All Age
St. Thomas
* 300,000 Roofing
Sub-Total 1,900,000
Cascade All Age
St. Ann * 300,000 Roofing
Walkerswood All Age
St. Ann * 700,000 Roofing
Sub-Total 1,000,000 Hampden Primary
Trelawny
* 300,000 Roofing
Warsop All Age
Trelawny
* 500,000 Roofing
Sub-Total 800,000 Johns Hall St.
James * 300,000 Latrines
Salters Hill All Age
St. James
* 700,000 Roofing
Sub-Total 1,000,000 Mt. Grace Prim and Jnr High
Westmoreland
* 700,000 Roofing
New Castle All Age
Westmoreland
* 900,000 Roofing
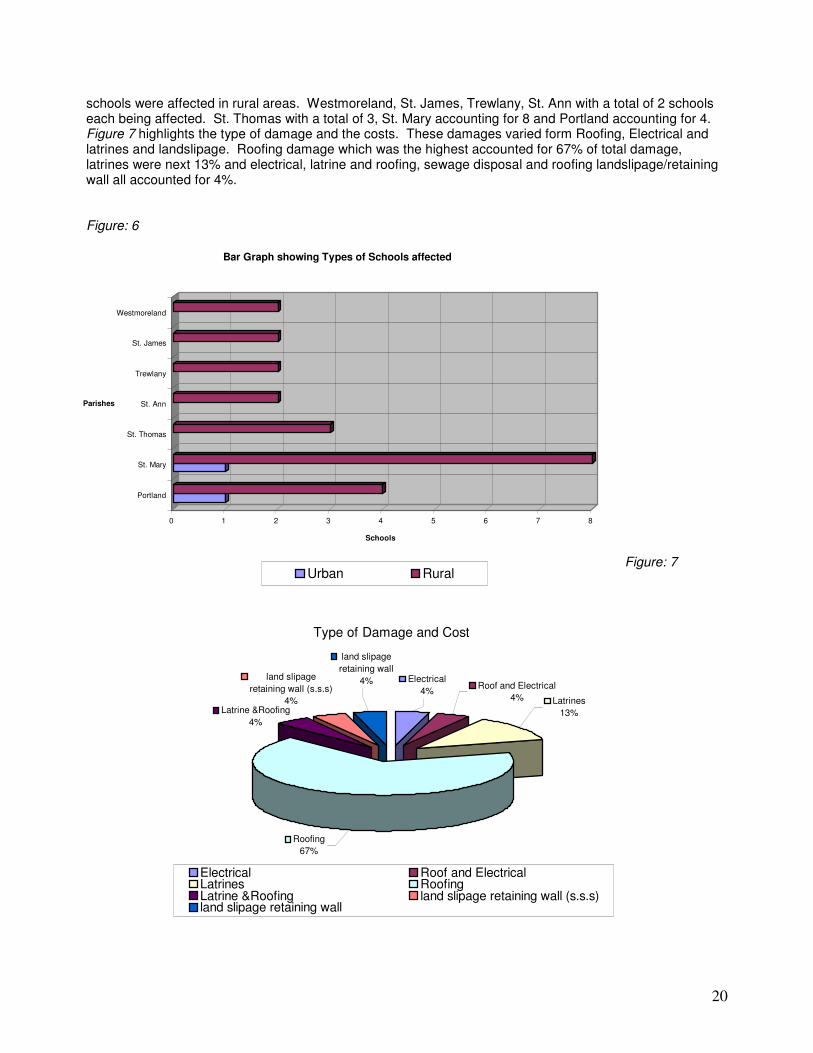
Sub-Total 1,600,000 Figure 6 below shows the number of schools that were affected in the various parishes in both urban and rural areas. A total of two schools were affected in the urban areas of St. Mary and Portland, while 23
20
schools were affected in rural areas. Westmoreland, St. James, Trewlany, St. Ann with a total of 2 schools each being affected. St. Thomas with a total of 3, St. Mary accounting for 8 and Portland accounting for 4. Figure 7 highlights the type of damage and the costs. These damages varied form Roofing, Electrical and latrines and landslipage. Roofing damage which was the highest accounted for 67% of total damage, latrines were next 13% and electrical, latrine and roofing, sewage disposal and roofing landslipage/retaining wall all accounted for 4%. Figure: 6
Figure: 7
0 1 2 3 4 5 6 7 8
Schools
Portland
St. Mary
St. Thomas
St. Ann
Trewlany
St. James
Westmoreland
Parishes
Bar Graph showing Types of Schools affected
Urban Rural
Type of Damage and Cost
land slipage
retaining wall (s.s.s)
4%Latrine &Roofing
4%
land slipage
retaining wall
4% Electrical
4%Roof and Electrical
4% Latrines
13%
Roofing
67%
Electrical Roof and ElectricalLatrines RoofingLatrine &Roofing land slipage retaining wall (s.s.s)land slipage retaining wall

21
Figure:
8 Summa
ry of total damage to educational institutions is highlighted in figure 8 above. Both summary and figure highlights St. Mary as the parish with the highest cost in this sector. SUMMARY PORTLAND 4,400,000 ST. MARY 10,200,000 ST. THOMAS 1,900,000 ST. ANN 1,000,000 TRELAWNY 800,000 ST. JAMES 1,000,000 WESTMORELAND 1,600,000 Grand Total 20,900,000 TOTAL ESTIMATE = $20,900,000
5.8 SOCIAL AND PSYCHOLOGICAL IMPACTS 5.8.1 Overview Vulnerability. Portland has an approximate population of 790,400 persons (Survey of Living Conditions 1999) of which approximately 42% are children (below 18 years). 17 communities are located in west Portland. Most children are from low-income families in rural communities whose farming activities provide primary income for the families. 5.8.2 Prime Disaster Areas The areas mainly affected by the recent floods were inland/interior and one community on the coast (Spring Garden). In total approximately 10 to 17 communities were hard hit see Map 1:
1. Skibo 2. Bybrook 3. Hans Delight
0.00
2,000,000.00
4,000,000.00
6,000,000.00
8,000,000.00
10,000,000.00
12,000,000.00
Cost in J$
Portland St. Mary St. Thomas St. Ann Trewlany St. James Westmoreland
Parishes
Total Damage Costs for Educational Facilities by Parishes Affected

22
4. Barracks Spring 5. Carlton 6. Claverty 7. Chepstowe 8. Belevdere 9. Bangor Ridge 10. Spring Garden
5.8.3 Realities Access to the affected communities were limited and within communities many districts have been cut off from each other. Most internal roads have been demolished by the water and as a result most communities can only be accessed with high four wheel drives. 5.8.4 Access to shelter disrupted:
� Most homes have been either destroyed or are unfit for living in. � Evacuation to shelters begun on Thursday, November 1, 2001 after which those families desirous of
leaving the communities were housed at the Buff Bay Primary School for three days and four nights. Two shelters exist in Buff Bay, one at the Globe (church Mans) and the other at the Lynch Park Civic Centre. These shelters house a total of 32 adults and 56 children.
� Within shelters regular meals are provided. � Many children lost clothing (washed away, muddy, soaked) � Sheets are used to divide sleeping areas � Families range from single to eight members (one family consisting of six children and two adults) � Residents of the shelter have improvised beds consisting of ply board on blocks with mattresses
provided by relief agencies. � Access to sanitary convenience exist at both shelter
5.8.5 Access To Services Now Limited
� Disruption of education – some children within shelters are attending schools, other children within districts are not attending schools due to teachers inability to access communities. Children took canoes across the Spanish River or were taken by helicopter to school until alternate arrangements for High School children could be made. While at schools these children were/are fed by the school feeding programme. They currently wear any available clothing, not uniforms to school. Footwear is by far inappropriate for weather and books are not available.
� Disruption of regular health services – medical teams present however communities no longer have regular access to services provided by the clinics.
� Limited access to drinking water – relief agencies providing bottled water � Electricity and piped water have not yet been restored.
5.8.6 Disruption of Livelihoods Most members of the communities were peasant farmers, employed to coffee and banana farms. A significant number commuted to other communities and parishes for employment in various industries. As a result of the floods there has been great disruption to livelihood patterns:
� Goods not available at shops as many shops have been washed away and goods trucks have no access to communities
� Subsistence farming on which most communities depend as main income (animals, food stuff) washed away.
� Inability to earn due to crop destruction/devastation will have implications for ability of parents to provide for the children as well as the nutrition of these children.
� Psychological – many people are unable to pull themselves together and as a result counseling was provided. Many within the shelters tell horror stories of waking up and seeing water springing up

23
within yards and dwellings, many recall sites of devastation while being airlifted from their communities. Although eager to continue their lives many have expressed feelings of hopelessness.
5.8.7 Concerns For Children Within Disaster Areas
� Lack of privacy of children within shelters � Education of children within shelters – many attend school however with the very basic necessities � Education of children within communities which have been cut off – teachers unable to access
communities. � Lack of recreational opportunities – children confined to area, outside wet � With limitations now presented to livelihoods – nutritional needs of children may be at risk if proper
education of parents in alternative methods of food use and preparation is not shared. � Trauma counseling for those children affected by disaster � Uncertainty of when structured lives will resume
5.9 SOCIAL IMPACTS
5.9.1 HEALTH SECTOR Wide scale destruction and damage to water supplies, houses and pit latrines, inadequate solid waste management, pooling of water and the lack of road access to some communities, place the affected populations at high risk for diseases and illnesses. The issues that contribute to the deterioration of environmental health need to be addressed as a priority to avert disease outbreaks. Report From the Ministry health revealed that the priority areas for the Health Sector include:-
Service Delivery Water Supply and Quality Waste Water Disposal Solid Waste Disposal Vector Control Public Education on Health Issues Health Sector Needs Assessment and Budget International Collaboration MOH Direction and Coordination
Damage totaled $ 53, 567, 000.00 J $. (Appendix: 5 Highlights health Sector needs Assessment and Recommendations).
1. Service Delivery
Facilities Over seventy five percent (75%) of the health facilities islandwide continue to leak due to faulty roofs. The Primary Care facilities are the worse affected. Flooding occurred at fifteen percent (15%) of health facilities. Damage occurred at the Swift River Health Centre, Portland with silt and debris surrounding and entering it and the fence at the Olympic Gardens Health Centre, KSA was damaged by a falling tree. Efforts must be made to effect repairs to these facilities and correct the poor drainage systems. Services

24
All services were maintained at ninety-five percent (95%) of the facilities. In some cases there was a reduction in the scope of services due to non-attendance by staff and patients. Two facilities – the Fruitful Vale Health Centre in Portland and the Annotto Bay hospital – were used as shelters for short periods. Services are suspended at four Health Centres in Portland: - Swift River (as above) – relocated to Hope Bay - Cascade, Spring Hill and Bangor Ridge – inaccessible. There are no alternate facilities.
Once a week airlifts of staff will be requested.
Transportation
Field work was limited by a lack of four (4) wheel drive vehicles, especially in Portland. Helicopter transfer of critically ill patients will increase until the road network is restored.
Surveillance Disease surveillance activities have been heightened in all parishes. There were no reports of increased incidence of any disease resulting from this event.
Shelters
At 2001/11/04, four (4) shelters remain open in Portland with 107 occupants and one (1) in Annotto Bay, St. Mary with 157 occupants. There are no immediate health concerns.
2. Water Supply and Quality
Water quality remains poor in many areas and analysis of samples was limited by the lack of water quality testing kits. The NWC was advised to liaise closely with the Public Health Departments. Parish Councils lack the resources to effectively restore their supplies. The MOH and MOWH are working to increase the storage capacity of communities and households. The MOH and Health Departments have implemented a public education programme on “Making Water Safe”, by boiling or using household bleach.
3. Waste Water Disposal
The majority of persons in the affected areas utilize pit latrines. Community surveys reveal:
� Portland – 118 destroyed and 91 damaged. � St. Mary – 410 destroyed (Nov. to date 2001)
Replacement must be treated as a priority, especially in the typhoid endemic areas.
4. Solid Waste Disposal
Collection systems, in particular in Portland and St. Mary, were limited by reduced road access and excessive deposits of debris. The worst affected areas in Portland were not previously served by the public collection system. Special initiatives will have to be implemented and monitored. The effects of inadequate solid waste disposal to increased breeding of vectors – mosquitos, rodents and flies – require an urgent solution.
5. Vector Control

25
Health Departments are constrained by the lack of an on-going comprehensive programme, while the island remains on alert for the West Nile virus and dengue and dengue haemorrhagic fevers. Excessive pools of stagnant water, uncollected garbage and the presence of raw sewage in some areas are cause for concern. Parish health teams will need resources to address these issues and avert disease outbreaks.
6. Public Education on Health Issues An initial one (1) month programme for “Making Water Safe” has been implemented. This will be followed by programmes for other environmental health issues.
7. Health Sector Needs Assessment and Budget
An updated needs assessment and budget, totaling J$53, 567, 000.00 were prepared on November 06. An additional three hundred and fifty (350) pit latrines were added, based on assessments received from St. Mary.
Cabinet has approved an initial J$10M for the health sector. 8. International Collaboration
PAHO, Barbados sent one (1) officer to Jamaica from November 03-06 to gather information for the preparation of a proposal for funding from international donors. The MOH facilitated this process including transportation to Portland. The ODPEM has forwarded the health sector needs assessment and budget to the international donor community in Jamaica.
9. MOH Direction and Coordination
Direction and coordination activities continue from the Emergency, Disaster Management and Special Services Branch. Contact has been maintained with the parishes and regions and requested reports received. Damage Assessment continue and two (2) needs assessment reports have been prepared. Assistance was provided in the preparation of a Cabinet note on November 02, 2001. Coordination meetings were attended at the ODPEM, including on November 05. No attempt was made to make the MOH EOC at the Bustamante Hospital for Children operational on November 03 and 04, as heavy rainfall and flooding in Kingston made transfer of equipment, furniture and supplies impossible. The Directors, EDMSSB and Health Service Planning and Integration initiated contact with all regions and received reports at home. The Director, EDMSSB responded to all emergency calls from the NEOC at the ODPEM, from home.
5.10 WELFARE AND RELIEF 5.10.1 PERSONS AFFECTED A total of approximately 1084 families were affected by the flood event (Source Office of Disaster Preparedness and Emergency Management and Ministry of Labour Social Security 2001). Approximately 3252 persons were affected this is using 3 as the approximate figure to give the total population affected. A break down from the affected parishes highlights

26
• Portland 220 families affected approx. 660 persons with 277 children • St. Mary 422 Families • St. Ann 20 families • St. Catherine 22 Families • Kingston & St. Andrew 400 families
Its interesting to note that the percentage of the children affected in Portland is fairly high as that population accounts for 41% of the total person affected. Persons Affected also received blankets and mattresses as part of the assistance package. This assessment was carried out on a house to house basis. Total Cost as of November 2001 $497,919.26
TABLE: 10 SUMMARY OF WELFARE ASSISTANCE
Date
Number Families Affected
Approximately Number of Persons Affected
Assistance
January, 1998
1084
3252
$407,919.26
SOURCE: MLSS 2001 In total 10 shelters were opened to accommodate the affected persons these include:-
Portland – (4) Fruitful Vale All Age, Swift river SDA, Buff Bay Independent Church, Lynch Park Community Centre. St. Mary – (3) Enfield Community Centre, Enfield Primary School, Enfield Baptise Church. St. Ann - none St. Catherine - None Kingston & St. Andrew (3) New Heaven and Duhaney Park Area.
Much of the damage reported were that of household and personal effects. While others reported damages losses to crops and livestock and damage and/or destruction to houses.

27
5.11 SUMMARY OF LOSSES TABLE: 11 SUMMARY OF DAMAGE LOSSES October – November 2001 FLOOD EVENT
SECTOR COST IN JAMAICAN DOLLARS ($)
Agriculture
• Crop losses 375, 637, 708.00 • Livestock Losses 28, 421, 400.00 • Soil Conservation 4, 800, 000.00 • Farm Roads 124, 341, 000.00 ------------------------
533, 200, 108.00 Utilities
• Water 95, 000,000.00 • 25,000,000.00 • Electricity 6,800,000.00 • Telephone 537,527.00 ----------------------- 127, 337, 527.00 Physical Infrastructure
• Main roads 479, 544, 039.00 • PC roads 563, 560, 369.00 • Bridges 181, 770,000.00 • River training works 255, 320, 000.00 • Cost to reopen 13,182,000.00
------------------------------ 1, 493, 376, 408.00
Housing Social Infrastructure
• Welfare and relief 497,919.26 • Health 53, 567,000.00 • Education 20, 900,000.00 ------------------------- 74, 964,919.26 Commerce and Tourism 420,000.00
533, 200, 108.00 127, 337, 527.00 1, 493, 376, 408.00 74, 964,919.26 420,000.00
GRAND TOTAL 2,229,298,962.26
Source: ODPEM 2002. 5.11.1 SUMMARY OF DAMAGE LOSSES AND IMPLICATIONS FOR THE SECTORS The total cost of damage resulting from the flood rains is estimated a at $2,229,298,962.26 Billion Jamaican dollars. The analysis revealed that the physical infrastructure sector suffered the greatest damage. The total estimated damage was set at $1,493,376,408.00 Billion or 66.99% of the total damage to all sectors. The

28
second highest was Agriculture which accounted for 23.92%, or $533,200,108.00 million in damage. The pie chart below shows total damage by sector.
Figure 9 The damage from the rains has impacted significantly across the sectors. Within the physical infrastructure sector poor road conditions resulted in increased time spent in travelling between destinations. Losses were also rendered to industries directly affected by agriculture, this has also put a strain on the financial institutions in terms of more credit risks and capital shortfall. . It must be noted that the Agriculture and Physical Infrastructure Sector continue to be the sectors hardest hit and the money spent in rehabilitation continues to increase. In light of this closer attention needs to be placed in these sectors along with more stringent mitigation measures. The losses have caused revenue shortfall in utilities and losses in production to communities, and also a general loss of revenue to Gross Domestic Product . The social impacts although more difficult to quantify, also manifest themselves in disaster situations. In general, there was reduced quality of life in both rural and urban areas, which promote the cycle of poverty. Many residents and an increased number of children had to be counseled as trauma and stress levels increased after the disaster. Human lives were also lost. In short all the sector are vulnerable to disasters which in turn affect the economy. It is therefore becoming more evident that disaster mitigation should be a major component in the overall sector development. 6.0 RECOMMENDATIONS Overview The Damage Assessment of the severely affected parishes of St. Mary, and Portland and to a lesser extent St. Ann, Trewlany, St. Catherine Kingston and St. Andrew has highlighted that the occurrence of floods, landslides and debris flows continue to have devastating effects on our country. Heavy precipitation and severe weather has caused deaths and serious damage across the various sectors of the economy. The flood Event occurred within the latter half of the Hurricane season. It was associated with an area of disturbed weather, which fueled the formation of Hurricane Michelle. This coupled with short duration and high intensity rainfall caused the capacity of the soil to be saturated hence, giving rise to rapid runoff and thus increasing the risk of slope failures.
Pie Chart Showing Losses to Sectors
Commerce and
Tourism
0%
Social
Infrastrucutre
3%
Physical
Infrastructure
67%
Utilities
6%
Agriculture
24%
Agriculture Utilities Physical InfrastructureSocial Infrastrucutre commercea and Tourism

29
Damage to Agriculture, roads, housing and the other sectors as a result of Flooding and landslide was severe and the impact covered all sectors. The dollar losses accounted for $2,229,298,962.26 Billion dollars. This indicates that more focus needs to be placed on mitigation measures to reduce loss to life and property. Development Planning and Mitigation An accurate and timely prediction of a hazardous event can save human lives but can do very little to reduce economic losses and social disruption that can only be accomplished by measures long in advance. Therefore Mitigation measures, both structural and non-structural will have to be implemented to reduce the damage impact on the communities. Mitigation of disaster usually entails reducing the vulnerability of the elements at risk; modifying the hazard process of the site, and changing its function. Mitigation measures can have structural characteristics such as specific safety on vulnerability reduction measures in the design of new facilities, retrofitting of existing buildings. Non-structural measures concentrate on limiting landuse, use of tax incentives and risk undermining through insurance programmes. 6.1 Landslide
Landslides are caused when the forces of gravity pulls rock debris on soils down a slope. Because gravity acts on slopes landslides only occur when the stress produced by the force of gravity exceeds the resistance of the material. The range and magnitude of landslide is so great that general instructions on how to prevent or halt them cannot be given. However, for every landslide, specific geological, morphological, soil-mechanic investigations should be carried out. And landslide hazard maps prepared for vulnerable communities. Hopefully these investigations may be able to help us determine what building measures might be able to be taken to protect buildings and infrastructure.
The effects of landslides on buildings depends on the size of the displacement and the static type of structure. Therefore structures which are vulnerable to displacement of their foundations, such as multi-story buildings and shells, etc should not be erected in areas where the possibility of landslides would occur. Slope Reduction – Reduction of a slide potential of rock material can be done by reducing the steepness of the slope by adding material at the base of the slope. The type of material and its porosity potential that would be added to the base should have the qualities where it would be able to channel water that would otherwise collect and trigger more land movements.
Retaining Structures – Construction of gabion baskets would stabilize the soil. • Weight of the formation material, • Gradient of the slope and • The population density would all play a major part in the importance of the construction of these structures.
Weight of the formation material – The weight of the retaining wall should be able to accommodate the weight of the soil material that has the potential to become unstable.
Gradient of Slope – The intentions to stabilize the slope becomes more difficult with increase slope gradient. The dimensions of the wall that is the length and width should be adjusted depending on the steepness of the slope.
Population Density – Priority should be considered when constructing gabion baskets in populated areas. Densely populated areas where fatal accidents from landslide may occur would take priority over an area with little or no population.

30
Main roads that link communities should take priority, examples can be seen in Rose Mount, St. Mary and Swift River main road, Portland.
Planting Vegetation – Planting vegetation on slopes that shows bare rock can also reduce the amount of landslides. This vegetation should not be agricultural for them to be removed, but should be permanently planted. Choose vegetation that has high-density roots and branches and would not attract persons in the area to cut down and use for domestic purposes.
Recognizing the hazard before it becomes disastrous is also important. From past observations and research, sedimentary rocks especially the Richmond Formation in these northern parishes have been susceptible to landslides. Recognizing this hazard and monitoring where persons settle can prevent fatal incidences from occurring. Areas where there are continuous reports of landslides should not be allowed to be over-populated.
Squatters must be monitored and permanently removed/relocated as soon as authorities know of their intentions. This being a delicate matter, landslide hazard maps should be interpreted and displayed to them when enforcing the law.
Residence, especially in Portland, should be educated about hazardous areas, flood prone and landslide prone areas, when constructing their homes. The Town Planning Department should be involved in advising home owners when constructing their homes.
6.2 FLOODING
Flooding is caused by persistent and intense rainfall that exceeds the absorptive capacity of soil and the flow capacity of natural or man- made watercourses. This causes the watercourse to overflow its banks onto adjacent lands.
In areas with steep topography and small drainage basins such as Trelawny, floods occur rapidly and rise to a relatively high peak. In the areas affected damage was severe because of the high flow and the sudden onset of the flood. There were general characteristics of the areas that were affected by the flooding:
1. Residents live next to a gully or a river. 2. Squatter settlements. 3. Inadequate or lack of drainage especially on the sides of roads. 4. Construction on unstable slopes. 5. Persons living in swampy lands.
Other factors that caused flooding:
1. Deforestation, 2. Inappropriately constructed buildings in high-risk location especially by squatters. 3. Makeshift houses on unstable slopes 4. Poor Drainage 5. Unsuitably built and poorly maintained drains 6. Poor construction and inadequate design specifications have also contributed to the flooding
(Source: 2001 DAR ODPEM). The recommendations to reduce flood damage are based on two strategies:
1. Technical protection of inundation areas using dykes, embankments grounes etc. 2. Protection of houses and buildings in the area
Technical protection of inundation areas This can take the form of channel improvements: cleaning of all watercourses to increase water flow and stabilizing of banks with gabion baskets, and elevation of houses on stilts and other

31
structural mitigative measures. The stilts must be designed to withstand the impact of floating debris and the stilt foundations need to be protected from erosion(Source: 2001 DAR ODPEM).
Protection of houses and buildings in the area This can take the form of floodproofing which gives design specifications of buildings and sometimes involves permanent relocation of residents living in flood-prone areas for example the residents of Albion Lane, St, James who live on the banks of North Gully and those of Holland Road, Trelawny; it provides low level of protection when other solutions are not available. Floodproofing has to be also put in place for road and bridges such as the Pencar River Bridge in St. Mary. Zoning which prohibits housing developments in high-risk areas is also recommended (Source: 2001 DAR ODPEM).
Education, information and training is needed especially for those who live in flood-prone areas. This will help to reduce their susceptibility to flood damage, as they will be able to make informed decisions. Encouraging flood insurance is key so that individuals will be able to pay for the damage caused by flooding instead of depending on the Government to give them financial assistance
Programme to put flood control structures in place should be embraced. This should be compiled with some assessment of the capacity of draining.
• Drains should be constructed with some forward planning, taking into consideration growing population and urbanization of the parish and should also take into account run off for different return periods.
• Drain cleaning which is currently carried out in the parish should probably be done more often in the year or at some critical peak times if a trend is noticed. It is important that debris cleared in drain cleaning be removed from the site upon cleaning to prevent material re-entering the drainage systems, especially after a heavy rain (Source: 2001 DAR ODPEM).
6.3 Vulnerability and Risk Assessments To support decision-making and forward planning, vulnerability and risk assessments should be carried out.
• It outlines the responsibilities that will be necessary in the long term for the community to recover to a pre-disaster condition.
• These assessments also seek to guide the formulation of building codes and standards for public safety and disaster awareness education programmes.
• Such assessments serve as a foundation to enable more hazard mapping, to determine areas of high risk and vulnerability.
• Vulnerability risk assessments and hazard mapping allows for zoning
This information will be useful as a planning tool to guide the development process in the parish.
6.4 Siting of Developments In terms of planning development orders are used to guide development. These are legal documents empowering the Town and Country Planning Authority, under the TCP Act 1957, to prepare and consult with the local planning Authority on development for specific areas throughout Jamaica. These documents are to regulate and control the use of land ensuring that land is not misused, and to guide the manner in which development will take place.
However one draw back to this is that development orders only cover the coast of Portland and one mile inland this is also applicable for the parish of St. Mary. For development to take place persons will have to acquire both planning and building permission. Development orders only cover coastal towns, not the interior and other areas that were affected. These areas are covered by the local building Act. This requires the Local planning Authority to inspect building plans and give advice. However, the building Act is mainly concerned with structural integrity of the building and not necessarily on location or site situation. This therefore leads to a situation where buildings and other types of development are located on sites which are highly unsuitable and hence, exposed to hazards.

32
It is therefore important that the vulnerable parishes be put within the parameters of development orders where technical assessments will be carried out to determine the optimum use of the land.
7.0 CONCLUSION Jamaica due to its global position would continue to experience severe weather conditions and systems that originate North of the island. Parishes in the north and northwestern section of the island would always be more vulnerable than parishes in the south to such systems. This factor is justified by the fact that most of the parishes in the south are protected by the rain shadow from the mountains whereas the north and northwestern parishes are not (Source: 2001 DAR ODPEM). The severity of the hazardous incidences (especially flooding) could have been reduced by the proper maintenance of the network of drains and culverts in the parishes. Residences in all of the parishes agree that the roads and drains are not being maintained. Drains need to be maintained to reduce the effect of flooding. Poor channeling of water from the roads also caused extensive road surface damage. This may be speaking to the road construction practices and the quality of work in construction. Road materials approved by engineering standards and the practice of proper engineering skills when constructing roads in Jamaica need to be enforced. The better the quality of infrastructures constructed in Jamaica the less damage they would experience during heavy rains (Source: 2001 DAR ODPEM). Further, maintenance does not only relate to the roads, gullies and drains but also the many sinkholes that are located in the parishes. These sinkholes need to be maintained either by the government or small farmers who cultivate in those areas. The government or volunteer agencies should approach people in the communities and educate them about the benefits of maintaining sinkholes. The most beneficial mitigation measure that could be initiated is the relocation of squatters and other affected persons. Vulnerability and risk assessments should be carried out in these areas if the areas are found to be hazard prone areas, plans should be put in place to relocate persons to places that are habitable. As we seek to make disaster management a part of our daily lifestyle. Efforts to strengthen Disaster Mitigation especially in the area of public education at the community level must be addressed. Finally, it is the responsibility of the government to maintain public infrastructures. The government needs to discourage persons from settling in hazardous prone areas. Appropriate habitable areas need to be determined for persons who would be relocated. These few mitigation measures would definitely be economically beneficial in future disaster management programmes (Source: 2001 DAR ODPEM).

33
References Harris N 1998. Rain Induced Slope Failures and Damage Assessment in Portland Jamaica: January 3-4, 1998 Flood Event Unpublished Mines and Geology Division Report. Harris, N. Landslip Investigation- Mt. Airy, St. Andrew. Jamaica, Engineering Geology Unit, p.13, 1984. Laing G. A, 1998. Flash Floods in Jamaica during January and March, 1988: Environmental Conditions and Mitigation. Montgomery, Carla W. Environmental Geology. USA, Wm. C. Brown Publishers,p.121,125,128,157,995. OAS. Primer on Natural Hazard management in Integrated Regional Development Planning 1991. ODPEM (Peod), 1998. Flood Report. ODPEM 1998. Report on the Cost of Damage Incurred due to Hurricane Mitch.
ODPEM, 1999. Portland Report and Damage Assessment- January – 4, 1998. Jamaica, ODPEM. Water Resources Authority, 1998. Flood Report Portland January 3-4, 1998. Atlas for Caribbean Examinations. United Kingdom, Longman Group, p.18, 1991. Parish Profiles: Portland, St. James, St. Ann, St. Catherine, Trelawny, St. Mary. Jamaica Information Services, 1991.

34
APPENDIX :1 REPORT WATER RESOURCES AUTHORITY 1998 FLOOD REPORT. The recommendations of the report if they were adopted would have resulted in reduced losses and damage. From a Hydrology and Hydraulic point of view the subset of recommendations of utmost significance are: The Flood Hazard Mapping Regulations of Flood Plain Usage Data Collection and Management Technical Guides Flood Hazard Mapping As underscored by the report these are fundamental tools in disaster preparedness, planning and mitigation. The importance of this tool is even now demonstrated in the difficulty experienced in identifying sites for relocation. Where as 3 years ago it could be very time consuming to prepare floodplain maps. Today with significant advancement in the technology facilitated by GIS based inputs, these maps can now be prepared much quicker. There is an urgent need for training, hence in the interim, required technology and training can be fast track to facilitate mapping urgently needed in the critical areas. Software = US$6,500.00 (Ja$300,000)
1
Data Collection and Management Recommendations were made for 3.7 million dollars for intensity rain gauges and water level recorders for Portland, to facilitate more effective data recording and analysis capabilities in support of flood hazard mitigation. Only 4 gauges were installed costing US$24,000 ($Ja1.1 million) (DIPECHO Project). There is a need for at least one intensity gauge in each of the watersheds to facilitate hydrological analyses and hydraulic designs data. (9 gauges for eastern Jamaica) Cost for purchase and installation US$36,000 (Ja$1.66 million) At present an additional cost of $1.4 million is required to rehabilitate hydrometric stations damaged during the Oct-Nov floods. Regulations of flood plain Usage Recommendations were made to review and adopt the draft proposed Canadian prototype of Regulations governing the use of flood plains. No one was given this responsibility. The Water Resources Authority in carrying out a review of its mandate has recognized the need to assume responsibility for development of a Flood Water Control Master Plan to include Flood Plain Mapping islandwide. This has been accepted by the MOWH and revisions to the WRA’s ACT are now being drafted. And should be finalized by March 2002. This proposed planning process should include the review and adoption Canadian Template regulation. It is recommended that directive be given by parliament for the Ministry to proceed quickly with the development of this plan. The MOWH should as a first step organize a workshop with all the stakeholders to determine the scope of the plan. Cost of workshop = U$6,000.00
1 WATER RESOURCES AUTHORITY 2001-11-28

35
Technical Guides Recommendations were made for the involvement of the WRA in the preparation of detailed guidelines and working notes illustrating appropriate standards and criteria regarding the siting, and dimensioning of buildings and hydraulic structures. Again no one was given the responsibility to ensure that this was done. It is recommended that this guideline document be an output of the Proposed Flood Water Control Master Plan.

36
APPENDIX : 2 CONCLUSIONS AND RECOMMENDATIONS - NEPA Oct – Nov Flood Report 2001 Land use in Portland is often not consistent with land capability. Soil conservation measures need to be implemented along with other physical works such as river training and management. River works need to be implemented after a thorough hydrological assessment of major rivers and tributaries is conducted. This is critical in watershed management units with known histories of flooding. In places where Groynes and Gabion Baskets have been destroyed there needs to systematic replacement of these structures to prevent destructive effects from high rainfall events. Orderly development of communities is needed with planning recommendations based on geological, geographical and environmental information. The recommendations for development need to be adhered to. Encroachment on forest areas and the resulting deforestation reduces water retention and accelerates run-off leading to flooding during high rainfall. Erosion in these areas contributes to high levels of soil in rivers during rains. This was evidenced by an aerial photo of the Spanish River and Mabess River confluence where the Mabess River ran clear while the Spanish River was brown with soil. Programmes written for short term, medium term and long-term watershed rehabilitation need to be funded so that the excessive costs associated with disasters can be avoided as far as possible. While acknowledging the limitations of the government treasury, innovative approaches to funding these programmes must be actively sought. The postulated effects of global climate change indicate an increasing number of storms and other severe weather events. These will bring large volumes of rain and high winds. As a result, high-risk areas will have to be brought to a state of readiness. International funding sources that address climate change and its effects may be one source of identifiable funding for some of these programmes. One thing is certain, watershed programmes and activities need to be funded.
37
APPENDIX : 3 REPORT FROM NATIONAL WORKS AGENCY Spanish River Bridge At Spanish River approximately 300 feet of the approach road to the bridge has been eroded away. This resulted from the river channel becoming approximately twice as wide as normal during the floods. In order to repair the roadway, approximately 3500 ft of river training works will be required to protect the road in the future and narrow the river channel. Estimated Costs - $86.5 Million Swift River Bridge Approximately 30 ft of this approach road was washed away. This will require gabion protection to the approach road. Estimated Costs - $35.04 Westmoreland Bridge One Abutment undermined resulting in the settling of the bridge footing and resulting twisiting of bridge. Repairs to this bridge will require the driving of new piles and the replacement/strengthening of the abutment. Estimated Costs $16.4 Million Fort George Flood rains had previously damaged this bridge; the temporary fording has also been washed away. Repairs to this bridge will require the erection of a new bridge. Estimated Costs $32.85 Million. Minor Damage to other Bridges $10.6 Million
- Skibo $2.19 Million - Agualta Vale $3.28 Million - Friendship $5.47
Update on Repairs Bridges Spanish River Bridge Pedestrian access across the Spanish River has now been re-established. Work has also commenced on filling out the approach to the Western abutment. Vehicular access across the bridge should be possible within a week. Spring Garden to Chepstowe (Detour around both the Spanish River, Swift River Bridges) Work has commenced in the river bed to restore the collapsed section of roadway near the Chepstowe Bridge. This should be completed in another two weeks. Swift River Bridge The placing of boulders and placement of fill material to replace the washed out section of the approach will commence by Thursday, November 15, 2001. In the interim traffic will continue to use the old railway bridge. Westmoreland Bridge Work has commenced on the rebuilding of the central pier for the bridge and should be completed in eight weeks. Skibo Bridge Work on the Skibo Bridge has been completed.

38
Major/Minor Road Rehabilitation Patching/Minor Road repairs have commenced utilizing the agency’s routine maintenance contractors, all contractors are expected to be fully mobilized within 2 weeks. Other major works will be carried out by larger road contractors who will be selected primarily from contractors now working under the National Road Rehabilitation Program. All major flood damage repairs are scheduled for completion within one year. Over 40 Front End Loaders, Backhoes, and Trucks were mobilized to carry out clearing exercises. These were drawn from the NWA fleet as well as from our Routine Maintenance contractors. Currently more than 98% of the main road network has now been re-opened to at least single lane traffic. At the time of this report the following main roads were are still impassible:
I) Buff Bay to Hope Bay – at Spanish River Bridge (Spanish River/Swift River Bridges) II) School House Corner – Spring Gardens – at Chepstowe Bridge (Failure of retaining wall) III) Chovey – Claremont – at Westmoreland Bridge
Chips Hall – Durham (Blocked by Major Landslides) Approximately 150 m of road abutting the western approach to the Spanish River Bridge near to Orange Bay was swept away. The Anns Delight Bridge was damaged. The bridge at Chepstowe which was initially unaffected became damaged in the November rains.

39
APPENDIX :4 REPORT FROM MINISTRY OF EDUCATION RE FLOODS IN PORTLAND AND ST. MARY Beyond the above costs the Ministry of Education, Youth and Culture will need funding to carry out a project at the Annotto Bay High School, to address a problem which though it may not be considered a direct result of the flooding, has been exasperated by the flood event. The school opened in September 2001 as a grade 7 to 11 school but was actually built to accommodate 405 students at grades 7 to 9. Prior to the floods the school population was over 300 but has since increased by 151. There is some feeling that a large percentage of the temporary students may remain after their schools become accessible again. The MOEY&C is currently in discussions with the World Bank about a project, (including Annotto Bay), to erect additional secondary level institutions. However the agreement is unlikely to be signed before June 2002. There is great concern as to what will be the situation at the school in September 2002 as the enrolment is likely to exceed the capacity by a great margin It has been suggested that the MOEY&C carry out the expansion project at the Annotto Bay High School through funding of its Capital A Budget. It could therefore begin the design process immediately and begin construction about mid-2002. The project is estimated to cost $50,000,000.00 of which approximately 75% would be expended in the financial year 2002-2003.

40
APPENDIX :5 HEALTH SECTOR NEEDS ASSESSMENT SEVERE WEATHER EVENT – OCTOBER 29, 2001
1. Water Quality
a) Thirty (30) Water Quality Kits HACH Test Kits 17N Ph 4.0 – 10.00 Model No. 1470/11 @J$3,600.00 J$108,000.00
b) Thirty (30) Patho Screen (Coliform) Kits
-PLW 100 mls/Model No. 2610-96 @J$2,300.00 J$ 69,000.00 Sub-Total J$177,000.00
2. Waste Water
- Five Hundred and Fifty (550) Latrines (St. Mary 60%, Portland 35%, St. Ann and Trelawny 5%)
- 100 Standard Latrines
@ J$35,000.00 J$3,500,000.00
- 400 sealed double vault pit latrines @J$100,000.00 J$40,000,000.00
- 50 latrines and shower
@J$135,000.00 J$6,750,000.00 Sub-Total J$50,250,000.00
3. Vector Control (Mosquitoes)
Programme for one (1) month - Source reduction and Larvicidal work – oil,
etc. J$100,000.00
- Twelve (12) fogging machines @ J$60,000.00 J$720,000.00
- Protective equipment
e.g. heavy duty gloves etc. J$130,000.00
- Malathion (technical grade) 20 drums @ J$70,000.00 J$1,400,00.00
- 50 x 25kg bags A-bate J$ 390,000.00
Sub-Total J$2,740,000.00
4. Public Education Programme J$400,000.00
- Making Water Safe - General Environment Health - Waste Disposal/Vector Control
TOTAL J$53, 567, 000.00

41
Recommendations
1. The issues of environmental health and the potential for disease epidemics need to be presented as a priority at the highest level and budgetary support identified.
2. Redeployment of staff and transportation needs to be considered to ensure speedy damage and
needs assessments, and the implementation and follow-up of priority work programmes.
3. Programme managers need to monitor the effects of interruptions in services, in particular Maternal and Child Health activities, and initiate corrective actions, as necessary, to ensure that goals are met.
4. The MOH needs to establish a permanent facility to ensure 24-hr capabilities and rapid response
to emergencies and disasters.
5. The Emergency, Disaster Management and Special Services Branch needs staff to be assigned on a full-time basis to cope with the on-going emergencies and disasters. This present event and preparing the nation, including the health sector, for the possibility of Anthrax, as well as the daily response activities are difficult. A seven-day week response has been required and carried out by the Branch since October 01, 2001, resulting in high levels of stress and fatigue.