Embed Size (px)
Citation preview

Dairy Reproduction Benchmarks
J.W. Smith, W.D. Gilson, L.O. Ely and W.M. GravesAnimal and Dairy Science Department

Dairy Reproduction Benchmarks UGA Cooperative Extension Bulletin 1210

UGA Cooperative Extension Bulletin 1210 Dairy Reproduction Benchmarks
Table of Contents
Introduction ...........................................................................................................................................................3Methods ..................................................................................................................................................................3Figure 1: U.S. Map Showing Four Regions .......................................................................................................3Measures of Reproductive Efficiency .................................................................................................................3Dry Period ..............................................................................................................................................................6Herd Reproduction Program ...............................................................................................................................6Recommendations .................................................................................................................................................7Summary ................................................................................................................................................................7
Tables
Table 1: Effect of Calving Interval on the Net Operating Income (Income - Expenses) of a 200-Cow Dairy Herd at Different Target Levels of Milk Production .......................................4Table 2: Loss in Net Operating Income (Income - Expenses) with Increasing Calving Interval at Different Levels of Target Milk Production ....................................................................................4Table 3: Estimated Cost per Cow per Added Day Open of Higher Calving Intervals at Different Levels of Target Milk Production..........................................................................................................5Table 4: Measures of Reproductive Efficiency for AI Herds in the Northeast Region by Herd Size ........9Table 5: Measures of Reproductive Efficiency for AI Herds in the Midsouth Region by Herd Size ......11Table 6: Measures of Reproductive Efficiency for AI Herds in the Midwest Region by Herd Size ........13Table 7: Measures of Reproductive Efficiency for AI Herds in the South Region by Herd Size .............15Table 8: Measures of Reproductive Efficiency for All Herds in the Northeast Region by Herd Size .....17Table 9: Measures of Reproductive Efficiency for All Herds in the Midsouth Region by Herd Size .....18Table 10: Measures of Reproductive Efficiency for All Herds in the Midwest Region by Herd Size .....19Table 11: Measures of Reproductive Efficiency for All Herds in the South Region by Herd Size ...........20Table 12: Average Measures of Reproductive Efficiency by Region and Production Level .....................21

Dairy Reproduction Benchmarks UGA Cooperative Extension Bulletin 1210
An abundance of information and numerous resources are available through the Dairy Records Manage-ment Systems (DRMS), Raleigh, North Carolina, for use in herd management analysis. The DHI-202 Herd
Summary Report is a valuable source of information. Herd summary data can uncover many herd management strengths and weaknesses.
The purpose of this bulletin is to provide reproduction benchmarks for Holstein herds processed by DRMS. Some examples of using and applying benchmark values are provided. This bulletin, however, should be viewed primarily as a comprehensive resource for reproduction benchmark values. These benchmarks will be useful to dairy producers, dairy managers, consultants, veterinarians and agri-business representatives as a first step in the analysis of herd management practices.
Methods
Herd Summary information was obtained from the DRMS, Raleigh, North Carolina, for Holstein herds last tested in No-vember or December, 2000. Research has shown that manage-ment variables may differ by region of the country, herd size and milk production level. Consequently, benchmark values are presented for Northeast, Midsouth, Midwest and South re-gions (Figure 1). Within regions, values are further subdivid-ed by either herd size or rolling herd average milk production. Values in all tables and graphs were limited to herds with a minimum of 25 cows. Minimum rolling herd milk production for herds included in percentile tables was 12,000 pounds. Note that all analyses and calculations are based on herd average information and not on individual cow data.
Herds using natural service sires seldom report the number of services. The result is a distortion of manyDHI reproductive parameters such as services per pregnancy. Values in this bulletin are listed for herds usingpredominately artificial insemination (AI) as well as for all herds regardless of sire usage. AI herds aredefined as those with 70 percent or more AI services with minimum services per pregnancy equal to 1.5 for both pregnant and all cows. Herds in the “all” category were not restricted by any reproductive parameter.
Statistics calculated for certain benchmark values were n, mean, standard deviation and percentile ranks.Following are definitions of these terms:
N - The number of observations (herds) included in a specific analysis. Mean - The average calculated as the sum of all observations divided by N.
Standard Deviation (SD) - A measure of the variability of the observations. The larger the SD, the more variation among the observations.
Percentile Rank - Percentiles are defined as a value such that X% falls short of the value and Y% exceeds the value. For example, if a benchmark value is at the 75th percentile, then 75 percent of the herds analyzed had values below the benchmark and 25 percent had values above the benchmark. A herd value at the 75th percentile rank is in the top 25 percent of all herds analyzed.
Measures of Reproductive Efficiency
Average days open is an overall indicator of reproductive efficiency status. Projected average days openas listed in this bulletin includes cows with breeding dates and cows without breeding dates in milk longerthan the Voluntary Waiting Period (VWP). The VWP 4 is the desired minimum number of days from calving
Figure 1. Map of United States showing four regions.
3

UGA Cooperative Extension Bulletin 1210 Dairy Reproduction Benchmarks
until first service and is selected by the producer. Calving interval is the period of time between calvings and is measured in months. The projected minimum calving interval equals Average Days Open + 280 days/30.4,where 280 days is the average length of gestation and 30.4 days is the average length of a month. The effect of calving interval on net operating income (income - expenses) to owner’s labor and management for a 200-cow dairy is shown in Table 1.
Table 1. Effect of Calving Interval on the Net Operating Income (Income - Expenses) of a 200-Cow Dairy Herd at Different Target Levels of Milk Production.
Target Herd Avg.(lbs)
Cl (mo) Actual Herd Avg.(lbs)
No. Milk Cows Net Cash Income($)
16,00013 17,538 184 66,81514 16,286 171 49,08315 15,200 160 33,725
18,00013 19,385 184 112,60814 18,000 171 91,24015 16,800 160 72,731
20,00013 21,600 184 174,43314 20,057 171 148,64915 18,720 160 126,312
22,00013 23,723 184 217,32714 22,029 171 188,47715 20,560 160 163,483
The University of Georgia cash flow dairy budget program was used to generate these comparisons. The herd size was held constant at 200 cows. The number of cows milking and dry is a function of the calving interval. Other assumptions included a 60-day dry period and no replacement rearing expenses. Rations were balanced for each target level of production causing increased feed cost for each higher level of target milk production. The dry cow ration remained constant for each level of production. All other costs were held constant. For each target level of milk production, budgets were run for a calving interval of 13, 14 or 15 months. With increasing calving intervals, the number of lactating cows and net operating income declines for each level of target milk production. Although feed costs are lower at longer calving intervals since more cows are eating the less ex-pensive dry cow ration instead of the milk cow ration, the loss of milk income is greater. As level of target milk production increases, net operating income tends to increase as well.
The potential loss in net operating income for changing calving interval is reported in Table 2. The cost of a longer calving interval is greater with higher levels of production. The cost per cow per added day open is re-ported in Table 3. This cost changes with level of production and is different for the added days open associated with different calving intervals. This estimate varies between $2.52 to $4.74 per cow per added day open at the different levels of production when changing from a 13- to 14-month calving interval or from a 14- to 15-month calving interval.
Table 2. Loss in Net Operating Income (Income - Expenses) with Increasing Calving Interval at Different Levels of Target Milk Production.
Calving Interval (mos.)Target Herd Avg. (lbs) 13 vs. 14 14 vs. 15 13 vs. 15
16,000 $17,732 $15,358 $33,09018,000 $21,368 $18,509 $39,88720,000 $25,784 $22,337 $48,12122,000 $28,850 $24,994 $53,844
4

Dairy Reproduction Benchmarks UGA Cooperative Extension Bulletin 1210
Many factors affect the actual cost of days open on a particular farm. These factors include milk price, cownumbers, production level, AI and veterinary expenses, bST use, potential replacement losses and replacementrearing expenses. With higher production levels, there is potentially greater income loss as days open and calv-ing interval increase. The use of bST has complicated the evaluation of optimal calving intervals since cows may continue to produce at profitable levels for a much longer period. But if these conditions can be met, higher potential returns will be available with the shorter calving interval. Moreover, many herds are not using bST or are using bST on only a few cows. The high cost of added days open should provide incentive to examine the reproductive efficiency of your herd. Many management tools are now available that can help shorten calving intervals.
Table 3. Estimated Cost per Cow per Added Day Open of Higher Calving Intervals at Different Levels of Target Milk Production.
Calving Interval (mos.)Target Herd Avg. (lbs) 13 vs. 14 14 vs. 15 13 vs. 15
16,000 $2.92 $2.52 $2.7618,000 $3.51 $3.04 $3.3220,000 $4.24 $3.67 $4.1022,000 $4.74 $4.11 $4.49
Days to first service (DFS), conception rate (CR) and heat detection rate (HDR) all combine to influence days open and calving interval. Average days to first service is affected by the selected voluntary waiting period, heat detection efficiency and herd reproductive health.
Generally, dairy producers set a VWP of 45 to 60 days, which enables the minimum days to first service. The days to first service further sets the minimum calving interval for a cow and the herd. The average time between calvings will be longer than the minimum calving interval because not all cows will conceive on first service and some cows experience early embryonic death. The conception rate, heat detection efficiency and postpar-tum breeding policy strongly influence the calving interval.
Accurate heat detection is especially important for herds breeding by AI; however, it is also important for natu-ral service herds. It provides the basis upon which most reproduction management decisions are made. Detec-tion of the first estrous period following calving provides a reference point upon which to expect subsequent estrous periods. It is also beneficial in determining whether a cow is recovering normally from calving.
Heat detection is a major factor affecting days open and calving interval. The percent of heats observed is an indicator of the overall success of a heat detection program. Not only must estrous be observed, but the observa-tion and breeding must be done on a timely basis for conception to occur.
Measures of conception rate include services per pregnancy and percent successful services. Services per preg-nancy are available for pregnant cows and all cows. The percent successful services is equal to the number of successful services divided by the number of total services. For herds on routine pregnancy diagnosis, reported pregnancies are used to calculate the percent successful. When actual pregnancy data are not reported, the 65-day non-return rate is used.
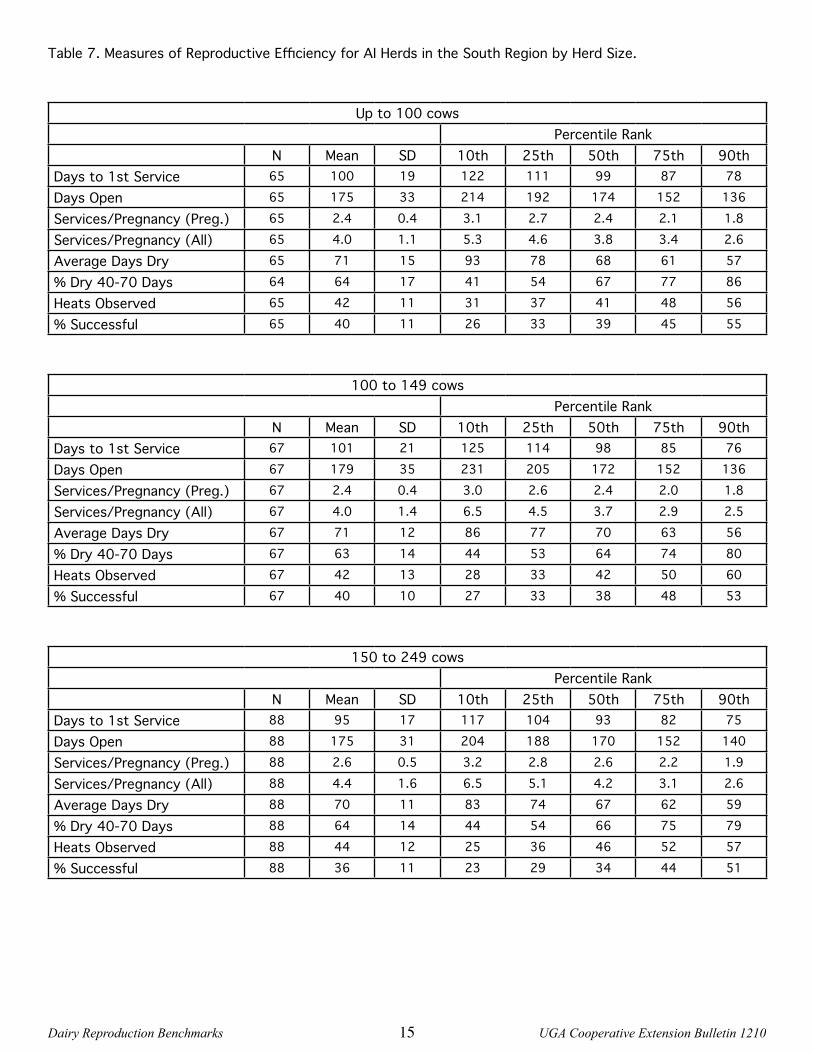
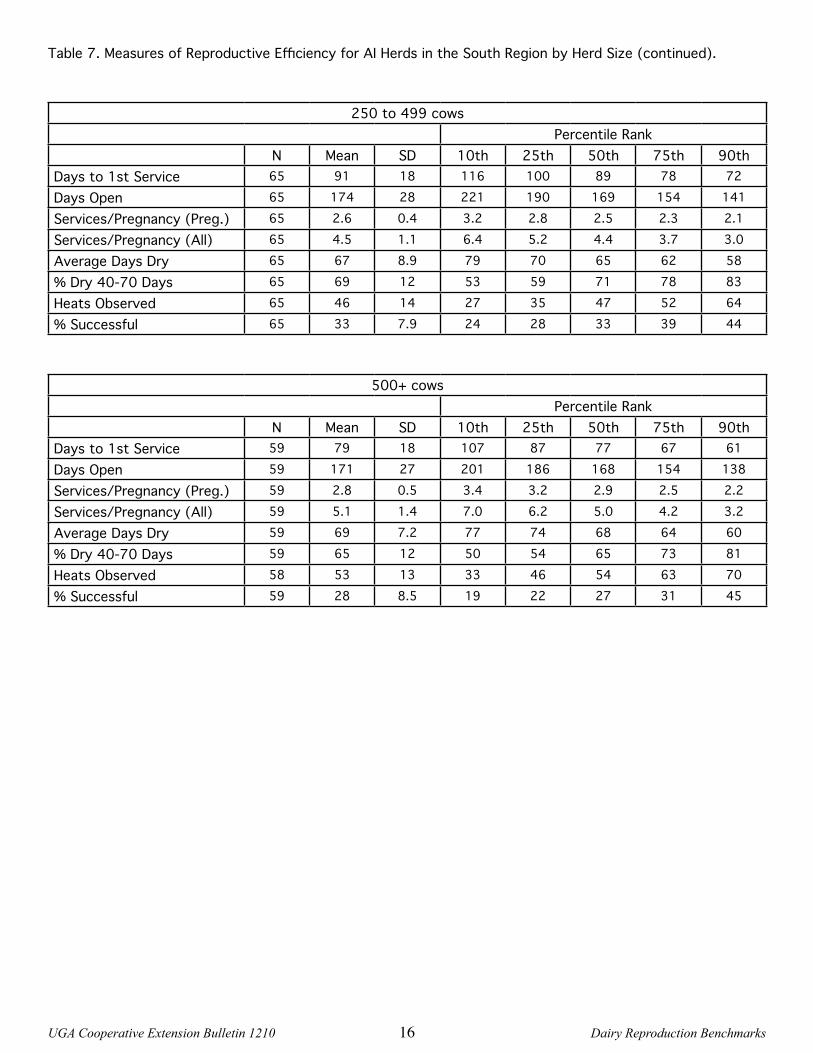
Several measures of reproductive efficiency for AI herds by region are presented in Tables 4-7. The data are fur-ther divided into five or six groupings based on herd size to better reflect management differences. These tables provide a convenient means of comparing a herd’s reproductive efficiency to similar herds in the same region.
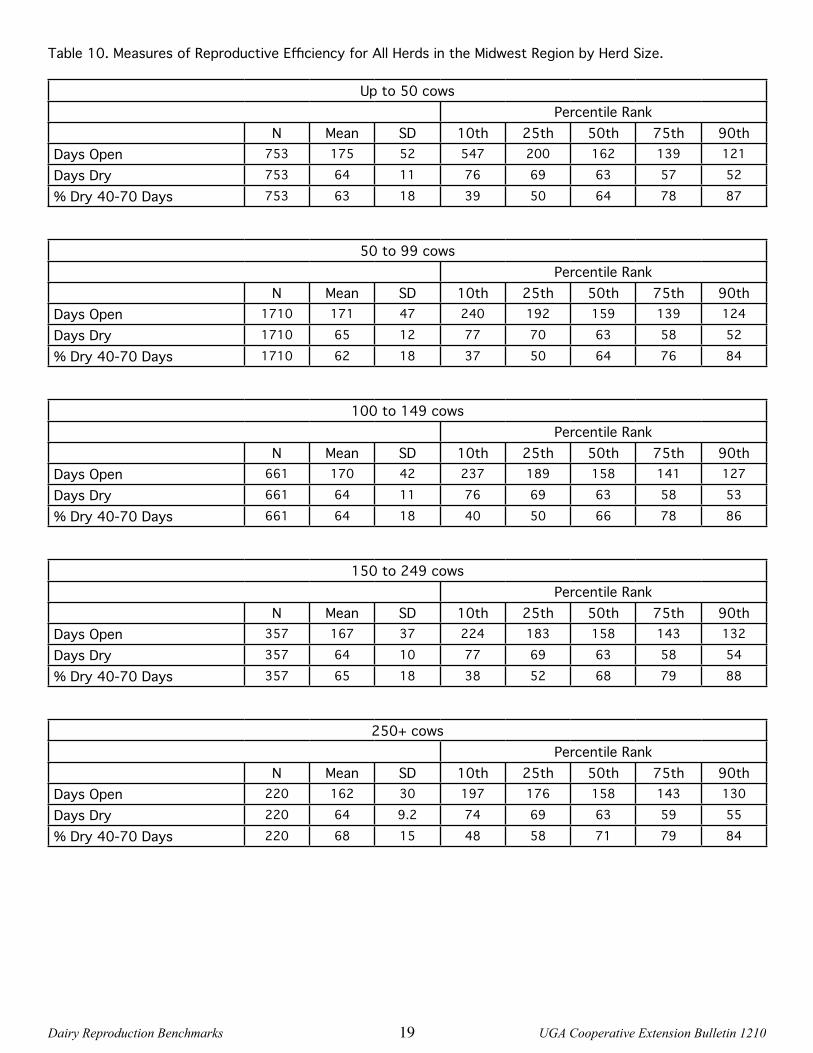
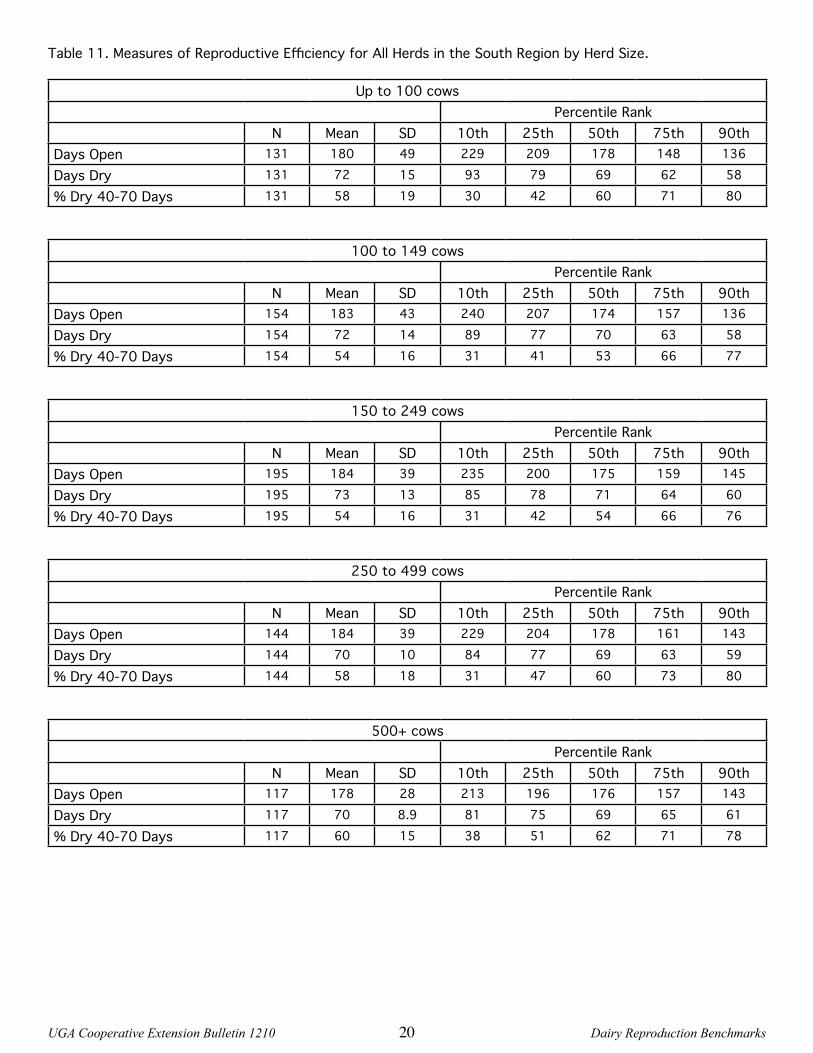
Tables 8-11 present a limited selection of measures of reproductive efficiency for all herds sorted by region and herd size. Because data generated by natural service herds are limited, only the information regarding days open
5
UGA Cooperative Extension Bulletin 1210 Dairy Reproduction Benchmarks
and days dry are valid. Evaluation is difficult in these situations. These data, however, can identify those herds that have significant reproductive problems.
Example 1
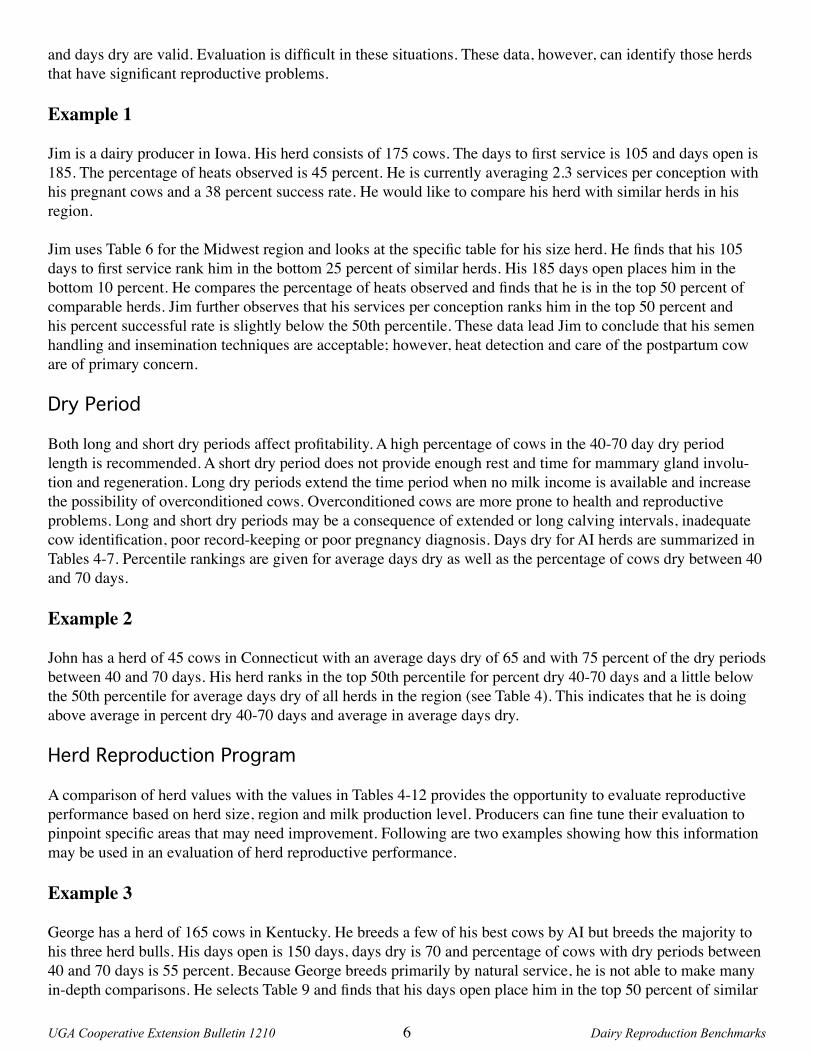
Jim is a dairy producer in Iowa. His herd consists of 175 cows. The days to first service is 105 and days open is 185. The percentage of heats observed is 45 percent. He is currently averaging 2.3 services per conception with his pregnant cows and a 38 percent success rate. He would like to compare his herd with similar herds in his region.
Jim uses Table 6 for the Midwest region and looks at the specific table for his size herd. He finds that his 105 days to first service rank him in the bottom 25 percent of similar herds. His 185 days open places him in the bottom 10 percent. He compares the percentage of heats observed and finds that he is in the top 50 percent of comparable herds. Jim further observes that his services per conception ranks him in the top 50 percent and his percent successful rate is slightly below the 50th percentile. These data lead Jim to conclude that his semen handling and insemination techniques are acceptable; however, heat detection and care of the postpartum cow are of primary concern.
Dry Period
Both long and short dry periods affect profitability. A high percentage of cows in the 40-70 day dry period length is recommended. A short dry period does not provide enough rest and time for mammary gland involu-tion and regeneration. Long dry periods extend the time period when no milk income is available and increasethe possibility of overconditioned cows. Overconditioned cows are more prone to health and reproductiveproblems. Long and short dry periods may be a consequence of extended or long calving intervals, inadequate cow identification, poor record-keeping or poor pregnancy diagnosis. Days dry for AI herds are summarized in Tables 4-7. Percentile rankings are given for average days dry as well as the percentage of cows dry between 40 and 70 days.
Example 2
John has a herd of 45 cows in Connecticut with an average days dry of 65 and with 75 percent of the dry periods between 40 and 70 days. His herd ranks in the top 50th percentile for percent dry 40-70 days and a little below the 50th percentile for average days dry of all herds in the region (see Table 4). This indicates that he is doing above average in percent dry 40-70 days and average in average days dry.
Herd Reproduction Program
A comparison of herd values with the values in Tables 4-12 provides the opportunity to evaluate reproductive performance based on herd size, region and milk production level. Producers can fine tune their evaluation to pinpoint specific areas that may need improvement. Following are two examples showing how this information may be used in an evaluation of herd reproductive performance.
Example 3
George has a herd of 165 cows in Kentucky. He breeds a few of his best cows by AI but breeds the majority to his three herd bulls. His days open is 150 days, days dry is 70 and percentage of cows with dry periods between 40 and 70 days is 55 percent. Because George breeds primarily by natural service, he is not able to make many in-depth comparisons. He selects Table 9 and finds that his days open place him in the top 50 percent of similar
6

Dairy Reproduction Benchmarks UGA Cooperative Extension Bulletin 1210
herds. The average days dry for his herd places him between the 25th and 50th percentiles. The percent of dry periods between 40 and 70 days for his herd places him between the 10th and 25th percentiles. These are areas where he can make improvement, but determining the underlying causes will be difficult because of limited information.
Example 4
Bill has a herd in Georgia with a herd average of 19,585 pounds. He checks Table 12 for the South region and finds that similar herds with a 19,000 pound rolling herd average have an average days to first service of 94 and average days open of 173. He further notices that the average services per pregnancy are 2.5 and 4.5 for preg-nant cows and all cows, respectively. Days dry average 69 days and the percentage of cows dry 40 to 70 days average 66 percent for similar herds in his region. Any values for his herd that fall outside these ranges indicate strengths or weaknesses in his management.
Recommendations
After an evaluation is complete, establish goals to improve performance. Goals for improvement of parameterssuch as days open must also consider the interrelationship with other reproductive parameters. For example, a goal of 115 days open and a 60-day dry period requires that, on average, conception must be at 115 days. If 2.0 services per pregnancy are maintained, then days to first service must average 73 days with a VWP of 60 days. Heat detection must also be excellent.
Summary
Benchmarks provide a convenient method of comparing the performance of your herd with the performance of similar herds. The information provided in this bulletin allows producers or advisors to evaluate a herd’s per-formance with similar herds and determine potential strengths and weaknesses in management. Specific recom-mendations cannot be made based on this information. Producers are encouraged to consult experts who can help identify specific problems and recommend solutions.
7

UGA Cooperative Extension Bulletin 1210 Dairy Reproduction Benchmarks8

Dairy Reproduction Benchmarks UGA Cooperative Extension Bulletin 1210
Table 4. Measures of Reproductive Efficiency for AI Herds in the Northeast Region by Herd Size.
Up to 50 cowsPercentile Rank
N Mean SD 10th 25th 50th 75th 90thDays to 1st Service 583 91 17 113 100 89 80 73Days Open 583 147 26 181 160 145 129 118Services/Pregnancy (Preg.) 583 2.3 0.4 2.8 2.5 2.2 2.0 1.8Services/Pregnancy (All) 583 3.0 0.7 3.9 3.4 2.8 2.4 2.1Average Days Dry 583 66 9.3 76 70 64 60 56% Dry 40-70 Days 583 68 15 47 58 70 79 86Heats Observed 582 48 11 32 41 48 55 62% Successful 583 42 8.7 32 36 42 49 54
50 to 99 cowsPercentile Rank
N Mean SD 10th 25th 50th 75th 90thDays to 1st Service 1237 93 18 115 102 89 80 74Days Open 1237 148 26 183 162 144 130 118Services/Pregnancy (Preg.) 1237 2.2 0.4 2.7 2.4 2.2 2.0 1.8Services/Pregnancy (All) 1237 3.0 0.7 3.8 3.3 2.9 2.5 2.2Average Days Dry 1237 64 8.8 75 69 63 58 54% Dry 40-70 Days 1237 69 15 48 60 70 80 86Heats Observed 1236 46 11 32 39 46 54 59% Successful 1237 42 8.0 32 37 42 48 52
100 to 149 cowsPercentile Rank
N Mean SD 10th 25th 50th 75th 90thDays to 1st Service 379 91 17 112 98 88 80 74Days Open 379 149 27 184 162 143 129 119Services/Pregnancy (Preg.) 379 2.2 0.3 2.7 2.4 2.2 2.0 1.8Services/Pregnancy (All) 379 3.2 0.8 4.0 3.5 3.0 2.6 2.4Average Days Dry 379 64 9.9 74 67 62 58 53% Dry 40-70 Days 379 70 14 51 62 71 80 87Heats Observed 379 46 10 32 39 47 52 58% Successful 379 40 7.5 31 35 41 45 50
9
UGA Cooperative Extension Bulletin 1210 Dairy Reproduction Benchmarks
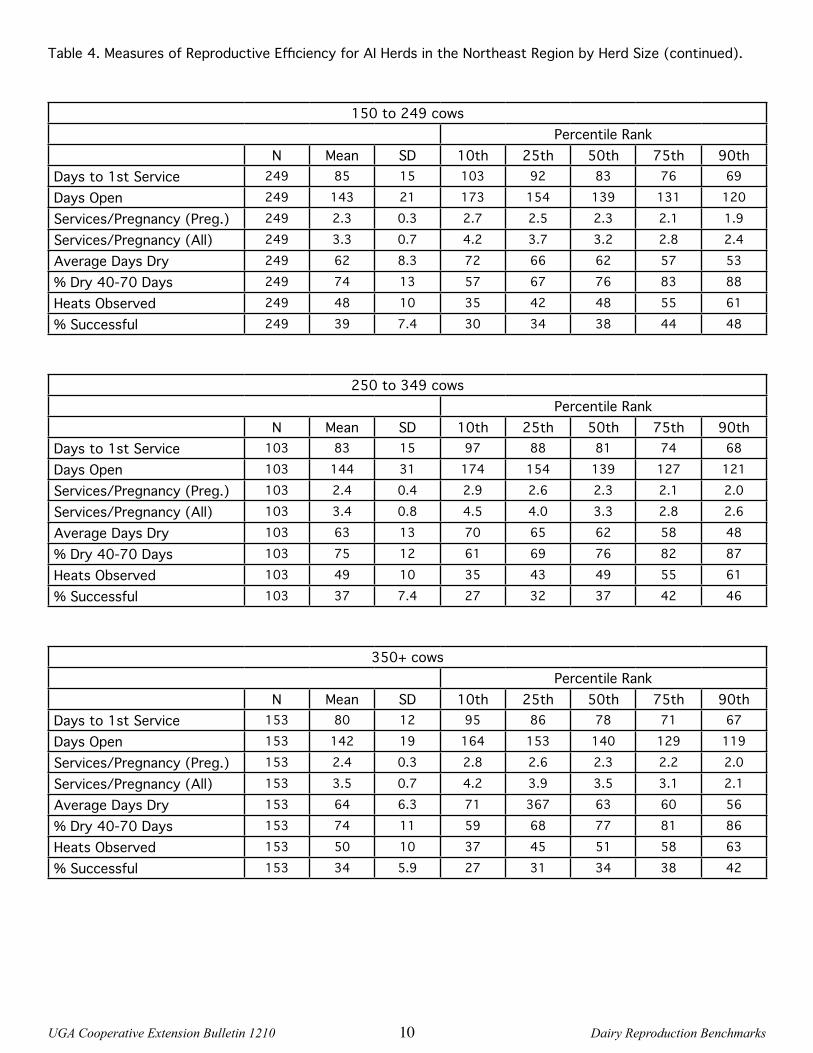
Table 4. Measures of Reproductive Efficiency for AI Herds in the Northeast Region by Herd Size (continued).
150 to 249 cowsPercentile Rank
N Mean SD 10th 25th 50th 75th 90thDays to 1st Service 249 85 15 103 92 83 76 69Days Open 249 143 21 173 154 139 131 120Services/Pregnancy (Preg.) 249 2.3 0.3 2.7 2.5 2.3 2.1 1.9Services/Pregnancy (All) 249 3.3 0.7 4.2 3.7 3.2 2.8 2.4Average Days Dry 249 62 8.3 72 66 62 57 53% Dry 40-70 Days 249 74 13 57 67 76 83 88Heats Observed 249 48 10 35 42 48 55 61% Successful 249 39 7.4 30 34 38 44 48
250 to 349 cowsPercentile Rank
N Mean SD 10th 25th 50th 75th 90thDays to 1st Service 103 83 15 97 88 81 74 68Days Open 103 144 31 174 154 139 127 121Services/Pregnancy (Preg.) 103 2.4 0.4 2.9 2.6 2.3 2.1 2.0Services/Pregnancy (All) 103 3.4 0.8 4.5 4.0 3.3 2.8 2.6Average Days Dry 103 63 13 70 65 62 58 48% Dry 40-70 Days 103 75 12 61 69 76 82 87Heats Observed 103 49 10 35 43 49 55 61% Successful 103 37 7.4 27 32 37 42 46
350+ cowsPercentile Rank
N Mean SD 10th 25th 50th 75th 90thDays to 1st Service 153 80 12 95 86 78 71 67Days Open 153 142 19 164 153 140 129 119Services/Pregnancy (Preg.) 153 2.4 0.3 2.8 2.6 2.3 2.2 2.0Services/Pregnancy (All) 153 3.5 0.7 4.2 3.9 3.5 3.1 2.1Average Days Dry 153 64 6.3 71 367 63 60 56% Dry 40-70 Days 153 74 11 59 68 77 81 86Heats Observed 153 50 10 37 45 51 58 63% Successful 153 34 5.9 27 31 34 38 42
10

Dairy Reproduction Benchmarks UGA Cooperative Extension Bulletin 1210
Table 5. Measures of Reproductive Efficiency for AI Herds in the Midsouth Region by Herd Size.
Up to 50 cowsPercentile Rank
N Mean SD 10th 25th 50th 75th 90thDays to 1st Service 56 102 21 122 116 102 86 77Days Open 56 165 33 214 183 156 142 126Services/Pregnancy (Preg.) 56 2.4 0.3 2.8 2.6 2.3 2.1 1.9Services/Pregnancy (All) 56 3.4 1.2 4.6 3.9 3.1 2.7 2.3Average Days Dry 56 70 15 88 78 66 60 53% Dry 40-70 Days 56 61 18 38 50 62 71 85Heats Observed 56 42 12 28 34 41 49 59% Successful 56 43 8.2 32 37 43 49 52
50 to 99 cowsPercentile Rank
N Mean SD 10th 25th 50th 75th 90thDays to 1st Service 311 97 20 123 108 93 83 76Days Open 311 159 31 202 175 153 139 125Services/Pregnancy (Preg.) 311 2.2 0.4 2.7 2.4 2.2 2.0 1.8Services/Pregnancy (All) 311 3.4 1.1 4.5 3.7 3.1 2.7 2.4Average Days Dry 311 68 11 80 72 66 61 58% Dry 40-70 Days 311 69 15 48 60 71 80 87Heats Observed 311 42 11 29 34 42 49 57% Successful 311 42 9 31 36 42 48 53
100 to 149 cowsPercentile Rank
N Mean SD 10th 25th 50th 75th 90thDays to 1st Service 254 94 19 119 105 90 82 73Days Open 254 162 30 207 178 156 142 127Services/Pregnancy (Preg.) 254 2.4 0.4 2.9 2.7 2.3 2.1 1.9Services/Pregnancy (All) 254 3.8 1.2 5.2 4.2 3.6 3.0 2.5Average Days Dry 254 67 10 80 72 65 60 57% Dry 40-70 Days 254 70 14 50 61 72 80 85Heats Observed 254 45 11 30 38 45 52 59% Successful 254 38 8.9 26 33 37 43 51
11

UGA Cooperative Extension Bulletin 1210 Dairy Reproduction Benchmarks
Table 5. Measures of Reproductive Efficiency for AI Herds in the Midsouth Region by Herd Size (continued).
150 to 249 cowsPercentile Rank
N Mean SD 10th 25th 50th 75th 90thDays to 1st Service 162 91 18 118 98 87 79 72Days Open 162 163 30 207 183 156 139 131Services/Pregnancy (Preg.) 162 2.4 0.4 3.0 2.7 2.4 2.1 2.0Services/Pregnancy (All) 162 4.0 1.2 5.6 4.5 3.7 3.1 2.7Average Days Dry 162 67 12 82 71 65 59 56% Dry 40-70 Days 162 69 14 48 60 70 80 85Heats Observed 162 46 11 31 38 47 54 59% Successful 162 36 9.0 25 30 37 41 46
250+ cowsPercentile Rank
N Mean SD 10th 25th 50th 75th 90thDays to 1st Service 67 90 18 113 98 86 78 73Days Open 67 166 26 207 183 164 148 134Services/Pregnancy (Preg.) 67 2.5 0.4 3.1 2.8 2.4 2.2 2.1Services/Pregnancy (All) 67 4.1 1.1 5.6 4.8 3.8 3.2 2.7Average Days Dry 67 67 9 75 72 65 61 58% Dry 40-70 Days 67 71 15 49 61 73 84 88Heats Observed 67 44 13 27 37 44 54 60% Successful 67 34 9.5 23 28 34 39 44
12

Dairy Reproduction Benchmarks UGA Cooperative Extension Bulletin 1210
Table 6. Measures of Reproductive Efficiency for AI Herds in the Midwest Region by Herd Size.
Up to 50 cowsPercentile Rank
N Mean SD 10th 25th 50th 75th 90thDays to 1st Service 232 99 18 121 109 96 87 81Days Open 232 160 31 200 176 158 140 123Services/Pregnancy (Preg.) 232 2.2 1.4 2.9 2.5 2.2 1.9 1.8Services/Pregnancy (All) 232 3.0 0.9 4.3 3.5 2.8 2.4 2.0Average Days Dry 232 63 10 76 69 61 57 53% Dry 40-70 Days 232 69 17 46 56 70 82 89Heats Observed 232 40 11 26 32 39 47 53% Successful 232 45 9.6 32 37 45 52 57
50 to 99 cowsPercentile Rank
N Mean SD 10th 25th 50th 75th 90thDays to 1st Service 728 98 20 124 108 95 85 76Days Open 729 158 31 199 174 154 138 123Services/Pregnancy (Preg.) 729 2.2 0.4 2.7 2.4 2.1 1.9 1.8Services/Pregnancy (All) 729 3.1 1.0 4.3 3.5 2.9 2.5 2.2Average Days Dry 729 64 11 74 68 63 57 53% Dry 40-70 Days 727 69 15 49 59 71 80 86Heats Observed 726 40 10 27 33 40 47 54% Successful 729 44 9.5 32 37 44 50 56
100 to 149 cowsPercentile Rank
N Mean SD 10th 25th 50th 75th 90thDays to 1st Service 352 96 21 123 106 92 83 75Days Open 352 160 31 202 175 155 138 128Services/Pregnancy (Preg.) 352 2.2 0.4 2.8 2.5 2.2 2.0 1.8Services/Pregnancy (All) 352 3.3 0.9 4.4 3.8 3.1 2.6 2.3Average Days Dry 352 63 9.2 73 66 62 57 53% Dry 40-70 Days 352 70 15 49 62 73 82 88Heats Observed 352 41 11 26 32 41 49 55% Successful 352 41 9 30 34 41 48 53
13
UGA Cooperative Extension Bulletin 1210 Dairy Reproduction Benchmarks
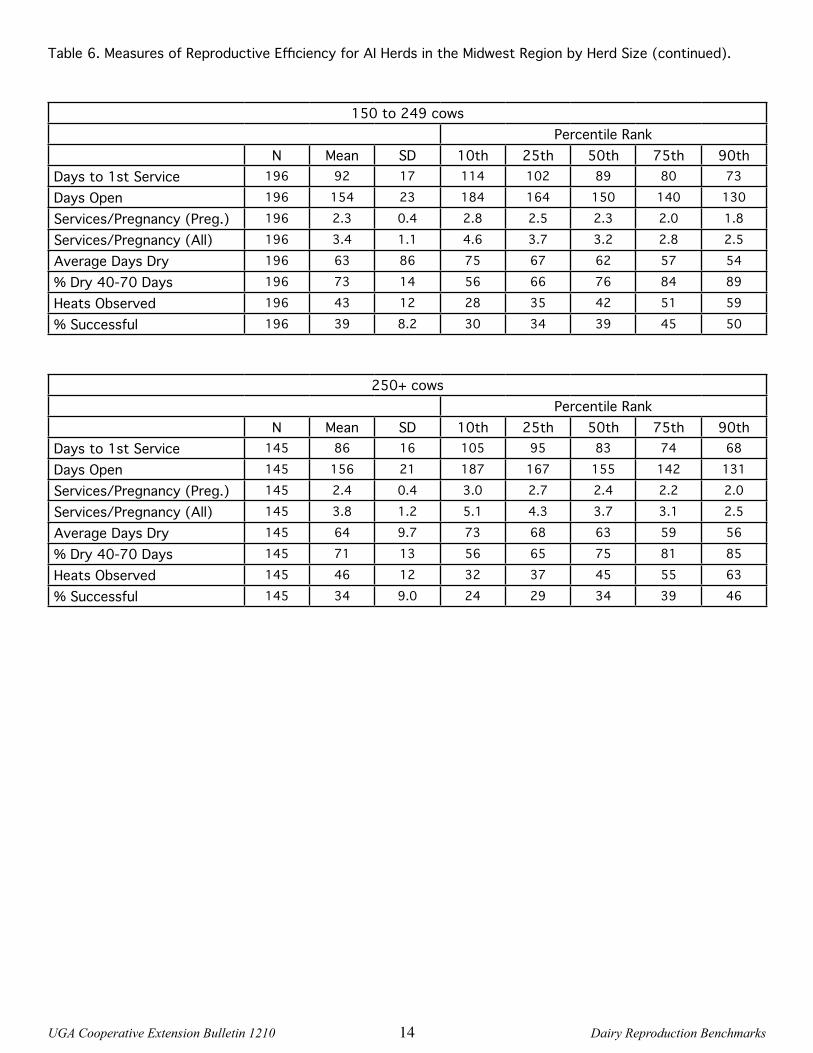
Table 6. Measures of Reproductive Efficiency for AI Herds in the Midwest Region by Herd Size (continued).
150 to 249 cowsPercentile Rank
N Mean SD 10th 25th 50th 75th 90thDays to 1st Service 196 92 17 114 102 89 80 73Days Open 196 154 23 184 164 150 140 130Services/Pregnancy (Preg.) 196 2.3 0.4 2.8 2.5 2.3 2.0 1.8Services/Pregnancy (All) 196 3.4 1.1 4.6 3.7 3.2 2.8 2.5Average Days Dry 196 63 86 75 67 62 57 54% Dry 40-70 Days 196 73 14 56 66 76 84 89Heats Observed 196 43 12 28 35 42 51 59% Successful 196 39 8.2 30 34 39 45 50
250+ cowsPercentile Rank
N Mean SD 10th 25th 50th 75th 90thDays to 1st Service 145 86 16 105 95 83 74 68Days Open 145 156 21 187 167 155 142 131Services/Pregnancy (Preg.) 145 2.4 0.4 3.0 2.7 2.4 2.2 2.0Services/Pregnancy (All) 145 3.8 1.2 5.1 4.3 3.7 3.1 2.5Average Days Dry 145 64 9.7 73 68 63 59 56% Dry 40-70 Days 145 71 13 56 65 75 81 85Heats Observed 145 46 12 32 37 45 55 63% Successful 145 34 9.0 24 29 34 39 46
14
Dairy Reproduction Benchmarks UGA Cooperative Extension Bulletin 1210
Table 7. Measures of Reproductive Efficiency for AI Herds in the South Region by Herd Size.
Up to 100 cowsPercentile Rank
N Mean SD 10th 25th 50th 75th 90thDays to 1st Service 65 100 19 122 111 99 87 78Days Open 65 175 33 214 192 174 152 136Services/Pregnancy (Preg.) 65 2.4 0.4 3.1 2.7 2.4 2.1 1.8Services/Pregnancy (All) 65 4.0 1.1 5.3 4.6 3.8 3.4 2.6Average Days Dry 65 71 15 93 78 68 61 57% Dry 40-70 Days 64 64 17 41 54 67 77 86Heats Observed 65 42 11 31 37 41 48 56% Successful 65 40 11 26 33 39 45 55
100 to 149 cowsPercentile Rank
N Mean SD 10th 25th 50th 75th 90thDays to 1st Service 67 101 21 125 114 98 85 76Days Open 67 179 35 231 205 172 152 136Services/Pregnancy (Preg.) 67 2.4 0.4 3.0 2.6 2.4 2.0 1.8Services/Pregnancy (All) 67 4.0 1.4 6.5 4.5 3.7 2.9 2.5Average Days Dry 67 71 12 86 77 70 63 56% Dry 40-70 Days 67 63 14 44 53 64 74 80Heats Observed 67 42 13 28 33 42 50 60% Successful 67 40 10 27 33 38 48 53
150 to 249 cowsPercentile Rank
N Mean SD 10th 25th 50th 75th 90thDays to 1st Service 88 95 17 117 104 93 82 75Days Open 88 175 31 204 188 170 152 140Services/Pregnancy (Preg.) 88 2.6 0.5 3.2 2.8 2.6 2.2 1.9Services/Pregnancy (All) 88 4.4 1.6 6.5 5.1 4.2 3.1 2.6Average Days Dry 88 70 11 83 74 67 62 59% Dry 40-70 Days 88 64 14 44 54 66 75 79Heats Observed 88 44 12 25 36 46 52 57% Successful 88 36 11 23 29 34 44 51
15
UGA Cooperative Extension Bulletin 1210 Dairy Reproduction Benchmarks
Table 7. Measures of Reproductive Efficiency for AI Herds in the South Region by Herd Size (continued).
250 to 499 cowsPercentile Rank
N Mean SD 10th 25th 50th 75th 90thDays to 1st Service 65 91 18 116 100 89 78 72Days Open 65 174 28 221 190 169 154 141Services/Pregnancy (Preg.) 65 2.6 0.4 3.2 2.8 2.5 2.3 2.1Services/Pregnancy (All) 65 4.5 1.1 6.4 5.2 4.4 3.7 3.0Average Days Dry 65 67 8.9 79 70 65 62 58% Dry 40-70 Days 65 69 12 53 59 71 78 83Heats Observed 65 46 14 27 35 47 52 64% Successful 65 33 7.9 24 28 33 39 44
500+ cowsPercentile Rank
N Mean SD 10th 25th 50th 75th 90thDays to 1st Service 59 79 18 107 87 77 67 61Days Open 59 171 27 201 186 168 154 138Services/Pregnancy (Preg.) 59 2.8 0.5 3.4 3.2 2.9 2.5 2.2Services/Pregnancy (All) 59 5.1 1.4 7.0 6.2 5.0 4.2 3.2Average Days Dry 59 69 7.2 77 74 68 64 60% Dry 40-70 Days 59 65 12 50 54 65 73 81Heats Observed 58 53 13 33 46 54 63 70% Successful 59 28 8.5 19 22 27 31 45
16

Dairy Reproduction Benchmarks UGA Cooperative Extension Bulletin 1210
Table 8. Measures of Reproductive Efficiency for All Herds in the Northeast Region by Herd Size.
Up to 50 cowsPercentile Rank
N Mean SD 10th 25th 50th 75th 90thDays Open 1396 146 32 185 160 142 125 113Days Dry 1396 66 9.4 77 71 65 60 56% Dry 40-70 Days 1396 66 16 44 56 68 78 86
50 to 99 cowsPercentile Rank
N Mean SD 10th 25th 50th 75th 90thDays Open 1986 150 32 187 164 144 128 117Days Dry 1986 65 10 76 69 63 59 54% Dry 40-70 Days 1986 66 16 44 56 68 79 86
100 to 149 cowsPercentile Rank
N Mean SD 10th 25th 50th 75th 90thDays Open 569 150 31 186 162 144 129 118Days Dry 569 65 13 76 69 62 58 54% Dry 40-70 Days 569 66 16 42 55 68 78 85
150 to 249 cowsPercentile Rank
N Mean SD 10th 25th 50th 75th 90thDays Open 341 148 28 185 160 141 131 120Days Dry 341 63 9.0 73 67 62 57 54% Dry 40-70 Days 341 69 15 48 60 73 81 86
250 to 349 cowsPercentile Rank
N Mean SD 10th 25th 50th 75th 90thDays Open 129 145 30 179 155 139 127 119Days Dry 129 63 13 71 66 62 58 55% Dry 40-70 Days 129 72 14 55 66 75 82 87
350+ cowsPercentile Rank
N Mean SD 10th 25th 50th 75th 90thDays Open 170 142 19 166 153 139 129 119Days Dry 170 64 6.3 72 67 64 61 56% Dry 40-70 Days 170 73 12 54 68 76 81 85
17

UGA Cooperative Extension Bulletin 1210 Dairy Reproduction Benchmarks
Table 9. Measures of Reproductive Efficiency for All Herds in the Midsouth Region by Herd Size.
Up to 50 cowsPercentile Rank
N Mean SD 10th 25th 50th 75th 90thDays Open 180 169 50 228 184 158 136 119Days Dry 180 72 16 91 78 70 63 57% Dry 40-70 Days 180 58 18 32 45 60 70 83
50 to 99 cowsPercentile Rank
N Mean SD 10th 25th 50th 75th 90thDays Open 706 167 44 225 184 155 139 125Days Dry 706 70 13 85 75 67 61 57% Dry 40-70 Days 706 60 18 34 46 62 74 83
100 to 149 cowsPercentile Rank
N Mean SD 10th 25th 50th 75th 90thDays Open 475 166 38 222 185 158 140 125Days Dry 475 70 12 86 75 67 62 58% Dry 40-70 Days 475 61 18 36 47 63 75 83
150 to 249 cowsPercentile Rank
N Mean SD 10th 25th 50th 75th 90thDays Open 268 168 37 220 189 160 141 131Days Dry 268 69 13 84 75 66 60 56% Dry 40-70 Days 268 62 17 38 50 64 76 84
250+ cowsPercentile Rank
N Mean SD 10th 25th 50th 75th 90thDays Open 118 171 31 216 188 168 150 135Days Dry 118 68 10 81 74 66 62 59% Dry 40-70 Days 118 64 18 38 52 66 77 85
18
Dairy Reproduction Benchmarks UGA Cooperative Extension Bulletin 1210
Table 10. Measures of Reproductive Efficiency for All Herds in the Midwest Region by Herd Size.
Up to 50 cowsPercentile Rank
N Mean SD 10th 25th 50th 75th 90thDays Open 753 175 52 547 200 162 139 121Days Dry 753 64 11 76 69 63 57 52% Dry 40-70 Days 753 63 18 39 50 64 78 87
50 to 99 cowsPercentile Rank
N Mean SD 10th 25th 50th 75th 90thDays Open 1710 171 47 240 192 159 139 124Days Dry 1710 65 12 77 70 63 58 52% Dry 40-70 Days 1710 62 18 37 50 64 76 84
100 to 149 cowsPercentile Rank
N Mean SD 10th 25th 50th 75th 90thDays Open 661 170 42 237 189 158 141 127Days Dry 661 64 11 76 69 63 58 53% Dry 40-70 Days 661 64 18 40 50 66 78 86
150 to 249 cowsPercentile Rank
N Mean SD 10th 25th 50th 75th 90thDays Open 357 167 37 224 183 158 143 132Days Dry 357 64 10 77 69 63 58 54% Dry 40-70 Days 357 65 18 38 52 68 79 88
250+ cowsPercentile Rank
N Mean SD 10th 25th 50th 75th 90thDays Open 220 162 30 197 176 158 143 130Days Dry 220 64 9.2 74 69 63 59 55% Dry 40-70 Days 220 68 15 48 58 71 79 84
19
UGA Cooperative Extension Bulletin 1210 Dairy Reproduction Benchmarks
Table 11. Measures of Reproductive Efficiency for All Herds in the South Region by Herd Size.
Up to 100 cowsPercentile Rank
N Mean SD 10th 25th 50th 75th 90thDays Open 131 180 49 229 209 178 148 136Days Dry 131 72 15 93 79 69 62 58% Dry 40-70 Days 131 58 19 30 42 60 71 80
100 to 149 cowsPercentile Rank
N Mean SD 10th 25th 50th 75th 90thDays Open 154 183 43 240 207 174 157 136Days Dry 154 72 14 89 77 70 63 58% Dry 40-70 Days 154 54 16 31 41 53 66 77
150 to 249 cowsPercentile Rank
N Mean SD 10th 25th 50th 75th 90thDays Open 195 184 39 235 200 175 159 145Days Dry 195 73 13 85 78 71 64 60% Dry 40-70 Days 195 54 16 31 42 54 66 76
250 to 499 cowsPercentile Rank
N Mean SD 10th 25th 50th 75th 90thDays Open 144 184 39 229 204 178 161 143Days Dry 144 70 10 84 77 69 63 59% Dry 40-70 Days 144 58 18 31 47 60 73 80
500+ cowsPercentile Rank
N Mean SD 10th 25th 50th 75th 90thDays Open 117 178 28 213 196 176 157 143Days Dry 117 70 8.9 81 75 69 65 61% Dry 40-70 Days 117 60 15 38 51 62 71 78
20

Dairy Reproduction Benchmarks UGA Cooperative Extension Bulletin 1210
Table 12. Average Measures of Reproductive Efficiency by Region and Production Level.
Northeast
Herd Average
(lbs) NDays to 1st
Service Days Open
Services / Pregnancy (Pregnant
Cows)
Services / Pregnancy (All Cows) Days Dry
% Dry 40-70 Days
14000 18 97 172 2.1 2.9 74 5615000 43 94 153 2.2 2.9 68 6016000 84 86 157 22 3.0 66 6217000 138 93 151 2.2 2.9 66 6618000 219 93 150 2.2 3.0 65 6419000 328 92 148 2.2 3.0 64 6620000 361 90 144 2.2 3.0 64 7021000 412 89 145 2.2 3.0 64 7122000 328 89 146 2.3 3.1 63 7223000 283 89 145 2.3 3.1 63 7424000 197 87 145 2.3 3.3 63 7525000 126 86 141 2.3 3.2 63 7626000 71 90 148 2.4 3.5 62 7427000 79 95 155 2.3 3.4 64 72
Midsouth
Herd Average
(lbs) NDays to 1st
Service Days Open
Services / Pregnancy (Pregnant
Cows)
Services / Pregnancy (All Cows) Days Dry
% Dry 40-70 Days
14000 18 117 202 2.2 3.1 79 4715000 25 99 171 2.3 3.6 80 4616000 44 99 169 2.3 3.4 71 6417000 60 98 167 2.3 3.3 68 6118000 101 99 169 2.3 3.6 69 6519000 114 96 164 2.4 3.8 66 6720000 123 92 160 2.4 3.8 66 7221000 143 90 153 2.4 3.8 66 7422000 96 92 150 2.3 3.5 65 7423000 45 96 156 2.3 3.5 65 7424000 70 88 157 2.4 4.1 65 76
21

UGA Cooperative Extension Bulletin 1210 Dairy Reproduction Benchmarks
Table 12. Average Measures of Reproductive Efficiency by Region and Production Level (continued).
Midwest
Herd Average
(lbs) NDays to 1st
Service Days Open
Services / Pregnancy (Pregnant
Cows)
Services / Pregnancy (All Cows) Days Dry
% Dry 40-70 Days
14000 20 111 175 2.1 2.6 75 5315000 33 110 181 2.1 3.0 69 5616000 70 101 165 2.2 3.0 66 6217000 95 102 170 2.2 3.1 64 6518000 139 99 161 2.2 3.1 66 6419000 188 98 163 2.3 3.1 64 6820000 233 96 158 2.3 3.2 64 6921000 207 96 161 2.2 3.3 62 7022000 200 94 150 2.2 3.2 62 7223000 157 93 154 2.2 3.3 62 7524000 109 89 149 2.3 3.5 63 7825000 80 88 150 24 3.6 60 7726000 54 94 153 2.4 3.6 30 7527000 61 90 152 2.3 3.4 60 78
Midsouth
Herd Average
(lbs) NDays to 1st
Service Days Open
Services / Pregnancy (Pregnant
Cows)
Services / Pregnancy (All Cows) Days Dry
% Dry 40-70 Days
14000 7 103 199 2.2 3.2 76 3815000 18 94 166 2.3 3.6 70 6216000 29 90 176 2.7 4.5 70 6217000 39 94 173 2.6 4.4 72 6318000 40 97 181 2.5 4.1 74 6219000 47 94 173 2.5 4.5 69 6620000 39 91 170 2.4 4.2 68 6821000 37 95 180 2.6 4.8 68 6822000 76 92 169 2.6 4.5 65 71
22


![arXiv:2005.12873v3 [cs.DC] 7 Jun 2020processing benchmarks [12]. They studied about distributed and parallel benchmarks for graph analyzers, graph database benchmarks, benchmarks for](https://img.dokumen.tips/doc/110x75/60c4e778df2cd14e603091d9/arxiv200512873v3-csdc-7-jun-2020-processing-benchmarks-12-they-studied-about.jpg)