Embed Size (px)
Citation preview

60
DAFTAR PUSTAKA
1. Cuningham FG, Mac Donald PC, Gant NF, et al. Hypertensive Disorders in Pregnancy
William Obstetrics. 20th ed. Conecticut : Appleton & Lange; 1997.
2. Simanjuntak JR. Evaluasi Kematian Maternal Penderita Preeklampsia Berat di RSUD
Dr. Pirngadi Medan Tahun 1993 –1997. 1999.
3. Miller DA. Hypertension in Pregnancy. Current di. (De Cherney AHL, N. Goodwin T,
eds.). New York: McGraw Hill. p.; 2007.
4. Sofoewan S. Pregnancy Outcome of Women with Severe Preeclampsia With and
Without HELLP Syndrome. 2001.
5. Depkes RI. Survei Kesehatan Rumah Tangga tahun 2001. In: Jakarta: Departement
Kesehatan RI; 2001.
6. Sibai BM. The HELLP Syndrome (hemolysis, elevated liver enzymes and low trombosit
counts). In: Much Ado About Nothing ?. ; 1990:;162 : 311-316.
7. Siregar MF. Luaran Janin dan Ibu pada Penderita Preeklampsiaa di RSUD Dr. Pirngadi
Medan. 1997.
8. Sarwono P WH. Ilmu Kebidanan. Jakarta: PT Bina Pustaka Sarwono Prawirohardjo;
2010.
9. Djamhoer Martaadisoebrata HW, Firman F. Wirakusumah, Dinan S. Bratakoesoema,
Sofie R. Krisnadi,Johanes C. Mose. Obstetri Patologi. (Sulaiman Sastrawinata DM,
Firman F. Wirakusumah, ed.). Jakarta: Penerbit Buku Kedokteran EGC; 2004.
10. Kaaja R, Laivuori H, Laakso, M, Tikkanen MJ YO. Evidence of a State of Increased
Insulin Resistance in Preeclampsia.; 1999.
11. William C. Mabie BMS. Hypertensive States of Pregnancy. Current Ob. (MLP AHD,
ed.). Houston: Appleton & Lange; 1994.
12. Steegers EA, von Dadelszen P, Duvekot JJ PR. Pre-Eclampsia. The Lancet; 2010.

61
13. C.H. Backes KM, Pamela Moorehead, Leandro Cordero, C.A. Nankervis PJG. Maternal
Preeclampsia and Neonatal Outcomes. 2011.
14. Konimusliha P, Dewantiningrum J HR. Hubungan antara Frekuensi Perawatan
Antenatal dengan Kejadian Preeklampsia Berat di RSUP Dr. Kariadi Tahun 2010. 2011.
15. Granger JP, Alexander BT, Llinas MT, Bennett WA KR. Pathophysiology of
Hypertension During Preeclampsia Linking Placental Ischemia with Endothelial
Dysfunction.Hypertension.; 2001.
16. Duckitt K HD. Risk Factors for Pre-Eclampsia at Antenatal Booking: Systematic
Review of Controlled Studies. BMJ; 2005.
17. Sibai BM, Hauth J, Caritis S, Lindheimer MD, MacPherson C, Klebanoff M, et al.
Hypertensive disorders in twin versus singleton gestations. Am J Obs Gynecol.
2000;;182::938-942.
18. Chappell LC, Enve S, Seed P, Briley Pregnancy, Lucilla Poston, Shennan AH. Adverse
Perinatal Outcomes and Risk Factors for Preeclampsia in Women With Chronic
Hypertension: A Prospective Study. Hypertensi.; 2008.
19. Dekker G, Robillard PY. The birth interval hypothesis-does it really indicate the end of
praternity hypothesis? J Reprod Immunol. 2003;;59::245-251.
20. Conde-Agudelo A, Villar J LM. World health organization systematic review of
screening tests for preeclampsia. Obs Gynecol. 2004;;104::1367-1391.
21. Lisonkova S, Joseph K. Incidence of Preeclampsia: Risk Factors and Outcomes
Associated with Early-Versus Late-Onset Disease. Am J Obstet Gynecol.
2013:209(6):544. e1 - . e12.
22. Dekker GA, Sibai BM. Etiology and Pathogenesis of Preeclampsia: Current Concepts.
Am J Obstet Gynecol. 1998:179(5):1359-1375.
23. Hiby SE, Walker JJ, O’Shaughnessy KM, Redman CW, Carrington M, Trowsdale J, et
al. Combinations of Maternal KIR and Fetal HLA-C Genes Influence The Risk of
Preeclampsia and Reproductive Success. J Exp Med. 2004:;200(8):957-965.

62
24. Indonesia KKR, ed. Buku Saku Pelayanan Kesehatan Ibu Di Fasilitas Kesehatan Dasar
Dan Rujukan. Jakarta; 2013.
25. Wagner LK. Diagnosis and Management of Preeclampsia. Am Fam Physician.
2004:;70(12):2317-2324.
26. Hohllagschwandtner M, Todesca DB. HELLP (hemolysis, elevated liver enzymes and
low trombosit counts) Needs Help. AmJ Obs Gynecol. 1991:; 164 : 1500-1513.
27. Lockwood CJ, Paidas MJ. Preeclampsia and Hypertensive Disorders. In : Cohen WR.
Complication in Pregnancy. 5th ed. Philadelphia : Lippicott Williams & Wilkins; 2000.
28. Churchill D, Beevers DG. Hypetension in Pregnancy. London: BMJ Books; 1999.
29. Arbogast BW, Taylor RN. Molecular Mechanism of Preeclampsia. Springer-Verlag.
1996.
30. Martin JN, Rinehart BK, May WL, et al. The Spectrum of Severe Preeclampsia :
Comparative Analysis by HELLP (hemolysis, elevated liver enzymes and low trombosit
counts) Syndrome Classification. AmJ Obs Gynecol. 1999:; 180 : 1373-1384.
31. Arias F. Practical Guide to Highrisk Pregnancy and Delivary. 2nd ed. St. Louis : Mosby
Year Book; 1999.
32. Walker J. Current Toughts on the Pathophysiology of Preeclampsia /Eclampsia.
Progress i. (Studd J, ed.). : Churchill Livingstone; 1999.
33. Barton JR, Riely CA, Adamec TA, et al. Hepatic Hispatologic in Condition does not
Correlate with Laboratory Abnormalities in HELLP Syndrome (hemolysis, elevated
liver enzymes and low trombosit counts). AmJ Obs Gynecol. 1992:; 167 : 1538-1543.
34. Oesterhof H, Voorhoeve P, Arnodudse JG. Enhancement of Hepatic Artery Resistence
to Blood Fflow in Preeclampia in ppresence or Absence of HELLP Syndrome. AmJ Obs
Gynecol. 1994:4; 171 : 526-530.
35. Usta IM, Barton JR, Amon EA, et al. Acute Fatty Liver of Pregnancy : An Experience
in Diagnosis and Management of Cases. AmJ Obs Gynecol. 1994:: 171 : 1342-1347.
36. Morikawa H, Umikage H YM. Clinical Difference Between HELLP Syndrome and

63
Partial HELLP Syndrome. AUFOG Accredit Ultrasound Work. 2001.
37. Martin JN, May WL, Magann EF, et al. Early risk assesment of severe preeclampsia:
admission baterry of symptom and laboratory test to predict likelihood of subsequent
significant maternal morbidity. AmJ Obs Gynecol. 1999:; 180 : 1407-1414.
38. Dekker GA WJ. Maternal Assesment in Pregnancy Induced Hypertensive Disorder :
Special Investigation and Their Pathophysiological Basis. London: Chapman&Hall;
1997.
39. Sibai BM, Taslimi MM, El-Nazer A et al. Maternal and Perinatal Outcome Associated
with the Syndrome of hemolysis, elevated liver enzymes and low trombosit counts in
Severe Preeclampsia. AmJ Obs Gynecol. 1986:; 155 : 501-509.
40. Martin JN, Blakes PG, Perry KG, et al. The Natural Hystory of HELLP Syndrome :
Patern of Disease Progression and Regression. AmJ Obs Gynecol. 1991:; 164 : 1500-
1513.
41. Ghulmiyyah L, Sibai B, ed. Maternal Mortality from Preeclampsia/Eclampsia. In:
Seminars in Perinatology; 2012.
42. Wahdi SA, Praptohardjo U. Kematian Maternal di RSUP Dr. Kariadi Semarang tahun
1996-1998. Maj Obstet dan Ginekol Indones POGI. 2000::65-70.
43. Leveno KJ. Cunningham. In: Obstetri Williams. ; 2009.
44. Duley L, ed. The Global Impact of Preeclampsia and Eclampsia. In: Seminars in
Perinatology; 2009.
45. SARAH DYAANGGARI AKIP. LUARAN MATERNAL DAN PERINATAL PADA
IBU HAMIL DENGAN PREEKLAMPSIA BERAT (Analisis Perbedaan Faktor Risiko
dengan dan Tanpa Riwayat Preeklampsia). eprints.undip. 2015.
46. Gandhi S, Sun D, Park AL. The Pulmonary Edema Preeclampsia Evaluation (PEPE)
Study. J Obs Gynaecol Can. 2014;;36(12)::1065-1070.
47. Anggraeni W, Pramono BA. Analisis Faktor Risiko terhadap Luaran Maternal dan
Perinatal Pada Kasus Eklampsia di RSUP Dr Kariadi Tahun 2011-2012. Fac Med

64
Diponegoro Univ. 2013.
48. auf Altenstadt JFvS, Hukkelhoven CW, van Roosmalen J, Bloemenkamp KW. Pre-
Eclampsia Increases the Risk of Postpartum Haemorrhage. A Nationwide Cohort Study
Netherlands. 2013.
49. Redman, Borzychowski A, Sargent I C, ed. Inflammation and Preeclampsia. In:
Seminars in Fetal and Neonatal Medicine; 2006.
50. Sari LPA, Harahap M. Perbedaan Mortalitas antara Pasien Sepsis dan Sepsis Komplikasi
Disseminted Intravascular Coagulation di ICU RSUP Dr. Kariadi. Fac Med Diponegoro
Univ. 2013.
51. Acosta CD, Knight M, Lee HC, Kurinczuk JJ, Gould JB, Lyndon A. The Continuum of
Maternal Sepsis Severity: Incidence and Risk Factors in a Population-Based Cohort
Study. PLoS One. 2013;;8(7)::e67175.
52. Thachill J, Toh CH,. Disseminated intravascular coagulation in obstetric disorders and
its acute haematological management. Blood Reveiw. 2009:;167-176.
53. Ngoc NTN, Merialdi M, Abdel-Aleem H, Carroli G, Purwar M, Zavaleta N, et al,, Ngoc
NTN, Merialdi M, Abdel-Aleem H, Carroli G, Purwar M, Zavaleta N, et al,. Causes of
Stillbirths and Early Neonatal Deaths: Data from 7993 Pregnancies in Six Developing
Countries. Causes Stillbirths Early Neonatal Deaths Data from 7993 Pregnancies Six
Dev Ctries. 2006:;84(9):699-705.
54. Knight M. Eclampsia in the United kingdom 2005. BJOG An Int J Obstet Gynaecol.
2007;;114(9)::1072-1078.
55. Group TETC. Which Anticonvulsant for Women with Eclampsia? Evidence from the
Collaborative Eclampsia Trial. Lancet. 1995;;345(8963)::1455-1463.
56. Goldenberg RL, Culhane JF, Iams JD, Romero R. Epidemiology and Causes of Preterm
Birth. Lancet. 2008;;371(9606)::75-84.
57. Saigal S, Doyle LW. An Overview of Mortality and Sequelae of Preterm Birth from
Infancy To Adulthood. Lancet. 2008;;371(9608)::261-269.

65
58. Wati LK. Hubungan antara Preeklampsia/Eklampsia dengan Kejadian Berat Badan
Lahir Rendah (BBLR) Di RSUD Dokter Soedarso Pontianak Tahun 2012. J Mhs PSPD
FK Univ Tanjungpura. 2013;;3(1).
59. Carolan M, Frankowska D. Advanced Maternal Age and Adverse Perinatal Outcome: A
Revies of the Evidence. Midwifery. 2010:: 1-8.
60. Giurgescu C, Sanguanklin N, Engeland CG, White-Traut RC, Park C, Mathews HL, et
al,. Relationships Among Psychosocial Factors, Biomarkers, Preeclampsia, and Preterm
Birth in African American Women: A pilot. Appl Nurs Res. 2014.
61. Heinonen S SS. Reproductive Risk Factors of Fetal Asphyxia at Delivery: A Population
Based Analysis. J Clin Epidemiol. 2001;;54(4)::407-410.
62. Kosim MS, Yunanto A, Dewi R, Sarosa G and Usman A,. Buku Ajar Neonatologi.
Pertama. Jakarta: Ikatan Dokter Anak Indonesia; 2008.
63. Prawirohardjo S. Ilmu Kandungan. Yayasan Bina Pustaka Jakarta; 2002.
64. Constance Sinclair. Buku Saku Kebidanan. Jakarta: Penerbit Buku Kedokteran EGC;
2003.
65. Sibai BM, Ramadan MK, Usta I, Salama M, Mercer BM, Friedman SA. Maternal
morbidity and mortality in 442 pregnancies with hemolysis, elevated liver enzymes, and
low platelets (HELLP syndrome). Am J Obstet Gynecol. 1993;169(4):1000-1006.
doi:10.1016/0002-9378(93)90043-I.
66. Audibert F, Friedman S a, Frangieh a Y, Sibai BM. Clinical utility of strict diagnostic
criteria for the HELLP (hemolysis, elevated liver enzymes, and low platelets) syndrome.
Am J Obstet Gynecol. 1996;175:460-464. doi:10.1016/S0002-9378(96)70162-X.
67. Hatsari Siahaan. Luaran Ibu dan Anak pada Penderita Preeklamosia Berat Usia
Kehamilan <37 Minggu dengan Penanganan secara Ekspetatif dan Aktif. 2011.
68. Haddad B, Barton JR, Livingston JC, Chahine R, Sibai BM. HELLP (hemolysis,
elevated liver enzymes, and low platelet count) syndrome versus severe preeclampsia:
Onset at ???28.0 weeks’ gestation. Am J Obstet Gynecol. 2000;183(6):1475-1479.
doi:10.1067/mob.2000.106975.

66
69. Afessa B, Green B, Delke I, Koch K. Systemic inflammatory response syndrome, organ
failure, and outcome in critically ill obstetric patients treated in an ICU. Chest.
2001;120(4):1271-1277. doi:10.1378/chest.120.4.1271.
70. Abramovici D, Friedman SA, Mercer BM, Audibert F, Kao L, Sibai BM. Neonatal
outcome in severe preeclampsia at 24 to 36 weeks’ gestation: Does the HELLP
(hemolysis, elevated liver enzymes, and low platelet count) syndrome matter? Am J
Obstet Gynecol. 1999;180(1 I):221-225. doi:10.1016/S0002-9378(99)70178-X.
71. Aslan H, Gul A, Cebeci A. Neonatal outcome in pregnancies after preterm delivery for
HELLP syndrome. Gynecol Obs Invest. 2004;58(2):96-99. doi:10.1159/000078679.
72. Raval DS, Co S, Reid MA, Pildes R. Maternal and neonatal outcome of pregnancies
complicated with maternal HELLP syndrome. J Perinatol. 1997;17(4):266-269.
http://www.ncbi.nlm.nih.gov/pubmed/9280089.
73. Audibert F, Benchimol Y, Benattar C, Champagne C, Frydman R. Prediction of
preeclampsia or intrauterine growth restriction by second trimester serum screening and
uterine Doppler velocimetry. Fetal Diagn Ther. 2005;20(1):48-53.
doi:10.1159/000081369.

67
LAMPIRAN 1

68
LAMPIRAN 2
69
LAMPIRAN 3
Frequencies
Frequency Table
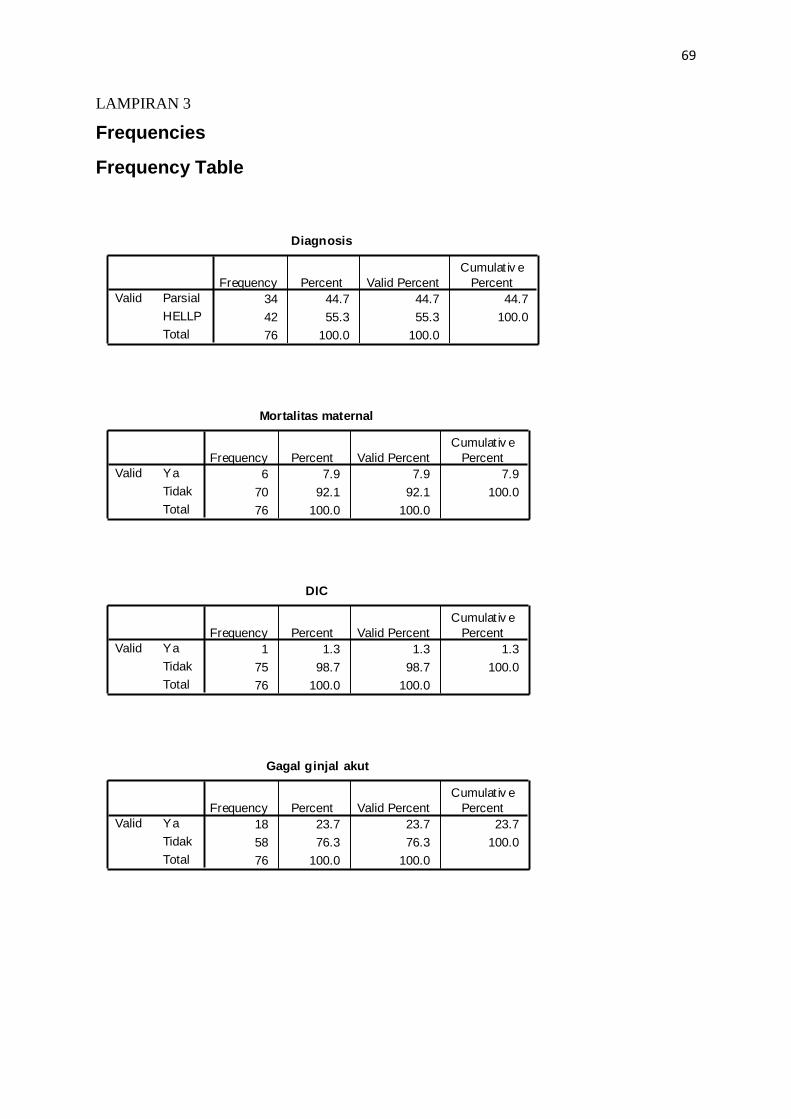
Diagnosis
34 44.7 44.7 44.7
42 55.3 55.3 100.0
76 100.0 100.0
Parsial
HELLP
Total
Valid
Frequency Percent Valid Percent
Cumulat iv e
Percent
Mortalitas maternal
6 7.9 7.9 7.9
70 92.1 92.1 100.0
76 100.0 100.0
Ya
Tidak
Total
Valid
Frequency Percent Valid Percent
Cumulat iv e
Percent
DIC
1 1.3 1.3 1.3
75 98.7 98.7 100.0
76 100.0 100.0
Ya
Tidak
Total
Valid
Frequency Percent Valid Percent
Cumulat iv e
Percent
Gagal ginjal akut
18 23.7 23.7 23.7
58 76.3 76.3 100.0
76 100.0 100.0
Ya
Tidak
Total
Valid
Frequency Percent Valid Percent
Cumulat iv e
Percent

70
Gangguan penglihatan
13 17.1 17.1 17.1
63 82.9 82.9 100.0
76 100.0 100.0
Ya
Tidak
Total
Valid
Frequency Percent Valid Percent
Cumulat iv e
Percent
Edema paru
17 22.4 22.4 22.4
59 77.6 77.6 100.0
76 100.0 100.0
Ya
Tidak
Total
Valid
Frequency Percent Valid Percent
Cumulat iv e
Percent
Eklampsia
18 23.7 23.7 23.7
58 76.3 76.3 100.0
76 100.0 100.0
Ya
Tidak
Total
Valid
Frequency Percent Valid Percent
Cumulat iv e
Percent
SIRS
4 5.3 5.3 5.3
72 94.7 94.7 100.0
76 100.0 100.0
Ya
Tidak
Total
Valid
Frequency Percent Valid Percent
Cumulat iv e
Percent
Perawatan ICU
41 53.9 53.9 53.9
35 46.1 46.1 100.0
76 100.0 100.0
Ya
Tidak
Total
Valid
Frequency Percent Valid Percent
Cumulat iv e
Percent
71
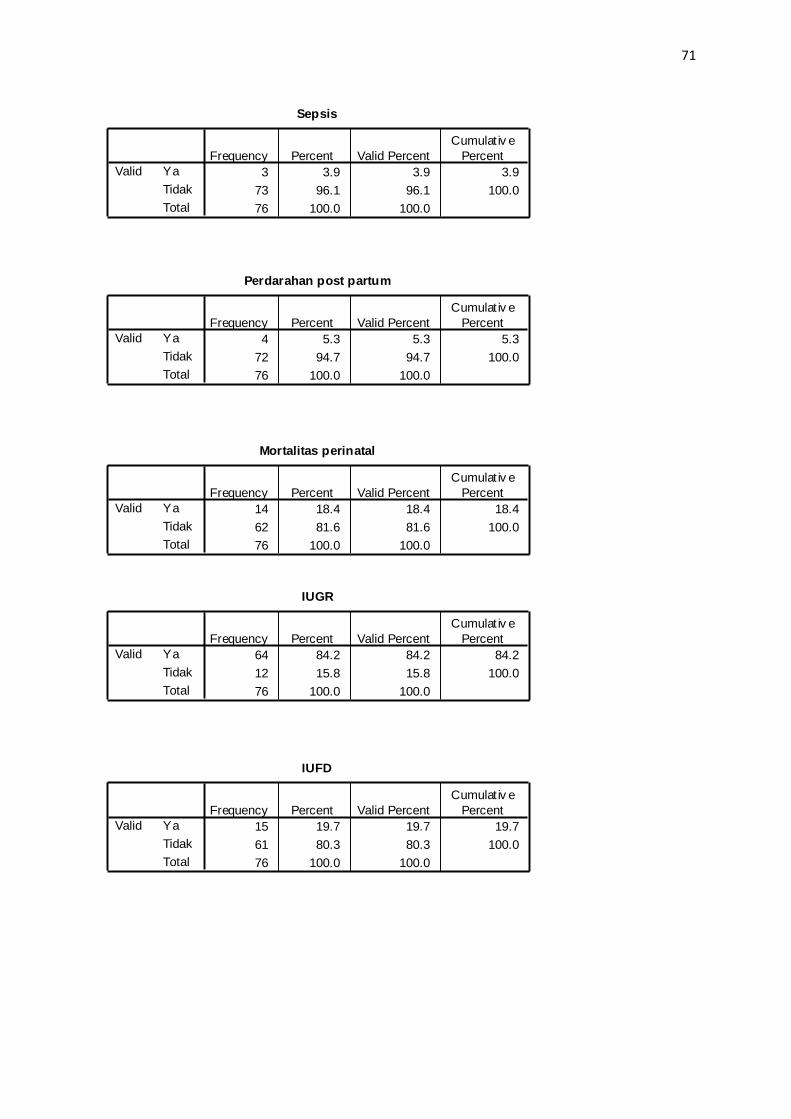
Sepsis
3 3.9 3.9 3.9
73 96.1 96.1 100.0
76 100.0 100.0
Ya
Tidak
Total
Valid
Frequency Percent Valid Percent
Cumulat iv e
Percent
Perdarahan post partum
4 5.3 5.3 5.3
72 94.7 94.7 100.0
76 100.0 100.0
Ya
Tidak
Total
Valid
Frequency Percent Valid Percent
Cumulat iv e
Percent
Mortalitas perinatal
14 18.4 18.4 18.4
62 81.6 81.6 100.0
76 100.0 100.0
Ya
Tidak
Total
Valid
Frequency Percent Valid Percent
Cumulat iv e
Percent
IUGR
64 84.2 84.2 84.2
12 15.8 15.8 100.0
76 100.0 100.0
Ya
Tidak
Total
Valid
Frequency Percent Valid Percent
Cumulat iv e
Percent
IUFD
15 19.7 19.7 19.7
61 80.3 80.3 100.0
76 100.0 100.0
Ya
Tidak
Total
Valid
Frequency Percent Valid Percent
Cumulat iv e
Percent

72
Asfiksia
36 47.4 47.4 47.4
40 52.6 52.6 100.0
76 100.0 100.0
Ya
Tidak
Total
Valid
Frequency Percent Valid Percent
Cumulat iv e
Percent
Gawat janin
18 23.7 23.7 23.7
58 76.3 76.3 100.0
76 100.0 100.0
Ya
Tidak
Total
Valid
Frequency Percent Valid Percent
Cumulat iv e
Percent
Kelahiran prematur
61 80.3 80.3 80.3
15 19.7 19.7 100.0
76 100.0 100.0
Ya
Tidak
Total
Valid
Frequency Percent Valid Percent
Cumulat iv e
Percent
Kelainan Doppler
28 36.8 36.8 36.8
48 63.2 63.2 100.0
76 100.0 100.0
Ya
Tidak
Total
Valid
Frequency Percent Valid Percent
Cumulat iv e
Percent

73
Crosstabs
Mortalitas maternal * Diagnosis
Crosstab
3 3 6
2.7 3.3 6.0
8.8% 7.1% 7.9%
31 39 70
31.3 38.7 70.0
91.2% 92.9% 92.1%
34 42 76
34.0 42.0 76.0
100.0% 100.0% 100.0%
Count
Expected Count
% within Diagnosis
Count
Expected Count
% within Diagnosis
Count
Expected Count
% within Diagnosis
Ya
Tidak
Mortalitas
maternal
Total
Parsial HELLP
Diagnosis
Total
Chi-Square Tests
.073b 1 .787
.000 1 1.000
.073 1 .788
1.000 .556
.072 1 .788
76
Pearson Chi-Square
Continuity Correctiona
Likelihood Ratio
Fisher's Exact Test
Linear-by-Linear
Association
N of Valid Cases
Value df
Asy mp. Sig.
(2-sided)
Exact Sig.
(2-sided)
Exact Sig.
(1-sided)
Computed only f or a 2x2 tablea.
2 cells (50.0%) hav e expected count less than 5. The minimum expected count is 2.
68.
b.
Risk Estimate
1.258 .237 6.672
1.129 .486 2.621
.897 .393 2.052
76
Odds Rat io for Mortalitas
maternal (Ya / Tidak)
For cohort Diagnosis =
Parsial
For cohort Diagnosis =
HELLP
N of Valid Cases
Value Lower Upper
95% Conf idence
Interv al

74
DIC * Diagnosis
Crosstab
1 0 1
.4 .6 1.0
2.9% .0% 1.3%
33 42 75
33.6 41.4 75.0
97.1% 100.0% 98.7%
34 42 76
34.0 42.0 76.0
100.0% 100.0% 100.0%
Count
Expected Count
% within Diagnosis
Count
Expected Count
% within Diagnosis
Count
Expected Count
% within Diagnosis
Ya
Tidak
DIC
Total
Parsial HELLP
Diagnosis
Total
Chi-Square Tests
1.252b 1 .263
.011 1 .915
1.625 1 .202
.447 .447
1.235 1 .266
76
Pearson Chi-Square
Continuity Correctiona
Likelihood Ratio
Fisher's Exact Test
Linear-by-Linear
Association
N of Valid Cases
Value df
Asy mp. Sig.
(2-sided)
Exact Sig.
(2-sided)
Exact Sig.
(1-sided)
Computed only f or a 2x2 tablea.
2 cells (50.0%) hav e expected count less than 5. The minimum expected count is .
45.
b.
Risk Estimate
2.273 1.761 2.934
76
For cohort
Diagnosis = Parsial
N of Valid Cases
Value Lower Upper
95% Conf idence
Interv al

75
Gagal ginjal akut * Diagnosis
Crosstab
9 9 18
8.1 9.9 18.0
26.5% 21.4% 23.7%
25 33 58
25.9 32.1 58.0
73.5% 78.6% 76.3%
34 42 76
34.0 42.0 76.0
100.0% 100.0% 100.0%
Count
Expected Count
% within Diagnosis
Count
Expected Count
% within Diagnosis
Count
Expected Count
% within Diagnosis
Ya
Tidak
Gagal ginjal
akut
Total
Parsial HELLP
Diagnosis
Total
Chi-Square Tests
.264b 1 .607
.059 1 .808
.263 1 .608
.787 .402
.261 1 .610
76
Pearson Chi-Square
Continuity Correctiona
Likelihood Ratio
Fisher's Exact Test
Linear-by-Linear
Association
N of Valid Cases
Value df
Asy mp. Sig.
(2-sided)
Exact Sig.
(2-sided)
Exact Sig.
(1-sided)
Computed only f or a 2x2 tablea.
0 cells (.0%) hav e expected count less than 5. The minimum expected count is 8.
05.
b.
Risk Estimate
1.320 .457 3.810
1.160 .670 2.008
.879 .526 1.468
76
Odds Rat io for Gagal
ginjal akut (Ya / Tidak)
For cohort Diagnosis
= Parsial
For cohort Diagnosis
= HELLP
N of Valid Cases
Value Lower Upper
95% Conf idence
Interv al

76
Gangguan penglihatan * Diagnosis
Crosstab
8 5 13
5.8 7.2 13.0
23.5% 11.9% 17.1%
26 37 63
28.2 34.8 63.0
76.5% 88.1% 82.9%
34 42 76
34.0 42.0 76.0
100.0% 100.0% 100.0%
Count
Expected Count
% within Diagnosis
Count
Expected Count
% within Diagnosis
Count
Expected Count
% within Diagnosis
Ya
Tidak
Gangguan penglihatan
Total
Parsial HELLP
Diagnosis
Total
Chi-Square Tests
1.791b 1 .181
1.065 1 .302
1.785 1 .181
.227 .151
1.767 1 .184
76
Pearson Chi-Square
Continuity Correctiona
Likelihood Ratio
Fisher's Exact Test
Linear-by-Linear
Association
N of Valid Cases
Value df
Asy mp. Sig.
(2-sided)
Exact Sig.
(2-sided)
Exact Sig.
(1-sided)
Computed only f or a 2x2 tablea.
0 cells (.0%) hav e expected count less than 5. The minimum expected count is 5.
82.
b.
Risk Estimate
2.277 .669 7.749
1.491 .886 2.511
.655 .319 1.343
76
Odds Rat io for Gangguan
penglihatan (Ya / Tidak)
For cohort Diagnosis =
Parsial
For cohort Diagnosis =
HELLP
N of Valid Cases
Value Lower Upper
95% Conf idence
Interv al

77
Edema paru * Diagnosis
Crosstab
6 11 17
7.6 9.4 17.0
17.6% 26.2% 22.4%
28 31 59
26.4 32.6 59.0
82.4% 73.8% 77.6%
34 42 76
34.0 42.0 76.0
100.0% 100.0% 100.0%
Count
Expected Count
% within Diagnosis
Count
Expected Count
% within Diagnosis
Count
Expected Count
% within Diagnosis
Ya
Tidak
Edema
paru
Total
Parsial HELLP
Diagnosis
Total
Chi-Square Tests
.790b 1 .374
.374 1 .541
.802 1 .371
.419 .272
.779 1 .377
76
Pearson Chi-Square
Continuity Correctiona
Likelihood Ratio
Fisher's Exact Test
Linear-by-Linear
Association
N of Valid Cases
Value df
Asy mp. Sig.
(2-sided)
Exact Sig.
(2-sided)
Exact Sig.
(1-sided)
Computed only f or a 2x2 tablea.
0 cells (.0%) hav e expected count less than 5. The minimum expected count is 7.
61.
b.
Risk Estimate
.604 .197 1.848
.744 .370 1.494
1.231 .804 1.887
76
Odds Rat io for Edema
paru (Ya / Tidak)
For cohort Diagnosis
= Parsial
For cohort Diagnosis
= HELLP
N of Valid Cases
Value Lower Upper
95% Conf idence
Interv al

78
Eklampsia * Diagnosis
Crosstab
8 10 18
8.1 9.9 18.0
23.5% 23.8% 23.7%
26 32 58
25.9 32.1 58.0
76.5% 76.2% 76.3%
34 42 76
34.0 42.0 76.0
100.0% 100.0% 100.0%
Count
Expected Count
% within Diagnosis
Count
Expected Count
% within Diagnosis
Count
Expected Count
% within Diagnosis
Ya
Tidak
Eklampsia
Total
Parsial HELLP
Diagnosis
Total
Chi-Square Tests
.001b 1 .977
.000 1 1.000
.001 1 .977
1.000 .598
.001 1 .977
76
Pearson Chi-Square
Continuity Correctiona
Likelihood Ratio
Fisher's Exact Test
Linear-by-Linear
Association
N of Valid Cases
Value df
Asy mp. Sig.
(2-sided)
Exact Sig.
(2-sided)
Exact Sig.
(1-sided)
Computed only f or a 2x2 tablea.
0 cells (.0%) hav e expected count less than 5. The minimum expected count is 8.
05.
b.
Risk Estimate
.985 .340 2.853
.991 .550 1.789
1.007 .627 1.617
76
Odds Rat io f or
Eklampsia (Ya / Tidak)
For cohort Diagnosis =
Parsial
For cohort Diagnosis =
HELLP
N of Valid Cases
Value Lower Upper
95% Conf idence
Interv al

79
SIRS * Diagnosis
Crosstab
2 2 4
1.8 2.2 4.0
5.9% 4.8% 5.3%
32 40 72
32.2 39.8 72.0
94.1% 95.2% 94.7%
34 42 76
34.0 42.0 76.0
100.0% 100.0% 100.0%
Count
Expected Count
% within Diagnosis
Count
Expected Count
% within Diagnosis
Count
Expected Count
% within Diagnosis
Ya
Tidak
SIRS
Total
Parsial HELLP
Diagnosis
Total
Chi-Square Tests
.047b 1 .828
.000 1 1.000
.047 1 .828
1.000 .609
.047 1 .829
76
Pearson Chi-Square
Continuity Correctiona
Likelihood Ratio
Fisher's Exact Test
Linear-by-Linear
Association
N of Valid Cases
Value df
Asy mp. Sig.
(2-sided)
Exact Sig.
(2-sided)
Exact Sig.
(1-sided)
Computed only f or a 2x2 tablea.
2 cells (50.0%) hav e expected count less than 5. The minimum expected count is 1.
79.
b.
Risk Estimate
1.250 .167 9.370
1.125 .408 3.099
.900 .331 2.450
76
Odds Ratio f or SIRS
(Ya / Tidak)
For cohort
Diagnosis = Parsial
For cohort
Diagnosis = HELLP
N of Valid Cases
Value Lower Upper
95% Conf idence
Interv al

80
Perawatan ICU * Diagnosis
Crosstab
19 22 41
18.3 22.7 41.0
55.9% 52.4% 53.9%
15 20 35
15.7 19.3 35.0
44.1% 47.6% 46.1%
34 42 76
34.0 42.0 76.0
100.0% 100.0% 100.0%
Count
Expected Count
% within Diagnosis
Count
Expected Count
% within Diagnosis
Count
Expected Count
% within Diagnosis
Ya
Tidak
Perawatan
ICU
Total
Parsial HELLP
Diagnosis
Total
Chi-Square Tests
.093b 1 .761
.005 1 .942
.093 1 .761
.819 .471
.092 1 .762
76
Pearson Chi-Square
Continuity Correctiona
Likelihood Ratio
Fisher's Exact Test
Linear-by-Linear
Association
N of Valid Cases
Value df
Asy mp. Sig.
(2-sided)
Exact Sig.
(2-sided)
Exact Sig.
(1-sided)
Computed only f or a 2x2 tablea.
0 cells (.0%) hav e expected count less than 5. The minimum expected count is 15.
66.
b.
Risk Estimate
1.152 .464 2.856
1.081 .653 1.791
.939 .627 1.407
76
Odds Rat io for Perawatan
ICU (Ya / Tidak)
For cohort Diagnosis =
Parsial
For cohort Diagnosis =
HELLP
N of Valid Cases
Value Lower Upper
95% Conf idence
Interv al

81
Sepsis * Diagnosis
Crosstab
2 1 3
1.3 1.7 3.0
5.9% 2.4% 3.9%
32 41 73
32.7 40.3 73.0
94.1% 97.6% 96.1%
34 42 76
34.0 42.0 76.0
100.0% 100.0% 100.0%
Count
Expected Count
% within Diagnosis
Count
Expected Count
% within Diagnosis
Count
Expected Count
% within Diagnosis
Ya
Tidak
Sepsis
Total
Parsial HELLP
Diagnosis
Total
Chi-Square Tests
.608b 1 .436
.035 1 .852
.609 1 .435
.584 .420
.600 1 .439
76
Pearson Chi-Square
Continuity Correctiona
Likelihood Ratio
Fisher's Exact Test
Linear-by-Linear
Association
N of Valid Cases
Value df
Asy mp. Sig.
(2-sided)
Exact Sig.
(2-sided)
Exact Sig.
(1-sided)
Computed only f or a 2x2 tablea.
2 cells (50.0%) hav e expected count less than 5. The minimum expected count is 1.
34.
b.
Risk Estimate
2.563 .222 29.534
1.521 .656 3.527
.593 .118 2.978
76
Odds Ratio f or
Sepsis (Ya / Tidak)
For cohort
Diagnosis = Parsial
For cohort
Diagnosis = HELLP
N of Valid Cases
Value Lower Upper
95% Conf idence
Interv al

82
Perdarahan post partum * Diagnosis
Crosstab
2 2 4
1.8 2.2 4.0
5.9% 4.8% 5.3%
32 40 72
32.2 39.8 72.0
94.1% 95.2% 94.7%
34 42 76
34.0 42.0 76.0
100.0% 100.0% 100.0%
Count
Expected Count
% within Diagnosis
Count
Expected Count
% within Diagnosis
Count
Expected Count
% within Diagnosis
Ya
Tidak
Perdarahan
post partum
Total
Parsial HELLP
Diagnosis
Total
Chi-Square Tests
.047b 1 .828
.000 1 1.000
.047 1 .828
1.000 .609
.047 1 .829
76
Pearson Chi-Square
Continuity Correctiona
Likelihood Ratio
Fisher's Exact Test
Linear-by-Linear
Association
N of Valid Cases
Value df
Asy mp. Sig.
(2-sided)
Exact Sig.
(2-sided)
Exact Sig.
(1-sided)
Computed only f or a 2x2 tablea.
2 cells (50.0%) hav e expected count less than 5. The minimum expected count is 1.
79.
b.
Risk Estimate
1.250 .167 9.370
1.125 .408 3.099
.900 .331 2.450
76
Odds Ratio f or
Perdarahan post
partum (Ya / Tidak)
For cohort
Diagnosis = Parsial
For cohort
Diagnosis = HELLP
N of Valid Cases
Value Lower Upper
95% Conf idence
Interv al

83
Mortalitas perinatal * Diagnosis
Crosstab
5 9 14
6.3 7.7 14.0
14.7% 21.4% 18.4%
29 33 62
27.7 34.3 62.0
85.3% 78.6% 81.6%
34 42 76
34.0 42.0 76.0
100.0% 100.0% 100.0%
Count
Expected Count
% within Diagnosis
Count
Expected Count
% within Diagnosis
Count
Expected Count
% within Diagnosis
Ya
Tidak
Mortalitas
perinatal
Total
Parsial HELLP
Diagnosis
Total
Chi-Square Tests
.565b 1 .452
.206 1 .650
.574 1 .449
.558 .327
.558 1 .455
76
Pearson Chi-Square
Continuity Correctiona
Likelihood Ratio
Fisher's Exact Test
Linear-by-Linear
Association
N of Valid Cases
Value df
Asy mp. Sig.
(2-sided)
Exact Sig.
(2-sided)
Exact Sig.
(1-sided)
Computed only f or a 2x2 tablea.
0 cells (.0%) hav e expected count less than 5. The minimum expected count is 6.
26.
b.
Risk Estimate
.632 .190 2.102
.764 .360 1.618
1.208 .766 1.903
76
Odds Rat io for Mortalitas
perinatal (Ya / Tidak)
For cohort Diagnosis =
Parsial
For cohort Diagnosis =
HELLP
N of Valid Cases
Value Lower Upper
95% Conf idence
Interv al
84
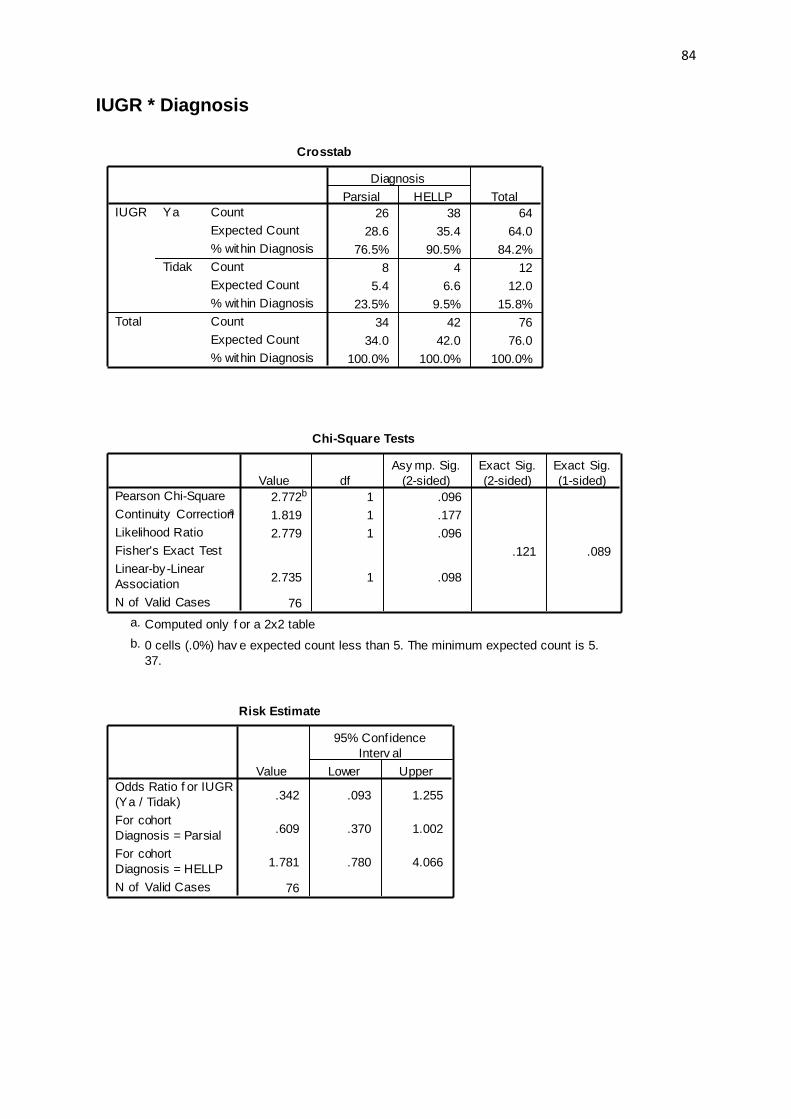
IUGR * Diagnosis
Crosstab
26 38 64
28.6 35.4 64.0
76.5% 90.5% 84.2%
8 4 12
5.4 6.6 12.0
23.5% 9.5% 15.8%
34 42 76
34.0 42.0 76.0
100.0% 100.0% 100.0%
Count
Expected Count
% within Diagnosis
Count
Expected Count
% within Diagnosis
Count
Expected Count
% within Diagnosis
Ya
Tidak
IUGR
Total
Parsial HELLP
Diagnosis
Total
Chi-Square Tests
2.772b 1 .096
1.819 1 .177
2.779 1 .096
.121 .089
2.735 1 .098
76
Pearson Chi-Square
Continuity Correctiona
Likelihood Ratio
Fisher's Exact Test
Linear-by-Linear
Association
N of Valid Cases
Value df
Asy mp. Sig.
(2-sided)
Exact Sig.
(2-sided)
Exact Sig.
(1-sided)
Computed only f or a 2x2 tablea.
0 cells (.0%) hav e expected count less than 5. The minimum expected count is 5.
37.
b.
Risk Estimate
.342 .093 1.255
.609 .370 1.002
1.781 .780 4.066
76
Odds Ratio f or IUGR
(Ya / Tidak)
For cohort
Diagnosis = Parsial
For cohort
Diagnosis = HELLP
N of Valid Cases
Value Lower Upper
95% Conf idence
Interv al

85
IUFD * Diagnosis
Crosstab
7 8 15
6.7 8.3 15.0
20.6% 19.0% 19.7%
27 34 61
27.3 33.7 61.0
79.4% 81.0% 80.3%
34 42 76
34.0 42.0 76.0
100.0% 100.0% 100.0%
Count
Expected Count
% within Diagnosis
Count
Expected Count
% within Diagnosis
Count
Expected Count
% within Diagnosis
Ya
Tidak
IUFD
Total
Parsial HELLP
Diagnosis
Total
Chi-Square Tests
.028b 1 .867
.000 1 1.000
.028 1 .867
1.000 .546
.028 1 .868
76
Pearson Chi-Square
Continuity Correctiona
Likelihood Ratio
Fisher's Exact Test
Linear-by-Linear
Association
N of Valid Cases
Value df
Asy mp. Sig.
(2-sided)
Exact Sig.
(2-sided)
Exact Sig.
(1-sided)
Computed only f or a 2x2 tablea.
0 cells (.0%) hav e expected count less than 5. The minimum expected count is 6.
71.
b.
Risk Estimate
1.102 .355 3.422
1.054 .573 1.940
.957 .567 1.615
76
Odds Ratio f or IUFD
(Ya / Tidak)
For cohort
Diagnosis = Parsial
For cohort
Diagnosis = HELLP
N of Valid Cases
Value Lower Upper
95% Conf idence
Interv al

86
Asfiksia * Diagnosis
Crosstab
18 18 36
16.1 19.9 36.0
52.9% 42.9% 47.4%
16 24 40
17.9 22.1 40.0
47.1% 57.1% 52.6%
34 42 76
34.0 42.0 76.0
100.0% 100.0% 100.0%
Count
Expected Count
% within Diagnosis
Count
Expected Count
% within Diagnosis
Count
Expected Count
% within Diagnosis
Ya
Tidak
Asf iksia
Total
Parsial HELLP
Diagnosis
Total
Chi-Square Tests
.766b 1 .381
.415 1 .519
.767 1 .381
.489 .260
.756 1 .384
76
Pearson Chi-Square
Continuity Correctiona
Likelihood Ratio
Fisher's Exact Test
Linear-by-Linear
Association
N of Valid Cases
Value df
Asy mp. Sig.
(2-sided)
Exact Sig.
(2-sided)
Exact Sig.
(1-sided)
Computed only f or a 2x2 tablea.
0 cells (.0%) hav e expected count less than 5. The minimum expected count is 16.
11.
b.
Risk Estimate
1.500 .604 3.724
1.250 .758 2.062
.833 .551 1.260
76
Odds Ratio f or
Asf iksia (Ya / Tidak)
For cohort
Diagnosis = Parsial
For cohort
Diagnosis = HELLP
N of Valid Cases
Value Lower Upper
95% Conf idence
Interv al

87
Gawat janin * Diagnosis
Crosstab
9 9 18
8.1 9.9 18.0
26.5% 21.4% 23.7%
25 33 58
25.9 32.1 58.0
73.5% 78.6% 76.3%
34 42 76
34.0 42.0 76.0
100.0% 100.0% 100.0%
Count
Expected Count
% within Diagnosis
Count
Expected Count
% within Diagnosis
Count
Expected Count
% within Diagnosis
Ya
Tidak
Gawat
janin
Total
Parsial HELLP
Diagnosis
Total
Chi-Square Tests
.264b 1 .607
.059 1 .808
.263 1 .608
.787 .402
.261 1 .610
76
Pearson Chi-Square
Continuity Correctiona
Likelihood Ratio
Fisher's Exact Test
Linear-by-Linear
Association
N of Valid Cases
Value df
Asy mp. Sig.
(2-sided)
Exact Sig.
(2-sided)
Exact Sig.
(1-sided)
Computed only f or a 2x2 tablea.
0 cells (.0%) hav e expected count less than 5. The minimum expected count is 8.
05.
b.
Risk Estimate
1.320 .457 3.810
1.160 .670 2.008
.879 .526 1.468
76
Odds Rat io for Gawat
janin (Ya / Tidak)
For cohort Diagnosis
= Parsial
For cohort Diagnosis
= HELLP
N of Valid Cases
Value Lower Upper
95% Conf idence
Interv al

88
Kelahiran prematur * Diagnosis
Crosstab
26 35 61
27.3 33.7 61.0
76.5% 83.3% 80.3%
8 7 15
6.7 8.3 15.0
23.5% 16.7% 19.7%
34 42 76
34.0 42.0 76.0
100.0% 100.0% 100.0%
Count
Expected Count
% within Diagnosis
Count
Expected Count
% within Diagnosis
Count
Expected Count
% within Diagnosis
Ya
Tidak
Kelahiran
prematur
Total
Parsial HELLP
Diagnosis
Total
Chi-Square Tests
.559b 1 .455
.209 1 .647
.556 1 .456
.565 .322
.551 1 .458
76
Pearson Chi-Square
Continuity Correctiona
Likelihood Ratio
Fisher's Exact Test
Linear-by-Linear
Association
N of Valid Cases
Value df
Asy mp. Sig.
(2-sided)
Exact Sig.
(2-sided)
Exact Sig.
(1-sided)
Computed only f or a 2x2 tablea.
0 cells (.0%) hav e expected count less than 5. The minimum expected count is 6.
71.
b.
Risk Estimate
.650 .209 2.021
.799 .458 1.393
1.230 .687 2.202
76
Odds Rat io for Kelahiran
prematur (Ya / Tidak)
For cohort Diagnosis =
Parsial
For cohort Diagnosis =
HELLP
N of Valid Cases
Value Lower Upper
95% Conf idence
Interv al

89
Kelainan Doppler * Diagnosis
Crosstab
11 17 28
12.5 15.5 28.0
32.4% 40.5% 36.8%
23 25 48
21.5 26.5 48.0
67.6% 59.5% 63.2%
34 42 76
34.0 42.0 76.0
100.0% 100.0% 100.0%
Count
Expected Count
% within Diagnosis
Count
Expected Count
% within Diagnosis
Count
Expected Count
% within Diagnosis
Ya
Tidak
Kelainan
Doppler
Total
Parsial HELLP
Diagnosis
Total
Chi-Square Tests
.533b 1 .465
.241 1 .624
.535 1 .464
.485 .313
.526 1 .468
76
Pearson Chi-Square
Continuity Correctiona
Likelihood Ratio
Fisher's Exact Test
Linear-by-Linear
Association
N of Valid Cases
Value df
Asy mp. Sig.
(2-sided)
Exact Sig.
(2-sided)
Exact Sig.
(1-sided)
Computed only f or a 2x2 tablea.
0 cells (.0%) hav e expected count less than 5. The minimum expected count is 12.
53.
b.
Risk Estimate
.703 .273 1.812
.820 .475 1.417
1.166 .779 1.744
76
Odds Rat io f or Kelainan
Doppler (Ya / Tidak)
For cohort Diagnosis =
Parsial
For cohort Diagnosis =
HELLP
N of Valid Cases
Value Lower Upper
95% Conf idence
Interv al

90
Logistic Regression
Block 1: Method = Backward Stepwise (Likelihood Ratio)
Classification Tablea
15 19 44.1
9 33 78.6
63.2
8 26 23.5
4 38 90.5
60.5
Observed
Parsial
HELLP
Diagnosis
Overall Percentage
Parsial
HELLP
Diagnosis
Overall Percentage
Step 1
Step 2
Parsial HELLP
Diagnosis Percentage
Correct
Predicted
The cut v alue is .500a.
Variables in the Equation
.961 .638 2.273 1 .132 2.615 .749 9.122
-1.193 .674 3.133 1 .077 .303 .081 1.136
-.163 1.333 .015 1 .903 .850
-1.073 .663 2.616 1 .106 .342 .093 1.255
1.452 .796 3.325 1 .068 4.272
Gangguan_penglihatan
IUGR
Constant
Step
1a
IUGR
Constant
Step
2a
B S.E. Wald df Sig. Exp(B) Lower Upper
95.0% C.I. for EXP(B)
Variable(s) entered on step 1: Gangguan_penglihatan, IUGR.a.

91
Tabel Frekuensi Data
Variabel F %
Diagnosis
HELLP 42 30,9
Parsial 34 25
Mortalitas maternal 6 7,9
DIC 1 1,3
Gagal ginjal akut 18 23,7
Gangguan penglihatan 13 17,1
Edema paru 17 22,4
Eklampsia 18 23,7
SIRS 4 5,3
Perawatan ICU 41 53,9
Sepsis 3 3,9
Perdarahan post partum 4 5,3
Mortalitas perinatal 14 18,4
IUGR 64 84,2
IUFD 15 19,7
Asfiksia 36 47,4
Gawat janin 18 23,7
Kelahiran prematur 61 80,3
Kelainan Doppler 28 36,8
Tabel hasil uji chi square antar diagnosis Parsial dan HELLP
Variabel
Diagnosis Bivariat Multivariat
Parsial HELLP p OR (IK95%) p
OR
(IK95%) n % n %

92
Mortalitas maternal 3 8,8 3 7,1 1,000‡ 1,26 (0,24-6,67)
DIC 1 2,9 0 0 0,447‡ –
Gagal ginjal akut 9 26,
5 9
21,
4 0,607§ 1,32 (0,46-3,81)
Gangguan penglihatan 8 23,
5 5
11,
9 0,181§ 2,28 (0,67-7,75) 0,132
2,62 (0,75-
9,12)
Edema paru 8 17,
6 11
26,
2 0,374§ 0,6 (0,20-1,85)
Eklampsia 8 23,
5 10
23,
8 0,977§ 0,99 (0,34-2,85)
SIRS 2 5,9 2 4,8 1,000‡ 1,25 (0,17-9,37)
Perawatan ICU 19 55,
9 22
52,
4 0,761§ 1,15 (0,46-2,86)
Sepsis 2 5,9 1 2,4 0,584‡ 2,56 (0,22-29,53)
Perdarahan post partum 2 5,9 2 4,8 1,000‡ 1,25 (0,17-9,37)
Mortalitas perinatal 5 14,
7 9
21,
4 0,452§ 0,63 (0,19-2,1)
IUGR 26 76,
5 38
90,
5 0,096§ 0,34 (0,09-1,26) 0,106
0,342 (0,09-
1,26)
IUFD 7 20,
6 8 19 0,867§ 1,1 (0,36-3,42)
Asfiksia 18 52,
9 18
42,
9 0,381§ 1,5 (0,6-3,72)
Gawat janin 9 26,
5 9
21,
4 0,607§ 1,32 (0,46-3,81)
Kelahiran prematur 26 76,
5 35
83,
3 0,455§ 0,65 (0,21-2,02)
Kelainan Doppler 11 32,
4 17
40,
5 0,465§ 0,7 (0,27-1,81)
Keterangan : § Pearson Chi Square; ‡ Fisher’s Exact Test

93
LAMPIRAN 4
Identitas
Nama : Adhityadeva N T
NIM : 22010112140029
Tempat/tanggal lahir : Semarang, 27 Oktober 1994
Jenis kelamin : Laki-laki
Nomor HP : 08112992710
e-mail : [email protected]
RiwayatPendidikan Formal
a. SD : SDN SOMPOK SEMRANG Lulus tahun : 2006
b. SMP : SMP N 8 SEMARANG Lulus tahun : 2009
c. SMA : SMA N 11 SEMARANG Lulus tahun : 2012
KeanggotaanOrganisasi
1. Anggota KASTRAT HIMA KU UNDIP Tahun 2013/2014