Embed Size (px)
Citation preview
Cyfrowy Polsat Group Investor Presentation
WOOD's Winter in Prague Emerging Europe Conference 2015 December 2015
Cyfrowy Polsat S.A. Capital Group

Disclaimer
This presentation includes 'forward-looking statements'. All statements other than statements of historical facts included in this presentation, including, without limitation, those regarding our financial position, business strategy, plans and objectives of management for future operations (including development plans and objectives relating to our products and services) are forward-looking statements. Such forward-looking statements involve known and unknown risks, uncertainties and other important factors that could cause the actual results, performance or achievements to be materially different from future results, performance or achievements expressed or implied by such forward-looking statements. Such forward-looking statements are based on numerous assumptions regarding our present and future business strategies and the environment in which we will operate in the future. These forward-looking statements speak only as at the date of this presentation. We expressly disclaim any obligation or undertaking to disseminate any updates or revisions to any forward-looking statements contained herein to reflect any change in our expectations with regard thereto or any change in events, conditions or circumstances on which any such statement is based. We caution you that forward-looking statements are not guarantees of future performance and that our actual financial position, business strategy, plans and objectives of management for future operations may differ materially from those made in or suggested by the forward-looking statements contained in this presentation. In addition, even if our financial position, business strategy, plans and objectives of management for future operations are consistent with the forward-looking statements contained in this presentation, those results or developments may not be indicative of results or developments in future periods. We do not undertake any obligation to review or to confirm or to release publicly any revisions to any forward-looking statements to reflect events that occur or circumstances that arise after the date of this presentation.
As consolidation of the results of Metelem Holding Company Limited, the company indirectly controlling Polkomtel, started from 7 May 2014, the Company has decided to adjust the method of presentation of its operational data so as to align it with the new structure and mode of operation of our Group. The presentation contains the new set of key performance indicators (KPI’s), covering our operations in the fields of telecommunications and pay TV. The operational indicators from before that period are only of informational nature and they demonstrate the impact that Metelem Group’s operational performance, Polkomtel’s results in particular, would have the Group’s operational results, had Metelem Group been part of Polsat Group during these periods. The KPI’s are illustrative only and due to their nature they only present a hypothetical situation, hence they do not present the Group’s actual operational results for specific periods.
.

Contents
1. Introduction to our business
2. Our market strategy
3. Operational KPIs
4. Financial results
5. Company financial performance vs peers
6. Deleveraging and dividend policies
7. Stock performance
8. Summary

1. Introduction to our business

Who we are
5
Polsat Group
Largest pay-tv platform in Poland
Poland’s leading mobile network
operator
Leading commercial broadcaster
Leader of the Polish online video market
We are one of the largest Polish companies and a leading media and telecommunications group in the region
27.2%
Orange 27.4%
T-Mobile 22.5%
Play 22.8%
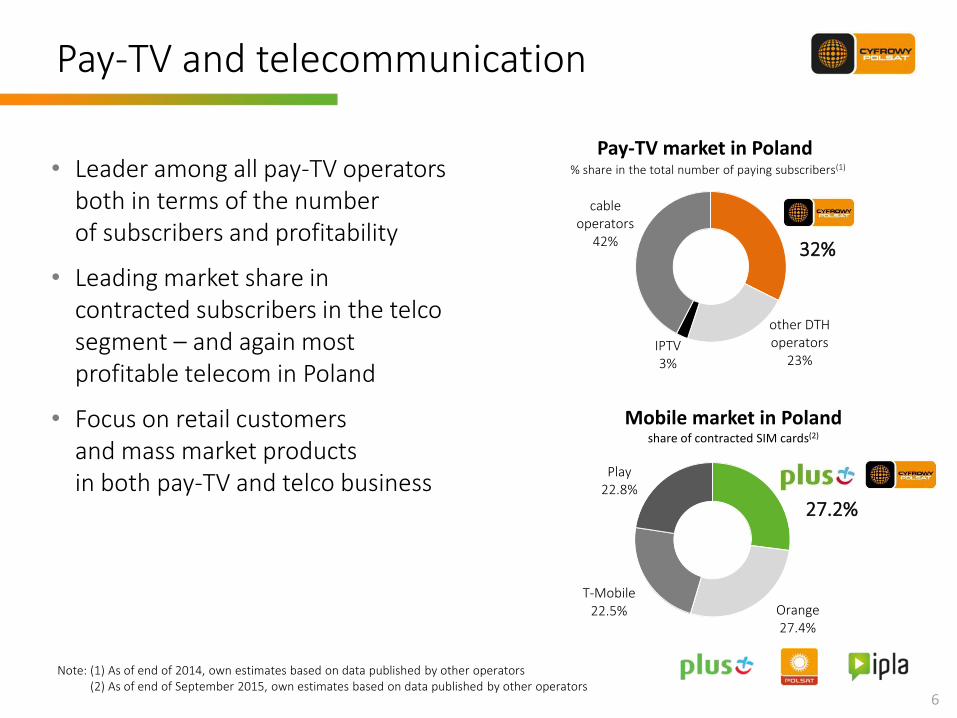
Pay-TV and telecommunication
6
Pay-TV market in Poland
Mobile market in Poland
share of contracted SIM cards(2)
• Leader among all pay-TV operators both in terms of the number of subscribers and profitability
• Leading market share in contracted subscribers in the telco segment – and again most profitable telecom in Poland
• Focus on retail customers and mass market products in both pay-TV and telco business
32%
other DTH operators
23% IPTV 3%
cable operators
42%
Note: (1) As of end of 2014, own estimates based on data published by other operators (2) As of end of September 2015, own estimates based on data published by other operators
% share in the total number of paying subscribers(1)

7
• Portfolio of 31 channels, providing us with 24.6% audience share
• Strong position on the TV ad market, with 26.0% market share
• IPLA – our own online video platform, with 3.6m users in Q3’15
Audience share
TV broadcasting and video online
Source: NAM, All 16‐49, all day, SHR%, 9M’15; Starlink, airtime and sponsoring; TV Polsat internal analysis; IPLA – internal analyssis, average number of unique users of the IPLA website/application
TV ad market share
Polsat Group 26.0%
Others 74.0%
Polsat Group 24.6%
TVN Group 21.9% TVP Group
23.6%
Other CabSat 19.5%
Other DTT 10.4%

1. The biggest LTE network coverage – over 92% of population
2. The largest mobile broadband customer base of 1.7m
3. Power LTE – real competition for fixed-line Internet access
Plus has been the winner in the mobile Internet test of „Komputer Świat” Axel Springer monthly. Additionally Plus received the „QUALITY” award for the fastest Internet access based on LTE technology
8
Leader of wireless broadband market

Unique offering vs. competition
9
Key content x – – – – x
Smartphones – – x x x x
In-H
om
e
TV x x – x – x
Broadband – x x x x x
Voice – x x x x x
Ou
t-o
f-H
om
e TV x – – x – x
Broadband – – x x x x
Voice – x x x x x
Source: Operator’s websites; products and services provided with its own infrastructure, or using MVNO model

2. Our market strategy

11
Leveraging the customer base potential
• Upselling and cross-selling of existing and potentially new products and services to the largest customer base in Poland
• Growing the customers’ revenue and long term loyalty
NEW products

12
Multiplay offer being the perfect tool for strategy execution
• Pay-TV, mobile telephony and mobile Internet – all services bundled under smartDOM offer
• smartDOM offer is available to both existing and new customers of the Group
• Bundled offer addressing both retail and small business customers
• A simple and flexible mechanism which offers clear benefits to customers contracting additional services offered by the Group
13
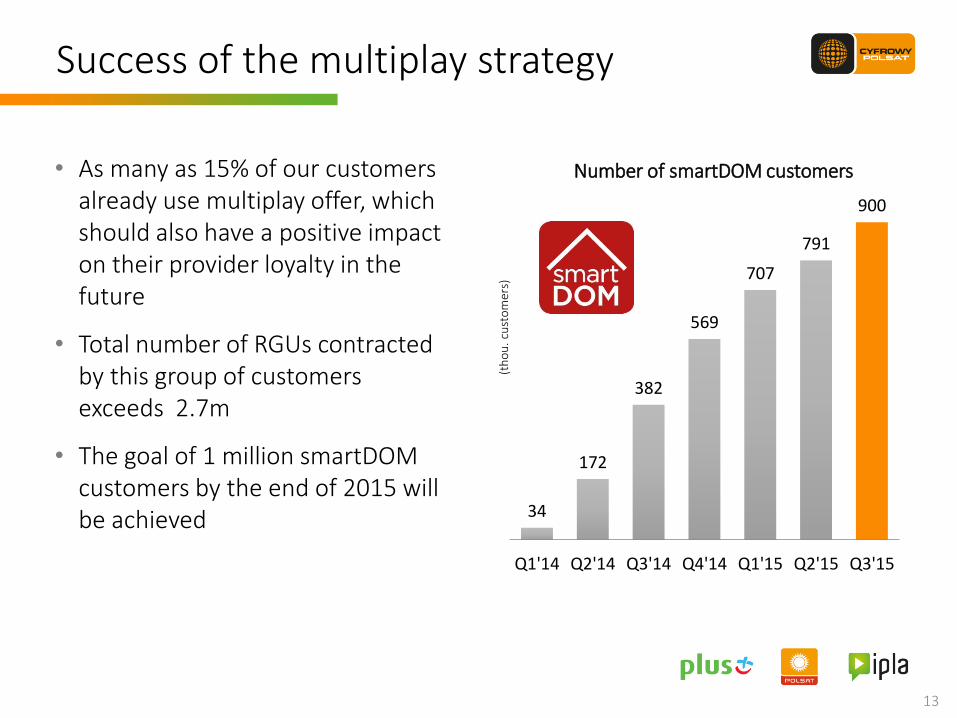
Success of the multiplay strategy
34
172
382
569
707
791
900
Q1'14 Q2'14 Q3'14 Q4'14 Q1'15 Q2'15 Q3'15
(th
ou
. cu
sto
mer
s)
Number of smartDOM customers • As many as 15% of our customers already use multiplay offer, which should also have a positive impact on their provider loyalty in the future
• Total number of RGUs contracted by this group of customers exceeds 2.7m
• The goal of 1 million smartDOM customers by the end of 2015 will be achieved

89
.1 90
.3
87
.6
87
.1
84
.8
85
.3 86
.5
87
.2
85
.8 87
.0 88
.1
Q1'13 Q2'13 Q3'13 Q4'13 Q1'14 Q2'14 Q3'14 Q4'14 Q1'15 Q2'15 Q3'15
11
80
0
11
86
9
11
90
8
11
97
9
11
98
3
12
02
3
12
23
1
12
34
8
12
39
5
12
37
7
12
41
9
Q1'13 Q2'13 Q3'13 Q4'13 Q1'14 Q2'14 Q3'14 Q4'14 Q1'15 Q2'15 Q3'15
14
Contract RGUs EOP Contract ARPU (PLN)
stable MTRs
+ +
Multiplay supports the continuous growth of the number of services and ARPU

15
The potential for the future
Source: European Commission - E-Communications Household Survey, March 2014
Multi-play penetration in Europe
21%
46% 46%
54% 55%
61% 64%
75%
Poland EU Spain UK Sweden Germany France
• Our strategic goal assumes the highest possible saturation of our customer base with integrated services
• A large group of our customers lives in less urbanized areas, where multiplay offers have been practically unavailable so far
• Mutual benefits resulting from the multiplay offer both for the customer and the operator
The Netherlands

3. Operational KPIs

53
80
33
52
25
19
89
47
14
-31
22
Q1
'13
Q2
'13
Q3
'13
Q4
'13
Q1
'14
Q2
'14
Q3
'14
Q4
'14
Q1
'15
Q2
'15
Q3
'15
4 0
48
4 1
28
4 1
60
4 2
12
4 2
37
4 2
56
4 3
45
4 3
92
4 4
05
4 3
75
4 3
96
Q1
'13
Q2
'13
Q3
'13
Q4
'13
Q1
'14
Q2
'14
Q3
'14
Q4
'14
Q1
'15
Q2
'15
Q3
'15
6 9
42
6 8
91
6 8
35
6 7
79
6 7
14
6 6
45
6 6
17
6 5
88
6 5
52
6 5
19
6 5
05
Q1
'13
Q2
'13
Q3
'13
Q4
'13
Q1
'14
Q2
'14
Q3
'14
Q4
'14
Q1
'15
Q2
'15
Q3
'15
17
Mobile telephony
our aspirations: to stabilize the base
Pay-TV Internet
to grow fast based on our competitive advantage
to sustain organic growth
-38
-50
-57
-56
-65
-69
-27
-29
-36
-33
-14
Q1
'13
Q2
'13
Q3
'13
Q4
'13
Q1
'14
Q2
'14
Q3
'14
Q4
'14
Q1
'15
Q2
'15
Q3
'15
50
39
63
74
44
91
14
6
10
0
69
46
34
Q1
'13
Q2
'13
Q3
'13
Q4
'13
Q1
'14
Q2
'14
Q3
'14
Q4
'14
Q1
'15
Q2
'15
Q3
'15
qu
arte
rly
net
ad
ds
c
on
trac
t R
GU
s EO
P
81
1
85
0
91
3
98
8
1 0
32
1 1
23
1 2
69
1 3
68
1 4
37
1 4
83
1 5
17
Q1
'13
Q2
'13
Q3
'13
Q4
'13
Q1
'14
Q2
'14
Q3
'14
Q4
'14
Q1
'15
Q2
'15
Q3
'15
KPIs – retail customer services

89.1 90.3 87.6 87.1
84.8 85.3 86.5 87.2 85.8 87.0 88.1
1.9 1.9 1.9 1.9 1.9 1.9 2.0 2.0 2.0 2.1 2.1
150%
250%
50
60
70
80
90
Q1'13 Q2'13 Q3'13 Q4'13 Q1'14 Q2'14 Q3'14 Q4'14 Q1'15 Q2'15 Q3'15
ARPU RGU/customer
11.8 11.9 11.9 12.0 12.0 12.0 12.2 12.3 12.4 12.4 12.4
0
5
10
15
Q1'13 Q2'13 Q3'13 Q4'13 Q1'14 Q2'14 Q3'14 Q4'14 Q1'15 Q2'15 Q3'15
KPIs – retail customer services
18
(m o
f R
GU
s)
Total number of RGU contract services
(AR
PU
in P
LN)
ARPU
6.3 6.3 6.3 6.3 6.3 6.2 6.2 6.1 6.1 6.0 5.9
01234567
Q1'13 Q2'13 Q3'13 Q4'13 Q1'14 Q2'14 Q3'14 Q4'14 Q1'15 Q2'15 Q3'15
(m o
f cu
sto
mer
s)
Total number of customers
8.7% 8.8% 9.0% 9.2% 9.1% 8.8% 8.8% 9.1% 9.5% 10.1% 10.2%
0%
5%
10%
15%
Q1'13 Q2'13 Q3'13 Q4'13 Q1'14 Q2'14 Q3'14 Q4'14 Q1'15 Q2'15 Q3'15
Churn
stable MTRs
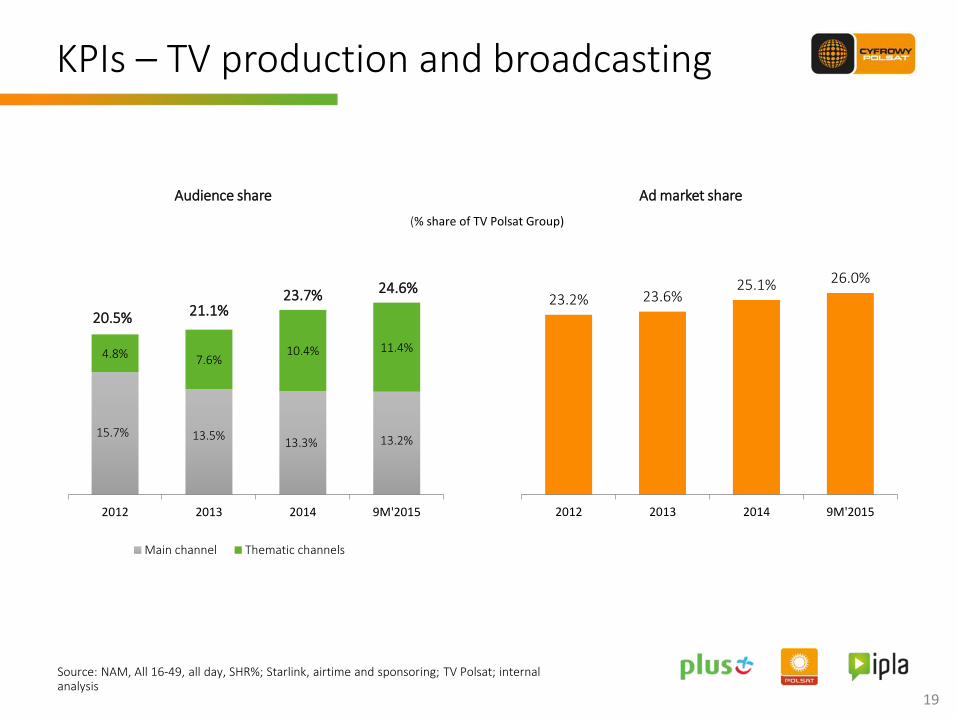
KPIs – TV production and broadcasting
Source: NAM, All 16‐49, all day, SHR%; Starlink, airtime and sponsoring; TV Polsat; internal analysis
19
20.5% 21.1% 23.7% 24.6%
4.8% 7.6% 10.4% 11.4%
0%
5%
10%
15%
20%
25%
30%
2012 2013 2014 9M'2015
Main channel Thematic channels
Audience share
23.2% 23.6% 25.1% 26.0%
0%
5%
10%
15%
20%
25%
30%
2012 2013 2014 9M'2015
Ad market share
(% share of TV Polsat Group)
15.7% 13.5% 13.3% 13.2%

4. Financial results

2,8 2,9 2,8 1,9
2012 2013 2014 9M'15
10,9 9,9
9,1 9,2
2012 2013 2014 9M'15
2,5 2,0 1,6
12,3 11,1
2010 2011 2012 2013 2014 9M'15
1,5 2,4
2,8 2,9
7,4 7,2
2010 2011 2012 2013 2014 9M'15
0,4 0,7 1,0 1,0
2,7 2,8
2010 2011 2012 2013 2014 9M'15
Source: condensed consolidated financial statements Note: (1) consolidation of TV Polsat Group (2) consolidation of Metelem Group 21
Strong and resilient business profile
bn PLN bn PLN
Revenues EBITDA Net debt
Cyfrowy Polsat Group
7,2 6,7 6,7
5,1
2012 2013 2014 9M'15
bn PLN bn PLN
Revenues EBITDA
Metelem Group
bn PLN
(1) (2)
Net debt bn PLN
0,0
(1) (2) (1) (2)

Source: Interim condensed consolidated financial statements for the 3 and 9 month periods ended 30 September 2015 and internal analysis
22
Revenue and operating costs structure
Revenue structure Operating costs structure
68%
26%
5%
1%
Retail revenue
Wholesale revenue
Sale of equipment
Other revenue
27%
22% 16.5%
13.5%
10%
7%
1% 3%
Technical costs and cost of settlements with telecommunication operators
Depreciation, amortization, impairment and liquidation
Cost of equipment sold
Content cost
Distribution, marketing, customer relation management and retention costs
Salaries and employee-related costs
Cost of debt collection services and bad debt allowance and receivables written off
Other costs
9M’15 9M’15

23
Source: Interim condensed consolidated financial statements for the 3 and 9 month periods ended 30 September 2015 and internal analysis Note: (1) Nominal value of debt, excl. CP and PLK Revolving Loans (2) Equivalent of the nominal value of EUR 542.5m and USD 500m PLK Senior Notes calculated at the average foreign exchange rates of the Polish National Bank as at September 30, 2015 of PLN/EUR 4.2386 and PLN/USD 3.7754, respectively. In connection with the process of refinancing, which assumes the redemption of the PLK Senior Notes at the turn of January and February of 2016, indebtedness under the PLK Senior Notes is presented as current liabilities from issued bonds in the consolidated balance sheet as at September 30, 2015. (3) Adjusted for transitory VAT settlements
Balance sheet and FCF
Adjusted FCF after interest3
(mPLN)
311 414
86
680
208
Q3'14 Q4'14 Q1'15 Q2'15 Q3'15
Lower share of installment
plan sales, advance CIT, lower CAPEX,
lower interest
HY PLK coupon,
annual UMTS fee
HY PLK coupon,
settlement of 2014 CAPEX
higher investments
in customers,
rescheduling of CP’s interest
HY PLK coupon,
annual UMTS fee,
higher CAPEX,
higher according to
schedule fees for GB
LTM PLN 1,388m
4,1872
0
858 963 1,068
1,173 1,000
2015 2016 2017 2018 2019 2020 2021
Our debt maturing profile1
SFA CP SFA PLK PLK Senior Notes series A Bonds
6,826
5. Company financial performance vs. peers

2014 YoY revenue dynamics of Polsat Group vs TMT peers
(pro-forma)
(excl. Metelem)
We are focused on monetizing our competitive strengths…
25
• The new Polsat Group, being composed of two relatively stable businesses (mobile telco and DTH), strongly growing mobile broadband leg and rebounding TV broadcasting business, clearly outperforms local telco incumbents as well as direct media competitors in terms of revenue dynamics
• As a result, with a growing ad market, stable MTRs and rational behavior of our competitors, revenue stream of our Group is expected to grow organically in future
3.6%
18.1%
-4.6%
-10.8%
-6.1%
-4.5%
-1.7%
8.6%
0.7%
-30% -25% -20% -15% -10% -5% 0% 5% 10% 15% 20%
Orange
T-Mobile
Netia
avg telco
incumbents
Play
TVN

2014 EBITDA margins of Polsat Group vs TMT peers
(pro-forma)
(excl. Metelem)
…and delivering returns to our shareholders and lenders
26
• Cyfrowy Polsat entered DTH market in 2001 as a market challenger, nevertheless aligning dynamic growth of the business with continuously taking care of operating efficiency was our key assumption
• Since 2011 Polkomtel continuously outperforms local telco market on operating efficiency, while simultaneously keeping revenue level comparable with peers
• As a result, the enlarged Polsat Group currently outperforms both incumbents, as well as challengers in terms of EBITDA generation
34.4%
24.4%
35.5%
29.4%
38.8%
32.1%
40.2%
32.4%
39.1%
0% 10% 20% 30% 40% 50% 60%
TVN
Play
Netia
T-Mobile
Orange
avg telco incumbents

6. Deleveraging and dividend policies

Current policies
28
• Management goal is to deleverage below the level of 2.5x net debt/EBITDA as soon as possible
• Dividend policy is directly linked with the deleveraging strategy and allow the Company to dividend payment net debt/EBITDA below 2.5x level
3.1x
2013* 2014 2015 2016
Expected leverage ratio1
2.5x
* LTM 3Q’13 pro forma leverage
Note: (1) presented in November 2013 with the PLK acquisition
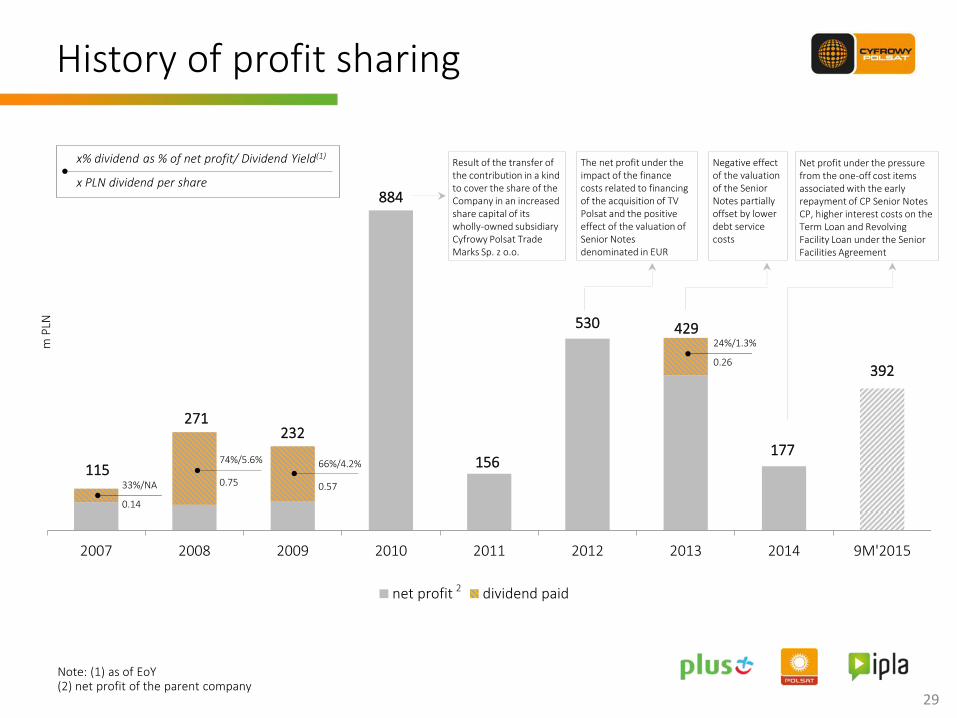
115
271 232
884
156
530 429
177
392
2007 2008 2009 2010 2011 2012 2013 2014 9M'2015
m P
LN
net profit dividend paid
29
History of profit sharing
x% dividend as % of net profit/ Dividend Yield(1)
x PLN dividend per share
33%/NA
0.14
24%/1.3%
0.26
74%/5.6%
0.75
66%/4.2%
0.57
Note: (1) as of EoY (2) net profit of the parent company
Result of the transfer of the contribution in a kind to cover the share of the Company in an increased share capital of its wholly-owned subsidiary Cyfrowy Polsat Trade Marks Sp. z o.o.
The net profit under the impact of the finance costs related to financing of the acquisition of TV Polsat and the positive effect of the valuation of Senior Notes denominated in EUR
Negative effect of the valuation of the Senior Notes partially offset by lower debt service costs
Net profit under the pressure from the one-off cost items associated with the early repayment of CP Senior Notes CP, higher interest costs on the Term Loan and Revolving Facility Loan under the Senior Facilities Agreement
2

7. Stock performance

Stock performance since IPO
Performance of Cyfrowy Polsat shares since the IPO on the WSE in May 2008 compared to WSE indexes
(indexed; 100 = closing price on May 6, 2008)
Note: (1) change November 30, 2015 vs May 6, 2008
31
0%
50%
100%
150%
200%
250%
May-08
Jul-08
Sep-08
Nov-08
Jan-09
Mar-09
May-09
Jul-09
Sep-09
Nov-09
Jan-10
Mar-10
May-10
Jul-10
Sep-10
Nov-10
Jan-11
Mar-11
May-11
Jul-11
Sep-11
Nov-11
Jan-12
Mar-12
May-12
Jul-12
Sep-12
Nov-12
Jan-13
Mar-13
May-13
Jul-13
Sep-13
Nov-13
Jan-14
Mar-14
May-14
Jul-14
Sep-14
Nov-14
Jan-15
Mar-15
May-15
Jul-15
Sep-15
Nov-15
CPS WIG WIG-Media Orange WIG-Telcom
9%(1)
1%(1)
83%(1)
70%(1)
34%(1)
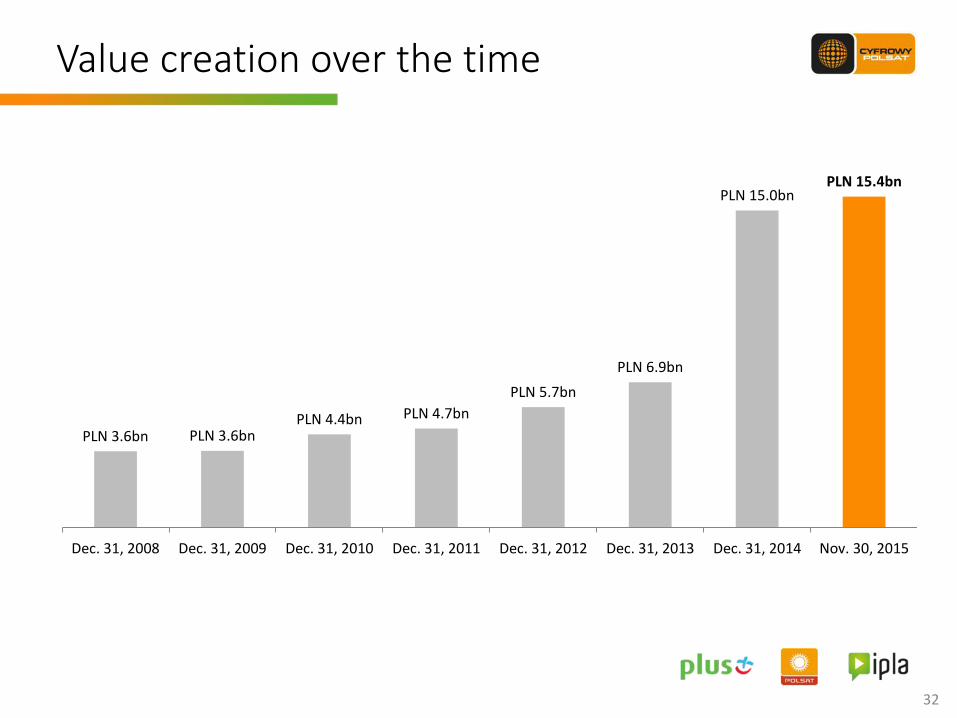
Value creation over the time
32
PLN 3.6bn PLN 3.6bn PLN 4.4bn PLN 4.7bn
PLN 5.7bn
PLN 6.9bn
PLN 15.0bn PLN 15.4bn
Dec. 31, 2008 Dec. 31, 2009 Dec. 31, 2010 Dec. 31, 2011 Dec. 31, 2012 Dec. 31, 2013 Dec. 31, 2014 Nov. 30, 2015

33
Polsat Group market capitalization vs WIG-20 and other listed TMT companies1
Largest listed TMT Group on WSE
PLNbn
Source: 1) stooq.pl, as of November 30, 2015
15.4
8.9
1.9
0 5 10 15 20 25 30 35 40
Pekao (banking)
PKO BP (banking)
PZU (insurance)
PGNiG (gas)
PKN Orlen (oil)
BZWBK (banking)
PGE (energy)
CPS (TMT)
KGHM (natural resources)
mBank (banking)
LPP (clothing)
Orange (TMT)
Eurocash (retail)
Energa (energy)
Alior (banking)
Enea (energy)
Tauron (energy)
Synthos (chemical)
Asseco (IT)
Netia (TMT)
Bogdanka (natural resources)

8. Summary
Investment summary
• Unique product portfolio and large customer base provides with the potential to grow revenues long term
• Execution of multiplay strategy supported by growing telco and television markets
• Strong financial profile against the peers supports further value creation
• Effective execution of the deleveraging strategy may accelerate the potential future returns from dividend payments
35

9. Appendix

Current operational performance a. Services to individual and
business customers

6.6m 6.6m 6.6m 6.5m 6.5m
4.3m 4.4m 4.4m 4.4m 4.4m
1.3m 1.4m 1.4m 1.5m 1.5m
Q3'14 Q4'14 Q1'15 Q2'15 Q3'15
Telefonia komórkowa
Płatna telewizja
Internet
38
12.23m 12.42m 12.35m 12.39m 12.38m
Internet Pay TV Mobile telephony
Consistent building of contract service base
• Growth of our total contract service base by 42K (q/q)
• Further growth of mobile Internet RGUs supported by broader LTE coverage
• Return to the growth of pay TV RGUs
• Visible slowdown of the price erosion on the mobile telephony market, leading to the stabilization of the voice service customer base
• Most favorable MNP balance over the last 6 years

11
-6
-30 -30 -30
-14 -7
1Q'14 2Q'14 3Q'14 4Q'14 1Q'15 2Q'15 3Q'15
-65 -50 -49
-67 -61 -72
-83
1Q'14 2Q'14 3Q'14 4Q'14 1Q'15 2Q'15 3Q'15
157 130
145 157 135
116 93
Q1'14 Q2'14 Q3'14 Q4'14 Q1'15 Q2'15 Q3'15
Most favorable MNP balance over the last 6 years
39
Number portability to/from Plus network (thou.) Balance Orange
Balance T-Mobile
Balance Play
Source: MNPs interpreter interface of Location and Information Platform with the Central Database of UKE (Office of Electronic Communications)
38
36
42
58
61
48
69
13
7
10
8
10
7
11
5
11
2
96
92
-100
-73 -65
-57 -51 -48
-23
Q1'14 Q2'14 Q3'14 Q4'14 Q1'15 Q2'15 Q3'15
ported-in PLUS ported out PLUS balance PLUS

86.5 87.2 85.8 87.0 88.1
1.98 2.01 2.04 2.07 2.09
150%
250%
50
55
60
65
70
75
80
85
90
Q3'14 Q4'14 Q1'15 Q2'15 Q3'15
ARPU RGU/customer
40
(AR
PU
in P
LN)
Effective building of ARPU per customer
• Consistent execution of our strategy, resulting in the increased saturation of the customer base with contract services
• Visible growth of ARPU per customer to PLN 88.1 as a result of upselling additional products and services, mainly attributed to our smartDOM offer
• The process of migration of customers to unlimited tariffs is nearly completed. This combined with recent reduction of the price pressure suggests positive prospects for the future

41
4.2m
18.3 18.2 17.3 18.3 19.0
Q3'14 Q4'14 Q1'15 Q2'15 Q3'15
4.0m 4.1m 4.0m 4.0m
Q3'14 Q4'14 Q1'15 Q2'15 Q3'15
Telefonia komórkowa
Internet
Pay TV Internet Mobile telephony
(AR
PU
in P
LN)
Prepaid – stable base and further ARPU growth
• Value of the prepaid services market back on the growth path as a result of a long-term price stability in this segment
• Growth of data consumption by smartphones and higher volumes of exchanged traffic are positively reflected in the level of ARPU
• ARPU of our customers continues to grow at the rate of 3.8% YoY

1.0K
3.1K
March 2015 October 2015
42
1,123 1,269
1,368 1,437 1,483 1,517
Q2'14 Q3'14 Q4'14 Q1'15 Q2'15 Q3'15
Growth of the base of contract Internet RGUs
Rapid expansion of the LTE800
BTS
on
-air
Leader of the mobile Internet market
Note: (1) Including Internet RGUs in the contract model, as well as other SIM cards for which data transfer exceeded 1MB in a given month
• Already 3.1K base stations operate in the LTE800 technology, providing Plus and CP customers with the broadest LTE coverage in Poland
• The number of contract customers of mobile Internet exceeded 1.5m
• In September 2015, a total of 5.1m cards(1) logged in our network and actively used data transmission
• In Q3’15 our customers consumed nearly 58m GBs through Midas network
• Total LTE network coverage exceeds 92%; Together with Midas Group we are currently launching on average 10 new LTE800 stations daily

Current operational performance b. Broadcasting and
TV production segment

755 804
Q3'14 Q3'15
Market expenditures on TV advertising and sponsorship
Viewership of our channels and position on the ad market in Q3’15
Source: NAM, All 16‐49, all day, SHR%; Starlink, airtime and sponsorship; TV Polsat; internal analysis Note: (1) Revenue from advertising and sponsorship of TV Polsat Group according to Starlink’s definition
Thematic channels 24.1%
21.9% 22.9%
21.1%
10.0%
25.2%
22.0% 22.6%
19.7%
10.5%
Polsat Group TVN Group TVP Group Other CabSat Other DTT
Q3'14
Q3'15
Dynamics of audience share results Audience shares
Main channels
44
198 222
Q3'14 Q3'15
Revenue from advertising and sponsorship of TV Polsat Group(1)
+6.4%
+11.9%
mlP
LN
mP
LN
12.4%
9.9% 8.1%
POLSAT TVN TVP
12.8% 12.0%
7.5% 7.0%
POLSAT TVN TVP 1 TVP 2

KPI – Broadcasting and TV production segment in 9M’15
Source: NAM, All 16‐49, all day, SHR%; Starlink, airtime and sponsorship; TV Polsat; internal analysis
45
20.5% 21.1% 23.7% 24.6%
4.8% 7.6% 10.4% 11.4%
0%
10%
20%
30%
2012 2013 2014 9M'15
Main channel Thematic channels
Audience shares
23.2% 23.6% 25.1% 26.0%
0%
10%
20%
30%
2012 2013 2014 9M'15
TV ad market shares
(% share of TV Polsat Group)
15.7% 13.5% 13.3% 13.2%
(% share of TV Polsat Group)
• Polsat’s main channel and thematic channels are the viewership leaders in the commercial group
• Polsat Group viewership in line with the strategy
• TV advertising and sponsorship market in 9M’15 increased YoY by 4.2%
• Revenue from TV advertising and sponsorship of TV Polsat Group grew faster than the market
• Our share in the TV advertising market increased to 26.0%
• We maintain our expectations on the middle single‐digit increase of the TV advertising market in 2015

Financial results Q3’15

mPLN Q3’15 YoY change
Revenue 2,415 0%
Operating costs(1) 1,499 (1%)
EBITDA 930 2%
EBITDA margin 38.5% 0.9pp
Net profit 502 945%
47
Source: Interim condensed consolidated financial statements for the 3 and 9 month periods ended 30 September 2015 and internal analysis Note: (1) Costs exclude depreciation, amortization, impairment and liquidation
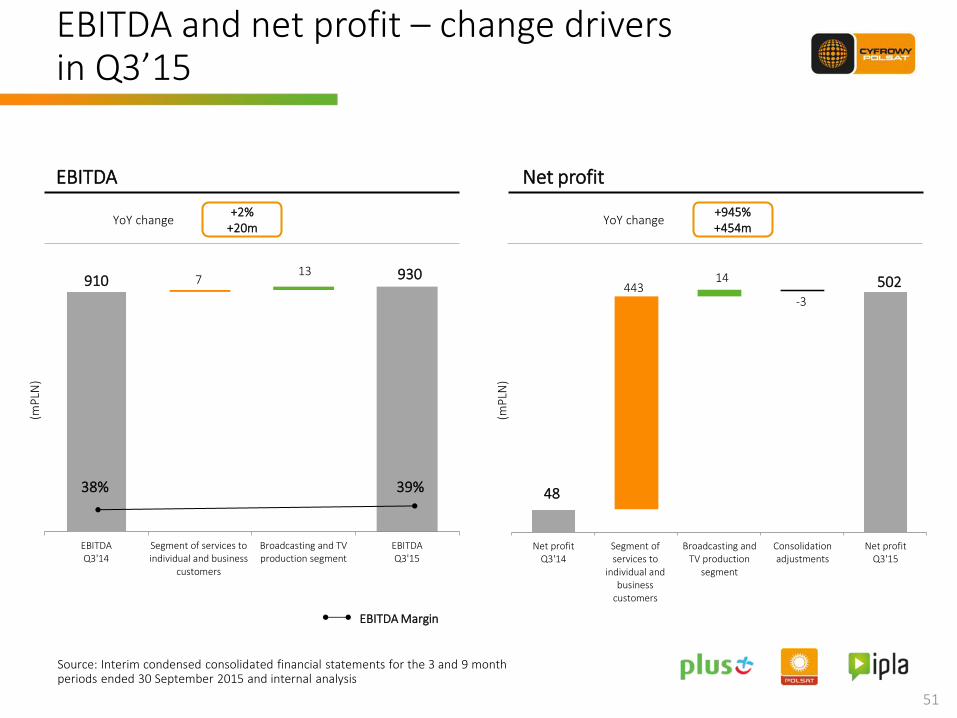
Group’s financial results in Q3’15
• Stable revenue and decrease in operating costs resulting in an increase in EBITDA by PLN 20m and an increase in EBITDA margin to almost 39%
• Net profit influenced by a number of non-cash one-off events related to the refinancing of debt of the capital group

mPLN Q3’15 YoY change
Revenue 2,174 1%
Operating costs(1) 1,344 1%
EBITDA 844 1%
EBITDA margin 38.8% 0.1pp
48
Results of the segment of services to individual and business customers in Q3’15
Source: Interim condensed consolidated financial statements for the 3 and 9 month periods ended 30 September 2015 and internal analysis Note: (1) Costs exclude depreciation, amortization, impairment and liquidation
• Increase in revenue due mainly to an increase in wholesale revenue and equipment sales
• Operating costs under control. The increase of technical costs and cost of settlements with telecommunication operators compensated by a decrease of cost of equipment sold
• Consequently, EBITDA growth by PLN 7m

49
Source: Interim condensed consolidated financial statements for the 3 and 9 month periods ended 30 September 2015 and internal analysis Note: (1) Costs exclude depreciation, amortization, impairment and liquidation (2) One-off in Q3’14: FIVB World Championship
mPLN Q3’15 YoY change
Revenue 283 -10%
Operating costs(1) 198 -19%
EBITDA 86 17%
EBITDA margin 30.4% 7.1pp
Results of the broadcasting and TV production segment in Q3’15
• Increase of adjusted revenue by 14%(2) mainly due to the monetization of higher audience shares of Polsat Group channels
• Growth of adjusted costs by 15%(2) associated with additional investments in the programming offer of TV4 as well as higher costs of amortization of film and sports licenses (in relation to the UEFA EURO 2016 Qualifiers)
• Dynamic growth of reported EBITDA by PLN 13m and EBITDA margin to over 30%

50
Source: Interim condensed consolidated financial statements for the 3 and 9 month periods ended 30 September 2015 and internal analysis
-5% -92m
2,420 2,415 13
-32
14
RevenueQ3'14
Segment ofservices to
individual andbusiness
customers
Broadcasting andTV production
segment
Consolidationadjustments
RevenueQ3'15
(mP
LN)
0% -5m
1,992 1,900 -60
-46
14
Operating costsQ3'14
Segment ofservices to
individual andbusiness
customers
Broadcasting andTV production
segment
Consolidationadjustments
Operating costsQ3'15
(mP
LN)
YoY change
Operating costs
YoY change
Revenue
Revenue and costs – change drivers in Q3’15
51
+945% +454m
910 930 7 13
EBITDAQ3'14
Segment of services toindividual and business
customers
Broadcasting and TVproduction segment
EBITDAQ3'15
(mP
LN)
+2% +20m
48
502 443 14
-3
Net profitQ3'14
Segment ofservices to
individual andbusiness
customers
Broadcasting andTV production
segment
Consolidationadjustments
Net profitQ3'15
(mP
LN)
EBITDA Net profit
EBITDA and net profit – change drivers in Q3’15
EBITDA Margin
YoY change YoY change
Source: Interim condensed consolidated financial statements for the 3 and 9 month periods ended 30 September 2015 and internal analysis
38% 39%

1,643
617
131
23
1,711
592
104
13
Retail revenue
Wholesale revenue
Sale of equipment
Other revenue
Q3'15 Q3'14
4%
4%
26%
mPLN
52
78%
Revenue structure in Q3’15
Source: Interim condensed consolidated financial statements for the 3 and 9 month periods ended 30 September 2015 and internal analysis
• Lower revenue from mobile telephony services partially mitigated by revenue growth from mobile Internet and pay TV services
• Increase in wholesale revenue primarily due to significantly higher advertising revenue of TV Polsat, as well as to the growth of revenue from Interconnect and the lease of telecom infrastructure
• Higher revenue from equipment sales as a result of i.a. a growing share of installment plan sales among transactions with equipment, which translates into an increase in unit revenue per transaction

551
401
315
257
200
122
9
45
496
478
349
262
187
118
15
87
Technical costs and cost of settlementswith telecommunication operators
Depreciation, amortization, impairmentand liquidation
Cost of equipment sold
Content cost
Distribution, marketing, customerrelation management and retention
Salaries and employee-related costs
Cost of debt collection services and baddebt allowance
Other costs
Q3'15 Q3'14
11%
16%
10%
2%
mPLN
7%
4%
44%
49%
53
Source: Interim condensed consolidated financial statements for the 3 and 9 month periods ended 30 September 2015 and internal analysis
costs
and receivables written off
Operating costs structure in Q3’15
• Increase in technical costs due to increased costs of data transfer within our broadband Internet access service and rising costs of Interconnect
• Decrease in depreciation, amortization, impairment and liquidation as a result of lower costs of amortization of frequency licenses in the 1,800 MHz spectrum and depreciation of the telecommunication infrastructure
• Lower cost of equipment sold mainly due to a lower volume of contracts for telecommunication services with equipment concluded in Q3’15
• Increase in distribution, marketing, customer relation management and retention costs due to a higher amount of deferred distribution fees being charged to costs, which was partially compensated by more efficient cost control in the areas of customer service and retention
• Decrease in other costs mainly due to the recognition in the corresponding period of 2014 of sales of marketing and broadcasting rights to the FIVB Volleyball Men’s World Championship Poland 2014

Source: Interim condensed consolidated financial statements for the 3 and 9 month periods ended 30 September 2015 and internal analysis
54
Items below the EBITDA level in Q3’15
930.3
-401.1
-240.0
-26.5
616.2
-244.8
-21.4 0.6
613.3
-110.9
502.4
EBITDA Depreciation,amortization,
impairment andliquidation
Net interestcost
Foreign exchangedifferences onissued bonds
Cumulativecatch-up
Early redemptioncosts
Other financial revenue, net
Share of theprofit of joint
venture
Gross profit Income tax Net profit
(mP
LN)
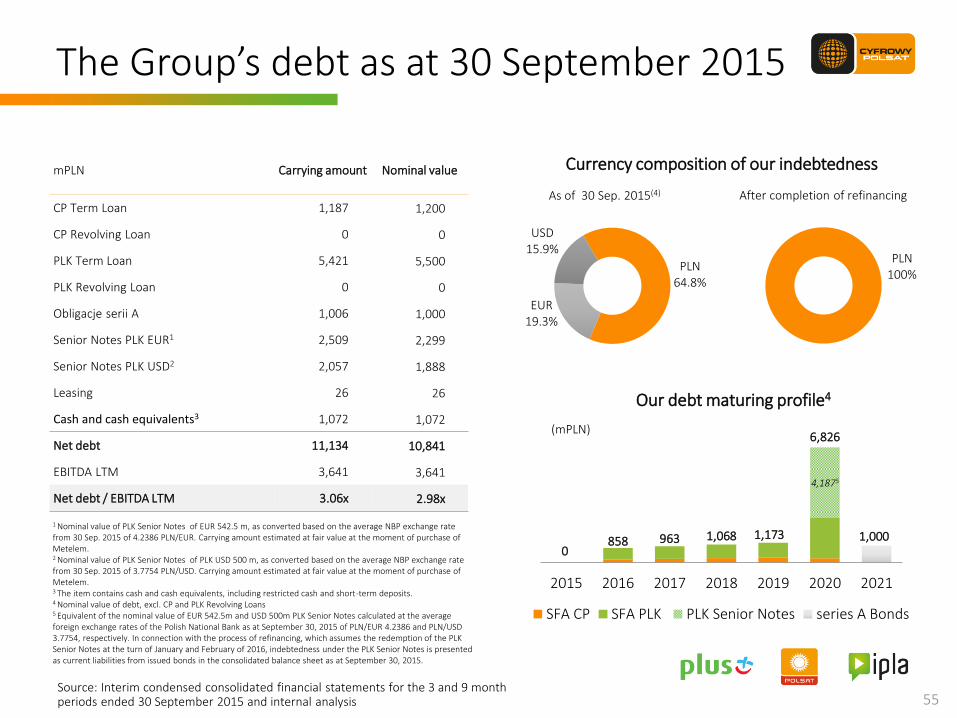
PLN 100%
Source: Interim condensed consolidated financial statements for the 3 and 9 month periods ended 30 September 2015 and internal analysis
PLN 64.8%
EUR 19.3%
USD 15.9%
4,1875
0 858 963 1,068 1,173
6,826
1,000
2015 2016 2017 2018 2019 2020 2021
Our debt maturing profile4
SFA CP SFA PLK PLK Senior Notes series A Bonds
(mPLN)
1 Nominal value of PLK Senior Notes of EUR 542.5 m, as converted based on the average NBP exchange rate from 30 Sep. 2015 of 4.2386 PLN/EUR. Carrying amount estimated at fair value at the moment of purchase of Metelem. 2 Nominal value of PLK Senior Notes of PLK USD 500 m, as converted based on the average NBP exchange rate from 30 Sep. 2015 of 3.7754 PLN/USD. Carrying amount estimated at fair value at the moment of purchase of Metelem. 3 The item contains cash and cash equivalents, including restricted cash and short-term deposits. 4 Nominal value of debt, excl. CP and PLK Revolving Loans 5 Equivalent of the nominal value of EUR 542.5m and USD 500m PLK Senior Notes calculated at the average foreign exchange rates of the Polish National Bank as at September 30, 2015 of PLN/EUR 4.2386 and PLN/USD 3.7754, respectively. In connection with the process of refinancing, which assumes the redemption of the PLK Senior Notes at the turn of January and February of 2016, indebtedness under the PLK Senior Notes is presented as current liabilities from issued bonds in the consolidated balance sheet as at September 30, 2015.
55
mPLN Carrying amount Nominal value
CP Term Loan 1,187 1,200
CP Revolving Loan 0 0
PLK Term Loan 5,421 5,500
PLK Revolving Loan 0 0
Obligacje serii A 1,006 1,000
Senior Notes PLK EUR1 2,509 2,299
Senior Notes PLK USD2 2,057 1,888
Leasing 26 26
Cash and cash equivalents3 1,072 1,072
Net debt 11,134 10,841
EBITDA LTM 3,641 3,641
Net debt / EBITDA LTM 3.06x 2.98x
As of 30 Sep. 2015(4) After completion of refinancing
The Group’s debt as at 30 September 2015
Currency composition of our indebtedness

Refinancing update

Historically largest corporate financing in the Polish zloty
57
2.0 3.0
4.0
2.8
8.0 7.0
3.0
12.5
1.0
14.4
3.0
10.3
8.4 7.6
TPSA
(20
10
)
PG
NiG
(20
10
)
PK
N O
RLE
N(2
01
1)
Po
lko
mte
l(2
01
1)
CP
(20
11
)
ENEA
(20
12
)
Tau
ron
(20
12
)
Po
lko
mte
l(2
01
3)
PK
N O
RLE
N(2
01
4)
KG
HM
(20
14
)
PG
NiG
(20
14
)
CP
(20
14
)
CP
+Po
lko
mte
l(2
01
5)
CP
- b
on
ds
(20
15
)
EUR/USD/other PLN
Source: own study based on Thomson Reuters
(PLN bn)
17.4 13.5

Broad consortium of financial institutions involved in the New SFA
Remaining entities within the consortium Global coordinators
Borrowers Legal and financial advisors
58
Consortium of 20 financial institutions

Key parameters of the new financing
59
Nominal / Currency
Tenure
Borrowers / Issuer
Interest / Coupon
Interest period
PLN 11.5 bn + PLN 1 bn (RCF)
5 years, partly amortized
Security
Financial covenants
New SFA
Cyfrowy Polsat, Polkomtel
WIBOR + margin dependent on leverage ratio
Quarterly(1)
Secured (as long as leverage >1.75x)
Leverage secured <3.5x Total leverage <4.2x Interest cover >2.0x Debt service cover >1.2x
PLN 1 bn
6 years, bullet repayment
Series A Bonds
Cyfrowy Polsat
WIBOR + 250bps margin step-up if leverage ratio >3.5x
Semi-annual (January/July)
Unsecured
Leverage ratio <4.5x Interest cover >1.5x
Note: (1) With an option to pay in monthly or semi-annual periods.
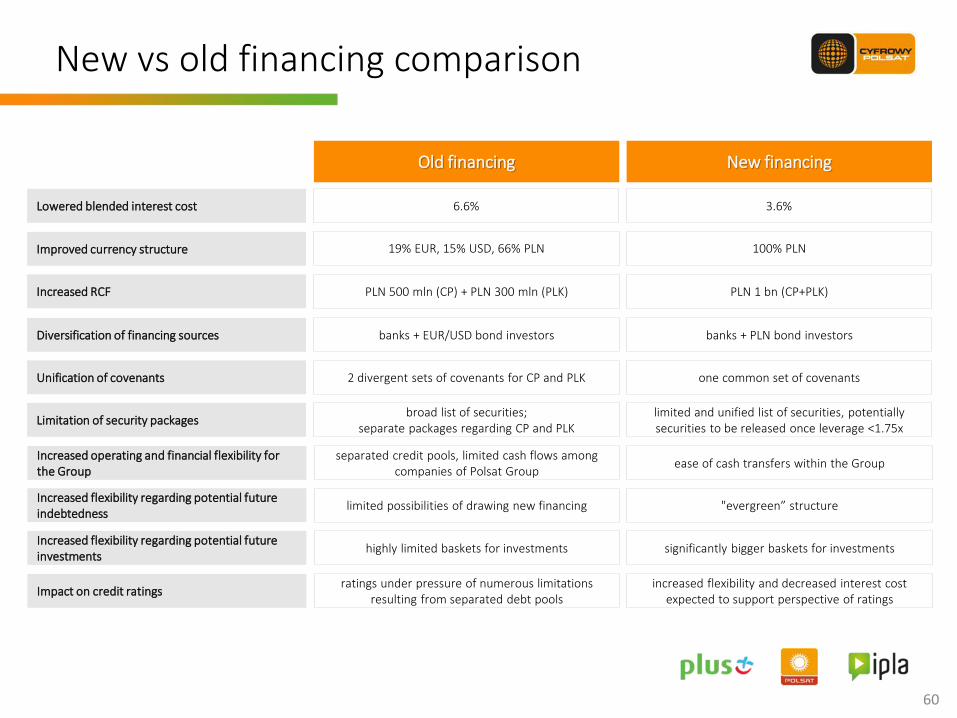
New vs old financing comparison
60
Lowered blended interest cost
Improved currency structure
Increased RCF
Diversification of financing sources
Unification of covenants
6.6%
19% EUR, 15% USD, 66% PLN
Limitation of security packages
Old financing
PLN 500 mln (CP) + PLN 300 mln (PLK)
banks + EUR/USD bond investors
2 divergent sets of covenants for CP and PLK
broad list of securities; separate packages regarding CP and PLK
3.6%
100% PLN
New financing
PLN 1 bn (CP+PLK)
banks + PLN bond investors
one common set of covenants
limited and unified list of securities, potentially securities to be released once leverage <1.75x
Increased operating and financial flexibility for the Group
separated credit pools, limited cash flows among companies of Polsat Group
ease of cash transfers within the Group
Increased flexibility regarding potential future indebtedness
limited possibilities of drawing new financing "evergreen” structure
Increased flexibility regarding potential future investments
highly limited baskets for investments significantly bigger baskets for investments
Impact on credit ratings ratings under pressure of numerous limitations
resulting from separated debt pools increased flexibility and decreased interest cost
expected to support perspective of ratings

Modification of the indebtedness structure will be executed in 2 steps
61
PLN mln nominal
value
CP Group (excl. PLK)
SFA (PLN) 2,178
RCF 70
PLK Group
SFA (PLN) 6,020
RCF 0
PLK High Yield Notes EUR1/USD2 4,158
end of 2Q’15
Source: Interim condensed consolidated financial statements for the 3 and 6 month periods ended 30 June 2015 and internal analysis
Note: (1) Nominal value of PLK Senior Notes of EUR 542.5 m, as converted based on the average NBP exchange rate from 30 June 2015 of 4.1944 PLN/EUR. (2) Nominal value of PLK Senior Notes of PLK USD 500 m, as converted based on the average NBP exchange rate from 30 June 2015 of 3.7645 PLN/USD. (3) After repayment scheduled for 31 March 2016.
PLN mln nominal
value
CP Group (incl. PLK)
New SFA (PLN) 6,700
New RCF (PLN) 0
New CP Bonds (PLN) 1,000
PLK Group
PLK High Yield Notes EUR1/USD2 4,158
after refinancing (1Q’16 onwards)
PLN mln nominal
value
CP Group (incl. PLK)
New SFA (PLN)3 11,292
New RCF (PLN) 0
New CP Bonds (PLN) 1,000
intermediate (3-4Q’15)

Final effects of the refinancing surpassed our initial assumptions
62
Note: (1) Concerns blended costs of CP Group and PLK Group indebtedness, applying current WIBOR rates. (2) Based on initial nominal of PLN 12.5 bn and leverage ratio as reported at 30 June 2015.
6.6%
3.6%
old financing new financing
Reduction of blended interest cost(1)
Interest savings(2) approx. PLN 380 mln per annum
-3.0 p.p.(1)

0
50
100
150
200
250
300
350
4,5 4,0 3,5 3,0 2,5 2,0 1,5 1,0 0,5
Unsecured CP bonds
New SFA
Margin grid promotes further deleveraging of Polsat Group
net debt / EBITDA bas
is p
oin
ts
Margins in reference to leverage level(1)
Note: (1) Leverage ratio is tested on a quarterly basis, new margin set after a change of leverage level is reported (no backwards corrections implemented).
63
325
250
210
110
net debt / EBITDA 30/06/15

Additional information

Shareholding structure
65
Shareholder Number of shares % of shares Number of votes % of votes
Reddev Investments Limited (1) , including:
- privileged registered shares
- ordinary bearer shares
154,204,296
152,504,876
1,699,420
24.11%
23.85%
0.27%
306,709,172
305,009,752
1,699,420
37.45%
37.24%
0.21%
Embud Sp. z o.o. (2) 58,063,948 9.08% 58,063,948 7.09%
Karswell Limited (2) 157,988,268 24.70% 157,988,268 19.29%
Sensor Overseas Limited (3) , including:
- privileged registered shares
- ordinary bearer shares
54,921,546
26,741,375
28,180,171
8.59%
4.18%
4.41%
81,662,921
53,482,750
28,180,171
9.97%
6.53%
3.44%
Others 214,367,958 33.52% 214,539,208 26.20%
Total 639,546,016 100.00% 818,963,517 100.00%
Note: (1) Reddev is an indirect subsidiary of Mr Zygmunt Solorz-Żak (2) Entity controlled by Mr. Zygmunt Solorz-Żak. (3) The dominant entity of Sensor Overseas Limited is the EVO Holding Ltd., a subsidiary EVO Foundation. As of March 18, 2015

66
+
19.99 79
Premium offer PLN 89.99
+
CINEMAX HD
+
+ +
+
Rodzinny HD
iplaMIX (2)
nV
OD
+ M
ult
iro
om
HD
HBO HD
SPORT HD
FAMILY MAX HD
FILM HD
nV
OD
Note: as of 25.11.2015; (1) including promotional channels; (2) temporary promotional packages
VOD Home Movie Rental (2)
# of channels(1)
Price (PLN)
138 49.99
168 +10.00
171 +30.00
FTA
Sample of our DTH offer

Portfolio of our TV channels
67
DTT Cab/Sat
No. of channels
TV Polsat Group DTT market
4 24
No. of channels
TV Polsat Group Cab/Sat market
31 ca. 200

68
Spectrum competitive landscape
1) Source: UKE. The graph includes a simplified picture, only main frequencies are presented (excluded: Polkomtel’s 2,5MHz 420MHz, Orange’s 5Mhz 450Mhz, each 4 biggest MNO’s 5MHz 2100MHz TDD).
Polkomteland Midas
jointly
40%
40%
25%
Orange Play T-Mobile Midas Polkomtel new
frequencies
15MHz 15MHz 15MHz 15MHz 2100 MHz
total: 60MHz
900 MHz total: 35MHz
6 MHz 5MHz 7MHz 5MHz
70 MHz FDD 2500/2600 MHz
total: 120MHz expected availability: 2015 50 MHz TDD
7,2MHz 19,6MHz 9,6 MHz 1800 MHz
total: 73,4MHz 7,2MHz
800 MHz total: 30MHz
25 MHz expected availability: 2015
4MHz 3MHz
12,4MHz
2,4
5MHz
15MHz
Sferia
5 MHz

1) Customer - natural person, legal entity or an organizational unit without legal personality who has at least one active service provided in a contract model. 2) RGU (revenue generating unit) - single, active service of pay TV, Interneet Access or mobile telephony provided in contract or prepaid model. 3) ARPU per customer - average monthly revenue per customer generated in a given settlement period (including interconnect revenue). 4) Churn - termination of the contract with Customer by means of the termination notice, collections or other activities resulting in the situation that after termination of the contract the Customer does not have any active service provided in the contract model. Churn rate presents the relation of the number of customers for whom the last service has been deactivated (by means of the termination notice as well as deactivation as a result of collection activities or other reasons) within the last 12 months to the annual average number of customers in this 12-month period. 5) ARPU per total prepaid RGU - average monthly revenue per prepaid RGU generated in a given settlement period (including interconnect revenue)
69
SEGMENT OF SERVICES TO INDIVIDUAL AND BUSINESS CUSTOMERS1)
2012 2012
2013 2013
2014 2014
2015
Q1 Q2 Q3 Q4 Q1 Q2 Q3 Q4 Q1 Q2 Q3 Q4 Q1 Q2 Q3
Total number of RGUs2) (contract + prepaid) n/a n/a n/a n/a n/a 16 348 336 16 434 266 16 627 551 16 447 334 16 447 334 16 333 003 16 250 497 16 449 992 16 482 031 16 482 031 16 429 469 16 349 090 16 395 514
CONTRACT SERVICES
Total number of RGUs, including: 11 532 547 11 516 833 11 605 099 11 735 100 11 735 100 11 799 951 11 868 947 11 908 422 11 978 807 11 978 807 11 982 678 12 023 369 12 230 798 12 347 828 12 347 828 12 394 712 12 377 021 12 418 707
Pay TV, including: 3 885 022 3 868 733 3 921 673 3 994 875 3 994 875 4 047 592 4 127 560 4 160 343 4 212 323 4 212 323 4 236 986 4 255 544 4 344 773 4 391 702 4 391 702 4 405 464 4 374 517 4 396 361
Multiroom 394 001 416 027 470 578 510 617 510 617 559 997 633 475 680 316 719 935 719 935 749 319 771 481 806 064 844 809 844 809 872 628 886 305 901 271
Mobile telephony 6 985 015 6 978 192 6 976 594 6 979 590 6 979 590 6 941 638 6 891 314 6 834 719 6 778 675 6 778 675 6 713 629 6 644 687 6 617 382 6 587 915 6 587 915 6 552 365 6 519 311 6 505 016
Internet 662 510 669 908 706 832 760 635 760 635 810 721 850 073 913 360 987 809 987 809 1 032 063 1 123 138 1 268 643 1368211 1 368 211 1 436 883 1 483 193 1 517 330
Number of customers 6 282 300 6 264 412 6 281 184 6 313 423 6 313 423 6 318 321 6 306 877 6 285 607 6 287 658 6 287 658 6 260 662 6 221 111 6 184 775 6 137 531 6 137 531 6 068 839 5 990 051 5 937 768
ARPU per customer3) [PLN] 92.5 94.4 93.8 93.8 93.6 89.1 90.3 87.6 87.1 88.5 84.8 85.3 86.5 87.2 85.9 85.8 87.0 88,1
Churn per customer4) n/a n/a n/a 8.4% 8.4% 8.7% 8.8% 9.0% 9.2% 9.2% 9.1% 8.8% 8.8% 9.1% 9.1% 9.5% 10.1% 10.2%
RGU saturation per one cusotmer 1.84 1.84 1.85 1.86 1.86 1.87 1.88 1.89 1.91 1.91 1.91 1.93 1.98 2.01 2.01 2.04 2.07 2.09
Average number of RGUs, including: 11 497 022 11 521 707 11 558 288 11 659 474 11 559 123 11 772 318 11 846 507 11 884 574 11 924 710 11 857 027 11 986 199 11 981 389 12 125 363 12 272 311 12 091 316 12 376 603 12 391 326 12 378 586
Pay TV, including: 3 858 338 3 879 834 3 894 623 3 955 082 3 896 969 4 018 307 4 098 051 4 144 131 4 175 145 4 108 909 4 227 450 4 243 880 4 301 558 4 361 890 4 283 695 4 403 541 4 397 999 4 376 405
Multiroom 358 652 406 943 443 744 494 506 425 961 535 271 600 411 658 475 697 978 623 034 736 315 759 922 787 736 822 568 776 635 860 827 881 296 893 001
Mobile telephony 6 986 951 6 977 393 6 978 772 6 974 525 6 979 410 6 965 606 6 917 102 6 862 047 6 801 845 6 886 650 6 749 396 6 670 820 6 628 199 6 597 742 6 661 539 6 570 344 6 532 488 6 508 391
Internet 651 733 664 480 684 893 729 867 682 743 788 405 831 354 878 396 947 720 861 469 1 009 353 1 066 689 1 195 606 1 312 679 1 146 082 1 402 718 1 460 839 1 493 790
Average number of customers 6 288 609 6 272 029 6 271 838 6 291 791 6 281 067 6 316 275 6 317 333 6 293 472 6 279 979 6 301 765 6 274 951 6 242 450 6 201 335 6 159 903 6 219 660 6 105 250 6 031 638 5 960 463
PREPAID SERVICES
Total number of RGUs, including: n/a n/a n/a n/a n/a 4 548 385 4 565 319 4 719 129 4 468 527 4 468 527 4 350 325 4 227 128 4 219 194 4 134 203 4 134 203 4 034 757 3 972 069 3 976 807
Pay TV n/a n/a n/a n/a n/a 85 574 81 441 84 538 77 771 77 771 81 619 66 578 98 136 122 787 122 787 66 163 41 517 60 471
Mobile telephony n/a n/a n/a n/a n/a 4 385 742 4 379 630 4 475 541 4 171 810 4 171 810 4 042 605 3 923 778 3 855 669 3 792 978 3 792 978 3 775 976 3 737 282 3 685 092
Internet n/a n/a n/a n/a n/a 77 069 104 248 159 050 218 946 218 946 226 101 236 772 265 389 218 438 218 438 192 618 193 270 231 244
ARPU per total prepaid RGU5) [PLN] n/a n/a n/a n/a n/a 18.0 19.2 18.2 17.5 18.2 16.5 17.9 18.3 18.2 17.7 17.3 18.3 19.0
Average number of RGUs, including: n/a n/a n/a n/a n/a 4 549 031 4 532 090 4 635 182 4 599 374 4 578 919 4 398 038 4 285 747 4 212 274 4 172 129 4 267 047 4 068 646 4 006 108 3 970 091
Pay TV n/a n/a n/a n/a n/a 78 707 73 828 68 740 77 953 74 807 77 779 79 253 69 522 129 021 88 894 67 972 61 165 41 313
Mobile telephony n/a n/a n/a n/a n/a 4 397 976 4 370 181 4 431 149 4 338 987 4 384 573 4 091 609 3 975 410 3 893 375 3 798 701 3 939 774 3 797 423 3 755 130 3 713 656
Internet n/d n/d n/d n/d n/d 72 348 88 081 135 293 182 434 119 539 228 650 231 084 249 377 244 407 238 379 203 251 189 813 215 122
KPIs – retail customer services

Key financial data
70
mPLN Q1'12 Q2'12 Q3'12 Q4'12 2012 Q1'13 Q2'13 Q3'13 Q4'13 2013 Q1'14 Q2'14 Q3'14 Q4'14 2014 Q1'15 Q2'15 Q3’15
Revenue 669.2 713.8 644.5 750.6 2 778.1 697.1 735.9 677.3 800.5 2 910.8 723.3 1 745.9 2 419.6 2 521.1 7 409.9 2 329.0 2 469.2 2 414.9
Retail revenue 424.0 427.1 434.4 446.6 1 732.1 451.7 452.0 460.3 466.1 1 830.1 467.8 1 204.5 1 710.7 1 701.7 5 084.7 1 637.2 1 652.0 1 643.3
Wholesale revenue 234.6 272.7 198.0 286.3 991.6 223.8 265.2 204.0 317.2 1 010.2 242.2 479.1 591.6 641.1 1 954.0 553.3 688.7 616.9
Sale of equipment 2.7 6.2 2.6 7.2 18.7 13.1 11.8 7.1 9.7 41.7 7.9 55.4 104.1 159.9 327.3 118.4 106.9 131.2
Other revenue 7.9 7.8 9.5 10.5 35.7 8.5 6.9 5.9 7.5 28.8 5.4 6.9 13.2 18.4 43.9 20.1 21.6 23.5
Operating costs -464.5 -499.7 -444.9 -562.4 -1 971.5 -512.9 -542.4 -510.7 -591.7 -2 157.7 -507.4 -1 351.8 -1 992.5 -2 125.4 -5 977.1 -1 909.0 -1 899.5 -1 900.1
Content costs -206.8 -226.6 -171.5 -219.0 -823.9 -207.5 -239.5 -219.3 -260.7 -927.0 -210.6 -260.9 -262.4 -295.6 -1 029.5 -235.5 -274.0 -257.3
Distribution, marketing, customer relation management and retention costs
-71.5 -71.8 -73.7 -95.7 -312.7 -79.0 -81.3 -79.3 -92.4 -332.0 -75.4 -132.2 -186.8 -218.3 -612.7 -189.2 -193.2 -200.1
Depreciation, amortization, impairment and liquidation
-54.4 -56.7 -60.2 -71.7 -243.0 -60.7 -62.3 -64.8 -68.6 -256.4 -62.5 -311.3 -478.3 -443.8 -1 295.9 -467.9 -393.5 -401.2
Technical costs and cost of settlements with telecommunication operators
-49.7 -55.1 -58.6 -59.3 -222.7 -60.7 -62.0 -62.2 -71.4 -256.3 -71.3 -288.0 -495.9 -557.2 -1 412.4 -482.3 -522.4 -551.2
Salaries and employee-related costs -40.6 -40.3 -38.9 -58.6 -178.4 -43.1 -41.9 -40.4 -53.2 -178.6 -44.6 -108.2 -118.0 -150.9 -421.7 -129.1 -140.8 -122.3
Cost of equipment sold -5.5 -7.6 -7.0 -16.1 -36.2 -25.8 -16.8 -10.7 -10.6 -63.9 -10.3 -189.7 -348.6 -376.6 -925.2 -332.5 -291.7 -314.9
Cost of debt collection services and bad debt allowance and receivables written off
-5.9 -8.4 -5.3 -7.8 -27.4 -6.4 -9.3 -5.3 -7.2 -28.2 -6.7 -18.1 -15.3 -27.5 -67.6 -18.7 -27.8 -8.5
Other costs -30.1 -33.2 -29.7 -34.2 -127.2 -29.7 -29.3 -28.7 -27.6 -115.3 -26.0 -43.4 -87.2 -55.5 -212.1 -53.8 -56.1 -44.6
Other operating income. net -1.7 -1.1 -2.0 -12.7 -17.5 0.5 1.5 36.8 -2.0 36.8 3.6 3.5 4.7 -2.2 9.6 8.7 13.8 14.4
Profit from operating activities 203.0 213.0 197.6 175.5 789.1 184.7 195.0 203.4 206.8 789.9 219.5 397.6 431.8 393.5 1 442.4 428.7 583.5 529.2
Gain/loss on investment activities, net 12.5 -8.5 5.3 5.0 14.3 3.9 0.7 7.4 4.1 16.1 1.2 23.9 1.5 -11.4 15.2 28.9 -11.9 -5.2
Finance costs 30.1 -92.4 -5.2 -43.1 -110.6 -80.1 -102.4 -10.7 -22.8 -216.0 -108.7 -273.4 -384.7 -379.2 -1 146.0 -261.3 -222.1 88.8
Share of the profit of a joint venture accounted for using the equity method
0.7 0.8 0.5 0.8 2.8 0.8 0.8 0.7 0.6 2.9 0.6 0.7 0.7 0.6 2.6 0.5 0.9 0.5
Gross profit for the period 246.3 112.9 198.2 138.2 695.6 109.3 94.1 200.8 188.7 592.9 112.6 148.8 49.3 3.5 314.2 196.8 350.4 613.3
Income tax -41.2 -13.4 -26.2 -16.6 -97.4 -14.1 -13.4 -24.4 -15.5 -67.4 -14.4 -16.7 -1.1 10.5 -21.7 -26.0 -45.9 -110.8
Net profit for the period 205.1 99.5 172.0 121.6 598.2 95.2 80.7 176.4 173.2 525.5 98.2 132.1 48.2 14.0 292.5 170.8 304.5 502.5
EBITDA 257.4 269.7 257.8 247.2 1 032.1 245.4 257.3 268.2 275.4 1 046.3 282.0 708.9 910.1 837.3 2 738.3 896.6 977.0 930.4
EBITDA margin 38.5% 37.8% 40.0% 32.9% 37.2% 35.2% 35.0% 39.6% 34.4% 35.9% 39.0% 40.6% 37.6% 33.2% 37.0% 38.5% 39.6% 38.5%

Glossary
71
RGU (Revenue Generating Unit)
Single, active service of pay TV, Internet Access or mobile telephony provided in contract or prepaid model.
Customer Natural person, legal entity or an organizational unit without legal personality who has at least one active service provided in a contract model.
Contract ARPU Average monthly revenue per Customer generated in a given settlement period (including interconnect revenue)
Prepaid ARPU Average monthly revenue per prepaid RGU generated in a given settlement period (including interconnect revenue)
Churn Termination of the contract with Customer by means of the termination notice, collections or other activities resulting in the situation that after termination of the contract the Customer does not have any active service provided in the contract model.
Churn rate presents the relation of the number of customers for whom the last service has been deactivated (by means of the termination notice as well as deactivation as a result of collection activities or other reasons) within the last 12 months to the annual average number of customers in this 12-month period.
Usage definition (90-day for prepaid RGU)
Number of reported RGUs of prepaid services under the mobile telephony and Internet Access means the number of SIM cards which received or answered calls, sent or received SMS/MMS or used data transmission services within the last 90 days.
In practice this means that within the last 90 days a given card had to be inserted to a phone or another device which was active and was able to make or receive call, message, data transmission session. 90-day usage definition thus eliminates inactive cards.
Based on the aforementioned definition each year UKE collects data of the mobile operators in Poland in order for the European Commission to prepare a comparison of actual penetration of mobile telecommunication services in the EU countries (the so-called Digital Agenda report).

Contact Investor Relations Łubinowa 4A 03-878 Warsaw Phone: +48 (22) 356 6004 / +48 (22) 426 85 62 / +48 (22) 356 65 20 Email: [email protected]
www.grupapolsat.pl