Embed Size (px)
Citation preview

Cutting scores
Using tests to improve decisions:Cutting scores & base rates

Cutting scores
Review: Conditional Probability
• Conditional probabilities arise when the probability of one thing [A] depends on the probability of something else [B]
• In such cases, we want to factor in the probability of B before we worry about A
• This amounts to focusing on the elements that are likely to be ‘picked out’ by both A and B
• P(A|B) = P(A and B)/P(B)
Cutting scores
Three ways
• We can consider three ways to solve condition probability questions (all exactly equivalent):– Common sense– Probability tables– Bayes’ Theorem

Cutting scores
a.) Common sense • P(A|B) = P(A and B)/P(B)• 5 males, one wears a dress; 3 females, 4 wear dresses.
– What is the probability that you wear a dress, given that you are female?
• First: We want to know how many people are both dress wearers and females = P(A and B) = 4
• Second: We want to know what proportion of all woman are accounted for by the dress wearing females= Dress wearing females / Females= P(Female and dress-wearing)/P(Female)= 4/5

Cutting scores
b.) Probability Tables• P(A|B) = P(A and B)/P(B)
• What is the probability that you sometimes wear a dress, given that you are female?
Dress No dress
Male 1 4
Female 4 1

Cutting scores
b.) Probability Tables• P(A|B) = P(A and B)/P(B)
• What is the probability that you sometimes wear a dress, given that you are female?
Dress No dress
Male 1 4
Female 4 1
JUST IGNORE ALL THE MALES!

Cutting scores
c.) Bayes’ Theorem• P(A|B) = P(A and B)/P(B)• What is the probability that you sometimes wear a dress, given that you are female?
P(A|B) = P(B|A) P(A) / P(B)
Proof: By definition, (1.) P(A|B) = P(A and B) / P(B) (2.) P(B|A) = P(A and B) / P(A)
(3.) P(B|A) P(A) = P(A and B) [Multiply (2.) by P(A)](4.) P(B|A) P(A)= P(A|B) P(B) [Substitute (1.) in (3.)](5.) P(B|A) P(A) / P(B) = P(A|B) [Divide by P(B)]
P(Dress-wearing|Female) = P(Female|Dress-wearing)P(Female)/P(Dress-wearing)= (4/5 * 5/10) / (5/10)= 4/5
Cutting scores
Why use ^$#*! Bayes’ Theorem?
• Bayes Theorem is not intended to confuse, but to simplify: you can use it to get the probability relation between any two cells in the 2x2 table
• It can also be generalized to more complex situations
• However, in this class we won’t go outside of 2x2 conditional probability tables: so just draw a picture or think it through if you prefer!

Cutting scores
Cutting scores
• What is a cutting score or cutting line?
• How shall we evaluate how good any given test is?

Cutting scores
Cutting scores
• What is a cutting score or cutting line?– In many tests we have criteria: if a subject scores above
score X, they are likely to be Y [a genius, a moron, a good prospect, likely to die in six months]
– X is a cutting score• Note that this is a conditional probability: P(diagnosis|test
result)• Note also that in this case probability of X [test result] is
not ‘given by God’: we test designers are free to change the cutting score as we like
• In doing so, we can change P(diagnosis|test result)

Cutting scores
Cutting scores
• As an example, think of the probability that a person is a genius (defined, let’s say, as IQ > 130) given that they got an IQ score of 128, on the one hand, or 110, on the other.
• Assume the standard error for IQ is 10 points• Then there is a fair chance that a person who got 128 has
an IQ above 130, but a very small (but non-zero) chance that that person who got 110 has an IQ above 130– If we used 110 as a cutting score for genius, we’d be
wrong a lot: P(diagnosis|test result) is very low– If we used 128 as a cutting score for genius, we’d be
wrong less often: P(diagnosis|test result) is higher

Cutting scores
Cutting scores• What we want is some principled way of deciding what a
good cutting score is for any particular purpose• Clearly, our choice of cutting score will depend on that
purpose– When we are diagnosing a brain tumour, we want to be
wrong almost never if the person does have a brain tumour AND we don’t care too much if we make a false positive
– When we are trying to identify criminals, we might be more worried about minimizing false positives (we could ruin a life is we say someone is a criminal when they are not) and willing to pay the price by letting some real criminals go free (increase our false negative rate)

Cutting scoresTest scores
Criterion
Positive prediction: “This person will succeed.”
Negative prediction: “This person will fail.”
Low score High score
DefinitelyBad
Definitelygood
Acceptable

Cutting scoresTest scores
Criterion
Positive prediction: “This person will succeed.”
Negative prediction: “This person will fail.”
Low score High score
DefinitelyBad
Definitelygood
Acceptable
False negative:Incorrectly undiagnosed.
False positive:Incorrectly diagnosedC
utti
ng li
ne

Cutting scoresTest scores
Criterion
Positive prediction: “This person will succeed.”
Negative prediction: “This person will fail.”
Low score High score
DefinitelyBad
Definitelygood
Acceptable
Low false negative rate
High false positive rateC
utti
ng li
ne
Rewarding incompetence

Cutting scoresTest scores
Criterion
Positive prediction: “This person will succeed.”
Negative prediction: “This person will fail.”
Low score High score
DefinitelyBad
Definitelygood
Acceptable
High false negative rate
Low false positive rate
Cut
ting
line
Ignoring competence

Cutting scores
How shall we evaluate how good a test is?
• Three things need to be taken into account:i.) The size of the correlation between test scores
and criterion
- The higher the correlation, the narrower the scatterplot (i.e. the ellipse) and the smaller the error rates

Cutting scores
How shall we evaluate how good a test is?
• Three things need to be taken into account:ii.) The base rate
iii.) The cutting score
What is the relation between these two measures?

Cutting scores
The relation between base rate and cutting score
• Example from Meehl:– Group A: 415 well-adjusted soldiers– Group B: 89 mal-adjusted soldiers– A scale diagnosed 55% of Group B, and only
19% of Group A, so the authors advocated its use
Cutting scores
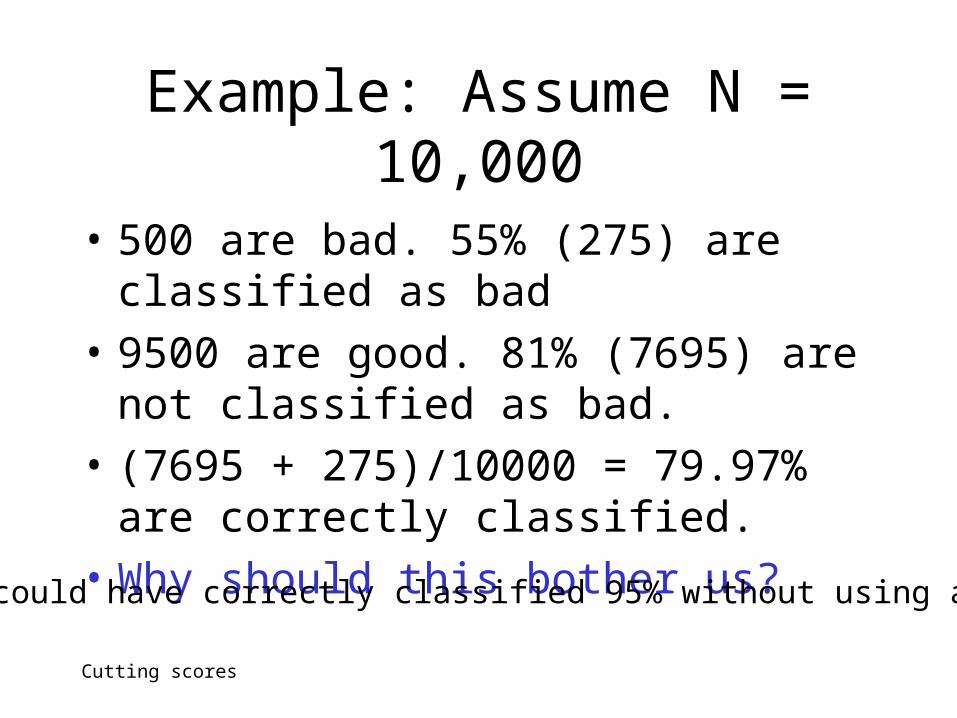
Example: Assume N = 10,000
• 500 are bad. 55% (275) are classified as bad
• 9500 are good. 81% (7695) are not classified as bad.
• (7695 + 275)/10000 = 79.97% are correctly classified.
• Why should this bother us?
We could have correctly classified 95% without using a test!

Cutting scores
Let’s use Bayes’ Theorem: Is ‘bad’ bad?
P(Bad|Diagnosed) = P(Diagnosed|Bad)P(Bad)/P(Diagnosed)
P(Diagnosed|Bad) 0.55 GivenP(Bad) 0.05 AssumedP(Diagnosed) 0.208 = (0.55*0.05) + (0.19* 0.95)
P(Bad|Diagnosed) 0.13 = P(Diagnosed|Bad)P(Bad)/P(Diagnosed)
When we take base rates into account, an identification of a person as ‘bad’ actually has only a 13% chance of being correct, not a 55% chance as claimed.

Cutting scores
Let’s use Bayes’ Theorem: Is ‘not bad’ good?
When we take base rates into account, a failure to identify a person as ‘bad’ has 97% chance of being correct…but remember that we were already 95% sure before we bothered to do the calculation!
P(Good|Not Diagnosed) =P(Not Diagnosed|Good)P(Good)/P(Not Diagnosed)
P(Not Diagnosed|Good) 0.81 Given
P(Good) 0.95 Assumed
P(Not Diagnosed) 0.7920 = (0.45*0.05) + (0.81* 0.95)
P(Good|Not Diagnosed) 0.97 By Bayes' Theorem

Cutting scores
The relation between base rate and cutting score, II
• A certain Rorschach configuration is seen in 8.1% of schizophrenics, and 0% of non-schizophrenics
• The authors claim this is clinically useful: Is it really?

Cutting scores
Let’s do the math!
Although the sign is certain in this case, it is so rare itself and applies to a group with such a rare base rate that it is P(Rorschach) that is worrying: This information would be diagnostically helpful in only 7 cases out of 10,000! = it is clinically useless
P(Schizo|Rorschach) = P(Rorschach|Schizo)P(Schizo)/P(Rorschach)
P(Rorschach|Schizo) 0.081 The empirical findingP(Schizo) 0.0085 Known base rate for schizophreniaP(Rorschach) 0.0006885 = (0.0085*0.081)
P(Schizo|Rorschach) 1.00 =P(Rorschach|Schizo)P(Schizo)/P(Rorschach)

Cutting scores
What can we do? : Rule 1
• “In order for a positive diagnostic assertion to be ‘more likely true than false’, the ratio of positive to negative base rates in the examined population must exceed the false positive to valid positive rate”:
Base rate of positives False positive rate of test
Base rate of negatives True positive rate of test>

Cutting scores
Example : Rule 1
Base rate of positives False positive rate of test
Base rate of negatives True positive rate of test>
A cutting score identifies 80% of brain-damaged patients. 15% of nondamaged patients also exceed that cut-off. What base rates can justify the use of such a test?
.15 (false positive) / .80 (true positive) = 0.19The ratio of brain damaged to non-brain damaged patients in the population under consideration must be equal to or greater than .19, or about 1 in 5.

Cutting scores
The easiest case: Equal base rates (Rule 2)
• Iff base rates are equal, then the probability of a positive diagnosis is the ratio of the true positive rate to the sum of the true and false positive rates.
• Another way of saying this more simply is: equal base rates render Bayes’ Theorem unnecessary.

Cutting scores
Example: Equal base rates (Rule 2)
• Iff base rates are equal, then the probability of a positive diagnosis is the ratio of the true positive rate to the sum of the true and false positive rates.
• Two kinds of cancers occur equally often. A test diagnoses Type B with 68% accuracy, but is at chance for Type A. You get a positive test result. What is the probability you have Type B cancer?
For once life is simple. The probability is 68%.0.68 / (0.68 + 0.32) = 0.68

Cutting scores
Example 2: Equal base rates (Rule 2)
• A test picks out 75% of people who will continue in school (true positives) but also 40% of those who will not (false positives). It is claimed that about half of all students in the population drop out of school. How far off can that claim be without the test being useless?
• The probability of a positive diagnosis with equal split is the ratio of the true positive rate to the sum of the true and false positive rates:
0.75 / (0.75 + 0.40) = 0.65
So the test gets about 65% right. If less than 35% of the students actually do drop out, the test will not do better than base rates.
That is: If it is a matter of fact that (say) only 10% of students drop out, then there is no use giving this test: it can’t beat the 90% odds you have of being correct before you bothered to give the test

Cutting scores
When can a test help? (Rule 3)
• A test result can only help if the base rate of the more numerous class (here, positive) is less than the ratio of the true negative rate to the sum of the true and false negative rate

Cutting scores
When can a test help? (Rule 3)• A test result can only help if the base rate of the more numerous class (say,
positive) is less than the ratio of the true negative rate to the sum of the true and false negative rate
• A test of maladjustment classifies 85% of maladjusted girls, but only mis-identifies 15% of adjusted girls. What base rates are needed to support these ratios? (Assume, reasonably, that there are more adjusted than unadjusted girls.)
• The ratio of the true negative rate to the sum of the true and false negative rate = (0.85 [true negative] / (0.85 [true negative] + 0.15 [false negative]) = 0.85. The test can only help if less than 85% of girls are well-adjusted.

Cutting scores
What does this have to do with cutting lines?
• The proportion of people selected (diagnosed, chosen) from a sample is called the selection ratio
• When positive/negative base rates are not equal, there is a (fairly brutal) trade-off between the accuracy (error rate) of a diagnosis or prediction, and the size of the selection ratio

Cutting scores
The brutal trade-off
• If you want to be very sure you are right, you can speak of only a very small proportion of the sample (and you need a very large sample to get the cut-off points!)
• If you want to say something about everyone, then you must be prepared to be uncertain about your cut-off points, and wrong very often.
– In short: you can be certain about a few people, or uncertain about a lot of people: take your pick!

Cutting scoresTest scores
Criterion
Positive prediction: “This person will succeed.”
Negative prediction: “This person will fail.”
Low score High score
DefinitelyBad
Definitelygood
Acceptable
False negative:Incorrectly unselected
False positive:IncorrectlyselectedC
utti
ng li
ne

Cutting scoresTest scores
Criterion
Positive prediction: “This person will succeed.”
Negative prediction: “This person will fail.”
Low score High score
DefinitelyBad
Definitelygood
Acceptable
Low false Negative rate
High false positive rateC
utti
ng li
ne
Rewarding incompetence

Cutting scoresTest scores
Criterion
Positive prediction: “This person will succeed.”
Negative prediction: “This person will fail.”
Low score High score
DefinitelyBad
Definitelygood
Acceptable
High false negative rate
Low false positive rate
Cut
ting
line
Ignoring competence

Cutting scores
Sensitivity & Specificity
• The sensitivity of a test = The probability of having a positive test result when the disease is present
= P(Result|Disease) = True positive rate
• The specificity of a test = The probability of having a negative test result when the disease is absent= P(~Result|~Disease) = True negative rate

Cutting scoresTest scores
Criterion
Positive prediction: “This person will succeed.”
Negative prediction: “This person will fail.”
Low score High score
DefinitelyBad
Definitelygood
Acceptable
False negative:Incorrectly unselected
False positive:Incorrectly selectedC
utti
ng li
ne
True positive:Correctly selected
True negative:Correctly unselected
SENSITIVITY
SPECIFICITY

Cutting scores
What to do? 1
1.) Obviously, sometimes we can be satisfied with a small improvement on true negative base rates and with a large false positive rate
– As we have said, we don’t mind mistaking 90 brain tumors in order not miss 20.
2.) Successive hurdles: Take a chance, allow errors, and give the expensive, time-consuming, but accurate tests to those who are selected out from a first-pass of a less-expensive, less time-consuming, and more accurate test
– Repeat as necessary...

Cutting scores
What to do? 2
3.) Sometimes we can find sub-populations with less extreme base rates than in the world-at-large– If our referrals are well-screened, we can have more confidence in
base rates that are less onerous (= closer to being equal) than they would be in the world at large

Cutting scores
What to do? 3
4.) Sometimes ‘so what?’ is the right thing to say.
– Since testing with any accuracy is so difficult to do well, we should not bother to give tests that don’t lead to real changes in therapy or other treatment
– If you can identify good therapy candidates with 70% accuracy, so what? Will you then ignore or refuse to treat those who don’t make the cut?
– If not, don’t waste time and effort giving the test

Cutting scores
What to do? 4
• Gather base rate information.