Embed Size (px)
Citation preview

© 2017 Certica Solutions, Inc. All rights reserved. www.CerticaSolutions.com 877.456.8949 [email protected]
TestWiz™ Customizing Reports
Updated: July 11, 2017
2
© 2017 Certica Solutions, Inc. All rights reserved.
This guide and the software described in this guide are furnished under a license accompanying the software and may be used only in accordance with the terms of such license. By using this guide, you agree to the terms and conditions of that license. TestWiz and the TestWiz logo are trademarks or registered trademarks of Certica Solutions, Inc. in the United States and other countries. All other product names mentioned herein may be trademarks or registered trademarks of their respective companies.
3
Table of Contents
Introduction ........................................................................................................................................ 4
Creating a Customized Report ............................................................................................................. 5 Changing the Default Parameters ..............................................................................................................7 Saving Parameters as “Customizations” or “Quick Reports” .....................................................................7
Report Parameters .............................................................................................................................. 8 The Student, Teacher, School, and District Parameters .............................................................................8 The Spc. Code Filter Parameter ...................................................................................................................9 The Spc. Code Display Parameter .............................................................................................................11 The Subtests Parameter ............................................................................................................................12 The Scores Parameter ...............................................................................................................................13 The Cutoff Parameter ...............................................................................................................................14 The Rank Order Parameter .......................................................................................................................15 The Letter Parameter ................................................................................................................................16 The Statistics Parameter ...........................................................................................................................20 The Display Score Parameter ....................................................................................................................20 The Cross-Tab Parameter .........................................................................................................................21 The Gap Score Parameter .........................................................................................................................24 Multi-Test Reports ....................................................................................................................................29 History Reports .........................................................................................................................................31
Related Documents ........................................................................................................................... 34
Contact Information .......................................................................................................................... 34
4
Introduction TestWiz allows you create a variety of reports for any given assessment. After selecting a test, you can view and print any report from the Create Reports page (refer to Viewing and Printing Reports for details.) All reports are presented with reasonable default settings.
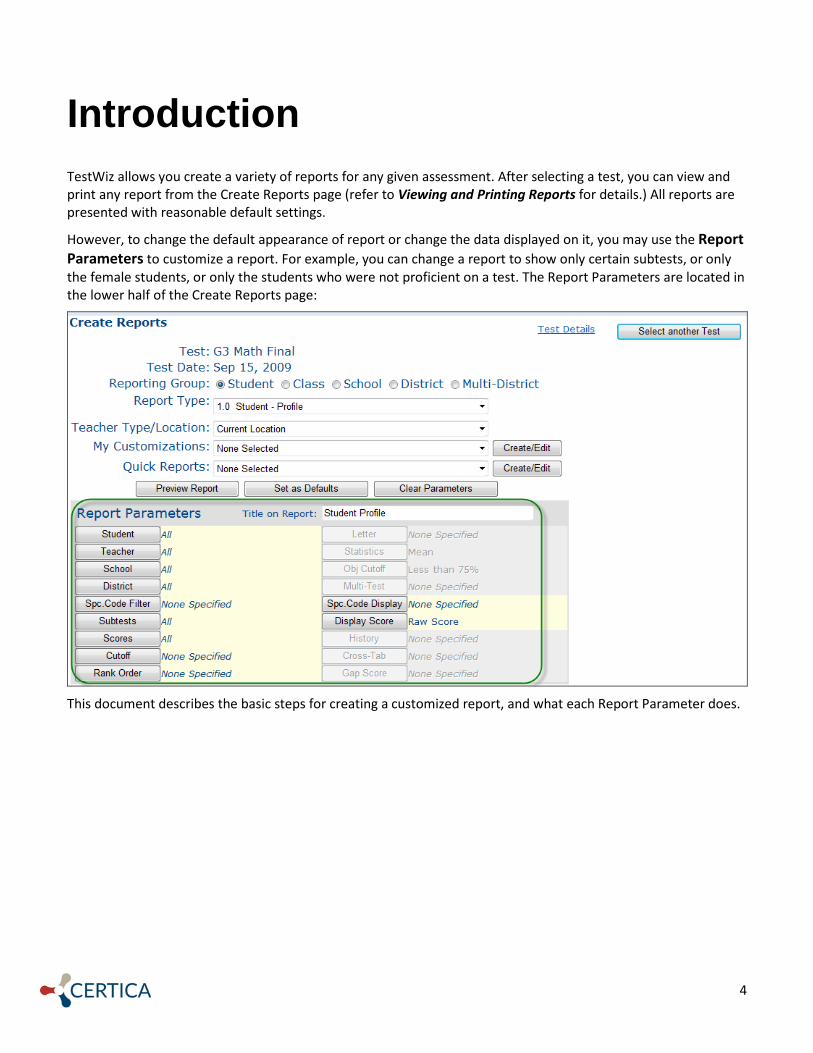
However, to change the default appearance of report or change the data displayed on it, you may use the Report Parameters to customize a report. For example, you can change a report to show only certain subtests, or only the female students, or only the students who were not proficient on a test. The Report Parameters are located in the lower half of the Create Reports page:
This document describes the basic steps for creating a customized report, and what each Report Parameter does.

5
Creating a Customized Report
TestWiz reports are created based on a set of parameters. You can change these parameters on the Create Reports page in order to customize your reports. To change the parameters:
1. Click Select a Test for Reporting from the top menu bar. You arrive at the Select a Test for Reporting page:
2. Select a test by clicking anywhere on the row. The Create Reports page appears. Select a Reporting
Group, Report Type, and Teacher Type/Location. (If necessary, refer to Viewing and Printing Reports for details on making these selections.)
3. Examine the buttons under Report Parameters.
Notice that the parameter buttons have displays next to them to indicate whether a parameter has been specified. Parameter buttons that are gray are unavailable for the report type you selected.

6
4. Click the button for the parameter you want to change and a second screen appears. For example, click on Student and the Select Student screen appears. This screen contains a list of students who took the test, enabling you to hand-pick the students on whom you want the report to be based.
5. After making changes to a parameter, click OK to return to the Create Reports screen.
Notice that after you change a parameter, the display says “Selected” or lists specific selections.
6. Click the Preview Report button to display the customized report on your screen.
For more information on each of the report parameters, refer to the section, “Report Parameters,” beginning on page 8.

7
Changing the Default Parameters Your selected parameters are saved from one session to the next by test. Some parameters can be saved across tests, if they apply to more than one test. The parameters that you can set by default are Teacher Type/Location, District, School, Teacher, Subtests, Scores, Spc. Code Filter, Spc. Code Display, Statistics, and Display Score. To save the parameters the way you want them to be when you select this test later (or when you choose Clear Parameters from the Create Reports page):
1. Click Set as Defaults from the Create Reports page.
2. A message appears asking if you are sure you want to save the current settings as your default
parameters. Click OK. Note: To eliminate any changes you made to the report parameters, click Clear Parameters located in the middle of the Create Reports page. The parameters revert to your last staved defaults. Click the button again, and the parameters revert to the TestWiz defaults.
Saving Parameters as “Customizations” or “Quick Reports” After you’ve modified the report parameters, you can save them as a “Customization” to use again with other tests or other reports. For information on Customizations, refer to the document titled, Customizations, available when you go to the Home page of TestWiz and click Help Documents on the left sidebar. If you want to save a specific report along with its modified parameters, you may save the report as a “Quick Report,” if your user account has permission to do so. The Quick Report becomes available to you and the others in your group. For more information on Quick Reports, refer to the document titled, Quick Reports, available when you go to the Home page of TestWiz and click Help Documents on the left sidebar.

8
Report Parameters
The report parameters control various aspects of a report. You may customize them for any report. A detailed description of each of the parameters follows below. These are all available on the Create Reports screen.
The Student, Teacher, School, and District Parameters You can use these parameters to select one or more students, teachers, schools, or districts to appear on reports.
1. Click on the Student, Teacher, School, or District button. A new page appears. For example, if you click the Student button, the Select Students page appears.
This window shows all of the students who took the test you selected.
2. If you want to narrow the list to students with a certain last name, teacher, school, or district, enter a whole or partial name in the appropriate text box at the top of the screen under “Filter Students.”
Then click Filter. The names that appear are those that satisfy the filter.

9
3. To select a student(s), click in the box next to each of the student names you wish to select. A check
mark appears next to each selected name.
Notice that there are Select All and Clear All buttons at the bottom of the window. You could use Select All to select all the names and then click on individual students you wish to de-select. Or you can use Clear All to de-select all the names.
4. Click OK when finished. The main Create Reports screen reappears. Notice that next to the Student parameter, the display now says “Selected.”
The Spc. Code Filter Parameter Special Codes are demographic characteristics associated with students. When you import a test, demographics that are in the file get imported along with the students’ names and test scores. The Spc. Code Filter parameter allows you to generate reports based on selected student characteristics. For example, you can select the Special Code Sex and set its value to Male. That would allow you to generate reports for only the Male students who took a particular test. To select certain Special Codes for a report:
1. Click on the Spc. Code Filter button. The Select Special Codes for Filtering Student Records page appears.

10
2. Decide if you want to look at Special Codes most recently associated with a student or those associated when the test was administered. Click the appropriate choose at the top where it says, “Filter based on information from.”
3. Click on a Code that you want to specify. For example, to specify a particular gender, click on Sex. A check mark appears on the box and a box of choices for the Sex code appears at the bottom of the screen.
4. Select a value for the Special Code by clicking on it (a check mark appears). You can select more than
one value at a time. If you have selected more than one value, the report will include students who have one value OR the other. If the Special Code has numeric values, choose a comparison symbol or word and specify a number, or range of numbers, in the text box. For example, the Special Code called “Days” uses numeric values:
or
5. Click OK when done.
6. When you click Preview Report, the report shows only the students who have the Special Code(s) you selected.

11
Note: If you choose more than one Special Code, the report will show students who fit the criteria for the first code, and the second code, and the third code, etc.
The Spc. Code Display Parameter The Spc. Code Display parameter allows you to display Special Code values for each student on a report. This parameter is available for Student List reports, History reports, and Profile reports. To select Special Codes to display on a report:
1. Click on the Spc. Code Display button. The Select Special Codes to Display screen appears.
2. Click “Enable Parameter” so that a check mark appears in the box. The available Special Codes appear.
3. The column on the left titled Select from shows all the Special Codes available. To select a Special
Code, double-click on its name in the list on the left. The Special Codes you select appear on the right side under In Report.

12
4. Click OK when you have selected between one and five Special Codes.
5. When you preview the report, you see student values for the selected Special Codes.
The Subtests Parameter If you don’t hand pick the subtests, the reports include as many subtests as possible. If your report includes more subtests than will fit on one page, you can de-select certain subtests. You can also change the sequence of the subtests printed. To specify the subtests to appear in your report:
1. Click on the Subtests button. The Select Subtests screen appears.

13
2. The column on the right titled In Report shows all the subtests in the order they will appear on a report. To de-select a subtest, double-click on its name in the list on the right or use the single left arrow button. The subtest you de-selected now appears on the left side, under Select from.
3. To select a subtest to appear in a report, double-click on it in the Select from column or use the single right arrow button. Note: If you are creating an Item Analysis or Objectives report, you cannot select only subtests that are composites of other subtests. This is because composite subtests have no items or objectives associated with them.
4. Click the OK button to get back to the main Create Reports page.
The subtests print out on a report in the order in which they appear in the In Report column. To change the order, click on a subtest in the In Report column. Then click on the Up or Dn buttons to move that subtest up or down.
Note: You cannot control the order of subtests on an Objectives report.
Your subtest selections are saved for this test even after you exit the software. If you would like to store that set of subtests as the default for all tests, click the Set as Defaults button on the main Create Reports page. In that case, your set of subtests will be honored on all tests that have an identical list of subtests.
The Scores Parameter To change the order or select the scores to print in a report:
1. Click on the Scores button. The Select Scores page appears:

14
2. The process for selecting scores is the same as for selecting subtests. The column on the right shows all the scores that are available for this test. To de-select a score, double-click on it. The score you de-selected now appears on the left side, under Select from.
3. To select a score to appear on a report, double-click on it.
4. Click OK to get back to the main Create Reports screen. The scores print out on a report in the order in which they appear in the In Report column. To change the order, click on a score in the In Report column. Then click on the Up or Dn buttons to move that score up or down.
The Cutoff Parameter The Cutoff parameter enables you to see reports for a subgroup of students based on rank or score. For example, you can generate a report that shows only the students who ranked in the top 10% in Math. Or you can have a report that shows those students whose scaled score was below 220. For example, to report only on students who scored within a certain range of scores, follow these steps:
1. Click on the Cutoff button. The Select Cutoff page appears.
2. Click Cutoff by Score to bring up additional options:
3. Select a type of score you want from the Score drop-down list.
4. Select a subtest(s) to which you want to apply the cutoff. For example, to see only students who scored a certain range in English and Math, select both English and Math.
5. Enter a range of scores by filling in the From and the To fields under Select parameters to cutoff by score.
15
6. Lastly, select one of the options at the bottom of the page to indicate whether you want your report to include students who met the cutoff criteria on each subtest or on any one subtest.
7. Click OK.
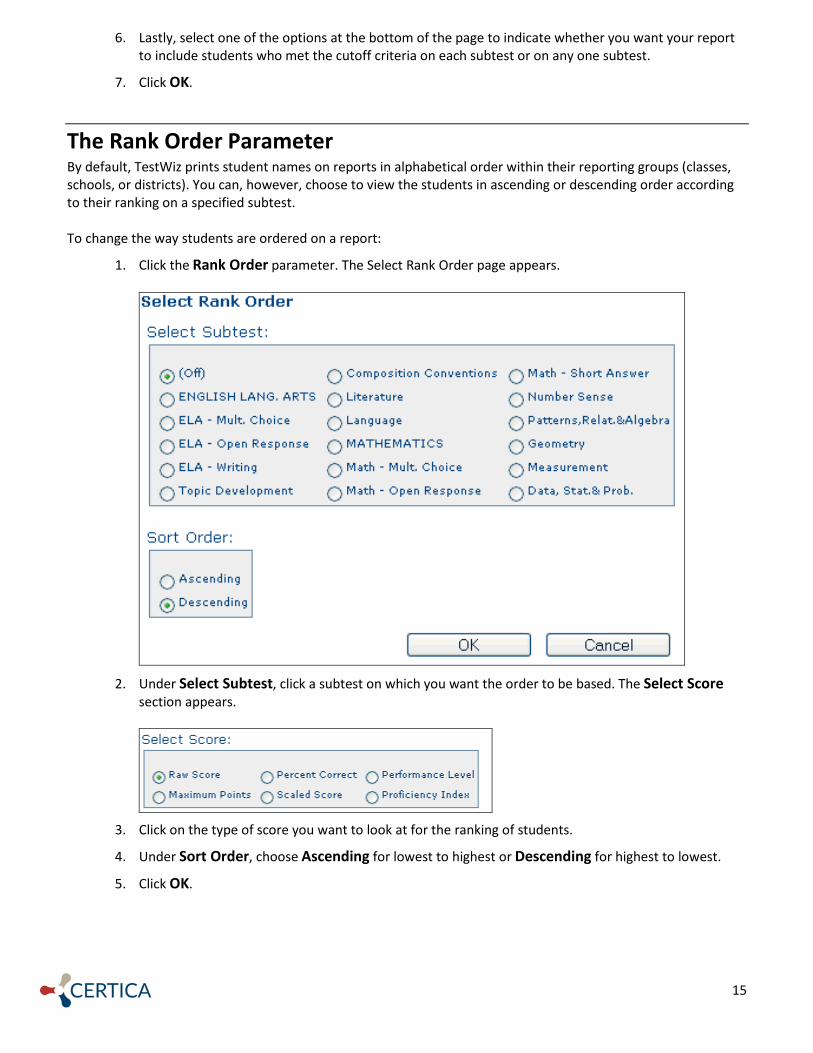
The Rank Order Parameter By default, TestWiz prints student names on reports in alphabetical order within their reporting groups (classes, schools, or districts). You can, however, choose to view the students in ascending or descending order according to their ranking on a specified subtest. To change the way students are ordered on a report:
1. Click the Rank Order parameter. The Select Rank Order page appears.
2. Under Select Subtest, click a subtest on which you want the order to be based. The Select Score
section appears.
3. Click on the type of score you want to look at for the ranking of students.
4. Under Sort Order, choose Ascending for lowest to highest or Descending for highest to lowest.
5. Click OK.

16
The Letter Parameter When you create a Student-Profile with Letter or Student Profile with Objectives report, you have the option of attaching a letter or memo using the Letter parameter. To attach a letter/memo to a report:
1. Select Student as the Reporting Group and Student-Profile with Letter or Student-Profile with Objectives as the Report Type.
2. Click the Letter parameter button to open the Select and Manage Letter page.
3. Click on a letter title to select it. (If no letters are available, you can create one. Refer to the next
section titled, “Creating a New Letter.” If you want to edit an existing letter, refer to, “Editing a Letter.”) Notice that when a letter is selected, the letter preview appears on the bottom section of this screen. The letter preview shows the letter with any automatic fields filled in with generic terms and scores such as “John” and “100.” If there are no letters to choose from, refer to the section that follows titled, “Creating a New Letter.”
4. Click OK to use the selected letter on the report.

17
5. When you preview the report, the letter appears at the bottom for each student:
Creating a New Letter To create a new letter:
1. Click New from the Select and Manage Letter page. The Edit Letter page appears.

18
2. Enter a name for the letter in the Title text box.
3. If you want to share this letter with other TestWiz users and you are an administrator, click All to
share with all the users under your access control jurisdiction.
4. Notice the text that says “Applying the following Cutoff to the letter: None.”
This example says “None” because there is no cutoff specified by the Cutoff parameter on the Create Reports page. You can, however, specify a cutoff on the primary page by clicking the Cutoff parameter button and making appropriate selections. Then the letter you create will apply that cutoff when you select it later.
5. Click in the blank writing space located below the formatting buttons and drop-down menus. Type your letter in the writing space. Note: By default, the writing space is located on the “Design” tab. However, as you enter the content of the letter, it is encoded in HTML. If you want to edit the letter directly in HTML, click the “HTML” tab, located at the bottom of the writing space.
6. To insert fields such as {student} (shown above) use the drop-down menu to insert a “macro” (or field). A field reference such as {student} is inserted into your letter. When you see the letters on your report, individual student names are inserted automatically instead of the reference text.
7. To format fonts or paragraphs, click the appropriate formatting button or choose from a drop-down menu to format characters. If you are not sure what a menu or button does, let your cursor hover over it so that a pop-up description appears.
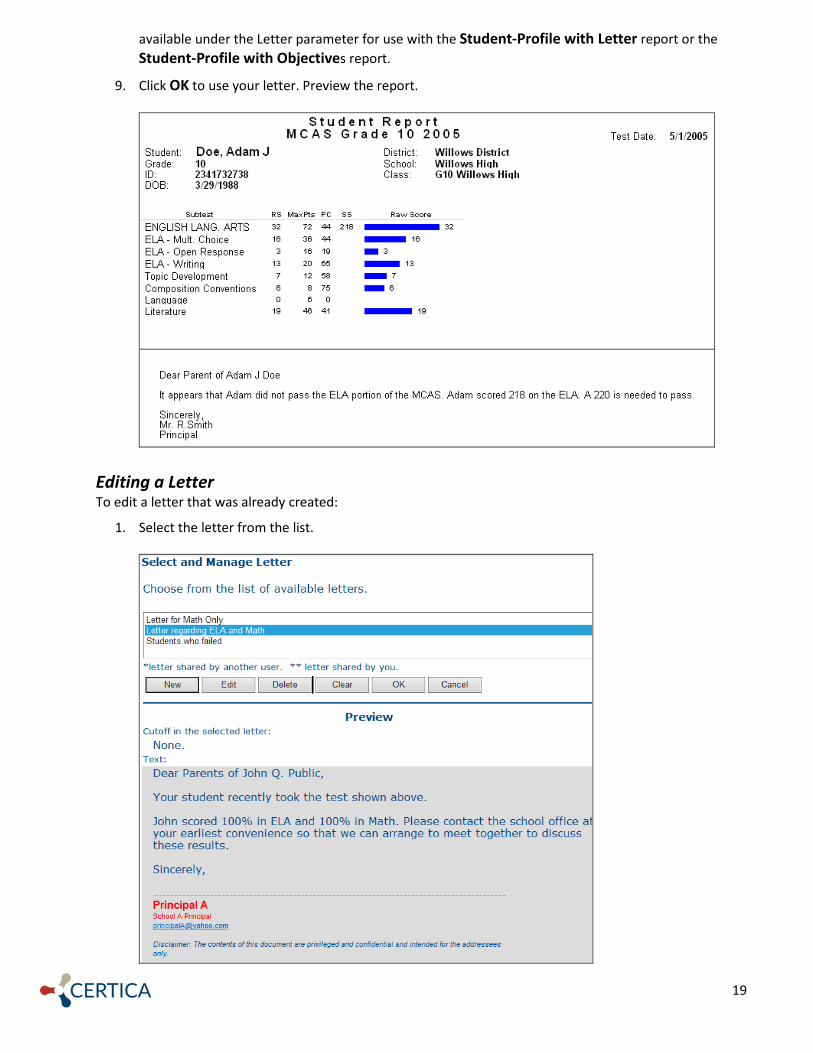
8. Click Save when you are finished creating the letter. You return to the Select and Manage Letter screen. A preview of your letter appears. (If you used macros in the letter, these are displayed in the preview with generic names (such as “John Q. Public”) and scores (such as “100”). The letter is now
19
available under the Letter parameter for use with the Student-Profile with Letter report or the Student-Profile with Objectives report.
9. Click OK to use your letter. Preview the report.
Editing a Letter To edit a letter that was already created:
1. Select the letter from the list.

20
2. Click Edit from the Select and Manage Letter page. The Edit Letter page appears.
3. Change the title of the letter or the text or formatting. You can also change the sharing access. Refer to “Creating a New Letter” for additional details on entering letter content. Note regarding cutoff: When you click Edit, the cutoff associated with the letter automatically changes to whatever cutoff is selected on the primary page (the Create Report page). If you want to change the cutoff associated with the letter, change it on the primary page first and then edit it. Alternatively, if you want to keep the cutoff that was previously associated with the letter, click OK on the Select and Manage Letter page which sets the cutoff on the primary page. Then click on the Letter parameter button again, click Edit, and proceed with editing.
4. Click Save to save the changes. Click Save As only if you are editing a letter someone else created and you have provided a new title.
The Statistics Parameter Summary statistics can be based on a mean or median of scores. By default, the statistics are calculated using the mean. You may change this using the Statistics parameter. To change from mean to median:
1. Click on the Statistics button. The Select Statistics Method page appears.
2. Select Median and click OK.
The Display Score Parameter This parameter sets the type of score to display on reports with graphs. You will also see it on summary reports.
1. Click the Display Score button. The Select Score to Display page appears.
2. Click on the type of score you want shown on the reports and click OK.
3. Your display score selection is saved for this test even after you exit the software. If you would like to store this score as the default for all tests, click the Set as Defaults button on the main Create Reports page.

21
The Cross-Tab Parameter When you create a Cross-Tab report, you must use this parameter. Create a Cross-Tab report when you want to compare performance of subgroups of students based on summary statistics. A Cross-Tab report gives you the following summary information such as the number of students in the subgroups and the average values for the subgroup. Each subgroup is specified by a subtest, a cutoff score value, and one or two Special Codes. This allows you to compare, for example: boys versus girls who scored below average for a Math subtest; or students who were in your school system for various amounts of time. To create a Cross-Tab report:
1. Select School or District as the “Reporting Group” and Cross-Tab as the “Report Type”.
2. Click the Cross-Tab parameter button to open the Cross-Tab Setup page.
3. On the “Subtest and Score” tab, choose a subtest from the Subtest drop-down menu.
4. Choose a type of score from the Score drop-down menu; choose a type of range from the Cutoff drop-down menu; enter a numeric value for Value 1 and Value 2.
Note: Value 2 only appears if the Cutoff is set to Including/Between Value 1 and Value 2.
5. For the Cross-Tabulation Type, choose One Special Code or Two Special Codes. If you want to focus on one demographic such as Sex/Gender, choose One Special Code. If you want to use two demographics such as Sex/Gender and Race, select Two Special Codes.

22
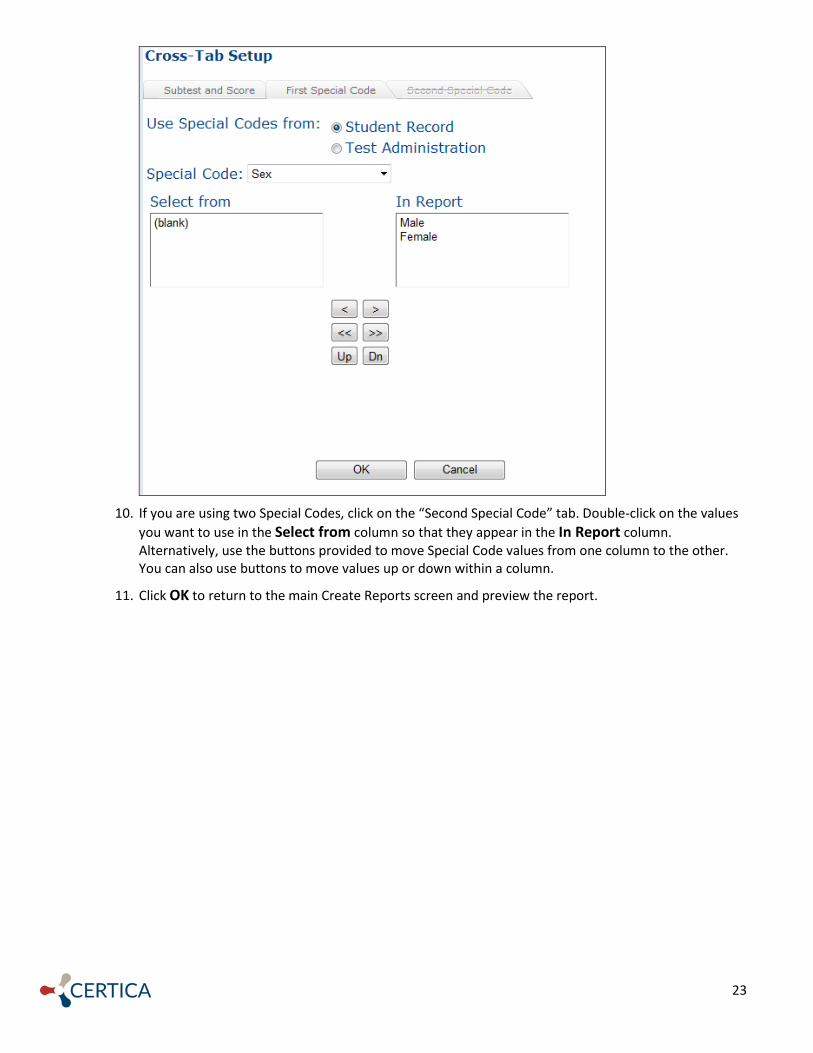
6. Click on the “First Special Code” tab.
7. Specify whether you want to use Special Codes associated with the students in Student Records
database or in the test administration.
8. Choose a Special Code from the Special Code drop-down list.
9. Double-click on the values you want to use in the Select from column so that they appear in the In Report column. Alternatively, use the buttons provided to move Special Code values from one column to the other. You can also use buttons to move values up or down within a column.
23
10. If you are using two Special Codes, click on the “Second Special Code” tab. Double-click on the values
you want to use in the Select from column so that they appear in the In Report column. Alternatively, use the buttons provided to move Special Code values from one column to the other. You can also use buttons to move values up or down within a column.
11. Click OK to return to the main Create Reports screen and preview the report.

24
The Gap Score Parameter The gap score parameter allows you to compare the scores of one group, a primary group, with the scores of another group, a comparison group.
The primary group is the group specified by your selections on the main Create Reports screen. When you make changes to the parameters on the Create Reports screen to select specific schools, teachers, or types of students, you are changing the primary group.
The comparison group(s) can be pre-defined or defined by you. A pre-defined group is one whose scores are included in the test configuration. An example of a pre-defined group for some tests is the State Average. A group you define yourself can be any group of specific schools, teachers, districts, students, or types of students. To define and select comparison groups, you use the Gap Score parameter.
The following are the kinds of reports on which you can show comparisons: Student Reports
• Objectives • Item Analysis • Profile with Objectives • Profile with Items
Class, School, District, and Multi-District reports
• Item Analysis • Multi-Group Frequency Distribution Graphs • Item Analysis Graph • Objectives Summary • Class - Instructional Grouping
Note: Most of the reports compare your primary group to one comparison group. You can use the Item Analysis Graph report, however, to compare your primary group to up to three comparison groups at once.

25
To create a comparison report:
1. Select one of the reports mentioned above from the main Create Report page. For example, choose Class as the Reporting Group and Item Analysis Graph as the Report Type.
2. Specify your primary group by making any changes to the parameters on the main Create Reports page.
3. Next, specify a comparison group. Click the Gap Score parameter button. The Select Gap Scores page appears.
4. You can change the name of your primary group by typing a name in the first text box. For example, if your primary group is one particular school, enter a descriptive name for it.
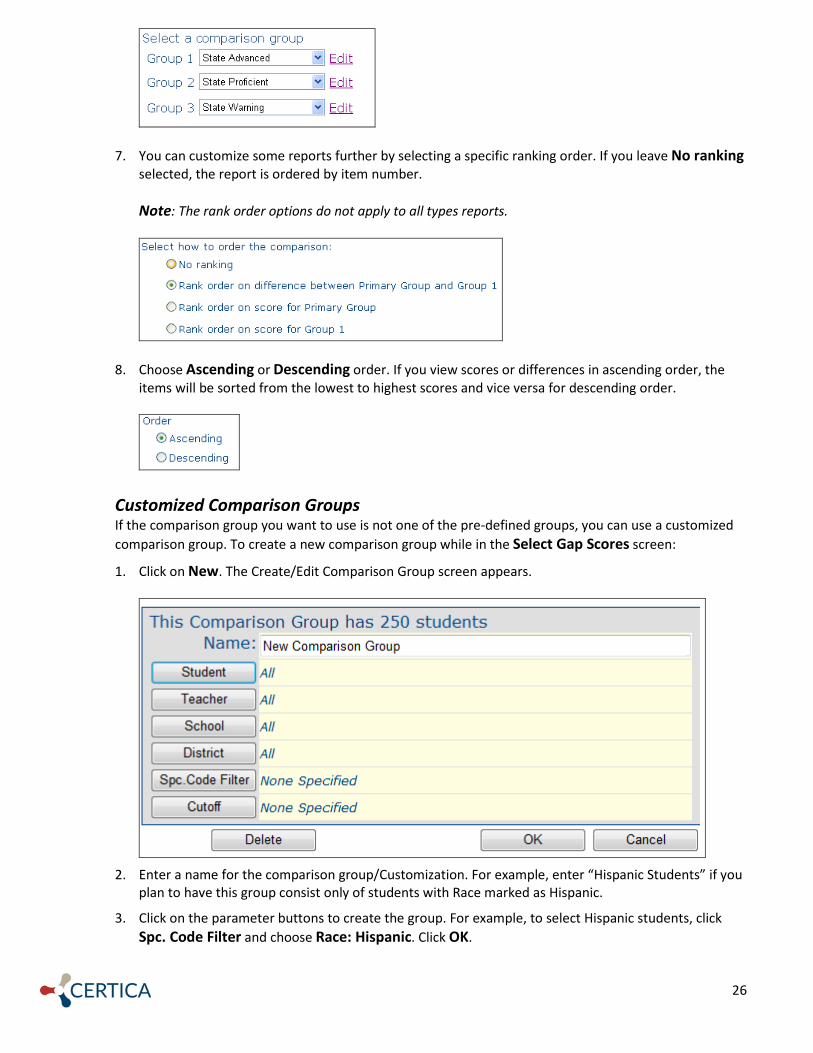
5. Under “Select a comparison group” choose a group from the Group 1 drop-down list. The choices
consist of any pre-defined comparison groups and any groups you create. See the section below titled “
6. Customized Comparison Groups” for more information on creating your own comparison groups. Note about the number of comparison groups: Some reports allow you to specify more than one group. For example, if you are creating an Item Analysis Graph report, you can choose two additional comparison groups by selecting from the Group 2 and Group 3 drop-down lists. For other reports, select up to six comparison groups.
26
7. You can customize some reports further by selecting a specific ranking order. If you leave No ranking selected, the report is ordered by item number. Note: The rank order options do not apply to all types reports.
8. Choose Ascending or Descending order. If you view scores or differences in ascending order, the items will be sorted from the lowest to highest scores and vice versa for descending order.
Customized Comparison Groups If the comparison group you want to use is not one of the pre-defined groups, you can use a customized comparison group. To create a new comparison group while in the Select Gap Scores screen:
1. Click on New. The Create/Edit Comparison Group screen appears.
2. Enter a name for the comparison group/Customization. For example, enter “Hispanic Students” if you
plan to have this group consist only of students with Race marked as Hispanic.
3. Click on the parameter buttons to create the group. For example, to select Hispanic students, click Spc. Code Filter and choose Race: Hispanic. Click OK.

27
4. Click OK when you are finished to return to the Select Gap Scores screen.
5. Now you can select your comparison group from the Group 1 drop-down list. To edit the group later or delete it, you can select it in Group 1 and click the Edit link to open the Create/Edit Comparison Group screen.
6. When you are finished using the gap score options, click OK to return to the Create Reports page.
Example 1 Comparing Your School’s Special Ed. Students to Those in the District
1. Choose School as the Reporting Group and School–Objectives Summary as the Report Type.
2. Specify your primary group of students which, for this example, is your school’s special ed. students. Use the School parameter on the main Create Reports screen to select your school. Then use the Spc. Code Filter parameter to select SPED (or a similar Special Code name) with a value of YES.
3. To specify your comparison group, click on the Gap Score parameter.
4. Click New to open the Create/Edit Comparison Group page.
5. Create a new comparison group called District SPED Students. Use the Spc. Code Filter button on this page to select SPED with a value of YES.
Now that the comparison group is created, you can proceed to compare your primary group and the comparison group:
1. On the Select Gap Scores page, enter My School SPED Students for the name of your primary group.
2. Go to the Group 1 drop-down menu and choose District SPED Students.
3. Click OK to return to the main Create Reports page and click Preview Report to see your groups compared.

28
Example 2 Comparing Two Schools vs. the District on a Graph
1. Choose District as the Reporting Group and District–Item Analysis Graph as the Report Type. You can create up to three comparison groups for an Item Analysis Graph report.
2. Specify your primary group which, for this example, is your district. Use the District parameter on the main Create Reports screen to select your district.
3. To create your comparison groups, which, for this example, are the individual schools in your district, click on the Gap Score parameter to open the Select Gap Scores page.
4. Click New to bring up the Create/Edit Comparison Group page.
5. Enter a name for the group in the NAME box. For this example, enter School A and use the School parameter button to select one school.
6. Click OK to return to the Select Gap Scores page.
7. Click New again and create a new comparison group called School B. Use the School parameter to select another school.
8. Click OK to return to the Select Gap Scores page.
Now that the comparison groups are created, you can proceed to compare your primary group and the comparison group:
1. On the Select Gap Scores page, enter My District as the name of the primary group.
2. Go to the Group 1 and Group 2 drop-down menus and choose School A and School B, respectively.
3. Click OK to return to the main Create Reports page and click Preview Report to see your groups compared.
29
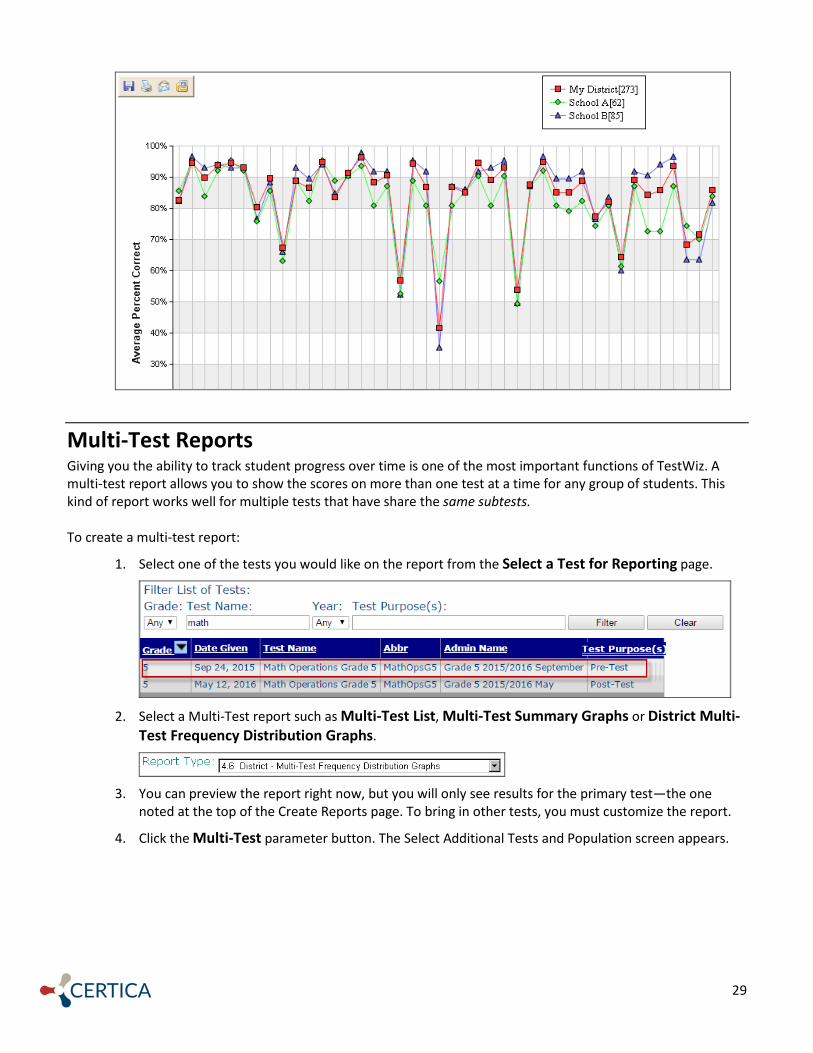
Multi-Test Reports Giving you the ability to track student progress over time is one of the most important functions of TestWiz. A multi-test report allows you to show the scores on more than one test at a time for any group of students. This kind of report works well for multiple tests that have share the same subtests. To create a multi-test report:
1. Select one of the tests you would like on the report from the Select a Test for Reporting page.
2. Select a Multi-Test report such as Multi-Test List, Multi-Test Summary Graphs or District Multi-
Test Frequency Distribution Graphs.
3. You can preview the report right now, but you will only see results for the primary test—the one
noted at the top of the Create Reports page. To bring in other tests, you must customize the report.
4. Click the Multi-Test parameter button. The Select Additional Tests and Population screen appears.

30
5. Select a Population. Choose All Students to show all students/tests. Choose Cohort to use only
students that took all the selected tests.
6. Select one to four additional tests under the Select Additional Tests section. Click on the box next to a test so that a checkmark appears. Then click OK. Note: To limit the list of available tests to those for a certain grade or having a particular name or date, use the Grade, Name, From, To, and Test Purpose(s) drop-down menus under Find and Select Additional Tests. Then click Find.
7. Preview the report. Look at different subtests by clicking the drop-down list next to Subtest at the top of the screen. Choose a subtest such as Mathematics, or Literature, or Language, etc.
8. If, for example, you selected two tests and Math was on both tests, you can view a report for students
who took both tests—the cohort.

31
History Reports A history report enables you to view results from various tests that students have taken, regardless of the types of subtests and scores that were tested. To create a history report:
1. Select one of following for the Reporting Group: Student, Class, or School.
2. Select a history Report Type such as Class-History. You can preview the report right now, but you will only see results for the primary test (the one noted at the top of the Create Reports page) and the first three scores from the History parameter. To bring in other tests or show other scores or subtests, you must customize the report. Refer to the sections that follow below.
Adding Tests To include other tests in your history report:
1. Click on the History parameter button. The Select History screen appears:
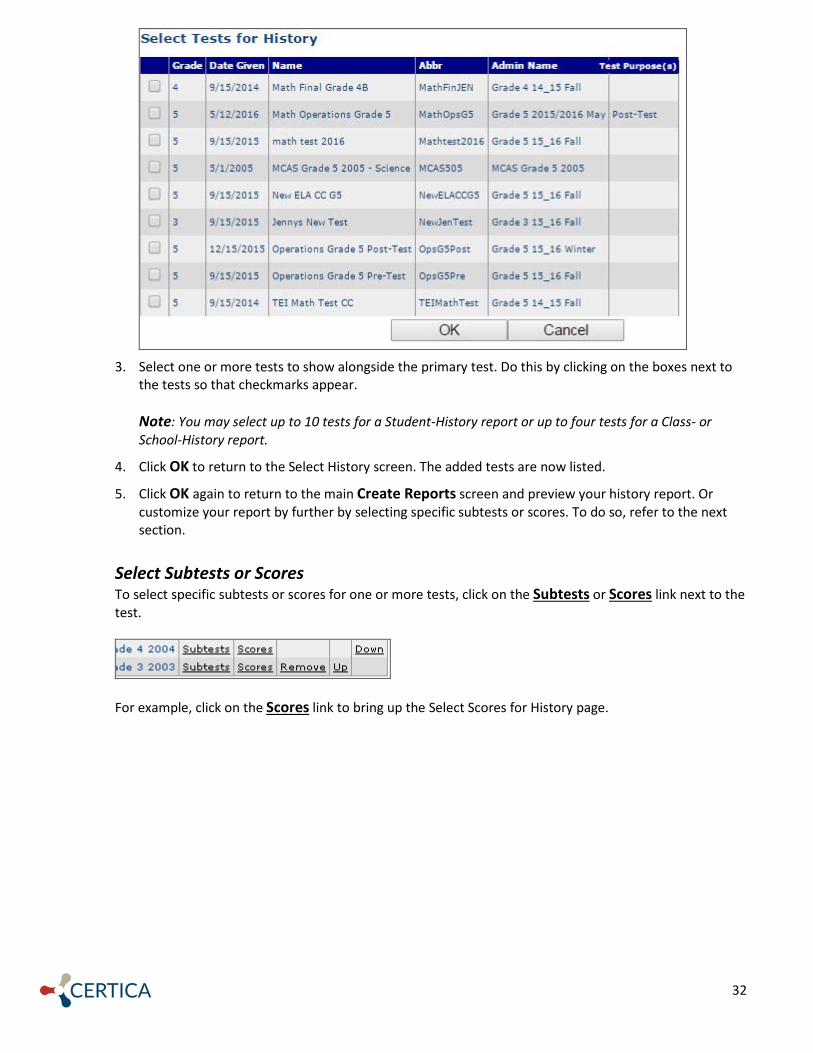
2. The primary test is shown as the only test for the history report. To add other tests to the history
report, click Add More. The Select Tests for History screen appears. It lists tests that were taken by any of the students who took the primary test.
32
3. Select one or more tests to show alongside the primary test. Do this by clicking on the boxes next to
the tests so that checkmarks appear. Note: You may select up to 10 tests for a Student-History report or up to four tests for a Class- or School-History report.
4. Click OK to return to the Select History screen. The added tests are now listed.
5. Click OK again to return to the main Create Reports screen and preview your history report. Or customize your report by further by selecting specific subtests or scores. To do so, refer to the next section.
Select Subtests or Scores To select specific subtests or scores for one or more tests, click on the Subtests or Scores link next to the test.
For example, click on the Scores link to bring up the Select Scores for History page.

33
1. The column on the right shows all the scores that are available for this test. To de-select a score,
double-click on it. The score you de-selected now appears on the left side, under Select from. To select a score to appear on a report, double-click on it. To change the order, click on a score in the In Report column. Then click on the Up or Dn buttons to move that score up or down. You can select up to three scores.
2. Click OK to get back to Select History page.
3. Click OK again to return to the main Create Reports page and preview your history report.
Removing Tests To remove a single test from the list of tests to appear in your history report, click the Remove link next to the test and click OK.
34
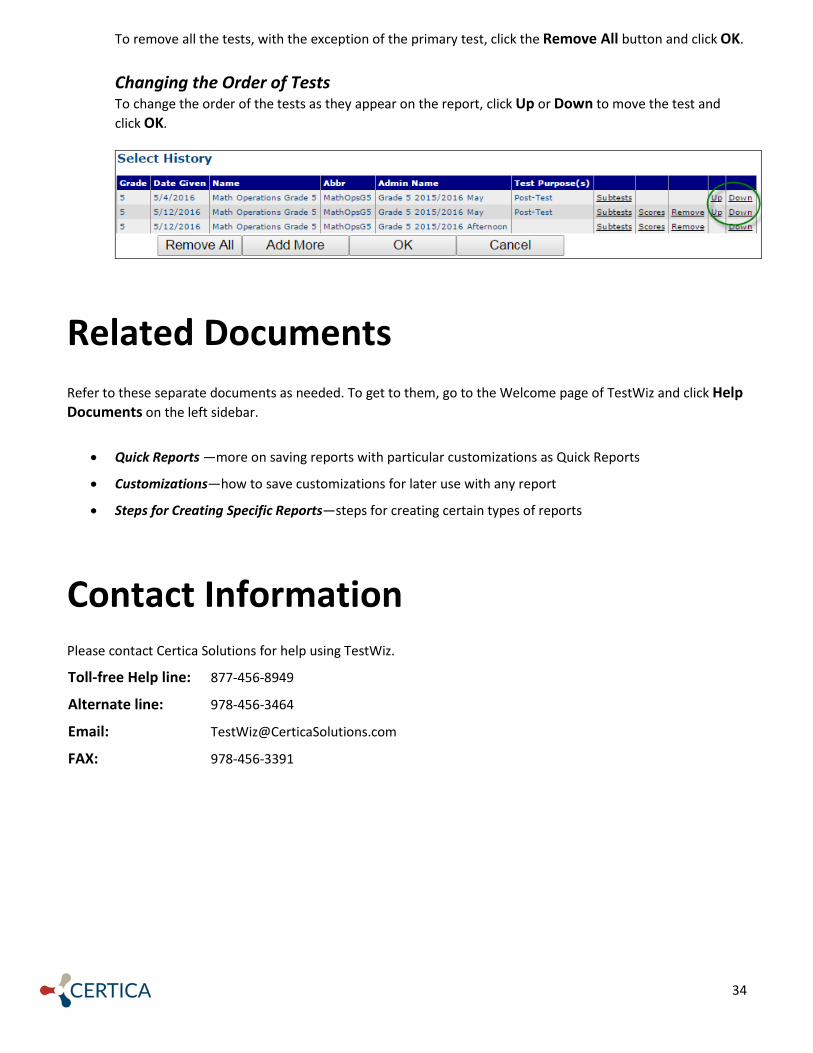
To remove all the tests, with the exception of the primary test, click the Remove All button and click OK.
Changing the Order of Tests To change the order of the tests as they appear on the report, click Up or Down to move the test and click OK.
Related Documents
Refer to these separate documents as needed. To get to them, go to the Welcome page of TestWiz and click Help Documents on the left sidebar.
• Quick Reports —more on saving reports with particular customizations as Quick Reports
• Customizations—how to save customizations for later use with any report
• Steps for Creating Specific Reports—steps for creating certain types of reports
Contact Information Please contact Certica Solutions for help using TestWiz.
Toll-free Help line: 877-456-8949
Alternate line: 978-456-3464
Email: [email protected]
FAX: 978-456-3391