Embed Size (px)
Citation preview

CUSTOMER PERCEPTIONS FOR EXPECTATIONS AND
ACCEPTANCE OF AN AUTHENTIC DINING
EXPERIENCE IN THAI RESTAURANTS
by
PIYAVAN SUKALAKAMALA, B.I.D.
A THESIS
IN
RESTAURANT, HOTEL, AND INSTITUTIONAL MANAGEMENT
Submitted to the Graduate Faculty of Texas Tech University in
Partial Fulfillment of the Requirements for
the Degree of
MASTER OF SCIENCE
Approved
Chairperson of the Committee
Accepted
Dean of the Graduate School
December, 2004

ACKNOWLEDGEMENTS
This thesis project is the result of the time and input of many people.
Without their help and support it would not have been possible. To complete a
thesis research project of this magnitude was a challenge both mentally and
physically. Thankfully, I was surrounded with people who were always supported
me.
I would like to take this opportunity to thank all of the people who made it
possible for me to write this thesis. I would first like to thank Dr. Janice Boyce, I
am very grateful to have her as my thesis committee chairperson. Special
thanks to her enduring devotion, guidance, encouragement, and help towards
this research. This work was not possible without the tremendous amount of
precious time and patience that she spent on working with me.
I would like to express my gratitude to Dr. Tim Dodd for his guidance and
advice, and also for serving on my thesis committee. I am also grateful to
Dr. David Rivera, Jr. for his help in part of my factor analyses. Appreciation goes
to the staff of Texas Tech University and especially to Restaurant, Hotel and
Institutional Management faculties for their advice and assistance.
Very special thanks go out to all of the Thai restaurant managers for their
time and cooperation by allowing the questionnaires to be surveyed in their
restaurants. I would also like to thank to the subjects who participated in the
survey study.

I would like to extend my sincere appreciation to my mother, Rachanee,
for her patience and enduring support throughout my life. She will always be a
source of endless support for me, and her love is one of the greatest treasures in
my life. I would like to dedicate this thesis to my mother for teaching me to value
knowledge, hard work, and self-improvement. My greatest appreciation goes to
my sister, Sophitmanee, for her patience and tireless work in suggesting, helping,
and giving guidance to me everyway that she possibly can.
Finally, and most importantly, I am extremely thankful for the love and
support of my family and friends. Without them the goal of obtaining this master
thesis would not have been possible.
Thank you all!
Ill

VI
viii
ix
TABLE OF CONTENTS
ACKNOWLEDMENTS
ABSTRACT
LIST OF TABLES
LIST OF FIGURES
CHAPTER
I. INTRODUCTION 1
Current Market 2
Purpose of the Study 3
Statement of Problem 4
II. REVIEW OF LITERATURE 6
Eating Out America 6
Movements of Ethnic Cuisines 6
Thai Food at Glance 8
Customer Perceptions 11
Customer Selection of Ethnic Restaurants 12
III. MATERIALS AND METHODS 15
Subjects 15
Pilot Test 16
Questionnaire 17
Statistical Analysis 17
IV
IV. RESULTS AND DISCUSSION 20
Demographic Characteristics of Subjects 20
Information about How the Subjects Use the Restaurant 25
Personal References 25
Characteristics of an Authentic Thai Restaurant Experience 31
Factor Analyses 34
Customer Perceptions 34
Characteristics of Authentic Thai Restaurant Experience 38
V. CONCLUSIONS 43
Findings 43
Implications 45
Limitations 46
REFERENCES 47
APPENDICES
A. TELEPHONE SOLICITATION 49
B. SURVEY AND COVER LETTERS 51

ABSTRACT
Multiculturalism is an intrinsic part of the historical formation and
development of the United States. The U.S. is also a multiethnic and multilingual
society, a trend that will increase in the future (US Census Bureau, 1990). One
of the important components of ethnicity is expressed in the manner in which
ethnic groups prepare and serve their food. Every group uses a distinct method
of cooking and traditional ingredients in their dishes. Ethnic foods represent a
dynamic and evolving category.
Over time foods that were considered ethnic, like pizza, have become a
part of the mainstream in the American diet. Most recently, restaurateurs are
beginning to mix and combine the influences and traditions from a variety of
ethnic origins in a fusion of cuisines and flavors.
Today, Thai food is very popular. Many Thai restaurants open each year
in the U.S. to meet the needs of the Thai population and others. Today in the
U.S., Westerners are more accepting of international cuisines than before. Most
Thai restaurant owners are Thais who may or may not have experience in the
restaurant business. It is important for restaurateurs to know consumer demand
before opening a restaurant due to the high rate of restaurant failures.
Sometimes the ambience of the restaurant will greatly effect customer
preferences because they are not familiar with the new setting, so they may feel
VI

uncomfortable while dining. An example is eating with chopsticks at a Chinese
restaurant or sitting on the floor to eat in a Japanese restaurant.
The purpose of this study is to investigate: 1) customers' authentic
expectation for food, as well as the overall experience 2) the amount of
authenticity customers can accept in a future Thai restaurant experience and 3)
what customers want Thai restaurants to provide them with when they go for the
dining experience.
A total of 250 questionnaires were distributed to guests in five Thai
restaurants in the United States. A total of 247 completed questionnaires were
returned (98.8%). The majority of the respondents were between the ages of 21-
30 years old (25.5%). Seventy-six pereents of survey responses identified
themselves as White Americans. Fifty-four pereents of the subjects were
married. The majority of survey respondents indicated that they had achieved at
least a college degree and 35.6% of subjects had an annual income of more than
$80,000.
A descriptive analysis indicated subjects who had higher incomes and
were well educated scored higher having a practical and positive attitude on an
authentic Thai restaurant. An additional portion of the survey indicated that the
majority of customers did not have a higher expectation of employees and
traditional Thai influences like decorations and atmosphere while the taste of the
cuisine are indicated to be the most important component in their dining
experience at a Thai restaurant.
VII

LIST OF TABLES
L Demographic characteristics (n=247) 21
2. Information about the use of Thai restaurant (n=247) 26
3. Mean and standard deviation of personal preferences toward the attitudes and behavior related to eating ethnic or regional cuisines in restaurants (n=247) 28
4. Mean and standard deviation of characteristic of an Authentic Thai restaurants experience (n=247) 32
5. Factor analyses testing for the personal preferences (n=247) 37
6. Factor analyses testing for characteristic of an authentic Thai restaurant experience (n = 247) 42
VIM

LIST OF FIGURES
1. Scree plot for personal preferences 35
2. Total variance explained of personal preferences 36
3. Scree plot for characteristic of an authentic Thai restaurant experiences 40
4. Total variance explained the characteristic of au authentic Thai restaurant experiences 41
IX

CHAPTER I
INTRODUCTION
Multiculturalism is an intrinsic part of the historical formation and
development of the United States. According to 1990 U.S. Census data there
are 135 U.S. ethnic groups using 150 languages in the United States. In
addition, there are hundreds of thousands of foreign students, tens of thousands
of foreign businesspeople, millions of legal aliens working for U.S. companies,
and visitors from all over the world staying in the United States (US Census
Bureau, 1990). The U.S. is a multiethnic, multilingual, and multicultural society,
which is projected to increase in the future. In fact, the United States is able to
represent the entire world virtually with all races, ethnic groups and languages
(Wertsman, 1996). These immigrants try to simulate an environment much like
their own origins in some aspects of their lives. Culture along with their own
ethnic foods help immigrants adjust to the United States. When Italians came to
the America they brought along their foods such as pizza and pasta. Today
pizza and pasta have become American favorites.
One of the important components of ethnicity is expressed in the manner
in which ethnic groups prepare and serve their food. Every group has a distinct
way of cooking and they use specific ingredients in their dishes. Each ethnic
group has preserved distinct features, which make their cuisine unique. Ethnic
foods represent a dynamic and evolving category. The term "Ethnic Food" is

difficult to define because it has a different meaning for each individual (National
Restaurant Association, 1995).
Over time items that used to be distinctly ethnic, like pizza, have become
a part of mainstream in the American diet. Many American consumers have
become far more interested in foods with different strong taste profiles.
International cuisines are becoming more acceptable. Most recently,
restaurateurs are beginning to combine the influences and traditions from a
variety of ethnic origins in a fusion of food and flavors.
Current Market
According to the National Restaurant Association (2004), the U.S.
restaurant industry predicts sales will reach $440.1 billion and is expected to
continue to grow. In 1999, $2,116.00 was spent on food away from home by the
average American household while each person individually spent around
$846.00. These numbers show that people are dining out more with projected
sales continuing from 2003-2004 of 4.6 percentages. This indicates consumers
are willing to spend money for entertainment and experiences. Families, who
have more discretionary income, are more likely to enjoy spending money on
food (National Restaurant Association, 2003).
Today, ethnic food is very popular. Many ethnic restaurants open every
year around the U.S. In the past, ethnic restaurants were opened to serve ethnic
people and other cultures to meet their needs. However, today in the U.S.,

Westerners are more accepting of international cuisines. Most ethnic restaurant
owners are internationals who may or may not have any experience or
background in the restaurant business. It is important for restaurateurs to know
consumer demand before opening a restaurant due to restaurant failures. From
1996 through 1999 failure rate was 57 to 61 percent for the first three-year period
after opening (Human Ecology News, 2003).
Purpose of the Studv
There are many food service operations in the US and there are also
many different kinds of cuisines in the restaurant industry. Since the majority of
customers are U.S. consumers and will likely be the ones to try new cuisines, it
would be good for the restaurant owners/managers to know what people want
and what they are looking for; beginning with the environment, the interior
design, and the menu of the restaurant. The main reasons customers choose
where to dine may depend on the authenticity of the restaurant. Or customers
may desire to experience a cuisine blended like Asian Fusion.
Most customers never experience the authenticity of a cuisine. They may
not know the difference between what is authentic and what is a blended cuisine
of Western styles. Therefore, most people expect their first experiences of the
taste and texture of the food to be consistent in every ethnic restaurant.
Sometimes the ambience of the restaurant will have a great effect on the
preference of customers because they are not familiar with the new setting, so

they may feel uncomfortable while dining. Also, customs of the culture like eating
with chopsticks at Chinese restaurants or sitting on the floor at Japanese
restaurants may also seem awkward for customers.
The purpose of this study is to investigate: 1) a customers' overall
expectations of a ethnic cuisine restaurant 2) customers' authentic expectation
for the food, as well as the overall experience 3) the amount of authenticity
customers can accept in a future ethnic restaurant experience and 4) what
customers want ethnic restaurants to provide them when they go for the dining
experience.
Statement of Problem
Ethnic cuisine has evolved over the centuries and now ethnic food has
become popular due to its' exotic flavors and healthy preparation method. Most
Americans misunderstand the difference between an authentic dining experience
and a traditional food experience.
Authentic and traditional foods do not necessarily mean the same thing.
Cooking done by international immigrants in the U.S. is not truly authentic but it is
very traditional. Another important factor influencing authentic Thai cooking is
the availability or lack there of finding authentic ingredients. The lack of these
certain ingredients like herbs and spices make cooking some ethnic dishes
impossible (Friedland, 2002). Most ethnic restaurants in the U.S. do not have
professional chefs, but highly trained kitchen staff.
The purpose of this research is to present authentic ethnic food from a
more understandable and comprehensive perspective. This project will
investigate and study the degree of authenticity customers can expect and enjoy
through traditional facets of ethnic cuisine. The goal of this research is to provide
information for ethnic restaurant owners/managers based on customer
expectations of an authentic ethnic cuisine experience. Outcomes of this project
will allow current or future restaurateurs to produce authentic ethnic food
prepared the way that most patrons' expect. Also, the results of this project may
encourage researchers in other Hospitality programs to pursue other ethnic
cuisines and restaurants. Professionals in the food industry may also use the
results of this research to develop strategic plan for their organizations.

CHAPTER II
REVIEW OF LITERATURE
Eatina Out America
For the past several years, people have begun to eat out more than ever
before. Today consumers spend 46% of their food dollar at restaurants. This
figure is expected to increase to 53% by 2010. There are many factors affecting
this including: an increasing amount of single households, more families having
double income providers, a need for companionship, dieting fads, and health
issues (Kalmar, 2001). Restaurants are constantly adjusting to fit the needs of
customers and to keep up with the changing times. They continue to provide the
best possible service for everyone. There will always be people who need and
want to go to restaurants. Businesses will continue to send their employees on
business trips and people will continue to want food cooked for them on special
occasions or after a long hard day. Vacationers must have a place to dine out
while on the road.
Movements of Ethnic Cuisines
In the United States, ethnic cuisines have existed for several decades.
European influenced restaurants like Italian, French, Spanish, English, German,
Swiss and Greek were among the first ethnic cuisines and had a great impact on
American society. During the 1950s to 1970s, additional ethnic cuisines like

Mexican, Cuban, Jamaican, and Polynesian were introduced. As the turn of
century approached, new cuisines gained enormous acknowledgment. These
are Chinese, Japanese, Korean, Thai, Indian, and Middle-East (Ladki & Nomani,
1996).
In 1989, the National Restaurant Association (NRA) reported that Thai
cuisine ranked 16'* in ethnic foods being consumed at restaurants (Riehle, 1989).
It also stated that Thai cuisine was ranked behind other ethnic cuisines because
the cuisine was consumed by a small segment of the population. Olsen, Warde,
and Martens (2000) stated that most Thai restaurant's customers were well
educated, live alone and had high incomes. The National Restaurant
Association also stated that Thai cuisine is becoming more popular because it
offers very flavorful dishes. However, Thai cuisine is not easy for individual to try
and prepare at home.
According to Macey (2001), American customers are more willing to try
new things and are open to new flavors. Customers are willing to try new ethnic
flavors, so the demand for ethnic cuisines is increasing rapidly. The increase in
ethnic populations in the U.S is reflected in the number of restaurants that offer
these groups a taste of home. For example, casual dining Asian restaurants
increased by 800 units all over the U.S. during the past 3 years (Macey, 2001).
Gordon (1991) reported that 67% of Asian restaurants received the most
business at dinnertime and another 33% from lunch.

Most Americans no longer consider Italian, Mexican, and Chinese a
foreign food but are mainstream. Kruse (2000) reported that Japan, Southeast
Asia, and India would become prime sources of new ethnic menu items. Today
there are many ways that restaurants present ethnic cuisines to customers, such
as through authenticity and fusion. Fusion food is one of the most important
foodservice trends. Fusion cooking is a great way to introduce many consumers
to an ethnic cuisine. It is the combining of characteristic ingredients and/or
cooking techniques of two or more ethnic cuisines to create fusion meals (Ohr,
2000). However, many customers do not know what the differences are between
authentic and fusion. Authentic cuisine is features distinct cooking methods,
using specific ingredients and traditional kitchen utensils use by each ethnic
group when presenting dishes in their own way. Fusion food on the other hand is
to combine the elements of various culinary traditions, which do not fit specifically
into any particular style on type of cuisine (Wertsman, 1996).
Thai Food at Glance
Thai food is known the world over as a unique cuisine. It is also
recognized as a health food because of its richness in nutritional value. Herbs
also play an important part in the Thai diet. Thai food is famous all over the
world, whether chili-hot or comparatively bland, harmony is the guiding principle
behind each dish. Thai cuisine is essentially a blend of centuries-old Eastern
8

and Westem influences harmoniously combined into something uniquely Thai
(The History of Thai Food, 2003).
Originally, Thai cooking reflected the characteristics of a waterborne
lifestyle. Aquatic animals, plants and herbs were the major ingredients.
Subsequent influences introduced the use of sizeable chunks to Thai cooking.
Large chunks of meat were eschewed.
With their Buddhist background, Thais avoided the use of large animals in
big chunks. Large cuts of meat were shredded and laced with herbs and spices.
Traditional Thai cooking methods were stewing, baking, and grilling. Chinese
influences saw the introduction of frying, stir-frying and deep-frying. Culinary
influences from the 17th century onwards included Portuguese, Dutch, French
and Japanese. Portuguese missionaries introduced chilies to Thai cooking
during the late 1600s (The History of Thai Food, 2003).
Thai cooking is very different than modern western cooking. Where in
western cooking particularly baking, ingredients are measured exactly. With Thai
cooking however, measurement is much more lenient. In Thai cooking there are
four flavors: sour, sweet, creamy and spicy. Heat sits on top of the four flavors.
The secret of a good dish is the right balance of the flavors. The National
Restaurant Association (1995) compared Thai cuisine with others and found that
Thai cuisine provided hot and spicy food, which was a unique flavor; not found in
other cuisines. They also found that Thai cuisine used mostly fresh ingredients
and was beautifully presented.
9
One of the challenges to cooking Thai food away from Thailand is having
the right ingredients. The majority of the ingredients are not common to
Westerners and are difficult to find. Even though Thai flavors come together in a
system that is very different from American or western flavor systems, this
system can be easily learned.
Fortunately, Thai ingredients are now more widely available. However,
when the ingredients are not available in the United States, substitutions may be
suggested; but only if it does not compromise the dish. While what people see in
a Thai restaurant outside of Thailand may not be what they eat in Thailand there
are comparable substitutions. For example, carrots are rare in Thai dishes in
Thailand but are very popular additions to Thai dishes in the United States.
The ideal Thai meal is a harmonious blend of the spicy, the subtle, the
sweet and the sour tastes, and is meant to be equally satisfying to eye, nose and
palate. A typical dinner menu might include a clear soup, a steamed dish, a fried
dish, a hot salad and a variety of sauces into which food is dipped. Sweet
desserts and/or fresh fruits such as mangoes, durian, jackfruit, papaya, grapes or
melon would follow the main course or meal.
Thai food is eaten with a fork and spoon. Even single dish meals such as
steamed rice topped with pork, are served in bite-sized slices to prevent the need
for a knife. The spoon is used to convey food to the mouth.
10

Customer Percfiptinng
Upon entering a restaurant, customers will have certain perceptions of the
dining experiences they are about to encounter. A study by Sommerville (1995)
divided restaurant diners into 3 categories: culture-oriented customers,
restaurant-oriented customers, and preparation-oriented customers. Each of
these groups was separated by using demographic characteristics, attitudes, and
the amount of knowledge, interest, and experience with ethnic cuisines.
The culture-oriented customers were mostly age between 40 to 59 years
old with a 50/50 ratio of men to women and a mean household income of
$52,600. This group of customers looked for the new and different, and wanted
to taste untried dishes and exotic flavors. They also desired a challenge and
enjoyed trying new cuisines as a hobby. This group of customers found an
authentic cuisine with evocative decor provided by natives to be interesting.
They also liked trying special native beverages.
The next group in the study is restaurant-oriented customers mostly
between the ages of 40 to 59 years old, a 49/51 ratio of men to women and a
mean household income of $ 48,200. This group represented 40 percent, which
is the largest segment of restaurant patrons (Papadopoulos, 1995). However,
they had less experience with ethnic food than the culture-oriented customers.
They looked for good food in a warm comfortable atmosphere. Dining in an
ethnic restaurant was just another dining experience for them. This group also
11

liked the friendly and attentive service and was big fans of take-out and delivery
services.
The last of these groups are preparation-oriented customers, with 37%
being 60 years old or older and 73% being female and 27% male. The
household income for this group averaged $ 36,200. This group likes to leam
how to cook new food but is least interested in exotic foods especially hot and
spicy. They preferred restaurants that offered cooking classes, gave away recipe
cards, and had in-house ingredients available for sale (Sommerville, 1995).
Customer Selection of Ethnic Restaurants
There are many factors that help customers select their restaurants. Most
people believe that high quality and good tasting food is the first priority of
restaurant selection. This is one reason new ethnic entrees are becoming more
popular because they meet the growing demands for flavorful, healthy meals.
Americans desire a more healthful lifestyle, but also want to indulge in tasty
foods (Ladki & Nomani, 1996).
The study by Castelo and Salay (2001) showed that price and
convenience are the major factors in the decision to eat out. Other important
factors were the hygiene and cleanliness of the restaurant, fast and friendly
service, and the ambience of the facility.
12

Restaurant design may effect a restaurant's environment. The dining area
should be comfortable for example, using chairs instead of stools. Also the
decoration of the restaurant should suite the restaurant theme.
Other studies have shown that the most frequent factors affecting
consumers' satisfaction are speed of service, hour of operation, food eye appeal,
and restaurant reputation. The study of MacLaurin and MacLaurin (2000) of
Hard Rock Cafe in Singapore also agreed that service is very important in the
restaurant business. The restaurant required all employees to attend the
complete customer service-training program before performing the job.
Additional factors like recommendation from friends, availability of nutrition
information, appropriate selection of regional ethnic dishes, and employee
courtesy are also important. While Thorns study (2003) indicated that the taste
of the food was the main factor that would bring back the customers.
Additionally, portion size and reliability of portion size were found to be one of the
main factors to bring back customers (MacLaurin & MacLaurin, 2000).
According to Papadopoulos (1995), some customers may find it
discomforting when ethnic restaurants listed the menu in foreign names without
descriptions and some ethnic restaurants still use their native language to name
dishes. The National Restaurant Association (1995) states that, the most helpful
thing an ethnic restaurant should do is to provide information about the
ingredients and preparation of dishes on the menu. This allows customers to
13

have a clear understanding of the ingredients in the dish then they are able to
make an appropriate menu choice.
The menu is furthermore capable of influencing customer's satisfaction.
MacLaurin and MacLaurin (2000) stated that the menu should be simple to
understand while fitting with the theme of the restaurant. In addition, a well-done
menu must be attractive to customers as well as should offer a number of foods.
The study by Papadopoulos (1995) also stated that the customers do not
care for the authenticity of the restaurant when compared to the flavor. Most of
the time, the decision to go back to ethnic restaurant relies on the first time visit.
If the customers have positive impressions they are more likely to go back to the
restaurant. However, there are some customers who really want to experience a
real authentic food just like it is served in the country of origin however; it is hard
for the restaurateurs to prepare the real authentic dishes because of the lack of
ingredients (Friedland, 2002).
There are some concerns among customers toward ethnic restaurants.
Riehle (1989) stated that ethnic cuisines are more accepted among adults.
However, when families with children go out to eat, the kids may influence where
to dine out. Because of this conflict, some customers hope to see more family
style ethnic restaurants so they can dine out more often with their families. The
study by the National Restaurant Association (1995) stated that a Thai restaurant
was not good for parents to bring along their children to dine out.
14

CHAPTER III
MATERIALS AND METHODS
Subjects
The information concerning consumer perceptions was obtained by
surveying certain U.S. populations in the United States. Subjects were recruited
from Thai restaurants in Amarillo, Dallas/Ft.Worth and Lubbock, Texas, San
Francisco, California, and St. Louis, Missouri. The three different types of
restaurants that were surveyed were as follows: fast food, buffet, and table
service. This survey was conducted during the summer of 2004.
Texas Tech University Institutional Review Board approved the protocol
for this study for the Protection of Human Subjects. Before distributing a
questionnaire, each restaurant manager was contacted by telephone (Appendix
A). They were given details about this research and asked to participate.
A total of 250 subjects were asked to participate in this study. These were
divided into 50 subjects per restaurant. The researcher was acquainted with the
owners of these particular restaurants who agreed to allow the questionnaires
(Appendix B) to be distributed to their customers. The subjects who participated
in the study were at least 21 years of age.
All potential participants were informed that their participation was
voluntary and their responses were kept confidential. They had the right to
refuse to answer any questions and withdraw any time without penalty.
15

Questionnaires were mailed to each restaurant where they were
distributed to customers. Customers were asked to return questionnaires to wait
staff or were returned to the researcher. The restaurant managers were asked to
mail the questionnaires back to researcher within a week. Two weeks after
mailing the questionnaires, the researcher contacted by telephone any restaurant
managers who did not return questionnaires.
The questionnaire asked general information about consumer
perceptions, consumer expectations, consumer acceptance, and demographic
characteristics. Customers were informed that their participation was voluntary
and responses were to be kept confidential. Each questionnaire was coded by
location.
Pilot Test
Before the questionnaire was finalized, a pilot test was conducted on 20
volunteers. The pilot test consisted of each participant completing the
questionnaire and providing the comments about the questionnaire. The time
each participant used to complete the questionnaire was noted. Comments from
participants were used to revise the questionnaire for use in the actual survey.
In the pilot study, participant names were kept confidential. However for
the survey, participant names were not kept, only the contact names of
restaurants are being retained after the data collection.
16

Questionnaire
Format of the questionnaire (Appendix B) was multiple choice, 10-point
Likert scale and fill in the blank. The questionnaire was modified from the study
of "Ethnic Cuisines: A Profile" by National Restaurant Association (1995). The
questionnaires were numerically coded to protect the subjects' privacy. There
were four parts to the questionnaire, which asked for information regarding
customer decisions to use restaurants, personal preferences, perceptions of
characteristics for an authentic Thai restaurant experience, and demographic
characteristics.
Part one of the questionnaire generally asked about who the decision
maker is to eat out for the household, what their favorite cuisine is and about the
use of Thai restaurants. Part two asked participants about their personal
preferences and experiences with ethnic cuisines. Part three of the
questionnaire concentrates on the characteristics of authentic Thai restaurants
experiences. Questions asked in this part related to taste/flavors, design setting,
environmental, atmosphere, and employees. Part three of the questionnaire also
focused on demographic information such as age, gender, education, and annual
income.
Statistical Analysis
All statistical analyses were performed using the SPSS program "the
Statistical Package for the social sciences" for Windows Version 11.5.
17

Statistical influences were based on 2-tailed test with significant level set at 0.05.
Means and standard deviation were determined for personal references,
characteristics of an authentic Thai restaurant experience, and demographic
characteristics.
Factor analysis was used to separate the components on personal
references and characteristics of an authentic Thai restaurant experience.
Correlation analysis was used to determined relationship between
demographic characteristics and factor analysis's components. Factor analysis
is a mathematical tool, which can be used to examine a wide range of data sets.
It reduces attribute space from a larger number of variables to a smaller number
of factors and as such is a "non-dependent" procedure (Williams, 1992).
Factor analysis is also a data reduction procedure used to combine many
variables into simpler more comprehensive variables. SPSS allows for many
items to be combined based on their similarities to form a construct. In this study
factor analysis was performed to determine if the statements used in the survey
instrument form underlying constructs. If underlying constructs exist about the
statements of the survey instrument they will be discussed based on their
relationships to one another (Green & Salkind, 2003).
To summarize, the information concerning consumer perceptions was
obtained by surveying certain populations in the United States. The
questionnaires were available only in English. Subjects had two weeks to
complete questionnaires and return to the researcher. The questionnaire asked
18

general information of subjects on consumer perceptions, consumer
expectations, and consumer acceptance of ethnic restaurant experiences. The
questionnaire can be used in future research projects as a guideline conceming
consumer perceptions.
19

CHAPTER IV
RESULTS AND DISCUSSION
A total of 250 questionnaires were distributed to customers in five Thai
restaurants in the United States. Customers returned 247 completed
questionnaires (98.8% response rate), 50 from Amarillo, Dallas/Ft. Worth, and St.
Louis, 49 from San Francisco, and 48 from Lubbock.
Demographic Characteristics of Subjects
A demographic profile of the 247 respondents is provided in Table 1.
There were 142 males (57.5%), 102 females (41.3 %), and 3 participants who
were unidentified (1.2%) due to lack of information. The results from this study
showed that the number of male consumers was higher than those female
consumers. However, study by Gordon (1991) found that the percentage of
female consumers (53%) of ethnic cuisine was higher when compared to the
ratio of male consumers (47%).
According to Table 1 most of the subjects were aged range 21-30 years
old (25.5%), 41-50 years old (22.7%), 31-40 years old (22.3%), 61-70 years old
(4.0%), others (2.0%), over 70 years old (2.0%). The demographic for the
participants of this study were these: over 76% indicate themselves as White
American, almost 11% indicated themselves as Asians/Pacific Islanders, almost
20

Table 1. Demographic characteristics (n = 247).
Variable Number 0/ /o
Gender
Female
Male
Age range
21-30
31-40
41-50
51-60
61-70
Over 70
Other
Race
White
Hispanic
African American
Asia/Pacific Island
Others
102
142
63
55
56
54
10
4
5
188
17
7
27
6
41.3
57.5
25.5
22.3
22.7
21.9
4.0
1.6
2.0
76.1
6.9
2.8
10.9
2.4
21

Table 1. Continued.
Marital status
Single
Married
Windowed
Divorced/Separated
Not available
Education
Some high school
High school graduate
Some college
College graduate
Bachelor's degree
Graduate school
Other
Annual income before taxes
Less than $20,000
$20,000 to less than $30,000
$30,000 to less than $40,000
Variable Number %
85
134
5
19
4
3
21
56
38
58
66
3
22
13
30
34.4
54.3
2.0
7.7
1.6
1.2
8.5
22.7
15.4
23.5
26.7
1.2
8.9
5.3
12.1
22

Table 1. Continued.
Variable Number %
$40,000 to less than $50,000
$50,000 to less than $60,000
$60,000 to less than $70,000
$70,000 to less than $80,000
More than $80,000
Not available
14
21
15
16
88
28
5.7
8.5
6.1
6.5
35.9
11.3
23

7% identified themselves as Hispanics, almost 3% identified themselves as
African American, while the remaining 2.4% of the participants indicated no race.
Marital status of subjects were as follows: 54.3% married, 34.4% single,
71% divorced/ separated, 2.0% widowed and remainder 1.6% no indication of
marital status. The level of education indicated that the subjects were well
educated which agreed with the study of the National Restaurant Association
(1995). Over 65% of subjects surveyed indicated they were college degreed.
While the remaining 22.7% indicated they had some college education, 8.5%
were high school graduate and the reminding 1.2% did not indicate a level of
education.
The results of this study show that the subjects ate out at Thai restaurants
an average of 26 times per year. The annual incomes of the subjects were
relatively high. Many of the subjects had annual incomes before taxes over
$80,000 (35.9%). The next highest percentage was in the $30,000 to less than
$40,000 group (12.1%), less than $20,000 (8.9%), $50,000 to less than $60,000
(8.5%), $70,000 to less than $80,000 (6.5%), $60,000 to less than $ 70,000
(6.1%), $40,000 to less than $50,000 (5.7%), $20,000 to less than $30,000
(5.3%), and data for this question were not provided by 11.3% of respondents.
The results of this study on annual incomes of consumers supported the study of
Olsen, Warde, and Martens (2000) and the National Restaurant Association
(1995) that the consumption of ethnic food is positively related to high personal
24

income and the higher the income, the more often the customers eat out at these
restaurants.
Information about How the Subjects Use the Restaurant
Table 2 showed information about the use of Thai restaurants. The study
found that the majority (92.7%) of the subjects were responsible for the decision
to eat out for the household. When asked about their favorite cuisine, most of
the subjects agreed that Thai cuisine was their favorite (26.7%), followed by
Mexican cuisine (19.0%), American (18.2%), Chinese (13.0%), Italian (4.1%) and
others (18.6%).
The survey indicated a large number of subjects had heard about Thai
food (99.2%) and had eaten Thai food in the past (98.4%). However, a few of
the subjects (0.8%) had never heard about Thai food or had never eaten Thai
food in the past (1.6%). Furthermore, about 242 (98.0%) of the subjects had
eaten out at Thai restaurants while 5 subjects (2.0%) had never eaten out at a
Thai restaurant.
Personal Preferences
The Mean and standard deviation of personal references toward the
attitudes and behavior related to eating ethnic or regional cuisines in restaurants
are shown in Table 3. Each of the statements asked in the survey were based
on a scale from 1 (does not describe me) to 10 (describes me very well).
25

Table 2. Information about the use of Thai restaurants (n = 247).
^^••'^^16 Number
Responsible for the decision to eat out for the household
Yes
No
Favorite cuisine
American
Chinese
Italian
Mexican
Thai
Other
Heard about Thai food
Yes
No
Eaten Thai food
Yes
No
%
229
18
45
32
10
47
66
46
245
2
243
4
92.7
7.3
18.2
13.0
4.1
19.0
26.7
18.6
99.2
0.8
98.4
1.6
26

Table 2. Continued.
Variable
27
Number %
Eaten out at Thai restaurants
Yes
No
242
5
98.0
2.0

O) c
l l _ «
ro (D
o ^ - J
• o CD
.*-.» CO CD i _ i _
o • >
Ct3 XI CD
.Q • o C CO
w 0
• a 3
" -» it=; Ct3 CD
SI .4—»
• a i _ CD $ O
. < — • w 0 o c 0
0 M —
0 1 —
Q.
"CD c o Cfl L _
0 Q.
«4—
o c g
'-I—»
Ct5 • >
0 • D
T3 L _
Ct3 • a c CD CO
• o
CD
c CD 0
2 oo 0
^
1 ^ • ^
CM 11 11
c U)
"c CD t _ 13 CD
• 4 — •
0
_C
w 0 c 'w 'D o
I D c O
'O) 0 1 _
1 »
o o 'c 0
•4—»
CO c CD 0
CD
cvi
C3)
CD
CD CD
CD
_0
CD
CD >
CO 0 c
'D o T3
c CD
W 0
^ — » W CD
0 c
c
O
o
CD .1—<
CO c o o E CD
0 13
13 O
c
CD
o JO CD
c CD 0
CD
CD
0 i _
D) CD CO
+-»
c 2 CD
w s? o 'c
CM 00 cvi
CD
o LO
0 c CD
o c "o
D O
. Q CD
•a o o U) D)
_c 0 E o CO
CD 0 x: 0 > CD
0
CD
C 13
0 C CO
o
0 c CD
CD
"cD CO 3
csi
oo
c .o CD u. CD Q .
Q .
~C0
c 0
C
0
C
'c JD Q. X 0
^ — »
o
0 E CD C
c g)
•0
CD CO 0 >
c O
C 0 E CD
c 0
- _ ^ . J ^ _ l - ^
0
o c o
T3
O 00
CD OO
00
c 2 CD
-4—»
CO
2^ CD
_ C
CO
CO CI. o
0
JO
CO c
_0 "3 C D
'.*—» CD 0
+-< c 0
I T3 O)
_C CO
C 0
sz
0
00 00
c\i
CXD
00
0 c CO o o
* - 4 — '
c 0
^ — » CD
c CD
c g CO
UL C CD CO
< 0
0 c
|co 'zj o •D 0
c _0 JD C
o "3 o
JD CD
ort
omf
0 c D » 0 0
t — ^ ™
CO 0
E " 0
E 0
CO
CD c iiu
;
led
JD CD • c 0
l * —
E 0 0
^ 0
E " 0
a
1 ^ CD
csi
CNJ
in
0 > CO
c 0 Q. X 0 _c CD
0 E o CO
CD 0
c CD O
0 CO
CD O 0
JD
CD CD.
CO —» c CD i _
_CD "GO
g 'c 0
E" 0
Csi
CD LO
00
0 o c 0
' k—
0 Q. X 0 g
V-* c: 0
c CD
C CD
. 4 - '
0 o c
. 0 'c 0 > c o o
0 o E CO
—» c CD CD
+-» CO 0 g 'c .c 0 E
T3 O
0 CD
LO CD
00 OJ 06
CO 0 _c [to 'D o g 'c 0 g v.* c 0
13 CD
0 O c 0
' l _
0 Q. X 0
c CD
28

•4—»
CO
c CD 0
• D 0
C o O 00 _0 JD CD
_ 0 SH .CD
CD >
OO Csj
Csi
o CJD
C\j Cvj
o o 00
CsJ CO
Csi
CD
iri
¥ Csi
CD
CD
CD 0
0 C
"co ' 3 o CD
CO 0 > CD
C
0 0
x: CO
-4—»
c CD t _ 3 CD
.+-• CO 0
o C D
0
05 C
"cD •D
• o C
it—
c 0 O
CD 3
0 1— 0
SZ Q. CO O
E i £ •-•-• CD
- . ^ CO
O *- i -c 3 CD
CO
C D c 1 o o o o
c CD 1— 3 CD
res
g 'c jz -4—»
0
c CD
_c T3 0 0 < i _ 0
• D
0
C3-T3 0 0 <4—
CO CD
x: 0 3
E CO CD
+.»
c CD • c 0 Q. E
^mj
c CO
c 0
SZ ^ — » 3 CD C CD
SZ
L— 0 x: CD L_
0
E 0 -» +-* c CD t 0 Q.
2 o E CO
0
c CO
' 3 o
o > CD
- - <
0
0 > 0 E CO
0
o CO 0
• a
CD
d g
.CD
dev
p ^ CD
•0 C CD
. I .J CO II
-6 CO
CD 0
E 0
;Q 'L— 0 CO 0
• D
. # — ' 0 C
oes
2, ''" E 0
0 CD 0 CO
29

The mean of the subjects who were constantly looking for new tastes and
cuisines to try was 7.19, which explains that most of subjects were looking for
new tastes and cuisines. This supports the findings of Sommerville (1995),
which found that the customers wanted to taste new dishes and exotic flavors.
The mean score of 7.69 showed that subjects agreed with the question
that going to ethnic restaurants is a great way to leam about different cultures.
However the mean score of 5.09 suggests subjects may try to avoid unfamiliar
cuisines regardless of recommendations from others. The mean score of 7.87
showed that subjects did not like it when menus only gave a foreign name
without explaining the ingredients or preparation method. Papadopoulos (1995)
supports this finding by stating that some customers find it difficult to order when
ethnic restaurants listed menu items in a foreign language without descriptions.
The mean score of 3.89 demonstrated that most of the time subjects felt
more comfortable when using different eating utensils, like chopsticks in a
restaurant. Most subjects felt uncomfortable dining out on blended cuisine like
Asian Fusion, than eating in authentic restaurants (3.78).
The mean score of 5.21 showed that subjects were fairly neutral in their
opinions to the question about enjoying ethnic restaurants because they could
eat relatively inexpensively. The mean score of 3.59 showed that subjects did
not get food from ethnic restaurants for their convenience of purchase, but for the
authentic experience. This finding refutes the results of Castelo and Salay
(2001), which found that most of the participants in their study made their food
30

purchasing decisions based on the price and convenience of the cuisine being
purchased.
The mean scores of 8.28 and 8.04 showed that subjects wanted to
experience authentic ethnic cuisines and liked to go to restaurants where natives
of the cuisine dine. In addition, most of the subjects found that ordering food in
an ethnic restaurant was not an intimidating experience. The subjects somewhat
agreed that a restaurant's atmosphere was not as important as the food quality
(5.97). According to Sommerville (1995), a group of restaurant-oriented
customers between 40 to 59 years of age were looking for good food in a warm
comfortable atmosphere. Robson (1999), also states that some of the ambient
factors such as color, sound, lighting, and scent could help produce a restaurant
environment that offers a positive guest experience. A study conducted by
Papadopoulos (1995) stated that customer's prefer flavor to the authenticity of
the restaurant. The mean of 6.16 supports the findings of Papadopoulos that
subjects prefer the flavor of the cuisine rather than authentic cooking.
Characteristics of an Authentic Thai Restaurant Experience
The mean and standard deviation of characteristics of an Authentic Thai
restaurants experience are shown in Table 4. Each of the statements asked in
the survey were based on a scale from 1 (not important) to 10 (very important).
The mean score of 4.07 indicated that real authentic Thai exterior design was not
important for authentic Thai restaurants as well as real authentic Thai interior
31

Table 4. Mean and standard deviation of characteristic of an Authentic Thai
restaurants experience (n = 247).
Variable
Real authentic Thai exterior design
Real authentic Thai interior decor
Hearing authentic Thai music played
Seeing wait staff wear Thai clothing
Traditional Thai greeting
Thai style tableware/ silverware
Thai style menu design including Thai language on the menu
Traditional hot and spicy tastes
Real authentic Thai dishes using authentic Thai ingredients
Only Thais preparing Thai food
Only Thai wait staff
Employees communicating with each other in the Thai language
Mean Std.
4.07 2.50
4.89 2.58
4.40 2.80
4.37 6.00
4.05 2.71
4.06 2.61
4.61 2.67
7.02 2.70
7.76 2.42
4.96 3.01
3.84 2.73
3.26 2.54
Std. = Standard deviation
Scale: 1 (not important) to 10 (very important).
32

decor (4.89), hearing authentic Thai music played (4.40), seeing waitstaff wear
Thai clothing (4.37), traditional Thai greeting (4.05), Thai style tableware/
silverware (4.06), Thai style menu design including Thai language on the menu
(4.61), only Thais preparing Thai food (4.96), only Thai wait staff (3.84), and
employees communicating with each other in the Thai language (3.26).
However, According to the study performed by George (2001), customers of
Chinese restaurants prefer the restaurant to have an authentic appearance,
which includes a traditional Chinese uniform, decorations, and music. Out of the
three features described, customers preferred authenticity in decoration over
uniform and music. Maclaurin & Maclaurin (2000) found that the uniform of
service employees should match the theme of the restaurant.
The study by George (2001), stated that despite customers preferring
authentic decorations over music and uniforms, patrons still considered food to
be the most important element in their dining experience which agreed with the
results of this study that traditional hot and spicy taste (7.02) and real authentic
Thai dishes using authentic Thai ingredients (7.76) were important to the
subjects.
33

Factor Analvsis
Customer Perceptions
The customer perceptions section of the survey was designed to measure
the perceptions toward the ethnicity of the ethnic Thai restaurant. In an effort to
further define customer perceptions, the data reduction procedure of factor
analysis was employed using SPSS. This was done to see if there were
underlying factors within the overall construct of customer perceptions. Two
tools were used to determine if there were underlying constructs within the
customer perceptions section of the survey. A scree plot and the total
explainable variance were examined to determine the number of potential
constructs that existed. The scree plot (Figure 1) shows a three factor solution is
appropriate. This assessment was confirmed using the results of the total
explainable variance table provided by SPSS, which may be seen in Figure 2.
Figure 2 shows that three variables account for over 48% of the variance within
the consumer perception component of the survey. After examination of the
scree plot and the total variance explained table provided by SPSS a three factor
solution was tested using Varimax rotation. The rotated solution may be seen in
Table 5, and confirms that there were three separate and distinct components,
which make up consumer perceptions of dining in Thai restaurants.
34

Scree Plot
3 -
0) = 2 re > c O)
in
1 -
Component Number
Figure 1. Scree plot for personal preferences.
35

ned
ra
xpl
nee
E
ra
IVa
ri
ra
Tot
(0 CT
_C "O m o
_ j
T3 0}
CD 3
a CO * -o 10
E D CO c
_ v j
"o CD L _
UJ ^
j
J 0)
enva
k IE
ic|(
itia
nf
£ 55
"n 0 H
" c
pone
E 0 0
VO 0 0 0 0 ° 0 0 CSJ 0 <U • ^ • * 0 0
— csi cri ocj TO CM CO •<}•
3
E 3 0
CD 0 0 ^ - . -y CO CO 0 0 g T - CM CO
c csj 1^-: CT) (C CSJ ^
> 0
5?
C35 (35 CO CJ) 1 - T -
(5 0 • * CO 3 CO csi T-'
5 0 0 0 0 0 0 CO CSJ 0 CM
U - ^ •<:l; 0 0 C35
S csi CI) 06 ir i ;] CSJ CO Tj- i n
5
5
a 0 0 T - . ^ 0 0 ^ 0 0 0 0 0 0 CN = •<-; CSJ CO T -- CSJ h^' cri N : 3 rvj ^
> ) >
CJ> CD CO 0 0 CD •«- - ^ CD 0 - ^ CO CD CO csj -r^
.,_ CD 0 0
csi CD
CO CO CD
CD
T—
f ^ CD
•«- CSI CO Ti- i n
CD CSJ
i n ai CD
i n CD CO
CD
CO CO CD
t o
m CD
iri 1 ^
O )
• ^
CD
( i n
°9
~
CO T -• ^ CSJ CD CO
CD i r i 0 0 CO
0 0 0 0 CO 0 CD r^
• * ' • *
CD CD ( D i n CD CD
X) O )
5 i n <D 0 0
( D CO CM
-
CO CD i n
0
0 0 CD CD
CO CD
0 0 0
• ^
i n t-~ i n
<-
CO
5 1 ^ CD
m 1 ^
CO
•<t Cvj i n
•M
a>
CD CD
1 ^ i n
c\i
CD CO
t o
C3 0 0
CD 0 • « —
CD 0 CD
T—
0 0
^ t
ysis
. tA
na
l
c
pone
E 0 0
CD Q .
0 C
hod:
Pr
Met
ct
ion
CD 4—*
u
CO 0 0
fere
i
0
Q.
rson
al
0 CD.
0 • 0 0 c
plai
0 0 f •) )U
B!
i —
Tot
al v
a
CsJ
0
3 O) ii.
36

Table 5. Factor analyses testing for the personal preferences (n = 247).
Item Factor 1 ^ Factor 2^ Factor 3^
Learn about a different culture
Look for new tastes and cuisines
Want to go to restaurants that native eat
Want to experience authentic cuisines
Find it intermediating to order food
Authentic restaurants are inexperience
Flavor is more important than authentic cooking
Food is more important than atmosphere
Eat ethnic food because of the convenience
More comfortable with fusion
Uncomfortable with different utensils
Try new cuisine when heard good thing
Do not like foreign names in menus
.472
.676
.767
.787
-.555
.518
.522
.532
.593
.600
.436
.637
.796
^Factor 1 = searching for authentic cuisine
Factor 2 = practical concern about authentic cuisine
Factor 3 = Novelty seeking in authentic cuisine
37

An examination of the items which make up the three factor solution led the
researcher to name Factor 1 searching for authentic cuisine, Factor 2 practical
concem about authentic cuisine, and Factor 3 to be named novelty seeking in
authentic cuisine.
The three factor solution for the first set (Table 5) of statement shows that
Factor 1 of the first set of statement was grouped together as searching for
authentic cuisine: leam about a different culture, look for new tastes and
cuisines, want to go to restaurants that native eat, and want to experience
authentic cuisines.
Another six statements of factor 2 were clustered together as practical
concem about authentic cuisine: find it intimidating to order food, authentic
restaurants are inexpensive, flavor is more important than authentic cooking,
food is more important than atmosphere, eat ethnic food because of the
convenience, and more comfortable with fusion. Finally, the third factor was
determined. It included uncomfortable with different utensils, try new cuisine
when heard good thing, and do not like foreign names in menus these loaded
together and were called novelty seeking in authentic cuisine.
Characteristics of Authentic Thai Restaurant Experience
The procedures used to examine if underlying constructs existed in the
characteristics of authentic Thai restaurant experiences were the same as those
employed to examine the customer perceptions section of the survey. The scree
38

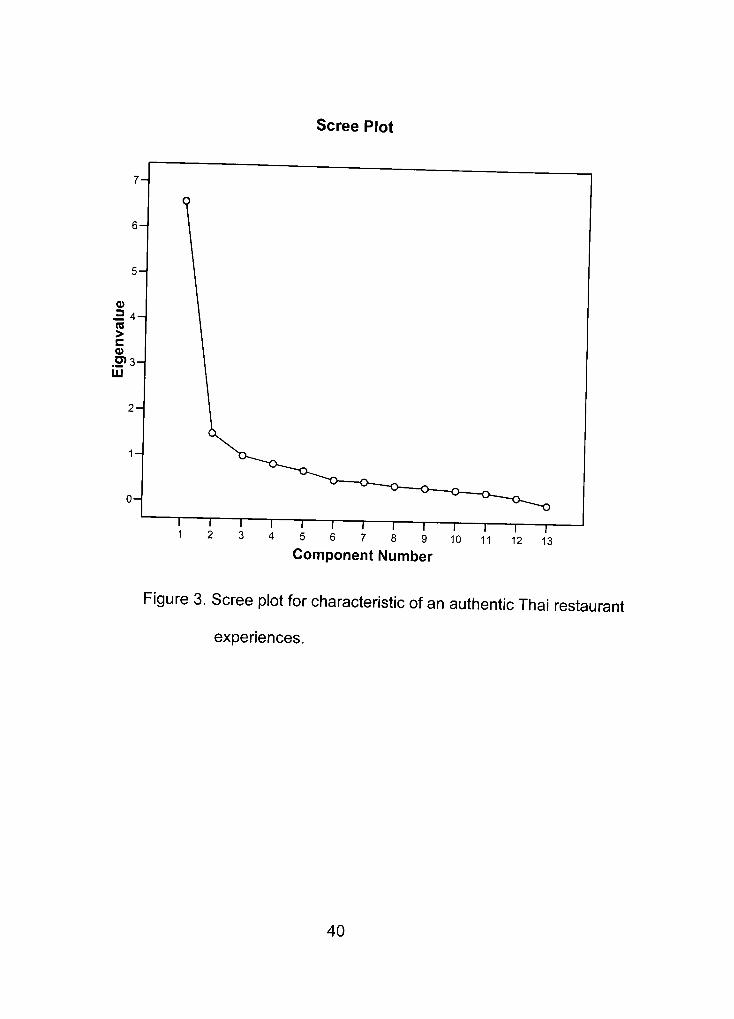
plot (Figure 3) provided by SPSS suggested the use of a two factor solution, but
an examination of the total variance explained table (Figure 4) provided by SPSS
suggested a three factor solution. Based on the contradictory results of the scree
plot and the total variance explained table a two and three factor solution using
Varimax rotation was examined. Based on the results of the three factor solution
it was determined by the researcher that the three factor solution provided by
SPSS was superior. The rotated solution may be seen in Table 6, and confirms
that there were three separate and distinct components, which make up
characteristics of authentic dining experience in Thai restaurants. An
examination of the items which make up the three factor solution led the
researcher to name Factor 1 environmental concerns. Factor 2 food concern,
and Factor 3 employee concern.
The first factor for the second set of statements was environmental
concern, which were grouped together: Thai style uniform. Thai style menu
design using Thai language, traditional Thai greeting. Thai style
tableware/silverware, authentic Thai music, and real authentic Thai exterior and
interior design. Factor 2 was clustered together as food concern: using authentic
ingredients in dishes and Traditional hot and spicy tastes. The last factor for the
second set of statement was employees concern: only Thais preparing food,
using Thai language for communication, and only Thais wait staff employees.
39
Scree Plot
1 r 9 10 11 12 13
Component Number
Figure 3. Scree plot for characteristic of an authentic Thai restaurant
experiences.
40

s S CSI m 0 0 ° cvj in fc 0) CO O C£5
§1 . § CO CD a i r nj <o in (D
T3 =3 ro p 3 ^
ra <p CSI CO CO
i CJ
'c a £
c7 c c
5 c Q:
w D
ro o
"O 0)
• a ro 5 3 •= CO ra i . a o
eE
x
urns
rianc
Ion
Si
ra o > ra
^ ra "5< o ^
1-
w 0)
1 E
lgen
valL
tia
^
1
_
'
^ U CM CO CSI J c: 0 0 r^ CD ' 2 CO cvi c-i 5 nj CO cvj T -
2 > : "o ) „ ) S9
) CM i n 1 -co i n h -
nj CO O) N-o ^ ' <N T-:
gS O O 00 ° CD •>* r^ CD • * en CD ~ d .r^ ai (5 m CD CO
3 E 3
o CD O T - 00 y CD i n CO C r t •(J- r^
• g CD ^ r^ ro « - ->
^ o^
•«f CD CD CD 00 O
ro • " ' ^ o •Q <0 -r- •,-1-
s? S 2 ?> £J ° en - ^ N- CO (D • ^ CD CD —
~ ° • ^ CD CO (;3 i n CD CD N .
3 E 3
o CD O T - 0 0 • ^ CJ CD i n CO m £ • * • ' I - r^ -sf • i CD ^ ^ : cd ra i n - ^ > O
•<* CD CD CD CO 00 O CO
TO lO • * O 00 5 CD - . - T -
~
= D
5 a. -5 J •<- CM CO •<D-
• *
i n
^ T —
00
Osl CM CO i n
CM en CD
n
CO CO o j i n 00
CSI
CO CO
CO CD
•*
n
CD i n 00 CO 00
CD m CO
N . CD • " ^
^
.._ — 00
T—
cn
CSI in CD
csi
•* 00 CO
X3
CO CD
^ •<t cn
in in CD csi
i n • < ; 1 -CO
D
,_ o OO (6 cn
m CO CO csi
•St O CO
o
i n N . f--00 cn
cn ~
IV. i n CM
\—
o o o o q o O CD O O
i n i n CM T-•^ uli • ^ i n
i n
csi
cn CO i n T -
O)
CO 1
eg CO > - - ^ LJ
" CO 0
o c 0
' l -0 Q. X 0
• ^ — »
c cc 3
CO
2 'ro SZ h-o c 0
SZ 3 CC
c CC
o '.*-* CO
0 •«—• o 03 cc
SZ o 0 x: in *^
CO " D
-S <U
< ro
o 0
E 0 o o
ro ro 9- -C " ro i > 3. — d iS g o D
1 ' 2 0 J 1 -^ 3
U LL
41

Table 6. Factor analyses testing for characteristic of an authentic Thai restaurant
experience (n = 247).
Item
Thai style uniform 594
Thai style menu design by using Thai language.607
Traditional Thai greeting
Thai style tableware/silven^/are
Authentic Thai music
Real authentic Thai exterior design
Real authentic Thai interior design
Using authentic ingredients in dishes
Traditional hot and spicy tastes
Only Thais preparing food
Using Thai language for communication
Only Thais wait staff employees
Factor 1 = environmental concern
Factor 2 = food concern
Factor 3 = employees concern
.632
.677
.735
.828
.863
Factor 1 ^ Factor 2^ Factor 3^
.845
.852
.733
.806
.814
42

CHAPTER V
CONCLUSIONS
Findings
The findings of this research should be of interest to Thai restaurant
businesses. This study showed that the respondents eat out at Thai restaurants
more than 26 times per year. Most of the respondents also agreed that their
favorite cuisine is Thai. More than half of the study's respondents were male
(57.5%) with most of the respondents being with age range 21-30 years old
(25.5%). The findings in this research also indicate that White Americans
(76.1%) represent to majority of Thai restaurant customers.
A small percentage of subjects surveyed indicated they had never heard
of or tried Thai dishes. However, most of the subjects (99.2%) had heard of Thai
food while 98.4% of subjects had eaten Thai food. In addition, the majority of
those surveyed indicated that they have eaten at Thai restaurants.
One of the most interesting findings of this study indicate that most of the
subjects have incomes of or higher than $80,000 (35.9%) and have graduate
degrees (26.7%). These groups of customers are more open minded about
ethnic cuisines. They also have more disposable income to spend for
entertainment or for new experiences.
The result of this study finds that there are three groups of factors that
influence customer's preferences about Thai restaurant experiences. Those
43

three groups are designated as searching for authentic cuisine, practical concem
about authentic cuisines, and seeking novelty in authentic cuisines. From those
three groups, the highest mean score for these subjects fall into the group most
often searching for authentic cuisine. The indication is that this group is open to
experiencing authentic ethnic cuisines. The survey also pointed out that these
participants are likely to go for an authentic experience rather than select a
restaurant for conveniences.
Results of this project indicated that subjects have three concerns related
to the characteristic of an authentic Thai restaurant experience. These concerns
involved the environment, the cuisine, and the employees. Subjects tended to be
concerned primarily with the authenticity of Thai dishes that use authentic Thai
ingredients. For Thai cuisine, traditional hot and spicy tastes are important and
may help to attract customers who are looking for the authentic taste. However,
they seem to have the least interest with employees being dressed authenticity
or having other native characters.
The research indicated subjects are more concerned with the food being
authentic in flavor rather than the overall atmosphere being authentic.
Additionally where customers want to learn about different cultures, they go to
ethnic restaurants such as Thai for this experience. In conclusion, convenience,
service, price, employees, and authentic design of a restaurant are still
components that draw in customers into the restaurant however, the most
important component is still to meet with customer' s needs is the taste of
44

cuisine. In contrast, Castelo and Salay (2001) stated that price and convenience
are the major factors for customers to choose restaurants.
Implications
Implications of these findings can be derived from the consumer attitude
perspective and from the ethnic restaurant appeal segmentation perspective.
Due to the popularity of ethnic cuisine in the United States, this study will be
useful to increase current knowledge of customer's perceptions and expectations
while dining at ethnic restaurants.
The results of this study may be used in future research for the Hospitality
Industry. Also this study will be of value to restaurateurs, as they can use this
study to apply to their own establishment to meet customers' satisfactions. Each
ethnic cuisine may influence customer perceptions and expectations differently.
The U.S. consumer will always be looking for more restaurant experiences
through different ethnic cuisines. To appeal to these consumers, ethnic
restaurants will need to focus on the basics: good tasting food, service,
atmosphere, and convenience.
The possibilities for follow-up to this research seem unlimited. In the
future, additional research is needed to provide an even better understanding of
customer perceptions, expectations, acceptance and preferences of authentic
dining experiences. The future studies may expand this research by comparing
the results of surveys from each location. At each restaurant location, the future
45

research may compare each group of customers by income, age, education, and
gender. For future studies, more restaurants may be included to increase the
reliability of the research. These results along with the results from this study will
allow the foodservice industry to better serve consumers.
Limitations
The customers in different locations may have different attitudes.
Awareness and knowledge of ethnic cuisines of each customer may differ. This
may have caused diverse responses in the study.
The number of participants might not truly be representative of the
population of the United States. Demographic characteristic of subjects can
cause varying results due to location of restaurants in the selected areas.
This study surveyed at three different types of Thai restaurants, which are
full service, buffet, and fast food. It might be possible that this research could
cover other segments of customers, type of services and geographical locations.
Those customers may have diverse experiences and this may cause changes in
outcomes for the different types of restaurants.
46

REFERENCES
Castelo BranccN.S.D., & Salay, E. (2001). Attitude of consumers in relation to
PTSS, ° 3 ( U 57-6^""^'" '^"^^' ° ''° ^^ ^^"^''°' '' '•'- ^°°^ ^"^"^'°"
Friedlandm, A. ( 2002, October). Authentic Asian occasion: when it comes to developing successful Asian dishes or concepts today, authenticity and creativity are key ingredients. Food Management.
George, T R (2001). Dining Chinese: A Consumer Subgroup Comparison Journal of Restaurant & Food Setvice Marketing. 4(2), 67-86.
Gordon, E. (1991). Asian Update. Restaurants USA. 11(1), 40-42
Grameier J. (2003). Human Ecology News Restaurant Failure Rate Much Lower man Commonly Assumed, Study Finds. Retrieved Janaury 10 2004 from http://www.hec.ohio-.state.edu/news/research/restaurant failure rate htm
Green, S.B. & Salkind, N.J. (2003). Using spss for windows and macintosh-analyzing and understanding data (3''^ ed.). Upper Saddle River NJ-Prentice Hall.
The History of Thai Food. Retrieved October 23, 2004, from http://www.thaiarocer.com/aboutthaifood.html
Kalmar, M. (2001). Busy restaurants fine-tune their reservations policies. Retrieved April 10, 2004, from www.thebusinessledaer.com
Kruse, N. (2000, July 15). Get real. Restaurant Business, 99(14), 125.
Ladki, S.M. & Nomani, M.Z.A. (1996). Consumer involvement in restaurant selection: A measure of satisfaction/dissatisfaction (Part II). Journal of Nutrition in Recipe & Menu Development, 2 (1), 15-33.
Macey, D. (2001, January 15). Picking up sticks. Restaurant Business, 100 31-41.
MacLaurin, D.J. & MacLaurin, T.L. (2000). Customer Perceptions of Singapore's Theme Restaurants. Restaurant Management. 41(3). 75-85.
47

National Restaurant Association. (1995). Ethnic cuisines: A profile. Chicago IL-Creative & Response Research Services, Inc.
^^Ti"^9n^nf f ' ' " ^ l ^ T ' ' ^ * ' ^ " - ^^°°^^- /"^"^^^K/^eseaA-c/7. Retrieved January 11, 2004, from http://www.restaurant.orq/rPsparrh/ ^
Ohr, L. M. (2000, March). A melting pot for flavors. Prepared Foods, 60, 31-36.
^ ' ' m . ' r r ^ •' ^ l ' " ^ ^ ' '^•••^ ^ ^ ^ ^ " ' ' ^- (2000)- Social differentiation and the nwket for eating out in UK. International Journal of Hospitality. 19(2), 173-
Papjdopoulos, K 0 995, March). The dish on ethnic cuisine-it's hot. Restaurants
Riehle, H. (1989). The market for ethnic foods. Restaurants USA. 9(7), 43.
Robson. S. K. A (1999). Tuming the Tables: The Psychology of Design for High-
Io|3)'!'56 e s " " ' " ' ^°'""''''''" ' " ' ' ^^'''''^"' Administration Quartehy.
Sommerville, S^(1995, March). Attracting ethnic food dinner; as easy as one two, three. ResfawranteL/SyA. 15(3), 34-38.
Thom, B. (2003, April 21). If they think it's authentic, they will come but if it tastes great they'll return. Nation's Restaurant News. 61, 11-12.'
U.S^ Census Bureau 1990 (2003). 1990 US. Census Data. Retrieved January 11, 2004, from http://www.census.gov/main/www/cen1990.html
Wertsman, V.F. (1996). What's cooking in multicultural America: An annoted bibliographic guide to over four hundred ethnic cuisines. Lanham MD-Scarecrow Press, Inc.
Williams, F. (1992). Reasoning with statistics: How to read quantitative research. Forth Worth, TX: Harcourt Brace Jovanovich College Publishers.
48

APPENDIX A
TELEPHONE SOLICITATION
49

Date:.
Restaurant Name:
Restaurant Address:
Phone Number:
Hello,
May I speak to the restaurant manager?
My name is Piyavan Sukalakamala. I am a graduate student in
Restaurant, Hotel, and Institutional Management at Texas Tech University. I am
working on a thesis research of Customer Perceptions for Expectations and
Acceptance of an Authentic Dining Experience in Thai Restaurants with
Dr. Janice Boyce who is my chairperson. The purposes are to obtain information
about customer preferences, characteristics, and demographics.
Within two weeks, I will send you 50 questionnaires with self-address
stamped retum envelop. The questionnaires will be distributed to the customers
one table per one questionnaire. Their response is voluntary but very important
and will be kept confidential; only a code number is on the questionnaire. They
may refuse to answer any question and may withdraw at any time. The
questionnaire will ask general information, preferences, and characteristics about
dining experiences in Thai restaurants.
Thank you so much for your cooperation and support for this research
project.
50

APPENDIX B
SURVEY QUESTIONNAIRE
51

' ' ^
; < ^ y w
Customer perceptions for expectations and acceptance of an authentic dining
experience in Thai Restaurants
Code #:
A survey of "Customer Perceptions for expectations and acceptance of an authentic dining experience in Thai Restaurants" is being conducted as a partial requirement for a Master's Thesis in the Restaurant/ Hotel Institutional Management Program of Texas Tech University. The purpose of this study is to obtain information about customer perceptions of an authentic ethnic dining experience. Your responses and participation are very important and is entirely voluntary, if you are willing to participate, fill out the enclosed questionnaire and return it to the researcher. All responses to these questions will be kept confidential. You may refuse to answer any question and withdraw without penalty. Thank you.
Please complete and return this survey to: Piyavan Sukalakamala
Dr. Janice Boyce
College of Human Science 60x41162
Texas Tech University Lubbock, TX 79409-1162
M
• ^ ^
52

Customer Perceptions Survey
1. Are you responsible for the dec islon to eat out for the household? D Yes D No
2. What is your favorite cuisine? (Select the only one that applied)
• American • Chinese • Italian • Mclean DThai • Other (specify,-
a Italian D Mexican DThai D Other (specify): _ 4. Have you heard about Thai food?
D Yes D No
5. Have you eaten Thai food? • Yes a No
6. Have you eaten out at Thai restaurants? D Yes a No
If you answered YES to question 6. please respond to question ;
7. How often do you eat out at Thai restaurants? times/ 12 months
the statement cJescriberju v e V w e r a n T " m e S e sta ^ ^ ^ f *"" ' '= ' ' " " " ' " ^ ^'^^^^ " ^ ° " " ' ' ' " ' number for each) ^ '"^^ statement does not descnbe you at all. (Please write in ONE
Does Not ' Describe Me r
At All ^ Describes Me ^ i 2 -^ A ^ r, Very Well
^ ^ 3 4 5 6 7 8 9 To
5
1.1 am constantly looking for new tastes and cuisines to try ^^" '^ '"> 2. Going to an ethnic restaurant is a great way to leam about a "different culture 3. usually wait to try a new cuisine until after I have heard something good about it
^nm!!^ A f l\ ,^" ^ ""T" "."'y ^^^^ ^ ^°'^'9" "^ '"^ wi'hout explaining the ingredients/preparation Sometimes I feel uncomfortable when using different eating utensils like chopsftek in a r e s K
6. feel more comfortable dining out on blended cuisine like Asian Fusion than authertic cuisine 7. enjoy ethnic restaurants partly because I can eat somewhat inexpensively 8. get food from ethnic restaurants more for convenience than for an "authentic experience" 9.1 want to expenence authentic ethnic cuisines 10.1 like to go to restaurants where natives of that cuisine eat 11.1 often find it Intimidating to order food in an ethnic restaurant.. 12. A restaurant's atmosphere isn't important as much as food quality. 13. Flavor for cuisine is more important to me rather than authentic co cooking..
53
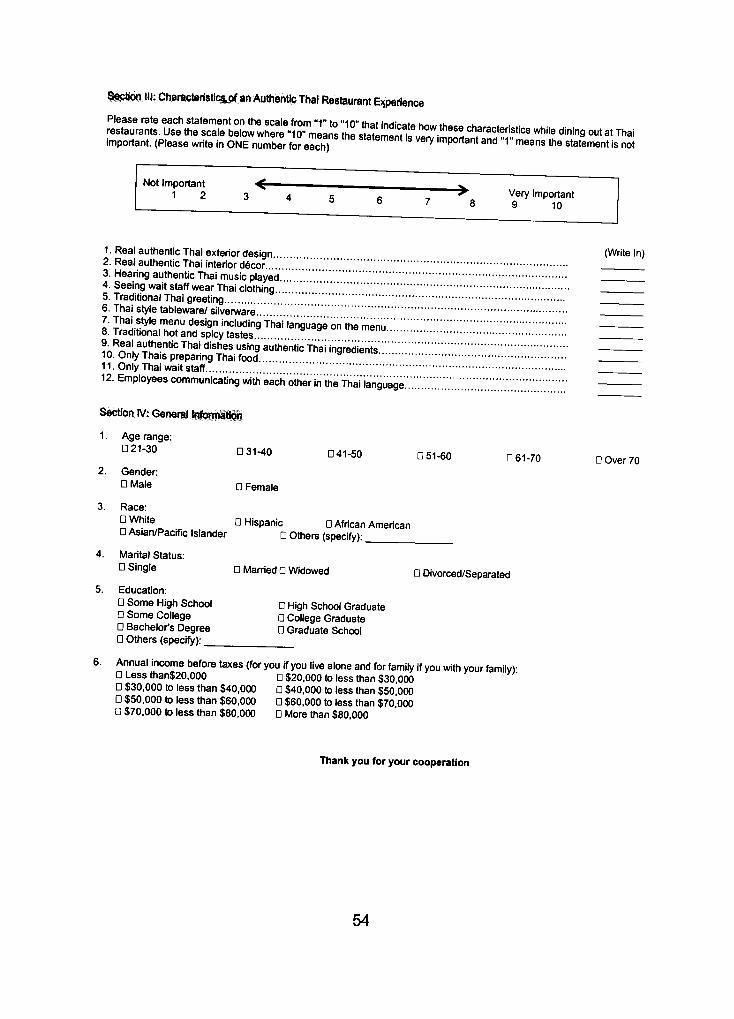
iic«Ofi HI; Cliareicteristlc&pfatt Aufhonttc Thai Restaurant &{perien<»
Please rate each statement on the scale from " 1 " to "10" that Indicate hnw tho«» ^h , . • .• restaurants. Use the scale below where "10" means the statement llvPrTimn^^ f '^^' l",?"os while dining out at Thai important. (Please write in ONE number for each) ^ '^ '^ " '«"* '^ very Important and " 1 " means the statement is not
Not Important 1 2
1. Real authentic Thai exterior design (Write In) 2. Real authentic Thai interior d6cor 3. Hearing authentic Thai music played 4. Seeing wait staff wear Thai clothing 5. Traditional Thai greeting 6. Thai style tableware/silverware. 8 ^ i J l t i T ? " ''r'^" '"'='""'"9 Thai language on the'menu;.:.:; 8. TracJitional hot and spicy tastes g^Real authentic Thai dishes using authentic Thai ingredients 10. Only Thais preparing Thai food 11. Only Thai wait staff 12. Employees communicating with each other in "the Thai ianguage.'.
Section IV; Genei5ai| i i w i H i B
1 • Age range:
°''-'° °^^-^° °^1-5° 051-60 •61-70 •Over70 2. Gender:
° Male n Female
3. Race:
° ^ ' ' ® D Hispanic a African American D Asian/Pacific Islander n others (specify):
4. Marital Status:
° Single D Married 0 Widowed D Divorced/Separated
5. Education: • Some High School n High School Graduate D Some College Q College Graduate D Bachelor's Degree Q Graduate School • Others (specify):
6. Annual income before taxes (for you if you live alone and for femily If you with your familv)' • Less than$20.000 a $20,000 to less than $30,000 • $30,000 to less than $40,000 D $40,000 to less than $50,000 D $50,000 to less than $60,000 D $60,000 to less than $70,000 D $70,000 to less than $80,000 D More than $80,000
Thank you for your cooperation
54
PERMISSION TO COPY
In presenting this thesis in partial fulfillment of the requirements for a master's
degree at Texas Tech University or Texas Tech University Health Sciences Center, I
agree that the Library and my major department shall make it freely available for
research purposes. Permission to copy this thesis for scholarly purposes may be
granted by the Director of the Library or my major professor. It is understood that any
copying or publication of this thesis for financial gain shall not be allowed without my
fnrther written permission and that any user may be liable for copyright infringement.
Agree (Permission is granted.)
Student Signature ^ate^
Disagree (Permission is not granted.)
Student Signature ~Date"