Embed Size (px)
Citation preview

2011 OWEA Wet Weather Issues Webinar Series
Curtis D. Courter, P.E.

Webinar Topics
Background
Treatment Alternatives
Solids and Floatables Control
Disinfection Alternatives
Clarification
○ EHRT
○ HRPCT
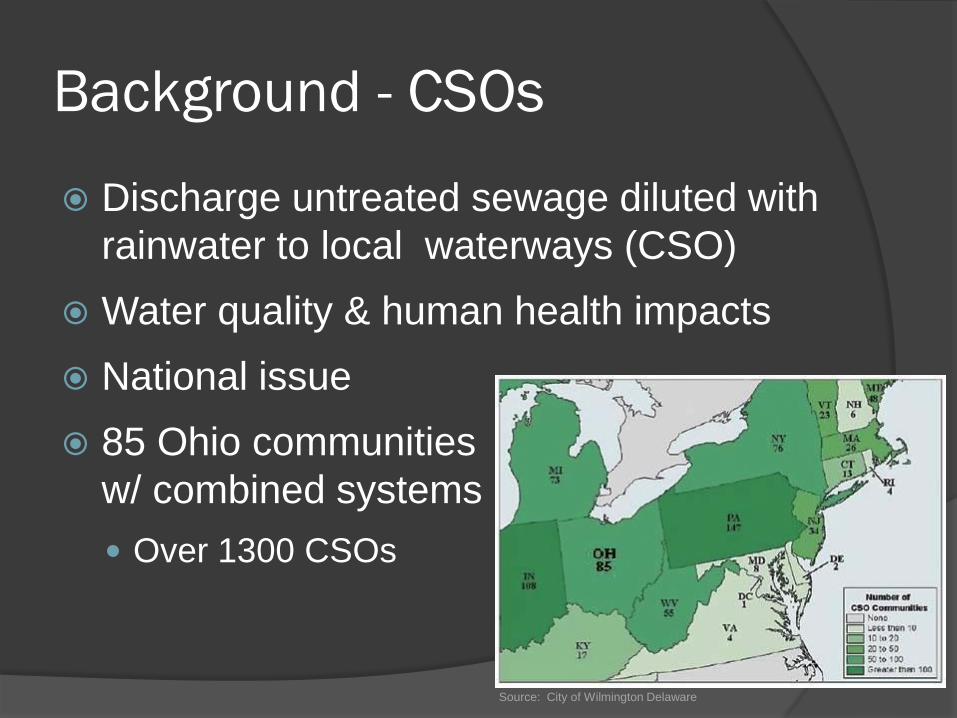
Background - CSOs
Discharge untreated sewage diluted with
rainwater to local waterways (CSO)
Water quality & human health impacts
National issue
85 Ohio communities
w/ combined systems
Over 1300 CSOs
Source: City of Wilmington Delaware

Background – Water Quality
0
20
40
60
80
100
120
140
160
Str
ea
m/R
ive
r M
ile
s (
10
00
s)
Source: iaspub.epa.gov

Background - Regulatory
CSO Control Policy
Clear levels of control
Flexibility
Phased implementation
Review and revision WQS
Nine Minimum Controls
NPDES Permits
Consent Judgments

Webinar Topics
Background
Treatment Alternatives
Solids and Floatables Control
Disinfection Alternatives
Clarification
○ EHRT
○ HRPCT

Why Solids and Floatables
Control? Nine Minimum Controls
Control of solids & floatables materials in CSOs (NMC 6)
Pollution prevention to reduce contaminants in CSOs (NMC 7)
Narrative Water Quality Standards
Waters shall be free from floating materials entering as result of human activity in amounts to be unsightly or cause degradation – OAC 3745-1-04B
Pollution Discharge Elimination Permits
None as a result of discharge in unnatural quantities injurious to designated use - MI0022802
Consent Orders
Engineering study of past , current and future measures to control solids and floatables materials – Cincinnati MSD
Assess construction of facilities for removing floatables from CSOs as an element of LTCP – Toledo

Solids and Floatables Controls
Source controls
In-System controls
End-of-Pipe controls

Source Controls
Pollution prevention

Source Controls
Catch basin modifications
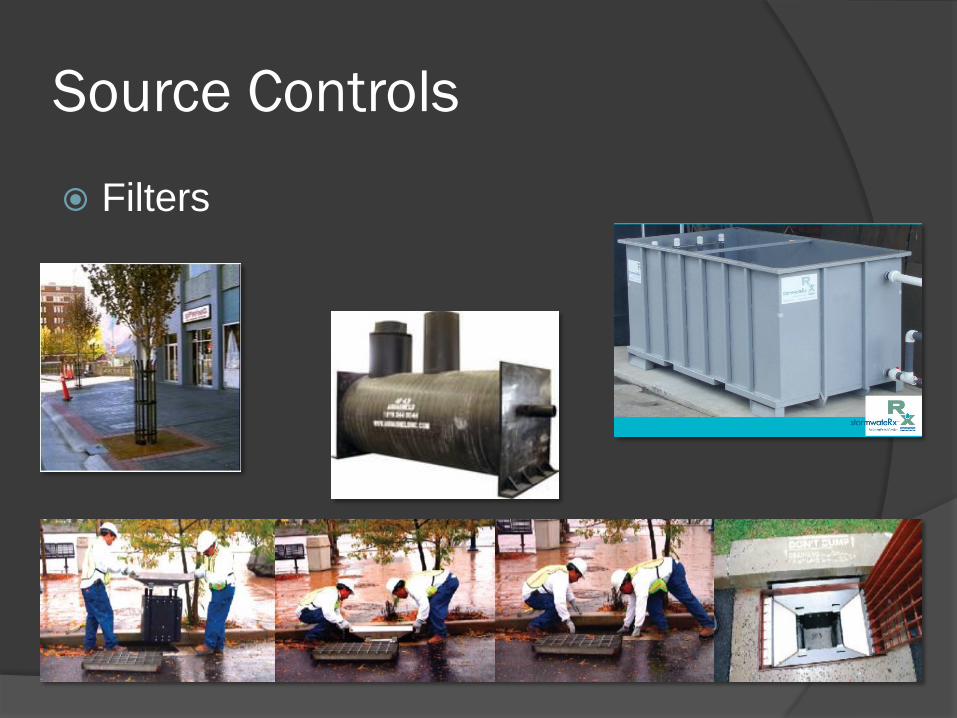
Source Controls
Filters
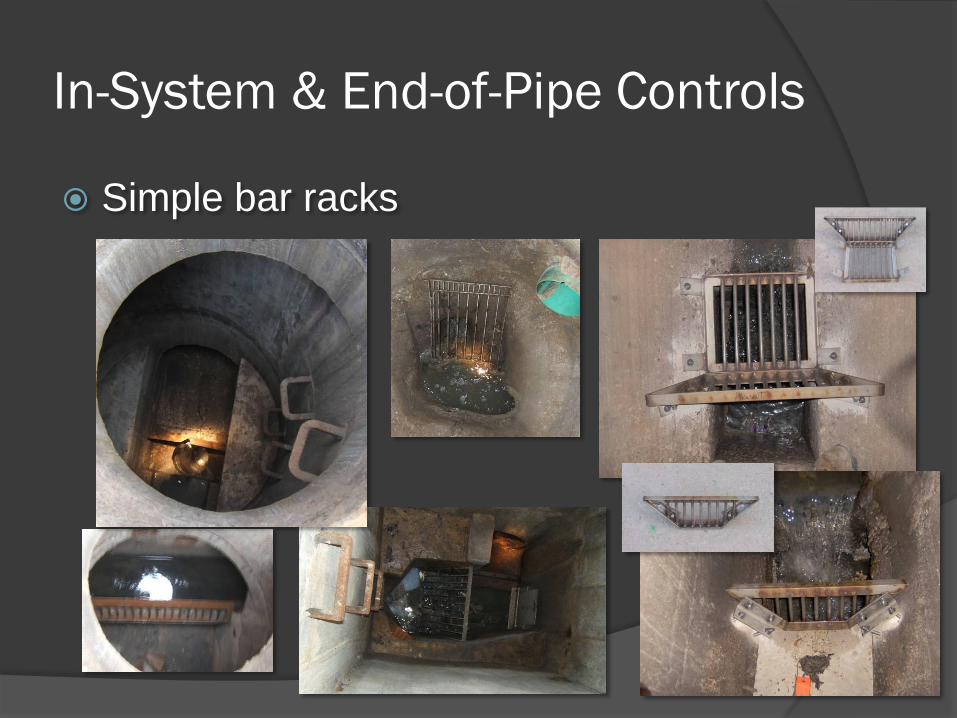
In-System & End-of-Pipe Controls
Simple bar racks

In-System & End-of-Pipe Controls
Static baffles

In-System & End-of-Pipe Controls
Dynamic baffles

In-System & End-of-Pipe Controls
Mechanically cleaned screens

In-System & End-of-Pipe Controls
Proprietary controls
Hydrodynamic separators
Nutrient Separating Baffle Box
Others

End-of-Pipe Controls
Nets
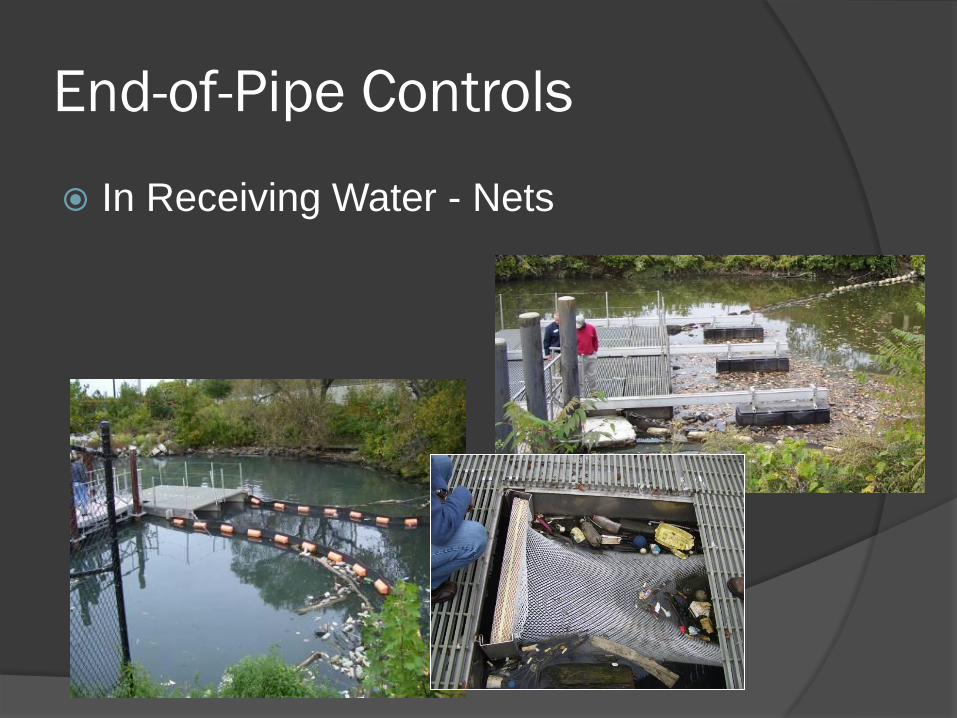
End-of-Pipe Controls
In Receiving Water - Nets

End-of-Pipe Controls
In Receiving Water - Booms

Case Study - Sanitation District
No. 1
SD1 Program Options
Regulatory:
○ S&F Controls everywhere
Other Communities:
○ Pilot engineered controls
Hybrid:
○ Simple S&F w/ engineered controls
Pilot program developed
Hydraulic criteria, controls, inspection forms
Cincinnati

Simple S&F Controls – Bar Racks
& Baffles
Dry Weather Flow
Sump Outfall
Pleasant Street
4th Street Baffle
Weir
Outfall

Simple S&F Controls – Net Bags
Net Bags
Elevated Outfall Pipe

Engineered S&F Control
Baffle
Outfall
NSBB
Screen
Sediment Sumps
Sewer

Select Observations – Bar Racks
Natural Debris
Influent Outfall
Blocking
Rack Overtopping
Influent
Outfall
Blocking Tie-off
Overtopping ~ 6 month storm event

Select Observations – Baffles
Baffle
Outfall Influent
Baffle Overtopping
Outfall
Blocking Tie-off
Influent
Overtopping ~ 6 month storm event
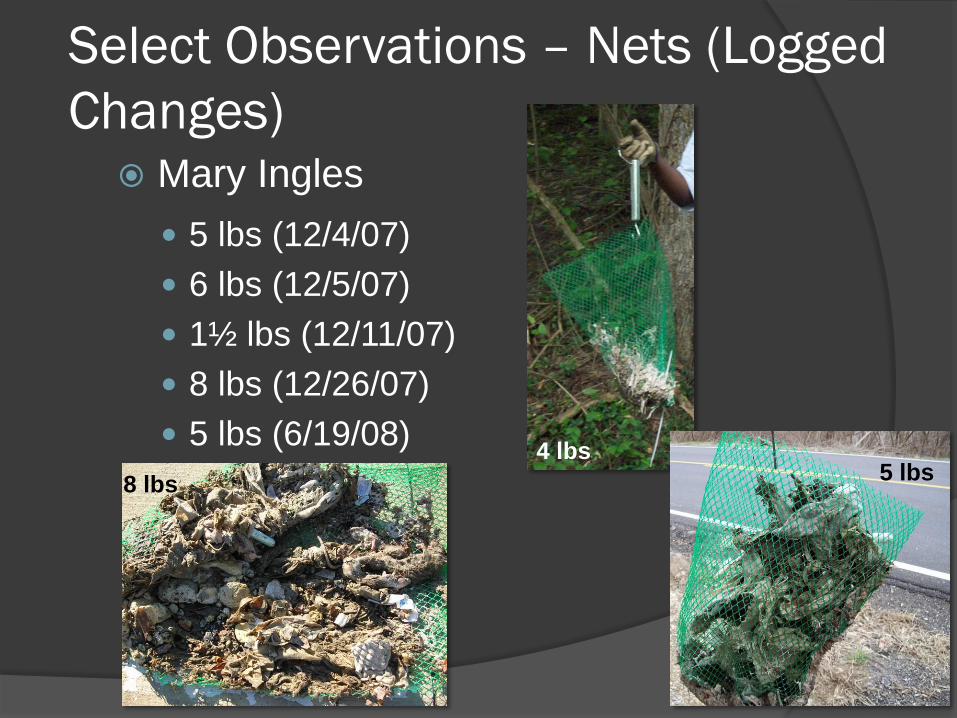
Select Observations – Nets (Logged
Changes) Mary Ingles
5 lbs (12/4/07)
6 lbs (12/5/07)
1½ lbs (12/11/07)
8 lbs (12/26/07)
5 lbs (6/19/08) 4 lbs
5 lbs 8 lbs
Pilot S&F Control Pilot Program
Summary of findings:
Bar racks ineffective due to blinding and height
limitations due to hydraulic restrictions
Weirs and baffles marginally effective – need good
hydraulics at CSO diversion (check velocity under
baffle)
Nets on elevated overflow outfall pipes highly
effective as long as velocities are not too high
(damage nets)

Final S&F Control Program
Install simple controls (weirs/baffles and nets) where configuration and hydraulics allow and effectiveness anticipated
Engineered control locations would be through watershed planning
Source controls – public education, street cleaning, catch basin modifications & cleaning, grit pits, regulate construction site runoff

Webinar Topics
Background
Treatment Alternatives
Solids and Floatables Control
Disinfection Alternatives
Clarification
○ EHRT
○ HRPCT

Effect on Cl2 Dose in Regression Models
0
1
2
3
4
5
1 10 100 1,000 10,000 100,000 1,000,000
GT
Lo
g F
. C
oli
. R
ed
uct
ion
4 mg/l - Cl2
8 mg/l - Cl2
10 mg/l - Cl2
20 mg/l - Cl2 Spring
Crk. (1997)
6 mg/l - Cl2
D.T. = 4 minutes
TKN = 3.6 mg/l
BOD = 31.5 mg/l
Source: Combined Sewer Overflow Abatement Program, Rochester, NY Volume II.
Pilot Plant Evaluations (EPA 600/2-79-031b)
High Rate Disinfection
Application of disinfectants using high-rate
mixing as a substitute for contact time
Kill = C x G x T
Where: T ≤ 5 minutes
Applies to chemical
disinfectants

Disinfection Methods
Ozone
Chlorine Dioxide
Gaseous Chlorine
Calcium Hypochlorite
UV
Sodium Hypochlorite
Peracetic Acid
BCDMH (bromine)

Disinfection Methods
Ultra Violet (UV)
Physical disinfectant
Common Elements
Pretreatment
Power center
Lamps
Ballast
Cleaning System
Gates (level control & Isolation)
Instrumentation (transmittance, etc.)
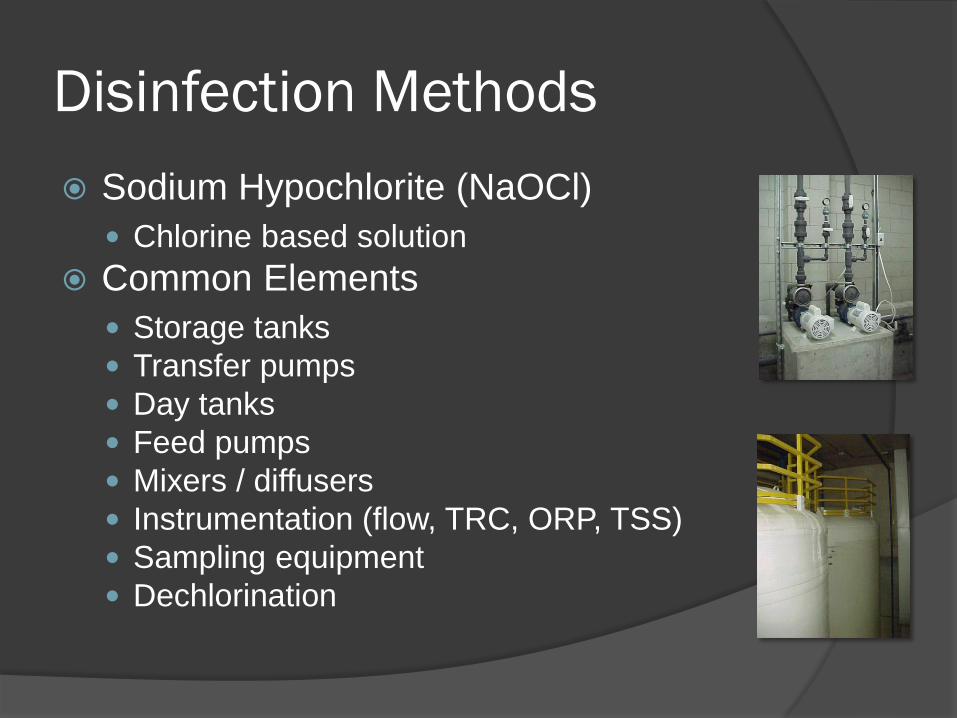
Disinfection Methods
Sodium Hypochlorite (NaOCl)
Chlorine based solution
Common Elements
Storage tanks
Transfer pumps
Day tanks
Feed pumps
Mixers / diffusers
Instrumentation (flow, TRC, ORP, TSS)
Sampling equipment
Dechlorination

Disinfection Methods
Peracetic Acid (PAA)
Acetic Acid and Hydrogen Peroxide solution
Common Elements
275 gallon totes or 55 gallon drums
Feed pumps
Mixers / diffusers
Instrumentation (flow, TSS)
Sampling equipment
Pressure relief
Heat monitoring

Disinfection Methods
Bromochlorodimethylhydantoin (BCDMH)
Bromine based powder
Common Elements
BCDMH Unit ○ Storage hopper
○ Feed equipment
○ Dissolution equipment
Feed pumps
Mixers / diffusers
Instrumentation (flow, TSS)
Sampling equipment Courtesy of City of Akron
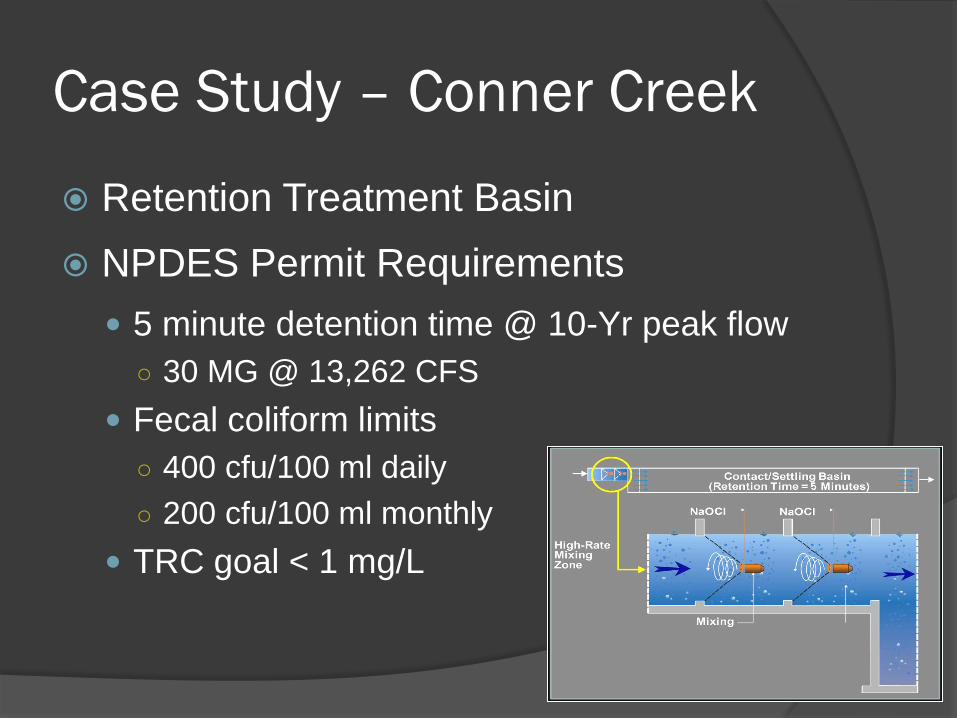
Case Study – Conner Creek
Retention Treatment Basin
NPDES Permit Requirements
5 minute detention time @ 10-Yr peak flow
○ 30 MG @ 13,262 CFS
Fecal coliform limits
○ 400 cfu/100 ml daily
○ 200 cfu/100 ml monthly
TRC goal < 1 mg/L

Disinfection System Studies
Disinfection Pilot Study
Mixer Modeling
NaOCl
Degradation
Study
NaOCl Feed System
Control Study

Disinfection Pilot Study
Objectives
Determine dose vs. kill relationship
Determine effect of mixing technology on kill
Disinfectant
Sodium hypochlorite
Technologies Tested
Vertical shaft
Pumped diffusion
High speed submersible induction
G ~ 500 sec-1

Disinfection Pilot Study
Conclusions
Mixing technology:
○ Mixers are equivalent for equivalent G
○ Rapid and thorough mixing is critical
CxT = 125
○ ≥ 4 log fecal coliform reduction
○ ≤ 400 cfu/100 ml
Submersible induction mixers selected

Mixer Modeling
High speed submersible mixers
Between 4 and 8 mixers required per channel
Objectives
Determine the number of mixers
3 Mixers Tested
2 Manufacturers, vacuum and non-vacuum styles
Rhodamine WT tracer

Mixer Modeling
Conte Anadromous Fish Research Center
Testing
Channel

Mixer Modeling Sampling Station 1
10 Feet Downstream of
Mixer
Sampling Station 2
58 Feet Downstream of
Mixer Sample
Pumps
Sampling
Grid

Mixer Modeling
0.25 Normalized Cl2 Contours
Measured 10 Feet Downstream
of Mixer At 3.2 FPS
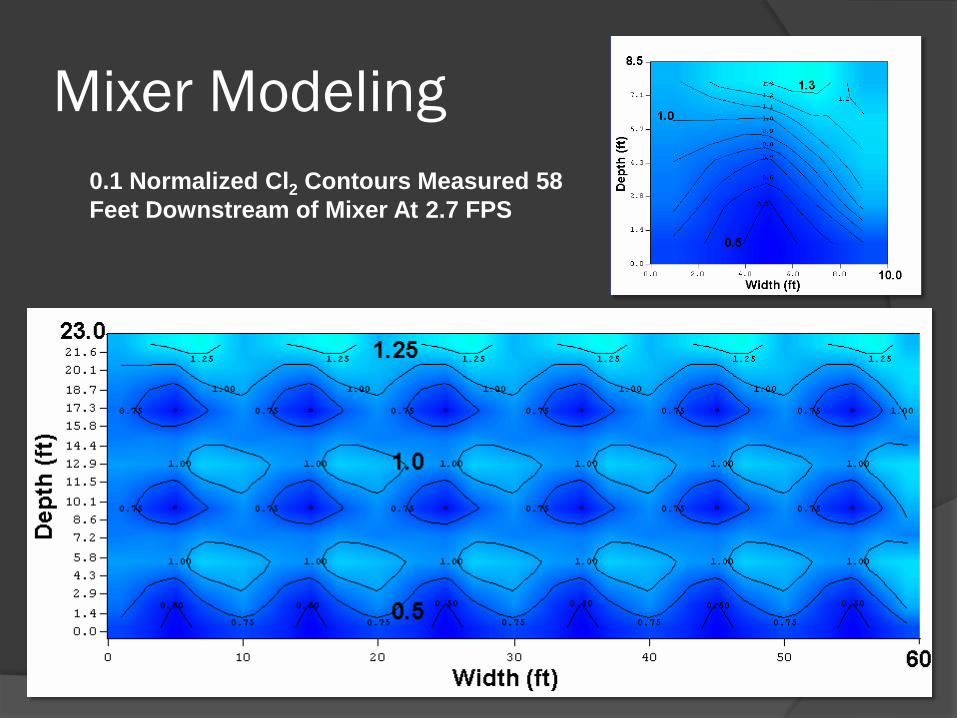
Mixer Modeling
0.1 Normalized Cl2 Contours Measured 58
Feet Downstream of Mixer At 2.7 FPS
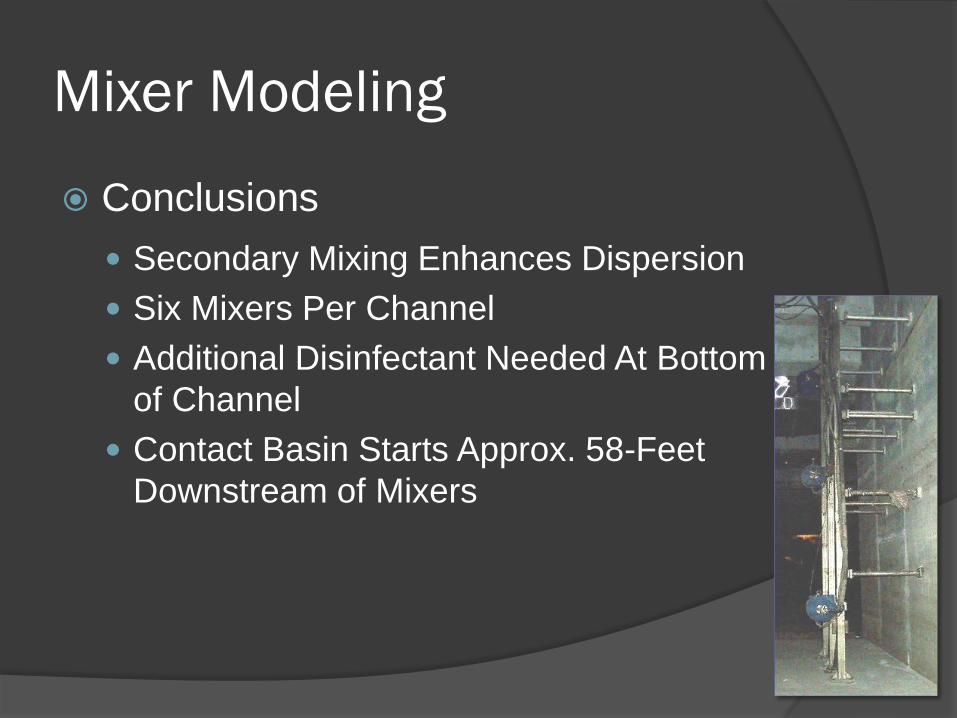
Mixer Modeling
Conclusions
Secondary Mixing Enhances Dispersion
Six Mixers Per Channel
Additional Disinfectant Needed At Bottom
of Channel
Contact Basin Starts Approx. 58-Feet
Downstream of Mixers

Operational Observations From 2-
Year Intensive Monitoring*
46 activations & 25 discharge events
Captured 2.5 billion gallons and
discharged another 2.9 billion gallons of
treated effluent
Max effluent flow ~2,600 cfs (T~25 min.)
Over 13-1/2 days of overflow
Recently had an event lasting 8 days
*DWSD 2008, Conner Creek CSO Basin Evaluation, October 24, 2008.

Webinar Topics
Background
Treatment Alternatives
Solids and Floatables Control
Disinfection Alternatives
Clarification
○ EHRT
○ HRPCT

High Rate Clarification
Alternatives
Chemical (non-proprietary)
CEPT
EHRT
Physical-Chemical (proprietary)
CoMag / BioMag
Densadeg
Actiflo / Bio-Actiflo
Windsor Ontario EHRT Pilot Plant

Chemically Enhanced
Clarification CEPT / EHRT
Addition of coagulant and polymer
Aggregates particles (flocculation)
Common Elements
Screens
Grit chamber
Settling tank
Chemical feed system
Mixers
Baffles
Instrumentation, pumps, piping, etc.

Physical-Chemical Clarification
Densadeg
Degremont Technologies
Recycled sludge ballast
Polymer
Common Elements
Screens
Reactor
Rapid Mixer
Lamella tubes
Instrumentation, pumps, piping, etc.
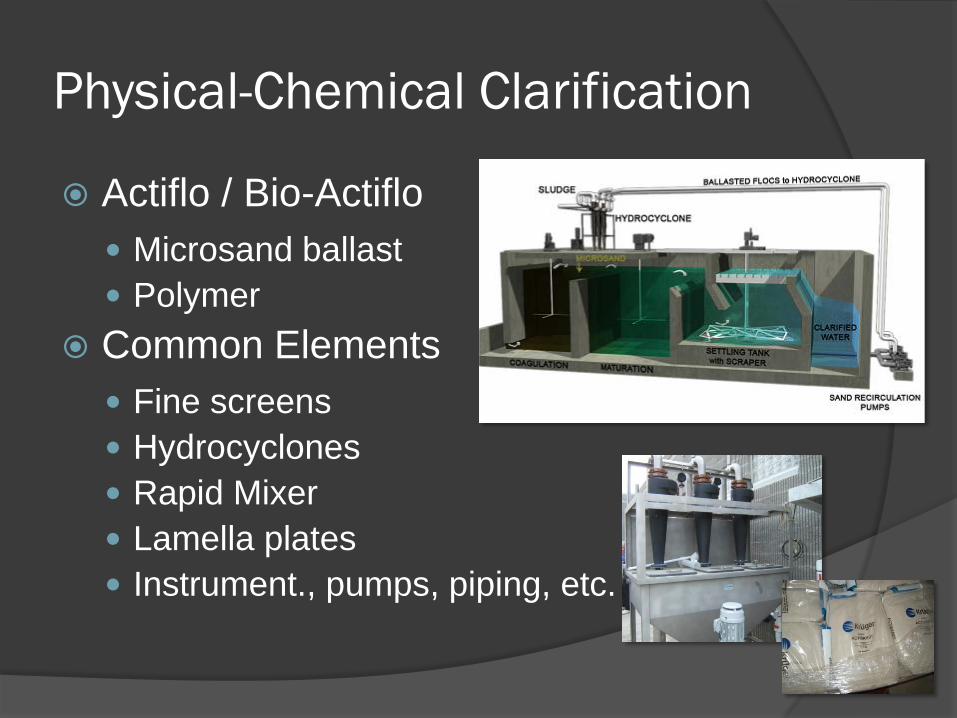
Physical-Chemical Clarification
Actiflo / Bio-Actiflo
Microsand ballast
Polymer
Common Elements
Fine screens
Hydrocyclones
Rapid Mixer
Lamella plates
Instrument., pumps, piping, etc.

Physical-Chemical Clarification
CoMag / BioMag
Cambridge Water Tech.
Magnetite ballast
Polymer
Common Elements
Feeder / hopper
Mix tank
Mixers
Shear mill and magnetic separator
Ballast make up
Instrumentation, pumps, piping, etc.

Case Study – NYCDEP Jamaica
Tribs CSO Project
NYC Actiflo & Densadeg side-by-side
pilot
Unit No. of
Runs
Flow
(mgd)
HRT
(min)
FeCl3
(mg/L)
Polymer
(mg/L)
SOR (1000s -
gpd/ft2)
Startup
Time (min)
Densadeg 17 0.2-0.5 12-33 50-70 1.4-1.8 29-65 30-60
Actiflo 15 0.3-0.8 5-11 60-100 0.45-1.0 72-130 5-10
Unit Waste
Sludge
TSS (%)
Influent
TSS
(mg/L)
Effluent
TSS
(mg/L)
TSS
Removal
(%)
Influent
BOD5
(mg/L)
Effluent
BOD5
(mg/L)
BOD5
removal
(%)
Densadeg 1-10% 83 25 69% 151 63 58%
Actiflo 0.1-0.3% 106 16 84% 119 51 57%

Questions?
Thank You Curtis D. Courter, P.E.
Hazen and Sawyer, P.C.
www.hazenandsawyer.com
(513) 469-5115 – Office
(513) 833-5125 - Mobile


![CONSTRUCTION EQUIPMENTS 8 Small … CONSTRUCTION EQUIPMENTS SR NO PRODUCT NAME CONCRETE MIXERS 1 [CM-1] FULL BAG CONCRETE MIXER WITH MECHANICAL HOPPER MOUNTED ON [500 –19] TYRES](https://img.dokumen.tips/doc/110x75/5c0d68d209d3f22d558b4a85/construction-equipments-8-small-construction-equipments-sr-no-product-name-concrete.jpg)