Embed Size (px)
Citation preview

#NICForum18
Current Market Conditions Impacting Senior Care
Friday, March 9, 201810:30 AM – 11:45 AM
Dallas Ballroom G

#NICForum18
Today’s Presentation
• The ULI/PwC Survey Results: Seniors Housing Is Attractive
• Demographic Trends: Yet, Another Slice
• The Economy: Rising Wage Rates, Rising Interest Rates
• Seniors Housing and Care Transactions: Relatively Robust
• Seniors Housing Market Fundamentals: Occupancy Flat
• Skilled Nursing Market Fundamentals: Falling Occupancy Rates

#NICForum18
Audience Polling Question #1Please Identify Your Professional Category:
1. SH Operator/Provider2. SNF Operator/Provider3. Both SH and SNF Operator/Provider4. Non-Real Estate-Based Care or Service Provider 5. Health System or Insurer6. Public or Private Equity Investor7. Debt Lender

#NICForum18
The ULI/PwC Survey Results:Seniors Housing is Attractive

#NICForum18
Seniors Housing As An Investment Opportunity
“Since this (seniors housing) has been considered a
specialized investment segment, many are not aware
of the rising liquidity (more than $14 billion in
transactions in the year ending second-quarter 2017)
and returns outpacing the NCREIF NPI benchmark by
400 basis points. Housing for seniors topped the list
of all residential segments in this year’s survey in
terms of its development and investment prospects
for 2018.”Source: Emerging Trends in Real Estate 2018, A Publication from Urban Land Institute and
PwC, published October 2017

#NICForum18
ULI Emerging Trends 2018
Key Takeaways Regarding Seniors Housing:• Seniors housing ranks third among 24 commercial/multifamily subsectors in 2018 for
best investment prospects and development prospects, behind fulfillment and warehouse
• Seniors housing ranks first among seven residential property types in 2018 for best investment prospects and development prospects.
Source: Emerging Trends in Real Estate 2018, A Publication from Urban Land Institute and PwC, published October 2017

#NICForum18
Investor Preference for Buying and Holding Seniors Housing
0
10
20
30
40
50
60
Buy Hold SellSeniors housing Moderate-income apartments Affordable apartments
Student housing Single-family rental High-income apartments
Buy/Hold/Sell Recommendations
Source: Emerging Trends in Real Estate 2018, A Publication from Urban Land Institute and PwC, published October 2017

#NICForum18
Seniors Housing Investment Returns Are Relatively StrongNCREIF Annualized Total Returns by Property TypePeriod Ending 12/31/17
Source: NCREIF
0
2
4
6
8
10
12
14
16
18
One Year Three Years Five Years Ten YearsNPI Apartment Hotel Industrial Office Retail Seniors Housing

#NICForum18
Demographic Trends:Yet, Another Slice
#NICForum18
Demographics Are Destiny
Source: Cartoon Bank

#NICForum18
Near and Long-term Demographics Are Getting Better
0
500
1,000
1,500
2,000
2,500
3,000
3,500
4,000
4,500
5,00019
0919
1119
1319
1519
1719
1919
2119
2319
2519
2719
2919
3119
3319
3519
3719
3919
4119
4319
4519
4719
4919
5119
5319
5519
5719
5919
6119
6319
6519
6719
6919
7119
7319
7519
7719
7919
8119
8319
8519
8719
8919
9119
9319
9519
9719
9920
0120
0320
0520
0720
0920
1120
13
Today’s 82-Year Old Resident Was Born in 1936
Greatest Generation55 Million
Silent Generation47 Million Generation X
55 MillionMillennials66 Million
Post Millennials65 Million
And Is Of The Silent Generation
Baby Boomers76 Million
Source: U.S. Census

#NICForum18
Population Pyramid for the U.S
Age and Sex Structure of the U.S.2012, 2030, 2060
Source: CDC—National Center for Health Statistics

#NICForum18
Significantly More 80-Plus Women than Men
0.0%
2.0%
4.0%
6.0%
8.0%
10.0%
12.0%
-
5
10
15
20
2520
1420
1520
1620
1720
1820
1920
2020
2120
2220
2320
2420
2520
2620
2720
2820
2920
3020
3120
3220
3320
3420
3520
3620
3720
3820
3920
4020
4120
4220
4320
4420
4520
4620
4720
4820
4920
5020
5120
5220
5320
5420
5520
5620
5720
5820
5920
60
Shar
e of
Tot
al P
opul
atio
n
Num
ber o
f 80-
Plus
Indi
vidu
als,
Milli
ons
Men Women Women Men
Number of 80-Plus Persons and Share of Total Population
Source: U.S. Census Bureau

#NICForum18
Growth in Older Men Exceeds Women in the Near Term
-
100,000
200,000
300,000
400,000
500,000
600,000
700,000
0.0%
1.0%
2.0%
3.0%
4.0%
5.0%
6.0%
7.0%
8.0%
2015 2016 2017 2018 2019 2020 2021 2022 2023 2024 2025 2026 2027 2028 2029 2030
Men Women men Women
Growth between 2018 and 2021:410,000 more 80-Plus Men375,000 More 80-Plus Women
Growth in 80-Plus Population2015 - 2030
Source: U.S. Census

#NICForum18
Life Expectancy Has Been Increasing
0
10
20
30
40
50
60
70
80
90
1900 1940 1950 1960 1970 1975 1980 1985 1990 1995 2000 2005 2015
U.S. Life Expectancy At Birth (Years)
Source: CDC—National Center for Health Statistics

#NICForum18
Growing Burden on Working Age Population
0
0.1
0.2
0.3
0.4
0.5
0.6
0.7
0.8
0.9
2014
2015
2016
2017
2018
2019
2020
2021
2022
2023
2024
2025
2026
2027
2028
2029
2030
2031
2032
2033
2034
2035
2036
2037
2038
2039
2040
2041
2042
2043
2044
2045
2046
2047
2048
2049
2050
2051
2052
2053
2054
2055
2056
2057
2058
2059
2060
Under 18 Over 65 Total Dependents
Dependency Ratio—Share of Over 65 and Under 18 to Working Population2014 - 2060
Source: U.S. Census

#NICForum18
The Economy: Rising Wage Rates, Rising
Interest Rates

#NICForum18
Strong Labor Demand
Source: Bureau of Labor Statistics
0
1,000
2,000
3,000
4,000
5,000
6,000
7,000
Jan-13 Apr-13
Jul-13 Oct-13
Jan-14 Apr-14
Jul-14 Oct-14
Jan-15 Apr-15
Jul-15 Oct-15
Jan-16 Apr-16
Jul-16 Oct-16
Jan-17 Apr-17
Jul-17 Oct-17
Job Openings Quits Hires
JOLTS Data: U.S. Job Openings, Quits and Hires (000s)January 2013 – December 2017

#NICForum18
Getting Closer to Record Low Jobless Rates…U.S. Unemployment Rate (%)Q1 1948 – Q4 2017
0.0
2.0
4.0
6.0
8.0
10.0
12.019
48Q
119
49Q
419
51Q
319
53Q
219
55Q
119
56Q
419
58Q
319
60Q
219
62Q
119
63Q
419
65Q
319
67Q
219
69Q
119
70Q
419
72Q
319
74Q
219
76Q
119
77Q
419
79Q
319
81Q
219
83Q
119
84Q
419
86Q
319
88Q
219
90Q
119
91Q
419
93Q
319
95Q
219
97Q
119
98Q
420
00Q
320
02Q
220
04Q
120
05Q
420
07Q
320
09Q
220
11Q
120
12Q
420
14Q
320
16Q
2
Q2 1953: 2.6%Q4 2017: 4.1%Q1 1969: 3.4%
Q4 2000: 3.9%

#NICForum18
…And Some Labor Markets Are Even Tighter
1.8 2.4 2.7 2.7 2.7 2.8 2.94.1 4.1
11.8
0
2
4
6
8
10
12
14
Portland, ME Nashville Milwaukee Austin San Francisco Boston Denver Atlanta Seattle Ocean City,NJ
Metropolitan Area Unemployment Rates (%), Low to HighDecember 2017
Source: U.S. Department of Labor

#NICForum18
Audience Polling Question #2
Will the National Unemployment Rate:
1. Remain Near Today’s Rate of 4.1%2. Bottom Out at 3.5%3. Hit A New Low Below 2.6%

#NICForum18
Mounting Wage Pressures?Average Hourly Earnings (Percent Change from Year Ago)January 2015 – December 2017
0.0%
1.0%
2.0%
3.0%
4.0%
5.0%
6.0%
7.0%
All Sectors SNF Assisted Living
Source: Moody’s Analytics, U.S. Department of Labor

#NICForum18
Wage Growth Is Exceeding Rent Growth
-2%
-1%
0%
1%
2%
3%
4%
5%
6%
2007 2008 2009 2010 2011 2012 2013 2014 2015 2016 2017
Annual Asking Rent Growth / Avg. Hourly Earnings*Primary Markets | 4Q06 – 4Q17
Assisted Living EmployeesAsking Rent - Assisted LivingAsking Rent - Independent Living
Source: NIC MAP® Data Service

#NICForum18
The New NIC MAP ® Bureau of Labor Statistics Employment and Wage Date Report

#NICForum18
Comparative Labor Market Conditions
Source: U.S. Bureau of Labor Statistics

#NICForum18
Consumer Confidence Is Strong
Source: The Conference Board
0.00
20.00
40.00
60.00
80.00
100.00
120.00
140.00
160.00
Jan-
90O
ct-9
0Ju
l-91
Apr-
92Ja
n-93
Oct
-93
Jul-9
4Ap
r-95
Jan-
96O
ct-9
6Ju
l-97
Apr-
98Ja
n-99
Oct
-99
Jul-0
0Ap
r-01
Jan-
02O
ct-0
2Ju
l-03
Apr-
04Ja
n-05
Oct
-05
Jul-0
6Ap
r-07
Jan-
08O
ct-0
8Ju
l-09
Apr-
10Ja
n-11
Oct
-11
Jul-1
2Ap
r-13
Jan-
14O
ct-1
4Ju
l-15
Apr-
16Ja
n-17
Oct
-17
U.S. Consumer Confidence (Index 1985 = 100, SA)January 1990 – January 2018

#NICForum18
Home Prices Have More Than Fully Recovered
Source: National Association of Realtors
U.S. Median Sales Price Existing Single-Family Homes, (Thousands of Dollars, SA)January 1990 – January 2018
0.0
50.0
100.0
150.0
200.0
250.0
300.0
Jan-
90O
ct-9
0Ju
l-91
Apr-
92Ja
n-93
Oct
-93
Jul-9
4Ap
r-95
Jan-
96O
ct-9
6Ju
l-97
Apr-
98Ja
n-99
Oct
-99
Jul-0
0Ap
r-01
Jan-
02O
ct-0
2Ju
l-03
Apr-
04Ja
n-05
Oct
-05
Jul-0
6Ap
r-07
Jan-
08O
ct-0
8Ju
l-09
Apr-
10Ja
n-11
Oct
-11
Jul-1
2Ap
r-13
Jan-
14O
ct-1
4Ju
l-15
Apr-
16Ja
n-17
Oct
-17

#NICForum18
This Recovery is Getting Long: Is It Time to Worry?
Source: NBER * As of March 2018

#NICForum18
Audience Polling Question #3
The Next Recession Will Begin:
1. By Year-end 20182. By Year-end 20193. By Year-end 20204. 2021 or beyond

#NICForum18
Rising Interest Rate Environment:Yield Curve for U.S. TreasuriesQ4 2015, Q4 2016, Q4 2017 and Feb. 16, 2018
0.0
0.5
1.0
1.5
2.0
2.5
3.0
3.5
4.0
3-Month 6-Month 1-Year 2-Year 3-Year 5-Year 7-Year 10-Year 20-Year 30-Year
2015Q4 2016Q4 2017Q4 16-Feb-18
Maturity Length of U.S. TreasuriesSource: Moody’s Analytics

#NICForum18
How Do Higher Interest Rates Impact Senior Care?
Cost of Borrowing
Consumer Savings Rates
Cap Rates, Valuations,
Risk Premium
Economic Growth Home Prices

#NICForum18
How Do Seniors Housing Cap Rates Stack Up?
Source: NCREIF
Cap RatesSeniors Housing, Apartment, NPI and Ten-Year Treasury Q1 2006 – Q4 2017
0.0
1.0
2.0
3.0
4.0
5.0
6.0
7.0
8.0
9.0
Ten-Year Treasury Rate Seniors Housing NPI Apartment

#NICForum18
As Interest Rates Have Fallen, Risk Premia Have Fallen
Source: NCREIF
Risk PremiumDifference Between Seniors Housing, Apartment, NPI and Ten-Year TreasuryQ1 2006 – Q4 2017
-1.0
0.0
1.0
2.0
3.0
4.0
5.0
6.0
NPI Seniors Housing Apartment
#NICForum18
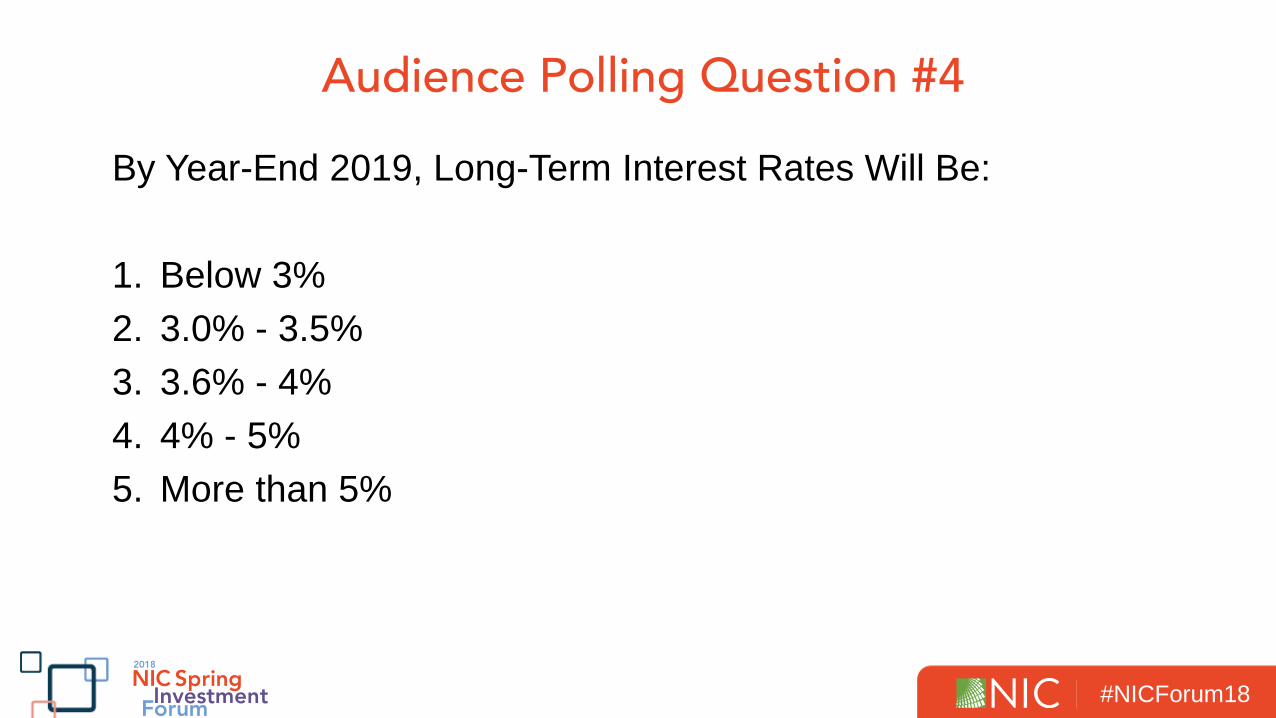
Audience Polling Question #4
By Year-End 2019, Long-Term Interest Rates Will Be:
1. Below 3%2. 3.0% - 3.5%3. 3.6% - 4%4. 4% - 5%5. More than 5%

#NICForum18
Seniors Housing Capital Market Trends: Relatively Robust

#NICForum18
Buyer Type Shifting as Public Buyers’ Share FallsClosed Transactions for Seniors Housing & Care by Buyer Type2008 – 4Q 2017
Source: NIC MAP® Data Service

#NICForum18
Seniors Housing Pricing Hovering at PeakSeniors Housing & Care Transactions Rolling 4-Quarter Price Per UnitU.S. | 1Q08 – 4Q17
Source: NIC MAP® Data Service

#NICForum18
Seniors Housing Market Conditions: Occupancy Flat

#NICForum18
Seniors Housing Occupancy Slips FurtherSeniors Housing FundamentalsPrimary Markets | 1Q06-4Q17
74%
76%
78%
80%
82%
84%
86%
88%
90%
92%
94%
0
2,000
4,000
6,000
8,000
10,000
12,000
14,000
16,000
18,000
20,000
2006 2007 2008 2009 2010 2011 2012 2013 2014 2015 2016 2017
Inventory Growth AbsorptionAll Occupancy (4Q) Stabilized Occupancy (4Q)
Source: NIC MAP® Data Service

#NICForum18
Where Did Inventory Growth Occur in Last Three Years?Seniors Housing Annual Inventory GrowthPrimary & Secondary Markets | 4Q14 – 4Q17
Source: NIC MAP® Data Service

#NICForum18
A Three-Year Look Back at Supply and Demand by MarketSeniors Housing Supply-DemandPrimary Markets 4Q14 – 4Q17
Source: NIC MAP® Data Service

#NICForum18
Seniors Housing Occupancy By Market
75%
80%
85%
90%
95%
100%
SJ
BAL
POR
SAC
SEA
NY
BOS
PIT SF DC LA SD PHI
MIN
STL
OR
L
MAP 31 DET
DEN CIN
TAM
MIA
CLE RIV
CH
I
PHO
ATL
DAL KC LV
HO
U SA
Seniors Housing Occupancy by Metro MarketPrimary Markets | As of 4Q17
Occupancy Range (4Q05 - 4Q17)Current Quarter OccupancyYear Ago Occupancy
Source: NIC MAP® Data Service

#NICForum18
Audience Polling Question #5
By Year-End 2018, Occupancy Rates for Seniors Housing Will:
1. Increase 50 basis points 2. Increase more than 50 basis points3. Decrease 50 basis points4. Decrease more than 50 basis points

#NICForum18
Skilled Nursing Trends

#NICForum18
Skilled Nursing Update
1. Occupancy reached a new low in the third quarter of 2017.
2. Medicaid patient day mix continues to make up a growing share of occupancy, reaching its highest point in the five-year series.
3. Medicare patient day mix still driver of lower occupancy, hitting a new low.
4. Managed Medicare revenue per patient day declined from the prior quarter.
Accessible through the Reports page in the NIC MAP® Client Portal
Source: NIC Skilled Nursing Data Initiative

#NICForum18
Audience Questions
Please Take a Few Minutes to Complete Today’s Session
Evaluation
![VWHPH ˆ 9RUOHVXQJ˛,QWHOOLJHQWH1H W]H · Network Operator Service Provider/ Service Operator Service Subscriber Service User,1 %HWHLOLJWH ’LHQVWQXW]HU, d.h. Telefonteilnehmer,](https://img.dokumen.tips/doc/110x75/5e182338294c58368038dc60/vwhph-9ruohvxqjqwhooljhqwh1h-wh-network-operator-service-provider-service.jpg)