Embed Size (px)
Citation preview

Republic of Sudan
Summary of causes, the situation and the key issues
Improved production in the previous season led to improve the availability of food in some states, which had a
significant impact in classifying some localities into better phases compared to the previous update.
Improvement in rangeland led to improved animal conditions and thus an improvement in livelihoods. The most
important reasons that led to the deterioration of the situation in some areas are: the deterioration of the
security situation caused by the tribal conflicts , the higher prices of food and non-food items which have direct
impact on access to food , the Climate changes has resulted in late rain ( dry spells ) in some areas, and floods in
other areas and this resulted in Significant losses in some states like : partial damage and total damage of
some houses and partial damages of some schools and immersion of some agricultural projects. There are some
injuries and deaths due to floods or electric shocks. Number of states Affected significantly, seven states ) the
most affected states are Khartoum , the heavy rains and floods cut roads and adversely affected Access to food
, but the positive role of this lies in the improvement in production in the next season and in some States
improved access to drinking water from creeks and valleys as in Red Sea state , which has been suffering from
scarcity of water in the summer , especially because of the scarcity of rain. Also the high rates of malnutrition,
wasting and weakness of food culture have had a direct impact on food security situation in some states.
Spread of humans and animals diseases in the autumn season (Malaria and Kalazar, scarcity of drinking water is
one of the threats in some areas like Darfur States and Kordofan. Conflict zones and border points with South
Sudan affected by the pillars of food security and the deterioration of livelihood assets.
Key Outcomes for the Worst affected Area Blue Nile: SAM is 4.2%. . no access to localities bordering the South of
Sudan
Red Sea: GAM is 28.5% CMR is 0.18 / 10,000 / day. 40% of the populations
suffer from food gaps.
South Kordofan: SAM is 7.3% in some localities mortality rate is 0.37 /
10,000 / day. 40% of the population suffer from deterioration of livelihood
assets due to insecurity
North Darfur: the average SAM is between 1.5-6.1%.
Deficit in the major food grains: 5% of the total consumption
West Darfur: SAM is 0.9-7.3% , in some localities deterioration of the
nutritional status of children less than 5 years, especially during the rainy
season, consumption gap for 42% of the population
East Darfur: the average SAM is between 3 - 8.2% and nutritional status of
children is affected by the insecurity, The state suffers from rising prices, the
increasing presence of IDP,s in the region and poor availability of food.
Central Darfur: SAM is 17%. , Poor access to food due to insecurity for 25%
of the population who lost their livelihood assets.
South Darfur: SAM is 3.4%. CMR is 0.26 / 10,000 / day , about 20% of
population have deteriorated livelihood assets.
Created on:
Valid To _______________ - ___________ current map (Sudan) Acute Food Insecurity Situation Overview
IPC Global Partners:
Integrated Food Security Phase Classification (IPC)
August 2013
:End of October 2013

Part 2: Summary of Findings, Methods, and Next Steps
Methods, Process & Key Issues (Write a brief description of the IPC Methods and challenges encountered during analyses)
The TWG followed the analysis tools included in the IPC manual version 2:00 ( the analytical framework , reference tables, analysis
worksheets , create a state map using the colors and names throughout the analysis ).
An estimate of the percentage of the population affected in various phases was done by different methods used in each state.
National Working Group has visited all States to train state working groups in the response analyze using IPC results to be used to design
appropriate intervention programs in the coming sessions.
Refreshment training has been implemented in the interim classification tools according to the Arabic version.
Intensive training resulted in clear improvement in the analysis and extrapolation of the results and the quality of the information to some
extent.
The states working groups analyzed the information and prepared the states reports which were submitted to the National Working Group
for review and agreement on the classification and they were finalized in the national workshop.
The main sources of evidences:
Ministry of Agriculture (field surveys, annual reports, etc.)
Ministry of Health (National Health Survey and state surveys)
Reports of the Humanitarian Aid Commission
Central Bureau of Statistics
Reports of the Ministry of Animal resources
Reports of the Ministry of Water Resources
Reports of the Ministry of Social Welfare
Reports of Zakat Chamber
Reports of International organizations and United Nations agencies
The main challenges:
- Availability of information at the local level and poor quality of some of the information especially for the key indicators .
- Coordination between the Working Group and the decision-making centers
- Inadequate budgets to enhance the analysis process and draw conclusions.
- Sustainability of IPC process and sustainable working groups to take advantage of the accumulated experience.
- Estimation of the affected population at every stage
Key Findings and Issues (Briefly discuss key findings)
According to the analysis of Acute food insecurity the country has been classified at phases1,2,3 (4 in two localities in North Darfur State , unlike the previous analysis besides North Darfur it was found in Red Sea, Blue Nile and white Nile) . There is an improvement in food security situation and livelihoods. This has led to change to better classification in some areas compared to the previous classification (February 2013) , on the other side there are localities turned for the worst phases . At the level of technical performance of the working groups there has been a significant improvement in the analysis and reporting status. Of the most important threats that coincided with this update are: flash floods and heavy rains (although it was late) that led to major damages in some areas where the inhabitants of those areas lost shelters and livelihoods assets, and they are assisted by some official supports and popular parties and other organizations. More losses were in Khartoum state while other States were also affected, the states of the River Nile, Northern, Red Sea , Sennar and Gazira. Rising food prices directly impact the possibility of access to food for vulnerable groups especially those that do not have the means of production to provide food with low income to buy the food they need. The insecurity situation was adversely affected the supply of food in Darfur states, South Kordofan and the Blue Nile, displacement and poor access to food is one of the main reasons for the classification in phases 3 and 4 Improvement in drinking water in the Red Sea State is a result of run off Khawr Arbaat which is the main source of drinking water added to the other creeks. While Kordofan and Darfur States are suffering from problems of water availability, especially in rural areas .

Food Security Seasonal Calendar and Monitoring
Implications
Wheat
Harvest
land
Preperation
for
Sorghum &
Millet
Dry Season
April May June July August September October November December January February March
Wage labors RecruitmentWage labors Recruitment
livestock Movement Livestock Movement
Ches t infec tio ns Ches t infec tio ns
Herds Protection
Malaria
Diarrhea
Eye Infec tio ns
Dates Harvest
land Preperation for
Winter Season
Wheat Harvest
Raingeland Improvind/ Seeds Broadcsting
Rainy Season Winter Season Planting
Hunger Season
Sorghum & Millet Harvestplantingland Preperation for
Sorghum & Millet
Dry Season
Agricultural activities and thus the food security situation in Sudan are mainly depend on the rainy season because 80 % of
the production depends on rainfall, which affected by the orbital line down to the north. Beginning of planting was late in this
season: in the states of Blue Nile, South and North Kordofan , Darfur states , southern parts of the Sennar and White Nile .
Usually proceeds by agriculture land preparation, which began late this season due to late rainy season.
Start of growing grain (sorghum and millet) during early July in most of the southern parts of the country. In the northern
parts begins by favorable climatic conditions (appropriate precipitation and humidity). Where farming operations usually
begin during the months of August and September, and weeds are removed and clean. Harvest of sorghum and millet begins
in the southern regions in late November As for the northern regions begins in late February (winter) .
Most important period to monitor the food security situation is the lean season, which starts in the period from the
beginning of May and lasts until late September before the new production (harvest) .
preparations for the winter season begins in early September in most Northern parts and continue until late October . Winter
crops planting Starts at early November, the season continues until the end of February.
Wheat harvest begins in February and lasts until the end of April. Dates harvest begins in August and ends at the end of
September in the northern states and Nile River. The dry season begins in early March and ends during April and May in most
parts of the country.
The movement of nomads in Darfur and South Kordofan usually starts in October and continues until the end of June to
southern parts of Sudan. The northward migration begins in June and ends in late October.
Spread of animal diseases during the rainy season, which begins in June and ends in late November.
Outbreaks of human diseases (such as malaria and chest infections, diarrhea and eye infections) increase in autumn. Also
inflammatory chest infection starts from October through February. While diarrhea takes a long period from June to October
in some areas of the country the prevalence of diseases in this season is as a result of heavy rains and floods.
Jobs available for workers during the rainy season and the harvest season across the country to supplement agricultural
operations, including the harvest.

Part 3: Population Tables
Detailed Population Table (Insert a detailed population table merging the population tables of all areas. Level of reporting should be the lowest administrative unit sub-divided by household food security
situation groups when applicable)
Detailed Population Table
Region State
Total
Population
Phase 1 Phase 2 Phase 3 Phase 4 Phase 3 or more
Population % Population % Population %
Populatio
n %
Populatio
n %
Northern
Northern 790,931 656,473 83 134,458 17 0 0 0 0 0 0
River Nile 1235550 370,665 30 864,885 70 0 0 0 0
Khartoum 6534795 5,489,228 84 1,045,567 16 0 0 0 0 0 0
Central
West
N.
Kordofan 3002781 2,282,114 76 720,668 24 0 0 0 0 0 0
S.Kordofan 1303004 846,953 65 351,811 27 104240 8 0 0 104240 8
White Nile 2086638 1,439,780 69 584,259 28 62599 3 0 0 62599 3
Central
Gezira 4112207 3,084,155 75 1,028,052 25 0 0 0 0 0 0
Sinnar 1408526 1,126,821 80 253,535 18 28171 2 0 0 28171 2
Blue Nile 625670 231,498 37 294,065 47 87594 14 12513 2 100107 16
Western
S.Ddarfur 3518846 1,689,046 48 1,301,973 37 457450 13 70377 2 527827 15
N.Darfur 1827876 109,673 6 694,593 38 822544 45 201066 11 1023611 56
W.Darfur 1090276 32,708 3 588,749 54 348888 32 119930 11 468819 43
Central
Darfur 966536 57,992 6 405,945 42 492933 51 0 0 492933 51
East Darfur 1438122 733,442 51 474,580 33 186956 13 43144 3 230100 16
Eastern
Kassala 1817743 272661.45 15 1326952.39 73 218129.16 12 0 0 218129.2 12
Red Sea 1744008 470,882 27 540,642 31 732483 42 0 0 732483 42
Gadarif 1550935 341,206 22 961,580 62 248150 16 0 0 248150 16
TOTAL 440,430333 ,62,1,2,91 44 ,,200,2,,1 11 120,62,,1 ,, 3302,1, , 32,192,10 ,, The total number is for classified population only
West Kordofan is not classified( new state no TWG is formed
Two localities in N. Darfur, Two in Blue Nile were not classified

Recommendations and Next Steps:
• Intensify training programs for technical working groups.
Training in IPC Information Support System ISS for states.
• Urge the need for close coordination between the National Working Group and decision - makers at the federal and
state level.
• Dissemination of the results of the analysis to decision-makers and stakeholders.
• Importance of full participation of TWG to gain technical consensus.
• Importance of presenting IPC results for the decision - makers (the governor and Cabinet) at States levels
• The need to incorporate the IPC required information in all the relevant surveys.
• Provide technical support and the necessary financial and logistical support to enable the activities of the working
groups to run smoothly.
• Form plans and programs according to the results of the response analysis in the future.
• The stability of the working group members to ensure recitation update.
• Verification and supporting data that has been collected and establishment of a database system.
• Focus on strategic targets, monitoring and evaluation of the situation and further analysis.
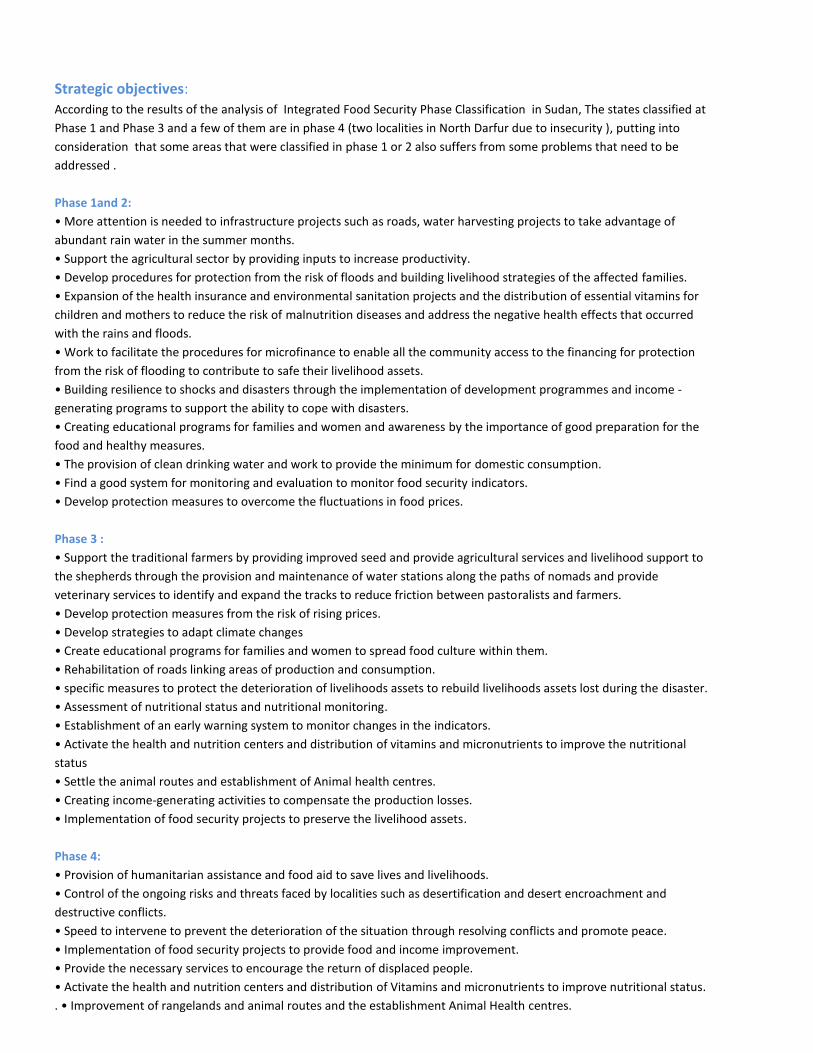
Strategic objectives: According to the results of the analysis of Integrated Food Security Phase Classification in Sudan, The states classified at
Phase 1 and Phase 3 and a few of them are in phase 4 (two localities in North Darfur due to insecurity ), putting into
consideration that some areas that were classified in phase 1 or 2 also suffers from some problems that need to be
addressed .
Phase 1and 2:
• More attention is needed to infrastructure projects such as roads, water harvesting projects to take advantage of
abundant rain water in the summer months.
• Support the agricultural sector by providing inputs to increase productivity.
• Develop procedures for protection from the risk of floods and building livelihood strategies of the affected families.
• Expansion of the health insurance and environmental sanitation projects and the distribution of essential vitamins for
children and mothers to reduce the risk of malnutrition diseases and address the negative health effects that occurred
with the rains and floods.
• Work to facilitate the procedures for microfinance to enable all the community access to the financing for protection
from the risk of flooding to contribute to safe their livelihood assets.
• Building resilience to shocks and disasters through the implementation of development programmes and income -
generating programs to support the ability to cope with disasters.
• Creating educational programs for families and women and awareness by the importance of good preparation for the
food and healthy measures.
• The provision of clean drinking water and work to provide the minimum for domestic consumption.
• Find a good system for monitoring and evaluation to monitor food security indicators.
• Develop protection measures to overcome the fluctuations in food prices.
Phase 3 :
• Support the traditional farmers by providing improved seed and provide agricultural services and livelihood support to
the shepherds through the provision and maintenance of water stations along the paths of nomads and provide
veterinary services to identify and expand the tracks to reduce friction between pastoralists and farmers.
• Develop protection measures from the risk of rising prices.
• Develop strategies to adapt climate changes
• Create educational programs for families and women to spread food culture within them.
• Rehabilitation of roads linking areas of production and consumption.
• specific measures to protect the deterioration of livelihoods assets to rebuild livelihoods assets lost during the disaster.
• Assessment of nutritional status and nutritional monitoring.
• Establishment of an early warning system to monitor changes in the indicators.
• Activate the health and nutrition centers and distribution of vitamins and micronutrients to improve the nutritional
status
• Settle the animal routes and establishment of Animal health centres.
• Creating income-generating activities to compensate the production losses.
• Implementation of food security projects to preserve the livelihood assets.
Phase 4:
• Provision of humanitarian assistance and food aid to save lives and livelihoods.
• Control of the ongoing risks and threats faced by localities such as desertification and desert encroachment and
destructive conflicts.
• Speed to intervene to prevent the deterioration of the situation through resolving conflicts and promote peace.
• Implementation of food security projects to provide food and income improvement.
• Provide the necessary services to encourage the return of displaced people.
• Activate the health and nutrition centers and distribution of Vitamins and micronutrients to improve nutritional status.
. • Improvement of rangelands and animal routes and the establishment Animal Health centres.