Embed Size (px)
Citation preview

•
REPORT
Civil Engineering Department
Cumulative Effects Assessment Manual
1 November 1995
ERM-Hong Kong, Ltd 6/F Hecny Tower
9 Chatham Road, Tsimshatsui Kowloon, Hong Kong
Telephone (352) 2722 9700 Facsimile (852) 2723 5660
.. ERM

r r [
[
[
[
['
u u II
Li
REPORT
Civil Engineering Department
Cumulative Effects Assessment . Manual
1 November 1995
Reference C1333
:::':"b:hM;i~ LM
POSitiOnfo'4f ~11 JZ;.d;;. Date: '1 up VN.t..t.dMf 1ft 5
This raport has been prepared by ERt.l-Hong Kong, Lid, .. 111 all raasonabla skill, eara and diligence .. lhin Iha Iem1s 01 the Contract .. lI1lha dient, ~ cu _ Terms and Conditions 01 Business and taking aaeount of the resources devoted to it by agreement with the client!
Wa c!sdam any responsi~lity to Iha diant and olher in respect of any matters outsida Iha scepe ollha above.
This report is oonfidantial to Iha diant and wa accept no responsi~lity of ..matsoever nabJre to third parties to whom this report 0( My part thereof, is mada known. kly such party reiies upon the report at Ihelr own risk.

L' [
[
r ~
l
r [
[
[
[
[
[
[
[
[
[
[
[
[
L
1 1.1 1.2 1.3 2 2.1 2.2 2.3 3 3.1 3.2 3.3 4 4.1 4.2 4.3
CONTENTS:
INTRODUCTION
BACKGROUND TO THE CUMULATIVE EFFECTS ASSESSMENT MANlL4L
OBJECTIVES OF THE CUMULATIVE EFFECTS ASSESSMENT MANlL4L
STRUCTURE OF THE REPORT
METHODOLOGY
INTRODUCTION
CEAM DATABASE
CEAM WORKSHEETS
MITIGATION MEASURES AND EM&A REQUIREMENTS
INTRODUCTION
ADDITIONAL MITIGATION MEASURES
EM&A MEASURES.
INTEGRATION OF CEAM WITH EM&A PROGRAMMES
INTRODUCTION
CONCEPTUAL MODEL
SELECTION OF CEAM MITIGATIONAND EM&A OPTIONS
1 1 2 3 4 4 4 6
10 10 10 13 14 14 14 15

t:
r' r f~
[
[
[
[
[
[
[
[
[
l [
L [
L
1
1.1
INTRODUCTION
BACKGROUND TO THE CUMUlATIVE EFFECTS ASSESSMENT MANuAL
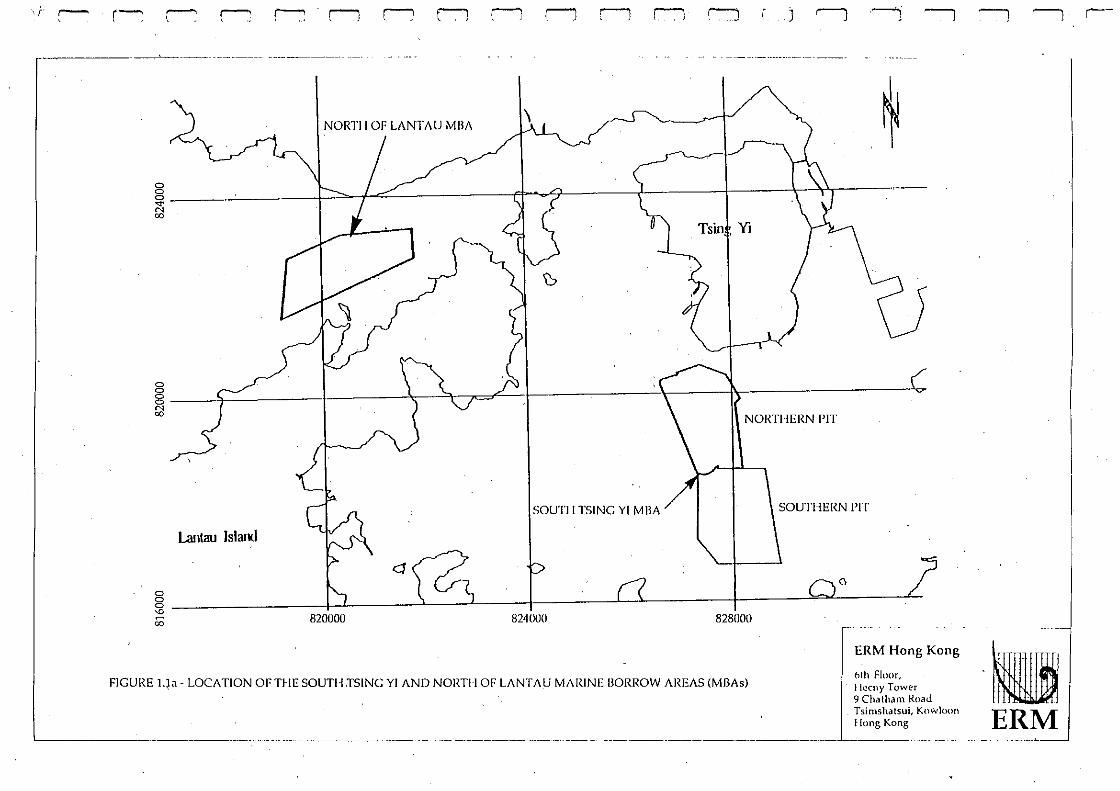
ERM Hong Kong was contracted by the Geotechnical Engineering Office of Civil Engineering Department to undertake an Environmental Impact Assessment (EIA) for the backfilling of Marine Borrow Areas (MBAs) at South Tsing Yi and North of Lantau. The brief for thisEIA Study includes preparation of an Initial Assessment Report (IAR), Draft and Final EIAs and an Environmental Monitoring and Auditing (EM&A) Manual. The Study is designed to evaluate environmental impacts associated with the proposed backfilling operations including effects on water quality and sediment transport, marine ecology, noise and air quality, and to propose operational controls and mitigation measures to reduce potential impacts to acceptable levels. The two MBAs proposed for backfilling are shown on Figure l.la.
As a result of comments from the Environmental Protection Department and the Agriculture and Fisheries Department on the IAR and Draft EIA, and discussions at the 2nd Study Management Group meeting held on 26 May 1995, evaluation of potential cumulative impacts arising from concurrent dredging and/ or disposal projects has become a key concern. Technical· analyses of sediment plume modelling performed for the EIA Study have identified that the contribution to suspended sediment levels from backfilling operations alone is environmentally acceptable. Using the results of these evaluations, the EIA developed an Operations Plan for backfilling at the South Tsing Yi and North of Lantau MBAs which minimises environmental impact through project design constraints.
The EIA also provides additional mitigation measures, in the form of plant maintenance and working methods, to further improve environmental compliance. Any environmentally unacceptable impacts must be mitigated and the mitigation measures validated by an Environmental Monitoring and Auditing (EM&A) programme. The EM&A Manual presents details of the Operations Plan and EM&A requirements developed within the EIA for the backfilling project, which are necessary to ensure the implementation and effectiveness of the recommended operational controls and mitigation measures.
However, when other dredging/ disposal projects occur concurrently with backfilling, the potential exists for unacceptable environmental impacts even if the backfilling Operations Plan and EM&A requirements are met. Other dredging/ disposal projects, which are permitted separately.from the South Tsing Yi/ North of Lantau MBAs may cause backfilling activities, which are acceptable in an independent sense, to contribute to unacceptable impacts,
Since it is not feasible to use hydrologic or sediment plume models to evaluate every possible combination of such projects, the Draft EIA has presented a number of cumulative modelling scenarios. Using these scenarios as a foundation, the purpose of this study is to identify specific impacts associated with backfilling of the South Tsing Yi and North of Lantau MBAs in combination with anyone or more of other dredging/ disposal operations in the study area, in the most cost~effective manner. This is achieved through the development of a Cumulative Effects Assessment Manual, hereafter referred to as the CEAM.
ERM HONG KONG CIvIL ENClNEERING DEPARTMENT
1

1.2
The CEAM is a flexible management tool which permits the specific impacts arising from any. combination of backfilling with other dredging/ disposal operations to be identified, as described above, and provides guidance for changes to the Operations Plan and the EM&A Manual for backfilling of South Tsing Yi and North of Lantau MBAs such that impacts are reduced to acceptable limits. The CEAM uses the actual operation rates of concurrent dredging/ disposal projects and applicable water quality objectives (WQOs) or specified criteria for each sensitive receiver. The CEAM has been designed for maximum flexibility as conditions change, allowing the addition or deletion of dredging/ disposal projects as they begin or are completed ..
The use, management and modification of the CEAM will be at the discretion of the Site Manager for the North of Lantau/South Tsing Yi backfilling project, who will use it as a tool to predict and mitigate impacts arising from the backfilling and other concurrent projects. Several opportunities for improving the CEAM and enhancing its effectiveness as a management tool are identified below:
incorporating predictions of SS concentrations in the bed layer at all SRs;
incorporating predictions for all four tidal conditions (dry season spring, dry season neap, wet season spring, wet season neap) for all SRs and identifying the worst case tide for each SR;
incorporating predictions and compliance evaluations for dissolved oxygen;
incorporating site specific ambient conditions .for all relevant water quality parameters at all SRs;
developing specific protocols for integrating EM&A data and the CEAM and validating and calibrating the revised CEAM; and
developing specifications for water quality modelling which is to be incorporated into the CEAM;
The administration, modification and development of the CEAM will be the responsibility of the Site Manager, and will be undertaken in conjunction with the Environmental Protection Department and the Fill Management Committee.
OB]ECI1VES OF THE CUMUIATIVE EFFECTS ASSESSMENT MANUAL
The specific objectives of the CEAM study are to provide:
L
F r r r [
[
c [
.' -"
[
[
[
[
[
A database which can be used to predict concentrations of suspended r ' sediments at sensitive receivers resulting from a variety of dredging and L disposal projects;
A methodology for using the predicted suspended sediment - l concentrations to adjust elements of the proposed Operations Plan and/or EM&A programme for the North of Lantau/South Tsing.Yi l MBAs; and
l ERM HONG KONG CMt. ENGINEERING DEPARTMENT
2 r
,I- r-r~
.---, "
r; r---; rJ r; r: rJ rJ rJ rJ r-:J r r"'"'j '-'} ------, J
..........,--'- .. _-- -~-.. ----- ----.---~-.-
NORTI I OF LANTAU MBA '\ ~
~
:5 ~ / cC d?? \ '1.\ o 0 \ '/ ~ I . "
Tsin2 Yi
8 ~ \ '- .!" I ' \ t 'v ~ ) "-../= - \( NORTHERN PIT
SOUTI I TSING YI MBA SOUTHERN PIT
Lanlau Island
(\
§ I 'J \ 'J \ '-->' r
~ 820000 824000 828000
FIGURE qa - LOCATION OF THE SOUTH .TSING YI AND NORTH OF LANTAU MARINE BORROW AREAS (MilAs)
~ .. ---------- -"---- -~.- --- -
ERM Hong Kong
bth Floor, Ilccny Tower 9 Chatham Road Tsimshatsui, Koy.'loorl Iiong Kong
~ ------, r-
II ERM

.-I
r r r r r r [
[
[
[
[
L [
[
[
L L L
1.3
A Cumulative Effects Assessment Manual (CEAM) which incorporates the database and the methodology and serves to supplement the North of Lantau/South Tsing Yi MBAs ErA, Operations Plan, and EM&A Manual.
SmuCIURE OF THE REpORT
Following this introductory section, the Manual is organised as follows:
Section 2 presents the database and worksheets, with full instructions on their operation;
Section 3 discusses possible additional mitigation measures and EM&A requirements; and
Section 4 provides guidance on modifying the standard Operations Plan and EM&A programme.
ERM HONG KONG CML ENGINEERING DEPARTMENT
3
l
r r r
[
r r [
[
[
[
[
[
[
[
[
L L L
2
2.1
2.2
METIIODOLOGY
INTRODUCTION
This section provides a description of the methodology employed to develop the CEAM. The first step in preparing the CEAM involved developing a database of predicted elevations in suspended solids (55) concentrations arising from each individual dredging/ disposal project, at each of the sensitive receivers (SRs) found in the ErA to be potentially impacted by backfilling operations. This database was then used to construct CEAM worksheets which allow the impacts of any combination of operations to be assessed. The assumptions and techniques governing the formulation of the CEAM database and worksheets, and full instructions for their use are presented below.
CEAM DATABAsE '
The database provides predicted elevations in suspended sediment (55) concentrations at 13 SRs, resulting from 15 different dredging/ disposal operations potentially occurring concurrently with backfilling operations in the stu d y area.
The projects included in the database are those which are reasonably expected to contributt; suspended sediment impacts to SRs potentially affected by backfilling operations during a 5-year period commencing in mid-1995. As stated in the ErA, the study area is located within the following boundaries: Chek Lap Kok Airport to Tuen Mun Area 38, Causeway Bay to Tsim Sha Tsui East and South Cheung Chau to Stanley. A single rate of working has been modelled for each of the potentially concurrent projects or project phases and is provided (in m3 per week) in the database. The dredging and disposal projects included in the CEAM database, and their modelled rates of operation are shown in Table 2.2b.
The modelled rate of backfilling operations at the South Tsing Yi and North of Lantau MBAs corresponds to the maximum worst case non-cumulative rate used in the ErA (ie, 200,000 m3 day-I trailer dredged material at South Tsing Yi plus 10,000 m3 day-I grab dredged material at North of Lantau). However, actual expected disposal rates for these projects will be limited to 100,000 m3 day-I at South Tsing Yi and 10,000 m3 day-I at North of Lantau by the Operations Plan. As explained in the ErA, these limits are necessary to reduce the effects of suspended sediment concentrations resulting from backfilling operations alone to acceptable levels.
Data are not currently available for several of the projects which may occur concurrently with backfilling at the South Tsing Yi and North of Lantau MBAs. These projects include Dredging and Filling for Kowloon Point Reclamation; Sand Dredging and Backfilling at Brothers West, East and Mid MBAs; and Backfilling of East Sha Chau West and Mid MBAs. Blank records for these projects have been included in the database to facilitate updating when modelled values for these projects become available. Because the CEAM provides a flexible approach to management of impacts, when new projects are planned, data on their associated impacts can be easily incorporated into the database.
ERM HONG KONG CML ENGINEERING DEPARTMENT
4

Table 2.2b Project names and modelled operating rates
Project name Modelled Modelled Operating Operating rate (m' rate (m' per day) per week)
Backfilling of North of Lantau and South Tsing Yi 210,000 1,470,000
Dredging of surface marine sand from South Tsing Yi MBA 80,000 560,000
Dredging of bottom alluvial sand from South Tsing Yi MBA 80,000 560,000
Dredging of marine sand from West Sulphur Channel Yi MBA 42,857 300,000
Dredging for CT10 & 11 Advance Works 80,054 560,378
Dredging for CT10 & 11 Berths 113,333 793,333
. Filling for CT10 & 11 Berths 119,100 833,700
Dredging in East Lamma Channel 80,000 560,000
Dredging for Stonecutters Reclamation 5,417 37,919
Dredging for Kowloon Point Reclamation N/A N/A
Filling for Kowloon Point Reclamation N/A N/A
Dredging for Green Island Reclamation 27,143 190,000
Filling for Green Island Reclamation 4,400 30,800
Dredging of sand from Brothers West, East and Mid MBAs N/A N/A
Backfilling of Brothers West, East and Mid MBAs N/A 'N/A
Sources: Agreement No. CE 52/94. West Sulphur Channel Marine- Borrow Area. Focused EIA. Final Report, December 1994. Green Island Reclamation (Part) - Public Dump. Environmental and Traffic Impact Assessment. Volume I (Main Report) and Volume ill (Sediment Plume Model Results) Agreement No CE 50/94. Lantau Port Reclamation Stage 1. Design of Reclamations and Edge Structures for Container Tenninals 10 and 11 and Backup Areas Lantau Port Development Stage 1. Container Terminals 10 and 11-- Ancillary Works (Design) Review of Advanced Works Dredged Option.
The 13 SRs included in the CEAM are those described in the ErA which fall within the plume area for the worst case non-cumulative modelling scenario (Scenario 4a in the ErA). For each SR, suspended sediment concentrations, in mg 1-1 (ppm) above background are presented for each individual ' dredging/ disposal project. These concentrations were estimated by using existing data sets 'and modelling results from the W AHMO modeL No new W AHMO modelling runs were performed in order to develop the CEAM database.
All predicted concentrations represent dry season spring tide conditions, which were identified in the ErA to be the worst case (Scenario 4a). Both maximum and minimum suspended sediment concentrations are estimated for each SR. These values represent the range of predicted suspended sediment elevation for the entire tidal cycle. Both maximum and minimum concentrations may occur for only brief periods of the tidal cycle. Therefore maximum suspended sediment concentrations represent a highly conservative, worst case approach.'
ERM HONG KONG CMt ENGINEERING DEPARTMENT
5
[:
[
[
[
r
[;
[
[
[
[
[
[
[
[
L l r
I r r r r [
[
r [
[
[ 2.3
[
[
[
L [
[
L L L
The CEAM predicts suspended sediment concentrations in terms of expected values in the surface layer of the W AHMO model. Most 5Rs are found exclusively in the surface layer, which in the W AHMO model extends to a depth of 8 meters. Most water intakes and mariculture activities, as well as amenity activities such as bathing at gazetted beaches, take place in water depths shallower than 8 meters. Therefore, it was felt to be appropriate for the CEAM to focus on 55 impacts in the surface layer.
For the purposes of the CEAM, suspended sediment concentrations were selected as the indicative parameter of impacts to water quality arising from backfilling in combination with any other dredging or disposal operations. Dissolved oxygen and nutrients are also impacted by dredging and disposal operations, however, as shown in the EIA, changes in these parameters largely result from the physical and chemical fluxes occurring as sediment is released into the water column. Therefore, using CEAM predictions to manage water quality such that high concentrations of suspended sediments do not occur at the 5Rs also protects them from the effects of fluxes in other parameters.
It should be noted that, by using the worst ~ase scenario for backfilling as its base, CEAM may not always predict the worst case suspended sediment concentration at each 5R for every combination of projects and seasonal! tidal conditions. However, by using the maximum 55 concentration predicted at each 5R and an approach which sums all concurrent project's impacts to predict 5R concentrations, CEAM is conservative and an appropriate tool for managing backfilling activities.
CEAM WORKSHEETS
The data contained within the database described above provides a tool for predicting the suspended sediment effects of individual projects. However, since the purpose of the CEAM is to assess cumulative effects, worksheets have been developed to allow the user to scale the data based on actual operation rates and to combine the predicted impacts from any combination of concurrent projects.
The CEAM worksheet consists of three parts:
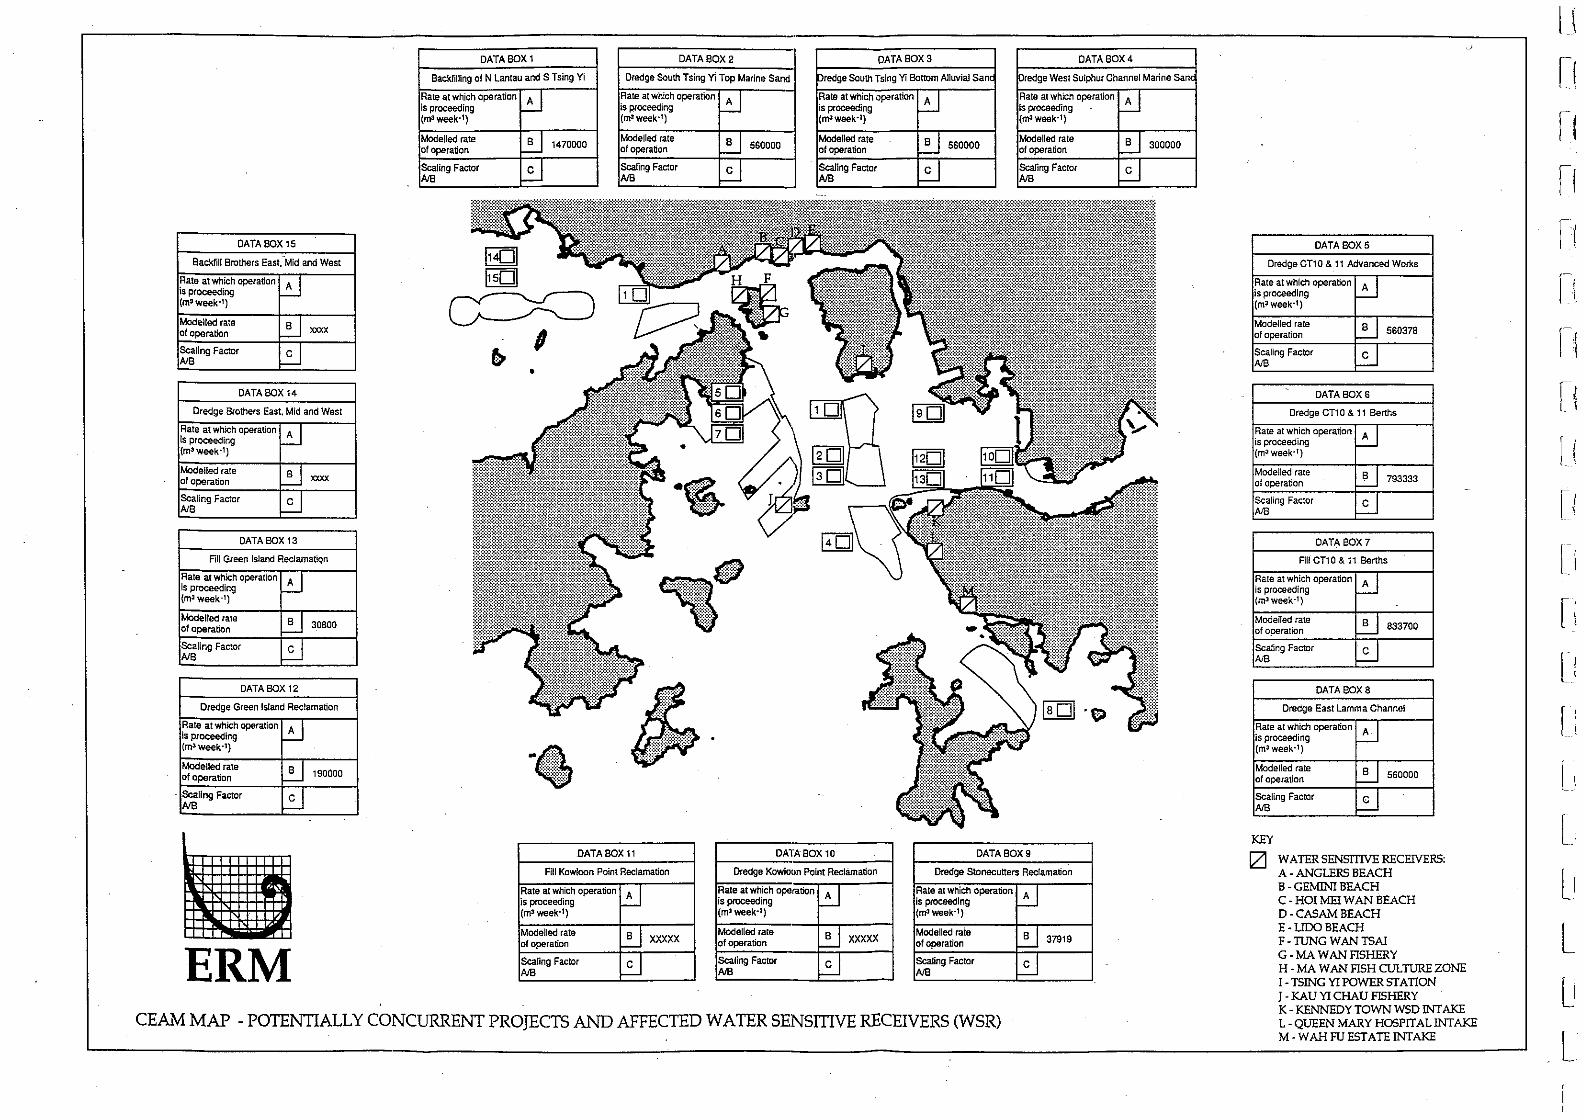
A map showing all dredging/ disposal projects which are potentially occurring concurrently with backfilling, and all potentially affected 5Rs in the study area;
A data worksheet which aids the user in calculating impacts arising from concurrent projects; and
An instruction sheet, providing step by step instructions on using the Map and the Worksheet.
Instructions for using the CEAM are described in detail below. Administrative arrangements for the timing and circumstances of CEAM usage will be the subject of separate discussions and agreements between concerned Government departments.
ERM HONG KONG CIvIL ENGINEERING DEPARTMENT
6
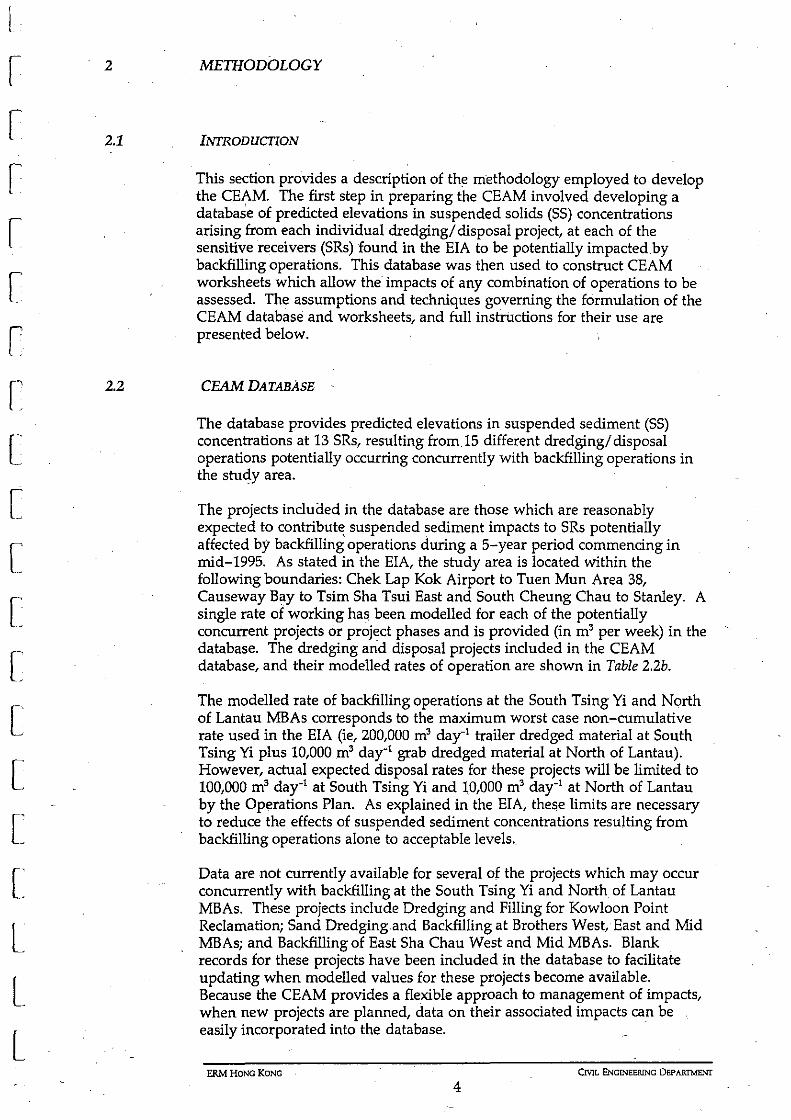
.INSTRUCTIONS FOR THE CEAM
STEP 1. Locate Concurrent Operations
i. On the CEAM ~ap, locate and mark all dredging and disposal opera~ions which are occurring concurrently with backfilling operations.
ii. For all mar~ed operations, locate the associated Data Box.
STEP 2. Calculate Scaling Factor
i. In each selected Data Box, insert the rate at which the dredging, filling or disposal operation is proceeding, in units of m' week-1 (Box A).
ii. Calculate the Scaling Factor (A;.B) and insert into Box C.
STEP 3. . Calculate SS Levels at SRs
i. ·Insert value C from Data Box into column labelled 'Scaling Factor'. The Scaling Factor for Erosion (lb) is the same as that for Backfilling (la).
ii. Multiply Scaling Factor (SF) by Maximum and Minimum SS values for each SR: .
iii. Insert new SS V9-lues into coh.lmns labelled 'Max x SF' and 'Min x SF', as shown.
iv. Repeat procedure for all Data Boxes marked in Step 1. v. Sum all values in 'Max x SF' and 'Min x SF' columns: vi. Add ambient values to summed SS values to give Total SS levels at each
SR.
STEP 4. Identify Exceedances
i. ii.
iii.
Compare Total SS values with Water Quality Criteria. If Total SS > Water Quality Criteria, tick Exceedance Box on Data Worksheet and locate all SRs showing exceedances on CEAM Map. If both 'Max' and 'Min' Exceedance Boxes on the CEAM Worksheet are ticked, shade in both halves of the SR Box. If only the 'Max' Exceedance Box is ticked, shade in half of-the SR Box_
r [
[
[
[
[
[
[
[
[
[
[
l l L r
DATA BOX 1 DATA 80X 2 DATA BOX 3 DATA80X.
Backfilling of N Lantau and S Tsing Yi Dredge South TSlng Vi Top Marine Sand predge South Tsing Vi Bottom Alluvial Sane predge West Sulphur Channel Manne Sane
Rate at which operation
~ is proceeding (m'week-')
Rate al which operation ~ is proceeding (f113week-1)
Rate at which operation
~ IS proceeding (m3week- l)
Rate at which operation ~ IS proceedmg (m3week-l)
Modelled rate ~ 1470000 of operation Modelled rale ~ 300000 of operation
Modelled rate l::J 560000 of operation Modelled rate ~ 560000 of operation
Scaling Factor ~ AlB Scaling Factor ~ AlB
Scaling Factor ~ AlB Scaling Factor ~ AlB
DATA BOX 15
Backfill Brothers East. Mid and West
Rate at whICh operation ~ is prOCeeding
(m3 week-1)
ModeUed rate ~xxxx of operation
Scaling Factor ~ AlB
DATA BOX ,.
Dredge Brothers East, Mid and West
Rate at whICh operation ~. is proceeding (m3 week-1)
Modelled rate ~xxxx of operation
Scaling Factor ~ "'8
DATA BOX 13
Fill G(een Island AedamatiQn
Rate at whICh operaCion
~ is proceeding (ml week-I)
Modelled rate ~ 30800 of operallon
Scaling Factor ~ "'8
DATA BOX 12
Dredge Green Island Reclamation
Rate at whICh operation W is proceeding (m3 week-1)
Modelled rate ~ 190000 of operation
Scaling Factor ~ AlB
DATA BOX l' DATA BOX 10 DATA80X9
Fill Kowloon Point Reclamation Dredge KowIolJn Point Reclamation Dredge Stonecutters Reclamation
Rate at which operation
~ is proceeding (m3 week-I)
Rate at which operation
~ is proceeding (m3 week-I)
Rate at which operation
~ is proceeding (m' week-')
Modelled rate
~ XXXXX of operation -Scaling Factor
~ AlB
Modelled rale ~ 37919 of opera lion
Scaling Factor ~ AlB
ModeJled rate ~ XXXXX of operation
Scaling Factor ~ AlB ERM CEAM MAP - POTENTIALLY CONCURRENT PROJECTS AND AFFECTED WATER SENSITIVE RECEIVERS (WSR)
DATA80X5
Dredge CT10 & 11 Advanced Works
Rate at which operation
~ is proceeding (m3 week-')
Modelled rate ~ 560378 of operation
Scaling Factor ~ AlB
- . I
DATA BOX 6
Dredge en a & 11 Berths
Rate at which operatton
~ IS proceeding (m3 week-')
Modelled rate l::J 793333 of operation
Scaling Factor ~ AlB
DATA BOX 7
Fin en 0 & 11 Berths
Rate at which operanon W IS proceeding (m3 week-')
Modelled rate l::J 833700 of operation
Scaling Factor ~ AlB
DATA80X8
Dredge East Lamma Channel
Rate at which operation S is proceeding (m3 week-')
Modelled rate ~ 560000 ofoperatlon
Scaling Factor ~ .
AlB
KEY
I2l WATER SENSITIVE RECEIVERS: A - ANGLERS BEACH B - GEMINI BEACH C - HOI MEl WAN BEACH D - CASAM BEACH E-UDOBEACH F - TUNG WAN TSAl G - MA WAN FISHERY H - MA WAN FISH CULTURE ZONE 1- TSING Yl POWER STATION J -KAU Yl CHAU FISHERY K - KENNEDY TOWN WSD!NT AKE
J
L - QUEEN MARY HOSPITAL !NT AKE M- WAHFU ESTATE !NTAKE
[(
r
l
L
L

l CEAM DATA WORKSHEET Calc~lations as of _________ (date)
r r ~ i-
I' r-
~
l Water Quality Crtteria 32.5 32.5 32.5 32.5 32.5 32.5 3,. 32.5 32.5 32.5 32.5 32.5 32.5
r-
L r l
L
L 32.5 32.5 325 32.S 32.5 325 20.0 325 32.5
• ERM L
I
r r r r r r
r [
[
[
[
L [
[
[
L L L I
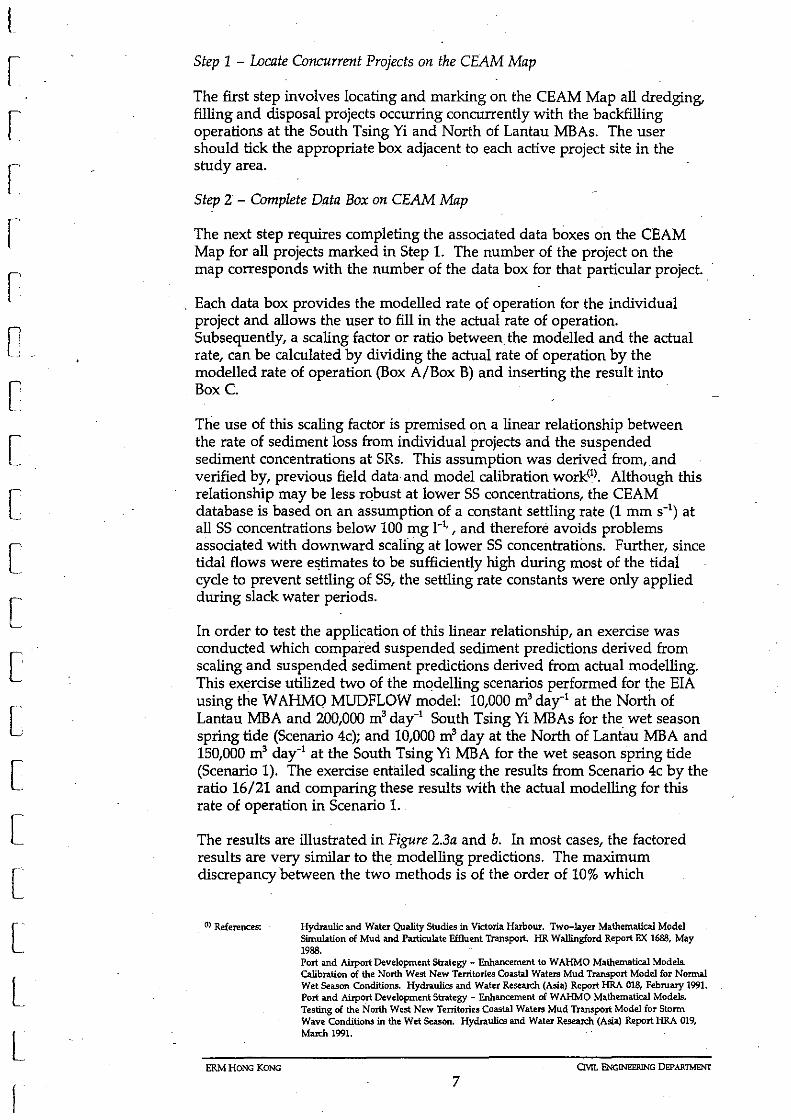
Step 1 - Locate Concurrent Projects on the CEAM Map
The first step involves locating and marking on the CEAM Map all dredging, filling and disposal projects occurring concurrently with the backfilling operations at the South Tsing Yi and North of Lantau MBAs. The user should tick the appropriate box adjacent to each active project site in the study area.
Step 2 - Complete Data Box on CEAM Map
The next step requires completing the associated data boxes on the CEAM Map for all projects marked in Step 1. The number of the project on the map corresponds with the number of the data box for that particular project ...
Each data box provides the modelled rate of operation for the individual project and allows the user to fill in the actual rate of operation. Subsequently, a scaling factor or ratio between the modelled and the actual rate, can be calculated by dividing the actual rate of operation by the modelled rate of operation (Box A/Box B) and inserting the result into Box C.
The use of this scaling factor is premised on a linear relationship between the rate of sediment loss from individual projects and the suspended sediment concentrations at SRs. This assumption was derived from,and verified by, previous field data and model calibration work(1). Although this relationship may be less robust at lower SS concentrations, the CEAM database is based on an assumption of a constant settling rate (1 mm S-I) at all SS concentrations below 100 mg I-I, , and therefore avoids problems associated with downward scaling at lower SS concentrations. Further, since tidal flows were e~timates to be sufficiently high during most of the tidal cycle to prevent settling of SS, the settling rate constants were only applied during slack water periods.
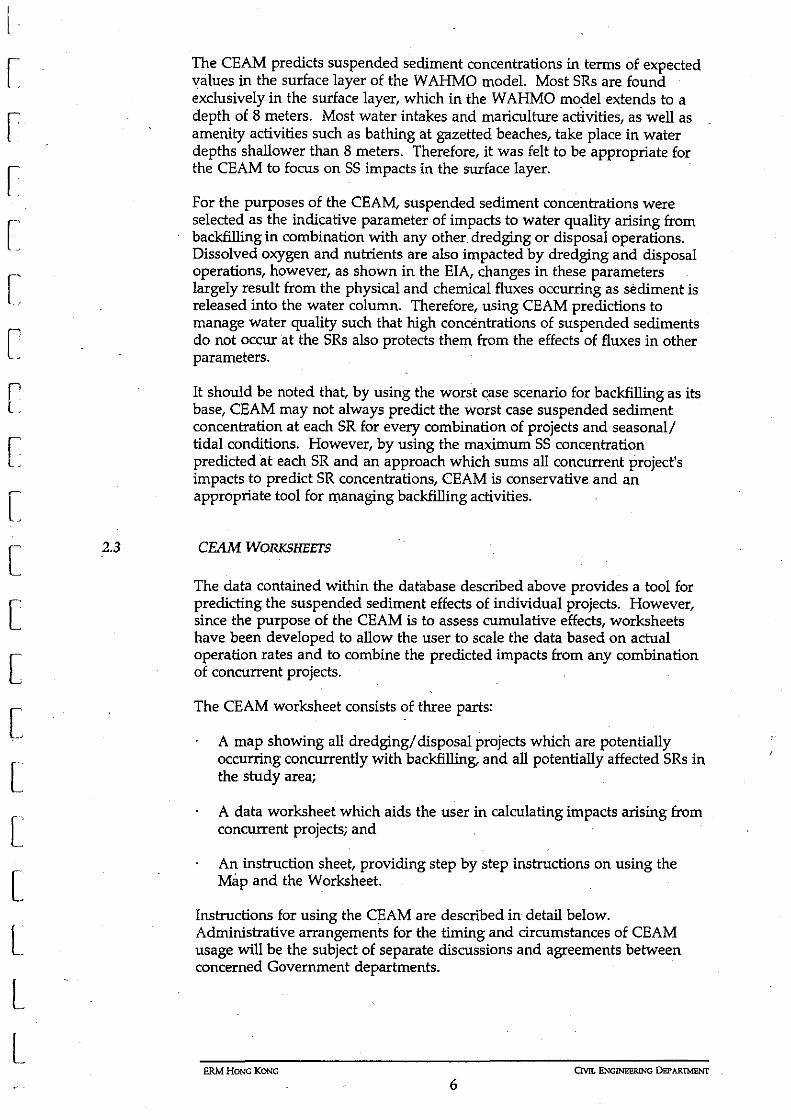
In order to test the application of this linear relationship, an exercise was conducted which compared suspended sediment predictions derived from scaling and suspended sediment predictions derived from actual modelling. This exercise utilized two of the modelling scenarios performed for the EIA using the WAHMO MUDFLOW model: 10,000 m3 day-I at the North of Lantau MBA and 200,000 m3 day-I South Tsing Yi MBAs for the wet season spring tide (Scenario 4c); and 10,000 m3 day at the North of Lantau MBA and 150,000 m3 day-I at the South Tsing Yi MBA for the wet season spring tide (Scenario 1). The exercise entailed scaling the results from Scenario 4c by the ratio 16/21 and comparing these results with the actual modelling for this rate of operation in Scenario 1.
The results are illustrated in Figure 2.3a and b. In most cases, the factored results are very similar to the modelling predictions. The maximum discrepancy between the two methods is of the order of 10% which
(I) References:
ERM HONG KONG
Hydraulic and Water Quality Studies in Victoria Harbour. Two-layer Mathematical Model Simulation of Mud and Particulate Effluent Transport. HR Wallingford Report EX 1688, May 1988. Port and Airport Development Strategy - Enhancement to W AliMa Mathematical Models. Calibration of the North West New Territories Coastal Waters Mud Transport Model for Normal Wet Season Conditions. Hydraulics and Water Research (Asia) Report HRA 018, February 1991. Port and Airport Development Strategy - Enhancement of WAHMO Mathematical Models. Testing of the North West New Territories Coastal Waters Mud Transport Model for Storm Wave Conditions in the Wet Season. Hydraulics and Water Research (Asia) Report liRA 019, M=h 1991.
OVIL ENGINEERING DEPARTMENT
7

represents approximately 1 mg r-I. This margin of error is considered acceptable in light of the nature of the CEAM as an indicative, predictive tool requiring a number of assumptions. Therefore, use of a linear relationship between disposal rates and predicted suspended sediment concentrations has been adopted for the CEAM.
Step 3 - Calculate Suspended Sediment Concentrations at Sensitive Receivers on CEAM Worksheet .
The scaling factor value calculated in Box C of each selected data box of the CEAM map is now transposed into the column labelled "Scaling Factor" on the CEAM Worksheet. This step should be repeated for each marked concurrent project on the CEAM map. The numbers for individual projects on the CEAM Map, the databoxes and the row number in the CEAM worksheet are identical. Inactive projects should be left blank on the CEAM worksheet.
It should be noted that the backfilling of the North of Lantau and South Tsing Yi MBAs requires two rows on the CEAM worksheet to account·for sediment loss due to both disposal and subsequent erosion. Erosion values for the backfilling operations can be scaled with the same scaling factor used in Row 1 ana. calculated in Box 1 on the CEAM Map. This is appropriate in the light of the findings of the EIA modelling studies (see EIA Section 3.11). This modelling showed that tidal currents are sufficient to erode 100% of all available fluid mud from these MBAs during worst case tidal conditions. Since the volume of fluid mud available for erosion is linearly related to the volume of mud disposed, SS concentrations resulting from erosion of fluid mud can be scaled in the same way as suspended sediment concentrations resulting from different rates of backfilling. Since the natural seabed is stable under worst case tidal conditions, there is no need to include a figure for suspended sediment concentrations resulting from "natural" erosion processes.
Once the scaling factors have been transposed, the user should multiply the scaling factor (SF) value by both the maximum and minimum predicted suspended sediment (SS) concentration for each SR and insert the new calculated values for SS concentrations into the appropriate columns for that SR (labelled "Max x SF" and "Min x SF", respectively). This procedure should be repeated for all SRs for each concurrent project in operation (ie, for all data boxes completed on the CEAM Map).
At each SR, the SS concentrations in the "Max x SF" and "Min x SF" columns should be summed to give total maximum and minimum prediCted suspended sediment concentrations at each SR resulting from the concurrent projects in operation at that time. The maximum and minimum summed values for each SR should be inserted into the row "Sum all values."
Ambient values of suspended sediments must also be added to the total suspended sediment concentration and are provided for each SR. These ambient values are based upon the 90th percentile for the study area (ie 25 mg I-I) as described in Chapter 3 of the North of Lantau/South Tsing Yi MBAs EIA. The exception to this is the ambient value for the Kennedy Town WSD Intake, which in accordance with agreements reached at the 2nd Study Management Group meeting on May 26, 1995, was calculated as the 90th percentile value from EPD routine water quality monitoring data collected at station VM8 during the years 1992-1994. Ambient values should be added to the dredging/ disposal project subtotal (Sum all values row) to
ERM HONG KONG avn. ENGINEERING DEPARTMENT
8
l
r r r r r [
E [
[
[
[
[
[
[
[
[
[
[
[

r-----"' r--- r--- l'""': r--: r; rl l'""': r; r-l II C""! II
----._-------_._- .•.•
10.0
9.0
--- 8.0 e c.. 7.0 c.. '-'
I: 6.0 0 .~ 5.0
d 4.0
~ 3.0 I: 0 U 2.0
1.0
0.0 .c ~
0 0
~ .c 0
'" ~ r: .'" .!! :5 eo ~ s
0 l'J
• Backfill (210,000)
c .c " 0
~ ~ 'u '" ::E S
" '0 ~ ~
:z: " u
.c 0
~
'" 0
3
'" ~ c
~ '. c ~
f-<
~ .c J: c
~ " ::E
~
~i " ·c
::E " ::E
Sensitive Receivers
• Backfill (160,000)
Figure 2.3a Backfilling of South Tsing Yi and North of Lantau Borrow Pits
II
~ o c
p.. 0 :;: .~ eo'"
.S ~
::-:J
iii ti i:' >=-M ::JiI: .:l
II
c ~ 0
~~ »-"Eo c '" ~~
II
d ::E..5
f~ ~ ~ CiO :z:
II
'iii Ul 0
.E~
.c c ,,-~.
o Backfill (160,000 Scaled from 210,000)
II
Comparison between Maximum Impacts of Different Dumping Rates and Scaled Predicted Impacts ~llll[JJU .. Imilll1m ERM
II

r r
o~",U[
.153 lld qt1M
r 0' 0
~)[111UI [ln~dsOH 0 cO
r ,(JBW u~n() N
E 0
'" .",
r o~",U[ as,,", " ""iJ UM.O~ .(pgUU:))I <.)
(/)
0 0 0
r cO .uoqsld '"
nBl{:) !A n8){ i2 -'" '" <.) ~
r " g o:l 0.. U°!l"l11S 0 .§
J::>It\0d !A :3U!s.L -0
(/) OJ
[' .<::: ~
u
'" 0... 'B ~Jnlln:)~l:lW s..
~ OJ ~ ....
UlJh\. l1yt .. 0 r:>-. •• t: -0 r ~ 0 OJ (oJ
CO Cd ~ u
~ ;::l r/J h.IdqS!d Ull'M grot oj ]
~ +-' r c OJ .. oj
'" •• .....:I OJ ..... •• <.;...; ;; '" 0' 0 ~
!l.lS.L U13h\ g'un,L = 0 ..c OJ)
[' ~ 0 c: 00. cO t . is. '" 0
Z S ::J
c:: "0 Cl
[ Q01r.)g OPrl -'" C ~ u
" oj c: o:l .- '" .... • >- ~
bJl 4-<
L c 5 4o~a WUSSl1;) .- 4-< (/) 0 'f-< '" ..c ~
+-' g
[ ;::l 0.. 0 8
ueA\ !dl'\l !OH C/l -<.;...; S 0 ::J
[' bJl S c '2 .-::::: :s S~l(0tr.?8 !TJ'!WdD t;:1 0' ~ c:
L <;) '" 0 oj ~ 0
cO CO OJ
N .£J .D
q'''''8 SJo[~UV ~
"'1 c:
[ c:: 0 -'" C'l '" u
CI) .;::::
'" OJ o:l .... 0..
0 0 0 0 0 C! 0 0 0 C! 0 ;::l S d '" 00 r-: ",; '" ..; '" N - d • .~
L - 0 [.l.. u
(wdd) UO!lC.llUa;mO;)
L.

r r r r [
r [
[
[
[
[
[
[
[
L L L L
provide the total predicted maximum and minimum 55 concentration at each SR. These maximum and minimum 55 concentrations should be inserted into the row "TOTAL 55."
Step 4 - Identification of Exceedances of WQOs and Criteria at Sensitive Receivers
The final step in the CEAM Worksheet is to compare the maximum and· minimum Total 55 value at each 5R with the applicable 55 water quality obj~ctives and criteria.
The WQO for suspended sediment concentrations of 30% above the ambient value (ie. 25 mg 1-1) applies to the following 5Rs: Anglers Beach, Gemini Beach, Hoi Mei Wan, Casam Beach, Lido Beach and Tung Wan Tsai. Suspended sediment criteria set by individual facilities apply to fish culture zones and water intakes in the study area (ie. 50 mg 1-1 at the Ma Wan Fish Culture Zone and the Ma Wan and Kau Yi Chau Fisheries, and 140 mg 1-1 for the Tsing Yi Power Station cooling water intake, the Queen Mary Hospital and Wah Fu Estate Intakes). However, based on EPD's 22 August 1995. comments, it is understood that if the WQO is more conservative than the facility-specific criteria, the WQO should be applied. Therefore, acceptability of 55 concentrations at the fish culture zones and the water intakes are also judged against the WQO. At the Kennedy Town W5D Intake, the facility-specific tolerable limit for suspended solids of 20 mg r-' is more conservative than the WQO of 22 mg 1-1 and so the facility-specific criterion is applied. .
If the maximum and/ or minimum Total 55 value at a SR is found to exceed the water quality objective or criterion for 55 concentrations, the user should indicate this exceedance by placing a check in the appropriate Exceedance Box (maximum and/or minimum value) for that 5R on the Worksheet. In addition, the user should indicate this exceedance on the CEAM Map showing the concurrent projects. At the 5Rs where there is a predicted exceedance, the user should shade in the entire box to indicate exceedance of both the maximum and minimum 55 values, or shade in only half of the box to indicate exceedance of the maximum 55 value only.
After following these procedures, the CEAM Map displays the projects in operation concurrently with backfilling of South Tsing Yi and North of Lantau MBAs, the 5Rs for which exceedances in water quality criteria are identified, and an indication of the degree of impact.
ERM HONG KONG CML ENGINEERING DEPARTMENT
9

I
I r r r r [
r [
[
[
[
[
L [
[
L L L L I
3
3.1
3.2
3.2.1
MITIGATION MEASURES AND EM&A REQUIREMENTS
INTRODUCTION
/ The CEAM predicts worst case impacts arising at each sensitive receiver for any combination of dredging/ disposal operation ongoing within the study area. Where exceedances of WQOs or specified criteria for suspended sediments are predicted to occur, mitigation measures and EM&A requirements will be necessary to control, identify and correct impacts. Mitigation measures and EM&A programmes provided in the ErA and EM&A Manual were developed for backfilling operations alone, and do not account for cumulative impacts arising from all concurrent operations. Since the severityand extent of cumulative impacts depends upon the combination of projects ongoing concurrently, and as these may not be ascertained at this time, a flexible approach to impact control must be adopted. The purpose of this section is to describe additional mitigation measures and EM&A C
requirements which can be imposed upon backfilling operations at the North of Lantau and South Tsing Yi MBAs in the event of unacceptable predicted cumulative impacts. Mitigation and EM&A requirements for other projects which may contribute to cumulative impacts are not discussed. Additional measures proposed here are designed to supplement the Operations PIal! described in the ErA and the EM&A Manual for the backfilling of the North of Lantau and South Tsing Yi MBAs ..
ADDmoNALMiTIGATION MEASURES
Additional mitigation measures for cumulative impacts were considered with respect to both potential reduction in suspended sediment concentrations· and tolerance limits of the specific SRs. The mitigation measures listed here represent options which can be combined into one or more mitigation . packages at the discretion of the Site Manager in conjunction with EPD and FMC. Additional mitigation measures for cumulative impacts may Include:
restrictions on backfilling rates; restrictions on backfill material type; restrictions on tidal conditions under which backfilling occurs; use of silt curtains; and, permit conditions for other concurrent projects.
In extreme cases, suspension of backfilling operations will be considered if other mitigation measures have been unsuccessful.
Restrictions on Backfilling Rate
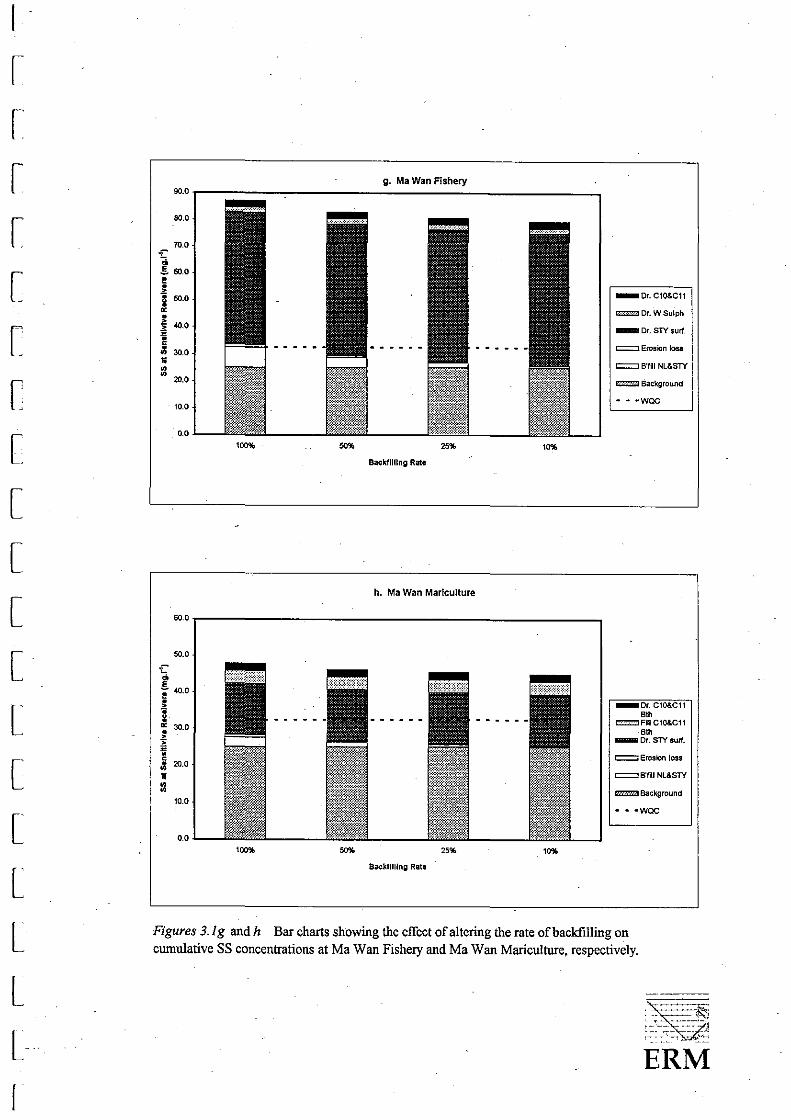
One means of mitigating the cumulative effects of backfilling and concurrent dredging and/ or disposal projects in the western waters of Hong Kong is to . control the rate at which backfilling at the South Tsing Yi and North of Lantau MBAs is undertaken. To assess the effects of different backfilling rates on total suspended sediment concentrations at SRs, Figures 3.1a through m were developed.
These barcharts represent the contribution to suspended sediment concentrations at each SR should the four projects having the highest impact (in terms of suspended sediment concentrations) on that SR be operating
ERM HONG KONG Crvrr. ENGINEERING DEP ARTMENr
10

- ~-- '."~ '---.
concurrently. The selection of these four projects was based upon the data presented in the CEAM database (maximum suspended sediment values) and thus the barcharts represent the worst case scenario for that SR in terms of projects operating concurrently.
In developing the barcharts, the following points were addressed:
All dredging; filling and backfilling operations were mcluded at their maximum rate; .
Impacts resulting from the combined backfilling at the South T~ing Yi and North 6f Lantau MBAs are presented at rates of 100%, 50%;25% and 10% of the rate specified in the Operations Plan (ie 100,000 m3 day-I at South Tsing Yi and 10,000 m3 day-I at North of Lantau). This approach assumes alinear relationship between the rate of backfilling· operations and the resulting predicted elevations in suspended sediment concentrations at SRS; as described in Section 2.3;
The erosion values are based upon losses of fluid mud formed from the backfill material from the MBA-. Under worst case tidal conditions, fluid mud is completely eroded from the pit, and as the relationship between
. the volume of backfill material and volume of fluid mud generated is proportional to disposal rates presented in the EIA, erosion losses are also shown at 100%, 50%, 25% and 10% of maximum modelled rates;
To indicate the contributions to total SS concentrations at SRs arising from the highest impacting projects, sand dredging at the southern pit of the South Tsing Yi MBA is included with backfilling; although this combination is noted as being mutually exclusive in the Operations Plan as described in the ErA;
For sand dredging at the southern pit of the South Tsing Yi MBA, it was assumed that dredging would be of surface marine sand or bottom alluvial sand, but not both operations concurrently. Of these two dredging operations, the worst case impact (surface marine sand) was selected for inclusion in the barchart;
The WQOs or specific criteria used in Step 4 of the cumulative worksheet are indicated by a dashed line on the barchart for each SR (ie, 30% above the ambient value of 25 mg 1-1, or more conservative specified criterion, if applicable).
There are several key points illustrated by the data in the barcharts:
Although altering the rate of backfilling in the worst case scenario always reduces the cumulative SS concentration at SRs, in only two of the thirteen cases (Ma Wan Fishery (Figure 3.1g) and Kennedy Town WSD Intake (Figure 3.1m) does this measure reduce cumulative SS concentrations below the WQO or specified criterion;
For all SRs the greatest impact is caused by dredging of surface marine sands at the southern pit of the South Tsing Yi MBA.
Only at Lido Beach (Figure 3.1e) are worst case cumulative impacts expected to be within compliance limits as defined by the WQOs or specified criteria. At all other SRs, worst case cumulative impacts exceed WQOs or specified criteria.
ERM HONG KONG avn. ENGD"lEERING DEPARTMENT
11
l i
r~
r [
r [
[
c L [
[
[
[
[
L [
[
[
I

[
[
[
[
[
[
[
[:
[:
[:
[
L L [
a. Anglers Beach
-60.0
50.0
~ So 40.0 • l .. ¥ ~Dr.WSulph
'" 30.0
i _Or. STVaur1', 'ii c
20.0 ~ Erosion loss :! • iii c=::::J B'fill NL&STY
10.0 IZZZ:l Background
--. -wac 0.0
'00% "'" '''' , .. Backfilling Rate
b. Gemini Beach 50.0
50.0
~ So 40.0 • ~ ~Dr.·wsurph
~ 30.0 • _Or. STY surf. -". E • c:::=::J Erosion loss c ~ 20.0
• c:::=:J B'fill NL&5TY
.::i ~ Background
10.0 .... -wac
0.0 ,00% "'" '''' 11'%
Backfilling Rate
Figures 3.1 a and b Barcharts showing the effect of altering the rate ofbackfiIIing on cwnulative SS concentrations at Anglers and Gemini Beaches, respectively.

r
r
[
[
[
[
[
l [
[
[
L L L
c. Hoi Mel Wan 45.0
40.0
35.0 "'-.. g
30.0 • ~ _Cr. STY surf.
! 25.0
• c:::::J Erosion loss
~ 20.0
• c c:::::J B'tifl NL&STY ~ 15.0 ~ ~ mmz:J Background ~ 10.0
.. .. -wac 5.0
0.0 100% 50% 25 .. '0%
Bacikfllllng Rat,
d. Casam Beach
45.0
40.0
, 35.0 do _Or. STY surf. g • 30.0
~ c:::::J Erosion loss
¥ 25.0 ~
• c:::::J B'fill NL&STY
i 20.0 ~ • ~ Background c 15.0 ~ 1i .. .. -wac ~ 10.0
5.0
0.0 100% 50% 25" '0%
Backfilling Rat,
Figures 3.1 c and d Barcharts showing the effect of altering the rate of backfilling on cumulative SS concentrations at Hoi Mei Wan and Casam Beach, respectively.

r r r [
[
[
[
[
L [
l L L L L
e. Lido Beach
35.0
30.0
'-l'25,O • ~ .. ¥
20.0 _ Or, STY surf,
'" ! 1M c=:::::J Erosion loss
• c II .. 10,0 0 0
miZ!:Z! Background
5.0 - - -woe
0.0
""" Backfilling Rate
f. Tung Wan Tsal
50.0
70,0
.~
" 60.0
E-- .
50.0 • .. • _Or.C10&C11
¥ '" 40.0 •
~Or.WSulph
-~
" _Or. STY surf.
• 30.0 c oll
c=:::::J Erosion loss
" 0 20.0 c::=:::J B'f111 NL&STY .. ~ Background
10.0 - - -woe
0.0
"'A" "" "" " .. Backfilling Rate
Figures 3.1 e and f Bar charts showing the effect of altering the rate of backfilling on cumulative SS concentrations at Lido Beach and Tung Wan Tsai, respectively.
[
[
[
[
[
[
L [
[
L L L
[
90.0
80.0
70.0 .,... ;;, !. 60.0
• 1: § 50.0
" • ~ "'.0 ~ • c ;! 30.0 ~
'" '" ,0.0
10.0
0.0
1('0" 50%
60.0
50.0
'd. s 40.0 • ~ ;; ¥ " 30.0 • ~ ~ • c II 20.0 .. '" '" 10.0
0.0
100%
g. Ma Wan Fishery
"" 10" Backfilling Rate
h. Ma Wan Marlcutture
Backfilling Rate
_Or.C10&Cl1
~Or.WSulph
_ Dr. STY surf.
c:=::::i Erosion loss
c::::::=J B'fin NL&STY
~ Background
.. .... wac
_Or.C10&Cl1 8th
c:::::IFin C10&C11 8th
_Dr. STY surf.
c::::::=J Erosion loss
c::::::=J B'fin NL&STY
IiZZZ2I Background
.. .. -wac
Figures 3.1g and·h Bar charts showing the effect of altering the rate of backfilling on cumulative SS concentrations at Ma Wan Fishery and Ma Wan Mariculture, respectively.

[~
[
[
[
[
[
[
[
[
L [
L L
50.0
40.0
'd. E-• • 30.0 ~ ~ • ~ 20.0 • c ~ 1; ~ ~
10.0
0.0
''''''
90.0
SO.O
.:- 70.0
d. E ! 60.0
~ .. 50.0 • • ~ • i 40.0 ~ • c ~ 30.0 1; ~ ~ 20.0
10.0
0.0
''''''
I. Tslng VI Power Station
50% '50' Backfilling Rate
J. Kau VI Chau Fishery
50% ,,%
Backfilling Rate
,,%
'0%
~Dr.WSulph
_Dr. STY sUrf.
c:::=J Erosion loss
~B'fiIlNL&S1Y
IZ:ZiZZJ Background
.. .. -wac
_Or.C10&C11
~Or.WSulph
_Or. STY surf.
c:::::=J Erosion loss
c=:::::::J B'fill Nl&STY
~ Background
...... wac
Figures 3.n andj Bar charts showing the effect of altering the rate of backfilling on cumulative SS concentrations at Tsing Yi Power Station and Kau Yi Chau Fishery, respectively,
:~ ___ ,iii." , . . -- _. ---: : :-::",' '>:-'- L: 1 __ .• ,_- ~
ERM

r r
r r [
[
[
[
[
[
[
[
[
l L L L [
IZZZZI Dr. W Sulph
_Or. STY sUrf.
c=::J Erosion loss
c=::J B'fill Nl&S1Y
~ BaCkground
---wQC
I. QUeen Mary Hospital Intake, BO.O
70.0
.;:: 60.0 a S • 50.0 • ~ ¥
~Or.WSulph
or ~
40.0 _Or. STY surf.
:;; ,. 30.0 c
c::=:::J Erosion loss
II c::::::::JB'fi1i NL&STY $
" 20.0
" ~ Background
10.0 .. .. -woe:
0.0
1<'0" ,...
'''' , ... Backfilling Rate
Figures 3.1 k and 1 Bar charts showing the effect of altering the rate of backfilling on cumulative SS concentrations at Kennedy Town WSD Intake and Queen Mary Hospital Intake, respectively.

L
r r
r [
[
[
[
[
L [
[
L L L L J
m. Wah Fu Estate Intake
~.0r---------~----------------------------------------,
50.0
" i i' 40.0
1 IZZZZI Dr. W Sulph
~ 30.0 _Or.S1Ysulf
~ c::::::J Erosion loss
~ 20.0
• r;::::=:J B'till NL&STY
~ 10.0
- - -wac
0.0 Backfilling Rate
Figure 3.1 m Bar chart showing the effect of altering the rate of backfilling on cumulative SS ccncentrations at Wah Fu Estate Intake.

I
r r r r r r [
[
[
[
[
L [
l L L L L [
3.2.2
3.2.3
At most SRs, apart from the Kennedy Town WSD Intake and the Ma Wan Fishery, backfilling at 100% of the Operations Plan rate (100,000 m3
day-I at South Tsing Yi and 10,000 m3 day-I at North of Lantau) will not cause WQOs or specified criteria to be exceeded. At both the Kennedy Town WSD Intake and Ma Wan Fishery, the concentration by which the WQO or specified criteria is exceeded is slight and due primarily to the additional effects of erosion rather than disposal plumes.
The barcharts graphically present a pivotal issue described in the EIA. The Operations Plan's rate of backfilling (100,000 m3 day-I at South Tsing . Yi and 10,000 m3 day-I at North of Lantau) was set to avoid causing unacceptable impacts to SRs from 55 concentrations resulting from backfilling activities. However, as these charts illustrate, reducing the rate of backfilling specified by the Operations Plan to 50%, 25% or even 10% makes little difference in the cumulative 55 concentrations predicted at SRs. While reducing the rate of backfilling results in a slight decrease in predicted 55 concentrations at SRs, the decrease is not substantial enough in any of these examples to bring cumulative 55 concentrations within compliance levels.
Restrictions on Backfill Material Type
As noted in the EIA Operations Plan, the material used to backfill the North of Lantau MBA will be mechanically dredged. The South Tsing Yi MBA will be backfilledwith a mixture of hydraulically- and mechanically- dredged material. Mechanically-dredged material has a lower water content and greater stability than hydraulically-dredged material, therefore, less material is lost to the water column during backfilling with mechanically dredged mud. The ratio of the two types of materials used to backfill the South Tsing Yi MBA will probably be 1:1; however to provide a conservative estimate, 55 concentrations at SRs are given for the worst case scenario of 100% hydraulically-dredged material.
To reduce exceedances where they occur, therefore, an effective mitigation measure may involve increasing the proportion of mechanically-dredged material used for backfilling. The effect this will have on 55 concentrations at the SRs may not be determined quantitatively as such scenarios have not been modelled. It is suggested, therefore, that this. mitigation measure be employed in conjunction with water quality monitoring as discussed below in Section 4.
Tidal. Conditions for Backfilling
The CEAM predicts impacts to SRs under dry season spring tide conditions, and is therefore, as described in Section 2.1, representative of the worst case impacts associated with backfilling. Should unacceptable impacts arise from a combination of projects, it may be possible to restrict the timing of backfilling to more favourable tidal periods. That is, if exceedances are predicted by CEAM for a certain combination of projects operating at a certain rate, an effective mitigation measure may be to alter the timing of the backfilling operation to a different part of the tidal cycle. Please note that the relative impacts of dry season spring tides, dry season neap tides, wet season spring tides and wet season neap tides are described for Scenario 4 (backfilling of 200,000.m3 day-I at South Tsing Yi and 10,000 m3 day-I at
ERM HONG KONG CIVIL ENGlNEERfl'l'G DEPARTMENT
12

3.2.4 .
3.2.5
3.3
North of Lantau) in the EIA (Section 3). It is recommended that this option be combined with monitoring of water quality at SRs, which is described below in Section 4.
Silt Curtain
Should a particularly high or prolonged impact at a SR be predicted by CEAM, which may be damaging to machinery or plant, deployment of a silt curtain around that SR may be reqUired. As described in the EM&A Manual, of the SRs considered, the Kennedy Town WSD intake is the most .sensitive to 55 concentrations, having a tolerable limit cif only 20 mg I-I, and it is envisaged that this would be the only SR at which a silt curtain would be cost-effectively deployed, should the need arise.
."
Permit Conditions for Other Concurrent Projects
As indicated by Figures 3.1a through m, backfillIng is often a minor contributor to cumulative 55 concentrations at SRs. Controlling the cumulative impact to SRs by changing the rate, material type or timing of backfilling will often be ineffective in reducing impacts to acceptable levels. Permit conditions for future dredging/ disposal projects would empower FMC to control the operation rates of future' projects based on predicted cumulative impacts and enable water quality impacts to be more effectively managed, in a cumulative sense.
EM&A MEASURES
To manage cumulative impacts such that they are maintairied below WQOs or specified criteria, EM&A measures in addition to those contained in the EM&A Manual for the North of Lantau/South Tsing Yi MBAs have been developed. Again, a flexible approach has been adopted implementation is at the discretion of the Site Manager in conjunction with EPD and FMC.
These EM&A measures are designed to supplement the EM&A Manual for backfilling alone by verifying that mitigation measures selected for any identified cumulative impact are successful in reducing 55 concentrations at SRs.
The EM&A measures to achieve these objectives are:
Increasing the frequency of sampling :at SR water quality monitoring stations which are predicted to experience unacceptable 55 concentrations as a result of cumulative impacts identified through the CEAM; and
Decreasing the frequency of sampling at SR water quality monitoring stations which are not predicted to experience unacceptable 55 concentrations.
Increasing the frequency of sampling at SR water quality monitoring stations should be considered if CEAM predicts that these SRs will be impacted. In order to accommodate this,sampling stations at SRs which are not predicted to be impacted may be sampled less frequently. The sampling frequency given in the EM&A manual, ie 3 times per week, should be maintained at all stations. Any changes to the EM&A programme will be agreed with EPD before implementation.
ERM HONG KONG CIvIL E'NGn-ffiERlNG DEPARTMENT
13
r r
r r c [:
[
[
[
[
[
[
l L L
L

I r [
r r r c c [
[
r [
[
[
[
[
L L L L r
4
4.1
4.2
INTEGRATION OF CEAM WITH EM&A PROGRAMMES
INTRODUCTION
This section describes the integration of information from various sources to manage environmental impacts associated with backfilling at North of Lantau and South Tsing Yi MBAs in light of potential cumulative impacts from concurrent projects. The following information sources will be discussed:
Information provided by the EIA for backfilling of North of Lantau and South of Tsing Yi MBAs alone, ie, the Operations Plan and EM&A Manual;
Information provided by the CEAM database and worksheet;
The CEAM mitigation and EM&A options; and
EM&A data from other concurrent projects in the study area.
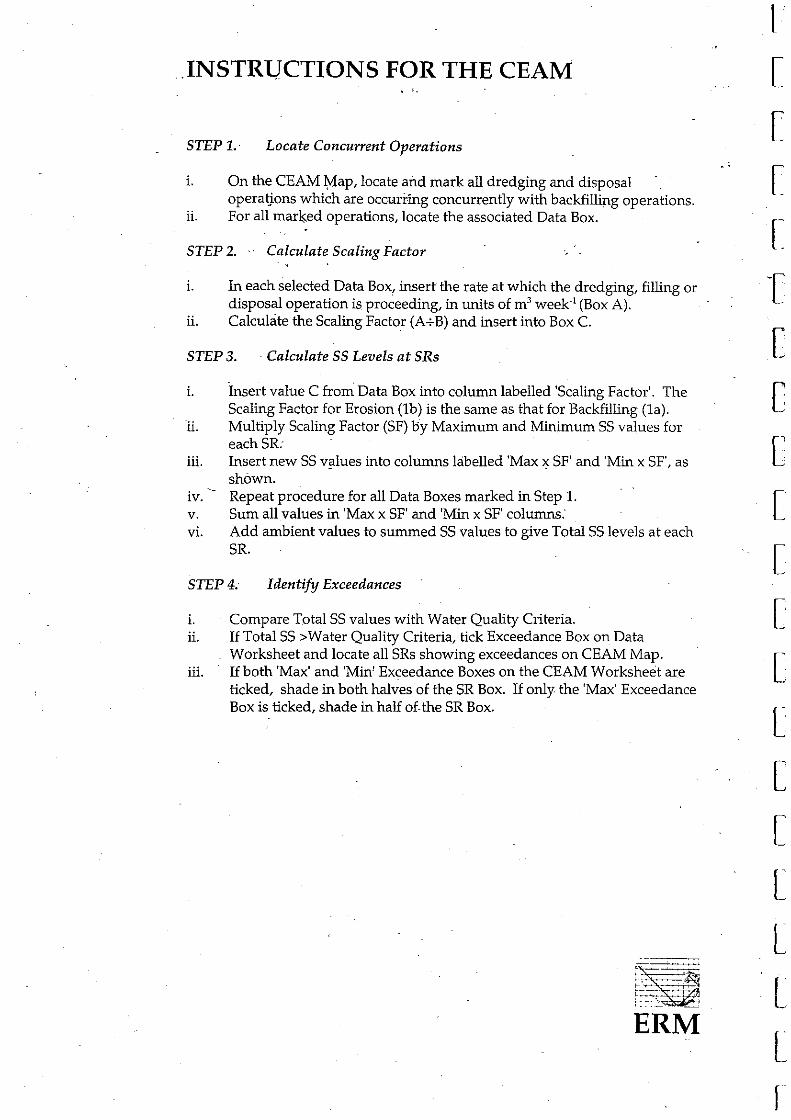
CONCEPTUAL MODEL
A conceptual model of the generation and interaction of information from the four sources listed above is shown in Figure 4.1a, in the form of a flow chart.
If backfilling of North of Lantau and South Tsing Yi MBAs is proceeding concurrently with other projects (Decision ,Point Dl), the CEAM database and worksheet is used to predict impacts at SRs and determine their acceptability (Action points AI and A2). The next step is to gather EM&A data from backfill monltoring programmes and any other ongoing projects and evaluate whether these data are relevant to management of 55 concentrations at SRs (D2). Features such as the location of the monitoring stations used (eg, the number of CEAM SRs monitored by other projects) and the frequency of sampling may be used to judge the usefulness of the EM&A data.
If relevant data are found, revisions to the CEAM based on actual, measured water quality conditions should be considered (A7). These data would be useful in providing data on cumulative impacts, for a known set of concurrent projects and would assist in the evaluation and refinement of CEAM predictions. For example, a mitigation option listed in Section 3 is to limit the tidal conditions under which backfilling occurs such that it does not take place when impacts will be greatest (ie, not on dry season spring tides). Monitoring data from other tides may allow the difference between worst case and non-worst case conditions to be calibrated. If available concurrent project EM&A data are not relevant to the assessment of 55 concentrations at SRs (D2), revisions to the CEAM database should still be considered based upon backfill EM&A data (A7).
After EM&A data have been compiled, the Site Manager, in conjunction with EPD and FMC, should determine whether itis more appropriate to use the CEAM, the EM&A data, or some combination of the two (A8). Selected data
ERM HONG KONG CML ENGINEERING DEPARTMENT
14

4.3
should then be used to determine whether 55 concentrations at SRs are unacceptable (D3) and thus, whether additional mitigation measures and modifications to the Operations Plan and EM&A programme are required (A9 and A10). Should any combination of backfilling at South Tsing Yi and North of Lantau MBAs and concurrent projects be found to be acceptable in terms of compliance with WQOs and specified criteria (D3), the standard Operations Plan and EM&A Manual for the ErA is sufficient to maintain compliance (All and A12).
If there are no other dredging/ disposal projects operating concurrently with backfilling (01), EM&A data gathering through the backfilling EM&A programme should be compiled and. examined to determine if revisions to the CEAM database are necessary (A4 and A6). Based on the findings of the EIA, environmental effects due to backfilling alone are acceptable, therefore, if no other projects are operating concurrently, backfilling may proceed using the standard Operations Plan and EM&A Manual (All and A12).
SELECITON OF CEAM MiTIGATIONAND EM&A OPTIONS
The CEAM provides a list of mitigation and EM&A options which may be utilized singly or in combination to reduce cumulative impacts arising from any combination of dredging/ disposal projects in the study" area. The most appropriate options to be selected will depend upon the degree of impact and other pr:oject constraints. Based upon current information, three levels of concern have been identified and are described below, along with recommendations on the measures to be taken.
The first level of concern arises from impacts which are predicted by the CEAM to be within the WQOs or specified criteria. Under such,conditions the standard Operations Plan and EM&A programme is appropriate and no modifications are necessary to maintain compliance.
The second level of concern arises when exceedances of WQO at some SRs are predicted by the CEAM, as indicated by the minimum and/ or maximum exceedance boxes on the worksheet. The most appropriate mitigation measures for these impacts would be to change the tidal conditions under which backfilling occurs, or change the type of material to be disposed such that the proportion of mechanically-dredged material is increased. If it is considered necessary, mitigation could include controlling the rate of backfilling and/ or the rate of operation of any other active projects for which control by FMC is possible. As CEAM provides a breakdown of the contributions to total 55 concentrations from each active project, it provides a tool for the management of impacts arising from these projects should opportunities for control of ongoing projects emerge.
For SRs where exceedances are detected, the frequency of water quality monitoring at those SRs could be increased to further explore the extent of impacts. To ensure the cost effectiveness of monitoring, increased sampling at impacted SRs may be offset by decreasing the sampling frequency of unimpacted SRs. Any changes to the EM&A programme will be agreed between the Site Manager, EPD and FMC before implementation. Once changes are agreed, the Operations Plan and EM&A Manual should be modified to incorporate these mitigation and EM&A options. Monitoring data from backfilling should be checked against the CEAM predictions following the implementation of mitigation options and further changes to
ERM HONG KONG CIvrr. ENGINEERING DEPARTMENT
15
1
r [
[
r r [
[
[
[
[
[
[
[
[
[
l [
[
L r

I
r
r r r [
c
[
[
[
[
[
[
[
L L L L ]
A7
AS
~p~~~i~ ~D>l __ ~ ____ ~N~O~ ______________ _,
ACTIVE?
. YES Al
USE CEAM DATABASE TO PREDICT
CONCENTRA nONS AT SRs FROMALt
ACfIVE PROJECTS
.A2
SUM ACTIVE PROJECTS + BACKFILLING +
AMBIENT + EROSION TO DERIVE CEAM
PREDICIlONS
A3
CHECK EM & A DATA FROM BACKFILLING
AND OTHER PROJECTS
D2
ARE EM&ADATA
FROM OTHER PROJECTS ,>-_.!:N:::O:...-_~ RELEVANT TO CEAM 1
ASSESSMENT OF SRs
?
y~
CONSIDER REVISIONS TO
CEAM DATABASE
COMPARE EM&ADATA
AND CEAM PREDICTIONS AND SELECT MOST
APPROPRIATE DATASET
AS
CHECK EM & A DATA FROM BACKFILLING
I
CHECKEM&ADATA FROM BACKFILLING
CONSIDER REVISIONS TO
CEAM DATABASE
lr-------y-~-------«~('~>-------~N~O~--------_, UNACC~PTABLE 1 MODIFY STANDARD
EIA OPERATIONS PLAN A9 &EM&AMANUAL
SELECT APPROPRIATE MITIGA nON & A 10
EM & A MEASURES
I BACKFILL
'----------~
STANDARD EtA OPERATIONS PLAN FOR BACKFILLING
STANDARD ElA EM&AMANUAL
FOR BACKFILLING
I
All
A12
A4
A6
ERM Hong Kong, Ltd
6th Floor FIGURE 4.1a - USE OF CUMULATIVE EFFECTS ASSESSMENT
MANUAL (CEAM) HecnyTower 9 Chatham Road Tsimshatsui, Kowloon Hong Kong

[
[
r r I r [ Table 4.3a
r F [
[
[
[
L [
L L L L L
the Operations Plan and EM&A Manual for the EIA be made as appropriate.
The third level of concern arises from predictions by CEAM of either exceedance at a large proportion of the SRs, or predictions by CEAM that some SRs will be heavily impacted. The most appropriate mitigation option under these' conditions is to reduce the rate of backfilling, and to halt operations altogether if necessary. Although halting backfilling is the most appropriate mitigation measure in these circumstances, as described in Section 3.2.1, this in itself will not bring cumulative impacts into compliance. Monitoring should proceed as described in the previous paragraph and the Operations Plan and EM&A Manual for the ErA should be modified accordingly.
The three levels of concern and guidelines for mitigation and EM&A options are summarised in Table 4.3a, below.
Summary of guidance for the selection of mitigation and EM&A options for CEAM.
Level of CEAM predictions Appropriate Appropriate EM&A Concern Mitigation Options Options
1 WQO not exceeded · Operations Plan Operations Plan · EM&A Manual EM&AManual
2 WQO exceeded at some SRs · Backfill at more Monitor impacted favourable tides; SRs more
· Backfill with a. frequently; higher percentage Monitor-of grab dredged unimpacted SRs material; less frequently.
· Make minor changes to the rate of backfilling
3 WQO exceeded at most SRs or · Make major Monitor impacted at some SRs which are heavily changes to the rate SRs more impacted of backfilling or frequently;
cease operations- Monitor · Silt curtain at unimpacted SRs
Kennedy Town less frequently.
ERM HONG KONG Crvn. ENGINEERING DEPARTMENT
16