Embed Size (px)
Citation preview

ความสัมพันธทางการเมือง บรรษัทภิบาล และ ผลประกอบการของบริษัท
นาย ศุภดนัย ศุภผลศิร ิ
วิทยานิพนธนี้เปนสวนหน่ึงของการศึกษาตามหลักสูตรปริญญาวิทยาศาสตรมหาบัณฑิต สาขาวิชาการเงิน ภาควิชาการธนาคารและการเงิน
คณะพาณิชยศาสตรและการบัญช ี จุฬาลงกรณมหาวิทยาลัย ปการศึกษา 2552
ลิขสิทธิ์ของจุฬาลงกรณมหาวิทยาลัย

POLITICAL CONNECTION, CORPORATE GOVERNANCE
AND FIRMS’ PERFORMANCE
Mr. Subhadanai Subhapholsiri
A Thesis Submitted in Partial Fulfillment of the Requirements
for the Degree of Master of Science Program in Finance
Department of Banking and Finance
Faculty of Commerce and Accountancy
Chulalongkorn University
Academic Year 2009
Copyright of Chulalongkorn University


ACKNOWLEDGEMENTS
I would like to express my gratitude to the persons I greatly feel indebted. The
first among them is Associate Professor Dr. Sunti Tirapat who kindly accepts to be
my advisor and gives lot of invaluable advice and supervision throughout the conduct
of this study. I feel obliged to thank Mr. Chaiyapruck Saetung for his impressive
assistance. His expertise on computer database fulfills my aspiration to construct the
political connection database. My sincere appreciation also goes to Associate
Professor Dr. Sothitorn Mallikamas and Dr. Wongkot Vijacksungsithi – the thesis
committee, for their worthy suggestions. I am also indebted to all the researchers
whose academic works are quoted by me in this study, especially Mr. Masami Imai,
Mr. Pramuan Bankanwanicha and Ms. Yupana Wiwattanakantang. The papers by
these knowledgeable scholars formulate a concrete base for my study.
In addition, I would like to give special thanks to my friends in the MS
Finance program for their help, support and friendship along studying in this program,
particularly for Mr. Kittituch Tanirandorn, Mr. Chaiamorn Trakarnkoolapun and Miss
Gunyarat Supawimon.
Last but not least, I would like to confer my deepest gratitude to my beloved
family for their support and understanding from the very outset of my study until the
completion.

CONTENTS
PAGE
Abstract in Thai ……………………………………………………………………. iv
Abstract in English ………………………………………………………………… v
Acknowledgements ………………………………………………………………... vi
Contents ...…………………………………………………………………………. vii
List of Tables …………………………………………………………………........ ix
List of Figures ………………………………………………………………........... xi
Chapter I: Introduction …………………………………………………………….. 1
Background of the study …………………………………………………1
Statement of problem ……………………………………………………… 2
Objectives …………………………………………………………………. 3
Scope of the study ………………………………………………………… 3
Contribution ……………………………………………………………….. 3
Organization of the study …………………………………………………. 4
Chapter II: Literature Reviews …………………………………………………….. 5
The influence of political connection ……………………………….......… 5
Corporate governance and performance of firms ……………………..…... 6
Firm-specific return variation, the probability of informed-base
trading and performance of firms ………………………………………..... 7 Chapter III: Sample and Data Description ………………………………………… 9
Sample and data ………………………………………………………….... 9
Sources of data …………………………………………………………….. 9
Identification of politically connected firms………………………............ 10
Hypotheses development …………………………………………………. 12
Chapter IV: Methodology …………………………………………………………. 14
Data description …………………………………………………………… 14
The reexamination of the effects of political connections ……………….... 23
The coup study………………………………………….....……………….. 24
Political connection, governance, and firm specific information ...……….. 27
Chapter V: Empirical Result ……………………………………………………… 33
viii
PAGE
The reexamination of the effects of political connections ………………... 33
The coup study ...………………………………………...………………… 49
Political connection, governance, and firm specific information .………... 67
Chapter VI: Conclusion …………………………………………………………… 81
References …………………………………………………………………………. 83
Appendices ………………………………………………………………………… 88
Appendix A: Supplementary explanation for political connection
matching procedure and judgment ...………………………... 88
Appendix B: Control variables used in the study ………………………...…….. 98
Appendix C: The books providing the information for indirect
connection used in this study ..….………………………....... 99
Appendix D: Questions for corporate governance index construction …...… 101
Appendix E: The result from using SH-BD Cooperation for the political
connection definition ..………………………………………. 104
Biography ………………………………………………………………………….. 108

ix
LIST OF TABLES
PAGE
Table 1: Sample of politically connected firms ………………………………...…….. 15
Table 2: Descriptive Statistics ….................................................................................... 19
Table 3: The correlations between idiosyncratic volatilities, CGI, and the components of
CGI ..…………………………………………………………………………. 22
Table 4: Benefit of political connection tested by Fama-French 3 Factors (1993)
model ...………………………………………………………….................... 35
Table 5: The political connection and the performances of the firms ………………… 38
Table 6: The political connection and the performances of the firms –
Thaksin’s regime and non-Thaksin’s regime ………………………………... 42
Table 7: The political connection and the performances of the firms –
loosen definition of political connection & separate regime ...………………. 47
Table 8: The political connection and the performances of the firms –
representatives of coalition and opposition parties ………………………...... 49
Table 9: The political connection and the buy-and-hold stock returns after
the coup – power gainers’ side ........................................................................ 52
Table 10: The political connection and the buy-and-hold stock returns after
the coup – power losers’ side …………………………………….….............. 55
Table 11: The political connection and the buy-and-hold stock returns after
the coup – representatives of coalition and opposition parties ….………....... 56
Table 12: Event study on coup d’état on September 2006 ............................................ 60
Table 13: Event study on the national election on December 2007…………………… 64
Table 14: The political connection, corporate governance and the performances
of the firms ....................................................................................................... 69
Table 15: The political connection, corporate governance and the performances of the
firms – CGI components ..……………………………………………………. 76
Table A1: Condition of connection used in matching procedure for each
connection order ….…………………….……………………………………. 96
Table A2: Component for each definition ………………………………………….… 96

x
PAGE
Table A3: List of control variables and descriptions …………………………………. 98
Table A4: Numbers of politically connected firms – Yearly …………………………. 104
Table A5: Benefit of political connection tested by Fama-French 3 Factors (1993)
model ……………………………………………………………………….. 105
Table A6: The political connection and the performances of the firms .…………….... 106
Table A7: The political connection and the performances of the firms –
Thaksin’s regime and non-Thaksin’s regime .…………………………….... 107

xi
LIST OF FIGURES
PAGE
Figure 1: SH-BD Cooperation ………………………………………………………... 26
Figure 2: Three diagram of trading process…………………………………………… 30
Figure 3: Cumulative abnormal returns for politically connected stocks around 2006
Coup event ..…………………………………………………..…………….. 62
Figure 4: Cumulative abnormal returns for politically connected stocks around 2007
national election …………………………………………………………….. 66
Figure 5: The diagram indicating the identification of the political connection ……… 89
Figure 6: The big picture of matching process ………………………………………... 93
Figure 6A: Details of Step 2A in Figure 6 …………………………………………….. 94
Figure 6B: Details of Step 2B in Figure 6 …………………………………………….. 95
Figure 7: The judgment of political connection ……………………………………….. 97

CHAPTER I
INTRODUCTION
1.1 Background and problem review
In the competitive world, firms try to maximize their profits in the long run by
both developing their ways of doing business and even creating political advantages,
which are usually established through connections with politicians. Does political
connection matter? Several researchers around the world are interested in this topic.
Faccio (2006) indicates the evidence of the benefits received from political connection.
Many researchers, such as Fisman (2001), Johnson and Mitton (2002), Goldman et al.
(2006) and Bertrand et al. (2008), provide the evidences of the benefits from connection
in several countries, both developed and emerging ones. For Thailand, Bunkanawitcha et
al. (2008) and Imai (2006) find strong evidences of politically connected favors through
many accounting and stock performances. Dusadee (2007) provides the mixed result. In
sharp contrast, Udomworarat (2005) shows far less of the benefits generated from
political connections. So far, the effect of political connection in Thailand is
inconclusive.
The inconclusive result in Thailand may arise from two noteworthy causes. One is
the difference in period focused by preceding studies which, perhaps, serve the disparate
evidences. The other is from the omission of some relevant control variables such as
corporate governance level and information flow. This conjecture is influenced from the
works of Durnev et al. (2004), Ferreira et al. (2007) 1, Gompers et al. (2003) and Core et
al. (2006) 2 which show that the firms with higher governance level and more openness,
on average, will outperform the firms with lower ones. In Thailand, particularly,
politically connected firms may have different standards of governance and degrees of
openness from the non -politically connected firms. On the one hand, they could have
1 These two papers imply that firm-specific return variation, as the proxy of information flow, causes
improvement in the firm’s performance in term of stock prices and quality in decision-making process. 2 Gomper et al. (2006) find that firms with strong shareholder rights, on average, can have higher risk-
adjusted stock returns, Tobin’s Q, profitability and sales growth than those of firms with weak shareholder rights. Core, Guay and Ructicus (2006) extend the understanding from Gompers et al., and they find the evidence that weak shareholder’s rights are associated with lower operating performance.

2
higher governance standards and information flow 3 because managements of these firms
try to ensure the public keeping eyes on them that they follow the good governance and
incur no suspicious activities or transactions. The incentive to do so is generated by the
belief that this improvement will create trustworthiness to firms, managements and the
connected politicians in term of openness, good governance, and transparency. On the
other hand, the politically connected firms could also have poorer governance and
openness. Probably, politically connected firms find no incentive to invest their resources
for establishing the better governance standards because they feel that the political
connections in hand are sufficient to provide satisfactory performances. Another
viewpoint, in the radical view, is that they may not want to develop good governance and
openness at all, because, in this aspect, the better governance and openness are more or
less the obstacles against the reaping of benefits from connection as well as creating the
transactions which undermine minority shareholders’ interests. Therefore it is interesting
to investigate the relation between political connection and governance. In one extreme, it
might be the case that instead of political connection, the better in governance level and
information flow are the explanations of the different in performances between these two
groups.
The aim of this study is to reinvestigate the performances of politically connected
firms between 1999 to 2008 period. This lengthened period allows us to investigate the
effect of the 19th September 2006 coup to politically connected stocks. In addition, this
paper control for the effect of corporate governance level and information flow in
examining the effect of political connection. This study will provide further
understanding on effects of political connections. Moreover, it will propose a basis for
improving laws and regulations in order to promote the fair competition among firms in
Thai capital market. Also, the insight from the study is determined to be useful for the
corporate managements who are pondering about creating or developing the governance
standards for the firms.
1.2 Statement of problem
3 In this study, the term openness and information flow will be used interchangeably.

3
The exploited benefits contributed from political connections can distort the
decision making of the investors, misallocate the resources of capital market and
discourage the fair competitions. These political rents also hinder the efficient
development of the country as the benefits of society are abandoned. The preceding
studies on political connection in Thailand present somewhat inconclusive evidences.
Probably, these researches overlook some relevant variables, such as the corporate
governance level and information flow, which are arguably the performance generators as
seen by a number of researchers. The main research issue is whether the politically
connected firms outperform the non-politically connected firms after controlling for
corporate governance level and/or information flow.
1.3 Objectives
The study has two main objectives as follows:
- To reexamine the empirical evidence of politically connected firms in
Thailand by extending the study period to cover the recent coup so as to
provide the opportunity to gain further insight of the effect of political
connections.
- To investigate on whether corporate governance and information flow
practically bring about the outperformance of the politically connected firms.
1.4 Scope of the study
The sample contains cross-sectional data of firms listed on the Stock Exchange of
Thailand (SET) during the period of a number of Prime Ministers, i.e., Chuan Leekbhai,
Thaksin Shinnawatra, Surayud Chulanont and Somchai Wongsawat (1999-2008).
Approximately, the sample will extend to 450 firms.
1.5 Contribution
This paper will reinvestigate the benefits the business firms receive from the
political connection in Thailand. The results could indicate the growth of performances
resulting from these connections. The study also provides various more in-depth studies
by separating period into two regimes, loosening definition of political connection,

4
showing the results from two different sources of political connections, and re-classifying
the representatives to ones from coalition parties and from opposition parties.
Furthermore, the effect of political connection on the occurrence of the 2007 coup will be
shown. And after controlling for the corporate governance level and information flow of
the firms, we will realize if the benefits from political connection can be sustained and
how these added control factor affect the performances. The insight obtained from the
latter question will bolster the decisions relevant to the development of the firms’
corporate governance standards and direction of the regulation enactment. Last but not
least, the way this paper handles with the collection and analysis of political data,
particularly for the matching process, is, hopingly, deserved some value as well.
1.6 Organization of the study
This research will be organized as following. Chapter 1 shows the background of
the problem, the issue to be studied, the objectives and scope of this study. Chapter 2 is
the literature review. This chapter details the preceding researches on the political
connection, the corporate governance, the idiosyncratic volatility and information flow
that are relevant to the study. Chapter 3 presents the statistic description, scope and the
source of data. Chapter 4 explains the methodology of this research. Chapter 5 represents
the results and interpretations from the estimation in Chapter 4. Chapter 6, which is the
last one, sees the conclusion of study.

CHAPTER II
LITERATURE REVIEWS This chapter presents reviews of related literature and previous studies
engendering the framework of this study. Related literature review will be separated into
3 parts; the influence of political connection, corporate governance and performance of
firms and firm-specific return variation, the probability of informed-base trading and
performance of firms
2.1 The influence of political connection
Even in the developed country such as United States, Germany, and France, the
benefits from economic rents also are presented through several accounting
characteristics and market performances of the companies.4 Cooper, Gulen, and
Ovtchinnikov (2008) construct variables that measure the extent of firm support for
candidates. They find that these measures are positively and significantly correlated with
the cross-section of future returns. The benefits of political connections seem more
common in Asia, where the cronyism-capitalism is not a new issue. The business entities
often run their operations with some supports from their connected network.5 Fisman
(2001) and Johnson et al. (2002) show that connections with the most important political
leaders contribute some values to the firms. However, they also suffer more when the
connected politician’s power declines. In China, where cronyism is called guanxi, there
are a number of researchers focusing in this field such as Cheung, Lau, and Stuaraitis
(2008) who find that firms controlled by central government benefits from transactions
dealt with their central government state-owned enterprises.
Thailand is another country having ability to supply the ideal sources for studies
on political connection. For long, the country is ranked from the indexers around the
world as a highly corrupted one.6 (The ranking indices are estimated from both public
and political sector.) These indices indicate the low level of transparency of Thailand's
4 See for examples on Cooper, Gulen, Ovtchinnikov (2008); Goldman, Rocholl, So (2006); Knight (2006) for
United States; Niessen, Ruenzi (2007) for Germany, Bertrand, Schoar, Kramarz, Thesmar (2004) for France, Dombrovsky (2008) for Latvia.
5 See Fisman (2001) and Johnson, Mitton (2002) for example. 6 It is interpreted from the value provided in the International Corruption Perception Index -
http://www.transparency.org

6
political processes. Hence, it is sensible to hypothesize that while the economic rents are
able to occur without many of obstacles, the political connections could create values.7
As for the studies in Thailand, Udomworarat (2005) investigates the politically
connected firms from 1993 to 2004 by using cross-section replicated portfolio and Fama-
French three factors model (1993). She focuses on such accounting variables, stock
performances, and event studies on the election dates. However Udomworarat (2005)
does not find such strong evidence of the outperformance from the connected ones. Imai
(2006) defines the benefit received as the better ROA and profitability ratio. In his study,
the regression models are run with the data in the period of Thaksin Shinawatra’s
government. Another acknowledged work is created by Bunkanawitcha et al. (2008) who
concentrate on the firms which are both connected with the cabinet members and owned
by Thai tycoon families. The firms connected with the government of Thaksin
Shinawatra are once again explored. The study finds the evidences that the connected
firms earned the higher market shares, abnormal returns, and favorable public policies
from their connection after the tycoons took over the national office in 2001.
2.2 Corporate governance and performance of firms
In the field of corporate governance, Gompers, Ishii, and Metrick (2003) provide
the ideal support evidence indicating the superior performance from having the better
governance standard. This paper finds the evidence that good governance could create
value. By creating the governance index to proxy for the level of shareholder rights
during the 1990s, after control for the market exposure, size, book-to-market, and
momentum effects, the researchers find for the studied period that firms with strong
shareholder rights (which they call them “democracy firms”) have risk-adjusted stock
returns that are 8.5% higher per year than those of firms with weak shareholder rights.
Gompers et al. (2003) also finds the evidence of superiors on the Tobin’s Q, profitability
and sales growth implicitly coming from the higher in the firm’s governance level. Core,
Guay and Ructicus (2006) extend the understanding from Gompers et al. (2003), and they
7 Although, Faccio (2006) illustrates the moderately restricted level of regulations in Thailand, these
restrictions are still being doubted of the effectiveness of appliance, the level of adoption and its transparency. For example, Thailand has the underdeveloped nominee holding legislation, which could enhance the manipulation on stock prices, illegal concealment, and money laundering. Another example, Bunkanwanicha and Wiwattanakantang (2008) illustrate the events of modification on public policies, which unfairly facilitated the ministers’ firms.

7
find the evidence that weak shareholders’ rights are associated with the lower operating
performance. However, their paper disagrees with the finding of GIM (2003) in the point
that weak governance causes weak stock returns. Bebchuk et al. (2009) is another paper
that extends the finding of GIM (2003), by refining the selection of the components of the
governance index. They find that the increases in the index level (more is worse) (whose
components are considered relevant with the stock returns and Tobin’s Q) are
monotonically associated with economically significant reductions in firm valuation,
large negative abnormal returns as well as Tobin’s Q during the 1990-2003 period.
2.3 Firm-specific return variation, the probability of informed-base trading and
performance of firms
The finding of Durnev, Morck, and Yeung (2004) support the argument implying
that a firm-specific return variation is due to informed trading, and that share prices are
actually closer to fundamental values where firm-specific return variation is higher.
Moreover, this proxy of informed trading still causes improvement in the stock prices.
With another interpretation of the finding is that firm specific return variation is
verification that more informative stock prices facilitate more efficient corporate
investment. Consistently with Durnev et al. (2004), the work of Ferreira and Laux (2007)
denote that firms with fewer antitakeover provisions indicating the more openness,
display higher levels of idiosyncratic risk which was after proved to be as the proxy of
information flow, trading activity, and information about future earning in stock prices.
The probability of informed-base trading, another variable that is hypothesized as a proxy
of information flow, is also counted in to check for consistency with result from using the
idiosyncratic volatility. Like others, this paper finds a positive correlation between
idiosyncratic risk and decision-making quality. This study also decomposes the volatility
into governance related and non-governance related components, and find that it is
mainly non-governance related idiosyncratic volatility that is associated with the quality
of investment decision making. This finding means that it is information flow more than
governance that is the determinant of the practical business outcome.

8
Thailand is a country which has been regarded as a low transparent, inadequate investor
protection and highly corrupted one for a long time.8 However, the evidences provided
by several researchers focusing on the political connection in the country still are
inconclusive. Some point out that Thai politicians exploit benefit by using their political
offices to unfairly support their connected firms, while the others do not find such
evidences. This discrepancy may result from lack of consideration and omission of
factors that are actually relevant to the performances by the former researchers.
The literatures described above consistently show us that the better governance
and more openness could contribute to the outperformance of the firms. Thus, in this
study, governance level and information flow of firms will be taken into account and
recognized as, possibly, sources of performances as well as the political connection. Then
the political connection will be reinvestigated. And we shall see whether after controlling
for information flow and governance level, the more conclusive results appear.
8 See International Corruption Perception Index, Castro et al. (2004), Haley (2000), Achavanuntakul (2006),
Phongpaichit et al. (2005), Khan et al. (2000), and Piriyarangsan (2004) for examples.

CHAPTER III
SAMPLE AND DATA DESCRIPTION
3.1 Sample and data
Total samples are all the firms listed in the Stock Exchange of Thailand during
1999-2008, excluding the firms with incomplete or unavailable data and firms with
negative equity in the Stock Exchange of Thailand. There are 3,492 firms-years included
in the samples.
3.2 Source of data
Financial data
Financial data is obtained from two sources. The first is SETSMART data base
which provides the data of Thai listed firms. The accounting data are taken from this
source since 1998 to 2008. The second is DATASTREAM data base. The weekly and
monthly total returns on stocks and SET index and risk free rates (Thai interbank rate) are
collected from DATASTREAM data base in the same time period as precedent source as
well as the accounting data.
Ownership and management data
The major shareholders’ names and the board of directors’ names are extracted
from SETSMART online data base created by the Stock Exchange of Thailand (SET). By
going through the data base, one could direct to the detailed ownership data that include
the names of shareholders whose stockholding is 0.5% and more. For the list of major
shareholders of the firms, the earliest reported data in a year will be used (which are often
around the first quarter). The management names provided by SETSMART are limited to
the top executives in each firm; the chairman, members of the board of directors and the
chief executive officer. All board of directors who have enrolled in the firms in that
particular year will be used.

10
Politicians’ data
Members of House of Representatives and cabinet members have unequal
political power and influence. The cabinet members have more chances and direct power
to support their connected firms such as through policies and concessions. This paper
generally categorizes the politicians into two groups; the cabinet member (CAB) and
members of House of Representative (REP).9 The data of the cabinet members are
obtained from the website of the Secretariat of the Cabinet. (www.cabinet.thaigov.go.th)
and the data of representatives are collected from the parliament library and the website
of the parliament (www.parliament.go.th).
3.3 Identification of politically connected firms
Basically, this paper regards a firm to be a politically connected one if it is
connected to a politician who has been in office for at least six months that year. The
procedures to identify political connection could be summarized into five main steps.
First, the family names of politicians, which are categorized as the cabinet member and
the representative, and dates that they take office during 1999 to 2008 are collected.
Second, the political connection is identified between the politicians and the
families, defined by surname of the business groups in Thailand. The families will be
considered as connected to politicians if the relationships between them fall into the four
main features of connection as described as follows10:
i. A politician is a member of a particular family or, in short, the relationship
between the politician and family is by blood lineage.
ii. A family has in-law relationship with a politician. The relationship is
established through the marriage between the two families.
iii. A family member is known to have a close relationship with the politician or
the politician’s families.
iv. A family member has a noteworthy business partner status with a politician.
Moreover, to identify the connection created through joint business, there are
two conditions: First, the joint business must be a flagship company of a
9 See Definition Declaration in Appendix A for the detailed meaning and some little exception. 10 Please see Figure 5 in Appendix A for more details.

11
family or. Second; they must be co-owner of two or more companies. These
details are stated in the Brooker Group’s report.
The connection between politicians and each family will be identified in the
above-mentioned steps. The types of connections will be noted aside the name of
connected families. The first type of connection is considered as “direct connection to
politicians” while the rests are considered as “strongly indirect connection” and “weakly
indirect connection”.11 These will be useful for further analysis. Indirect connection
statuses are mainly derived from the books- The Brooker Group’s “A Unique Guide to
Who Owns What” and Nation’s “The Fifty-five Most Well-Known Families”. The
product of this step is the database informing the connection between families. The other
books providing information for the indirect connections are stated in the Appendix C.
Third, we gather the private holding companies own by each family, especially
for the top families. These lists of private companies are primarily collected from the
Brooker Group’s report (2003). This step will help collect the bigger set of the listed
firms’ shares hold by each family; particularly in case that family does not directly hold
the firms but use the juristic person to do on their behalf.
In the forth step, the list of major shareholders and board members of listed firms
provided by the SETSMART’s data bases are then matched with the prepared surnames
and private companies of the families whose relationship with the politicians fall into (i),
(ii) (iii), and (iv).12 The ensuing products are the surname or name (in case it is a juristic
person) and percentage of total shares held by these people, for shareholding angle, and
positions charged by them in the board members of the firms, for board members angle.
For more details about matching procedure, please see in “Matching Procedure” section
in Appendix I. The product from this step is the percentage or position held in the firm by
each politically connected person.
Fifth and lastly, for the connection established through shareholder angle, the
percentage of shares held by politically connected people will be summarized for each
firm-year. Then if the summations for a firm are not less than the specific breakpoint, that
firm will be counted as the politically connected firms through shareholding. (The
11 Please see Definition Declaration section in Appendix A for more detail. 12This method is applicable because the family names in Thailand are quite unique.

12
specific breakpoint will be tested at 0.513, 1014, and 20 percent). For the board members
angle, the number of politically connected board members will be summarized for a firm-
year. Likewise, the specific breakpoint will be applied. If the number of connected board
members reaches that break point, the firm will be counted as the politically connected
firms through board members. (The specific breakpoint will be tested at ≥ 1, 2, and 3
people). (Please see Figure 7 in Appendix A for more details.) At last, the firms that
reach a specific cut-off level will be considered as politically connected firms.
While the higher cut-off level could present the higher effect from the political
connection, nonetheless, in some cases the loosen definitions, i.e. strongly and weakly
political connection definitions, will be adopted to alleviate the problem of shortage of
samples while the number of politically connected firms can be added in without
lowering the cut-off level, or also allow us to higher the cut-off level, classify the firms
into subgroups or slicing a long period into shorter one. And our study will focus on this
interchange as well.
3.4 Hypotheses development
Since the existing studies on political connections in Thailand are inconclusive,
this hypothesis is to provide further investigation by lengthen the study period. According
to Lin (2003) Castro et al. (2004) and Stulz (2005), Thailand is a country that has limited
ownership diffusion and has underdeveloped investor protection. For long, the country is
perceived as the low transparent one, especially in political context. Last but not least, the
nominee legislation in Thai market is still poor and far behind the developed markets.15
According to these reasons, the politicians in Thailand do not face much hindrance to use
their executive position in national office to unfairly support their connected firms such
as through the policies, concessions and legislations which bestow benefits to their
cronies and themselves. Hence, it is expected that this study will find the significant
13This 0.5% is the minimum percentage shareholding which is compulsively required the shareholders names
to be shown in the SETSMART’s data base. 14This cut-off point is generally used by several papers studying in political connection such as Imai (2006),
Bunkanwanicha et al. (2009), Faccio (2006), Faccio et al. (2006), Khwaja et al. (2005) and etc. 15 According to “The use of nominee on Stock Exchange of Thailand”, Achavanuntakul (2006)

13
evidence of benefit exploited by the political connection. According to this statement, the
first hypothesis is quoted in the null form as follow:
Hypothesis 1: The politically connected firms do not outperform the non-connected
firms.
Many researchers such as Bhagat et al. (2008) and Bebchuk et al. (2009) show us
the evidences indicating the association between higher firms’ corporate governance level
and firms’ subsequent performances such as ROA, Tobin’s Q ratio and market returns16.
In the field of credit rating which also implies to the cost of capital, Bhojraj et al. (2003)
and Ashbaugh-Skaife et al. (2006) point out evidence of the higher credit rating from
having superior governance level as well. The finding of Li et al. (2004), Malkiel et al.
(2004) and Jin et al. (2006) imply that the firm specific variation can be the proxy of
openness of the firms and it causes an improvement in stock prices. Moreover, Ferreira et
al. (2007) also suggest that the firm specific variation positively relates with the quality
of investment decision17. According to the idea supports from these papers, the firms
with the better governance standard and information flow are anticipated to outperform
the firms with worse one. To be consistent with these research papers, this paper is
expected to find the significant evidence indicating that the stronger governance and
higher information flow generate the higher performances of the connected firms.
According to this statement, the second hypothesis is quoted in the null form as follow:
Hypothesis 2: The better in corporate governance and information flow do not cause the
outperformance of the politically connected firms.
16 See for more examples on Bai et al. (2004), Brown et al. (2004), Klapper et al. (2004), Black et al. (2005)
and Andres et al. (2008). 17 For more examples see Goyal et al. (2001), Shen (2007) and Spiegel et al. (2005)

CHAPTER IV
METHODOLOGY
4.1 Data description
First of all, descriptive statistics of the characteristics of the politically connected
firms and the non-connected firms are investigated. These characteristics include ROA,
ROE, Tobin’s Q, firms’ size, firms’ age, DE ratio, interest coverage ratio, profitability
ratio, firm specific return variations, the probability of informed-base trading and
governance level.
Table 1 exhibits the quantities of politically connected firms. Panel A presents the
quantities of politically connected firms by various definitions and cut-off level. The
matching is done through shareholding and board of directors lists which are separately
shown in the panel.
Panel B focuses on direct connection definition which is frequently used in the
study (it is conventional and conservative meaning) and shows the quantities of
connected firms in yearly manner. For the whole period of the study (1999-2008) when
shareholding as the source of connection is used, there are 62 cabinet connected firms-
years which equal to 1.8% of all non-financial firms and 173 (5%) representative
connected firms-years. When the board of directors list as the source of connection is
considered, there are 39 (1.1%) cabinet connected firms and 261 (7.5%) representatives
connected firms-years. It is also interesting to note that in the period of Thaksin’s regime
(2001-2005), there are more firms connected with politicians than the period of non-
Thaksin’s regime (1999-2000 and 2007-2008). During 2001-2005, when the connection
established through shareholding is calculated, there are 2.5% of total firms that connect
with cabinet members and 6.4% of total firms connecting with representatives politicians,
while in the non-Thaksin’s period, there are only 0.8% and 2.6% of total firms that
connect with cabinet and representatives respectively. However this increasing number is
not only from the Thaksin’s TRT parties, it is also from the others parties as well (e.g.
Democrat). While representatives connected firms found through board of directors are
more than through shareholding, cabinet connected firms exhibit contrastively.

15
The increasing numbers of politically connected firms (both cabinet connected
and representative connected firms) in the period of Thaksin’s regime conform to the
suggestion of Thanee Chaiwat (2006) that the changed contexts of political market around
year 2000-2001 are the factors that encouraged and induced the businesspeople joining
the political market. This research also points out that there is more incentive for the
business sectors to pierce through the government office by, particularly, establishing the
new-type relationship with the political groups, the relationship which he called “the
relationship that led by the business group and supported by the political group. If the
business units jumping in the political arena have hidden agenda to exploit the societies
and their competitors’ benefit through the design of rent-seeking policy, concession
contracts or other contracts that are not fair to people. Hence, it could be the case that the
deeper involvement by one big business group who newly jumps in the political market
would tempt other business groups to do the same in order to protect their market share.
This could drastically increase the numbers of the businesspeople or the agent of these
businesspeople in the political arena.
Table 1 Sample of politically connected firms Panel A: Numbers of politically connected firms – whole period Panel A shows the quantities of politically connected firms-year defined by each definition for the whole period (1999 - 2008) in Stock Exchange of Thailand. Politicians are classified into cabinet members (CAB) and representatives (REP). It reports the quantities of politically connected firms derived from matching process which uses the connection through shareholding and through board of directors as the source of political connection. The first three columns report the quantities of connected firms by using the direct connection definition in matching process while the next three and the last three columns add the strongly indirect connection and indirect connection definition into the matching rules, respectively. Cut-off level utilized are 0.5%, 10% and 20% for the connection through shareholding and 1 person, 2 persons and 3 persons through board members.
Definition used Direct connection Direct or strongly indirect connection Direct or indirect
connection
Connection established through shareholding Cut-off level ≥0.5% ≥10% ≥20% ≥0.5% ≥10% ≥20% ≥0.5% ≥10% ≥20% CAB Connected 192 62 55 320 92 81 527 164 130 REP Connected 956 173 82 1031 218 131 1051 366 262 Connection established through board of directors Cut-off level ≥1 ≥2 ≥3 ≥1 ≥2 ≥3 ≥1 ≥2 ≥3 CAB Connected 226 39 17 289 73 31 407 154 71 REP Connected 796 261 109 927 375 188 1077 498 257

16
Table 1 Sample of politically connected firms – (continue) Panel B: Numbers of politically connected firms – Yearly Panel B presents the number of politically connected firms each year in Stock Exchange of Thailand. Politicians are classified into cabinet members and representatives. It reports the quantities of politically connected firms derived from matching process which using the connection through shareholding and through board of directors as the source of political connection. The number of connected firms in the panel comes from utilizing the 10% cut-off level in judgment process for the connection matched through shareholding data and 2 persons cut-off level for the connection matching through board members data.
1999 2000 2001 2002 2003 2004 2005 2006 2007 2008 99-08
Direct Connection through shareholding - 10% cut-off CAB Connected 2 4 8 9 8 11 10 6 0 4 62 REP Connected 9 9 23 25 20 23 25 24 1 14 173 Direct Connection through board of director - 2 persons cut-off CAB Connected 3 2 6 4 4 6 5 5 3 1 39 REP Connected 18 12 37 40 44 43 23 20 3 21 261
Overall descriptive statistics, as exhibited in Table 2, represent the characteristics
of politically connected firms and their matched firms. The politically connected firms
are cabinet connected firms and representative connected firms. The table is divided into
two panels. The first is for the descriptive statistics of politically connected firms
matched through shareholding and the second is for the ones through board of directors.
Each panel reports performance characteristics (Tobin’s Q ratio, ROA, ROE), accounting
characteristics (size, age in month, DE ratio, interest coverage, asset growth, operating
income per total asset and revenue per total asset) and corporate governance
characteristics (corporate governance index (CGI), components of CGI (board structure,
conflict of interest, board responsibility, shareholder right and disclosure and
transparency), idiosyncratic volatility (IDIO) and probability of information based trading
(PIN).
As shown in the Panel A, performance and accounting characteristics, there are
three significant differences between cabinet connected firms and their matched firm
which are Tobin’s Q ratio, size and Revenue/Asset. The first two variables imply that the
firms connect with cabinet members tend to be the large firms in term of market
capitalization and book value of asset. The negative difference in Revenue/Asset could be
inferred that these firms has lower asset turnover which can be due to their big size.
About ease to access the debt financing and profitability, cabinet connected firms have
higher DE ratio, lower interest coverage and higher operating income per asset

17
comparing with the matched firms, but these differences are not vivid enough to be
significant. In corporate governance characteristics, the cabinet connected firms show the
significantly higher magnitude in probability of information-based trading and lower
amount in the idiosyncratic volatilities. Interestingly, while the idiosyncratic volatility
and the probability of information-based trading are similarly hypothesized as the firm-
specific information, the descriptive statistics of the cabinet connected firms presents the
different interpretation. The cabinet connected group also demonstrates the significant
better CGI and its three components; board structure, board responsibility and
shareholder right comparing with the matched firms. This evidence provides us an idea
that the politically connected firms are not the badly-run firms even though they might
somehow benefit from their political connection. This might be due to two points. First,
the result above shows that these firms are the big ones in term of total asset, thus they
have potential to adopt the developed governance standards. Second, the nature of
cronyism appearing in the country, low transparency and highly corrupted in political
process have brought big business persons, when possible, to make an attempt seeking
the political connection which could provide the huge benefit to their businesses. These
connected firms generally are big companies and run by somewhat highly reputed icons
who can access to the top political power. As previously stated in the question of the
study, it could be the case that the gap in corporate governance standard could explain the
prevailing performance of politically connected firms discovered by Imai (2006) and
Bunkanawitcha et al. (2008). This premise will be rechecked in the second section of the
study result. By contrast to the cabinet connected firms, representative connected firms
tend to have significantly lower profitability in term of ROE, operating income per asset
and revenue per asset comparing with their matched group. They are also longer
established than their matched firms. In the context of information flow and corporate
governance, they present evidences of higher index of the conflict of interest, one of the
CGI components.
As for Panel B, Characteristics of politically connected firms found through board
of directors, there are some different results from those prior shown in Panel A. The firms
connected with cabinet members do not show significant differences from their peers in
term of performance characteristics, even though they demonstrate positive sign. In

18
accounting characteristics, the firms connecting with cabinet members also shows
positive significance in the difference with their peers when the Revenue/Asset is
compared. Moreover, the size of cabinet connected firms is not significantly different
from their matched firms. These contrast to ones we got from the connection through
shareholding. In governance characteristics, only shareholder right item of the cabinet
connected firms shows significantly superior from their peers. The firms connecting with
representatives from the matching through the board of directors list shows quite
consistent in characteristic differences (from their peers) with the representative
connected firms finding from the list of shareholding showing in Panel A. Their
performances in term of ROA are significantly less than their matched firms as well as
Revenue/Asset. They are longer established than their peers. And, in the governance
characteristics, the firms connecting with representative also have higher conflict of
interest index and lower in board structure index, the two components of CGI.
Table 3 illustrates the correlation matrix of the corporate governance indicators. It
is shown in the table that CGI and its components are somewhat negatively correlated
with the proxies of information flow. The correlations between all components of CGI
show the positive correlations.

Table 2 Descriptive statistics
Descriptive Statistics represent politically connected firms’ characteristics. Panel A presents characteristics of politically connected firms found through shareholding and Panel B demonstrates ones found through board of directors. Direct connection definition is utilized in the political matching process. Each panel shows performance characteristics of politically connected firms (Tobin’s Q ratio, ROA, ROE), accounting characteristics (size (natural log of total asset), Age in month, DE ratio, interest coverage ratio, asset growth, operating income per asset and revenue per asset) and governance characteristics (corporate governance index (CGI), CGI components, the idiosyncratic volatilities (IDIO) and the probability of information based trading (PIN)).
Panel A: Characteristics of politically connected firms found through shareholding
CAB REP Matched CAB Matched REP CAB-Matched REP-Matched Performance characteristics
TOBIN'S Q 1.924 0.992 1.367 1.093 0.557** -0.101 (0.268) (0.047) (0.069) (0.043) (0.228) (0.068)
ROA 0.049 0.026 0.029 0.041 0.021 -0.016 (0.014) (0.010) (0.011) (0.008) (0.018) (0.013)
ROE 0.026 0.042 -0.790 0.107 0.815 -0.065* (0.063) (0.022) (0.733) (0.022) (0.936) (0.034)
Accounting characteristics
Size 16.035 14.496 15.329 14.592 0.706*** -0.096 (0.205) (0.090) (0.142) (0.073) (0.242) (0.120)
Age (Month) 228.396 379.530 253.501 307.788 -25.105 71.742*** (16.036) (12.466) (13.260) (9.308) (21.185) (15.679)
DE Ratio 65.1038 65.3367 59.3103 89.0809 5.7935 -23.7442* (10.1192) (8.8807) (22.31) (8.8224) (29.6477) (13.7468)
Interest Coverage 35.7637 101.9046 221.6227 109.327 -185.859 -7.4224 (89.1853) (28.0499) (77.4176) (47.5369) (121.9817) (68.9606)
Asset Growth 0.073 0.063 0.066 0.069 0.007 -0.006 (0.036) (0.017) (0.022) (0.013) (0.040) (0.021)
Operating Income/Asset
0.069 0.035 0.039 0.053 0.030 -0.019* (0.015) (0.009) (0.011) (0.006) (0.018) (0.010)
Revenue/Asset 0.650 0.939 0.954 1.054 -0.304*** -0.115* (0.055) (0.045) (0.065) (0.036) (0.094) (0.059)
19

20
Table 2 Descriptive statistics – (continue)
CAB REP Matched CAB Matched REP CAB-Matched REP-Matched Corporate governance characteristics
IDIO 0.935 3.224 1.970 3.219 -1.035*** 0.006 (0.165) (0.200) (0.215) (0.133) (0.303) (0.233)
PIN 0.272 0.292 0.215 0.296 0.057* -0.005 (0.030) (0.017) (0.015) (0.010) (0.031) (0.019)
CGI 0.565 0.469 0.499 0.465 0.066** 0.004 (0.021) (0.011) (0.018) (0.008) (0.027) (0.013)
- Board Structure 0.547 0.414 0.462 0.441 0.085** -0.027 (0.029) (0.018) (0.025) (0.013) (0.039) (0.022)
- Conflict of Interest 0.480 0.408 0.450 0.384 0.031 0.024* (0.023) (0.012) (0.021) (0.008) (0.031) (0.014)
- Board Responsibility
0.626 0.535 0.538 0.511 0.088** 0.024 (0.032) (0.017) (0.021) (0.012) (0.036) (0.021)
- Shareholder Right 0.501 0.379 0.415 0.389 0.086*** -0.010 (0.024) (0.015) (0.021) (0.012) (0.031) (0.020)
- Disclosure and Transparency
0.642 0.558 0.581 0.559 0.060 -0.000 (0.027) (0.016) (0.025) (0.012) (0.038) (0.020)
Panel B: Characteristics of politically connected firms found through board of directors
CAB REP Matched CAB Matched REP CAB-Matched REP-Matched Performance characteristics
TOBIN'S Q 1.800 1.150 1.441 1.248 0.3591 -0.0986 (0.301) (0.055) (0.114) (0.049) (0.269) (0.077)
ROA 0.051 0.001 0.029 0.058 0.0215 -0.057** (0.017) (0.021) (0.014) (0.016) (0.022) (0.026)
ROE 0.067 -0.134 0.003 0.057 0.0644 -0.1908 (0.030) (0.174) (0.056) (0.029) (0.080) (0.139)

Table 2 Descriptive statistics – (continue 2)
CAB REP Matched CAB Matched REP CAB-Matched REP-Matched Accounting characteristics
Size 15.081 15.266 15.089 15.132 -0.0076 0.1341 (0.284) (0.0978) (0.1898) (0.0702) (0.3329) (0.1184)
Age (Month) 271.547 353.615 281.420 291.649 -9.8735 61.9659*** (22.8553) (14.1733) (15.1805) (8.3854) (26.8178) (15.4194)
DE Ratio 69.4882 77.9217 94.9549 92.426 -25.4668 -14.5043 (23.0245) (7.7562) (13.7531) (6.8995) (25.2264) (10.8651)
Interest Coverage 46.9233 227.6634 91.2365 5732.1732 -44.3132 -5504.5098 (141.525) (60.065) (36.3847) (4672.3623) (111.2787) (6375.1094)
Asset Growth 0.063 0.351 0.091 0.096 -0.0275 0.255 (0.0383) (0.249) (0.0262) (0.0132) (0.0455) (0.1915)
Operating Income/Asset
0.070 0.027 0.046 0.045 0.024 -0.0183 (0.019) (0.0139) (0.0143) (0.0083) (0.024) (0.0152)
Revenue/Asset 1.364 0.751 0.926 0.927 0.4379** -0.1766*** (0.2205) (0.04) (0.0711) (0.0348) (0.1879) (0.0548)
Corporate governance characteristics
IDIO 1.799 2.573 2.382 2.721 -0.5829 -0.1487 (0.2227) (0.1615) (0.2453) (0.1027) (0.3777) (0.1831)
PIN 0.295 0.278 0.238 0.284 0.057 -0.0056 (0.046) (0.0121) (0.0159) (0.0087) (0.0402) (0.0145)
CGI 0.523 0.475 0.484 0.472 0.0386 0.003 (0.0258) (0.0095) (0.0218) (0.0072) (0.0351) (0.012)
- Board Structure 0.554 0.397 0.470 0.444 0.0835 -0.0467*** (0.0409) (0.0136) (0.0335) (0.0112) (0.0545) (0.018)
- Conflict of Interest 0.411 0.445 0.418 0.399 -0.0062 0.0459*** (0.0282) (0.011) (0.0225) (0.0076) (0.0369) (0.013)
- Board Responsiblility
0.538 0.514 0.528 0.518 0.0097 -0.0038 (0.0359) (0.0144) (0.0283) (0.0107) (0.0466) (0.0178)
- Shareholder Right 0.473 0.413 0.371 0.405 0.1026** 0.0079 (0.031) (0.0129) (0.0251) (0.0102) (0.0409) (0.0166)
- Disclosure and Transparency
0.618 0.563 0.573 0.559 0.0451 0.0032 (0.0357) (0.015) (0.0283) (0.0109) (0.0464) (0.0183) 21
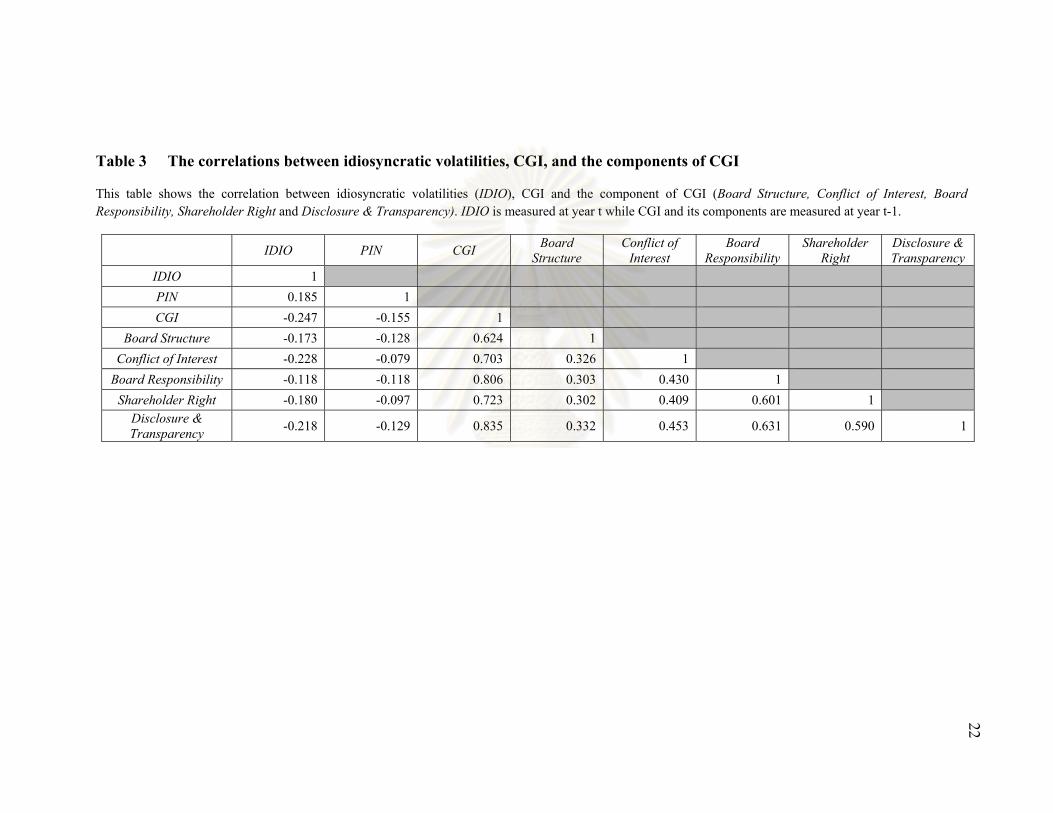
Table 3 The correlations between idiosyncratic volatilities, CGI, and the components of CGI
This table shows the correlation between idiosyncratic volatilities (IDIO), CGI and the component of CGI (Board Structure, Conflict of Interest, Board Responsibility, Shareholder Right and Disclosure & Transparency). IDIO is measured at year t while CGI and its components are measured at year t-1.
IDIO PIN CGI Board Structure
Conflict of Interest
Board Responsibility
Shareholder Right
Disclosure & Transparency
IDIO 1
PIN 0.185 1 CGI -0.247 -0.155 1
Board Structure -0.173 -0.128 0.624 1 Conflict of Interest -0.228 -0.079 0.703 0.326 1
Board Responsibility -0.118 -0.118 0.806 0.303 0.430 1 Shareholder Right -0.180 -0.097 0.723 0.302 0.409 0.601 1
Disclosure & Transparency -0.218 -0.129 0.835 0.332 0.453 0.631 0.590 1
22

23
4.2 The reexamination of the effects of political connections
Political connections and stock returns
To test on advantage of political connection, this study initially divides the
samples into two categories. One is the connected group which is considered as
connected to politicians or cabinet/VIP, the other is non-connected group. Then the study
follows Fama-French (1993) three factors model and estimates the regression on the
samples by the equation. The weekly returns of a group are formulated by both equally
weighted. The intercepts of the regressions of these two groups will be tested for
differentiation by t-test. The time-series data during 1999 to 2008 will be regressed with
OLS. The SMB and HML portfolios will be rebalanced at the end of June each year.
Specifically, Fama-French (1993) three factors model is as follows:
R , α β . R s . SMB h . HML ε , (1)
where i indicates the portfolio created from a group of stocks; 1 means portfolio
created from politically connected stocks and 2 means non-connected ones. is the
excess weekly returns of portfolio i in week t. is market excess weekly return.
is the difference between the returns on a portfolio of small stocks and a portfolio of large
stocks at week t. is the difference between the weekly returns on a portfolio of
high book-to-market and a portfolio of low book-to-market at week t. The study period is
run from 1999 to 2008.
It is expected that politically connected firms are able to generate the excessive
returns than the non-connected ones. Hence, the t-statistic test on the intercepts difference
is expected to show the significantly positive sign which can lead us to reject the first null
hypothesis.
Political connection and firms’ performances
To measure the contribution from political and cabinet connection, the regression
analysis is undertaken. To see whether the connections through politicians can improve
the firm’s performances in several views, four dependent variables are employed in the
tests. The dependent variables involved in this section are ROA, ROE and Tobin’s Q

24
ratio. The set of control variables are shown in the Appendix B. The regression model
can be shown in the general form as below:
Performance , α β . CAB , β . REP, ∑ γ . Control , (2)
where , , CAB , are the dummy variables that take on a value of one if the
firm is connected to a cabinet member and a representative, respectively, and zero
otherwise. If a firm is considers as connected to cabinet members it will not connected to
representatives. , denotes the set control variables; such as interest coverage
ratio, of firm i in the fiscal year t which we assume to begin at 1st July each. The focused
study period is 1999-2008.
The is expected to be significantly positive which could lead us to reject the
first null hypothesis and state that the political connection could create value to the firms.
4.3 The coup study
Impact of the coup d’état
To determine the effect of political domination of the government office, we
examine the performances into the passive portfolio returns (buy-and-hold abnormal
returns18). This section makes an attempt to replicate and extend the work of
Bunkawanicha (2009) by utilizing the event of the coup d’état on 19 September 2006.
For passive portfolio returns, BHARs of firms will be calculated for pre-election
and post election period. The pre-election BHARs of connected firms will cover
consecutive 12 months period prior 2 month before the coup. In the post-election period,
three sets of BHARs for each firms over consecutive monthly periods are computed; 12,
and 24 months after then. After BHARs as the dependent variable are obtained, the cross-
sectional regression analysis on the control variables and political connection indicators
is conducted. The set of control variables are shown in the Appendix B. The regression
model can be shown in the general form as below:
18 We use the standard approach suggested by Barber and Lyon (1997) to calculated buy-and-hold abnormal
returns (BHARs).

25
BHARs α β . CAB β . REP ∑ γ . Control (3)
where subscript j represent firm. is the buy-and-hold abnormal return of
firm j. The meaning of and are the same as above. The control variables are
measured at the firm level as of the end of year 2006. This test covers the period around
the 2006 coup.
Moreover, the study will proceed to determine the effect of politicians leaving the
office as well. The method is very similar to the study on the effect of taking office. The
study on effect of leaving office is also focused on the coup event which the governments
under PM Thaksin were abruptly overthrown.
To be consistent with anticipation, in the study of the effect of taking office, of
after election period in eq. (3) is expected to be significantly positive while of pre-
election period in eq. (3) is expected not to become positive significant and otherwise for
studying the impact of losing the power by the coup. This result would lead us to reject
the first null hypothesis.
For the samples used in this sub-section, eighteen firms in rehabilitation, twelve
firms with negative book-value, forty-two firms which have no price change, thirty-two
firms which does not fully traded in the whole period (2005-2007) ( some might have
been already delisted from SET but the Datastream still performs as they have been in
trading board, hence there is no change in the prices of these firms), 20 firms which have
incomplete data and a firm which has average BHARs per year greater than 1000% ( de
facto, it’s over 3000%) are all excluded from the sample list. Consequently, 328 firms are
finally included in the samples.
Due to the lack of political connection firms when a year is focused, this study
uses a set of combination between the source indicating of the politically connection
firms which we will call “SH-BD Cooperation connection” (stands for shareholding-
board of director cooperation) or only “Cooperation”. This combines the connection
definition through shareholding and board of directors into one group. The connection

26
that meets any of these requirements is considered one with the cabinet members through
Cooperation19:
1. The firm connects with the cabinet member through both shareholding and board
of director at 0.5% and 1 person cut-off respectively.
2. The firm connects with the cabinet member through shareholding at 10% cut-off.
3. The firm connects with cabinet member politicians through board of director at 2
people cut-off.
By replacing cabinet member with representative in these three conditions, the
conditions are for connection with the representatives through Cooperation.
Figure 1: SH-BD Cooperation, the combination of the connections through shareholding and board of directors.
This figure presents how the politically connected firm is accounted through the “SH-BD Cooperation” method. The area (1) is the intersection of the samples of politically connected firms from the use of low cut-off in matching process (0.5% for shareholding meaning and 1 person for board staff meaning). The area (2) is the groups of politically connected firms matching through shareholding list and it utilizes the medium cut-off in matching process. And the area (3) is the groups of politically connected firms matching through board staff list and it utilizes the medium cut-off in matching process. The Event study on the coup d’état
19 We also tested for the consistency when this type of definition is utilized in the regression on firms’ performance and the results show the consistent evidences. This also supports the use of this definition in this part of the study. The regression results are shown in the Appendix E.

27
To investigate the effect on the quick loss of governmental power, the event study
analysis on the impact of the 19th September 2006 coup on the stock returns of previously
politically connected firms will be undertaken. The abnormal return and volume would
be calculated during the coup d’état running from -4 to +4 week.
The study, examines the event study with CAPM-adjusted and 3-Facter adjusted
method. Initially, the stock is classified into two groups; politically connected group and
market which mean all stocks including the connected ones. Then the abnormal return
and cumulative abnormal return of political group would be computed. Next, the
differences from zero are tested on the abnormal and cumulative abnormal returns will be
tested. As regarding to the first hypothesis, the result of the last step is expected to be
significantly negative especially for the cabinet connected firms and firms connecting
with the representatives who are in the coalition parties. This could be interpreted that the
stock returns of the connected groups received higher negative impact from the coup than
the market did. In the study on the impact of the coup d’état above, the definition of
connection utilized is SH-BD Cooperation connection.
The impact of winning/losing an election
This sub-section is the supplementary event study. As the estimation done in the
last section, “the impact of the coup d’état”, the same method to study how the victory
and failing to win in national election affect the returns of each agents is used. The period
of study is the national election on 2007 which Pheu Thai party (former TRT party) led
by Samak Sundaravej won the election. Intuitively, it is expected that the cumulative
abnormal returns of firms connecting with the coalition parties will significantly gain
from the winning, while ones connecting with the opposition parties will significantly
injure from their electoral loss.
4.4 Political connection, governance, and firm specific information
Corporate governance index construction
The corporate governance index provided by Eamsherangkoon (2009) is utilized.
The author constructs Corporate Governance Index (CGI) based on the approach of
Ananchotikul (2006). This index uses information of Thai listed companies from public

28
source, including the mandatory Annual Disclosure Report (Form 56-1), company annual
reports, corporate websites, the web-based SET Market Analysis and Reporting Tool
(SETSMART), and the SET’s Director Database, to avoid bias from self-evaluated
questionnaire. The acquired answers from 87 questions are grouped in to five governance
components: 1) Board Structure 2) Conflict of Interest 3) Board Responsibilities 4)
Shareholder Rights, and 5) Disclosure and Transparency. Scores are given to each of the
governance items and taking a weighted average of the sub indexes to create CGI. As the
result, CGI runs from 0 to 100 with higher values indicating better corporate governance.
The calculation of firm specific variation (idiosyncratic volatility)
In this study, we follow the calculation of firm specific information examined in
the Ferreira and Laux (2007). They estimate the firm specific information by using the
measure of firm’s idiosyncratic volatility relative to the market-wide variation. However,
the paper by Ferreira et al. (2007) using the daily return to estimate the idiosyncratic
volatility in each month, these monthly data does not conform to the tests which relies on
the annual data (such as the governance index, and other control variable). Hence, the
calculation of idiosyncratic volatility is adjusted by using weekly return to estimate the
yearly idiosyncratic variation instead, assuming fiscal year starting on 1st July each year.
As in their paper, the market model is used in the estimation as shown as below:
R , α β . R , ε , (5)
with E ε , COV R, ε , 0. R , is the excess return for stock i on week t,
and R , is the value-weighted excess market index return on week t. Then β ,
where σ COV R , , R , , σ Var R , and σ Var R , . From this projection,
idiosyncratic variance is defined as
σ σ σσ
(6)

29
After the idiosyncratic volatility is computed, we standardize it by the total
volatility, for each month. One reason to transform it into ratio is that firms in some
industries are more sensitive to economy-wide shocks than others, and firm-specific
events may be correspondingly more intense. As the method provided by Ferreira and
Laux (2007), the equation to calculate the proxy of firm specific information is shown
below:
IDIO ln ,
, , (7)
where subscript i and t represent firm and year, respectively. IDIO is the proxy of
firm specific information calculated by taking the natural log to the firm specific
variation relative to market wide variation.
The probability of information-based Trading (PIN)
For the sake of thorough test of the information flow hypotheses, an alternative
measurement of information flow is investigated. It is the probability of information-
based trading (PIN) based on Easley et al. (1998). The analysis uses the information in
trade data to estimate the probability of the occurrence of the information-based trading
for individual stocks. The estimation of PIN in this study definitely follows such paper.
Public information events may be able to directly affect prices but not to trade20. Private
information is the signal that is not publicly observable. It contains information about the
future value of asset/firm; hence it affects price as well as trade. It will be assumed that
the information event occurs prior the beginning of the day. It could be good news or bad
news. Private information event which is independently distributed across days occurs
with probability α. These information events are good news with the probability 1-δ or
bad news with probability δ. There are two types of traders in the market which are the
informed traders who can observe the private information (and can use them in the
trading) and the uninformed traders who know only the public information. Assumingly,
20 “In effect, we define information events as public if they do not affect trading. Such events may cause price
changes, but little or no trade should be generated by a truly public information event. To the extent that seemingly public information events affect trade, they have a private component (such as understanding how to use this information) and we classify them as private information events.” (Easley (1998), p.5)

30
the informed traders are risk neutral and competitive. They will exploit the good signal
for buying stock and vice versa. On any day, arrivals of uninformed buyers and
uninformed sellers are random variables which are determined by independent Poisson
processes with arrival rate ε per day while the arrival rate of an informed trader is µ per
day. Please note again that the arrival rate of informed-trader which causing from the
occurrence of the good or bad information will be on only one side for a day: either buy
or sell, while the arrival rate of the uninformed trader will be always on both sides.. To
demonstrate, the figure 2 explains a possible outcome in each day.
infotmation event occur: α
bad signal: δ
buy arrival rate: ε
sell arrival rate: μ+ ε
good signal: 1- δ
buy arrival rate: μ+ ε
sell arrival rate: ε
infotmation event does not occur: 1-α
buy arrival rate: ε
sell arrival rate: ε
Figure 2: Three diagram of trading process. α is the probability that an information event will occur. δ is the probability of bad signal. μ is the arrival rate of informed trades. And ε is the arrival rate of uninformed trades.
In the model, buy and sell will reflect the underlying information structure, more
buys (arrival rate = μ + ε) in good events and more sells (arrival rate = μ + ε) in bad
events and no inform traders in no event day (arrival rate = ε). While it is not known
which process is operating on a day, these set of rates and probabilities are actually
presented by this model which should weighs on three possible components, i.e. good
news, bad news and no news, respectively, and will reflect their probability of occurrence
in the data. Give B indicates the number of buyer-initiated trades for the day and S

31
indicate the number of seller-initiated trades for the day, the likelihood of observing B
buys and S sells of firm i on day j of unknown type is shown as below21:
L B , , S , |θ 1– α e–ε T ,ε B ,
!B ,e–ε ε S ,
S , !
α δ e–ε ε B ,
B , ! e– μ ε μ εS ,
S , !
α 1 δ e μ ε μ ε B ,
B , ! e ε ε S ,
S , ! (8)
Where εi is an arrival rate of uninformed traders for firm i, μi ,is an arrival rate of
informed traders for firm i, Bi,j, is the number of investor buy order over day j. Si,j, is the
number of investor initiated sell order over day j. δi is a probability of information bad
event is occur, αi is a probability of occurring private information event, θi is the vector of
parameters to be estimated (αi, δi, εik, μi,) for firm i. For any given day, δ and α can be
either 0 or 1. Over multiple days, these parameters will be estimated from the daily
numbers of buys and sells which derived from the intra-day data. In multiple period we
estimate these parameters θi of firm i in each year by maximizing the joint likelihood
over the J trading days in a calendar year. The formula is shown below:
L M |θ ∏ L B , , S , |θJ , which M B , , S ,J
(9)
According to their meaning, the two probability parameters α and δ are restricted
to [0, 1] and two arrival rate parameters ε and µ were suppressed to [0, ∞].
For the computerized reason, de facto, we trans orm the eq. (8) into the form that shown below,
, ,, , ⁄ lo l log 1 ,,
, , ,
21 f
2 , g , , og, , , , , , 1
Define: in , , max ( , , , )) / 2) , m , / ( , + )
By this form, the two probability parameters α and δ were restricted to [0, 1] by a logit transform of unrestricted parameters, and the two rate parameters ε and µ were restricted to [0, ∞] by a logarithmic transform.

32
The parameters of problem estimated from the equation above will determine the
probability of information-based trading (PIN) in stock based on Easley et al. (1998) as
the equation shown;
PINαµ
αµ 2ε 10
The PIN variable is the weight of the private information based trading relative to
the trading by uninformed traders. The numerator indicates the expected quantity of
orders for a day which is composed of the occurrence of the information event times the
information-based order arrival rate. The denominator is the total sum of the information
based trade and the sell and buy trades for the non information event case. In the
denominator, ε is multiplied by 2 because the uninformed assumingly come to the
market on both buy and sell side with the same rate regardless there are good or bad or no
news.
Political connection, corporate governance and firm specific variation
To investigate whether the firms’ performance are affected by
governance/information flow or political connection, the following regressions are
estimated.
Performance , α β . REP, β . CAB , β CGI , β Info , ∑ γ . Control ,
(11)
where CGI , is the governance index of firm i at the started year t. Info , is the
firm specific information variable (which is surrogated by the idiosyncratic volatility and
the probability of informed-base trading) of firm i at the stated year t. The observation
period is from 2000 to 2007. According to the expertise provided by GIM (2003) and
Ferreira et al. (2007), the coefficients of Corporate Governance Index and the firm
specific information are expected to be significantly positive. This incident will be
consistent with our anticipation which lead us to conclude that the firms which have
better governance standard and information flow will outperform the firms with lower
ones. This will allow us to reject the second null hypothesis.

CHAPTER V
EMPIRICAL RESULT
As in the methodology chapter, the result will be divided into two sections. The
first is for the reinvestigation on the effects if political connections, which will be also
divided into two sub-sections; the regression analysis on the performances and the study
on the happening of 2007 coup. The second is for the study on the accounting
performance of firms after supplementary control for the political connection,
governance, and firm specific information.
5.1 A reexamination of the effects of political connections
Political connections and stock returns
Table 4 shows the regression result of Fama and French (1993) in which the
three-factor model on politically connected portfolio is used. The direct connection
definition is applied when the politically connected firms are found out. The table is
separated into two panels, Panel A and Panel B, which present the results from using the
shareholding and the board of director as the source of connection. When the whole
period of this study (1999-2008) is covered, the portfolio of cabinet connected firms
shows no sign of benefit received from political connection. Moreover, in Panel A, the
constant term of the long-short portfolio presents significant -0.4% return. This indicates
that the cabinet connected firms receive negative effect in term of alpha from their direct
political connection through shareholding. The representative connected firms exhibit
0.1% abnormal returns for long-short portfolio when the board of director as the source
of connection is used, however, the outcome is not considered significant. When the
connection found through shareholding is utilized, the abnormal returns are not
discovered.
When the period of study is divided into the Thaksin’s regime (2001-2005) and
non-Thaksin’s regime (1999-2000 and 2007-2008), the result from the model shows
some difference. Panel A, in Thaksin’s regime, cabinet connected portfolio
underperforms its matched firms with 0.7% abnormal return with 1% significant level
while representative connected portfolio shows no sign of significant difference from its

34
matched portfolio. In non-Thaksin’s regime, the political connections provide -0.4%
abnormal return over their matched firm for cabinet connected, and 0.2% for
representative connected portfolio. However, both of them are insignificant. Panel B, The
cabinet connected firms earn insignificant -0.3% and -0.2% for Thaksin’s and non-
Thaksin’s regime, respectively. The representative connected firms also get insignificant
results with -0.1% abnormal returns and 0.3% abnormal returns in Thaksin’s and non-
Thaksin’s regime, respectively.
The results obtained from this section indicate no evidence of abnormal return
contributed from connection with politicians. It is also demonstrated that in the period of
Thaksin’s regime, cabinet connected firms, on average, underperforms its matched firms.
In short, the result provided by this table does not reject our first null hypothesis.
Please note that the other definitions of political connection –Weakly Indirect
Connection and Strongly Indirect Connection through shareholder, and through board of
director - are also applied to the test for the whole period and the results shows the
coherent evidence with the above.
Political connection and firm’s performances
This sub-section presents estimates of the time-series cross-sectional firm-level
regression with the yearly data over the period 1999-2008. The regressions report the
result from running equation (2); the differences in each table are the used of the period,
the definition of political connection and the classification of politicians.
Table 5, shows the estimation results when the whole period of the study is
focused. The politicians are classified into cabinet members and representatives. In the
table, Panel A show the results from using connected found through shareholding and
Panel B demonstrate the results from using the board of director.

35
Table 4 Benefit of political connection tested by Fama-French 3 Factors (1993) model
This table presents the result of pooled regressions on weekly stock return by using Fama-French (1993) 3-Factor model. The period of study is from 1999 to 2008. The samples are divided into 4 groups which are cabinet connected firms, matched-cabinet connected firms, representative connected firms and matched-representative connected firms. The constant is generally known as abnormal return or alpha. The alpha from the returns difference between the politically connected firms and their matched firms are the indicator of benefit receives from political connection. RM-RF is weekly market return minus the overnight interbank rate. SMB (Small-minus-Big) is the average return on the three small portfolios minus the average return on the three big portfolios. And HML (High-minus-Low) is the average return on the two value portfolios minus the average return on the two growth portfolios.22 Robust standard errors are given in the parentheses. *, ** and *** indicate significance from zero at the 10%, 5% and 1% level, respectively. The table shows the estimation when applying definitions of direct connection established through shareholding and board of directors in Panel A and Panel B, respectively. The 10% cut-off is utilized in the results shown in Panel A and 2 persons cut-off is for Panel B. Each panel shows the estimate result of the whole period (1999 – 2008) and the estimated coefficient of the constant term when the sub periods are applied which are Thaksin’s regime (2001 – 2005) and Non Thaksin’s regime (1999 – 2000 and 2007 – 2008).
Panel A: Connection established through shareholding
Buy and Hold Portfolio Long-Short Portfolio
CAB REP Matched CAB
Matched REP
CAB-Matched
REP-Matched
Whole period
Constant -0.004*** 0.001 -0.001 0.000 -0.004* 0.000 (0.002) (0.001) (0.002) (0.001) (0.002) (0.002)
RM-RF 1.201*** 0.876*** 1.068*** 0.853*** 0.134* 0.024 (0.057) (0.053) (0.056) (0.04) (0.072) (0.063)
SMB 0.555*** 0.68*** 0.724*** 0.618*** -0.168 0.063 (0.087) (0.082) (0.086) (0.062) (0.112) (0.098)
HML -0.302*** 0.164** 0.276*** 0.039 -0.577*** 0.126 (0.083) (0.078) (0.082) (0.059) (0.106) (0.093)
R2 55.31% 36.67% 47.82% 48.71% 11.67% 0.60% Thaksin’s and non Thaksin’s regime
Thaksin’s Regime -0.004*** -0.001 0.002* -0.001 -0.007*** -0.001 (0.001) (0.001) (0.001) (0.001) (0.002) (0.001)
R2 71.97% 61.92% 45.96% 75.16% 34.64% 5.11%
Non-Thaksin’s Regime -0.007* 0.003 -0.003 0.000 -0.004 0.002 (0.004) (0.003) (0.004) (0.002) (0.005) (0.004)
R2 46.00% 31.33% 55.99% 38.13% 12.83% 0.44%
22 The definition of SMB and HML are literally from Kenneth R. French’s
website; http://mba.tuck.dartmouth.edu/pages/faculty/ken.french/
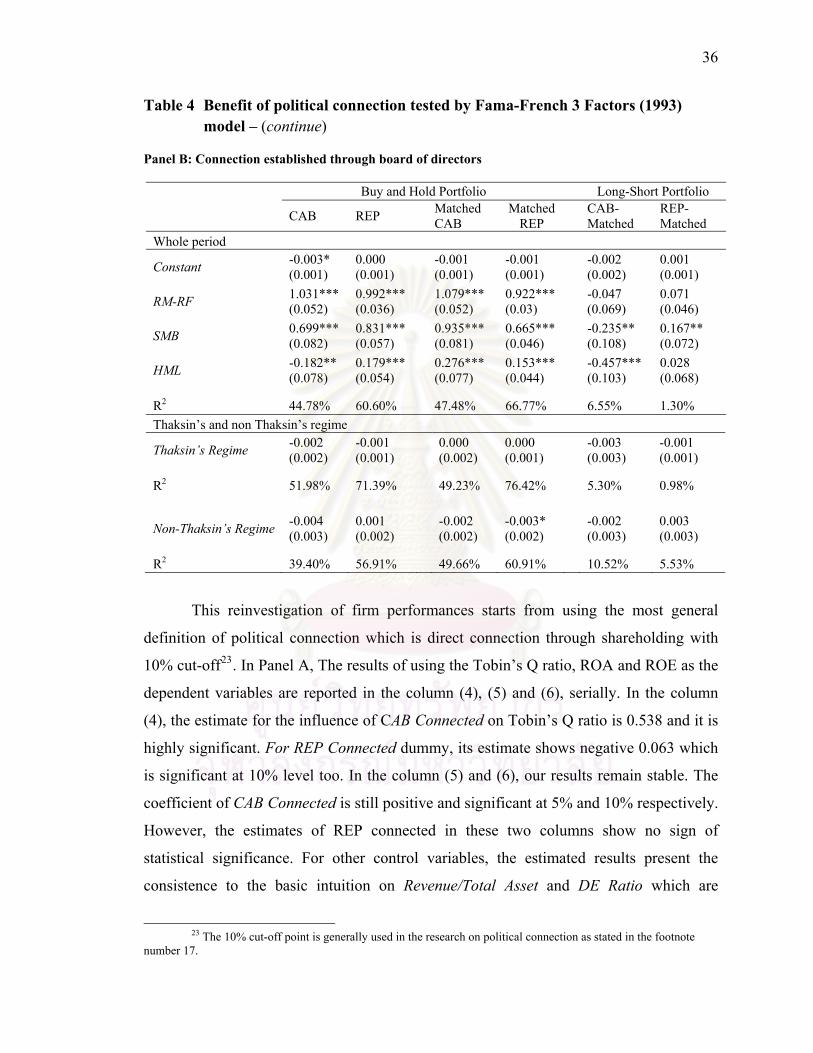
36
Table 4 Benefit of political connection tested by Fama-French 3 Factors (1993) model – (continue)
Panel B: Connection established through board of directors
Buy and Hold Portfolio Long-Short Portfolio
CAB REP Matched CAB
Matched REP
CAB-Matched
REP-Matched
Whole period
Constant -0.003* 0.000 -0.001 -0.001 -0.002 0.001 (0.001) (0.001) (0.001) (0.001) (0.002) (0.001)
RM-RF 1.031*** 0.992*** 1.079*** 0.922*** -0.047 0.071 (0.052) (0.036) (0.052) (0.03) (0.069) (0.046)
SMB 0.699*** 0.831*** 0.935*** 0.665*** -0.235** 0.167** (0.082) (0.057) (0.081) (0.046) (0.108) (0.072)
HML -0.182** 0.179*** 0.276*** 0.153*** -0.457*** 0.028 (0.078) (0.054) (0.077) (0.044) (0.103) (0.068)
R2 44.78% 60.60% 47.48% 66.77% 6.55% 1.30% Thaksin’s and non Thaksin’s regime
Thaksin’s Regime -0.002 -0.001 0.000 0.000 -0.003 -0.001 (0.002) (0.001) (0.002) (0.001) (0.003) (0.001)
R2 51.98% 71.39% 49.23% 76.42% 5.30% 0.98%
Non-Thaksin’s Regime -0.004 0.001 -0.002 -0.003* -0.002 0.003 (0.003) (0.002) (0.002) (0.002) (0.003) (0.003)
R2 39.40% 56.91% 49.66% 60.91% 10.52% 5.53%
This reinvestigation of firm performances starts from using the most general
definition of political connection which is direct connection through shareholding with
10% cut-off23. In Panel A, The results of using the Tobin’s Q ratio, ROA and ROE as the
dependent variables are reported in the column (4), (5) and (6), serially. In the column
(4), the estimate for the influence of CAB Connected on Tobin’s Q ratio is 0.538 and it is
highly significant. For REP Connected dummy, its estimate shows negative 0.063 which
is significant at 10% level too. In the column (5) and (6), our results remain stable. The
coefficient of CAB Connected is still positive and significant at 5% and 10% respectively.
However, the estimates of REP connected in these two columns show no sign of
statistical significance. For other control variables, the estimated results present the
consistence to the basic intuition on Revenue/Total Asset and DE Ratio which are
23 The 10% cut-off point is generally used in the research on political connection as stated in the footnote
number 17.

37
significant positive and negative, respectively. Nevertheless, the coefficients of Size and
ln (Asset) display somewhat mixed sign between different dependent variables.
Panel B also demonstrates a test by using the connection through board of director
with two people cut-off as the alternative definition. The result from this alternative
definition is consistent with the former. The estimates of CAB Connected are all positive,
although ones of column (5) and (6) – (ROA and ROE) – are not statistically significant.
For REP Connected, its estimated coefficients show negative signs for the Tobin’s Q and
ROA column, as the latter is also significant at 1% level.
The evidences shown from column (4), (5) and (6) in Table 5 consistently indicate
two points. First, on average, the connections with cabinet members are able to bolster
the accounting performances of the firms. Second, representatives provide no significant
supports to their connected firms, moreover, in some cases; to connect with them could
negatively affect the performances of the firms.
In Table 5, we also lower and higher the different cut-off points in the judgment
of politically connected firms, the resulted obtained are still consistent with the use of the
original cut-off, especially for the connection found through shareholding. Table 5
demonstrates that the ownership concentration of politically connected shareholding can
also be a factor determining the benefit received from the connection. As seen in Table 5,
the size of benefits that firms receive from cabinet connection is higher when percentage
of total shares held by their families are more concentrated, or the positions in board
rooms are added. This evidence could be interpreted as the difference in incentive driven
– while holding a small fraction of shares in a firm (or sitting a position in board staff)
could be marked as the connection signal or burden between politician’s families and the
bigger owners of the firms, to hold a large fraction of share or to take more seats in the
board in another firm could be seen as the family business of politicians, especially for
very high percentage like 20% or above.

Table 5 The political connection and the performances of the firms
The dependent variables reported in this table are Tobin’s Q ratio, ROA and ROE of firms in each year t. Sample period is 1999-2008. DE ratio is divided by 1000 to reduce the decimal points of coefficients. The accounting - independent variables (Size (natural log of total asset), Revenue/Total Asset, DE Ratio, Ln (Age in Month) (natural log of monthly age of firms)) are measured at year t-1. Industry classification follows SET standard. State-owned enterprise equals to 1 if 20% or more of shares of the firm is held by government who is also the biggest shareholder for the year. CAB Connected and REP Connected are dummy variables which equal to 1 if the firm is considered as the cabinet connected firm for the first one and representative connected firm for another, 0 otherwise. The connections are found through shareholding in Panel A and through board of director in Panel B. The direct connection definition is used for matching the political connection. The regressions utilize the OLS method. Robust standard errors are given in the parentheses. *, **, and *** indicate significance at the 10%, 5% and 1% level, respectively. The first three columns are the estimated result of using 0.5% shareholding cut-off for Panel A and 1 person cut-off for Panel B in the process of the judgment on political connection, while the next three and last three in Panel A (Panel B) are ones of using 10% (2 persons) and 20% (3 persons) cut-off , respectively.
Panel A: Connection established through shareholding
(1) (2) (3) (4) (5) (6) (7) (8) (9) Tobin's Q ROA ROE Tobin's Q ROA ROE Tobin's Q ROA ROE ≥0.5% shareholding ≥10% shareholding ≥20% shareholding
Constant 1.577*** -0.087 -1.111 1.624*** -0.085 -1.093 1.629*** -0.085 -1.104 (0.543) (0.169) (2.657) (0.566) (0.170) (2.708) (0.565) (0.170) (2.710)
CAB Connected 0.225*** 0.023** 0.347 0.538*** 0.037** 1.120* 0.694*** 0.040** 1.188* (0.067) (0.011) (0.779) (0.204) (0.017) (0.638) (0.239) (0.02) (0.669)
REP Connected -0.058*** 0.025 0.672 -0.063* -0.013 0.587 -0.019 -0.023 0.950 (0.017) (0.020) (0.565) (0.032) (0.018) (0.522) (0.042) (0.016) (0.833)
Size 0.027 0.001 -0.048 0.021 0.000 -0.061 0.021 0.000 -0.064 (0.021) (0.010) (0.094) (0.024) (0.010) (0.0930) (0.024) (0.010) (0.092)
Revenue/Total Assets 0.067*** 0.037*** 0.444 0.073*** 0.037*** 0.447 0.075*** 0.037*** 0.450 (0.017) (0.012) (0.355) (0.019) (0.012) (0.356) (0.02) (0.012) (0.359)
DE Ratio 0.001 -0.002*** -0.034 0.000 -0.002*** -0.035*** 0.000 -0.002*** -0.035 (0.002) (0.000) (0.045) (0.000) (0.000) (0.045) (0.001) (0.000) (0.045)
Ln(Age in month) -0.103*** 0.001 0.243 -0.101*** 0.003 0.283 -0.101*** 0.003 0.291 (0.026) (0.006) (0.255) (0.024) (0.005) (0.291) (0.025) (0.005) (0.297)
State-owned Enterprise -0.005 0.036 0.353 0.018 0.018 0.309 0.020 0.037 0.281 (0.052) (0.028) (0.232) (0.06) (0.028) (0.274) (0.06) (0.028) (0.296)
Industry-Year Dummies YES YES YES YES YES YES YES YES YES
R2 15.82% 2.24% 0.94% 16.07% 2.19% 0.92% 16.41% 2.19% 0.93% Observation 3074 3492 3230 3074 3492 3230 3074 3492 3230
38
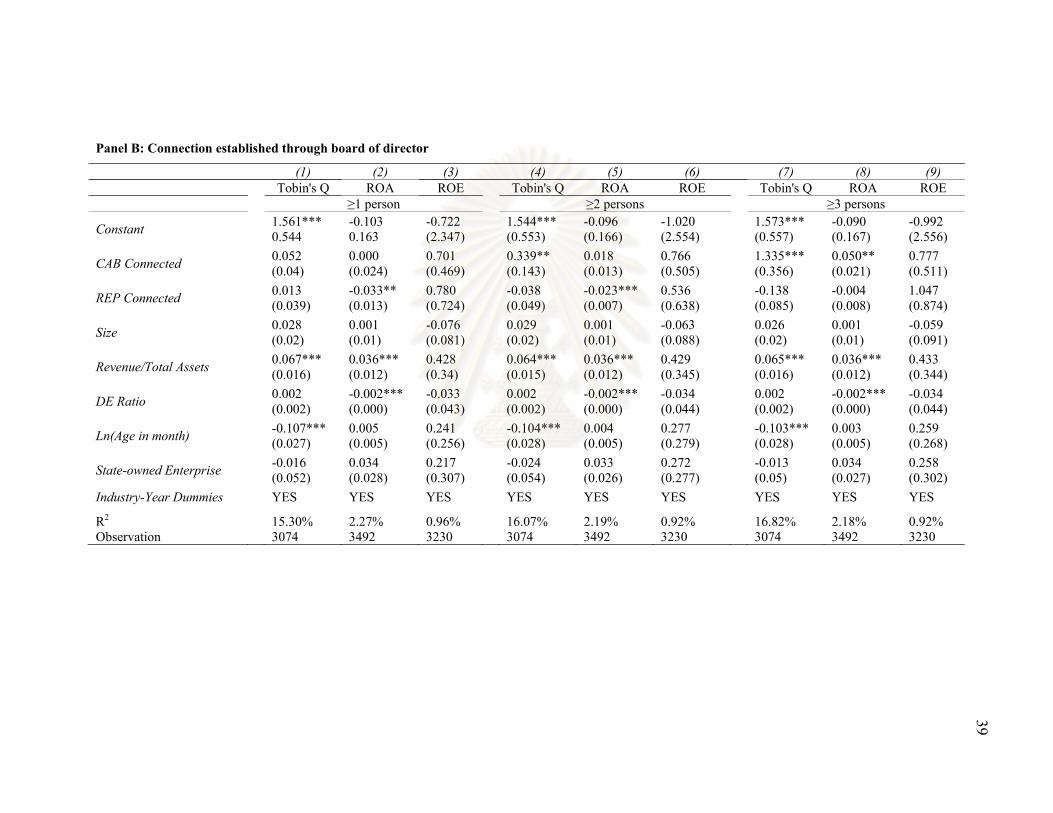
Panel B: Connection established through board of director
(1) (2) (3) (4) (5) (6) (7) (8) (9)
39
Tobin's Q ROA ROE Tobin's Q ROA ROE Tobin's Q ROA ROE ≥1 person ≥2 persons ≥3 persons
Constant 1.561*** -0.103 -0.722 1.544*** -0.096 -1.020 1.573*** -0.090 -0.992 0.544 0.163 (2.347) (0.553) (0.166) (2.554) (0.557) (0.167) (2.556)
CAB Connected 0.052 0.000 0.701 0.339** 0.018 0.766 1.335*** 0.050** 0.777 (0.04) (0.024) (0.469) (0.143) (0.013) (0.505) (0.356) (0.021) (0.511)
REP Connected 0.013 -0.033** 0.780 -0.038 -0.023*** 0.536 -0.138 -0.004 1.047 (0.039) (0.013) (0.724) (0.049) (0.007) (0.638) (0.085) (0.008) (0.874)
Size 0.028 0.001 -0.076 0.029 0.001 -0.063 0.026 0.001 -0.059 (0.02) (0.01) (0.081) (0.02) (0.01) (0.088) (0.02) (0.01) (0.091)
Revenue/Total Assets 0.067*** 0.036*** 0.428 0.064*** 0.036*** 0.429 0.065*** 0.036*** 0.433 (0.016) (0.012) (0.34) (0.015) (0.012) (0.345) (0.016) (0.012) (0.344)
DE Ratio 0.002 -0.002*** -0.033 0.002 -0.002*** -0.034 0.002 -0.002*** -0.034 (0.002) (0.000) (0.043) (0.002) (0.000) (0.044) (0.002) (0.000) (0.044)
Ln(Age in month) -0.107*** 0.005 0.241 -0.104*** 0.004 0.277 -0.103*** 0.003 0.259 (0.027) (0.005) (0.256) (0.028) (0.005) (0.279) (0.028) (0.005) (0.268)
State-owned Enterprise -0.016 0.034 0.217 -0.024 0.033 0.272 -0.013 0.034 0.258 (0.052) (0.028) (0.307) (0.054) (0.026) (0.277) (0.05) (0.027) (0.302)
Industry-Year Dummies YES YES YES YES YES YES YES YES YES
R2 15.30% 2.27% 0.96% 16.07% 2.19% 0.92% 16.82% 2.18% 0.92% Observation 3074 3492 3230 3074 3492 3230 3074 3492 3230

40
Imai (2006) and Bunkanwanicha et al. (2008) are the preceding researches
studying on political connection in the period of Thaksin’s government (2001-2005 and
2001-2004 respectively). The results from these two researches point out that the benefits
from political connection, especially cabinet connection are obvious. Table 6 shows us
the results from reinvestigating this argument.24 Remarkably, in 2001-2005, as it well
coheres with the evidence of Imai (2006), the cabinet members contributed the
considerably bigger and stronger significant outperformance to their connected firms
comparing with the whole period of our study. These evidences are consistent with the
preceding papers. The study of Thanee Chaiwat (2006) also conforms to and helps to
explain in our finding. In the work of Mr. Chaiwat, he state that the growth rate of asset
and earning of the firms connecting with the cabinet member in 2001 to 2003 are higher
than the average of their peers which he interprets it as the benefit from the economic
rent. Moreover, Thanee Chaiwat also proposes that there is a change in the flow of
resource since 2001. Such change is explained that these big businesspeople play the role
that affecting the policy making and control. In the past, big businesspeople are in the
out-of-circle of political power and they seem to enjoy the benefit from their indirect
connection that they establish by financially supporting the politicians and political
parties. But since 2001, the big business people have played the crucial role in shaping
the development direction of the nation; which makes them more politically powerful and
able to totally controls the prospect of the rents as well.
Similarly to the whole period, the firms connected with representatives in
Thaksin’s period earn highly significant depressing effect when Tobin’s Q is focused for
Panel A and ROA for Panel B. On the other hand, the out of Thaksin’s era gives the
diverse result. In Panel A, CAB Connected dummies indicate the weaker allegation to
politicians as the coefficients show significantly negative number and insignificantly
positive number as Tobin’s Q ratio and ROE are regressed, respectively. However, when
the ROA is regressed, the coefficient of CAB Connected gives the significantly positive
number. Panel B also provides the results leading to the same interpretation. Hence, the
24 The study period is 2001 to 2005 which exclude the last year of Thaksin’ regime, the year of political
instability triggering by the selling most, if not all, shares Thaksin and his family held in Shin Corporation Public Co., Ltd. to Temasek, the sovereign fund of Singapore. This transaction is the key bringing to the public furore on Thaksin and his government, the big demonstration leading by PAD, and lastly the coup on 19 September 2006.

41
different results from using three different dependent variables lead us to the lower the
degree of the allegation on cabinet members in this period.
Because the small sample size (<30) of CAB Connected firms in non-Thaksin’s
regime might lead to unreliable estimates, the tests by lowering the cut-off point to 0.5%
is also made. The result is still consistent with the above, even though there is some
decrease in its size and strength. The coefficients estimated of CAB Connected in
Thaksin’s regime are larger than the whole period; anyway only two coefficients
regressing with Tobin’s Q and ROA are significant. The coefficients of the CAB
Connected in non-Thaksin’s regime show significantly positive sign when regressing
with ROA and insignificantly negative when the Tobin’s Q and ROE are regressed with.
For representative connected firms, it seems like that in both regimes, they cannot clearly
earn the positive effect from their political connection. Moreover, they seem to be rather
hurt as found in Table 6.
In short, Table 6 presents the outcome that under Thaksin’s regime, the cabinet
connected firms earns greater and more obvious benefits than non-Thaksin’s regime.

42
Table 6 The political connection and the performances of the firms – Thaksin’s regime and non-Thaksin’s regime
The dependent variables reported in this table are Tobin’s Q ratio, ROA and ROE of firms in each year t. Sample period is 1999-2008. The independent variables used are the same as they are fully shown in Table 5. CAB Connected and REP Connected are dummy variables which equal to 1 if the firm is considered as the cabinet direct connected firm for the first one and representative direct connected firm for another, 0 otherwise. In Panel A, the connections are found through shareholding and in Panel B the connection are found through board of director. The direct connection definition used for matching the political connection and 10% or 2 people cut-off point are applied to the political connection judgment. The regressions utilize the OLS method. . Robust standard errors are given in the parentheses. *, **, and *** indicate significance at the 10%, 5% and 1% level, respectively. As one can see, each reported panel is separated into two parts. The first part displays the coefficients of CAB Connected and REP Connected when the regression covers the period of Thaksin’s regime (2001-2005). And another report the coefficient of the political connection dummies as the model is regressed by using the period of non-Thaksin’s regime (1999-2000 and 2007-2008).
Panel A: Connection established through shareholding
Tobin's Q ROA ROE
Thaksin's Regime (2001-2005)
CAB Connected 0.885*** 0.063** 1.732** (0.233) (0.026) (0.834)
REP Connected -0.090*** -0.020 0.715 (0.028) (0.027) (0.638)
R2 21.95% 2.10% 1.35% Observation 1556 1820 1670
Non-Thaksin's Regime (1999-2000 & 2007 -2008)
CAB Connected -0.195*** 0.052** 0.182 (0.45) (0.025) (0.457)
REP Connected -0.095*** 0.020 0.147 (0.019) (0.013) (0.097)
R2 13.31% 7.60% 2.32% Observation 1140 1255 1163
Panel B: Connection established through board of director
Tobin's Q ROA ROE
Thaksin's Regime (2001-2005)
CAB Connected 0.557*** 0.008 0.967 (0.137) (0.023) (0.604)
REP Connected -0.034 -0.032*** 0.81 (0.068) (0.005) (0.723)
R2 20.01% 2.09% 1.34% Observation 1556 1820 1670
Non-Thaksin's Regime (1999-2000 & 2007 -2008)
CAB Connected -0.215*** 0.007 0.167 (0.078) (0.03) (0.141)
REP Connected -0.117 0.012 -0.688 (0.092) (0.009) (0.569)
R2 13.37% 7.58% 2.52% Observation 1140 1255 1163

43
Table 7 displays the regression results when the definition of political connection
used in two tables above are loosen. In this table the political connection definition turns
from merely direct connection to direct or strongly indirect and direct or indirect
connection. By doing this, it is possible to investigate how the change will be when the
firms of politicians’ relative, friends and conglomerates are included in the sample.
This table also reports the estimates by separating period into the whole period (1999-
2008), Thaksin’s regime (2001-2005) and non-Thaksin’s regime (1999-2000 and 2007-
2008). The first part, the result from the whole period of this study, will be dealt with
first.
Panel B represents the use of board of directors as the source of connection. The
estimated results in the first part of panel B seem consistent with one from the direct
connection meaning. Interestingly, the coefficients of CAB Connected are not all clear
lower when the loosen definitions of political connection are applied, still, for column 2,
4, 5, and 6 the coefficient of CAB Connected become statistically significant (while it is
not significant in the direct definition). These evidences support the usage of indirect
connection in the sample.
There is another point that deserves consideration. Although the terms used to
describe the indirect connection are classified into strongly and weakly indirect
connection, the reality seems not to be coherent with our set terms. As it is shown in
Table 7, the coefficient of CAB Connected from using the direct and strong indirect
connection definition do not persistently bigger and stronger significant than ones from
using direct and indirect connection definition (which include the firms considered as
weakly indirect connected with cabinet members into the samples). This evidence shows
that the beneficiaries from political connections do not solely cluster around the family of
politicians and their spouse, but also including the conglomerate and the friends of them.
Another model which breaks up the connection types into 6 dummies – [CAB,
REP]x[Direct, Strongly Indirect, Weakly Indirect] also applies. For the cabinet connected
firms, the results from using the definition of connection through shareholding show that
the strongly indirect connection does not significantly be found to contribute the
outperformance to the firms. Contrarily, the weakly indirect connection shows the
evidences of benefit received with positive and 5% significant numbers when Tobin’s Q

44
and ROE are regressed. When the connection through board membership angle is viewed,
dissimilar evidence appears. This time, the strongly indirect connection present supports
the performance of the firm in term of ROA (10% significant level) and ROE (5%
significant level) while the weakly indirect connection provides a low significant
evidence in respect of ROE. In the case of connection through shareholding, this finding
emphasizes the observation in the above paragraph again. In reality, the real strength of
the connection created between these people might not follow their literally meanings -
(strongly and weakly, in-low relative and business conglomerates).
Concisely, the first part of Table 7, both in Panel A and B, shows us that when the
loosen definitions are utilized; the evidences of benefits received from cabinet political
connections still persist. As the shareholding are the source of connection matching,
employing this loosen definitions cause the lower and weaker amount in estimated result.
As the board of director are the source of connection matching, using this loosen
definitions generate clearer evidences of exploiting political connections. When each type
of connection (direct connection, strong indirect connection and weak indirect
connection) is separately analyzed, the strong and weak indirect connection can both
contribute the outperformance as well.
In Table 6, the result shows that the benefits received from political connections
seem stronger in the period of Thaksin’s regime when the direct connection definition is
applied to the matching procedure. In Table 7, we also reinvestigate that finding but with
the use of the loosen definition. In Panel A, the first three columns show that when the
strongly indirect connection is added to the definition of connection, the results are still
similar one in Table 6 which utilizes the direct definition only. The firms connected with
cabinet members in Thaksin’s regime seem to earn more significant benefits than ones in
the non-Thaksin’s period. For the estimates of REP Connected, there are some changes in
the period of non-Thaksin’s regime. Not only the coefficients regressed with Tobin’s Q
shows deduction in its significant level (from 1% to 10%) but also ones regressed with
ROA and ROE also turn to be significantly positive.
In the last three column of Panel A which the direct and indirect connection
definition are utilized in matching procedure, firms considered as connected with cabinet
members in Thaksin’s regime no longer clearly overcome ones in non-Thaksin’s regime.

45
While the estimates for CAB Connected in Thaksin’s period still remain high and
significant, ones out-of-Thaksin’s period seem to rise in both amounts and significances –
the coefficient of CAB Connected running with Tobin’s Ratio turns to be positive and
ones running with ROA and ROE become positive at highly significant level. Looking at
the coefficients of REP Connected, there are still more satisfactory to have the indirect
connection with the representatives in the period of non-Thaksin’s regime. Even though
the connected firms still perform badly in term of Tobin’s Q ratio, they make a better job
when the ROA and ROE are focused. The evidence indicating that, in non-Thaksin’s
regime, the indirect connection with politicians could be relevant to the outperformance
of the firms coheres with the idea of Chaiwat (2006). Thanee Chaiwat suggests that
before the rising of Thaksin in 2001, the business people managed to influence the
government operation and policy either by having the close-relationship with the political
figures or by establishing their nominees in the political parties25. And it seems that these
forms of relationship refamiliarized in the period after Thaksin’s regime as well.
When the connection through board of directors is applied with 2 people cut-off,
there is a noteworthy point to share. This time, using the alternative definition does not
provide the clearly consistent evidence with one through shareholding. The benefits
received from CAB connection in Thaksin’s period are stronger than non-Thaksin’s
period as it is in Table 6 (which direct connection definition is utilized). The firms
considered as connected with representative provide the different results when the
different definitions of political connections are applied. The result from the use of direct
or strongly indirect connection definition tell us that, in term of ROA, the representative
connected firms have highly significant positive effect from their connection while the
result from using direct and indirect definition do not illustrate the apparent benefits
gained from their political connections. In the other hand, it is shown that they get hurt
25 He calls the first way as the vertical relationship which the link between the politicians and business units is established through the patronage system – The business sectors will not directly join in the political arena but struggle to resort to these politicians and encourage them to assure that their business will receive the protections and supports from the government. The second way is horizontal relationship. In this relationship, the business groups will send the agents into the political parties; some of them hold the important position in the parties. If those political parties have an opportunity to set up the government, the agents may have a chance to be the cabinet members controlling the ministry that relate to their business benefit.
46
from connecting with these representatives, in term of Tobin’s Q ratio. This latter
evidence also coheres with one in Table 6.
Although it is mostly found that the connections with representatives supply
somewhat underperformances, it is still intuitively sensible to expect that this negative
effect comes from the representatives who are on the opposition side. Surprisingly, it is
denoted in Table 8 that when the Tobin’s Q is regressed, the coefficients estimated
demonstrates the highly significant evidence of negative effect from connecting with
representatives from coalition parties and, still, low significant evidence of positive effect
contributed from the representatives from opposition parties. The evidence is re-
emphasized when we utilize the connection through board staff, because the coefficient
of REP_GOV Directed is highly significant and significant negative when Tobin’s Q
ratio and ROA are regressed.
Conclusively, this sub-section contributes six insights to the study. First, the
benefits from the connection with cabinet members do exist as it was indicated by Imai
(2006) and Bunkanawitcha et al. (2008). Second, the percentage of shares held by cabinet
connected people and number of connected boards in the firms are positively related with
the outperformance contributed by political connection. Third, the evidence of benefits
received seems to be stronger in the period of Thaksin’s regime. Fourth, when the loosen
definitions of connection are utilized, the size and the strength of the coefficients
estimated are affected. Fifth, by and large, the results from using the shareholding and the
board of directors (at the same level cut-off) as the sources of political connections are
quite consistent. Anyway, the use of shareholding as the source of political connection
seems to provide stronger evidences, particularly when Tobin’s Q ratio is regressed with.
Lastly, connections established through the representatives who in the coalition parties
does not seem to contribute any performances, In some cases, by contrast, it provides the
underperformance.

Table 7 The political connection and the performances of the firms – loosen definition of political connection & separate regime
The dependent variables reported in this table are Tobin’s Q ratio, ROA and ROE of firms in each year t. Sample period is 1999-2008. The independent variables used are the same as they are fully shown in Table 5. CAB Connected and REP Connected are dummy variables which equal to 1 if the firm is considered as cabinet connected firm for the first one and representative connected firm for another, 0 otherwise. The reported tables are separated into two panels. Panel A displays the coefficients of CAB Connected and REP Connected when the political connections are established through shareholding and Panel B exhibits ones when the political connections are established through board of director. The direct or strongly indirect connection definition used for matching the political connection is applied to the first three columns and the direct or indirect connection definition is applied to the last three. 10% cut-off point and 2 people cut-off are applied to the political connection judgment through shareholding and through the board of director, respectively. The regressions utilize the OLS method. . Robust standard errors are given in the parentheses. *, **, and *** indicate significance at the 10%, 5% and 1% level, respectively. Each panel is separated into three parts. The first part displays the coefficients of CAB Connected and REP Connected when the regression covers the whole period of our study(1999-2008), while the second exhibits ones of the period of Thaksin’s regime (2001-2005) and the last part exhibits one of non-Thaksin’s regime (1999-2000 and 2007-2008).
Panel A: Connection established through shareholding
(1) (2) (3) (4) (5) (6) Tobin's Q ROA ROE Tobin's Q ROA ROE Direct & Strongly Indirect Connection Direct & Indirect Connection
Whole Period (1999-2008)
CAB Connected 0.419*** 0.014 0.800* 0.311*** 0.020 0.916* (0.15) (0.011) (0.474) (0.091) (0.014) (0.515)
REP Connected -0.093*** -0.004 0.647 -0.014 -0.018 0.765 (0.028) (0.013) (0.536) (0.028) (0.017) (0.573)
R2 16.00% 2.18% 0.93% 15.88% 2.20% 0.94% Observation 3074 3492 3230 3074 3492 3230
Thaksin's Regime (2001-2005)
CAB Connected 0.659*** 0.027* 1.093* 0.386*** 0.025*** 1.283* (0.167) (0.015) (0.581) (0.125) (0.009) (0.712)
REP Connected -0.123*** -0.007 0.806 -0.006 0.014 0.919 (0.023) (0.023) (0.656) (0.034) (0.02) (0.737)
R2 21.48% 7.60% 1.34% 20.39% 2.08% 1.36% Observation 1556 1820 1670 1556 1820 1670
Non-Thaksin's Regime (1999-2000 & 2007 -2008)
CAB Connected -0.202*** 0.018 0.257 0.168 0.057*** 0.462*** (0.05) (0.043) (0.425) (0.145) (0.011) (0.143)
REP Connected -0.087* 0.025** 0.176*** -0.087*** 0.082** 0.291*** (0.045) (0.01) (0.051) (0.033) (0.037) (0.073)
R2 13.33% 2.07% 2.33% 13.41% 7.92% 2.42% Observation 1140 1255 1163 1140 1255 1163
47

Panel B: Connection established through board of director
(1) (2) (3) (4) (5) (6) Tobin's Q ROA ROE Tobin's Q ROA ROE Direct & Strongly Indirect Connection Direct & Indirect Connection
Whole Period (1999-2008)
CAB Connected 0.205** 0.022* 0.640* 0.108* 0.012** 0.780* (0.097) (0.013) (0.369) (0.065) (0.005) (0.467)
REP Connected -0.046 -0.012 0.676 -0.069** -0.033* 0.789 (0.033) (0.011) (0.666) (0.027) (0.017) (0.747)
R2 15.44% 2.19% 0.93% 15.45% 2.24% 0.95% Observation 3074 3492 3230 3074 3492 3230
Thaksin's Regime (2001-2005)
CAB Connected 0.398*** 0.006 0.77 0.157*** 0.012 1.207* (0.088) (0.025) (0.507) (0.046) (0.012) (0.709)
REP Connected -0.055 -0.032*** 1.021 -0.095*** -0.023* 1.22 (0.042) (0.012) (0.894) (0.031) (0.014) (1.088)
R2 19.87% 2.10% 1.35% 19.73% 2.09% 1.38% Observation 1556 1820 1670 1556 1820 1670
Non-Thaksin's Regime (1999-2000 & 2007 -2008)
CAB Connected -0.173*** 0.014 0.312* -0.109** -0.001 0.244** (0.032) (0.025) (0.184) (0.047) (0.009) (0.095)
REP Connected -0.036 0.035*** -0.272 -0.057** -0.088 -0.192 (0.044) (0.011) (0.375) (0.027) (0.061) (0.334)
R2 13.33% 7.64% 2.39% 13.33% 8.06% 2.37% Observation 1140 1255 1163 1140 1255 1163
48

49
Table 8 The political connection and the performances of the firms – representatives of coalition and opposition parties
The dependent variables reported in this table are Tobin’s Q ratio, ROA and ROE of firms in each year t. Sample period is 1999-2008. The independent variables used are the same as they are fully shown in Table 4. CAB Connected, REP_GOV Connected, and REP_OPP Connected are dummy variables which equal to 1 if the firm is considered as the cabinet direct connected firm for the first one, representative direct connected firm which the representative(s) it connects with is in the coalition party for the next one and representative direct connected firm which the representative(s) it connects with is in the opposition party for the rest, 0 otherwise. The reported tables are separated into two panels. Panel A displays the estimates when the political connections are established through shareholding and Panel B exhibits ones when the political connections are established through board of director. The direct connection definition used for matching the political connection and 10% cut-off point for Panel A and 2 people cut-off point for Panel B are applied to the political connection judgment. The regressions utilize the OLS method. . Robust standard errors are given in the parentheses. *, **, and *** indicate significance at the 10%, 5% and 1% level, respectively.
Panel A: Connection established through shareholding
Tobin's Q ROA ROE
CAB Connected 0.535*** 0.037** 1.124* (0.204) (0.017) (0.641)
REP_GOV Connected -0.218*** 0.012 0.855 (0.033) (0.015) (0.768)
REP_OPP Connected 0.081* -0.030 0.354 (0.049) (0.028) (0.361)
R2 16.21% 2.20% 0.93% Observation 3074 3492 3230
Panel B: Connection established through board of director
Tobin's Q ROA ROE
CAB Connected 0.336** 0.019 0.763 (0.142) (0.013) (0.487)
REP_GOV Connected -0.26*** -0.036** 0.825 (0.045) (0.017) (0.733)
REP_OPP Connected 0.199 0.007 0.654 (0.152) (0.014) (0.486)
R2 15.98% 2.20% 0.93% Observation 3074 3492 3230
5.2 The coup study
Impact of the coup d’état
The coup in 2006 is a good material for studying the impact of sudden acquisition
and loss of power by using military force. To study on the side which gains the power, in
Table 9 regression analysis is conducted by using the buy-and-hold abnormal returns
(BHARs) as the dependent variable. BHARs are focused on 1-year BHARs prior the
coup, 6-month, 1-year and-2 year after the coup. Table 9 is divided into two panels which
50
presenting the results from using the direct connection definition as the political
connection definition in Panel A and direct or strongly indirect definition in Panel B. The
panel using the direct or indirect connection definition is not herein exhibited because the
politically connected firms sample are the same as done in panel B – there is no firms
considered as weakly indirect connects with politicians in year 2007. Due to the small
sample size of politically connected firms in year 2007, this study will use only one
political dummy indicating the firms considered as connect with both cabinet members
and representatives of that year. This is sensible because these people similarly come
from the mandate of the military who arrange s the coup. Interestingly, the results shown
in Table 9 show no benefit received from the coup for politically connected firms of 2007
comparing with the significant positive returns contributed from the connection when 1-
year prior BHARs is estimated. Moreover, the coefficient estimated presents the
significant negative amounts implying the stock returns of the firms connects with
military juntas, on average, underperform after the coup was broken out. This evidence
persists and becomes greater and stronger even the time goes by from six-month to one-
year and from one-year to two-year. Anyway the prediction power of the model is highest
in the short-run. In Panel A, after control for several factors, it is shown in the regression
that the firms connected with cabinet members from the coup earns 15.3%, 32.5% and
54.8% negative returns after the coup.
It is worth to note that the same models are run by using the more lenient
definition of political connection which is strongly indirect connection in Panel B. The
results we obtain share the similar evidence. Yet for the 6-month BHARs after the
election period, the coefficient of CAB Connected becomes significant.
The finding from this table demonstrates a contrast to the finding illustrated in
Bunkanawitcha et al. (2008) which focus on the first regime of Thaksin Shinawatra’s
government. The paper shows the evidence of exploitive garner from the uprising in
political power after a year passed by. However, the natures of the two regimes are
different and this might be a reason of diverse evidence. There are four reasons to support
this argument. First, it is the difference of the incentive to exploit through policy. The
cabinet members in the period of PM Surayud Chulanont, who was appointed from the
CNS, are not the primary fiduciary of the firms. They are not businesspeople; most of

51
them came from the military, the bureaucrats and the technocrats. No any families of
cabinet members and CNS held 10% or more of shares in a firm in SET. These facts
differ from what appeared in the government of Thaksin’s which had eight eligible firms
in 2001. Second, CNS and the government promised to stay in office for only a year.
Hence, people knew that any benefits contributed from the government were likely to be
short-lived and, moreover, some policies would take several months to be implemented
and so could be modified or cancelled by the next government. Third, the political
instability deriving from the organized protesters continued. During this time the group
of protestors changed from the yellow-shirts, who were strongly against Thaksin, to the
so-called red ones, who strongly support him. Even though the CNS attempted to slash
Thaksin’s political influences, the people who supported Thaksin did not give up while
his popularity was still high in the north and north-east region, of which the total
constituencies bear 54% of 400 elected members of the House of Representatives. This
situation might lead people to foresee the vindication after the CNS and its government
left the office and Thaksin’s came back. Lastly, the government led by Samak
Sundaravej, who once claimed that he was the nominee of Thaksin, won the election in
2007. The implicit return of Thaksin’s regime substantiated the fear of the opponents of
Thaksin and the atmosphere of vindication became stronger. This might indicate why
even the coup was passed for two years, the military juntas connected firms were still
performing defectively.
Briefly, Table 9 presents the evidence of negative buy-and-hold abnormal returns
from assuming power of the politicians who assume power from the coup d’état on
September 2006.

52
Table 9 The political connection and the buy-and-hold stock returns after the coup – power gainers’ side
The dependent variable reported in this table is buy-and-hold abnormal returns (BHARs) of firms. The accounting - independent variables (Size (natural log of total asset), Ln(Age in Month) (natural log of monthly age of firms), DE Ratio, IntCover (interest coverage), Asset Growth (yearly asset growth rate) and OprInc/Asset (operating Income divided by total asset)) are measured at year 2006. DE ratio is divided by 1000 and Interest coverage is divided by 10000 to reduce the decimal points of coefficients. Industry classification follows SET standard. CAB Connected and REP Connected are dummy variables which equal to 1 if, in year 2007, the firm is considered as connected with Cabinet members for the first one and representatives for another, 0 otherwise. The connections are found through SH-BD Cooperation connection. In Panel A, the direct connection definition is used for matching the political connection. In Panel B, the direct or strongly indirect connection definition is used for matching the political connection and, in this panel, only the coefficient of political dummy is reported. The regressions utilize the OLS method. Robust standard errors are given in the parentheses. *, **, and *** indicate significance at the 10%, 5% and 1% level, respectively.
Pre-Coup Period Post-Coup Period 1-Year BHARs 6-Month BHARs 1-Year BHARs 2-Year BHARs
Panel A: Results from using the direct connection definition
Constant -0.114 -0.009 -0.478 0.616 (0.572) (0.253) (0.415) (0.671)
CAB Connected 0.486*** -0.153 -0.325*** -0.548** (0.147) (0.139) (0.092) (0.213)
REP Connected 2.709 -0.286*** -0.134 -0.325* (2.178) (0.092) (0.158) (0.189)
Size -0.010 -0.018 0.033 0.004 (0.033) (0.013) (0.021) (0.034)
Ln(Age in month) 0.011 0.054 -0.02 -0.219** (0.057) (0.039) (0.054) (0.091)
DE Ratio 0.000 0.004*** 0.005*** 0.012*** (0.003) (0.001) (0.002) (0.003)
IntCover 0.000 -0.001* -0.004*** 0.001 (0.002) (0.001) (0.001) (0.004)
Asset Growth 0.061 0.486* 0.334 -0.250 (0.153) (0.294) (0.229) (0.183)
OprInc/Asset 1.228*** 0.271 0.135 -2.757 (0.343) (0.261) (0.483) (1.898)
Industry Dummies YES YES YES YES
R2 22.02% 23.41% 18.63% 15.42% Panel B: Results from using the direct or strongly indirect connection definition
CAB Connected 0.263** -0.14** -0.306*** -0.445*** (0.11) (0.061) (0.058) (0.133)
REP Connected 0.803 -0.050 -0.092 -0.55*** (0.873) (0.200) (0.171) (0.179)
R2 13.87% 23.13% 19.21% 15.96% Observations 328 328 328 328

53
On the side of the power loser, the same model as done in Table 9 is used, but this
time the political dummies used specify the firms connecting with the politicians in 2006,
the last year of Thaksin’s regime and just before the occurrence of the coup. The result
from Table 10, Panel A, shows us that when the direct connection is merely applied to the
definition of political connection, there is no significant evidence intimating the loss of
these politically connected firms, in term of 6-month 1-year and 2-year BHARs.
However, the negative signs of the coefficient estimated still cohere with our intuition.
In this Table, Panel B shows the result from adding the strongly indirect
connection into the political connection definition. The results points out some
differences to the ones in Panel A. In this Panel, the coefficient of CAB Connected
exhibits the negative number which is significant at 5% level and 10% level when the 6-
month and 1-year BHARs is used as dependent variable, respectively. These negative
significant numbers intimate that the connected firms received the negative impacts from
the happening of the coup, in term of stock returns. However, they persist in the short-run
(6-month and 1-year), period which is under the military junta administration.
When the meaning of political connection is more relaxed to the direct or indirect
connection definition, Panel C, same as Panel A, provides the negative numbers on the
coefficients of CAB Connected when 6-month BHARs and 1-year BHARs are regressed
with, though the estimates are not significant. The finding in this panel does not support
the argument that the firms connecting with the overthrown cabinet get hurt from the
coup.
The difference in the results shown in Panel B and others might come from the
small sample size of cabinet connected firms in a year (10 firms for direct connection
definition and 16 firms for strongly indirect and direct connection definition) which
causes the result sensitive to each individual sample. On the other hand, it might also
come from the fact that, the in-law relative firms of the cabinets were actually worse-off
when the coup happened. In the period of Thaksin’s regime, these firms might obtain
some benefits from their relative status, but in the period of military junta these benefit
could be restrained. Because, after the coup, the cabinet members were still perceived as
the companions or underlings of Mr. Thaksin, the ex-PM whom overthrown by the coup,
these people who suddenly losing their power could be seen as ones who are on the other

54
side of the military junta. Hence, it is also sensible to think further that the people who
have strongly linkages to the cabinet members – such as his/her relative and in-law
relative – still support them and still, on the other side of the junta. With these reason, it
was logical to believe that there was somewhat poor atmosphere for the prosperity of
these firms. It is also interesting to note that after the coup lapses for two years, BHARs
seems to be insignificant at all, this might be because the resumption of power by PPP
(People’s Power Party, formerly the Thai Rak Thai party). Even though, the negative sign
of the estimate of CAB Connected still goes on, this could be due to the continuance of
deep political instability, mainly caused by PAD, the so-called yellow shirts people who
are strongly against Mr. Thaksin Shinawatra and his companions (or minions). Shortly,
this table presents quite opaque evidence indicating that the firms connecting with cabinet
members earn unpleasant effect from the outbreak of the coup, in term of 6-month and 1-
year buy-and-hold abnormal returns.
Shortly, Table 9 and Table 10 indicate no evidence of the outperformance earned
after the outbreak of the coup for both sides; Surayud’s government and the military who
assumed power after the coup and Thaksin’s government who lost the power after such
event. There might be a set of words that fits well with the results “No one gains from
this fight”.

55
Table 10 The political connection and the buy-and-hold stock returns after the coup – power losers’ side
The dependent variable reported in this table is buy-and-hold abnormal returns (BHARs) of firms. The accounting - independent variables (Size (natural log of total asset), Ln(Age in Month) (natural log of monthly age of firms), DE Ratio, IntCover (interest coverage), Asset Growth (yearly asset growth rate) and OprInc/Asset (operating Income divided by total asset)) are measured at year 2006. DE ratio is divided by 1000 and Interest coverage is divided by 10000 to reduce the decimal points of coefficients. Industry classification follows SET standard. CAB Connected and REP Connected are dummy variables which equal to 1 if, in year 2006, the firm is considered as connected with Cabinet members for the first one and representatives for another, 0 otherwise. The connections are found through SH-BD Cooperation connection. In Panel A, the direct connection definition is used for matching the political connection. In Panel B and C, the direct or strongly indirect connection definition and direct or indirect connection are used for matching the political connection and, in these panels, only the coefficients of political dummy are reported. The regressions utilize the OLS method. Robust standard errors are given in the parentheses. *, **, and *** indicate significance at the 10%, 5% and 1% level, respectively.
Pre-Coup Period Post-Coup Period 1-Year BHARs 6-Month BHARs 1-Year BHARs 2-Year BHARs
Panel A: Results from using the direct connection definition
Constant -0.147 0.204 0.051 0.518 (0.570) (0.261) (0.486) (0.562)
CAB Connected -0.183 -0.165 -0.169 -0.282 (0.129) (0.110) (0.153) (0.564)
REP Connected -0.083 -0.064 -0.103 -0.103 (0.104) (0.063) (0.078) (0.131)
Size -0.030 -0.018 0.029 -0.001 (0.036) (0.013) (0.021) (0.034)
Ln(Age in month) 0.036 0.061 -0.007 -0.209** (0.059) (0.039) (0.053) (0.089)
DE Ratio 0.000 0.005*** 0.005*** 0.012*** (0.003) (0.001) (0.002) (0.003)
IntCover 0.000 -0.001** -0.004*** 0.001 (0.002) (0.001) (0.001) (0.004)
Asset Growth 0.110 0.493* 0.352 -0.231 (0.163) (0.292) (0.222) (0.189)
OprInc/Asset 1.181*** 0.267 0.13 -2.752 (0.344) (0.262) (0.48) (1.898)
Industry Dummies YES YES YES YES
R2 11.10% 23.51% 18.84% 15.35% Panel B: Results from using the direct or strongly indirect connection definition
CAB Connected -0.224 -0.262** -0.255* -0.303 (0.153) (0.117) (0.150) (0.487)
REP Connected -0.056 -0.028 -0.059 -0.037 (0.094) (0.060) (0.077) (0.131)
R2 11.16% 24.38% 19.05% 15.34% Panel C: Results from using the direct or indirect connection definition
CAB Connected -0.021 -0.125 -0.105 0.085 (0.135) (0.088) (0.122) (0.413)
REP Connected -0.09 0.004 0.018 -0.01 (0.085) (0.049) (0.066) (0.102)
R2 11.04% 23.33% 18.35% 15.18% Observations 328 328 328 328

56
Table 11 reports the result from the equation like the one shown in Table 10,
Panel A, but it divides the dummy marking the representative connected firms (REP
Connected) into 2 groups which are the firms connecting with the representatives from
the coalition parties (REP_GOV Connected) and the firms connecting with the
representatives from the opposition parties (REP_OPP Connected). The outcome from
the estimation indicates that the firms directly connecting with the representative from the
coalition parties earn the negative effect, which is significant at 10% level, from the
happening of the coup. This may imply that markets conjecture these firms are in the
group that would receive somewhat discontent effects comparing with the period before
the coup. There is another interesting point in the signs of the estimated coefficients,
while all politically connected firms received negative effect from their connection when
the 6-month BHARs is considered, the unlikable effect seems to be minimal for the firms
connecting with the representatives from the opposition parties. Yet, when the 2-year
BHARs is regressed, the estimates of REP_GOV Connected turns to be positive. These
could imply that the negative effect from the coup is clearer in the firms connecting with
the politicians from the coalition parties.
Table 11 The political connection and the buy-and-hold stock returns after the coup – representatives of coalition and opposition parties
The dependent variable reported in this table is buy-and-hold abnormal returns (BHARs) of firms. The accounting - independent variables used are the same as they are fully shown in Table 10. CAB Connected, REP_GOV Connected, and REP_OPP Connected are dummy variables which equal to 1 if, in year 2006, the firm is considered as the cabinet direct connected firm for the first one, representative direct connected firm which the representative(s) it connects with is in the coalition party for the next one and representative direct connected firm which the representative(s) it connects with is in the opposition party for the rest, 0 otherwise. The connections are found through SH-BD Cooperation connection. The direct connection definition is used for matching the political connection. The regressions utilize the OLS method. Robust standard errors are given in the parentheses. *, **, and *** indicate significance at the 10%, 5% and 1% level, respectively.
Pre-Coup Period Post-Coup Period 1-Year BHARs 6-Month BHARs 1-Year BHARs 2-Year BHARs
CAB Connected -0.182 -0.163 -0.169 -0.285 (0.128) (0.11) (0.152) (0.562)
REP_GOV Connected -0.080 -0.070 -0.205* -0.280 (0.166) (0.115) (0.119) (0.202)
REP_OPP Connected -0.090 -0.050 -0.030 0.005 (0.087) (0.09) (0.124) (0.159)
R2 11.12% 23.42% 19.14% 15.50% Observations 328 328 328 328

57
The event study on the coup d’état
Table 12 presents the results from the event study of coup d’état on 19 September
2006. The politically connected firms are classified by politicians they connect with (the
cabinet members of year 2006 (Panel A), the representatives of year 2006 who are in the
coalition parties (Panel B), representatives of year 2006 who are in the opposition parties
(Panel C), the cabinet members and representatives of year 2007 who were appointed by
the military junta (Panel D and E) and the matched-cabinet connected firms and matched
representative connected firms (Panel F)). Due to very small politically connected firms
sample and for practical report, this section uses SH-BD Cooperation as the source of
connection. Each panel is separated into three parts which are the results from applying
direct connection definitions, direct or strongly indirect connection and direct or indirect
connection into the judgment procedures. In the Panel A which the result of cabinet
connected firms are shown, one can see that all thirty-six cumulative abnormal returns for
the cabinet members are entirely negative and more than a half demonstrate the sign of
significances. This could iterate the idea that the firms connected to the cabinet of
Thaksin Shinwatra in that period get hurt from the breaking out of the coup. Amid the
presented six event windows, the event window covering two weeks before the coup till
the coup weeks show the greatest and strongest amount. However, the abnormal return
table that is modeled but not physically shown, and Figure 3, explain that the negative
impact from the happening of the coup on the cabinet connected firms tends to highly
concentrate in the coup week. On average, in the week of the coup, the cabinet connected
firms suffer by around negative 12% of the abnormal returns adjusted by CAPM and
around negative 8% when adjusted by three-factor model. Interestingly, even the
definition of political connections is loosened, the negative impact these firms earn from
the sudden coup is not alleviated. In contrast, it seems to be stronger when the associates
of cabinet members are included as one can see when the direct and indirect definition is
applied to the connection matching; all the cumulative abnormal returns present
significances.
In Panel B, which the firms connecting with the representative from the coalition
parties are focused, it is shown that because there are no any significant abnormal returns,
the evidences of negative impact from the coup are not strong. When the definition are

58
more and more relax, the negative effects the connected firms realize become disappear
which could view as the negative effect from the coup could not reach to these firms. –
The market might not recognize the links as well as the junta. – In brief, this panel
interprets the data that the government side representative connected firms do not
obviously be hurt from the coup.
Interestingly, in Panel C, the firms connected with the representative of
opposition parties seem to earn far better effect comparing with the cabinet connected
firms. When CAPM adjusted are used, twelve of eighteen abnormal returns are positive,
still, eight of them illustrate the significances. However the significant abnormal returns
are likely generated from the prior period of the occurrence of the coup which may be
from the rumor about the coup itself and the higher degree of the demonstration against
Thaksin Shinawatra’s PM status. Shortly, this panel presents that the firms connecting
with the representative of opposition parties could positively be affected by the outbreak
of the coup (which means the end of the Thaksin’s regime as well).
In Panel D and E, the event study is applied on the firms connecting with the
politicians rising up from the coup, all cumulative abnormal return are negative but only
one of them is significant. This can be interpreted as the firms connected with these
politicians do not earn benefit from the coup around the coup event. This could be due to
the reason given in the last sub-section that focuses on BHARs or because the names of
these politicians are not revealed in the short-time after the coup. It takes around two
weeks to know the name list of the cabinet members and the Member of Constitution
Drafting Assembly and the Member of Constitution Drafting Committee – which
considered as the representatives in this year are appointed in the time that beyond our
window period. In short, at that time the market does not realize the names of the new
politicians rising from the coup, so it could not pick the firms connecting with the new
politicians as well.
For comparability reason, the result obtained from the matched firms is applied in
Panel F. As one can see, the matched-cabinet connected firms show insignificant sign for
both CAPM adjusted and 3-Factor adjusted. For the matched-representative connected
firms, only one of (0,-1) window present the evidence of significant, while others are not.

59
Shortly, this panel indicates that the matched firms do not received significant effect from
the outbreak of the coup.
In Figure 3, which shows the cumulative CAPM-adjusted returns, it is postulated
that the returns of politically connected stocks represent different degrees of shock on the
coup date and while they started around the same place in a month before the coup, time
were wearing out the government side stock.
In conclusion, this sub-section demonstrates the evidence from the event study
that while the firms connecting with cabinet members under PM Thaksin earned
significant negative cumulative abnormal returns around the coup event, the firms
connecting with representatives of the coalition parties obtain the negative effect with
lower level. In the other hand, the firms connecting with representatives from the
opposition parties enjoy the occurrence of the coup as their stock make significant
cumulative abnormal returns around this event.

Table 12 Event study on coup d’état on September 2006
This table reports the cumulative weekly abnormal returns of politically connected firms around the event of the coup d’état, 19 September 2006. The week of coup event (18th – 22th September) are perceived as the week zero. The politically connected firms are classified by politicians they connect with (cabinet members, representatives who are in the coalition parties and representatives who are in the opposition parties) and the definitions of connection applied into the judgment procedures (direct connection, direct and strongly indirect connection, direct and indirect connection). The source of political connection is from Cooperation. The political connection dummies are generated from the information of year 2006 and 2007. Abnormal returns are adjusted by CAPM and 3-factors model which their coefficients used are estimated from weekly returns in 2004 to 2006. Cumulative abnormal returns are sum of all abnormal returns over the window; (-4,4), (-2,2), ,(-2,-1), (-2,0), (0,1), (0,4).t-value are given in the parentheses. *, **, and *** indicate significant difference from zero at the 10%, 5% and 1% level, respectively.
CAPM Adjusted 3-Factors Adjusted (-4,4) (-2,2) (-2,1) (-2,0) (0,1) (0,4) (-4,4) (-2,2) (-2,1) (-2,0) (0,1) (0,4)
Panel A: Cabinet connected portfolio (2006)
Direct Connection -5.66 -3.25 -3.3 -9.67** -6.18* -5.45 -6.29 -4.66 -3.06 -6.78* -4.23 -5.5 (1.52) (0.84) (1.13) (2.36) (1.87) (1.26) (1.65) (1.24) (1.1) (1.84) (1.29) (1.27)
Direct & Strongly Indirect Connection
-5.76* -4.35 -5.06* -10.93** -7.06** -5.29* -6.35** -5.6 -4.83* -8.38** -5.33* -5.37* (2.06) (1.33) (1.8) (2.7) (2.44) (1.82) (2.22) (1.73) (1.75) (2.16) (1.86) (1.84)
Direct & Indirect Connection
-5.04** -4.57* -5.38** -10.47*** -6.53*** -5.54** -4.82* -5.39** -4.76** -7.55** -4.54* -5.17** (2.08) (1.95) (2.37) (3.27) (2.85) (2.56) (1.93) (2.25) (2.12) (2.5) (2.04) (2.37)
Panel B: Representative connected portfolio – Coalition parties (2006)
Direct Connection -1.00 0.00 -1.63 -5.28 -3.56 -2.56 -2.33 -2.10 -2.17 -3.81 -2.42 -3.22 (0.3) (0.00) (0.55) (1.42) (1.62) (1.14) (0.72) (0.64) (0.75) (1.06) (1.14) (1.45)
Direct & Strongly Indirect Connection
1.64 3.95 1.15 -0.89 -1.10 0.65 0.56 2.16 0.84 0.83 0.17 0.17 (0.59) (1.57) (0.53) (0.42) (0.9) (0.32) (0.2) (0.88) (0.39) (0.39) (0.14) (0.08)
Direct & Indirect Connection
2.3 4.03** 2.12 0.43 -0.76 0.73 1.58 2.78* 1.98 1.89 0.29 0.45 (1.22) (2.58) (1.59) (0.32) (0.89) (0.56) (0.84) (1.8) (1.49) (1.44) (0.34) (0.34)
Panel C: Representative connected portfolio – Opposition parties (2006)
Direct Connection 4.18** 3.82*** 2.31* 2.38* -1.91** 0.17 4.02** 3.44*** 2.47** 3.42** -1.22 0.19 (2.29) (3.46) (1.92) (1.84) (2.26) (0.13) (2.14) (2.92) (2.07) (2.73) (1.42) (0.14)
Direct & Strongly Indirect Connection
4.52** 3.64*** 2.44** 2.3* -1.32 0.72 4.32** 3.23*** 2.54** 3.2*** -0.7 0.69 (2.64) (3.32) (2.17) (1.98) (1.59) (0.55) (2.46) (2.79) (2.33) (2.89) (0.85) (0.53)
Direct & Indirect Connection
1.89 0.54 -0.65 -0.35 -1.84*** -0.62 0.60 -0.69 -0.51 1.51 -0.35 -1.59 (0.86) (0.37) (0.44) (0.24) (2.69) (0.45) (0.26) (0.46) (0.35) (1.05) (0.48) (1.05)
60

61
Table 12 Event study on coup d’état on September 2006 – (continue)
CAPM Adjusted 3-Factors Adjusted (-4,4) (-2,2) (-2,1) (-2,0) (0,1) (0,4) (-4,4) (-2,2) (-2,1) (-2,0) (0,1) (0,4)
Panel D: Cabinet connected portfolio (2007)
Direct Connection -4.7 -0.87 -2.46 -1.84 -2.2 -3.26 -4.46 -0.61 -2.02 -1.57 -1.95 -3.05 (1.42) (0.52) (0.78) (0.7) (1.02) (1.17) (1.43) (0.39) (0.73) (0.62) (0.93) (1.2)
Direct & Strongly
Indirect Connection 0.98 -1.00 -1.56 -1.01 -1.55 -0.74 0.81 -1.44 -0.36 -0.84 -0.75 -0.71 (0.44) (0.76) (0.88) (0.62) (1.4) (0.55) (0.38) (1.09) (0.24) (0.53) (0.71) (0.55)
Panel E: Representative connected portfolio (2007)
Direct Connection -1.27 -5.99 -7.23 -5.27 -4.21 -4.34 -0.13 -5.33 -2.18 -3.33 -1.11 -3.02* (0.27) (1.29) (1.1) (1.06) (1.49) (5.18) (0.03) (0.9) (0.37) (0.62) (0.49) (7.75)
Direct & Strongly
Indirect Connection -4.42 -2.53 -5.06 -2.88 -2.76 -4.28 -4.99 -3.73 -3.02 -2.8 -1.37 -4.37 (0.85) (0.63) (1.41) (0.83) (1.41) (1.32) (0.96) (0.91) (0.93) (0.83) (0.74) (1.36)
Panel F: Matched portfolio Direct Matched-CAB
Connected 0.31 1.54 -1.41 -0.73 -1.82 -0.64 0.33 1.32 0.56 -0.19 -0.54 -0.43 (0.1) (0.66) (1.1) (0.37) (1.21) (0.22) (0.11) (0.61) (0.37) (0.1) (0.33) (0.15)
Direct Matched-REP
Connected 1.95 1.23 -1.68 -0.03 -2.24*** -1.06 1.47 0.29 0.08 0.10 -1.02 -1.17 (1.30) (1.10) (1.55) (0.02) (2.76) (1.05) (0.98) (0.26) (0.08) (0.09) (1.33) (1.16)

62
‐15.0
‐10.0
‐5.0
0.0
5.0
10.0
‐5 ‐4 ‐3 ‐2 ‐1 0 1 2 3 4
Return
Date
5
CAB Connected (06) REP_GOV Connected (06)REP_OPP Connected (06) CAB Connected (07)REP Connected (07) MATCHED_CAB
Figure 3: Cumulative abnormal returns for politically connected stocks around 2006 Coup event
The figure providing additional details on Table 12 shows cumulative abnormal returns for politically connected firms around the event of 2006 Coup. The week of coup event (18th – 22th September) is perceived as the week zero. The abnormal returns are calculated by CAPM-adjusted method. The definition of political connection utilized is direct connection, the source of political connection are “SH-BM cooperation”. The sample are classified into four groups as Table 12 which are 1) Cabinet connected firms of year 2006 (CAB Connected (06)) 2) Firms connecting with representatives of year 2006 who are in the coalition parties (REP_GOV Connected (06)) 3) Firms connecting with representatives of year 2006 who are in the opposition parties (REP_OPP Connected (06)) 4) Cabinet connected firms of year 2007(CAB Connected (07)) 5) Representatives connected firms of year 2007(REP Connected (07)) 6) Matched-cabinet connected firms and 7) Matched-representative connected firms.
The impact of winning/losing an election
As one can see in Table 13, the government side stocks both cabinets connected
and representatives connected seems to considerably favor the winning on 2007 national
election. When the CAPM-adjusted returns are focused, all returns of cabinet connected
stock in the Panel A are all positive and more than a half are significant. When the 3-
factor-adjusted is applied, only two returns result are significant, however all of them are
still positive. The results in the Panel A also illustrates the evidence of the tighter
definition of connection, the greater the abnormal returns.

63
Even though with a smaller size, the firms connecting with representatives in the
coalition parties also earn the positive contribution from the victory while almost all
cumulative abnormal returns in the Panel B show the positive sign. As well as cabinet
connected firms, their direct connected firms enjoy the victory more than the indirect
ones. This panel could be interpreted that the government side representative connected
firms also enjoy from the victory of the national election.
As for the firms connecting with representatives from opposition parties, the
results in Panel C and Figure 4 imply the negative impact from the failure to win the
election on the election week. Although there is no clear sign for the all windows, only
ones those are significant are negative which are in the window (-2,0). The window (-2,0)
period is the interesting one, because the figure shown below imply that the movement in
the prices and returns seem to start moving differently from other two politically
connected portfolio in two weeks before the election week. One can see that the
movement of cabinet connected and government side representative connected firms
started branching out in this week as well. It might be because the expectation of the
population becomes clearer when the election comes nearer. Shortly, this panel presents
that the firms connecting with the representative of opposition parties did not earn or
earns less positive effect from their failure to be the government side comparing with the
ones from the coalition parties.
It is dissimilar to the coup event which the effect of winning election tends to last
longer for the cabinet connected firms (Figure 4). This might be because it takes a month
to establish the cabinet members so the firms connecting to these peoples are still not
certain if they would get the connection with cabinet members status. The figure below
could help to support the argument; it is shown that the firms connecting with cabinet and
government side parties carry on moving upward, even though the election week was
passed.
Shortly, Table 13 and figure 4 present the event study fingering that firms
connecting with cabinet members and representatives who were in the coalition parties
enjoyed the cumulative abnormal returns inspired from their victory in the 2007 national
election while the firms connecting with the opposition parties did not get that pleasant
effect.

Table 13 Event study on the national election on December 2007
This table reports the cumulative weekly abnormal returns of politically connected firms around the event of the national election, 23 December 2007. The week of national election event (24th – 28th December) are perceived as the week zero. The politically connected firms are classified by politicians they connect with (cabinet members, representatives who are in the coalition parties and representatives who are in the opposition parties) and the definitions of connection applied into the judgment procedures (direct connection, direct and strongly indirect connection, direct and indirect connection). The political connection dummies are generated from the information of year 2008. The source of political connection is from Cooperation. Abnormal returns are adjusted by CAPM and 3-factors model which their coefficients used are estimated from weekly returns in 2005 to 2007. Cumulative abnormal returns are sum of all abnormal returns over the window; (-4,4), (-2,2), (-2,1), (-2,0), (0,1), (0,4).t-value are given in the parentheses. *, **, and *** indicate significant difference from zero at the 10%, 5% and 1% level, respectively.
CAPM Adjusted 3-Factors Adjusted (-4,4) (-2,2) (-2,1) (-2,0) (0,1) (0,4) (-4,4) (-2,2) (-2,1) (-2,0) (0,1) (0,4)
Panel A: Cabinet connected portfolio
Direct Connection 21.3* 16.86* 13.7* 9.80* 9.00 16.09 12.32 11.69 8.28 6.40 5.69 8.58 (2.31) (2.21) (2.08) (1.98) (1.69) (1.71) (1.35) (1.64) (1.34) (1.33) (1.12) (0.91)
Direct & Strongly Indirect Connection
18.32* 14.42* 12.06* 8.58* 7.85 12.44 11.6 10.41 7.68 6.05 5.13 6.67 (2.15) (2.04) (2.03) (1.93) (1.65) (1.39) (1.46) (1.65) (1.43) (1.44) (1.15) (0.8)
Direct & Indirect Connection
6.3* 6.68** 5.97** 3.04 4.88** 5.19 3.18 4.57* 3.35 1.89 3.18* 2.24 (1.75) (2.42) (2.49) (1.65) (2.54) (1.53) (0.99) (1.86) (1.53) (1.11) (1.78) (0.72)
Panel B: Representative connected portfolio – Coalition parties
Direct Connection 5.81 3.85 2.73 1.92 1.73 4.34 5.77 3.21 1.27 1.98 0.65 3.64 (1.11) (1.72) (0.99) (0.93) (1.23) (1.4) (1.09) (1.28) (0.49) (0.96) (0.53) (1.07)
Direct & Strongly Indirect Connection
3.25 4.74* 4.91** 2.10 4.05** 1.79 1.38 3.15 2.59 1.45 2.47* -0.33 (0.83) (2.04) (2.22) (1.31) (2.77) (0.74) (0.34) (1.39) (1.3) (0.91) (1.88) (0.12)
Direct & Indirect Connection
1.96 4.10* 4.47* 1.92 4.38*** 1.83 -0.04 2.48 2.15 1.21 2.81** -0.36 (0.51) (1.81) (2) (1.19) (3.16) (0.8) (0.01) (1.23) (1.12) (0.79) (2.25) (0.15)
Panel C: Representative connected portfolio – Opposition parties
Direct Connection 0.92 1.91 0.00 -1.58* 0.57 1.66 1.00 1.73 -0.5 -1.52* 0.19 1.47 (0.58) (1.25) (0) (2.02) (0.6) (1.32) (0.53) (1.05) (0.41) (1.81) (0.2) (1.01)
Direct & Strongly Indirect Connection
0.13 1.60 0.10 -1.3* 0.39 1.07 0.38 1.47 -0.39 -1.17 0.00 0.99 (0.08) (1.25) (0.1) (1.76) (0.49) (0.98) (0.22) (1.06) (0.37) (1.46) (0.01) (0.79)
Direct & Indirect Connection
-1.46 1.06 -0.27 -1.76** 0.06 0.04 -1.02 1.01 -0.71 -1.56* -0.30 0.08 (0.77) (0.9) (0.30) (2.29) (0.10) (0.05) (0.55) (0.83) (0.76) (1.97) (0.46) (0.08)
64

65
Table 13 Event study on the national election on December 2007 – (continue)
Panel D: Matched portfolio Direct Matched-CAB
Connected -3.11 0.98 1.19 0.70 0.18 -2.59* -3.95 0.08 0.92 -0.77 -0.85 -3.74* (1.58) (0.76) (1.23) (0.69) (0.17) (1.77) (1.55) (0.05) (0.79) (0.68) (0.77) (1.93)
Direct Matched-REP Connected
-1.22 1.24 -0.37 1.14 1.36*** 1.27 -0.32 1.31 0.03 0.63 0.91** 1.53 (0.77) (1.54) (0.54) (1.64) (3.00) (1.16) (0.21) (1.61) (0.04) (0.91) (2.10) (1.37)

66
‐5.0
0.0
5.0
10.0
15.0
20.0
25.0
‐5 ‐4 ‐3 ‐2 ‐1 0 1 2 3 4 5
Return
Date
Class1 Connected Class2_GOV ConnectedClass2_OPP Connected MATCHED CABMATCHED REP
Figure 4: Cumulative abnormal returns for politically connected stocks around 2007 national election
The figure providing additional details on Table 13 shows cumulative abnormal returns for politically connected firms around the event of 2007 national election. The week of election event (24th – 28th December 2007) is perceived as the week zero. The abnormal returns are calculated by CAPM-adjusted method. The definition of political connection utilized is direct connection, the source of political connection are “SH-BM cooperation”. The sample are classified into three group which are 1) Cabinet connected firms 2) Firms connecting with representatives who are in the coalition parties 3) Firms connecting with representatives who are in the opposition parties 4) Matched-cabinet connected firms and 5) Matched-representative connected firms.

67
5.3 Political connection, governance, and firm specific information
The study continues on the benefits received from political connection in the
former section by adding some controls that might be omitted in preceding papers into
the models. They are corporate governance (Corporate Governance Index (CGI), CGI
components) and the hypothesized information flow variables (the idiosyncratic volatility
(IDIO), and the probability of informed-base trading (PIN)). This addition will lead us to
the answer of the main research question of this paper, i.e. after controlling for corporate
governance and information flow, will the politically connected firms still outperform
their peers?.
In Table 14, this issue is investigated by adding control variables and their
interaction terms with political connection dummy into the regression. Due to statistic
insignificance of representative connection dummy (REP Connected) in the model run
with these added variables, they are not used in the equations and only effectual CAB
Connected dummy is utilized. This table is arranged in two panels which each panel is
divided into two parts. Panel A reports the result from using the connection found
through shareholding as the definition of political connection whereas Panel B uses the
political connection found through board of director. Tobin’s Q ratio is employed as
dependent variable in the first part and ROA is used in the second part. Table 14
organizes the results obtained with eight columns which are different in adding CGI,
IDIO, PIN, and their interaction with the cabinet connection dummy in the model used
before in Table 5.
The outcomes obtained in the first column shows that after the corporate
governance level among firms is controlled in our preceding used regression model, the
estimates of CAB Connected are still highly significant as the same for the equation used
Tobin’s Q and ROA as dependent variables. Hence, the insight we obtain from the former
section can still be sustained. As for the corporate governance control, the estimates of
CGI show us the positive signs for both dependent variables in both panels. Meanwhile,
particularly for the equation used Tobin’s Q as the dependent variable, the coefficient of
CGI is highly significant. The latter evidence could be interpreted that the firms having
higher corporate governance standard tends to outperform the firms with lower one,

68
especially in term of Tobin’s Q ratio. This evidence is in line with the finding of GIM
(2003), Bebchuk et al. (2008) and Bhagat et al. (2008).
The interaction term between the CGI and cabinet connected dummy is added to
the model in column 2 and the coefficient of CAB Connected still indicates that the
cabinet connected firms can generate the outperformance. Even though, the statistical
significance shows somewhat less strong in the result from Panel A. The coefficient
estimate of CGI is still similar to ones in the first column – it is highly significant and
presents a little greater amount when the interaction term is inserted. For the interaction
term, CAB Connected*CGI, its estimates in both panel demonstrate the negative signs
and ones of Panel B, both for Tobin’s Q ratio and ROA, show the evidence of statistic
significance (at 10% significance level for equation used Tobin’s Q and 5% level for
another). This finding could be interpreted that while connecting with cabinet or having
superior governance level could bring the pleasant performance to the firms, having both
does not earn another additional positive effect. Besides, the high governance standard
could impede the attempt to exploit benefits from the political connections one have. This
might be because the corporate governance standard is also based on transparency and
openness that are disparate to the exploitation on political connection which needs some
opaqueness. It could be the case that the firms that have very high governance standard
are the firms that their manager, employee and big shareholder believe in good
governance and have top-level integrity in the aspect of a firm and the nation; hence they
would not try to take advantage from the political connection.

Table 14 The political connection, corporate governance and the performances of the firms
The dependent variables reported in this table are Tobin’s Q ratio and ROA of firms in each year t. Sample period is 2001-2008. DE ratio is divided by 1000 to reduce the decimal points of coefficients. The accounting - independent variables (Size (natural log of total asset), Revenue/Total Asset, DE Ratio and ln(Age in Month) (natural log of monthly age of firms)) are measured at year t-1. Corporate Governance Index (CGI) is measured at year t-1 while the idiosyncratic volatility (IDIO) and the probability of information based trading (PIN) are measured at year t. Industry classification follows SET standard. State-owned enterprise equals to 1 if 20% of more of shares of the firm is held by government who is also the biggest shareholder for the year. CAB Connected is dummy variables which equal to 1 if the firm is considered as the cabinet direct connected firm, 0 otherwise. The connections are found through shareholding for Panel A and through board of director for Panel B. The direct connection definition is used for matching the political connection. 10% cut-off point is applied to the political connection judgment through shareholding and 2 people cut-off through the board of director. The regressions utilize the OLS method. . Robust standard errors are given in the parentheses. *, **, and *** indicate significance at the 10%, 5% and 1% level, respectively.
69

Panel A: Connection established through shareholding
(1) (2) (3) (4) (5) (6) (7) (8) Dependent Variable: Tobin’s Q Ratio
Constant 1.417*** 1.405*** 1.643*** 1.651*** 1.037*** 1,047*** 1.734*** 0.824*** (0.441) (0.444) (0.467) (0.467) (0.383) (0.378) (0.572) (0.364)
CAB Connected 0.544*** 1.029** 0.645*** 0.816*** 1.004*** 1.355*** 1.38*** 1.378 (0.126) (0.433) (0.094) (0.158) (0.089) (0.398) (0.438) (1.004)
CGI 0.295*** 0.317*** 0.284*** 0.357*** (0.056) (0.062) (0.082) (0.085)
CAB Connected*CGI -0.912 -1.204 -0.024 (0.946) (0.896) (1.203)
IDIO -0.026*** -0.025** -0.024** (0.01) (0.01) (0.01)
CAB Connected*IDIO -0.185* -0.222** (0.109) (0.096)
PIN 0.038 0.055 0.098 (0.129) (0.129) (0.125)
CAB Connected*PIN -1.436 -1.478 (1.559) (1.921)
Size 0.016 0.016 0.004 0.003 0.03 0.03 0.002 0.028 (0.021) (0.021) (0.025) (0.025) (0.023) (0.023) (0.024) (0.024)
Revenue/Total Assets 0.108*** 0.108*** 0.11*** 0.113*** 0.138*** 0.139*** 0.112*** 0.141*** (0.02) (0.02) (0.018) (0.02) (0.02) (0.02) (0.022) (0.022)
DE Ratio -0.004 -0.004 -0.001 -0.001 -0.001 -0.001 -0.002 -0.001 (0.012) (0.012) (0.012) (0.012) (0.01) (0.01) (0.013) (0.009)
ln(Age in month) -0.085*** -0.084*** -0.063*** -0.062*** -0.099*** -0.1*** -0.076*** -0.093*** (0.01) (0.01) (0.01) (0.01) (0.028) (0.027) (0.01) (0.026)
State-owned Enterprise 0.027 0.025 0.031 0.035 0.006 0.007 0.04 0.007 (0.075) (0.075) (0.079) (0.077) (0.121) (0.121) (0.078) (0.123)
Industry Dummy YES YES YES YES YES YES YES YES Year Dummy YES YES YES YES YES YES YES YES
R2 21.46% 21.52% 18.77% 18.91% 21.89% 22.26% 22.01% 21.81% Observations 2402 2402 2474 2474 1675 1675 2402 1636 70

Table 14 The political connection, corporate governance and the performances of the firms – (continue)
(1) (2) (3) (4) (5) (6) (7) (8) Dependent Variable: ROA
Constant 0.067 0.066 0.145 0.146 0.067 0.067 0.124 0.011 (2.310) (0.231) (0.178) (0.178) (0.045) (0.046) (0.232) (0.047)
CAB Connected 0.067*** 0.082* 0.065*** 0.081*** 0.044*** 0.066* 0.107** 0.067 (0.017) (0.049) (0.017) (0.02) (0.013) (0.035) (0.047) (0.062)
CGI 0.086 0.086 0.071 0.082*** (0.061) (0.06) (0.061) (0.016)
CAB Connected*CGI -0.029 -0.049 -0.007 (0.074) (0.074) (0.081)
IDIO -0.006*** -0.006*** -0.005*** (0.002) (0.002) (0.002)
CAB Connected*IDIO -0.018** -0.019*** (0.007) (0.007)
PIN 0.003 0.004 0.006 (0.018) (0.018) (0.018)
CAB Connected*PIN -0.089 -0.096 (0.112) (0.121)
Size -0.010 -0.010 -0.012 -0.012 0.000 0.000 -0.012 0.000 (0.013) (0.013) (0.013) (0.013) (0.002) (0.002) (0.013) (0.002)
Revenue/Total Assets 0.022 0.022 0.023 0.023 0.015*** 0.015*** 0.022 0.015*** (0.015) (0.015) (0.014) (0.014) (0.005) (0.005) (0.015) (0.004)
DE Ratio -0.002*** -0.002*** -0.002*** -0.002*** -0.002*** -0.002*** -0.002*** -0.002*** (0.000) (0.000) (0.000) (0.000) (0.000) (0.000) (0.000) (0.000)
ln(Age in month) 0.015** 0.015** 0.015** 0.015** -0.01** -0.01** 0.016** -0.009** (0.006) (0.006) (0.006) (0.006) (0.004) (0.004) (0.007) (0.004)
State-owned Enterprise 0.055 0.055 0.060 0.061 -0.004 -0.004 0.057 -0.014 (0.043) (0.043) (0.038) (0.038) (0.01) (0.01) (0.043) (0.009)
Industry Dummy YES YES YES YES YES YES YES YES Year Dummy YES YES YES YES YES YES YES YES
R2 1.92% 1.92% 1.96% 1.96% 22.14% 22.15% 1.98% 24.22% Observations 2582 2582 2667 2667 1744 1744 2582 1694 71

Table 14 The political connection, corporate governance and the performances of the firms – (continue 2)
Panel B: Connection established through board of director
(1) (2) (3) (4) (5) (6) (7) (8) Dependent Variable: Tobin’s Q Ratio
Constant 1.344*** 1.336*** 1.561*** 1.560*** 0.762*** 0.759*** 1.636*** 0.519 (0.433) (0.431) (0.436) (0.416) (0.318) (0.323) (0.514) (0.305)
CAB Connected 0.751*** 1.943*** 0.738*** 0.707** 1.255*** 1.463*** 2.158** 1.378 (0.219) (0.749) (0.213) (0.317) (0.273) (0.515) (0.929) (1.004)
CGI 0.305*** 0.329*** 0.284*** 0.357*** (0.063) (0.078) (0.101) (0.085)
CAB Connected*CGI -2.329* -2.541* -0.024 (1.261) (1.37) (1.203)
IDIO -0.026*** -0.026*** -0.024** (0.009) (0.009) (0.01)
CAB Connected*IDIO 0.019 -0.076 (0.263) (0.287)
PIN 0.017 0.028 0.098 (0.128) (0.143) (0.125)
CAB Connected*PIN -0.762 -1.478 (2.417) (1.921)
Size 0.023 0.023 0.012 0.012 0.047** 0.047** 0.01 0.028 (0.02) (0.02) (0.023) (0.022) (0.02) (0.02) (0.021) (0.024)
Revenue/Total Assets 0.094*** 0.096*** 0.095*** 0.095*** 0.117*** 0.116*** 0.096*** 0.141*** (0.015) (0.015) (0.014) (0.013) (0.01) (0.01) (0.016) (0.022)
DE Ratio -0.002 -0.002 0.001 0.001 -0.002 -0.002 0.001 -0.001 (0.01) (0.01) (0.01) (0.01) (0.009) (0.009) (0.011) (0.009)
ln(Age in month) -0.088*** -0.088*** -0.066*** -0.066*** -0.097*** -0.097*** -0.081*** -0.093*** (0.01) (0.01) (0.013) (0.012) (0.027) (0.026) (0.01) (0.026)
State-owned Enterprise -0.046 -0.044 -0.043 -0.043 -0.137 -0.136 -0.033 0.007 (0.076) (0.077) (0.078) (0.081) (0.114) (0.113) (0.084) (0.123)
Industry Dummy YES YES YES YES YES YES YES YES Year Dummy YES YES YES YES YES YES YES YES
R2 21.71% 21.94% 18.64% 18.64% 22.32% 22.35% 22.25% 21.81% Observations 2402 2402 2474 2474 1675 1675 2402 1636 72

Table 14 The political connection, corporate governance and the performances of the firms – (continue 3)
(1) (2) (3) (4) (5) (6) (7) (8) Dependent Variable: ROA
Constant 0.058 0.058 0.139 0.137 0.056 0.056 0.116 -0.001 (0.229) (0.229) (0.177) (0.178) (0.042) (0.043) (0.231) (0.045)
CAB Connected 0.056** 0.123*** 0.055** 0.016 0.061** 0.045 0.056 0.164 (0.025) (0.047) (0.024) (0.041) (0.03) (0.048) (0.101) (0.108)
CGI 0.089 0.090 0.073 0.082*** (0.06) (0.06) (0.061) (0.016)
CAB Connected*CGI -0.132** -0.068 -0.212 (0.06) (0.114) (0.188)
IDIO -0.006*** -0.006*** -0.006*** (0.002) (0.002) (0.002)
CAB Connected*IDIO 0.024 0.019 (0.03) (0.035)
PIN 0.002 0.001 0.004 (0.018) (0.02) (0.02)
CAB Connected*PIN 0.059 -0.004
(0.257)
73
24.54%
YES YES
1694
-0.002***
(0.237)
Size -0.009 -0.009 -0.011 -0.011 0.001 0.001 -0.011 0.001 (0.013) (0.013) (0.013) (0.013) (0.002) (0.002) (0.013) (0.002)
Revenue/Total Assets 0.02 0.02 0.022 0.022 0.014*** 0.014*** 0.02 0.015*** (0.015) (0.015) (0.014) (0.014) (0.004) (0.004) (0.015) (0.004)
DE Ratio -0.002*** -0.002*** -0.002*** -0.002*** -0.002*** -0.002*** -0.002*** (0.000) (0.000) (0.000) (0.000) (0) (0) (0) (0)
ln(Age in month) 0.014** 0.014** 0.014** 0.014** -0.01** -0.01** 0.016** -0.009** (0.006) (0.006) (0.006) (0.006) (0.004) (0.004) (0.007) (0.004)
State-owned Enterprise 0.048 0.048 0.054 0.055 -0.010 -0.010 0.051 -0.021** (0.043) (0.043) (0.037) (0.037) (0.008) (0.007) (0.042) (0.008)
Industry Dummy YES YES YES YES YES YES YES Year Dummy YES YES YES YES YES YES YES
R2 1.90% 1.90% 1.94% 1.95% 22.34% 21.07% 1.96% Observations 2582 2582 2667 2667 1744 1744 2582

74
In Table 15, the model used in the first column of Table 14 is rerun by replacing
CGI with its components as the explanatory variable. The table is organized in the same
manner as Table 14 which is divided into 2 panes and each panel has two parts. The
estimated equations are arranged in 6 equations – fives for each component in the model
and another for all components in one equation. While CAB Connected dummies are
significantly positive for all equations, only two components of CGI demonstrate the
significant evidences for the first five columns.
When the Tobin’s Q ratio is applied as dependent variable, the coefficient of
Board structure component in the first column shows the significant-positive number at
10% level and the estimate of Disclosure & Transparency component provides the highly
significant-positive figure in the fifth column. The estimates of other components also
illustrate positive sign, although they are not significant. And in the time that ROA is
utilized as dependent variable, the estimates of Conflict of Interest present the significant
positive numbers at 10% level in the second column and the coefficient of Disclosure &
Transparency component also generate the highly significant-positive number in the fifth
column as the outcomes of using Tobin’s Q. The estimates of other components also
present positive sign except one of Board Responsibility in Panel A, however they are not
significant. These evidences are consistent when the definition of connection is switched
from through shareholding to through board of director. Interestingly, when the all
components are all added in the model as it is shown in the last column, Board structure
and Conflict of Interest lose it significant power in the equation and merely the
coefficient of Disclosure & Transparency is able to show the significant sign, still, it is at
1% level. This evidence might indicate a noteworthy point as it is found in Cheung et al.
(2007) and Doidge (2007) that among the components of corporate governance index, the
financial disclosure or disclosure and transparency are the most relevant component to
the firms’ accounting characteristic and performances. Furthermore, the results obtained
in the fifth and sixth columns in Table 15 also suggest that using only disclosure and
transparency component might be more relevant to the performance of the firms, in term
of ROA, than using the whole corporate governance index. As one can see that the
coefficients of Disclosure & Transparency demonstrate the highly significant and
positive number when it is regressed with both Tobin’s Q and ROA, the estimate of CGI
in the first column of Table 14 only present the significance when employing Tobin’s Q

75
ratio as dependent variable. Hence, the disclosure and transparency component could
show its relevance to the more various performances. Once again the results in this table
express the consistence with Cheung et al. (2007) and Doidge (2007).
Table 14 deals with the issue of information flow. When the firm-specific
variation in third column is controlled, the cabinet connected firms can still earn the
outperformance with highly statistic significance. The evidence obtained in the third
column of Table 15 also point out the influence of idiosyncratic volatility seems not to
follow our hypothesis which we hypothesize it as the proxy of information flow. In
contrast with the corporate governance indicator (CGI), idiosyncratic volatility (IDIO)
appears to be the factor that hinders the satisfying performance. As it is shown in the
table, the estimates of IDIO in column 3 present the negative numbers with highly
significant evidence. The results, however, is not in line with Ferreira et al. (2007) which
presents the result pointing that idiosyncratic volatility, the proxy of private information
flow, positively relates with the profitability of the firms and associates with the efficient
corporate investments. If the information served to the market or openness really bring
the good performance to the firms, the results in column 3 and 4 tend tofollow the
arguments of Kelly (2007) and Ashbaugh-Skaife (2006) who assert that the idiosyncratic
volatility is not an appropriate proxy of information flow and has no explicit association
with it. Nontheless, it could be interpreted that the firms with high idiosyncratic volatility
are the uninteresting firms which are likely to have less analyst coverage (Chan et al.
2006) or they are small-capitalization firms (Malkiel and Xu (1997)). The rise of high
idiosyncratic variation in these firms can be explained. First, it could be because these
firms, as aforementioned, have less analyst coverage, are smaller and received less
attention from the market. Their prices occasionally move i and, sometimes, keeps
stagnant for a period. Thus it seems to have less co-movement with the market which in
turn, generates higher idiosyncratic volatility. Second, Thai market is dominated by the
firms with big capitalization in the SET of which the share price and volumes
significantly affects, SET index. Hence, the very big firms tend to have less firm-specific
variation comparing with the small firms.

76
Table 15 The political connection, corporate governance and the performances of the firms – CGI components
The dependent variables reported in this table are Tobin’s Q ratio and ROA of firms in each year t. Sample period is 2001-2008. DE ratio is divided by 1000 to reduce the decimal points of coefficients. The accounting - independent variables (Size (natural log of total asset), Revenue/Total Asset, DE Ratio and ln(Age in Month) (natural log of monthly age of firms)) are measured at year t-1. The components of Corporate Governance Index (CGI) – (Board Structure, Conflict of Interest, Board Responsibility, Shareholder Right and Disclosure & Transparency) – are measured at year t-1. Industry classification follows SET standard. State-owned enterprise equals to 1 if 20% of more of shares of the firm is held by government who is also the biggest shareholder for the year. CAB Connected is dummy variable which equal to 1 if the firm is considered as the cabinet direct connected firm f, 0 otherwise. The connections are found through shareholding for Panel A and through board of director for Panel B. The direct connection definition is used for matching the political connection. 10% cut-off point is applied to the political connection judgment through shareholding and 2 people cut-off through the board of director. The regressions utilize the OLS method. . Robust standard errors are given in the parentheses. *, **, and *** indicate significance at the 10%, 5% and 1% level, respectively.
Panel A: Connection established through shareholding
(1) (2) (3) (4) (5) (6) Dependent Variable: Tobin’s Q Ratio
Constant 1.408*** 1.532*** 1.532*** 1.520*** 1.411*** 1.364*** (0.441) (0.435) (0.461) (0.426) (0.447) (0.471)
CAB Connected 0.547*** 0.555*** 0.555*** 0.550*** 0.542*** 0.542*** (0.132) (0.127) (0.123) (0.123) (0.128) (0.126)
Board Structure 0.142* 0.126 (0.078) (0.091)
Conflict of Interest 0.018 -0.072 (0.074) (0.115)
Board Responsibility 0.004 -0.150 (0.135) (0.193)
Shareholder Right 0.058 -0.050 (0.08) (0.092)
Disclosure & Transparency
0.302*** 0.375*** (0.046) (0.086)
Size 0.021 0.019 0.02 0.019 0.022 0.015 (0.021) (0.022) (0.021) (0.022) (0.023) (0.023)
Revenue/Total Assets 0.108*** 0.108*** 0.108*** 0.108*** 0.073*** 0.109*** (0.02) (0.02) (0.02) (0.02) (0.019) (0.02)
DE Ratio -0.004 -0.004 -0.004 -0.004 0.001 -0.004 (0.012) (0.012) (0.012) (0.012) (0.001) (0.012)
ln(Age in month) -0.084*** -0.089*** -0.089*** -0.088*** -0.098*** -0.074*** (0.01) (0.01) (0.01) (0.009) (0.024) (0.012)
State-owned Enterprise 0.035 0.043 0.044 0.045 0.016 0.02 (0.073) (0.07) (0.077) (0.075) (0.059) (0.067)
Industry Dummy YES YES YES YES YES YES Year Dummy YES YES YES YES YES YES
R2 21.42% 21.34% 21.33% 21.35% 21.65% 21.79% Observations 2402 2402 2402 2402 2402 2402

77
Table 15 The political connection, corporate governance and the performances of the firms – CGI components (continue)
(1) (2) (3) (4) (5) (6) Dependent Variable: ROA
Constant 0.096 0.102 0.104 0.095 0.075 0.096 (0.214) (0.214) (0.231) (0.228) (0.217) (0.216)
CAB Connected 0.070*** 0.071*** 0.071*** 0.066*** 0.067*** 0.066*** (0.015) (0.015) (0.017) (0.022) (0.016) (0.021)
Board Structure 0.009 -0.005 (0.021) (0.027)
Conflict of Interest 0.054* 0.042* (0.03) (0.024)
Board Responsibility -0.003 -0.063 (0.053) (0.049)
Shareholder Right 0.054 0.036 (0.088) (0.099)
Disclosure & Transparency
0.078*** 0.081 (0.027) (0.05)
Size -0.008 -0.010 -0.008 -0.009 -0.010 -0.011 (0.014) (0.013) (0.013) (0.012) (0.013) (0.012)
Revenue/Total Assets 0.022 0.022 0.022 0.022 0.022 0.022 (0.015) (0.015) (0.015) (0.015) (0.015) (0.015)
DE Ratio -0.002*** -0.002*** -0.002*** -0.002*** -0.002*** -0.002*** (0.000) (0.000) (0.000) (0.000) (0.000) (0.000)
ln(Age in month) 0.014** 0.013** 0.014** 0.014** 0.016** 0.015** (0.006) (0.006) (0.006) (0.006) (0.006) (0.006)
State-owned Enterprise 0.059 0.054 0.059 0.060 0.054 0.051 (0.040) (0.043) (0.041) (0.040) (0.041) (0.038)
Industry Dummy YES YES YES YES YES YES Year Dummy YES YES YES YES YES YES
R2 1.88% 1.91% 1.88% 1.92% 1.95% 2.00% Observations 2582 2582 2582 2582 2582 2582

78
Table 15 The political connection, corporate governance and the performances of the firms – CGI components (continue 2)
Panel B: Connection established through board of director
(1) (2) (3) (4) (5) (6) Dependent Variable: Tobin’s Q Ratio
Constant 1.378*** 1.495*** 1.481*** 1.481*** 1.373*** 1.322*** (0.454) (0.445) (0.474) (0.441) (0.459) (0.487)
CAB Connected 0.747*** 0.761*** 0.761*** 0.755*** 0.747*** 0.734*** (0.22) (0.221) (0.22) (0.219) (0.22) (0.218)
Board Structure 0.131* 0.110 (0.077) (0.092)
Conflict of Interest 0.026 -0.069 (0.068) (0.11)
Board Responsibility 0.03 -0.119 (0.143) (0.195)
Shareholder Right 0.065 -0.046 (0.085) (0.093)
Disclosure & Transparency
0.303*** 0.364*** (0.051) (0.091)
Size 0.028 0.026 0.027 0.025 0.019 0.022 (0.02) (0.021) (0.02) (0.021) (0.02) (0.022)
Revenue/Total Assets 0.094*** 0.094*** 0.094*** 0.094*** 0.094*** 0.095*** (0.015) (0.015) (0.014) (0.015) (0.015) (0.014)
DE Ratio -0.001 -0.002 -0.002 -0.002 -0.003 -0.002 (0.01) (0.01) (0.01) (0.01) (0.01) (0.01)
ln(Age in month) -0.088*** -0.093*** -0.092*** -0.092*** -0.083*** -0.078*** (0.011) (0.01) (0.01) (0.009) (0.01) (0.013)
State-owned Enterprise -0.037 -0.032 -0.030 -0.029 -0.049 -0.051 (0.074) (0.07) (0.078) (0.075) (0.075) (0.065)
Industry Dummy YES YES YES YES YES YES Year Dummy YES YES YES YES YES YES
R2 21.71% 21.65% 21.58% 21.58% 21.59% 21.90% Observations 2402 2402 2402 2402 2402 2402

79
Table 15 The political connection, corporate governance and the performances of the firms – CGI components (continue 3)
(1) (2) (3) (4) (5) (6) Dependent Variable: ROA
Constant 0.079 0.083 0.085 0.076 0.057 0.079 (0.209) (0.210) (0.227) (0.224) (0.213) (0.211)
CAB Connected 0.058** 0.06** 0.059** 0.055** 0.056** 0.053** (0.024) (0.025) (0.025) (0.027) (0.025) (0.026)
Board Structure 0.009 -0.006 (0.021) (0.027)
Conflict of Interest 0.055* 0.042* (0.029) (0.024)
Board Responsibility 0.000 -0.060 (0.052) (0.048)
Shareholder Right 0.057 0.038 (0.087) (0.098)
Disclosure & Transparency
0.079*** 0.081 (0.027) (0.05)
Size -0.007 -0.009 -0.007 -0.009 -0.009 -0.011 (0.014) (0.013) (0.013) (0.012) (0.013) (0.012)
Revenue/Total Assets 0.021 0.02 0.021 0.021 0.02 0.021 (0.015) (0.015) (0.014) (0.015) (0.015) (0.015)
DE Ratio -0.002*** -0.002*** -0.002*** -0.002*** -0.002*** -0.002*** (0) (0) (0) (0) (0) (0)
ln(Age in month) 0.013** 0.012** 0.013** 0.014** 0.015** 0.015** (0.006) (0.006) (0.006) (0.006) (0.006) (0.006)
State-owned Enterprise 0.052 0.047 0.053 0.054 0.047 0.045 (0.041) (0.044) (0.041) (0.04) (0.041) (0.037)
Industry Dummy YES YES YES YES YES YES Year Dummy YES YES YES YES YES YES
R2 1.88% 1.91% 1.88% 1.92% 1.95% 2.00% Observations 2582 2582 2582 2582 2582 2582
In the fourth column, we insert the interaction term of cabinet connection dummy
and idiosyncratic volatility into the model. The interaction term shows negative and
significant signs in the first panel which utilize the shareholding as the source of the
political connection definition. This evidence further indicates that among the cabinet
connected firms, the firms with high firm-specific variation further get negative effect, or
in another view, the firms that have low firm-specific variation are the real one that earns
benefits from their connection. Nevertheless, the results in Panel B do not conform to
these characteristics and the estimates of the interaction terms present the positive sign,
even though, they are not significant.

80
In column 5 and 6, IDIO in column 3 and 4 are replaced by the probability of
informed-base trading, PIN, the proxy of the private information. When the probability of
informed-base trading is regressed with Tobin’s Q ratio in column 5, its estimates show
positive sign in all parts of both panels, however they are not significant. The positive
relationship between PIN the accounting performance is consistent with the finding of
Ferreira et al. (2007) which also finds the insignificant association between PIN and the
profitability (ROE). In the sixth column, the interaction term between cabinet connected
dummy is added into the equation. However, its coefficients are not strong enough to be
significant. The estimates of CAB Connected are still positive and highly significant even
when private information flow in the column fifth is controlled. In column sixth, which
the interaction term is added, the coefficient of cabinet connection dummy are still
similar to column 5, that is significant and positive except one from the second part of
Panel B which present the insignificant result. The evidence from column 5 and 6 do not
clearly support the argument that the firms, having higher private information flow which
is a proxy of openness, can generate the outperformance.
In conclusion, this section provides the evidence indicating that after controlling
for the corporate governance level, idiosyncratic volatility and the probability of
information-based trading of the firms, the politically connected firms can still
outperform the non-connected ones. This insight is meaningful to reject the first null
hypothesis. Furthermore, the firms with superior corporate governance standards could
enjoy the better performances and one with higher firm-specific variation could realize
the underperformance comparing with their peers. Hence, the second null hypothesis was
repudiated, particularly for the governance issue, as well.

CHAPTER VI
CONCLUSION
This study investigates the effects of political connection and corporate
governance level on the performances of the listed firms in SET during 1999-2008. The
politicians are classified into two groups: the cabinet members and the representatives.
There are two sources of political connection used in this study; the first is the
shareholding list and the second is the board of director list. The political connections are
also classified into three levels which are direct connection, strongly indirect connection
and weakly indirect connection. Corporate Governance Index (CGI) is used as the proxy
of the corporate governance level of firms and the idiosyncratic volatility (IDIO) and the
probability of informed-trading (PIN) will be proposed as the proxies of information
flow. The CGI is conducted following Ananchotikul (2007) approach. In term of
accounting performance, the results indicate that the firms connecting with the cabinet
members significantly outperform the markets while the firms connecting with the
representatives are not. This evidence is condensed in the period of 2001-2005 when the
direct connection and direct or strongly indirect connection are applied in the meaning of
the political connections. This evidence is consistent with the work of Imai (2006) and
Bunkanawitcha et al. (2008). However, when the direct or indirect connection is used in
the matching process, the cabinet connected firms in 2001-2005 can have the
outperformance likewise ones in the other (1999-2000 and 2007-2008). When the
representatives is refined into the representatives from the coalition parties and ones from
the opposition parties, interestingly, the firms connecting with the representative from the
coalition parties received negative effect from their political connection. When the
governance level and the proxy of private information flow are controlled, the
outperformance of cabinet connected firms still persists. Moreover, the result from the
study points out that the firms that have higher corporate governance level will have
better performance, especially in term of Tobin’s Q ratio. The obtained results also
indicate that the component of CGI that is relevant to the firms’ performances is
Disclosure and Transparency. Even though, the firms having higher private information
flow cannot acquire the outperformance.

82
This research also studies the effect of the coup in 2006 on the stock returns of
politically connected firms by using the event study on weekly returns and the regression
models on the buy-and-hold portfolio. The result from the event study suggests that the
firms connecting with the overthrown cabinet members received significantly negative
effect from the happening of coup while the firms connecting with representatives from
the opposition parties received the positive effect. By using the regression model on buy-
and-hold stock returns, the firms direct or strongly indirect connecting with the
overthrown cabinet members receive the significantly negative effect, likewise the firms
connecting with the politicians rising from the coup.
Nevertheless, this study has some limitations. First, it is the limitation arising
from lack of data, particularly PIN and CGI variables. Corporate Governance Index is not
available for the first two years of the whole period of study (1999-2000). And the
shortage of PIN data is from the technical computation problem which, in ideal case,
requires the considerably effective parallel computers to estimate. The missing variable
could affect the results. Second limitation is the political connection data. The
information on the indirect connections with politicians which deal with the connection
through in-law relative, close relationship and business conglomerates cannot be claimed
to be complete because this kind of information is not acknowledged in general public.
Eventually, the insight provided by this study could be further explored in several
aspects. The next research may extend the classification of politicians to other politically
related officials such as the advisory committee of the ministers, the cabinet secretary-
generals and the senators. Moreover, of the benefits from political connection could be
extended to other matters, such as earning quality, the internal transactions, stock
performance on other events and the usage of nominee in Thai entities.

REFERENCE
Achavanantakul, S. 2006. The use of nominees in Stock Exchange of Thailand. Academic Conference on Towards Clarity in Governance Rules and Regulations: Issues Stemming from the Sale of Shin Corporation [Online]. Available from: http://www.fringer.org/wp-content/writings/nominee-present.pdf [2006, August 25].
Ananchotikul, S. 2007. Does foreign investment really improve corporate governance,
Evidence from Thailand. University of California Working paper. Andres, C., and E. Theissen. 2008. Setting a fox to keep the geese: Does the comply-or-
explain principle work?. Journal of Corporate Finance 14: 289-301. Antoniou, A., and P. Holmes. 1995. Futures trading, information and spot price volatility:
evidence for the FTSE-100 Stock Index Future contract using GARCH. Journal of Banking and Finance 19: 117-129.
Antoniou, A., P. Holmes, and R. Priestley. 1998. The effect of Stock Index Futures
Trading on Stock Index volatility: An analysis of the asymmetric response of volatility to news. Journal of Futures Markets 18: 151-166.
Antoniou, A., G. Koutmos, and A. Pericli. 2005. Index futures and positive feedback
trading: evidence from major stock exchanges. Journal of Empirical Finance 12: 219-238.
Ashbaugh-Skaife, H., D. W. Collins, and R. LaFond. 2006. The effects of corporate
governance on firms’ credit ratings. Journal of Accounting and Economics 42: 203–243.
Ashbaugh-Skaife, H., J. Gassen, and R. LaFond. 2006. Does stock price synchronicity
represent firm-specific information? The international evidence. Working paper. Bai, C. E., Q. Liu, J. Lu, F. M. Song, and J. Zhang. 2004. Corporate governance and
market valuation in China. Journal of Comparative Economics 32: 559-616. Bebchuk, L., A. Cohen, and A. Ferrell. 2009. What matter in corporate governance?. The
Review of Financial Studies 22: 783-827. Bertrand, M., F. Kramarz, A. Schoar, D. Thesmar. 2004. Politically Connected CEOs and
Corporate Outcomes:Evidence from France. Working paper.

84
Bertrand, M., S. Johnson, K. Samphantharak, A. Schoar. 2008. Mixing family with business: A study of Thai business groups and the families behind them. Journal of Financial Economics 88: 466–498.
Bhagat, S., and B. Bolton. 2008. Corporate governance and firm performance. Journal of
Corporate Finance 14: 257-273. Bhojraj, H., and B. Sengupta. 2003. Effect of Corporate Governance on Bond Ratings
and Yields: The Role of Institutional Investors and Outside Directors. Journal of Business 76: 455-475.
Black, B., H. Jang, and W. Kim. 2005. Does corporate governance predict firms’ market
values?: Evidence from Korea. Working paper. Brown, L. D., and M. L. Caylor. 2004. Corporate governance and firm performance.
Working paper. Bunkanwanicha, P., and Y. Wiwattanakantang. 2008. Big business owners in
politics. The Review of Financial Studies 22: 2133-2168. Castro, R., G. L. Clementi, and G. MacDonald. 2004. Investor protection, optimal
incentives and economic growth. Quarterly Journal of Economics 119: 1131-1175.
Chaiwat T. 2006. The economic rent-seeking in Thailand. In P. Phongpaichit (ed.), The
struggle of Thai capitalists 1: Adaptation and dynamics, pp.273-305. Bangkok: Matichon.
Chan K., A. Hameed. 2006. Stock price synchronicity and analyst coverage in emerging markets. Journal of Financial Economics 80: 115–147.
Chantrataragul, D. 2007. Political connection and ownership concentration: Evidence
from Thailand. Master’s Thesis, Master in Finance Programe, Faculty of Commerce and Accountancy, Thammasat University.
Cheung, Y. L., J. T. Connelly, P. Limpaphayom, and L. Zhou. 2007. Do Investor really
value corporate governance? Evidence from the Hong Kong market. Journal of International Financial Management and Accounting 18: 86-122.
Cheung, Y. L., P. R. Rau, and A. Stouraitis. 2008. The helping hand, the lazy hand, or the
grabbing hand? Central vs. local government shareholders in publicly listed firms in China. Working paper.

85
Cooper, M. J., H. Gulen, and A. V. Ovtchinnikov. 2008. Corporate political contributions
and stock returns. Working paper. Core, J. E., W. R. Guay, and T. O. Rusticus. 2006. Does weak governance cause weak
stock returns?: An examination of firm operating performance and investors’ expectations. Journal of Finance 61: 655-687.
Durnev, A., R. Morck, and B. Yeung. 2004. Value-enhancing capital budgeting and firm-
specific stock returns variation. Journal of Finance 59: 65-105. Doige, C., G. A. Karolyi, R. M. Stulz. 2007. Why do countries matter so much for
corporate governance?. Journal of Financial Economics 86: 1-39. Dombrovsky, V., 2008. Do political connections matter?: Firm-level evidence from
Latvia. Working paper. Faccio, M. 2006. Political connected firms. The American Economic Review 96: 369-
386. Faccio, M., R.W. Masulis, and J. J. McConnell. 2006. Political Connections and
corporate bailouts. Journal of Finance 61: 2597-2635. Faccio, M. 2006. The characteristics of politically connected firms. University of
Vanderbilt, Working paper. Fama, E., and K. French. 1993. Common risk factors in the returns on stocks and
bonds. Journal of Finance 33: 3-56. Ferreira, M. A., and P. A. Laux. 2007. Corporate governance, idiosyncratic risk, and
information Flow. Journal of Finance 62: 972-989. Fisman, R., 2001. Estimating the value of political connections. American Economic
Review 91: 1095-1102. Goldman E., J. Rocholl, and J. So. 2006. Do politically connected boards affect firm
value?. Working paper. Gompers, P., J. Ishii, A. Metrick. 2003. Corporate governance and equity prices.
Quarterly Journal of Economics 118: 107–155.

86
Goyal, A., and P. Santa-Clara. 2001. Idiosyncratic risk matters!. Working paper. Haley, U. C. V. 2000. Corporate governance and restructuring in East Asia: An overview.
Seoul Journal of Economics 13: 225 – 251. Imai, M. 2006. Mixing family business with politics in Thailand. Asian Economic
Journal 20: 241-256. Jin, L., and S. C. Myers. 2006. R2 around the world: New theory and new tests. Journal of
Financial Economics 79: 257–292 Johnson, S., and T. Mitton. 2003. Cronyism and capital controls: Evidence from
Malaysia. Journal of Financial Economics 67: 351–382. Kelly, P. J., 2007. Information Efficiency and Firm-Specific Return Variation. Working
paper. Khan, M., and K. Jomo. 2000. Rents, rent-seeking and economic development: Theory
and evidence in Asia. Cambridge: Cambridge University Press. Knight, B. 2006. Are policy platforms capitalized into equity prices? Evidence from the
Bush/Gore 2000 Presidential Election. Journal of Public Economics 90: 751–773. Khwaja, Asim Ijaz, and Atif Mian. 2005. Do Lenders Favor Politically Connected Firms?
Rent provision in an Emerging Financial Market. Quarterly Journal of Economics 120: 1371-1411.
Klapper, L. F., and I. Love. 2004. Corporate governance, investor protection, and
performance in emerging markets. Journal of Corporate Finance 10: 703-728. Li, K., R. Morck, F. Yang, and B. Yeung. 2004. Firm-specific variation and openness in
emerging markets. The Review of Economics and Statistics 86: 658-669. Lins, K. 2003. Equity ownership and firm value in emerging markets. Journal of
Financial and Quantitative Analysis 38: 159-184. Malkiel, B. G., and Y. Xu. 2004. Idiosyncratic risk and security returns. Working paper. Malkiel, B. G. and Y. Xu. 1997. Risk and Return Revisited. Journal of Portfolio
Management, 23, No.3: 9-14.

87
Niessen, A., and S. Ruenzi. 2007. Political connectedness and firm performance: Evidence from Germany. Working paper.
Phongpaichit, P., and C. Baker. 2005 Thaksin: The business of politics in Thailand.
Chiangmai: Silkworm books. Piriyarangsan, S., N. Trirat, and N. Wannathepsakul. 2004. Corruption: Politicians,
bureaucrats, and businessmen.. Bangkok: National economic and social advisory council.
Sappaiboon, T., 2000, The fifty-five most well-known families: Volume 1. Bangkok:
Nation Multimedia Group. Sappaiboon, T., 2001, The fifty-five most well-known families: Volume 2. Bangkok:
Nation Multimedia Group. Sappaiboon, T., 2006, The legends of the thirty most well-known families. Bangkok:
Animate Group. Shen, J. 2007. Idiosyncratic volatility: Information or noise?. Working paper. Shleifer, A., and R. W. Vishny. 1994. Politicians and firms. Quarterly Journal of
Economics 109: 995-1025. Spiegel, M., and X. Wang. 2005. Cross-sectional variation in stock returns: Liquidity and
idiosyncratic Risk. Working paper. Stulz, R. 2005. The limits of financial globalization. The Journal of Finance 60: 1595-
1638. The Brooker Group. 2003. Thai Business Group: A Unique Guide to Who Owns What.
5th ed. Bangkok: The Brooker Group. Udomworarat, N. 2005. Politics and stock returns: Evidence from Thailand. Master’s
Thesis. Master of Science in Finance Programe, Chulalongkorn Business School, Chulalongkorn University.

APPENDICES

APPENDIX A Supplementary explanation for political connection matching procedure and judgment
Identification of Political Connection
Figure 5: The diagram indicating the identification of the political connection Please note that the condition 1to 4 (the number in the circles) will be applied to connection through shareholding and the conditions 1and 3 will be applied to connection through board of director staff. The arrows out from the politically connected firms, the big circle, indicate either that the shares or the board position of the subject firms or are held by the people in the next box. The rectangle boxes are used to describe individual people and the octagon ones are used to describe juristic people. The arrows between the rectangles and rectangles or octagons and rectangles indicate the connection between these people.

90
Definition declaration
1. Direct connection describes the connection between a family and politicians
which are established through sharing the same family name. For connection through
shareholding, this can means the shares of the subjected firm are either held by the
politicians families or by the company that is also owned by the politicians family. Please
see condition 1 and 2 in Identification of Political Connection in Appendix A(page
above).
2. Indirect Connection describes the connection between a shareholder’s or board
member’s family and politicians which are established through some relationship except
sharing the same family name. The connection between these two people can be in-law
relative relationship which is defined as strong indirect connection and friendship or
business partner which called weak indirect connection. The condition 3 and 4 in
Identification of Political Connection in Appendix A(page above) give a picture for the
indirect connection.
3. Cabinet member describe the people holding the cabinet member status, namely,
Prime Minister, deputy prime minister, minister, deputy minister, for not less than 6
month in a year.
Please note that the change of Prime Ministers in People’s Power Party from
Samak Sundaravej to Somchai Wongsawat in late September 2008 does not meet the
condition as the cabinet stays in office less than six months. Thus, for 2008, the criterion
is specifically relaxed by counting the office term of a cabinet member who sits in both
governments consecutively.
The Council of National Security members (CNS or Kor-Mor-Chor in Thai), Ex-
PM Thaksin Shinawatra are also considered as Cabinet member in year 2007 and 2008
respectively.
4. Representative(s) describe both people holding the cabinet member status less
than 6 month in a year or people who holds member of House of Representatives status
not less than 6 months in a year. Please note that for the year 2007, under the Surayud
government, the government rising from the coup d’état, there was no parliament in that
year. However, 110 people are appointed as the Member of Constitution Drafting

91
Assembly and the Member of Constitution Drafting Committee by the military
government, thus these people will be used as Representatives in the year.
5. Real Shareholder describes the person or family who is the owner of the company
which is also the institutional shareholder of the listed firms. For example, Family A
owns company named Holding Co., Ltd. and Holding Co., Ltd hold 5% of share in XYZ
Public Co., Ltd., a listed firm. Hence, we call family A as the real shareholder of the
XYZ Public Co., Ltd.

92
Objective of matching
For analytical capability, it would provide more insight on how the political
connection works if the connections are classified into two aspects. The first is whom the
firms connect with? Is he/she cabinet member or representative? Generally, the studies
on political connection find the stronger power of the cabinet connected firms than the
representative connected firms. Due to the difference of power contributed, it is
essentially to separate politicians into 2 classes. And the second is how does the firm
connect with the politicians? Is it direct connection or strongly indirect connection or
weakly indirect connection? Intuitively, the direct connection seems to inspire the
politicians to do something more than ones of his/her in-law relative, business partners or
friends because his family is the direct beneficiary of the firm. Moreover, in some cases,
the loosen definitions can be adopted to remedy the problem of sample shortage while the
number of politically connected firms will be added without lowering the cut-off, or also
allow to raise the cut-off level, classify the firms into subgroups or slicing a long period
into shorter one. In short, the objective of the matching process is to obtain whether,
whom and how the firm connected with politicians.
To easily compare the characteristic between each classified group – the cabinet
member or representative, direct or indirect connection, the matching procedure must be
created with some cautions. For example, if only the direct connection is assumably
relevant, the shareholders who directly connect with the representative will be considered
as connected with the representatives no matter they have indirect connection with
cabinet members or not. On the other hand, if the strongly indirect connection is assumed
to be relevant, the shareholders who both directly connect with the representative and
indirectly connect with cabinet member will be considered as connected with the cabinet
members.(Because the cabinet members will get the first priority under the judgment.)
Hence, each sub-group of the matching result must be the mutually exclusive one and this
is the only way that allows such flexibility.

93
Matching procedure
Step 11. Go into the list of (1) 2. Pick shareholder name i3. Is shareholder i is the individual person or juristic person?
Step 0BGive i = i+1, x = 0
Step 2APlease see Diagram 2A for more details.
Individual person
Juristic person
Step 0AGive i = 0
Step 0CHas the last shareholder name i of the firm in the year been already operated?
N
Y
Start
End
Required Data:(1) major shareholders names of the listed firms(2) politician name & surname(3) firms owned by the families(4) database of connections between families
Step 2BPlease see Diagram 2B for more details.
Step 3Back to step 0B
Figure 6: The big picture of matching process This diagram indicates how matching between the shareholder’s name and the politician works. The product from this diagram will be the eventual material for political connection judgment. Please see Figure 6A and 2B and Table A1 for more details of step 2A. For matching connection through the board of director, the process should be similar excepts only there is no Step 2B to follow.
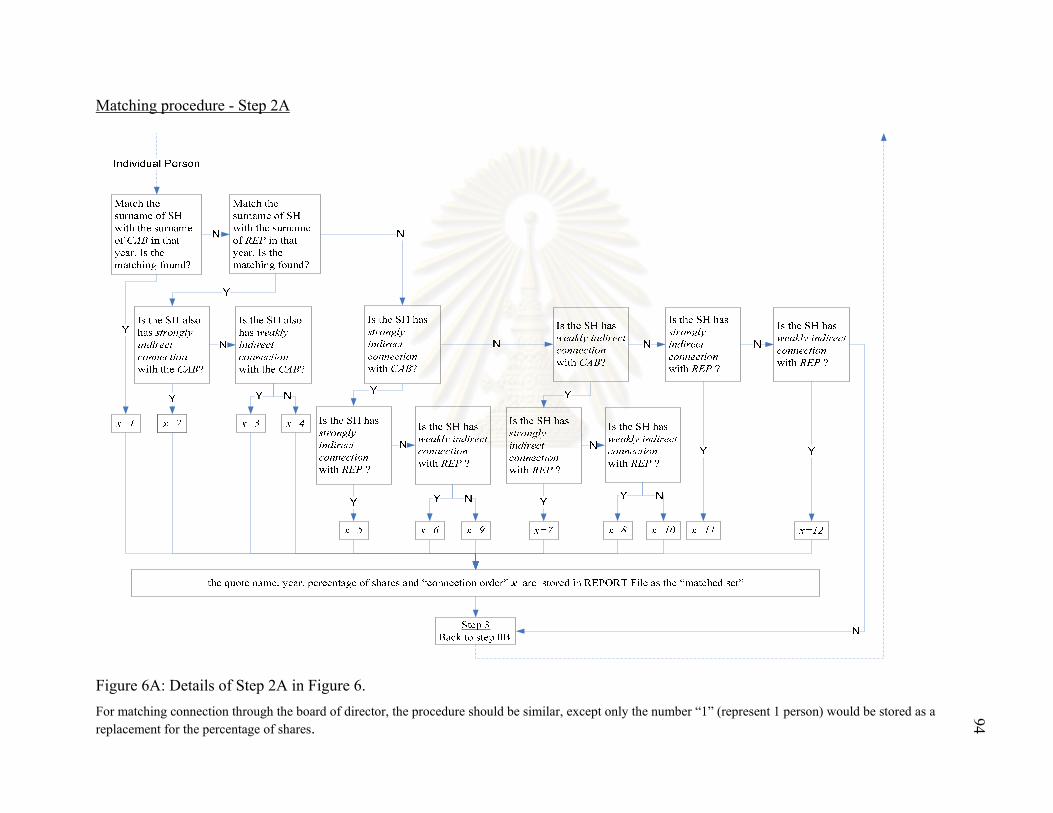
Matching procedure - Step 2A
Figure 6A: Details of Step 2A in Figure 6. For matching connection through the board of director, the procedure should be similar, except only the number “1” (represent 1 person) would be stored as a replacement for the percentage of shares.
94

Matching procedure - Step 2B
Figure 6B: Details of Step 2B in Figure 6. 95

96
This table states the package of connection orders whose percentages of shares will be sum up when the firms are in the process of political connection judgment. The aggregated number then will be examined whether it reach the set cut-off or not.
(1)+(2)+(3)+(4)+(5)+(6)+(7)+(8)+(9)+(10)
Cabinet or Representative connected
(1)+(2)+(3)+(4)+(5)+(7)+(9) (1)+(2)+(3)+(4)
Direct Connection or Indirect Connection (1)+(2)+(3)+(5)+(6)+(7)+(8) (4)+(9)+(10)
Table A1 Condition of connection used in matching procedure for each connection order
Definition assumed Cabinet connected Representative connected
This table helps to clarify the meaning of each connection order described in Figure 6A and 2B Connection order "x" Directly connects with Strongly Connects with Weakly connects with
1 CAB - - 2 REP CAB - 3 REP No CAB 4 REP No No 5 No CAB & REP - 6 No CAB REP 7 No REP CAB
Direct Connection or Strong Indirect Connection (1)+(2)+(5)+(7) (3)+(4)+(8)+(9) Direct Connection Only (1) (2)+(3)+(4)
8 No No CAB & REP 9 No CAB No
10 No No CAB 11 No REP No 12 No No REP
“No” means there's no connection that is eligible for that particular box “-” means the condition of the box does not need to be checked.
Table A2 Component for each definition

97
Judgment of political connection
Figure 7: The judgment of political connection This diagram shows how to judge the politically connected firm after the percentage of share held by the each connection order “x” is obtained. Please see Table 2A for more details of Step 2. For the judgment of political connection through board of director, the aggregated number of connected boards in a year will be checked as a replacement of the aggregated percentage of shared held by connected people and the cut-off used will be 1, 2 and 3 people.

APPENDIX B
Table A3 List of control variables used in the study and their descriptions
This table summarizes the set of controls variable used in the study. The subscript i and t represent firm and calendar year. The control variables will be collected as of the start of the year.
iable Var Meaning
Size ,The logarithm of total assets controlling for profitability that vary with firm’s size
Fixed Total Asset⁄ , The ratio of net fixed assets to total assets
Asset Growth , The one year growth rate in total assets
OprInc Asset⁄ , The ratio of EBIT to total assets
Revenue Asset⁄ , The asset turnover ratio controlling for the firm efficiency
Age in month , The month of the firm’s establishment controlling for more settled in market presence
ln Age in month ,The natural log of the month of the firm’s establishment controlling for more settled in market presence
State own Entreprise , The dummy variables for firms that government owns for more than 10 percent of firm’s total shares.
DE Ratio , The debt-equity ratio divided by 1000
IntCover , The interest coverage ratio divided by 1 million

APPENDIX C
The books providing the information for indirect connection used in this study26
Chiangkul, V. 2006. Government economic policy: Conflict of business interest. Bangkok: King Prachatipok’s Institute.
Julapongstorn, S. 2000. Decoding the Thai commercial banking monopoly. Bangkok: Siam.
Lertrattana, P. 2006. Thaksin, his associates, and the inconsistency of Thai politicians. Bangkok: Openbook.
Nimpanich, C. 2008. Interest groups and Thai politics: Old & new politics and case studies. 2nd edition: Chulalongkorn University Publisher.
Phongpaichit, P., and C. Baker. 2005. Thaksin: The business of politics in Thailand. Silkworm books, Chiangmai, Thailand.
Phongpaichit, P., ed. 2006. The struggle of Thai capitalists 1: Adaptation and dynamics. Bankok: Matichon.
Phongpaichit, P., ed. 2006. The struggle of Thai capitalists 2: Cultural politics for survivor. Bangkok: Matichon.
Piriyarangsan, S., N. Trirat, and N. Wannathepsakul. 2004. Corruption: politicians, bureaucrats, and businessmen. Bangkok: National economic and social advisory council.
Polabutra, A. 2007. The Black Book: The Thaksin Regime Corruption Menu. Bangkok: Rachathamanoon.
Sappaiboon, T. 2000. The fifty-five most well-known families: Volume 1. Bangkok: Nation Multimedia Group.
Sappaiboon, T. 2001. The fifty-five most well-known families: Volume 2. Bangkok: Nation Multimedia Group.
Sappaiboon, T. 2006. The legends of the thirty most well-known families. Bangkok: Animate Group.
Supawasu, K. 2004. Who says the rich don’t cheat: A true story. Bangkok: B.B.
26 Note: Even though the information used in these studies is mainly based on these books, we also utilize the
information about the connection between the big families from the known facts presented in other sources as well.

100
The Brooker Group. Thai business group: A unique guide to who owns what, 5th edition. Bangkok:The Brooker Group.
Vitheethas Institute. 2003 Good governance and corruption in Thai social. Bangkok: Vitheethas.

APPENDIX D
Questions for corporate governance index construction Code Questions Scoring Rule Max. Score Weight A. Board Structure 6.00 20% A1 What is the size of the board of directors? 1 if 5 <=a1<=12; ;0 otherwise 1.00 A2 What is the size of executive board? 1 if a2 <= 12 ;0 otherwise 1.00 A3 How many directors are also managers? 1 if a3/a1 < 1/3 ;0 otherwise 1.00 A4 How many directors are dependent? 1 if a4/a1 > 1/3 ;0 otherwise 1.00 A5 Does the firm state the definition of independence in the disclosure report? 1 if a5=1 ;0 otherwise 1.00 A6 How many directors have attended director training programs by the Thai Institution of
Directors Association? 1 if a6/a1 >1/2 ;0 otherwise 1.00
B. Conflict of Interest 8.00 25% B1 Is the chairman is the same person as CEO? 1 if b1=0 ;0 otherwise B2 Is the chairman independent? 1 if b2=1 ;0 otherwise B3 How many public companies dose the chairman currently serve as a director or a
manager? 1 if b3<=3 ;0 otherwise
B4 Does an audit committee exist? 1/2 if b4=1 ;0 otherwise B5 Chair by independent director? 1/6 if b5=1 ;0 otherwise B6 Role and responsibilities clearly stated? 1/6 if b6=1 ;0 otherwise B7 Performance or meeting attendance disclosure? 1/6 if b7=1 ;0 otherwise B8 Does a nominating committee exist? 1/2 if b8=1 ;0 otherwise B9 Chair by independent director? 1/6 if b9=1 ;0 otherwise B10 Role and responsibilities clearly stated? 1/6 if b10=1 ;0 otherwise B11 Performance or meeting attendance disclosure? 1/6 if b11=1 ;0 otherwise B12 Does a remuneration committee exist? 1/2 if b12=1 ;0 otherwise B13 Chair by independent director? 1/6 if b13=1 ;0 otherwise B14 Role and responsibilities clearly stated? 1/6 if b14=1 ;0 otherwise B15 Performance or meeting attendance disclosure? 1/6 if b15=1 ;0 otherwise B16 Does a corporate governance committee exist? 1/2 if b16=1 ;0 otherwise B17 Chair by independent director? 1/6 if b17=1 ;0 otherwise B18 Role and responsibilities clearly stated? 1/6 if b18=1 ;0 otherwise B19 Performance or meeting attendance disclosure? 1/6 if b19=1 ;0 otherwise

Code Questions Scoring Rule Max. Score Weight B. Conflict of Interest 8.00 25% B20 Does the firm has a policy that specifies a minimum number of independent directors? 1/3 if b20=1 ;0 otherwise Does the firm discuss the following internal-control issues in the disclosure report? B21 - Organization and control environment 2/15 if b21=1 ;0 otherwise B22 - Risk management 2/15 if b22=1 ;0 otherwise B23 - Management control activities 2/15 if b23=1 ;0 otherwise B24 - Information and communication 2/15 if b24=1 ;0 otherwise B25 - Monitoring and evaluation 2/15 if b25=1 ;0 otherwise C. Board Responsibilities 13.00 20% C1 Number of board meeting per year 1 if c1>4 ;0 otherwise 1.00 C2 Average director’s meeting attendance c2/c1 ;0 otherwise 1.00 C3 Average independent directors meeting attendance c3/c1 ;0 otherwise 1.00 C4 Is there a board meeting solely for independent directors? 1 if c4=1 ;0 otherwise 1.00 C5 Number of audit committee meeting per year 1 if c5=>4 ;0 otherwise 1.00 C6 Average audit committee meeting attendance c6/c5 ;0 otherwise 1.00 C7 Is there at least one accounting expert on the audit committee? 1 if c7=1 ;0 otherwise 1.00 C8 How many public companies does the chairman of audit committee serve as a director or
manager? 1 if c8<=3 ;0 otherwise 1.00
C9 Does the firm clearly distinguish the role and responsibilities of the board and management?
1/3 if c9=1 ;0 otherwise 0.33
C10 Does the firm disclose that directors evaluation system exists? 1/3 if c10=1 ;0 otherwise 0.33 C11 Does the firm have an option scheme which incentivizes management? 1/3 if c11=1 ;0 otherwise 0.33 C12 Has there been any legal dispute where the firm was claimed to be a fault during the past
year? 1 if c12=0 ;0 otherwise 1.00
C13 Has there been any sanction to the board, management, or other insider for violations of Securities and/or Corporations laws in the last two years?
3*(1-c13) ;0 otherwise 3.00
D. Shareholder Rights 7.00 10% D1 Does the firm hold an annual general shareholder meeting? 1 if d1=1 ;0 otherwise D2 Does the firm employ one-share-one-vote rule? 1 if d2=1 ;0 otherwise D3 Is cumulative voting allowed in electing directors? 1 if d3=1 ;0 otherwise
102

Code Questions Scoring Rule Max. Score Weight D. Shareholder Rights 7.00 10% D4 Is voting by mail allow? 1 if d4=1 ;0 otherwise D5 How many days in advance does the company send out a notice of general meetings to
shareholders? d5/14 ;0 otherwise
D6 Is proxy voting allowed? 1 if d6=1 ;0 otherwise D7 Does the firm disclosure a dividend policy? 1/3 if d7=1 ;0 otherwise D8 What is the minimum dividend (as a percentage of net profit) according to the dividend
policy? 1/3*d8/100 ;0 otherwise
D9 Does the firm provide an explanation/rationale for setting dividend at the specified level? 1/3 if d9=1 ;0 otherwise E. Disclosure and Transparency 13.00 25%
103
Does the firm disclose the following information in the disclosure report? E1 - Board meeting attendance of individual directors 1 if e1=1 ;0 otherwise 1.00 E2 - Board compensation and/or benefits of individual directors 1 if e2=1 ;0 otherwise 1.00 E3 - Directors shareholding 1 if e3=1 ;0 otherwise 1.00 E4 - Management shareholding 1 if e4=1 ;0 otherwise 1.00 E5 - Related party transaction in detail 1 if e5=1 ;0 otherwise 1.00 E6 - Corporate group structure 1 if e6=1 ;0 otherwise 1.00 E7 - Grouping of major shareholding who belong to the same family/economics unit 1 if e7=1 ;0 otherwise 1.00 E8 Does investor relation unit exist? 1 if e8=1 ;0 otherwise 1.00 E9 Does the firm mention its investor relations activity carried out during the past year? 1 if e9=1 ;0 otherwise 1.00 E10 Does the firm’s Annual Report include a section devoted to corporate governance
principles and implementations? 1 if e10=1 ;0 otherwise 1.00
E11 How many times in the last two years has the firm been charged for failures to publish company reports within the specified periods?
3-e23 ;0 otherwise 3.00
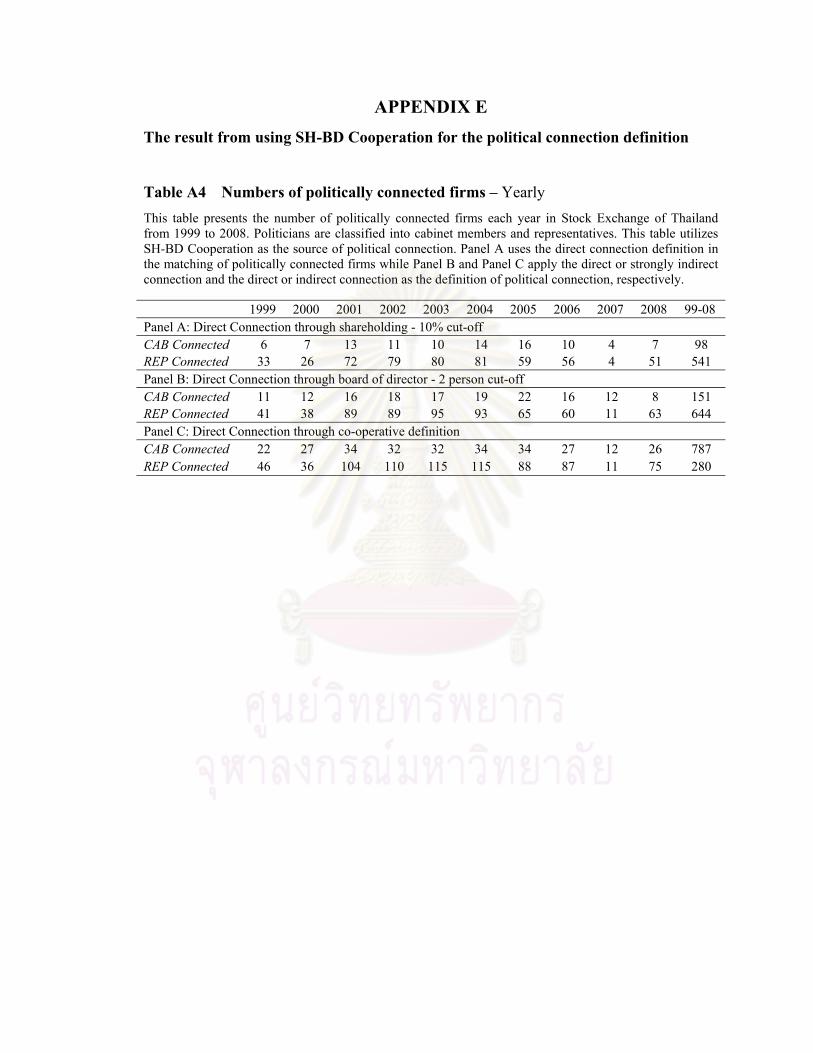
APPENDIX E The result from using SH-BD Cooperation for the political connection definition
Table A4 Numbers of politically connected firms – Yearly This table presents the number of politically connected firms each year in Stock Exchange of Thailand from 1999 to 2008. Politicians are classified into cabinet members and representatives. This table utilizes SH-BD Cooperation as the source of political connection. Panel A uses the direct connection definition in the matching of politically connected firms while Panel B and Panel C apply the direct or strongly indirect connection and the direct or indirect connection as the definition of political connection, respectively.
1999 2000 2001 2002 2003 2004 2005 2006 2007 2008 99-08 Panel A: Direct Connection through shareholding - 10% cut-off CAB Connected 6 7 13 11 10 14 16 10 4 7 98 REP Connected 33 26 72 79 80 81 59 56 4 51 541 Panel B: Direct Connection through board of director - 2 person cut-off CAB Connected 11 12 16 18 17 19 22 16 12 8 151 REP Connected 41 38 89 89 95 93 65 60 11 63 644 Panel C: Direct Connection through co-operative definition CAB Connected 22 27 34 32 32 34 34 27 12 26 787 REP Connected 46 36 104 110 115 115 88 87 11 75 280

105
Table A5 Benefit of political connection tested by Fama-French 3 Factors (1993) model
This table present the result of pooled regressions on weekly stock return by using Fama-French (1993) 3 Factor model. The period of study is from 1998 to 2008. The samples are divided into 4 groups which are cabinet connected firms, matched-cabinet connected firms, representative connected firms and matched-representative connected firms. The constant is generally known as abnormal return or alpha indicator of benefit receives from political connection. RM-RF is weekly market return minus the overnight interbank rate. SMB (Small-minus-Big) is the average return on the three small portfolios minus the average return on the three big portfolios. And HML (High-minus-Low) is the average return on the two value portfolios minus the average return on the two growth portfolios.27 Robust standard errors are given in the parentheses. *, ** and *** indicate significance from zero at the 10%, 5% and 1% level, respectively. The table shows the estimation when applying direct SH-BD Cooperation connection as the definition of political connection. Panel A shows the estimate result of the whole period (1998 – 2008) while Panel B presents the estimated coefficient of the constant term when the sub periods are applied which are Thaksin’s period (2001 – 2005) and Non Thaksin’s Period (1998 – 2000 and 2007 – 2008).
Buy and Hold Portfolio Long-Short Portfolio
Class1 Class2 Matched
Class1 Matched Class2
Class1-Matched
Class2-Matched
Panel A: Whole period
Constant -0.0019 0.0016* -0.0012 -0.0004 -0.0007 0.0020* (0.0013) (0.0009) (0.0011) (0.0009) (0.0016) (0.0011)
RM-RF 1.1104*** 0.8192*** 1.0347*** 0.9074*** 0.075718 -0.0881** (0.043) (0.0323) (0.0388) (0.0305) (0.0533) (0.0391)
SMB 0.7696*** 0.5605*** 0.7076*** 0.7141*** 0.062032 -0.1537*** (0.0637) (0.0478) (0.0574) (0.0452) (0.0789) (0.0579)
HML -0.1006* -0.04313 0.1297*** 0.0864** -0.2304*** -0.1295*** (0.0523) (0.0393) (0.0472) (0.0372) (0.0648) (0.0475)
R2 57.57% 57.01% 60.67% 55.41% 2.37% 3.36%
Panel B: Thaksin’s and non Thaksin’s regime
Thaksin’s Regime
-0.0032** -0.0001 0.0002 -0.0001 -0.0034* 0.0000
(0.0013) (0.0008) (0.0013) (0.0007) (0.0018) (0.0008)
R2 71.68% 78.01% 58.41% 86.47% 22.75% 4.22%
Non-Thaksin’s Regime
-0.0014 0.0021 -0.0021 -0.0014 0.0007 0.0035
(0.0022) (0.0018) (0.002) (0.0017) (0.0026) (0.0022)
R2 54.07% 50.20% 63.26% 55.41% 2.78% 4.05% *This table could be compared with Table 4.
27 The definition of SMB and HML are literally from Kenneth R. French’s website; http://mba.tuck.dartmouth.edu/pages/faculty/ken.french/

Table A6 The political connection and the performances of the firms
The dependent variables reported in this table are Tobin’s Q ratio, ROA and ROE of firms in each year t. Sample period is 1999-2008. DE ratio is divided by 1000 to reduce the decimal points of coefficients. The accounting - independent variables (Size (natural log of total asset), Revenue/Total Asset, DE Ratio, Ln(Age in Month) (natural log of monthly age of firms)) are measured at year t-1. Industry classification follows SET standard. State-owned enterprise equals to 1 if 20% or more of shares of the firm is held by government who is also the biggest shareholder for the year. CAB Connected and REP Connected are dummy variables which equal to 1 if the firm is considered as the cabinet connected firm for the first one and representative connected firm for another, 0 otherwise. SH-BD cooperation is utilized as the source of connection. The direct connection definition is used for matching the political connection in the first three columns. And the direct or strongly indirect connection definition is used in the next three columns while the direct or indirect connection definition is used in the last three columns. The regressions utilize the OLS method. . Robust standard errors are given in the parentheses. *, **, and *** indicate significance at the 10%, 5% and 1% level, respectively.
*This table is comparable wit Ta h ble 5.
(1) (2) (3) (4) (5) (6) (7) (8) (9) Tobin's Q ROA ROE Tobin's Q ROA ROE Tobin's Q ROA ROE Direct connection Direct or strongly indirect connection Direct indirect connection
Constant 1.576*** -0.095 -0.831 1.566*** -0.096 -0.790 1.570*** -0.103 -0.421 (0.554) (0.165) (2.450) (0.554) (0.163) (2.387) (0.560) (0.164) (2.110)
CAB Connected 0.394** 0.017** 1.094 0.314*** 0.009 0.901 0.175*** 0.004 1.034 (0.155) (0.008) (0.687) (0.115) (0.007) (0.609) (0.058) (0.011) (0.695)
REP Connected -0.038* -0.021** 0.647 -0.05** -0.019* 0.763 -0.03 -0.02 0.927 (0.022) (0.01) (0.621) (0.024) (0.011) (0.687) (0.03) (0.019) (0.796)
Size 0.025 0.001 -0.073 0.026 0.009 0.901 0.027 0.001 -0.094 (0.022) (0.01) (0.084) (0.021) (0.007) (0.609) (0.021) (0.01) (0.075)
Revenue/Total Assets 0.067*** 0.036*** 0.439 0.067*** -0.019* 0.763 0.069*** 0.036*** 0.466 (0.017) (0.012) (0.352) (0.017) (0.011) (0.687) (0.017) (0.012) (0.371)
DE Ratio 0.001 -0.002*** -0.034 0.001 0.009 0.901 0.001 -0.002*** -0.032 (0.002) (0) (0.044) (0.002) (0.007) (0.609) (0.002) (0) (0.042)
Ln(Age in month) -0.101*** 0.004 0.269 -0.099*** -0.019* 0.763 -0.103*** 0.005 0.231 (0.026) (0.005) (0.279) (0.027) (0.011) (0.687) (0.029) (0.005) (0.246)
State-owned Enterprise -0.01 0.034 0.301 -0.01 0.009 0.901 0.00 0.031 0.494** (0.054) (0.027) (0.269) (0.057) (0.007) (0.609) (0.058) (0.025) (0.203)
Industry-Year Dummies YES YES YES YES YES YES YES YES YES
R2 15.96% 2.21% 0.94% 15.96% 2.20% 0.95% 15.64% 2.22% 0.98% Observation 3074 3492 3230 3074 3492 3230 3074 3492 3230
106

107
Table A7 The political connection and the performances of the firms – Thaksin’s regime and non-Thaksin’s regime
The dependent variables reported in this table are Tobin’s Q ratio, ROA and ROE of firms in each year t. Sample period is 1999-2008. The independent variables used are the same as they are fully shown in Table 4. CAB Connected and REP Connected are dummy variables which equal to 1 if the firm is considered as the cabinet direct connected firm for the first one and representative direct connected firm for another, 0 otherwise. In this table, the connections are found through SH-BD Cooperation. The direct connection definition is used for matching the political connection. The regressions utilize the OLS method. . Robust standard errors are given in the parentheses. *, **, and *** indicate significance at the 10%, 5% and 1% level, respectively. As one can see, the reported table is separated into two parts. The first part displays the coefficients of CAB Connected and REP Connected when the regression covers the period of Thaksin’s regime (2001-2005). And another report the coefficient of the political connection dummies as the model is regressed by using the period of non-Thaksin’s regime (1999-2000 and 2007-2008).
Tobin's Q ROA ROE
Thaksin's Regime (2001-2005)
CAB Connected 0.684*** 0.023 1.61** (0.158) (0.014) (0.801)
REP Connected -0.05 -0.032*** 0.908 (0.036) (0.012) (0.775)
R2 21.59% 2.12% 1.37% Observation 1556 1820 1670
Non-Thaksin's Regime (1999-2000 & 2007 -2008)
CAB Connected -0.107 0.019** 0.159 (0.084) (0.008) (0.112)
REP Connected -0.02 0.012** -0.21 (0.035) (0.006) (0.258)
R2 13.27% 7.59% 2.35% Observation 1140 1255 1163
*This table is comparable with Table 6.

108
BIOGRAPHY
Mr. Subhadanai Subhapholsiri was born on 8th November 1986, in Bangkok. He
graduated from Chulalongkorn Demonstration School (Satit Chula School) in the primary and
secondary school level. At the undergraduate level, he graduated from the Department of
Industrial Engineering, Faculty of Engineering, Chulalongkorn University in May 2008. After
that in the same year, he was enrolled in the Master of Science in Finance Program,
Chulalongkorn University.