Embed Size (px)
Citation preview

04/11/2014
1
CTC- CENTRO DE
TECNOLOGIA CANAVIEIRA

04/11/2014
2
Land for Sustainable Sugarcane
3
Demand for Sugarcane
4

04/11/2014
3
TRANSPORT
C-CO2Photossynthesis
18 monthsPlant cane
CULTURAL MANAGEMENTS- pesticides
- herbicides
- vinasse
1st RATOON
12 months
12 months
2nd RATOON
12 months
3rd RATOON
HARVEST
12 months
4th RATOONREFORMATION
PLANTING
Fertilizer
Lime
Filter cake
CO2
CH4
N2O
Filter cakeVinasse - distribution channel
BY-PRODUCTS
Bagasse
- boiler
- co-generation
of electric
power
PRODUCTSCONSUME
CO2
CO2CO2 N2O
CO2
CH4N2OCO2
CH4
CO2CO2 N2O
Sustainability: Sugarcane CO2 eq cycle
Fonte: Cerri et al CENA USP
CRUZAMENTOS GENÉTICOS
(Camamu/BA)
IMPORTAÇÃO E QUARENTENA DE PROGENITORES
(Miracatu/SP)
PRODUÇÃO DOS SEEDLINGS
(Piracic. e Jau/SP)
SELEÇÕESINICIAIS
(Piracic. e Jau/SP)
Ano 1 Ano 1
Ano 2 ao 7Mult. (1x3) Fase II
Mult. (5x5) Fase III
Ens. 2 (5x6) Fase IV Dois cortes
VC Fase I
Testes de doenças
Recomendação de variedades CTC para plantio na lavoura comercial
VARIEDADES CTC MOV
Ano 8 ao 13
ENSAIOS DE VARIEDADES (Usinas
cooperadas)
Módulos (5x8) Fase V Dois cortes
Ens. Final 3(5x10) Fase VI Dois cortesCurvas de maturação
FLUXOGRAMA DO PROGRAMA DE MELHORAMENTO
Fonte: Donzelli, CTC

04/11/2014
4
ANO 5 a 8
EXPERIMENTOS VARIETAIS
(POLOS REGIONAIS)
FASE 3DOIS CORTES
CURVAS DE MATURAÇÃO
Fase 4:Recomendação de variedades CTC para plantio na lavoura comercial.(MACP & DP)
SELEÇÃO INICIAL (Polos Regionais e
CTC)
ANO 2 a 5FASE 2
Testes de Doenças
PRODUÇÃO DE SEEDLINGS
(Piracicaba/SP)
ANO 1
FASE 1HIBRIDAÇÃO (Camamu/BA)
ANO 1
IMPORTAÇÃO E QUARENTENA DE
PROGENIES
FLUXOGRAMA DO PROGRAMA DE MELHORAMENTO
Ensaios em Ambientes de
Produção
VARIEDADES CTC
Novo modelo de Melhoramento Genético – FluxosNovo modelo de Melhoramento Genético – Fluxos
MGC anterior Novo MGCAno
Fase 1 Fase 1
Fase 2 Fase 2
Fase 3 Fase 3
MACPFase 4
0
1
2
3
4
5
6
7
8
9
10
11
12
13
14
15
Fase 5
Lançamento Regional
Lançamento Nacional
Fase 4
Lançamento Regional
D.P.
6 polos, 70.000 seedlings
5.600 clones
400 clones
24 clones
12 polos, 43.000 seedlings
3.010 clones
1.204 clones
120 clones
12 clones

04/11/2014
5
SP/Piracicaba A-I, B-I, C-I PR/Paraná C-I, D-I e E-I
SP/Ribeirão PretoA-II, B-II, C-II
A-III, B-III, C-IIISP/Araçatuba
C-II, D-II e E-II
C-III, D-III e E-III
GO/Goiás norteB-IV, C-IV; D-IV
B-V, C-V; D-VGO/Goiás sul
C-IV, D-IV, E-IV
C-V, D-V, E-V
Polos Regionais – cobertura edafoclimáticaPolos Regionais – cobertura edafoclimática

04/11/2014
6
Reprodução Proibida
CTC HistoryCTC History
1969 1979 2004 2011
Experimental Station Camamu Quarentine Station Miracatú
CT CanavieiraOscip
CTC S/A
Copersucar Technology Center
Experimental Station Piracicaba CTC headquarters
CTC- Centro de Tecnologia Canavieira
CTC is
transformed
into an open
association with
non-profit
purposes
CTC OverviewTimeline
Launch of the first
CTC variety SP-1143
Development
of automation
controls for the
sugarcane mills
Development of soils maps
and production
environments technology
Sugarcane Genome
Project development
Leadership by CTC
Development of sugarcane
dry cleaning systems and
straw recovery technology
Brazil´s first official use
of ethanol as fuel
CTC S.A
1931
1969
1983
1986
1992
1995
2005
2004
Restructuring and expansion of
CTC ´́́́s activities
Growth and diversification in the
sugar and ethanol industry
Initiation of private
operations in the
sugarcane industry
First private investment
in the sugarcane R&D
sector2013*
Restructuring and expansion
of its activities for all regions
of Brazil
Big Improvements of
mechanization in
sugarcane cutting,
loading and
transportation
1999
Start in CTC of
the E2G
project
2007
Foundation of the
Copersucar
Technology Center
2011
CTC is
converted
into a
private
corporation
Access to BNDES and Finep
funds
1879
Deployment of the
new Strategy
1879-1969 1969-1983 1984 -2004 2005-2010 2011-2012
Start up of the
first private
“Engenho”l in
Brazil
2012
04/11/2014
7
From 2004 to 2012 - CTC has increased from 73 associated members up to
154 stakeholders , including 12 thousand cane growers.
Today this represent 60% of all sugarcane planted in Brazil
2004 2012
CTC Evolution
Reprodução Proibida
Fonte: UNICA
ETHANOL LEARNING CURVEETHANOL LEARNING CURVE
Ethanol price evolution (CONSTANT R$ deflated jan 2011)
3 x
Last year : 97 kg produts / TC or ~ R$ 103,00/TC = 3 kg wax= 0,5 kg yeast extract
Sugar in sugarcane 136,75 kg Total Sugars / TC Price of TS: R$ 0,4728 1 TC: R$64,66

04/11/2014
8

04/11/2014
9
167%
224%
132%
40%
-50%
0%
50%
100%
150%
200%
250%
300%Milho
Colza
Beterraba Aç
Cana de Açúcar
FAOSTAT
Corn
Rapessed
Sugarbeets
Sugarcane
As a result, sugarcane was left far behind.
Productivity
1960 = 100

04/11/2014
10
81.284.3
79.8
57.5
Sugar Cane ProductivitySugar Cane Productivity
New Varieties benefitsNew Varieties benefits

04/11/2014
11
AREA PER VARIETY %AREA PER VARIETY %
CTC TECHNOLOGIES CTC TECHNOLOGIES
04/11/2014
12
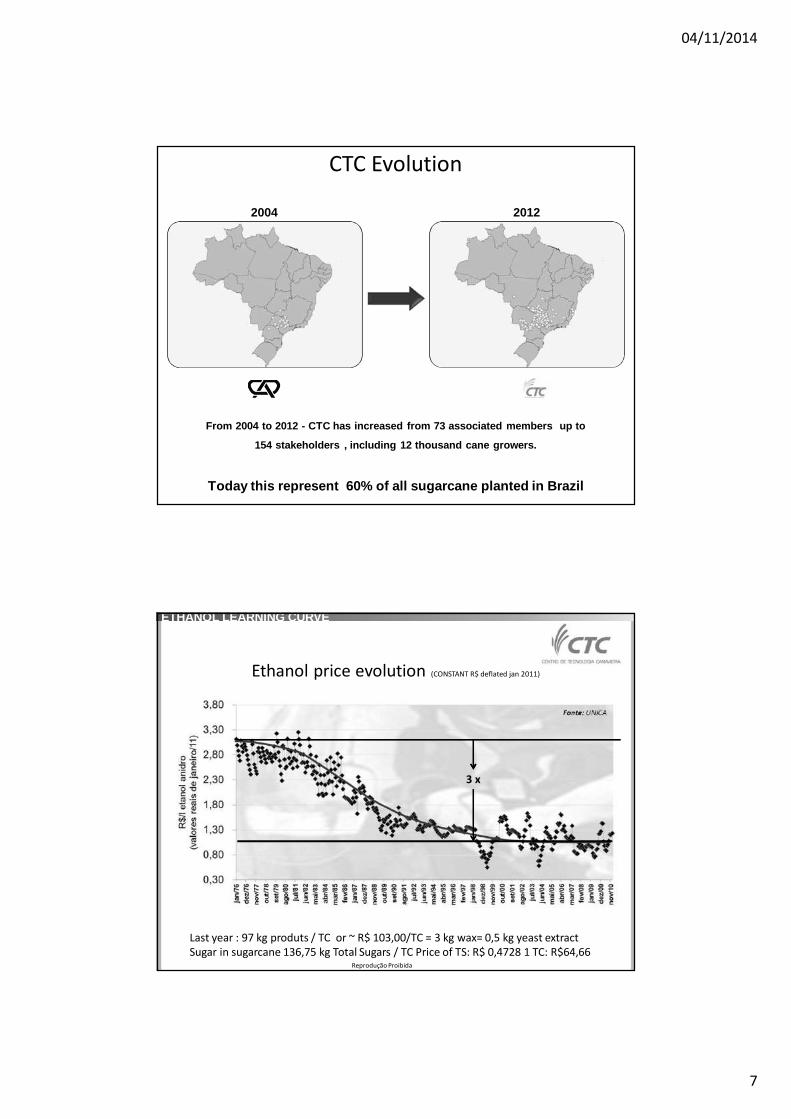
23
Agricultural production + Logistics + Industrial Processing
20 – 40 kha
sunlight water CO2
sugar(35 t/h)
ethanol(42 m3/h)
electricity(50 MW)
solids1-10 t/h
vinasse500 m3/h
CO2
2 t/h
harvesting500 t/h
field op.
water1000 t/h
nutrients (1 ton/h)
200 MUS$
Agro-Industrial Reference Unit – Processing Scales
04/11/2014
13

04/11/2014
14
04/11/2014
15

04/11/2014
16

04/11/2014
17

04/11/2014
18
04/11/2014
19

04/11/2014
20
04/11/2014
21
04/11/2014
22
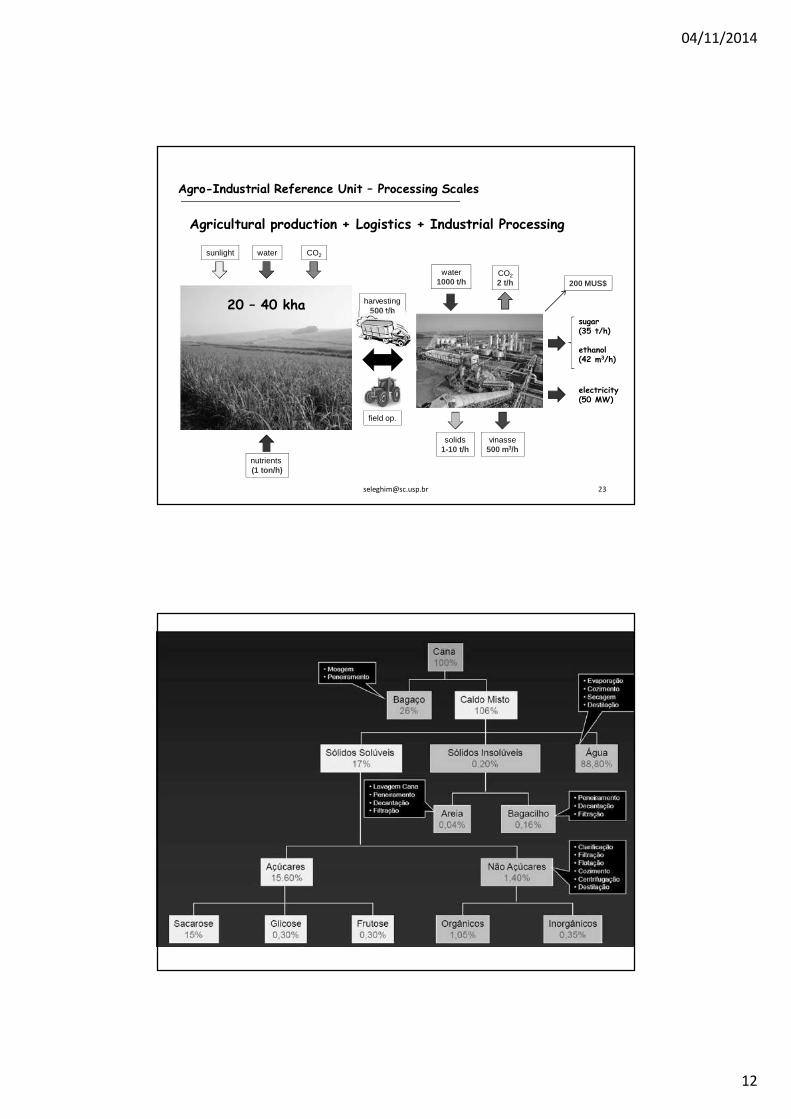
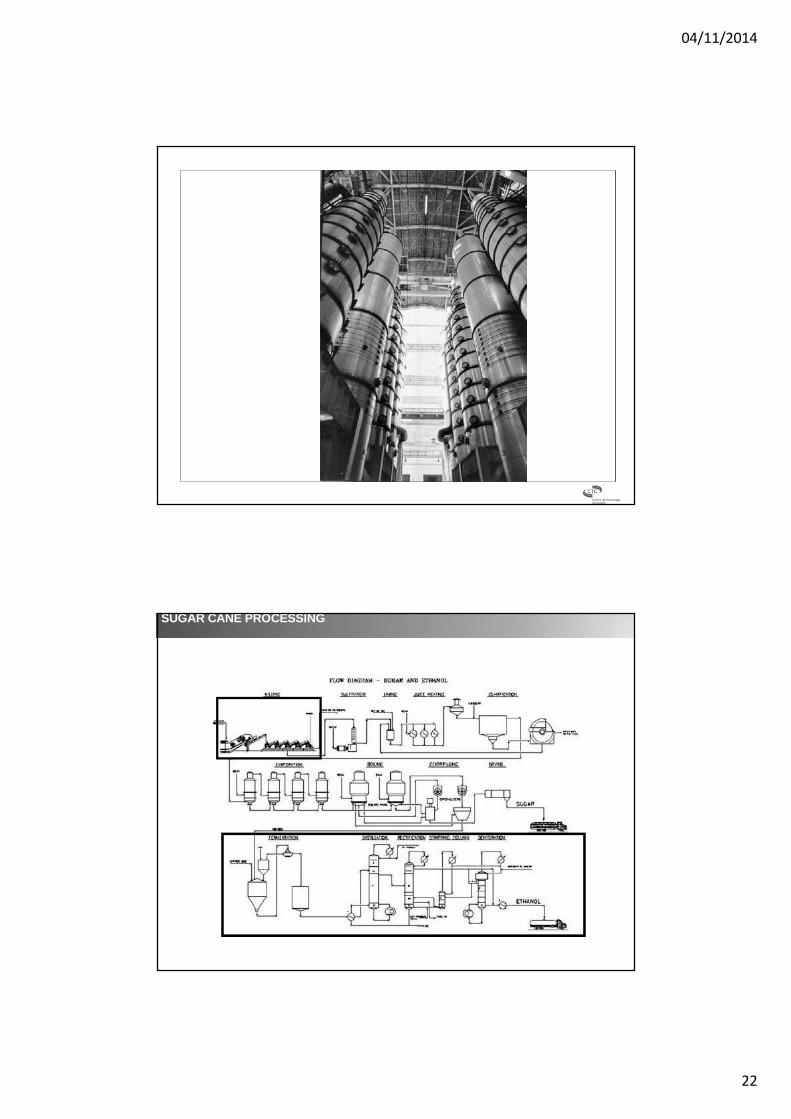
SUGAR CANE PROCESSINGSUGAR CANE PROCESSING
04/11/2014
23
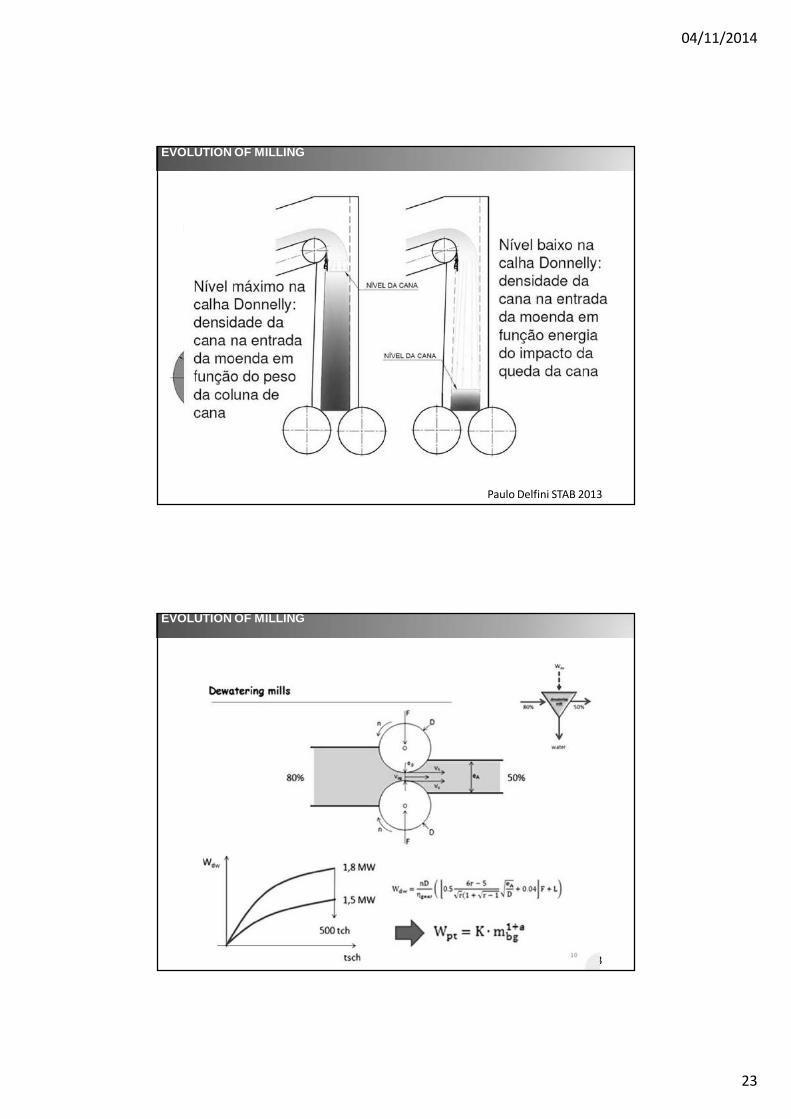
EVOLUTION OF MILLINGEVOLUTION OF MILLING
Paulo Delfini STAB 2013
EVOLUTION OF MILLINGEVOLUTION OF MILLING
Paulo Delfini STAB 2013