Embed Size (px)
Citation preview

CSU Residential School Learning & Teaching Space 2017 Utilisation Report Wagga Wagga Campus Version No: 1.0 | June 2017

Executive Summary
As part of Charles Sturt University’s (CSU) ongoing review of learning and teaching space
utilisation, this report outlines the analysis of a subset of 20 spaces located within the Boorooma
Precinct of the Wagga Wagga Campus for the duration of the 2017 Session 1 Residential School period
(02/04/17 to 13/04/17). Following a similar review in 2016, the key driver for this report was to provide
an analytical response to the enduring opinion that the campus’ stock of learning and teaching spaces
are effectively at capacity for Residential Schools. Sources of contributing data included Syllabus Plus
(Timetabling), Banner Student, Archibus (Space Planning) and audit data. Analysis and reporting was
conducted by the Division of Facilities Management.
Key findings of this report show:
• The view that the campus is effectively at capacity for residential schools is incorrect.
• There are financial implications relating to the operation of unused or underused spaces
covering cleaning, heating / cooling and security.
• Analysis of the Boorooma Precinct of the Wagga Wagga Campus indicated there is ample
learning and teaching space for current Residential School needs and for any anticipated future
growth. Based on audit returns, learning and teaching utilisation was measured at 4.1% with a
timetable utilisation of 22.1%.
• Significant variance in room frequency when compared with sessional teaching data was again
observed which indicated a large proportion of booked spaces are simply not used.
• Current timetabling processes are seen as a key contributor to poor utilisation whereby a
number of subject bookings significantly exceeded requirements in terms of the ratio of students
to space.
This report recommends numerous courses of action (Section 6.0 - Recommendations) with the
most critical being a review of timetabling principles and practices focusing on challenging unrealistic
booking requests which impact the wider availability of quality space across the precinct.

CSU Residential School Learning & Teaching Space 2017 Utilisation Report – Wagga Wagga Campus Page 2
Version 1.0 – June 2017
Table of Contents
1.0 Introduction .......................................................................................................................... 3
1.1 Scope .......................................................................................................................... 3
1.2 Governance ................................................................................................................. 4
2.0 Wagga Wagga Campus Aggregate Data ............................................................................ 4
3.0 Utilisation by Room Type .................................................................................................... 6
3.1 Case Study: Wal Fife and Keith Swan Theatres ......................................................... 7
4.0 Subject Analysis .................................................................................................................. 9
5.0 Key Observations .............................................................................................................. 12
6.0 Recommendations ............................................................................................................ 13
7.0 Wagga Wagga 2017 Session 1 Residential School: Appendices ..................................... 15
7.1 Audited Spaces ......................................................................................................... 15
7.2 Audited Spaces Utilisation Metrics by Building ......................................................... 16
7.3 Audited Spaces Utilisation Metrics by Room Type ................................................... 17

CSU Residential School Learning & Teaching Space 2017 Utilisation Report – Wagga Wagga Campus Page 3
Version 1.0 – June 2017
1.0 Introduction
The purpose of this report is to provide an assessment of the utilisation of learning and teaching
spaces in the Wagga Wagga Campus of Charles Sturt University (CSU) for the 2017 Session 1
Residential School. This Residential School period took place between April 2nd and April 13th, 2017.
Learning and teaching spaces are a key element to the fabric of CSU’s campuses. The Division of
Facilities Management (DFM) has, this year, chosen to audit a subset of twenty spaces combined with
a full review of timetable and subject data.
Residential Schools provide CSU students studying online the opportunity to attend campus for
face-to-face lectures, tutorials and laboratory classes which, in many cases, is the only physical
interface a student has to the organisation. Space utilisation measures how intensively space is used,
based on the analysis of both timetable and audit data. It is the frequency of hours of use expressed as
a percentage of the teaching day (Room Frequency Factor) multiplied by the percentage of occupied
seats (Seat Occupancy Factor).
This report draws upon four key sources of data. Spatial data relating to learning and teaching
spaces is sourced from Archibus, CSU’s enterprise space management system that acts as the central
repository for University space and property data. Timetabling data for the 20 learning and teaching
spaces is acquired from Syllabus Plus, the University’s enterprise timetabling scheduler along with
subject data extracted from Banner Student. The fourth data source relates to information obtained from
an audit of the 2017 Session 1 Residential School on the Wagga Wagga Campus.
A number of report recommendations for the closure of learning and teaching spaces on the
Wagga Wagga Campus have been challenged by stakeholders based on apparent need for space
during Residential Schools. Examples being spaces within the Lecture Unit (Building 11) and the Keith
Swan Theatre (Building 12, Room 103). Whilst closed for the 2016 and 2017 sessional teaching year,
these spaces have been reactivated during Residential School periods based on sustained pressure
from faculties and advice from Timetabling. It is the intent of this document to challenge the need to
reactivate these mothballed spaces, along with providing detailed analysis of the usage patterns of
learning and teaching spaces at both room and subject levels. Data analysis and reporting was
undertaken by the DFM who wish to acknowledge the Division of Student Administration (DSA) as a
key report stakeholder.
1.1 Scope
This report provides an analysis of learning and teaching space utilisation in CSU’s 2017
Session 1 Residential School at the Wagga Wagga Campus (02/04/17 to 13/04/17). A decision was
made to audit a subset of 20 timetabled spaces on the Boorooma Precinct of the campus to clarify the
utilisation compared to the earlier Session 2 Residential school report of 2016. The full listing of the
spaces audited and the individual utilisation metrics is included in Section 7.0 (Appendix). Analysis of
timetable and subject data for the entire campus has also been undertaken (Section 4.0) . All other
CSU campuses and sites have been excluded from this report.

CSU Residential School Learning & Teaching Space 2017 Utilisation Report – Wagga Wagga Campus Page 4
Version 1.0 – June 2017
1.2 Governance
This document provides a view of timetable effectiveness across the Wagga Wagga Campus’
2017 Session 1 Residential School. The following organisational stakeholders have been identified:
• Division of Facilities Management (DFM)
• Division of Student Administration (DSA)
• Office for Students (OfS)
• Faculty of Science (FoS)
• Faculty of Arts and Education (FoAE)
• Faculty of Business, Justice and Behavioural Sciences (FoBJBS)
This document will be tabled with four organisational committees within CSU:
1. Residential Schools Steering Committee
2. Timetable Governance Committee
3. Capital Planning Committee
4. Learning Environments Committee
Data within this document provides insight into a missing element of learning and teaching
space use metrics within CSU - the use of space for residential schools. Findings within this document
will provide significant benefit to ongoing planning of space and further insight into forward strategy
decisions relating to CSU’s approach to timetabling and ultimately, the experience of our online student
cohort.
2.0 Wagga Wagga Campus Aggregate Data
Results represented in this section relate to two main data sources. Firstly, timetable data and
secondly, audit data. As the physical audit constituted only twenty spaces within four buildings,
comparative timetable analysis is limited however due to their location and use, these spaces are of
particular interest. Aggregated data in Figure 1 outlines audit and timetable frequency, occupancy and
utilisation statistics specific to targeted spaces from within the Boorooma Precinct on the Wagga Wagga
Campus. These building are:
• Building 11 - Lecture Unit
• Building 12 - Keith Swan Theatre
• Building 14 - Wal Fife Theatre
• Building 21 - Communications and Creative Industries
Figure 1 clearly identifies audited spaces are underutilised and show a significant deviation from the
timetable data. Detailed audit data for specific rooms within the above buildings is located in Section
7.0 (Appendix).

CSU Residential School Learning & Teaching Space 2017 Utilisation Report – Wagga Wagga Campus Page 5
Version 1.0 – June 2017
Figure 1 - Wagga Wagga Campus audit and timetable frequency, occupancy and utilisation, 2017 Session 1 Residential
School specific to targeted spaces within buildings 11, 12, 14 & 21.
In order to better understand timetabling data accuracy, the Wagga Wagga Campus Session 1,
2017 Residential School Learning and Teaching Space Utilisation Review (OLaTSUR) was completed
in Weeks 15 and 16 (April 2nd to April 13th, 2017). Of interest are three factors:
• Low overall utilisation measures when timetable is compared to audit (Figures 1 & 2). This has
been a consistent outcome over previous years of data analysis. This indicates a real world
utilisation being significantly less that officially reported timetable figures, ie: 4.1% (Audit)
compared to 22.1% (Timetable).
• Comparative analysis between audit and timetable data indicates variations in Room
Frequency Factor measures. The disparity is considerably greater than during sessional
teaching weeks as compared to past years of reporting.
• Comparative analysis between audit and timetable data shows significant gaps between
expected and experienced Seat Occupancy Factures measures. This figure has been a
consistent factor in influencing low utilisation measures over past years of data analysis.
Analysis of utilisation data over weeks 15 and 16 highlights a variance between audit and
timetable data. Room frequency data (RFF) over the period indicates a general trend whereby learning
and teaching space that had timetabled events scheduled were empty at the time of audit (Figures 1 &
2). This is interpreted as an overbooking of timetable booked classes. Seat occupancy (SOF) metrics
indicate a significant gap between what was anticipated in the timetable and what the auditors
accounted for (Figures 1 & 2). There are numerous dynamics influencing these results and within this
area alone there is significant body of academic literature discussing potential factors.
14.6%
28.3%
4.1%
43.6%
50.7%
22.1%
0%
10%
20%
30%
40%
50%
60%
Room Frequency Factor (RFF) Seat Occupancy Factor (SOF) Utilisation (UTIL)
Wagga Wagga Campus Residential School S1 2017: (Boorooma Precinct Buildings 11, 12, 14 & 21)
Audit Timetable

CSU Residential School Learning & Teaching Space 2017 Utilisation Report – Wagga Wagga Campus Page 6
Version 1.0 – June 2017
Figure 2 - Wagga Wagga Campus, Boorooma Precinct, Buildings 11, 12, 14 and 21 Audit and Timetable Utilisation
3.0 Utilisation by Room Type
Figure 3 - Wagga Wagga Campus, Boorooma Precinct, Buildings 11, 12, 14 and 21 Audit and Timetable Utilisation by Room
Type
CSU Residential School Learning & Teaching Space 2017 Utilisation Report – Wagga Wagga Campus Page 7
Version 1.0 – June 2017
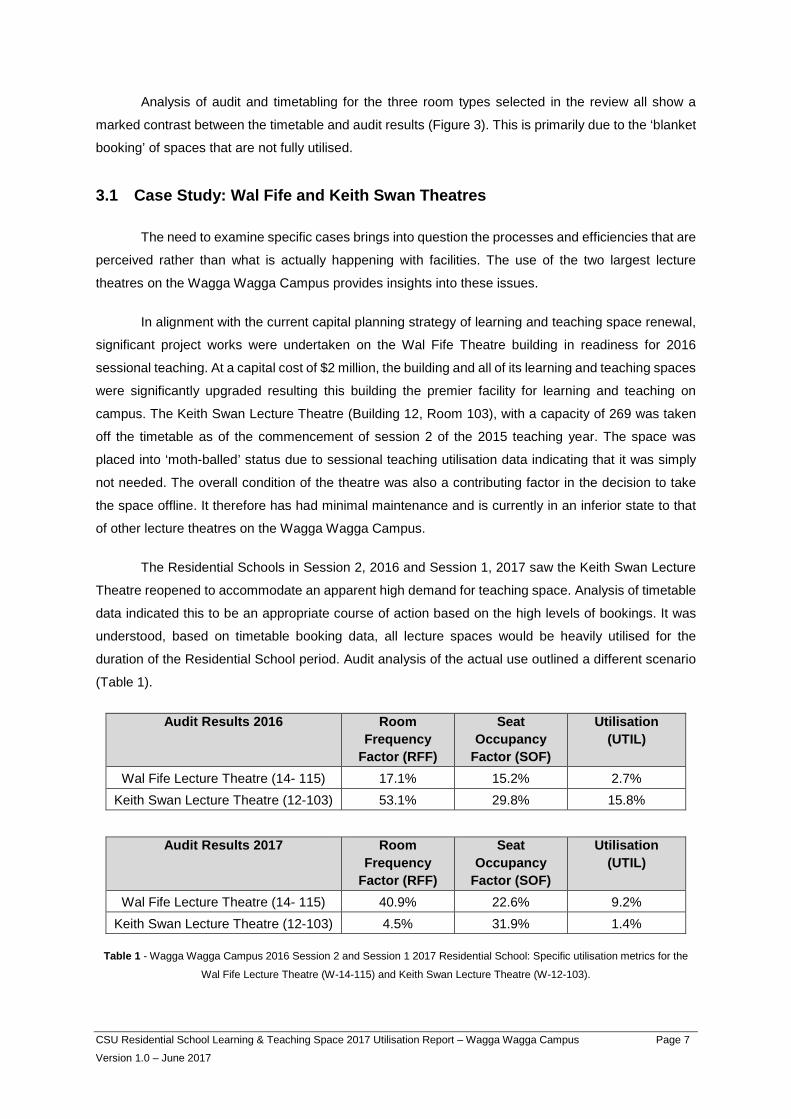
Analysis of audit and timetabling for the three room types selected in the review all show a
marked contrast between the timetable and audit results (Figure 3). This is primarily due to the ‘blanket
booking’ of spaces that are not fully utilised.
3.1 Case Study: Wal Fife and Keith Swan Theatres
The need to examine specific cases brings into question the processes and efficiencies that are
perceived rather than what is actually happening with facilities. The use of the two largest lecture
theatres on the Wagga Wagga Campus provides insights into these issues.
In alignment with the current capital planning strategy of learning and teaching space renewal,
significant project works were undertaken on the Wal Fife Theatre building in readiness for 2016
sessional teaching. At a capital cost of $2 million, the building and all of its learning and teaching spaces
were significantly upgraded resulting this building the premier facility for learning and teaching on
campus. The Keith Swan Lecture Theatre (Building 12, Room 103), with a capacity of 269 was taken
off the timetable as of the commencement of session 2 of the 2015 teaching year. The space was
placed into ‘moth-balled’ status due to sessional teaching utilisation data indicating that it was simply
not needed. The overall condition of the theatre was also a contributing factor in the decision to take
the space offline. It therefore has had minimal maintenance and is currently in an inferior state to that
of other lecture theatres on the Wagga Wagga Campus.
The Residential Schools in Session 2, 2016 and Session 1, 2017 saw the Keith Swan Lecture
Theatre reopened to accommodate an apparent high demand for teaching space. Analysis of timetable
data indicated this to be an appropriate course of action based on the high levels of bookings. It was
understood, based on timetable booking data, all lecture spaces would be heavily utilised for the
duration of the Residential School period. Audit analysis of the actual use outlined a different scenario
(Table 1).
Audit Results 2016
Room Frequency
Factor (RFF)
Seat Occupancy
Factor (SOF)
Utilisation (UTIL)
Wal Fife Lecture Theatre (14- 115) 17.1% 15.2% 2.7% Keith Swan Lecture Theatre (12-103) 53.1% 29.8% 15.8%
Audit Results 2017
Room Frequency
Factor (RFF)
Seat Occupancy
Factor (SOF)
Utilisation (UTIL)
Wal Fife Lecture Theatre (14- 115) 40.9% 22.6% 9.2% Keith Swan Lecture Theatre (12-103) 4.5% 31.9% 1.4%
Table 1 - Wagga Wagga Campus 2016 Session 2 and Session 1 2017 Residential School: Specific utilisation metrics for the
Wal Fife Lecture Theatre (W-14-115) and Keith Swan Lecture Theatre (W-12-103).

CSU Residential School Learning & Teaching Space 2017 Utilisation Report – Wagga Wagga Campus Page 8
Version 1.0 – June 2017
The greater reliance on the Wal Fife theatre in 2017 is pleasing, with the Keith Swan Lecture
Theatre being used sparingly, (the opposite was the case in 2016). The Wal Fife Theatre, was relatively
solidly booked and had an overall utilisation of 9.2% in 2017, up from 2.7% in 2016. The Keith Swan
Lecture Theatre reported a reduced utilisation of 1.5% in 2017, down from 15.8% in 2016 (Table 2).
However there was no valid reason to book or use the Keith Swan Lecture Theatre. The use of
the Theatre could easily have been accommodated in the Wal Fife Lecture theatres. There was ‘no
clash’ in the timetable that could not have been accommodated elsewhere. This is highlighted in the
following two graphs.
Figure 4 - Wagga Wagga Campus 2017 Session 1 Residential School: Wal Fife Lecture Theatre (W-14-115) and Keith Swan
Lecture Theatres (W-12-103). Comparative analysis of audited hours of actual use.
Figure 4 provides detail relating to the actual hours used for both Wal Fife and Keith Swan
theatres. Figure 5 provides total numbers of students counted in both spaces during the audit process.
Evidence indicates the approach of ‘blanket’ booking is creating the apparent issues in capacity for
Residential Schools. Blanket bookings has a ripple effect which in-turn forces Timetabling to move
classes into less suitable spaces or spaces that have been closed to sessional teaching such as the
Keith Swan Lecture theatre (Building 12).
The student experience is adversely affected and has a reputational effect upon the
organisation. Key to large lecture theatre spaces is that spaces with high functionality, quality,
configuration to utilise a range of teaching pedagogies will both enhance the learning experience of
visiting online students and add reputational value to the organisation. The Keith Swan Theatre offers
none of the above factors and is not required for learning and teaching and should be closed.

CSU Residential School Learning & Teaching Space 2017 Utilisation Report – Wagga Wagga Campus Page 9
Version 1.0 – June 2017
Figure 5 - Wagga Wagga Campus 2017 Session 1 Residential School: Wal Fife Lecture Theatre (W-14-115) and Keith Swan
Lecture Theatres (W-12-103). Comparative analysis of audited total student attendance.
4.0 Subject Analysis
Analysis of subject data using data from the University timetable, Banner, the University
Handbook and audit returns indicates a number of anomalies in the correlation of assumed learning
and teaching space need versus actual bookings. Table 2 highlights examples of excessive booking of
space based on assumed space requirements for student numbers over the duration of the subject’s
residential school class booking. This is indicative of blanket booking whereby spaces are booked for
whole days or the duration of the subject residential school class booking with audit results indicating
that a large percentage of scheduled time is not used by classes.
Potential drivers for this form of booking include process - historically larger student cohorts and
a rollover of the previous year’s bookings or, pedagogy - more flexible, fluid teaching requirements
meaning a greater need for space to undertake breakout activities. Further consultation with subject
coordinators is required to understand in more detail the rationale behind high hours of bookings but is
it clear that the numbers reported are excessive. Ultimately overbooked space can be reallocated to
other subjects or not allocated resulting in savings in operational costs.

CSU Residential School Learning & Teaching Space 2017 Utilisation Report – Wagga Wagga Campus Page 10
Version 1.0 – June 2017
Wagga Wagga Campus 2017 Session 1 Residential School: Analysis of Subjects
Subject School Faculty Banner
Enrolment
Residential
School
Days
Total
Hours
Booked
Estimated
Overbooking
Ratio
HCS300/HCS509 SHSS FOAE 102 4 486 15
NRS211 SNMIH FOS 25 4 324 10
MHP105 SNMIH FOS 33 5 348.5 9
BMS229 SBS FOS 23 3 160 7
CHM108 SAWS FOS 191 3 160 7
CHM104 SAWS FOS 109 3 160 7
HCS200/HCS507 SHSS FOAE 186 4 204.5 6
BMS129 SBS FOS 113 3 152 6
ASC148 SAVS FOS 41 1 50 6
ASC261/ASC461 SAVS FOS 43 2 80 5
PSC415 SAWS FOS 31 2 74 5
ASC106 SAVS FOS 24 1 32 4
BMS308 SBS FOS 45 3 96 4
ITC355 SOMP FOBJBS 11 1 32 4
PSC102 SAWS FOS 93 3 96 4
PSC202 SAWS FOS 12 3 96 4
Table 2 - Wagga Wagga Campus 2017 Session 1 Residential School: Analysis of subjects with an estimated overbooking ratio
of 4x times what would be expected based on total booked hours
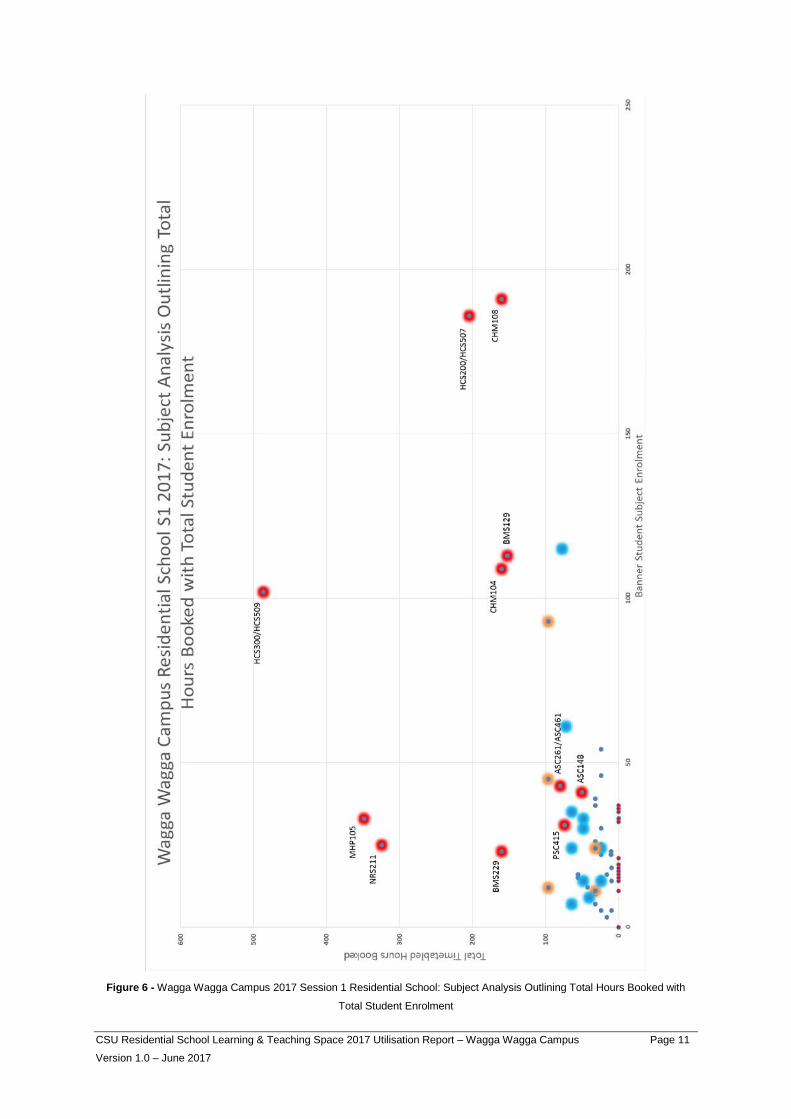
Figure 6 displays all subjects with residential school bookings based on student subject
enrolment and timetable booking data. A clear cluster of subjects appears with cohorts under fifty
students and bookings of one hundred hours or less. Based on timetable data, the average duration of
a residential school during this period was 2.77 days.
Graph Element Element Explanation
Blue Dot / Red Halo Bookings in excess of 5x estimated space requirements
Blue Dot / Orange Halo Bookings in excess of 4x estimated space requirements
Blue Dot / Blue Halo Bookings in excess of 3x estimated space requirements
Blue Dot / No Halo Bookings falling within expected (1-2x) space requirements
Black Dot / No Halo Bookings for subjects with no Residential School
Red Dot / No Halo Subjects with Banner enrolments exist and residential schools listed in
the handbook but no bookings within the timetable.
Table 3 - Wagga Wagga Campus 2016 Session 2 Residential School: Breakdown of Figure 25 graphing elements.
CSU Residential School Learning & Teaching Space 2017 Utilisation Report – Wagga Wagga Campus Page 11
Version 1.0 – June 2017
Figure 6 - Wagga Wagga Campus 2017 Session 1 Residential School: Subject Analysis Outlining Total Hours Booked with
Total Student Enrolment

CSU Residential School Learning & Teaching Space 2017 Utilisation Report – Wagga Wagga Campus Page 12
Version 1.0 – June 2017
Table 3 provides detailed explanation regarding the separation of graphed elements in Figure
6 aligning with subject data highlighted in Table 2. Anomalous subject space bookings are clearly
identifiable when compared to the collective dataset. Sixty one percent of subjects fell within expected
space requirements of one to two times booking ratio. Booking ratio was calculated on total timetabled
hours booked per subject reconciled with an expected maximum eight hours of teaching. It is expected
that some subjects may have booking ratios greater than one based on potential requitements for
laboratory and teaching spaces or breakout group teaching. With this said, any subjects with a ratio
greater than two have been highlighted. Furthermore there were a number of booking anomalies
whereby subjects flagged as a scheduled residential schools did not correlate with a corresponding
timetable entry (Figure 6).
Ongoing analysis of subject level booking data is recommended to clearly define the actual
requirement for spaces to align with pedagogy outcomes. Current auditing processes do not provide
detail relating to use of space outside of subject bookings. That is, we cannot reliably reconcile actual
subject hours taught if lessons were conducted in spaces other than those booked or were undertaken
without bookings.
Based on the above, there is a significant argument that high levels of blanket booking of space
exist. There is also additional evidence that a number of subjects are not booked within the timetable,
possibly booked at a faculty level using faculty facilities. Reasons for this may include exclusivity of
space or some schools choosing not to use the timetable to book space.
The concept of the campus being full during residential schools is based more on perceptions
derived from bookings. In actuality, there is plentiful space for the teaching of residential school subjects
on campus. The processes behind subject space bookings require a full review to identify why situations
of over-booking and under-booking exists.
5.0 Key Observations
1. Reasons for over-booking are:
a. Blanket booking of rooms. This is a reoccurring issue.
b. Rollover of timetable bookings based on historically large student cohorts.
c. Multiple rooms booked to be used simultaneously, often as blanket bookings.
d. Erroneous bookings in the Timetable with no room attached.
2. Some extreme examples of overbooking of spaces exists such as:
a. HCS300/CS509 with an enrolment of 102 students which was booked for 486 hours of
teaching over 4 days.
b. NRS211 with an enrolment of 25 students which was booked for 324 hours of teaching
over 4 days.
c. MHP105 with an enrolment of 33 students which was booked for 348.5 hours of teaching
over 5 days.

CSU Residential School Learning & Teaching Space 2017 Utilisation Report – Wagga Wagga Campus Page 13
Version 1.0 – June 2017
3. Lecture Theatres within the Boorooma Precinct were not used effectively with the Keith Swan
Lecture Theatre being reopened. Data clearly indicates the reopening of the Keith Swan Theatre
was not required. Clashes in observed use could have been resolved by scheduling use in other
facilities within the Wal Fife Theatre complex.
4. The processes facilitating the scheduling of Residential schools appears to be deregulated with
minimal ‘common’ procedures across Faculties and Schools and possibly (although not proven)
Campuses. Additionally, the process by which timetabling are informed of residential school needs
appears to be different between Faculties and Schools.
5. Data within this report is drawn from the Wagga Wagga Campus Session 1 Residential School. It
has verified that the symptomatic issues highlighted in the ‘CSU Residential School Learning and
Teaching Space 2016 Utilisation Report, Wagga Wagga Campus’ document are duplicated across
the Residential School sessions 1 and 2.
6.0 Recommendations
This report identifies a number of principles and recommendations for physical learning and teaching
spaces across the university. These recommendations have been taken from the 2016 report as 2017
analysis has identified the same issues:
1. Report Driver
The study of the Session 1 Residential School on the Wagga Wagga Campus was initiated primarily
due to feedback from Timetabling and academic stakeholders indicating the campus was effectively full
in terms of available learning and teaching space. Analysis has indicated that there is plentiful space
on the Boorooma Precinct of the Wagga Wagga Campus to accommodate existing load and any future
growth.
2. Process Reengineering
Feedback from Timetabling (DSA) indicates their role is to fundamentally book spaces based on the
requirements set down by Schools and Faculties. It is clear that the data provided by these groups, in
many cases is incorrect. Additionally, the methodology currently used by Timetabling to schedule each
residential school is not conducive to developing an efficient timetable. These factors lead to issues
highlighted within this report such as blanket booking, over booking, squatting and classes being
conducted in spaces that are not overly favourable to supporting the student experience. It is
recommended a full review of the residential school policy and associated process is undertaken
considering facility use efficiencies, the needs of academics and students, along with identifying owners
of the end-to-end process of scheduling. Additionally, subject analysis at a pedagogical level is
recommended to understand real space needs based on proposed teaching patterns / plans. There is
a great potential for Timetabling to adopt the role of business partner working with academic
stakeholders to drive an effective and efficient process.

CSU Residential School Learning & Teaching Space 2017 Utilisation Report – Wagga Wagga Campus Page 14
Version 1.0 – June 2017
3. Lecture Theatres
Permanently remove the Keith Swan Theatre from the University timetable (Sessional and Residential
School) and mothball the facility. In collaboration with campus stakeholders, the space will be reviewed
to establish its longer term future.
4. Financial Implications The costs of underutilised assets have far reaching implications which can be summarised as:
a. Operational costs that are expended inefficiently across facilities that should be more highly
utilised and rationalised.
b. Capital costs that are maintaining/renovating an asset portfolio, where older or seriously
underutilised stock could be moth-balled, decommissioned or demolished.
c. Amortisation costs that are accruing on Assets that should be ‘off the books’.
d. Opportunity costs associated with funds expended in operating and capital costs that could be
channelled into other university priorities.
e. Reputational costs associated with poor utilisation that continues to affect staff and students by
not prioritising classes in the best facilities for the best student experience and outcomes.
5. Ongoing Audits As with the 2016 Report findings, DFM does not intend to conduct future audits of Residential Schools
until the University demonstrates changes to timetabling principles and practices.
CSU Residential School Learning & Teaching Space 2017 Utilisation Report – Wagga Wagga Campus Page 15
Version 1.0 – June 2017
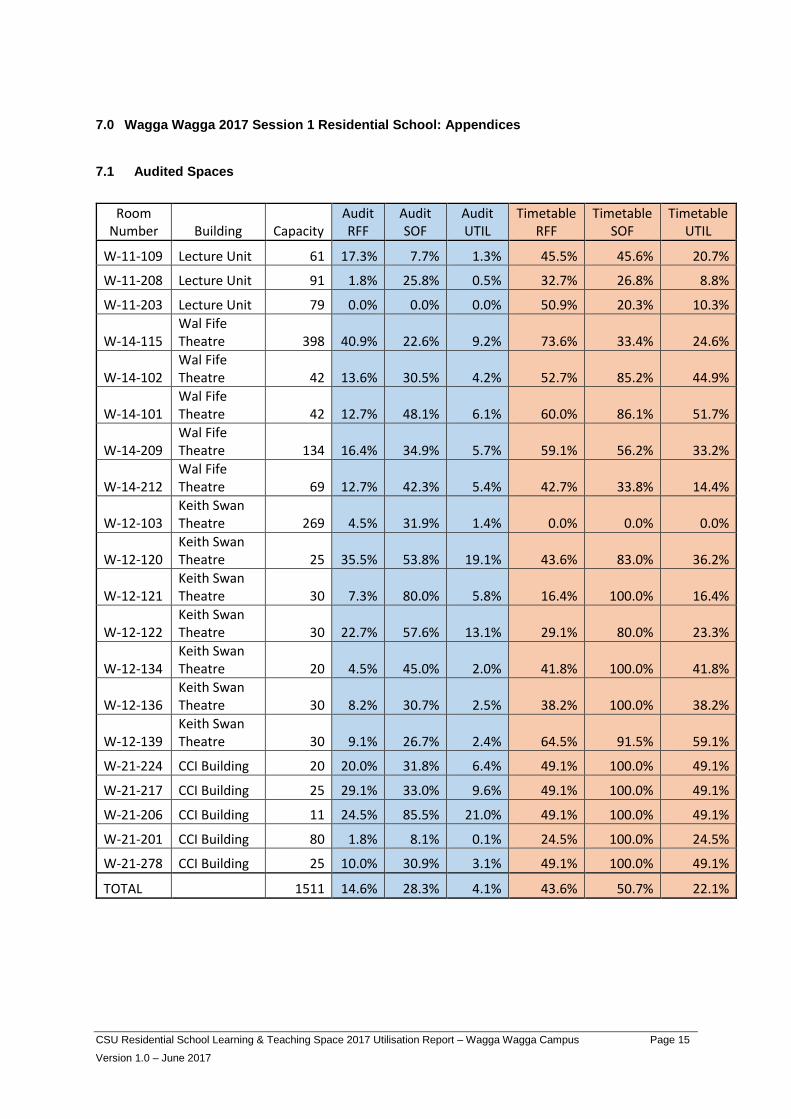
7.0 Wagga Wagga 2017 Session 1 Residential School: Appendices
7.1 Audited Spaces
Room Number Building Capacity
Audit RFF
Audit SOF
Audit UTIL
Timetable RFF
Timetable SOF
Timetable UTIL
W-11-109 Lecture Unit 61 17.3% 7.7% 1.3% 45.5% 45.6% 20.7%
W-11-208 Lecture Unit 91 1.8% 25.8% 0.5% 32.7% 26.8% 8.8%
W-11-203 Lecture Unit 79 0.0% 0.0% 0.0% 50.9% 20.3% 10.3%
W-14-115 Wal Fife Theatre 398 40.9% 22.6% 9.2% 73.6% 33.4% 24.6%
W-14-102 Wal Fife Theatre 42 13.6% 30.5% 4.2% 52.7% 85.2% 44.9%
W-14-101 Wal Fife Theatre 42 12.7% 48.1% 6.1% 60.0% 86.1% 51.7%
W-14-209 Wal Fife Theatre 134 16.4% 34.9% 5.7% 59.1% 56.2% 33.2%
W-14-212 Wal Fife Theatre 69 12.7% 42.3% 5.4% 42.7% 33.8% 14.4%
W-12-103 Keith Swan Theatre 269 4.5% 31.9% 1.4% 0.0% 0.0% 0.0%
W-12-120 Keith Swan Theatre 25 35.5% 53.8% 19.1% 43.6% 83.0% 36.2%
W-12-121 Keith Swan Theatre 30 7.3% 80.0% 5.8% 16.4% 100.0% 16.4%
W-12-122 Keith Swan Theatre 30 22.7% 57.6% 13.1% 29.1% 80.0% 23.3%
W-12-134 Keith Swan Theatre 20 4.5% 45.0% 2.0% 41.8% 100.0% 41.8%
W-12-136 Keith Swan Theatre 30 8.2% 30.7% 2.5% 38.2% 100.0% 38.2%
W-12-139 Keith Swan Theatre 30 9.1% 26.7% 2.4% 64.5% 91.5% 59.1%
W-21-224 CCI Building 20 20.0% 31.8% 6.4% 49.1% 100.0% 49.1%
W-21-217 CCI Building 25 29.1% 33.0% 9.6% 49.1% 100.0% 49.1%
W-21-206 CCI Building 11 24.5% 85.5% 21.0% 49.1% 100.0% 49.1%
W-21-201 CCI Building 80 1.8% 8.1% 0.1% 24.5% 100.0% 24.5%
W-21-278 CCI Building 25 10.0% 30.9% 3.1% 49.1% 100.0% 49.1%
TOTAL 1511 14.6% 28.3% 4.1% 43.6% 50.7% 22.1%

CSU Residential School Learning & Teaching Space 2017 Utilisation Report – Wagga Wagga Campus Page 16
Version 1.0 – June 2017
7.2 Audited Spaces Utilisation Metrics by Building
Building 11 Room Frequency Factor (RFF)
Seat Occupancy Factor (SOF)
Utilisation (UTIL)
Audit 6.4% 10.1% 0.6%
Timetable 43.0% 29.4% 12.7%
Variance -36.7% -19.3% -12.0%
Building 12 Room Frequency Factor (RFF)
Seat Occupancy Factor (SOF)
Utilisation (UTIL)
Audit 13.1% 44.9% 5.9%
Timetable 33.4% 91.8% 30.6%
Variance -20.3% -46.9% -24.7%
Building 14 Room Frequency Factor (RFF)
Seat Occupancy Factor (SOF)
Utilisation (UTIL)
Audit 19.3% 25.6% 4.9%
Timetable 57.6% 43.0% 24.8%
Variance -38.4% -17.3% -19.8%
Building 21 Room Frequency Factor (RFF)
Seat Occupancy Factor (SOF)
Utilisation (UTIL)
Audit 17.1% 38.3% 6.6%
Timetable 44.2% 100.0% 44.2%
Variance -27.1% -61.7% -37.6%
CSU Residential School Learning & Teaching Space 2017 Utilisation Report – Wagga Wagga Campus Page 17
Version 1.0 – June 2017
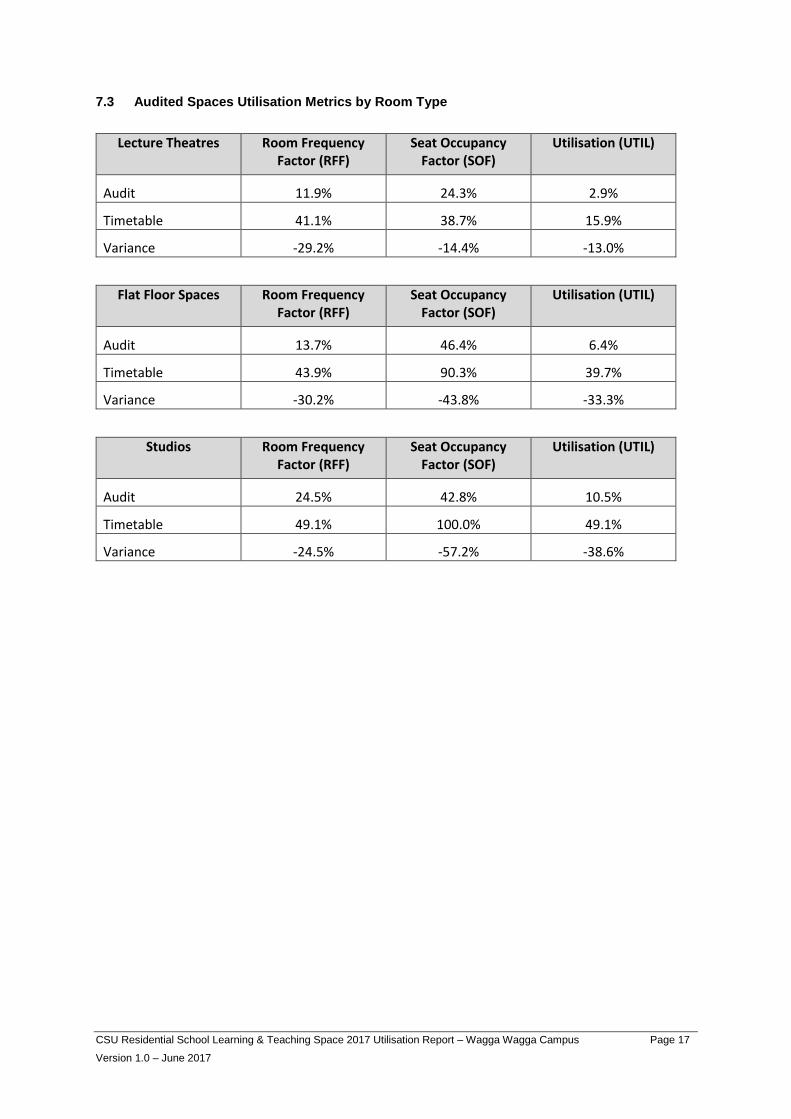
7.3 Audited Spaces Utilisation Metrics by Room Type
Lecture Theatres Room Frequency Factor (RFF)
Seat Occupancy Factor (SOF)
Utilisation (UTIL)
Audit 11.9% 24.3% 2.9%
Timetable 41.1% 38.7% 15.9%
Variance -29.2% -14.4% -13.0%
Flat Floor Spaces Room Frequency Factor (RFF)
Seat Occupancy Factor (SOF)
Utilisation (UTIL)
Audit 13.7% 46.4% 6.4%
Timetable 43.9% 90.3% 39.7%
Variance -30.2% -43.8% -33.3%
Studios Room Frequency Factor (RFF)
Seat Occupancy Factor (SOF)
Utilisation (UTIL)
Audit 24.5% 42.8% 10.5%
Timetable 49.1% 100.0% 49.1%
Variance -24.5% -57.2% -38.6%