Embed Size (px)
Citation preview

CSE Senior Design ICSE Senior Design I
Your Plan: EstimationYour Plan: Estimation
Instructor: Mike O’DellInstructor: Mike O’Dell
This presentations was derived from the textbook used for this class, This presentations was derived from the textbook used for this class, McConnell, Steve, McConnell, Steve, Rapid DevelopmentRapid Development, Chapter 8, further expanded on , Chapter 8, further expanded on
by Mr. Tom Rethard for this course.by Mr. Tom Rethard for this course.
1
2
Estimations and SchedulingEstimations and Scheduling
Discussion: Case Study 8.1 (pp. 163-165) Has this ever happened to you
(work/school)? What was the underlying problem? What should Carl have done?
Estimating the job by: Seat of the pants, or A proven, rational process?

1
3
OverviewOverview
The Software-Estimation Story (Synopsis)
Estimation-Process OverviewSize EstimationEffort EstimationSchedule EstimationBallpark Schedule EstimatesEstimate Refinement
1
4
The Software Estimation StoryThe Software Estimation Story**
Software/System development, and thus estimation, is a process of gradual refinement.
Can you build a 3-bedroom house for $100,000? (Answer: It depends!)
Some organizations want cost estimates to within ± 10% before they’ll fund work on requirements definition. (Is this possible?)
Present your estimate as a rangerange instead of a “single point in time” estimate.
The tendency of most developers is to under-estimate and over-commit!
* Copyright 2007, The DSW Group Ltd.

1
5
Estimate-Convergence GraphEstimate-Convergence Graph
Initialproduct
definition
Approvedproduct
definition
Requirementsspecification
Architecturedesign
specification
Detaileddesign
specification
Productcomplete
1.0
0.25
4
2
0.5
1.5
0.67
1.25
0.81.0
0.6
1.6
1.25
0.8
1.15
0.85
1.1
0.9
Project Cost(effort and size) Project
Schedule
High Estimate
High Estimate
Low Estimate
Low Estimate

1
6
Estimation vs. ControlEstimation vs. Control
Initially, customers want morecustomers want more than they can afford, something’s gotta givesomething’s gotta give…
Pro
duct
Siz
e/F
eatu
res
Evolution of Project(fixed resources)
Initially availableresources
Initially desiredfeature set
Features
Resources
Evolution of Project(fixed requirements)
Initially availableresources
Initially desiredfeature set Features
Resources
Developers and customers must choose between estimation accuracy and project control.
Pro
duct
Siz
e/F
eatu
res
1
7
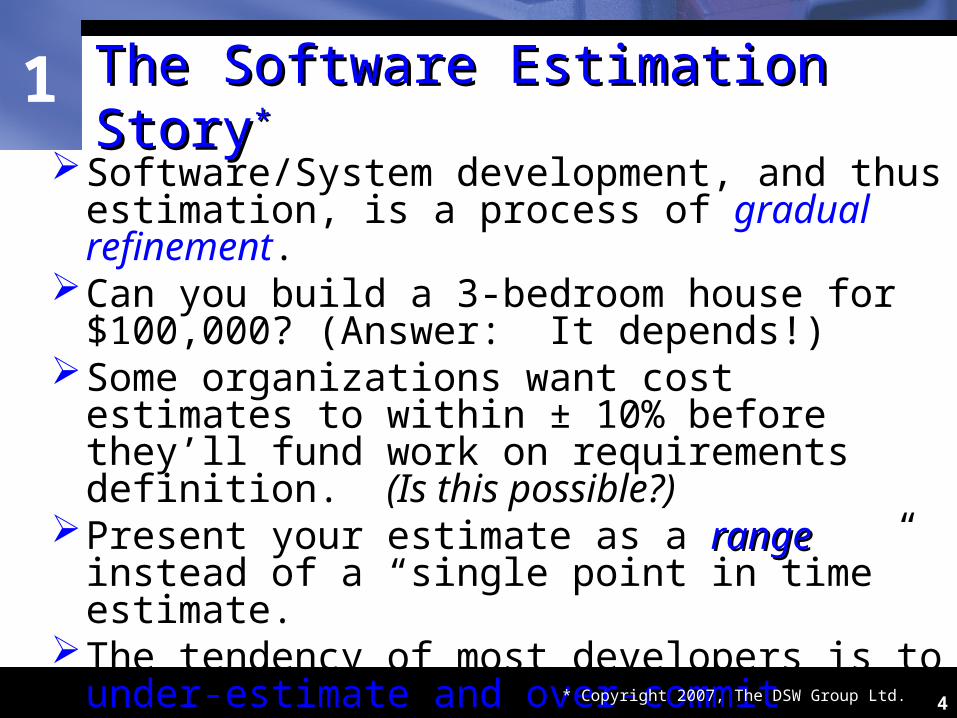
Cooperation, Cooperation, RefinementRefinement Explain to stakeholders that you will have
better estimatesbetter estimates at each project milestone. You can’t estimate what you don’t know.
ActualSchedule
Estimated Schedule
Minimum actual schedule
Actual schedule = Estimated Schedule
Estimate too high:costs higher due
to Parkinson’s law
Estimate too low:costs higher due
to planninginefficiencies and
mistakesEstimate Estimate ConvergencConvergencee

1
8
Estimation-Process OverviewEstimation-Process Overview
Step 1: Estimate the sizesize of the product (lines of code or function points)
Step 2: Estimate the efforteffort (man-months)
Step 3: Estimate the scheduleschedule(calendar months)
Step 4 (Meta-Step): Provide estimates in ranges and periodically (periodically (frequentlyfrequently) refine) refine the ranges to provide increasing precision as the project progresses

1
9
Size EstimationSize Estimation
Use an algorithmic approach, that estimates a program’s size from its features
Use size-estimation softwareCompare to similar projects in your
organization, by pieces.Software programs and algorithmic
approaches should be calibrated to your environment.
1
10
Estimation tipsEstimation tips Avoid off-the-cuff Avoid off-the-cuff estimates Allow time for the estimate (do it right!) Use data from previous projects Use developer-based estimates Estimate by walk-through Estimate by categories Estimate at a low-level of detail Don’t forget/omit common tasks Use software estimation tools Use several different techniques, and compare the
results Evolve estimation practices as the project progresses

1
11
Function-Point EstimationFunction-Point EstimationBased on number of
Inputs(screens, dialogs, controls, messages)
Outputs(screens, reports, graphs, messages)
Inquiries(I/O resulting in a simple, immediate output)
Logical internal files(Major logical groups of end-user data, controlled by program)
External interface files(Files controlled by other programs that this program uses. Includes logical data that enters/leaves program)

1
12
Function-Point MultipliersFunction-Point MultipliersFunction Points
Program Low Medium HighCharacteristic Complexity Complexity ComplexityNumber of inputs 3 4 6Number of outputs 4 5 7Inquiries 3 4 6Logical internal files 7 10 15External interface files 5 7 10
Sum these to get an “unadjusted function-point total”
Multiply this by an “influence multiplier” (0.65 to 1.35),based on 14 factors from data communication to ease ofinstallation.
All of this gives a total function-point count.Use this with Jones’ First-Order Estimation Practice, orcompare to previous projects for an estimate

1 Jones First-Order Estimate: Jones First-Order Estimate: Influence Multipliers Influence Multipliers
General System General System Characteristic Characteristic Brief DescriptionBrief Description
1. Data communications How many communication facilities are there to aid in the transfer or exchange of information with the application or system?
2. Distributed data processing
How are distributed data and processing functions handled?
3. Performance Was response time or throughput required by the user?
4. Heavily used configuration How heavily used is the current hardware platform where the application will be executed?
5. Transaction rate How frequently are transactions executed daily, weekly, monthly, etc.?
6. On-Line data entry What percentage of the information is entered On-Line?
7. End-user efficiency Was the application designed for end-user efficiency?
8. On-Line update How many ILF’s are updated by On-Line transaction?
9. Complex processing Does the application have extensive logical or mathematical processing?
10. Reusability Was the application developed to meet one or many user’s needs?
11. Installation ease How difficult is conversion and installation?
12. Operational ease How effective and/or automated are start-up, back-up, and recovery procedures?
13. Multiple sites Was the application specifically designed, developed, and supported to be installed at multiple sites for multiple organizations?
14. Facilitate change Was the application specifically designed, developed, and supported to facilitate change?
13

1
14
Effort EstimationEffort Estimation
Use estimation software to create an effort estimate directly from size estimate
Use McConnell’s schedule tables (Tables 8-8 through 8-10)
Use your organization's historical dataUse algorithmic approach (COCOMO,
Putnam)

1
15
Schedule EstimationSchedule Estimation
Rule-of-thumb equation schedule in months = 3.0 * man-months 1/3
This equation implies an optimal team size. Use estimation software to compute the
schedule from your size and effort estimates Use historical data from your organization Use McConnell’s Tables 8-8 through 8-10 to look
up a schedule estimate based on the size estimate
Use the schedule estimation step from one of the algorithmic approaches (e.g., COCOMO) to get a more fine tunes estimate than the “Rule of thumb” equation.

1
16
Jones’ First-Order EstimationJones’ First-Order Estimation
Kind of Software Best in Class Average Worst in Class
Systems 0.43 0.45 0.48Business 0.41 0.43 0.46Shrink-wrap 0.39 0.42 0.45
Take the function-point total and raise it to the appropriate power.Example:
350 function pointsaverage shrink-wrap development organization
3500.42 12 calendar months
This method works well for quick reality checks. (No magic!)
Organization’s Skills/Abilities

1
17
Ballpark Schedule EstimatesBallpark Schedule EstimatesUsable, concrete information is either:
embedded in expensive software-estimation systems
in books with dozens of equations and multipliers
McConnell’s tables tables describe systems software business software shrink-wrap software
Size in lines of codelines of codeAccuracy of McConnell’s tables… better than
seat of the pants, but should be validated.
1
18
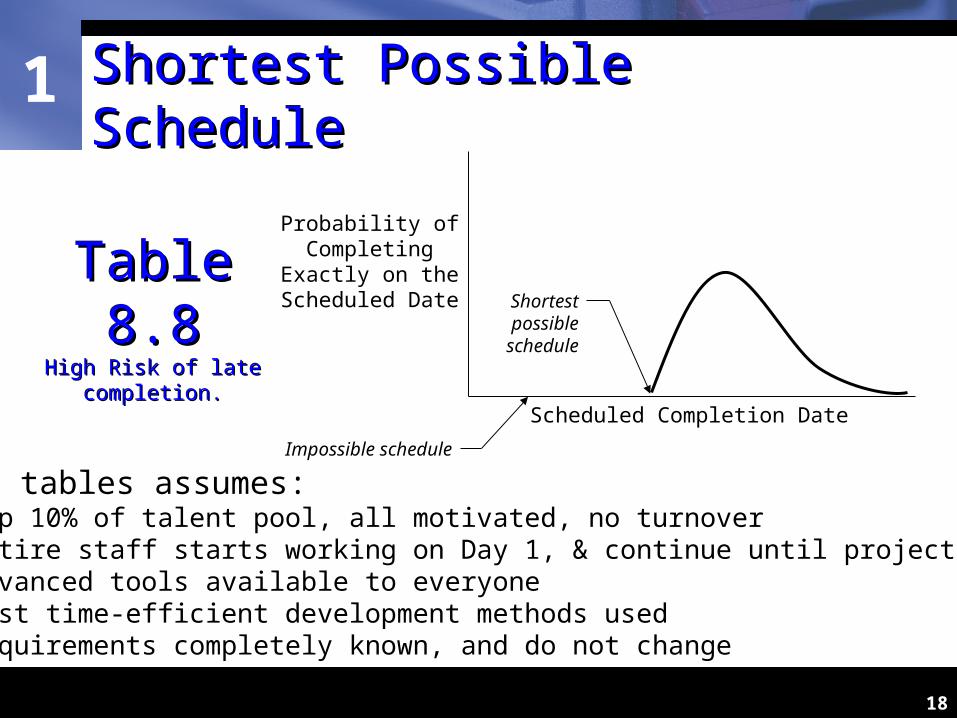
Shortest Possible ScheduleShortest Possible Schedule
Probability ofCompleting
Exactly on theScheduled Date
Scheduled Completion Date
Shortestpossible
schedule
Impossible schedule
• This tables assumes:- Top 10% of talent pool, all motivated, no turnover- entire staff starts working on Day 1, & continue until project released- advanced tools available to everyone- most time-efficient development methods used- requirements completely known, and do not change
Table 8.8Table 8.8High Risk of late High Risk of late
completion.completion.
1
19
Efficient Schedules (Table 8-9)Efficient Schedules (Table 8-9)This table assumes:
Top 25% of talent pool Turnover < 6% per year No significant personnel conflicts Using efficient development practices from Chap 1-5 Note that less effort required on efficient schedule
tables
For most projects, the efficient schedules represent “best-case”

1
20
Nominal Schedules (Table 8-10)Nominal Schedules (Table 8-10)
This table assumes: Top 50% of talent pool Turnover 10-12% per year Risk-management less than ideal Office environment only adequate Sporadic use of efficient development practices
Achieving nominal schedule may be a 50/50 bet.

1
21
Estimate Presentation StylesEstimate Presentation Styles
Plus-or-minus qualifiers“6 months, +3 months, -2
months” Ranges
“5-9 months” Risk quantification
“6 months...+1 month for late
subcontractor,+0.5 month for staff
sickness,etc...”
CasesBest case April
1Planned case May 15Current case May 30Worst case July
15
Coarse dates and time periods“3rd quarter 97”
Confidence factorsApril 1 5%May 15 50%July 1 95%

1
22
Schedule Estimation - ExampleSchedule Estimation - Example Software Project Size and Productivity ApproachSoftware Project Size and Productivity Approach
Low Side High Side(Aggressive)(Conservative)
Size Estimate 10000 LOC 30000 LOC
Productivity 400 LOC/PM 200 LOC/PM
Effort 25 PM 150 PM
Duration 5 months 30 months(5 person team)
McConnell Table 8-10 (p. 196), Nominal Schedule, System McConnell Table 8-10 (p. 196), Nominal Schedule, System ProductProduct
Duration 10 months 16 months

1
23
Schedule Estimation - Schedule Estimation - ExampleExample
Rule of Thumb (Duration = 3 x PMRule of Thumb (Duration = 3 x PM1/31/3))Low Side High Side(Aggressive)(Conservative)
3 x 251/3 = 3 x 1501/3 =Duration 8.8 (9) months 15.9 (16) months
# FnPts
Inputs 10 40
Outputs 5 25
Inquiries 10 40
Logical Int. Files 3030
Logical Ext. Files 214
149(unadj.)
Use Influence Multiplier of 1.2
Therefore:
1.2 x 149 180 adjusted fn points
Assuming Nominal Skills, System Product, Jones’s First Order says:
Duration = 180.45 = 10.35
months
Function Points, with Jones’s First Order Schedule Estimation (Medium Function Points, with Jones’s First Order Schedule Estimation (Medium complexity project – Table 8-2)complexity project – Table 8-2)

1
24
Schedule Estimation - Schedule Estimation - ExampleExample
Basic CoCoMo Estimation Coefficients, based on project Basic CoCoMo Estimation Coefficients, based on project type/complexity:type/complexity:
CoCoMo – nominal, semi-detachedCoCoMo – nominal, semi-detachedLow Side High Side(Aggressive)(Conservative)
Effort - PM E = 3.0(10)1.12 E = 3.0(30)1.12
E = a(SLOC)b = 68.45 PM = 135.36 PM
Duration – months E = 2.5(69).35 E = 2.5(136).35
D = c(E)d = 11 months = 14 months
Coefficient a b c d
Organic 2.4 1.05 2.5 0.38
Semi-detached 3.0 1.12 2.5 0.35
Embedded 3.6 1.20 2.5 0.32
1
25
Schedule Estimation - Schedule Estimation - ExampleExample
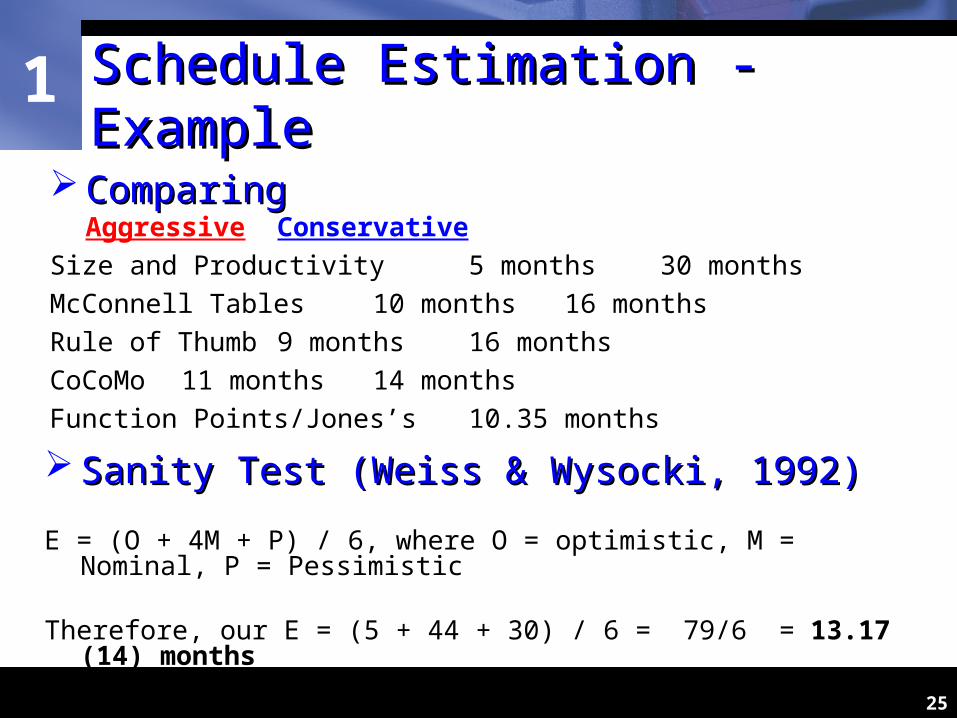
ComparingComparingAggressive Conservative
Size and Productivity 5 months 30 monthsMcConnell Tables 10 months 16 monthsRule of Thumb 9 months 16 monthsCoCoMo 11 months 14 monthsFunction Points/Jones’s 10.35 months
Sanity Test (Weiss & Wysocki, 1992)Sanity Test (Weiss & Wysocki, 1992)
E = (O + 4M + P) / 6, where O = optimistic, M = Nominal, P = Pessimistic
Therefore, our E = (5 + 44 + 30) / 6 = 79/6 = 13.17 (14) months
1
26
Estimate RefinementEstimate Refinement
Estimate can be refined only with a more refined definition of the software product
Developers often let themselves get trapped by a “single-point” estimate, and are held to it (Case study 1-1) Impression of a slip over budget is created
when the estimate increasesWhen estimate ranges decrease as the
project progresses, customer confidence is built-up.

1 RecommendationsRecommendations
Do not depend on a single cost or schedule estimate.
Use several Use several estimating techniques or cost models, comparecompare the results, and determine the reasons for any large variations.
Document the assumptions Document the assumptions made when making the estimates.
MonitorMonitor the project to detect when assumptions that turn out to be wrong jeopardize the accuracy of the estimate.
Maintain a historical databasehistorical database
28

1
29
ConclusionsConclusionsEstimate accuracy is directly proportionaldirectly proportional to
product definition. Before requirements specification, product is very
vaguely defined More effort, variety of approaches/methodsMore effort, variety of approaches/methods
used in estimating = better estimates. Use rangesUse ranges for estimates and gradually refine
(tighten) them as the project progresses. Measure progress and compareMeasure progress and compare to your
historical data Refine… Refine… RefineRefine… Refine… Refine!!!