Embed Size (px)
Citation preview

Cafiso, S., García, A., Cavarra, R. Romero, M.A., 1
1
Crosswalk Safety evaluation using a Pedestrian Risk Index as Traffic Conflict Measure
Salvatore Cafiso Professor, Dpt. of Civil & Environmental Eng., University of Catania, Viale A.Doria, Catania.
Italy. e-mail: [email protected] Alfredo García García
Professor, Dpt. of Transportation, Universitat Politècnica de València, Camino de Vera Valencia. Spain. e-mail: [email protected]
Rosario Cavarra PhD Candidate, Dpt. Civil & Environmental Eng., University of Catania, Viale A.Doria,
Catania. Italy e-mail: [email protected] Mario Alfonso Romero Rojas
PhD, Dpt Center for Road Safety, School of Civil Engineering, Purdue University, Win Hentschel Blvd, West Lafayette, U.S.A. e-mail: [email protected]
Submitted to the 3rd International Conference on Road Safety and Simulation, September 14-16, 2011, Indianapolis, USA
ABSTRACT
More than 14% of the approximately 25,000 people killed each year in traffic accidents in Europe are pedestrians. This high proportion of pedestrian fatalities led transportation researchers to make the improvement of pedestrian safety a priority. Few performance models based on crash data for pedestrian crashes exist. This is due to the spread distribution of the data that make difficult identifying statistical correlations. Traditional reactive strategies based on crash history analysis depend greatly on the quality and availability of the crash data. Consequently surrogate safety measures were developed as an efficient preventive approach. The Traffic Conflict Technique (TCT) was developed as “surrogate measure of road safety” by using near-accident indicators based on the measurement of the spatial and temporal proximity of road users. In this paper, a new conflict indicator, named Pedestrian Risk Index (PRI), is proposed, linking both the probability of collision between vehicle and pedestrian and the severity of the consequences. A before-after evaluation was carried out as a case study in Spain using PRI as a surrogate measure of safety in order to evaluate the safety performance of new traffic calming devices that replace zebra marked crosswalks. This paper shows that PRI is an effective measure of modifications in drivers’ behavior due to the installation of different safety countermeasures at a crosswalk. The PRI shows a reduction in severity of conflicts with an expected propensity to improve pedestrian safety. Keywords: safety, pedestrian, crosswalk, traffic conflict
Cafiso, S., García, A., Cavarra, R. Romero, M.A., 2
2
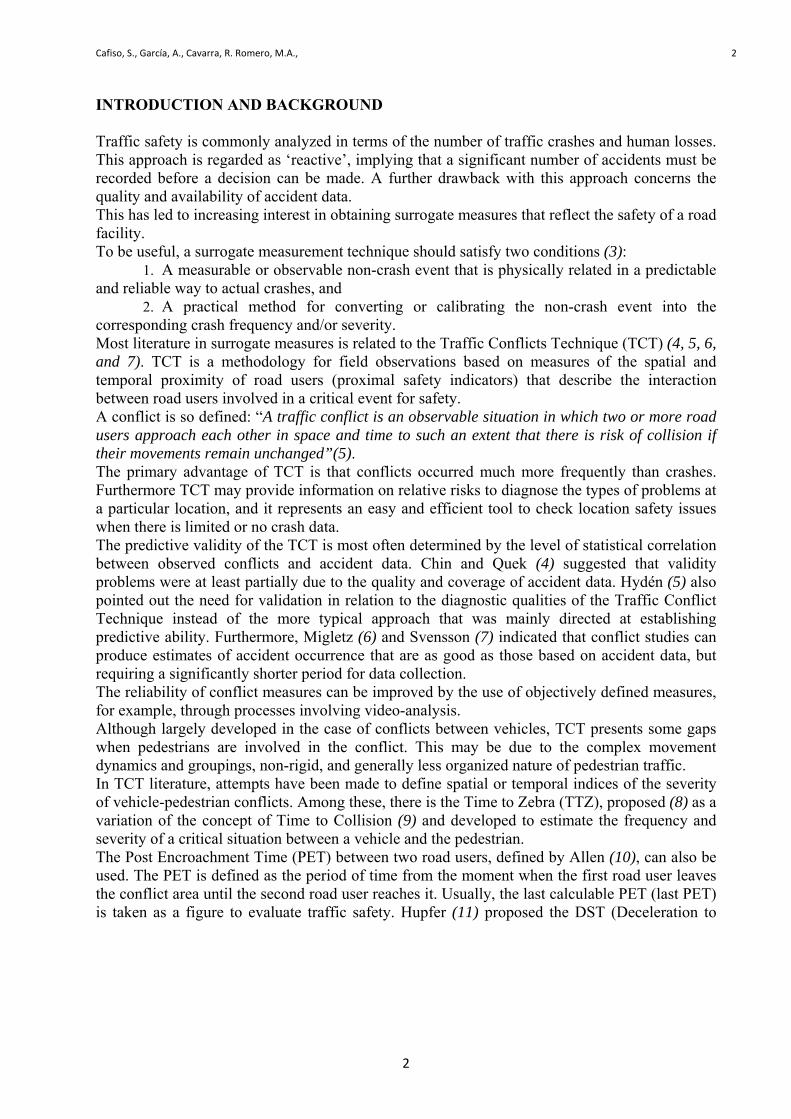
INTRODUCTION AND BACKGROUND Traffic safety is commonly analyzed in terms of the number of traffic crashes and human losses. This approach is regarded as ‘reactive’, implying that a significant number of accidents must be recorded before a decision can be made. A further drawback with this approach concerns the quality and availability of accident data. This has led to increasing interest in obtaining surrogate measures that reflect the safety of a road facility. To be useful, a surrogate measurement technique should satisfy two conditions (3):
1. A measurable or observable non-crash event that is physically related in a predictable and reliable way to actual crashes, and
2. A practical method for converting or calibrating the non-crash event into the corresponding crash frequency and/or severity. Most literature in surrogate measures is related to the Traffic Conflicts Technique (TCT) (4, 5, 6, and 7). TCT is a methodology for field observations based on measures of the spatial and temporal proximity of road users (proximal safety indicators) that describe the interaction between road users involved in a critical event for safety. A conflict is so defined: “A traffic conflict is an observable situation in which two or more road users approach each other in space and time to such an extent that there is risk of collision if their movements remain unchanged”(5). The primary advantage of TCT is that conflicts occurred much more frequently than crashes. Furthermore TCT may provide information on relative risks to diagnose the types of problems at a particular location, and it represents an easy and efficient tool to check location safety issues when there is limited or no crash data. The predictive validity of the TCT is most often determined by the level of statistical correlation between observed conflicts and accident data. Chin and Quek (4) suggested that validity problems were at least partially due to the quality and coverage of accident data. Hydén (5) also pointed out the need for validation in relation to the diagnostic qualities of the Traffic Conflict Technique instead of the more typical approach that was mainly directed at establishing predictive ability. Furthermore, Migletz (6) and Svensson (7) indicated that conflict studies can produce estimates of accident occurrence that are as good as those based on accident data, but requiring a significantly shorter period for data collection. The reliability of conflict measures can be improved by the use of objectively defined measures, for example, through processes involving video-analysis. Although largely developed in the case of conflicts between vehicles, TCT presents some gaps when pedestrians are involved in the conflict. This may be due to the complex movement dynamics and groupings, non-rigid, and generally less organized nature of pedestrian traffic. In TCT literature, attempts have been made to define spatial or temporal indices of the severity of vehicle-pedestrian conflicts. Among these, there is the Time to Zebra (TTZ), proposed (8) as a variation of the concept of Time to Collision (9) and developed to estimate the frequency and severity of a critical situation between a vehicle and the pedestrian. The Post Encroachment Time (PET) between two road users, defined by Allen (10), can also be used. The PET is defined as the period of time from the moment when the first road user leaves the conflict area until the second road user reaches it. Usually, the last calculable PET (last PET) is taken as a figure to evaluate traffic safety. Hupfer (11) proposed the DST (Deceleration to
Cafiso, S., García, A., Cavarra, R. Romero, M.A., 3
3
Safety Time), that is the necessary deceleration so that second road user reaches the conflict area not earlier than the first road user leaves it (i.e. when last PET =0, there is DST0). In this context, the Pedestrian Risk Index (PRI) was proposed as a new conflict indicator. It is a TCT measure for pedestrians and is appropriate for different traffic situations. Although, the mechanical formulas used to define PRI are well known and the analytic approach to characterizing the kinematics of vehicle/pedestrian conflict appears to be treated by other authors (12, 13, 14, 15, 16, and 17), in this paper it is shown how to compute an index derived by the actual driver behavior basing on the TCT approach. Therefore, the main difference from the studies reported in literature is that PRI is carried out using actual driving behavior observed at the zebra crossing during the entire development of the traffic conflict phase defined by the authors.
PEDESTRIAN RISK INDEX (PRI)
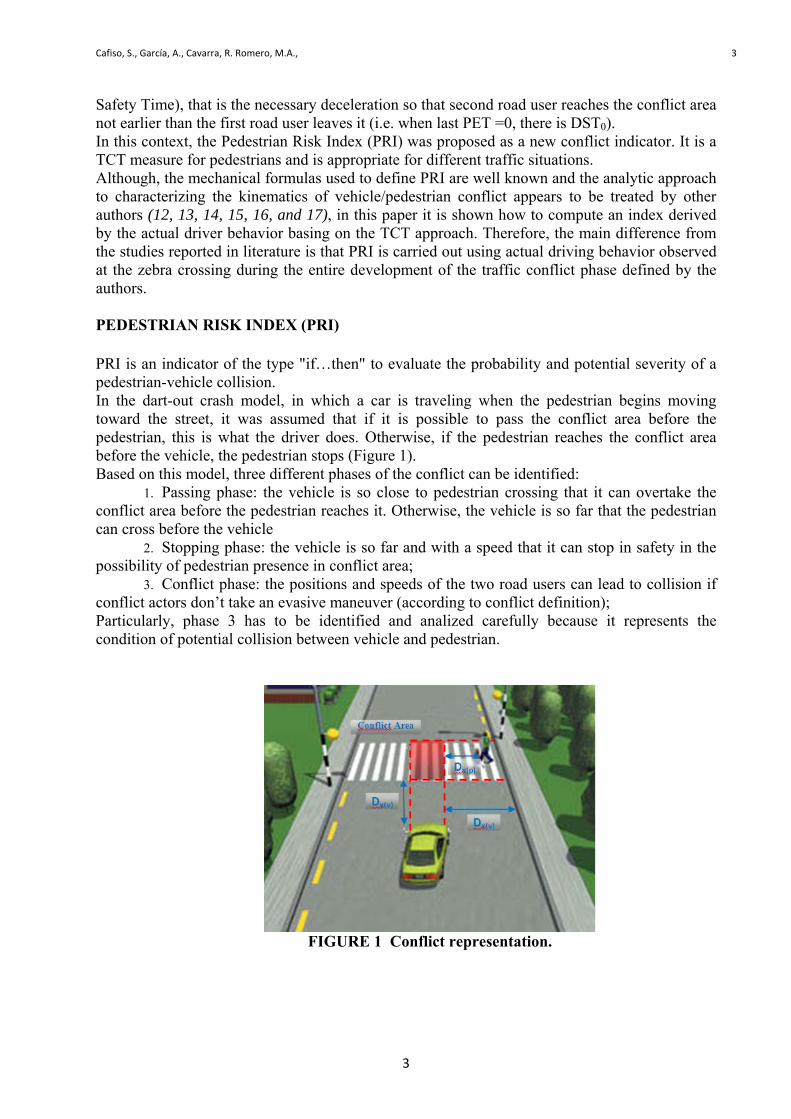
PRI is an indicator of the type "if…then" to evaluate the probability and potential severity of a pedestrian-vehicle collision. In the dart-out crash model, in which a car is traveling when the pedestrian begins moving toward the street, it was assumed that if it is possible to pass the conflict area before the pedestrian, this is what the driver does. Otherwise, if the pedestrian reaches the conflict area before the vehicle, the pedestrian stops (Figure 1). Based on this model, three different phases of the conflict can be identified:
1. Passing phase: the vehicle is so close to pedestrian crossing that it can overtake the conflict area before the pedestrian reaches it. Otherwise, the vehicle is so far that the pedestrian can cross before the vehicle
2. Stopping phase: the vehicle is so far and with a speed that it can stop in safety in the possibility of pedestrian presence in conflict area;
3. Conflict phase: the positions and speeds of the two road users can lead to collision if conflict actors don’t take an evasive maneuver (according to conflict definition); Particularly, phase 3 has to be identified and analized carefully because it represents the condition of potential collision between vehicle and pedestrian.
FIGURE 1 Conflict representation.

Cafiso, S., García, A., Cavarra, R. Romero, M.A., 4
4
For each instant of the conflict (FIGURE 1), three variables of time can be defined:
- Time to Collision of the vehicle, obtained from following equation:
)(
)(
vi
vyii V
DTTC (1)
where: TTCi(v) [sec] : vehicle time to reach the pedestrian crossing at instant i. Dyi (v) [m] :longitudinal distance between the vehicle and the crossing at the instant i. Vi(v) [m/sec] : vehicle speed at the instant i.
- Time to Collision of pedestrian is carried out in order to establish if a pedestrian can arrive at the conflict area in time to collide with vehicle.
(2)
where: TTCi(p) [sec] :pedestrian time to reach conflict area, at instant i. Dxi (v) [m] : lateral vehicle distance at instant i. Dxi (p) [m] : pedestrian position on crossing at instant i. Vp [m/sec] : pedestrian speed.
- Vehicle time to stopping (Ts), carried out using the following equation: (3)
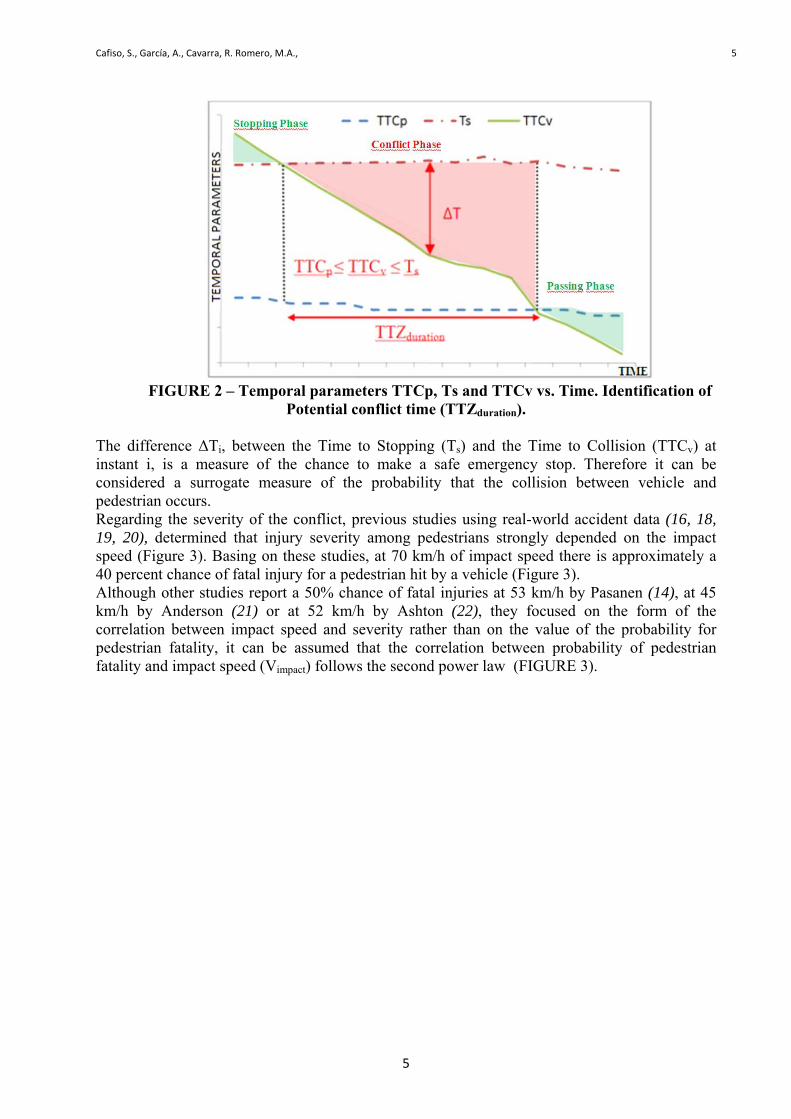
where: Tsi [sec] : stopping time instant i. Tr [sec] : reaction time of the driver. Vi(v) [m/sec] : vehicle speed at instant i. ab [m/sec2] : braking deceleration (absolute value). These time variables are utilized to define conflict: - when TTCv>Ts, the vehicle can safely stop before the conflict area (stopping phase); - when TTCv<TTCp, the pedestrian reaches the conflict area only after the vehicle has passed (passing phase). - when TTCv<Ts, the vehicle can’t stop before to reach the conflict area; - when TTCv>TTCp, the pedestrian is exposed to conflict with vehicle TTZduration (Time To Zebra duration) is defined the conflict time (conflict phase) in the interval:
TTCp<TTCV<Ts (FIGURE 2).
p
pxivxipi V
DDTTC )()(
b
virsi a
VTT )(
Cafiso, S., García, A., Cavarra, R. Romero, M.A., 5
5
FIGURE 2 – Temporal parameters TTCp, Ts and TTCv vs. Time. Identification of
Potential conflict time (TTZduration).
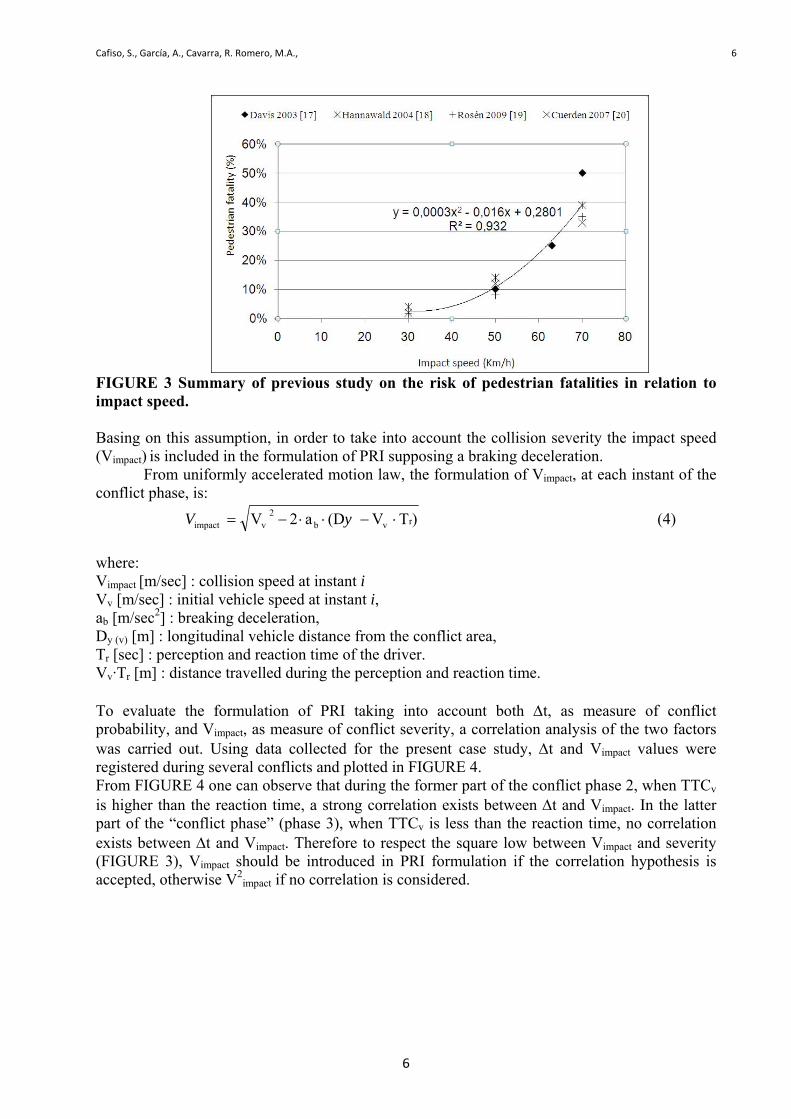
The difference ΔTi, between the Time to Stopping (Ts) and the Time to Collision (TTCv) at instant i, is a measure of the chance to make a safe emergency stop. Therefore it can be considered a surrogate measure of the probability that the collision between vehicle and pedestrian occurs. Regarding the severity of the conflict, previous studies using real-world accident data (16, 18, 19, 20), determined that injury severity among pedestrians strongly depended on the impact speed (Figure 3). Basing on these studies, at 70 km/h of impact speed there is approximately a 40 percent chance of fatal injury for a pedestrian hit by a vehicle (Figure 3). Although other studies report a 50% chance of fatal injuries at 53 km/h by Pasanen (14), at 45 km/h by Anderson (21) or at 52 km/h by Ashton (22), they focused on the form of the correlation between impact speed and severity rather than on the value of the probability for pedestrian fatality, it can be assumed that the correlation between probability of pedestrian fatality and impact speed (Vimpact) follows the second power law (FIGURE 3).
Cafiso, S., García, A., Cavarra, R. Romero, M.A., 6
6
FIGURE 3 Summary of previous study on the risk of pedestrian fatalities in relation to impact speed. Basing on this assumption, in order to take into account the collision severity the impact speed (Vimpact) is included in the formulation of PRI supposing a braking deceleration.
From uniformly accelerated motion law, the formulation of Vimpact, at each instant of the conflict phase, is:
)TV(Da2V r vb2
vimpact yV (4)
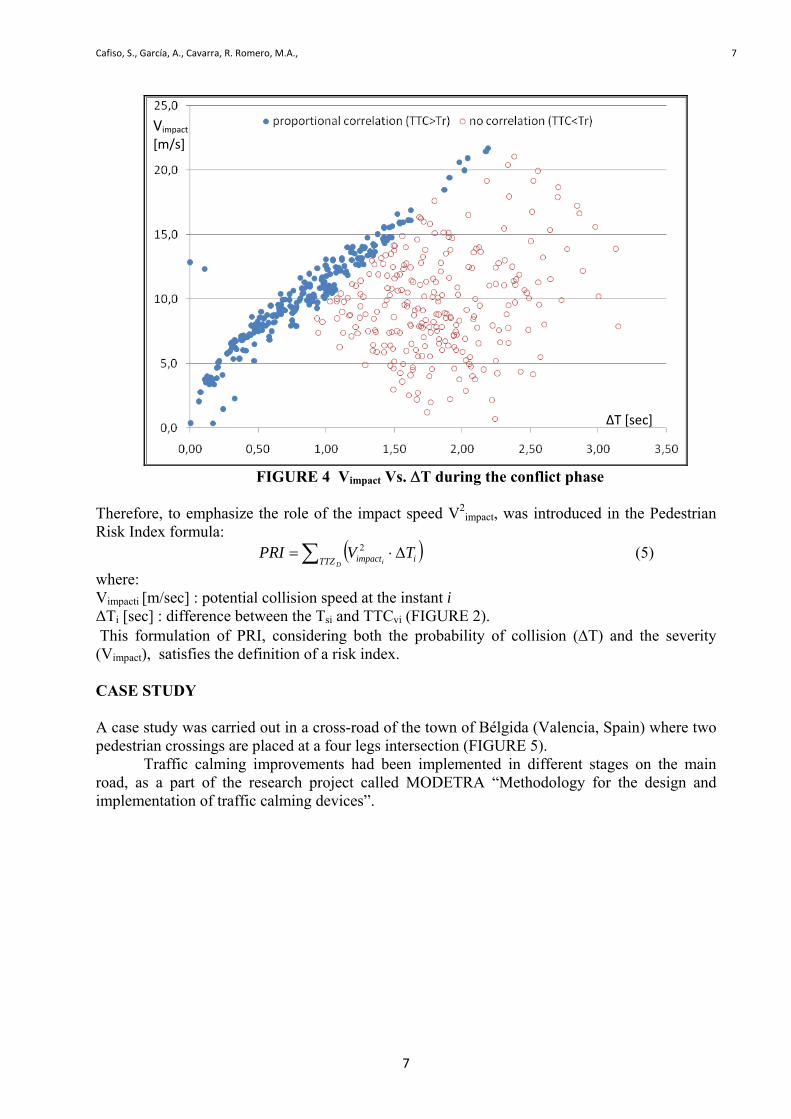
where: Vimpact [m/sec] : collision speed at instant i Vv [m/sec] : initial vehicle speed at instant i, ab [m/sec2] : breaking deceleration, Dy (v) [m] : longitudinal vehicle distance from the conflict area, Tr [sec] : perception and reaction time of the driver. Vv·Tr [m] : distance travelled during the perception and reaction time. To evaluate the formulation of PRI taking into account both t, as measure of conflict probability, and Vimpact, as measure of conflict severity, a correlation analysis of the two factors was carried out. Using data collected for the present case study, t and Vimpact values were registered during several conflicts and plotted in FIGURE 4. From FIGURE 4 one can observe that during the former part of the conflict phase 2, when TTCv is higher than the reaction time, a strong correlation exists between t and Vimpact. In the latter part of the “conflict phase” (phase 3), when TTCv is less than the reaction time, no correlation exists between t and Vimpact. Therefore to respect the square low between Vimpact and severity (FIGURE 3), Vimpact should be introduced in PRI formulation if the correlation hypothesis is accepted, otherwise V2
impact if no correlation is considered.
Cafiso, S., García, A., Cavarra, R. Romero, M.A., 7
7
FIGURE 4 Vimpact Vs. T during the conflict phase
Therefore, to emphasize the role of the impact speed V2
impact, was introduced in the Pedestrian Risk Index formula:
D iTTZ iimpact TVPRI 2 (5)
where: Vimpacti [m/sec] : potential collision speed at the instant i ΔTi [sec] : difference between the Tsi and TTCvi (FIGURE 2). This formulation of PRI, considering both the probability of collision (T) and the severity (Vimpact), satisfies the definition of a risk index.
CASE STUDY A case study was carried out in a cross-road of the town of Bélgida (Valencia, Spain) where two pedestrian crossings are placed at a four legs intersection (FIGURE 5).
Traffic calming improvements had been implemented in different stages on the main road, as a part of the research project called MODETRA “Methodology for the design and implementation of traffic calming devices”.
Vimpact
[m/s]
ΔT [sec]

Cafiso, S., García, A., Cavarra, R. Romero, M.A., 8
8
FIGURE 5 Site on study.
This “progressive” before-after study was developed during four phases of the
intervention, starting from the original situation (0-configuration) and progressing to the more complete configurations with speed humps and raised crosswalks (speed tables).
Scenarios
First scenario (North 1 & South 1) The initial configuration included two zebra crossings in a bad maintenance condition with poorly visible marking. Video recording was taken on April 3th 2009 between 9:00 and 13:00, in order to avoid traffic flow congestion (FIGURE 6).
FIGURE 6 Southern (A) and Northern (B) Crosswalk in the first scenario.
A B
Cafiso, S., García, A., Cavarra, R. Romero, M.A., 9
9
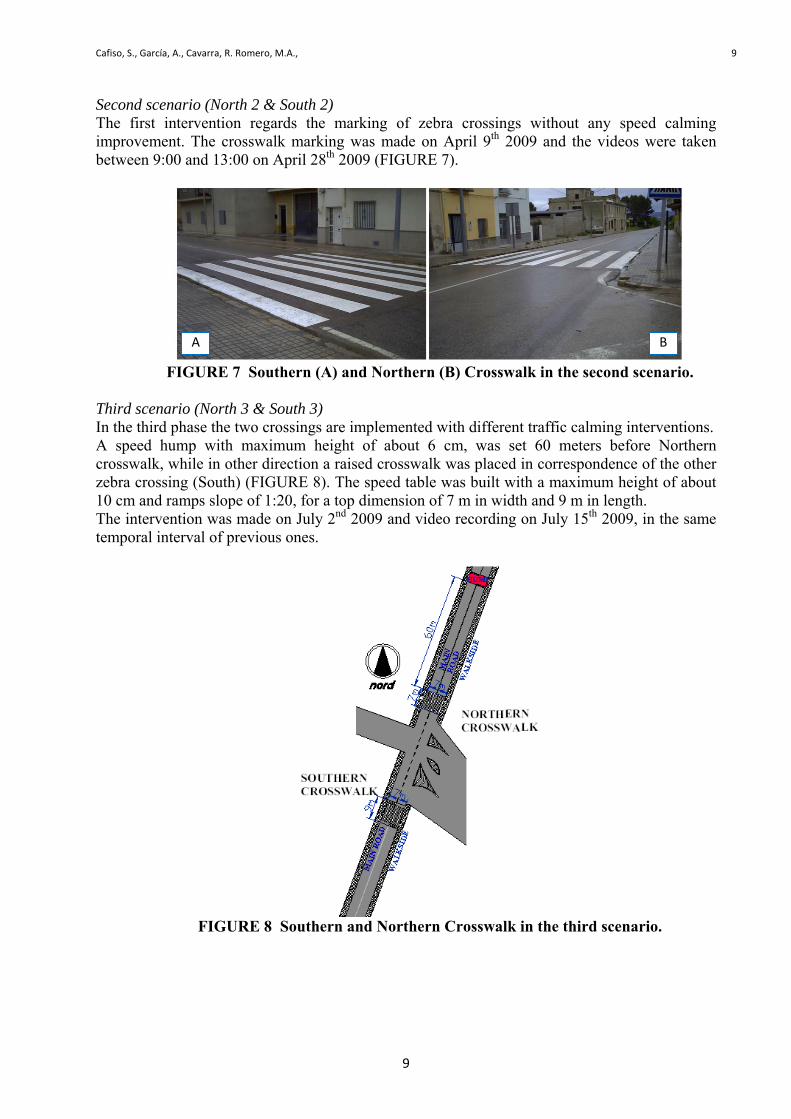
Second scenario (North 2 & South 2) The first intervention regards the marking of zebra crossings without any speed calming improvement. The crosswalk marking was made on April 9th 2009 and the videos were taken between 9:00 and 13:00 on April 28th 2009 (FIGURE 7).
FIGURE 7 Southern (A) and Northern (B) Crosswalk in the second scenario.
Third scenario (North 3 & South 3) In the third phase the two crossings are implemented with different traffic calming interventions. A speed hump with maximum height of about 6 cm, was set 60 meters before Northern crosswalk, while in other direction a raised crosswalk was placed in correspondence of the other zebra crossing (South) (FIGURE 8). The speed table was built with a maximum height of about 10 cm and ramps slope of 1:20, for a top dimension of 7 m in width and 9 m in length. The intervention was made on July 2nd 2009 and video recording on July 15th 2009, in the same temporal interval of previous ones.
FIGURE 8 Southern and Northern Crosswalk in the third scenario.
A B
Cafiso, S., García, A., Cavarra, R. Romero, M.A., 10
10
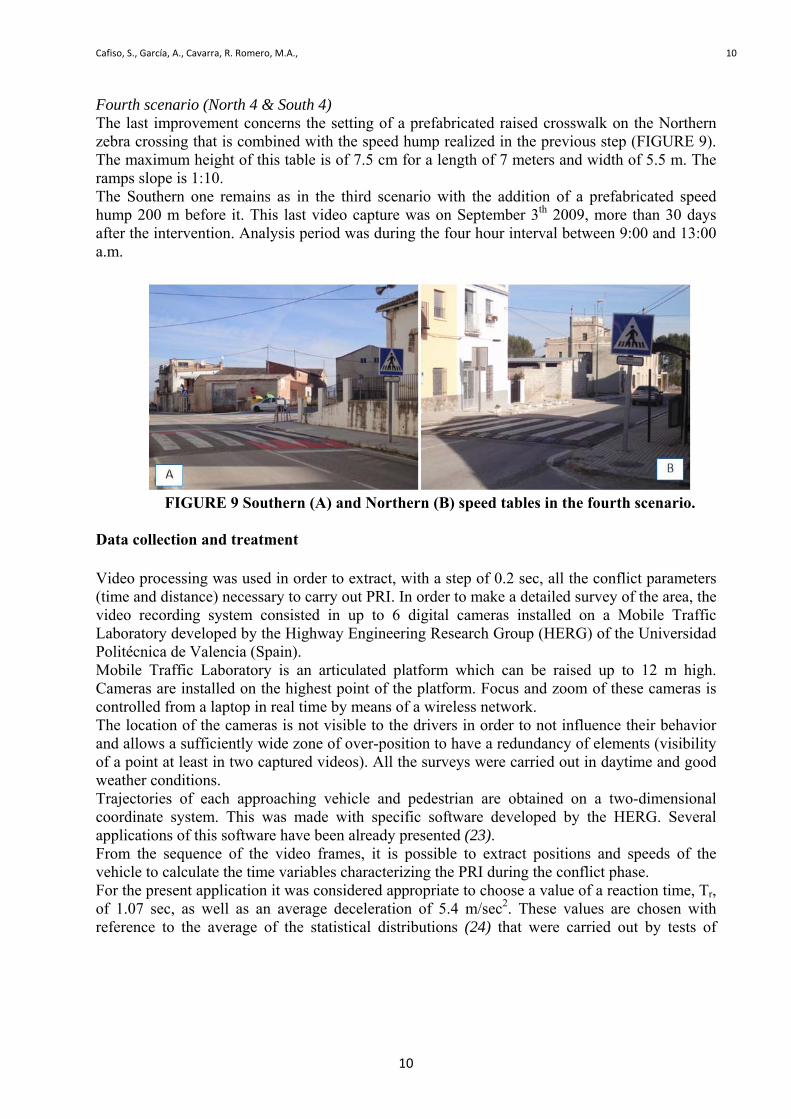
Fourth scenario (North 4 & South 4) The last improvement concerns the setting of a prefabricated raised crosswalk on the Northern zebra crossing that is combined with the speed hump realized in the previous step (FIGURE 9). The maximum height of this table is of 7.5 cm for a length of 7 meters and width of 5.5 m. The ramps slope is 1:10. The Southern one remains as in the third scenario with the addition of a prefabricated speed hump 200 m before it. This last video capture was on September 3th 2009, more than 30 days after the intervention. Analysis period was during the four hour interval between 9:00 and 13:00 a.m.
FIGURE 9 Southern (A) and Northern (B) speed tables in the fourth scenario.
Data collection and treatment
Video processing was used in order to extract, with a step of 0.2 sec, all the conflict parameters (time and distance) necessary to carry out PRI. In order to make a detailed survey of the area, the video recording system consisted in up to 6 digital cameras installed on a Mobile Traffic Laboratory developed by the Highway Engineering Research Group (HERG) of the Universidad Politécnica de Valencia (Spain). Mobile Traffic Laboratory is an articulated platform which can be raised up to 12 m high. Cameras are installed on the highest point of the platform. Focus and zoom of these cameras is controlled from a laptop in real time by means of a wireless network. The location of the cameras is not visible to the drivers in order to not influence their behavior and allows a sufficiently wide zone of over-position to have a redundancy of elements (visibility of a point at least in two captured videos). All the surveys were carried out in daytime and good weather conditions. Trajectories of each approaching vehicle and pedestrian are obtained on a two-dimensional coordinate system. This was made with specific software developed by the HERG. Several applications of this software have been already presented (23). From the sequence of the video frames, it is possible to extract positions and speeds of the vehicle to calculate the time variables characterizing the PRI during the conflict phase. For the present application it was considered appropriate to choose a value of a reaction time, Tr, of 1.07 sec, as well as an average deceleration of 5.4 m/sec2. These values are chosen with reference to the average of the statistical distributions (24) that were carried out by tests of
Cafiso, S., García, A., Cavarra, R. Romero, M.A., 11
11
emergency stop to avoid an obstacle appearing suddenly in the roadway. Moreover, this study adopts a pedestrian crosswalk walking speed value of 1.2 m/s (25). These values can be easily modified if different conditions are evaluated or to carry out a sensitivity analysis. To uniform the PRI estimate, the only considered vehicles are passenger car and LGV (Light Goods Vehicle). The powered two wheels (PTW)users are excluded from analysis, because of their aggressive behavior, in approaching pedestrian crossing (2). The extracted data concern the situation of a free flow condition for vehicles (isolated vehicle) with and without the presence of a visible pedestrian on sidewalk, just waiting to walk on pedestrian crossing.
ANALYSIS OF RESULTS
For the different crosswalk scenarios, the traffic conflicts were detected and the corresponding Pedestrian Risk Indices were carried out in order to evaluate the effectiveness of the safety improvements and the sensitivity of the new proposed indicator to identify change in driver behavior due to modifications on site configuration. TABLES 1 and 2 show the mean () and standard deviation () of PRI statistics for the different scenarios. TABLE 1 Means and Standard Deviations of PRI in the Four Configurations in Northern Crosswalk
Scenario 1 [North_1]
Scenario 2 [North_2]
Scenario 3 [North_3]
Scenario 4 [North_4]
Sample PRI Sample PRI Sample PRI Sample PRI μ 1992,9 1623,7 407,0 161,2North->South
without Pedestrian σ 60 1907,7 32 1293,3 40 298,7 38 210,2μ 2908,9 1506,2 351,2 121,2North->South with
Pedestrian σ 38 2567,4 37 1216,0 35 181,4 37 97,4 TABLE 2 Means and Standard Deviations of PRI in the Four Configurations in Southern Crosswalk
Scenario 1 [South_1]
Scenario 2 [South_2]
Scenario 3 [South_3]
Scenario 4 [South_4]
Sample PRI Sample PRI Sample PRI Sample PRI μ 997,0 1275,9 332,9 261,5South->North
without Pedestrian σ 60 1303,5 55 991,6 30 413,0 32 142,1μ 733,1 854,4 101,3 175,1South->North with
Pedestrian σ 47 593,2 35 607,1 30 126,3 34 136,0 In order to verify the statistical significance of the differences between the averages values of PRI obtained in the different scenarios of pedestrian crossing, a Student t-test was conducted. Considering a level of confidence of 95%, if the P-value is less than 0.05, we can reject the null hypothesis (the case of equal mean) in favor of the alternative and, therefore we can consider the difference in the mean value of PRI as statistically significant (gray cells in TABLES 3 and 4). Also the F-test was carried out to accept the hypothesis of equal variance between analyzed

Cafiso, S., García, A., Cavarra, R. Romero, M.A., 12
12
samples (TABLE 3 and TABLE 4). Based on F-test results the t-student for equal or different variance was carried out. TABLE 3 F-test and Student T-test for Means Difference in the Four Configurations in Northern Crosswalk
NO PEDESTRIAN WITH PEDESTRIAN F-Test T-Student F-Test T-Student
scenario ΔPRI F-ratio P-
value T-
value P-
value ΔPRI F-ratio P-
value T-
value P-
valueNorth_1 vs
North_2 369,25 1,976 0,042 0,970 0,335 1402,76 4,157 0,000 3,031 0,004North_1 vs
North_3 1585,96 40,779 0.000 6,324 0,000 2557,71 200,265 0.000 6,125 0,000North_1 vs
North_4 1831,72 82,404 0.000 7,367 0,000 2787,76 695,416 0.000 6,689 0,000North_2 vs
North_3 1216,72 20,640 0.000 5,122 0,000 1154,95 48,176 0.000 5,486 0,000North_2 vs
North_4 1462,47 41,708 0.000 6,182 0,000 1385,00 167,290 0.000 6,638 0,000North_3 vs
North_4 245,75 2,021 0,034 4,219 0,000 230,05 3,472 0,000 6,651 0,000 TABLE 4 F-test and T-Student for Means Difference in the Four Configurations in Southern Crosswalk
NO PEDESTRIAN WITH PEDESTRIAN F-Test T-Student F-Test T-Student
Scenario ΔPRI F-ratio P-
value T-
value P-
value ΔPRI F-ratio P-
value T-
value P-
valueSouth_1 vs
South_2 -278,92 1,728 0,043 -1,298 0,197 -
121,30 0,955 0,873 -0,907 0,367South_1 vs
South_3 664,10 9,959 0,000 3,601 0,001 631,74 22,059 0,000 7,055 0,000South_1 vs
South_4 735,51 84,087 0.000 4,326 0,000 557,98 19,025 0.000 6,213 0,000South_2 vs
South_3 943,02 5,764 0,000 6,143 0,000 753,04 23,108 0,000 7,160 0,000South_2 vs
South_4 1014,43 48,667 0,000 7,464 0,000 679,28 19,929 0,000 6,445 0,000South_3 vs
South_4 71,41 8,443 0,000 0,901 0,374 -73,76 0,862 0,691 2,209 0,031
Based on the obtained results and experimental scenarios, the following considerations about the effectiveness of the improvements can be highlighted:
- The repainting of the Zebra did not show a significant reduction of PRI values.
Cafiso, S., García, A., Cavarra, R. Romero, M.A., 13
13
- The use of traffic calming such as speed humps and speed tables reveals a considerable improvement in road safety conditions as demonstrate by lowest PRI values. Specifically, the configurations with tables present best effects in calming the behavior of road users compared with the presence of humps set before the pedestrian crossings.
- The sequence of a hump and a table doesn’t imply remarkable benefits in front of solutions with only one facility or device. In Tables 3 and 4: scenarios with different mean at 95% level of significance are highlighted in grey cells Moreover, the vehicle driver doesn’t seem to perceive the presence of a pedestrian waiting to cross on sidewalk as a limitation of his own maneuvering space. This outcome derives from T-student tests carried out in separate analysis, not reported in the present paper, showing no statistically significant differences in PRIs between “with pedestrian” and “no pedestrian” cases. CONCLUSIONS Traditionally road accident statistics are used to assess the level of road safety and to evaluate road safety programs. In some cases, the lack of good and reliable accident records can prevent proper analysis. An alternative approach that overcomes this problem is the use of safety surrogates measures, like Traffic Conflict which rely on observations of critical traffic situations. An important advantage of TCT with respect to crash analysis is having a much larger sample on a much shorter period of observation. Even though a statistical correlation between TCT indices and number of crashes is complex to define, the TCT is able to identify and evaluate operational deficiencies and improvements. A new TCT index was proposed to analyze conflicts between vehicles and pedestrians. PRI is defined to evaluate the potential severity of a pedestrian-vehicle conflict, relating it both to severity and dangerousness of the traffic situation. The application of the Pedestrian Risk Index method showed that this indicator is effective to highlight modifications in driver behavior due to safety improvements at a crosswalk. Specifically in the case of the use of traffic calming devices such as speed humps and speed tables, the case study reveals a considerable improvement in road safety conditions. The configurations with speed tables present the best effects in calming the behavior of road users compared with the presence of humps set before the pedestrian crossings. The sequence of a speed hump and a speed table doesn’t result in remarkable benefits compared to solutions with only one device. Use of modern technology such as automated video-analysis techniques is shown to simplify, make faster and more accurate the Traffic Conflict analysis. Even if a correlation between PRI and crash occurrence and severity is not available at this time, the analysis carried out in the present research, using a comparison among different scenarios, showed that PRI sensitivity to modification in driver behavior can lead to change in the probability and severity of a collision between a pedestrian crossing the road and an approaching vehicle. Therefore, PRI can be considered a “specific” risk factor. In order to compare different sites, an exposure factor must also be used to take into account the vehicle (AADTv) and pedestrian traffic flow (AADTped) at the crossing. Authors understand that the not proved correlation between PRI and the probability of collisions is a criticism of the paper. At pedestrian crossings usually zero or one pedestrian crashes occur
Cafiso, S., García, A., Cavarra, R. Romero, M.A., 14
14
during the observation period, making it difficult to use crash counts as a comparison factor. Also the availability of good exposure measures, especially for pedestrian flow, is a recurrent problem. At this phase of our study the results confirm the sensitivity of the model to changes in the crossing configuration. The collection of crash data is still in progress and a study of correlation between PRI and crashes will be analyzed in the near future.
ACKNOWLEDGEMENTS Authors would like to thank Center for Studies and Experimentation of Public Works (CEDEX) of the Spanish Ministry of Public Works that subsidizes the research project PT-2007-052-23/APM. Also thanks to: the Infrastructure and Transportation Department, General Directorate of Public Works, Valencian Government, Spain, for their collaboration in adjusting the road works for the study; the Ministry of the Interior, General Directorate of Traffic, Spain, for their cooperation in field data gathering; the company 3M for supplying the prefabricated pedestrian crossing.
REFERENCES 1. ERSO, European Road Safety Observatory. Annual Statistical Report 2008, 2008. 2. Cafiso, S., A. Montella, F. Mauriello, G. Pappalardo and R. Cavarra. Valutazione dei fattori
di rischio degli attraversamenti pedonali mediante analisi di sicurezza e analisi dei conflitti. Presented at 17th SIIV Meeting Enna, IT, September, 2008.
3. Tarko, A., G.Davis, and S. Washington. Surrogate measures of safety-White paper. Presented at 88th Annual TRB Meeting Washington, D.C., USA, January, 2009.
4. Chin, H.C., and S.T. Quek. Measurement of Traffic Conflicts. Safety Science, Vol. 26, No. 3, 1997, pp. 169-187.
5. Hyden, C. The Development of Method for Traffic Safety Evaluation: The Swedish Traffic Conflict Technique. Bulletin 70. Lund Institute of Technology, Lund, Sweden, 1987.
6. Migletz, D.J., W.D. Glauz and K.M. Bauer. Relationships between Traffic Conflicts and Accidents. Report No: FHWA/RD-84/042. US Department of Transportation, Federal Highway Administration, 1985.
7. Svensson, A. Further Development and Validation of the Swedish Traffic Conflicts Techniques. Dept of Traffic Planning and Engineering, Lund University, Lund, Sweden, 1992.
8. Várhelyi, A. Dynamic Speed Adaptation Based on Information Technology – A Theoretical Background, Bulletin 142, Dept. of Traffic Planning and Engineering, Lund University, Lund, Sweden, 1996.
9. Hayward, J., Near miss determination through use of a scale of danger. Report No. TTSC 7715, Pennsylvania State University, Penn., USA, 1972.
10. Allen B.L., Shin B.T. and P.J. Cooper. Analysis of Traffic Conflict Collisions. In Transportation Research Record, No. 667, TRB, Washington, D.C., USA, 1978, pp. 67–74.
11. Hupfer, C. Deceleration to safety time (DST)- a useful figure to evaluate traffic safety. Presented at 10th ICTCT Conference. University of Lund, Lund, Sweden, 1997.

Cafiso, S., García, A., Cavarra, R. Romero, M.A., 15
15
12. Mayne, A. The Problem of the Careless Pedestrian, in Almond, J. (Ed.) Proceedings of the Second International Symposium on the Theory of Road Traffic Flow, OECD, Paris, 1965, pp. 279-285.
13. Howarth, C., Routledge, D., and Repetto-Wright, R. An Analysis of Road Accidents Involving Child Pedestrians, Ergonomics, 17, 1974 pp. 319-330.
14. Pasanen, E., and H. Salmivaara. Driving Speed and Pedestrian Safety in the City of Helsinki. Traffic Engineering and Control, Vol. 34, No. 6, 1993, pp. 308–310.
15. Vaughn, R. Avoiding the Emerging Pedestrian: A Mathematical Model. SAE Technical Paper 970962, SAE, Inc., Warrendale, PA, USA, 1997.
16. Davis, G. Relating Severity of Pedestrian Injury to Impact Speed in Vehicle- Pedestrian Crashes: Simple Threshold Model. In Transportation Research Record No 1773, TRB, Washington, D.C., USA, 2001, pp. 108-113.
17. Davis, G., Sanderson, K., and S. Davuluri. A Vehicle/Pedestrian Collision Model for Neighborhood Traffic Control. Presented at 82th Annual TRB Meeting Washington, D.C., January, 2003.
18. Hannawald, L. and F. Kauer. Equal Effectiveness Study on Pedestrian Protection. Presentation. Technische Universität, Dresden, Germany, 2004.
19. Rosén, E. and U. Sander. Pedestrian fatality risk as a function of car impact speed. Accident Analysis and Prevention, 2009.
20. Cuerden, R, D. Richards and J. Hill. Pedestrians and their survivability at different impact speeds. Presented at 20th International Technical Conference on the Enhanced Safety of Vehicles, Lyon, France, 2007.
21. Anderson, R.W.G., McLean, A.J., Farmer, M.J.B., Lee, B.H. and C.G. Brooks. Vehicle travel speeds and the incidence of fatal pedestrian crashes. Accident Analysis and Prevention 29, 1997, pp. 667–674.
22. Ashton, S.J. A preliminary assessment of the potential for pedestrian injury reduction through vehicle design. SAE Technical Paper 801315, 1980.
23. Romero, M. and A. García, Deceleration Lane Length Evaluation Based on a New Conflict Indicator, Presented at 4th International Symposium on Highway Geometric Design, Valencia, Spain, 2010.
24. Koppa, R., Fambro, D., and R. Zimmer. Measuring Driver Performance in Braking Maneuvers, In Transportation Research Record No 1550, Washington, D.C., 1996 pp.8-15.
25. TRB. Highway Capacity Manual, Fourth Edition, Chapter 18, Pedestrians. Transportation Research Board, Washington, D.C., USA, 2000.