Embed Size (px)
Citation preview

Crop Report
For further information, contact Daphne Cruise, PAg, Crops Extension Specialist, Regional Services Branch, Toll Free: 1-866-457-2377 or 306-694-
3587, cell 306-630-2390 E-mail: [email protected]. Also available on the Ministry of Agriculture website at www.saskatchewan.ca/crop-report.
Published by the Ministry of Agriculture ISSN 0701 7085
Report number 21, September 20, 2018 For the Period September 11 to 17, 2018
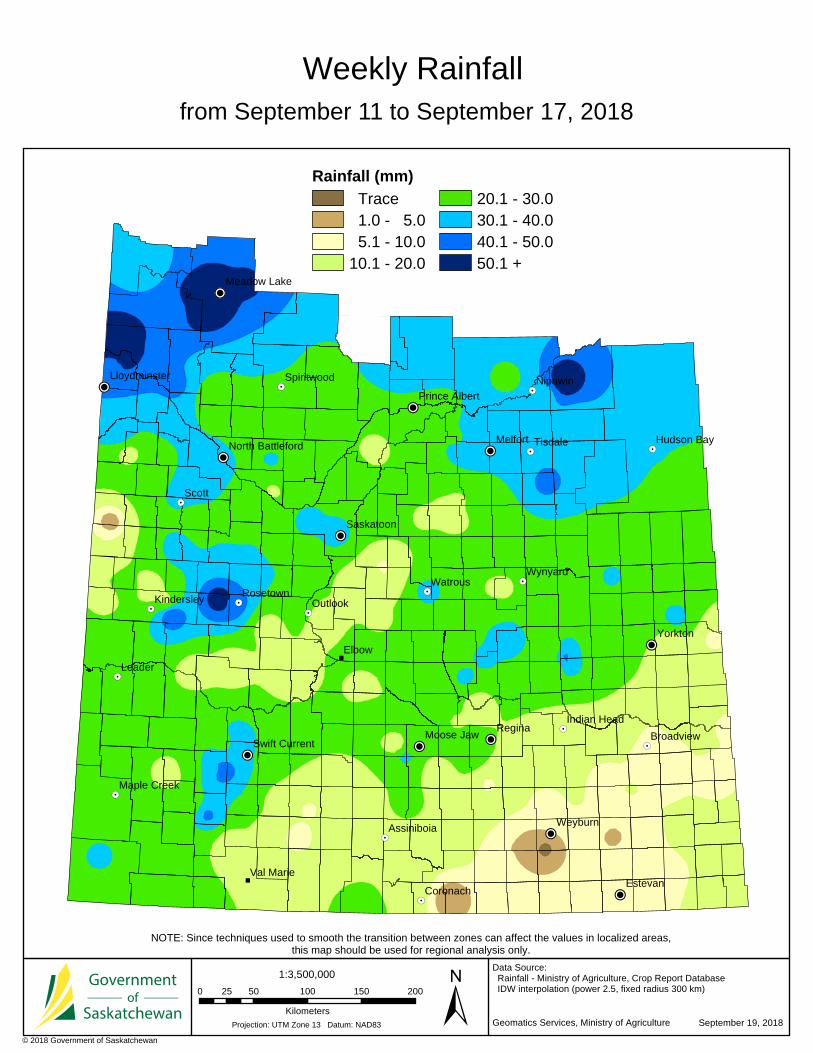
A wet and cool week stalled most harvest operations in the province. Sixty-two per cent of the crop is now in the bin, according to Saskatchewan Agriculture’s weekly Crop Report. The five-year (2013-2017) average is 53 per cent for this time of year. Twenty-six per cent of the crop is now swathed or ready to straight-cut. Rain fell over the majority of the province, with the largest amounts being reported in the central and northern regions. Many areas in these regions recorded more than 30 mm of rain. Snow was reported in the northwest region. Harvest is most advanced in the southwest region, where 86 per cent of the crop is now combined. The southeast region has 84 per cent combined, the west-central 57 per cent and the east-central region 55 per cent. The northeast region has 29 per cent combined while the
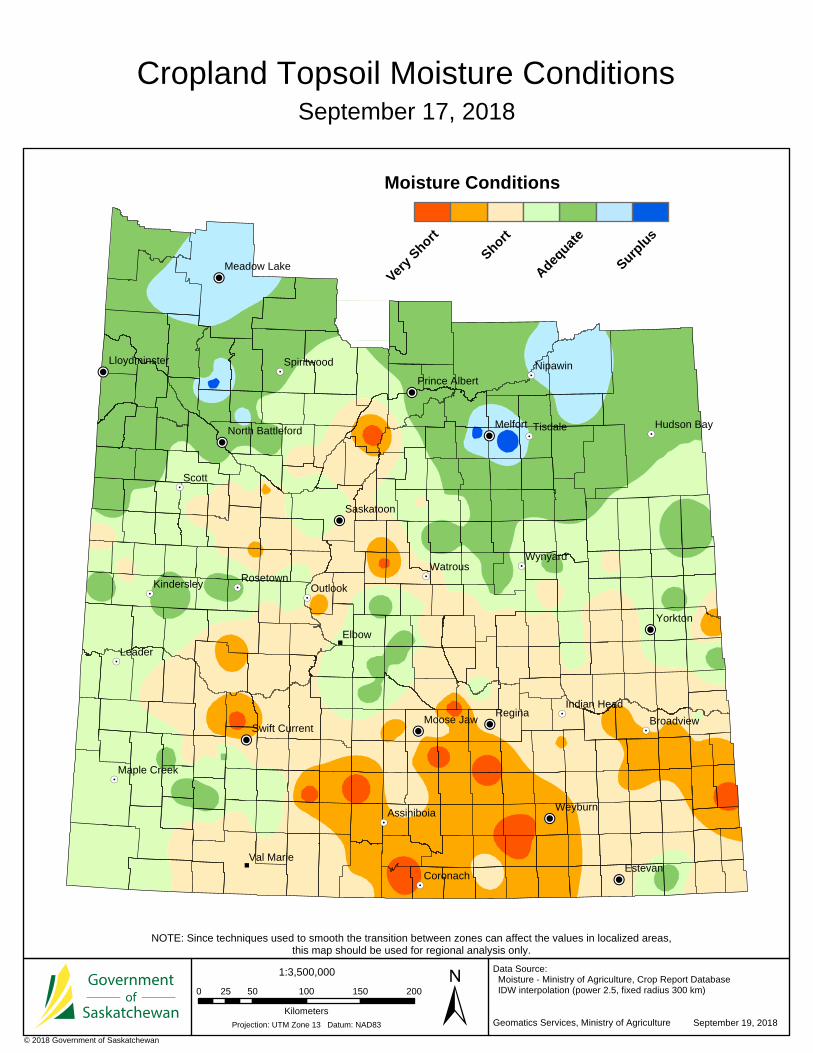
northwest region has 17 per cent combined. Ninety-six per cent of the lentils, 95 per cent of the field peas, 78 per cent of the durum, 50 per cent of spring wheat, 44 per cent of the canola and 25 per cent of the flax has now been combined. Across the province, topsoil moisture conditions have improved. Cropland topsoil moisture is rated as four per cent surplus, 40 per cent adequate, 37 per cent short and 19 per cent very short. Hay land and pasture topsoil moisture is rated as 31 per cent adequate, 38 per cent short and 31 per cent very short. Limited rainfall throughout many regions of the province has pasture conditions rated as 14 per cent in good condition, 23 per cent in fair condition, 36 per cent in poor condition and 27 per cent in very poor condition.
Saskatchewan Harvest September 17, 2018 Per cent combined
Winter wheat 99 Fall rye* 99
Spring wheat 50 Durum 78 Oats** 45 Barley 70
Canaryseed 27 Flax 25
Canola 44 Mustard 74
Soybeans 21 Lentils 96 Peas 95
Chickpeas 70 *includes 22 per cent ‘other’ **includes five per cent ‘other’
One year ago Rain showers delayed harvest for a few days.
Topsoil moisture was rated as 21 per cent adequate, 37
per cent short and 42 per cent very short.
Follow the 2018 Crop
Report on Twitter @SKAgriculture
Harvest Progress in SK
Per cent Combined All Crops
Sept 17/18 62 5 year avg. (2013-2017)
53
Sept 18/17 75 Sept 19/16 60 Sept 14/15 52 Sept 15/14 23 Sept 16/13 55
10 year avg. (2008-2017)
48
The majority of crop damage was due to lodging and rain causing quality loss. SaskPower says there were two reported cases of farm machinery contacting electrical equipment over the last week, bringing the total in September to eight. You can find out more about being safe around power lines by heading to SaskPower’s safety web pages.
Southeastern Saskatchewan:
Crop District 1 – Carnduff, Estevan, Redvers, Moosomin and Kipling areas Crop District 2 – Weyburn, Milestone, Moose Jaw, Regina and Qu’Appelle areas Crop District 3ASE – Radville, Minton and Lake Alma areas
Some areas in the region were able to get a few more days on the combines before rain showers rolled in again by the weekend. Eighty-four per cent of the crop is in the bin, up from 77 per cent last week. The five-year average (2013-2017) is 63 per cent combined. Overall, crop quality is good. There are large variations in yield over very short distances between fields, which is mainly due to variants in growing season rainfall. Many producers have finished harvest; however, there are still fields of flax, soybean and canola left to combine in some areas. The Carnduff area received 13 mm of rain, the Tantallon area 12 mm, the Grenfell area 17 mm, the Weyburn area 8 mm, the Moose Jaw area 27 mm, the Wilcox area 9 mm and the Radville area 6 mm. The Lampman area maintains the record (419 mm) for rain
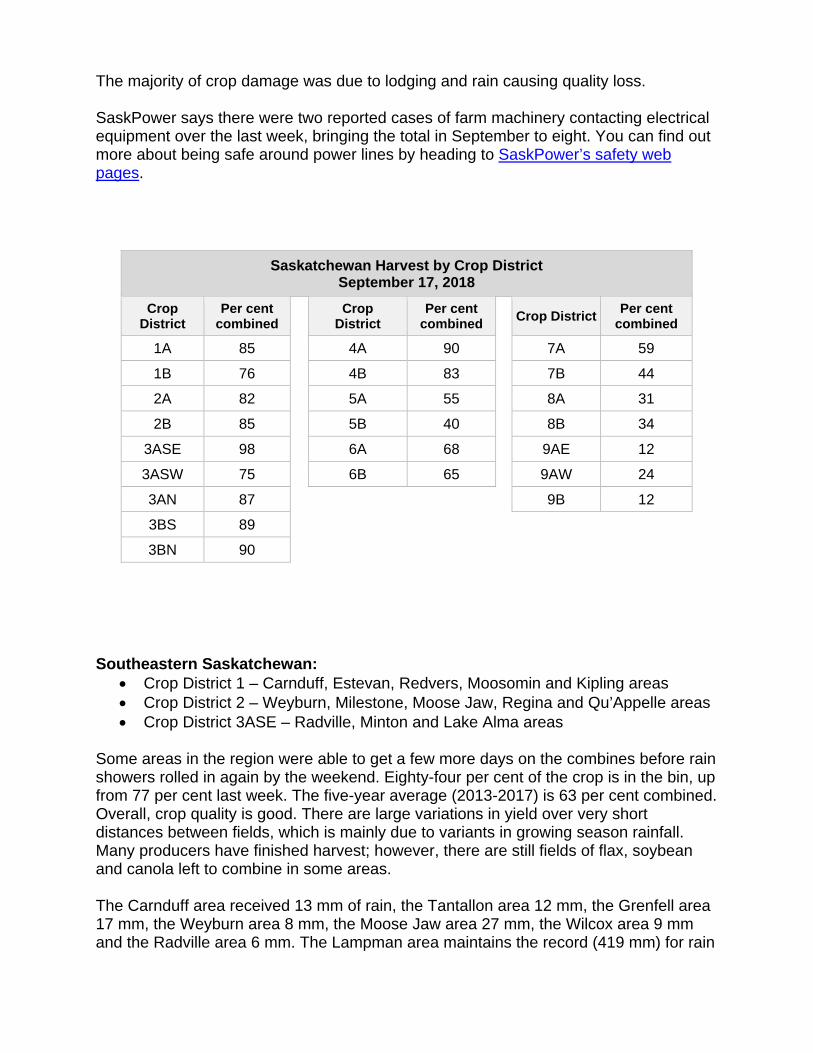
Saskatchewan Harvest by Crop District September 17, 2018
Crop District
Per cent combined
Crop District
Per cent combined
Crop District
Per cent combined
1A 85 4A 90 7A 59
1B 76 4B 83 7B 44
2A 82 5A 55 8A 31
2B 85 5B 40 8B 34
3ASE 98 6A 68 9AE 12
3ASW 75 6B 65 9AW 24
3AN 87 9B 12
3BS 89
3BN 90

in the region since April 1. The lack of rain in some parts of the region leaves many pastures and hay land in need of significant moisture. Cattle have been moved home or are being fed in pastures. There are reports of significantly more straw baled to help with feed shortages. Topsoil moisture on cropland is rated as 12 per cent adequate, 45 per cent short and 43 per cent very short. Hay land and pasture topsoil moisture is rated as five per cent adequate, 32 per cent short and 63 per cent very short. Crop District 2A is reporting that 70 per cent of cropland and 78 per cent of hay land and pasture remains very short of topsoil moisture at this time. Limited rain during the growing season has put some grazing pressure on pastures in the region. Fourteen per cent of the pastures in the region are in fair condition going in to the winter months, 40 per cent are rated as poor and 46 per cent are rated as very poor. The majority of crop damage this past week is due to lack of moisture. There are still concerns regarding the lack of feed and grass fire risk in many parts of the region. Winter cereal acres are expected to decrease due to dry field conditions. Producers are busy combining, moving cattle and baling straw. Southwestern Saskatchewan:
Crop District 3ASW – Coronach, Assiniboia and Ogema areas Crop District 3AN – Gravelbourg, Mossbank, Mortlach and Central Butte areas Crop District 3B – Kyle, Swift Current, Shaunavon and Ponteix areas Crop District 4 – Consul, Maple Creek and Leader areas
A damp week slowed harvest progress. Eighty-six per cent of the crop has been combined, up from 82 per cent last week and well ahead of the five-year (2013-2017) average of 66 per cent for this time of year. Rain was reported from most of the region and was welcomed, even though producers are trying to finish harvest. Some of the driest areas received significant moisture, while others did not record much precipitation. The Rockglen area recorded 26 mm, the Limerick area 19 mm, the Eyebrow and Gull Lake areas 24 mm, the Shaunavon area 42 mm, the Swift Current area 48 mm, and the Consul area 30 mm. The Shaunavon area has recorded the most rainfall (258 mm) in the region since April 1. The Lucky Lake area has reported the least amount of rainfall in the region since April 1 (89 mm). Many pastures and hay land are still in need of significant moisture. Topsoil moisture conditions have improved significantly since last week. Cropland topsoil moisture is rated as 28 per cent adequate, 45 per cent short and 27 per cent very short. Hay land and pasture topsoil moisture conditions are rated as 17 per cent adequate, 48 percent short and 35 per cent very short. Crop district 3ASW is reporting 60 per cent of the crop, hay and pasture acres are very short of topsoil moisture at this time.

As the grazing season comes to an earlier end than normal due to a very dry growing season, twenty-two per cent of the pastures in the region are in fair condition, while 46 and 32 per cent are rated in poor and very poor condition. Because of uneven germination and growing season hail damage, there are reports of cereal crops being slow to finish out maturity and finish off green kernels. Concerns remain about feed shortages and the risk of fire with the dry conditions. Many producers are moving their cattle home and, in some cases, turning them out into stubble to gain a few more days of grazing. Producers are busy combining, baling straw, hauling bales, moving cattle and controlling weeds. East-Central Saskatchewan:
Crop District 5 – Melville, Yorkton, Cupar, Kamsack, Foam Lake, Preeceville and Kelvington areas
Crop District 6A – Lumsden, Craik, Watrous and Clavet areas Fields have been fairly quiet over the past two weeks as producers wait for sunny and dry weather to continue with harvest operations. Fifty-five per cent of the crop is now in the bin, up from 49 per cent last week. This is still ahead of the five-year (2013-2017) average of 44 per cent for this time of year. Of the crop that was combined this past week, the majority of it was taken off tough and put into driers. Rainfall reported ranged from 8 mm (Rocanville area) to 44 mm (Ituna area). The Esterhazy area received 19 mm, the Raymore area 40 mm, the Rhein area 34 mm, the Kuroki area 21 mm, the Bethune area 30 mm and the Allan area 10 mm. The Langenburg area has received the most precipitation (414 mm) in the region since April 1. Topsoil moisture on cropland is rated as 47 per cent adequate, 42 per cent short and 11 per cent very short. Hay land and pasture topsoil moisture conditions are rated as 30 per cent adequate, 49 per cent short and 21 per cent very short. The rain is welcomed in the drier areas of the region, despite putting a stop to harvest for the time being. Four per cent of the pastures in the region are rated in good condition, 26 per cent are rated in fair condition, 41 per cent in poor condition and 29 per cent in very poor condition. Crop reporters have indicated the recent rain will most likely affect crop quality, causing bleaching and staining. There has been some seeding of winter cereals. Producers are busy trying to combine and hauling hay bales.

West-Central Saskatchewan: Crop District 6B – Hanley, Outlook, Loreburn, Saskatoon and Arelee areas Crop District 7A – Rosetown, Kindersley, Eston and Major areas Crop District 7B -- Kerrobert, Macklin, Wilkie and Biggar areas
Combines have been parked for about one week in most of the region due to overcast days and rain. Fifty-seven per cent of the crop is combined, up from 53 per cent last week. The five-year (2013-2017) average for this time of year is 52 per cent combined. Rain reported ranged from 3 mm (Macklin area) to 60 mm (Rosetown area). The Perdue area has received the most precipitation (345 mm) in the region since April 1. The least amount of rain has been reported from Outlook at 77 mm since April 1. Topsoil moisture has improved immensely with the last week’s rain. Cropland topsoil moisture is rated as 47 per cent adequate, 45 per cent short and eight per cent very short. Hay land and pasture topsoil moisture is rated as 38 per cent adequate, 47 per cent short and 15 per cent very short. The rain was welcomed in the drier areas of the region to help pastures and hay going into the winter months. As livestock are being moved home from pastures, seven per cent of the pastures are rated in good condition, 29 per cent in fair condition, 44 per cent in poor condition and 20 per cent in very poor condition. Rain, along with secondary green growth, has caused major delays in harvest operations. The recent rain is expected to cause some bleaching and staining in some crops. Producers are busy swathing, hauling hay and trying to combine. Northeastern Saskatchewan:
Crop District 8 – Hudson Bay, Tisdale, Melfort, Carrot River, Humboldt, Kinistino, Cudworth and Aberdeen areas
Crop District 9AE – Prince Albert, Choiceland and Paddockwood areas Another week of cool and damp weather has held up harvest in most areas of the region. Some swathing occurred between rain events. Crops that were taken off in the last couple of weeks have been tough and are being aerated and dried. Twenty-nine per cent of the crop is now combined, up from 27 per cent last week. The five-year (2013-2017) average is 40 per cent for this time of year. The region received some significant rain, which has resulted in wet field conditions. The Nipawin area received the most moisture in the region at 62 mm. The Star City area received 32 mm, the Arbourfield area 36 mm, the Humboldt area 17 mm, the Melfort area 37 mm and the Prince Albert area 40 mm. The Nipawin area has received the most precipitation (409 mm) in the region since April 1.

Cropland topsoil moisture is currently rated as 18 per cent surplus, 73 per cent adequate and nine per cent short. Hay land and pasture topsoil moisture is rated as five per cent surplus, 84 per cent adequate and 11 per cent short. Timely rains throughout the growing season have left pastures in decent condition as the grazing season comes to a close. Five per cent of the pastures in the region are rated in excellent condition, 51 per cent in good condition, 33 per cent in fair condition and 11 per cent in poor condition. Geese are starting to show up on swathed crops. The rain and very few drying days are expected to cause bleaching, staining and sprouting in some crops. Grain dryers will be needed to help bring the crop moisture down for safe storage. Producers are busy hauling hay and waiting for weather conditions to improve. Northwestern Saskatchewan:
Crop District 9AW – Shellbrook, North Battleford, Big River and Hafford areas Crop District 9B – Meadow Lake, Turtleford, Pierceland, Maidstone and
Lloydminster areas Cool, cloudy and wet weather has continued to slow harvest operations in the region. Snow was reported in the Lloydminster and Meadow Lake areas, ranging from one to six inches, severely lodging crops. Some crops still need time to mature before they can be combined. Crops that were harvested this past week were put into the bin tough and then dried. Seventeen per cent of the crop has been put in the bin, behind the five-year (2013-2017) average of 38 percent for this time of year. Fifty per cent of the crop has been swathed or is ready to straight combine. Rainfall amounts ranged from 16 mm (Duck Lake) to 70 mm (Meadow Lake). The Radisson area reported 17 mm, the North Battleford area 30 mm, the Glaslyn area 20 mm, the Frenchman Butte area 71 mm and the Pierceland area 31 mm. The Frenchman Butte area has the highest recorded rainfall for the province (since April 1) at 480 mm. A break in the cool and wet weather is needed for harvest to continue. Cropland topsoil moisture is rated as 16 per cent surplus, 64 per cent adequate, 13 per cent short and seven per cent very short. Hay land and pasture topsoil moisture is rated as eight per cent surplus, 72 per cent adequate, 13 per cent short and seven per cent very short. At this time, 44 per cent of the pastures are rated in good condition, 30 per cent in fair condition, 17 per cent in poor condition and nine per cent in very poor condition. Crop damage this past week is mostly attributed to cool and wet weather. Lodging, bleaching and staining are causing quality losses. Geese are starting to move into mature crops. Producers are waiting for some good weather to allow them to continue harvest operations. A good week of sunny and dry weather will be needed before harvest can continue.

Winter Wheat % Standing % in swath% ready to
straight combine% combined
southeast 0 0 0 100southwest 0 0 5 95east central 0 0 0 100west central 0 0 0 100northeast 0 0 0 100northwest 0 0 0 100provincial 0 0 1 99
Fall Rye % Standing % in swath% ready to
straight combine% combined
% other(greenfeed/silage)
southeast 0 0 0 99 1southwest 0 0 0 82 18east central 0 0 0 100 0west central 0 0 0 95 6northeast 0 0 0 100 0northwest 0 0 0 100 0provincial 0 0 0 92 8
Spring Wheat % Standing % in swath% ready to
straight combine% combined
southeast 4 4 4 88southwest 8 0 14 78east central 11 13 15 61west central 21 7 33 39northeast 20 9 39 32northwest 54 10 23 13provincial 20 8 22 50
Durum % Standing % in swath% ready to
straight combine% combined
southeast 3 3 2 92southwest 7 2 10 81east central 18 6 13 63west central 34 3 26 37northeast N/A N/A N/A N/Anorthwest N/A N/A N/A N/Aprovincial 10 1 11 78
Barley % Standing % in swath% ready to
straight combine% combined
% other(greenfeed/silage)
southeast 1 3 1 93 2southwest 5 0 3 87 5east central 5 5 10 79 1west central 21 4 17 55 3northeast 11 8 19 62 0northwest 34 18 24 21 3provincial 12 7 11 68 2
Oats % Standing % in swath% ready to
straight combine% combined
% other(greenfeed/silage)
southeast 2 8 6 80 4southwest 8 0 8 72 12east central 20 16 11 51 2west central 46 14 5 13 22northeast 26 11 36 27 0northwest 55 17 10 4 14provincial 28 12 14 40 6
Canaryseed % Standing % in swath% ready to
straight combine% combined
southeast 24 3 17 56southwest 17 15 26 42east central N/A N/A N/A N/Awest central 71 0 13 16northeast 37 1 50 12northwest N/A N/A N/A N/Aprovincial 52 2 19 27
Saskatchewan Harvest Progress - September 17, 2018
*Other - crop that will not be harvested due to weather, insect or disease damage or will be greenfeed or silage

Flax % Standing % in swath% ready to
straight combine% combined
southeast 45 6 15 34southwest 48 0 18 34east central 58 23 5 14west central 67 10 10 13northeast 92 3 5 0northwest 87 0 10 3provincial 54 10 11 25
Canola % Standing % in swath% ready to
straight combine% combined
southeast 4 11 7 78southwest 7 7 14 72east central 6 39 12 43west central 8 33 11 48northeast 6 68 10 16northwest 16 69 8 7provincial 7 39 10 44
Mustard % Standing % in swath% ready to
straight combine% combined
southeast 1 0 0 99southwest 10 0 11 79east central 40 14 15 31west central 25 6 26 43northeast 70 11 12 7northwest N/A N/A N/A N/Aprovincial 13 2 11 74
Soybeans % Standing % in swath% ready to
straight combine% combined
southeast 64 0 9 27southwest 50 0 20 30east central 89 0 10 1west central 91 0 7 2northeast 74 0 24 2northwest N/A N/A N/A N/Aprovincial 69 0 10 21
Field Peas % Standing % in swath% ready to
straight combine% combined
southeast 0 0 0 100southwest 0 0 1 99east central 0 0 1 99west central 1 0 4 95northeast 1 0 5 94northwest 7 0 13 80provincial 2 0 3 95
Lentils % Standing % in swath% ready to
straight combine% combined
southeast 0 0 0 100southwest 0 0 2 98east central 2 0 8 90west central 4 0 2 94northeast N/A N/A N/A N/Anorthwest N/A N/A N/A N/Aprovincial 1 0 2 97
Chickpeas % Standing % in swath% ready to
straight combine% combined
southeast 0 0 6 94southwest 12 0 20 68east central N/A N/A N/A N/Awest central N/A N/A N/A N/Anortheast N/A N/A N/A N/Anorthwest N/A N/A N/A N/Aprovincial 11 0 19 70

!P
!P
!. !.
!.
!.
!.
!.
!.
!.
!.
!.Yorkton
Weyburn
Tisdale
Watrous
Outlook
Moose Jaw
Kindersley
Swift Current
Prince Albert
North Battleford
9A
9B
8A
5B
6A5A
6B
4A
7A
7B
2B
1A
8B
1B
3AS
3BN4B
2A3BS
3ANRegina
Saskatoon
394
588
51
488
17
111
561
486
49
520
555
496
622
433419
45
9 678 5
494
395
2
344
290
501
44
110
261
228
279
1
71
499
347
42
257259
40
73
498
426
464
230
276
438
335 334
456
333
493
226
165168
11
331
409
497
231
166
79
9396 94
171
9597
637677
9899
667865
169
647568 676974 70
18
3337 343546 363839
10
92
229
61
154
463
12
91
466
138137
461
127
459
411
260
435
32
72
254
472
183
440
219
194
126
471
336
158
211
285
366
142
502
308
190
377
403
271282
224 221
442
487
218
128
309
247255
157
185
345
184
312315
164
222
101
250
491
429
352
248
430
314
31
431
376
213
189
273
243244
214
274275
245
277
341
367
246
437
284
141
337
109
318320
338
139
351
381
129
319
108104106107
428
346
317
131
105
193
124
436
130
223
125
100
136133135
316
457
427
103
253
343
161160
410
256
159163
287
467
280288 281
368
340
371
339
370
398
468
216
397
369
405
241
382
191
217
167
434
251
186
134
399
439
406
155156
404
151
232
286
303
379
301305
307 304
349
252
153
372
187
292
181
152
350
220
470
469
460
102
132
322
402
378
162
342
121122
321313
225
521
283
400
215
123
458
401
310
373380
490
Geomatics Services, Ministry of Agriculture
Data Source: Crop Districts - Saskatchewan Ministry of Agriculture
© 2018 Government of Saskatchewan
Crop Districts and Rural Municipalities in Saskatchewan
± April 9, 2018Projection: UTM Zone 13 Datum: NAD83
0 50 100 150 20025
Kilometers
1:3,200,000
!. Regional Service Office
!P City
Crop District
Rural Municipality
!P
!P
!P
!P
!.
!.
!.
!.
!P
!.
!.
!.
!.
"
!P
!P
!.
!P!P
!P
!.
!P
!.
"
!.
!.
!P
!.
!.
!.
Scott
Elbow
Leader
Regina
Watrous
Outlook
Weyburn
Melfort
Nipawin
Tisdale
Wynyard
Yorkton
EstevanCoronach
Rosetown
Moose Jaw
Val Marie
Broadview
Saskatoon
Hudson Bay
Spiritwood
Kindersley
Assiniboia
Maple Creek
Indian Head
Meadow Lake
Lloydminster
Swift Current
Prince Albert
North Battleford
Geomatics Services, Ministry of Agriculture
Data Source: Rainfall - Ministry of Agriculture, Crop Report Database IDW interpolation (power 2.5, fixed radius 300 km)
© 2018 Government of Saskatchewan
Projection: UTM Zone 13 Datum: NAD83 ±0 50 100 150 20025
Kilometers
Weekly Rainfall
Rainfall (mm)
20.1 - 30.030.1 - 40.040.1 - 50.050.1 +
Trace 1.0 - 5.0 5.1 - 10.010.1 - 20.0
NOTE: Since techniques used to smooth the transition between zones can affect the values in localized areas,this map should be used for regional analysis only.
September 19, 2018
from September 11 to September 17, 2018
1:3,500,000

(in millimeters) 1 inch = 25 mm
Crop R.M. Past Since Crop R.M. Past Since Crop R.M. Past Since Dist. No. Name Week 1-Apr Dist. No. Name Week 1-Apr Dist. No. Name Week 1-Apr
1A 2 Mount Pleasant 13 258 4A 51 Reno 30.4 151.9 7A 287 St. Andrews 48 1813 Enniskillen 7 326 79 A Arlington 30 148 288 Pleasant Valley 60 227
32 Reciprocity 9 266 79 B Arlington 48.8 231.9 290 A Kindersley 49.5 20134 Browning 10 419 109 Carmichael 22 99.3 290 B Kindersley 18 13561 Antler 7 286 110 Piapot N/A 99 292 Milton 18 26064 Brock 10 284 111 Maple Creek N/A 101 317 Marriott 40 31365 Tecumseh 4 141 4B 139 A Gull Lake 24 115 318 Mountain View 38 229
1B 91 Maryfield 10 304 139 B Gull Lake 14 95 320 A Oakdale N/A 198.594 Hazelwood 10.2 181.1 169 Pittville N/A 62 320 B Oakdale 13 186
122 Martin 8 282 229 Miry Creek 8.4 222.7 321 Prairiedale 23 220123 Silverwood 8 313 231 Happyland 14 92 7B 347 Biggar 24 237124 Kingsley 6 270 5A 152 Spy Hill 8 283 350 Mariposa 35 198125 A Chester 5 210 183 Fertile Belt 19 320.5 351 Progress 36 244125 B Chester 6 307 211 Churchbridge 18 414 352 Heart's Hill 10 186151 Rocanville 12 366 213 Saltcoats 14 234 377 Glenside 25 195154 A Elcapo 7 260 216 Tullymet 32 209.8 378 Rosemount 27 260154 B Elcapo 8 256 217 Lipton 26 198 379 Reford 23 216155 Wolseley 17 238 241 Calder 8 298 382 Eye Hill 2.5 176
2A 67 Weyburn NIL 188 243 Wallace 17 223 409 A Buffalo 36 26468 Brokenshell 3 206 244 Orkney N/A 218 409 B Buffalo 33 21796 Fillmore N/A 77 245 A Garry 29 196 410 Round Valley 25 242.497 Wellington 8 279.5 245 B Garry 23 249 8A 395 Porcupine 31 287
2B 127 A Francis 14 258.5 245 C Garry 18 2449 397 Barrier Valley 44 296.2127 B Francis 17.5 212.8 246 A Ituna Bon Accord 44 311 426 Bjorkdale N/A 115129 Bratt's Lake 9.3 173 246 B Ituna Bon Accord N/A 169 427 Tisdale 40 274.5131 Baildon 14 135 247 Kellross 27 181 428 Star City 32 276156 A Indian Head 16 165.6 248 Touchwood 40 175 456 Arborfield 36 401156 B Indian Head 10 180 5B 273 Sliding Hills 34 268 457 Connaught 35 218159 Sherwood 15 201 277 Emerald 20 209 486 Moose Range 62 342160 A Pense 23 118 305 Invermay 31 285 487 Nipawin 36 409160 B Pense 23 194.7 307 Elfros 23 206 8B 369 St. Peter 24 190161 Moose Jaw 27 223 308 A Big Quill 15 149 370 A Humboldt 17 246162 Caron 16 242.3 308 B Big Quill 23 153 370 B Humboldt 18 133.5191 Marquis 28 196 331 Livingston 29 331 371 Bayne 19 203
3ASE 38 A Laurier 4 176.2 336 Sasman 21 189 372 Grant 23.9 254.238 B Laurier 6 196 337 Lakeview 29 174 400 Three Lakes 19 21139 The Gap 2 224 366 Kelvington 30 236 429 A Flett's Springs 37 256
3ASW 10 Happy Valley 1 173 367 Ponass Lake N/A 176.5 429 B Flett's Springs 37 29612 Poplar Valley 15 161 6A 190 A Dufferin 33 179 459 Kinistino 28 23543 Old Post 26 169 190 B Dufferin 30 135 460 Birch Hills 20.2 254.473 A Stonehenge 15 144.6 190 C Dufferin 20 190 9AE 488 Torch River 28 25873 B Stonehenge 15 206 190 D Dufferin 19 128 491 Buckland N/A 3074 Wood River 19 160.8 219 A Longlaketon 32 174.5 520 Paddockwood 40 236
3AN 102 Lake Johnston 22 186.6 219 B Longlaketon 14 181 521 Lakeland 40 217103 Sutton 12 132 220 McKillop 32 176 9AW 406 A Mayfield 17 180132 A Hillsborough 20.5 205.5 221 Sarnia 28.1 184.8 406 B Mayfield N/A 73132 B Hillsborough 33 237 222 Craik 24 243 435 Redberry 23 280193 Eyebrow 24 164 251 Big Arm 23 244.5 436 Douglas 31 206
3BS 17 Val Marie N/A 125.5 252 Arm River 24 269 463 Duck Lake 16 17075 Pinto Creek 6 209 279 Mount Hope 26.8 165.4 466 Meeting Lake 24 32776 Auvergne 13 155 282 McCraney 19 166.3 467 A Round Hill 30 28277 Wise Creek 13 193 312 Morris 34 227.5 467 B Round Hill 25 35278 Grassy Creek 20 183.8 313 Lost River 10 101 493 Shellbrook N/A 176.4
105 Glenbain 9 158 339 Leroy 28.2 192.4 494 Canwood 28 232106 Whiska Creek 16 245 340 Wolverine 20 254 497 Medstead N/A 168107 Lac Pelletier 30 165 341 Viscount 8 167 9B 438 Battle River 35 256108 Bone Creek 42 201 343 Blucher 9 146 440 Hillsdale 17 294
3BN 138 A Webb 38 182 6B 223 A Huron 20 230 442 Manitou Lake 35.7 344.3138 B Webb 48 152.5 223 B Huron 27 170 498 A Parkdale 20 311165 Morse 42.5 230.9 284 A Rudy 10 77 498 B Parkdale 30 310166 Excelsior N/A 74.3 284 B Rudy 15 112 499 Mervin 43.5 370.5167 Sask Landing 35 216.8 285 Fertile Valley 23 161.5 501 A Frenchman Butte 49 451168 A Riverside 26 173 286 Milden 14 80 501 B Frenchman Butte 40 375168 B Riverside 27.1 178.8 314 Dundurn 14 135 501 C Frenchman Butte 71 480226 Victory 11 89 344 Corman Park 33 199 502 Britannia 47.5 200.5228 Lacadena 13 121 345 Vanscoy 34 151 561 Loon Lake 46 403257 Monet 12 90.5 346 Perdue 23 345 588 A Meadow Lake 51 427
376 Eagle Creek 26 214 588 B Meadow Lake 70 455403 Rosthern 26 275 622 Beaver River 31 335.6
for the period to Sept 11 to 17, 2018
Weekly Rainfall Summary
These precipitation amounts represent point locations within each municipality and do not necessarily reflect the whole R. M.Municipality No: A, B, C and D - more than one reporter

!P
!P
!P
!P
!.
!.
!.
!.
!P
!.
!.
!.
!.
"
!P
!P
!.
!P!P
!P
!.
!P
!.
"
!.
!.
!P
!.
!.
!.
Scott
Elbow
Leader
Regina
Watrous
Outlook
Weyburn
Melfort
Nipawin
Tisdale
Wynyard
Yorkton
EstevanCoronach
Rosetown
Moose Jaw
Val Marie
Broadview
Saskatoon
Hudson Bay
Spiritwood
Kindersley
Assiniboia
Maple Creek
Indian Head
Meadow Lake
Lloydminster
Swift Current
Prince Albert
North Battleford
Geomatics Services, Ministry of Agriculture
Data Source: Rainfall - Ministry of Agriculture, Crop Report Database IDW interpolation (power 2.5, fixed radius 300 km)
© 2018 Government of Saskatchewan
Projection: UTM Zone 13 Datum: NAD83 ±0 50 100 150 20025
Kilometers
Cumulative Rainfall
NOTE: Since techniques used to smooth the transition between zones can affect the values in localized areas,this map should be used for regional analysis only.
from April 1 to September 17, 2018
September 19, 2018
Rainfall (mm) 0.0 - 25.0
25.1 - 50.0
50.1 - 75.0
75.1 - 100.0
325.1 - 350.0
350.1 - 375.0
300.1 - 325.0
375.1 - 400.0
125.1 - 150.0
150.1 - 175.0
175.1 - 200.0 475.1 +
450.1 - 475.0
425.1 - 450.0
400.1 - 425.0200.1 - 225.0
225.1 - 250.0
250.1 - 275.0
275.1 - 300.0
100.1 - 125.0
1:3,500,000
!P
!P
!P
!P
!.
!.
!.
!.
!P
!.
!.
!.
!.
"
!P
!P
!.
!P!P
!P
!.
!P
!.
"
!.
!.
!P
!.
!.
!.
Scott
Elbow
Leader
Regina
Watrous
Outlook
Weyburn
Melfort
Nipawin
Tisdale
Wynyard
Yorkton
EstevanCoronach
Rosetown
Moose Jaw
Val Marie
Broadview
Saskatoon
Hudson Bay
Spiritwood
Kindersley
Assiniboia
Maple Creek
Indian Head
Meadow Lake
Lloydminster
Swift Current
Prince Albert
North Battleford
Geomatics Services, Ministry of Agriculture
Data Source: Moisture - Ministry of Agriculture, Crop Report Database IDW interpolation (power 2.5, fixed radius 300 km)
© 2018 Government of Saskatchewan
Projection: UTM Zone 13 Datum: NAD83 ±0 50 100 150 20025
Kilometers
Cropland Topsoil Moisture Conditions
NOTE: Since techniques used to smooth the transition between zones can affect the values in localized areas,this map should be used for regional analysis only.
September 19, 2018
September 17, 2018
Moisture Conditions
Very
Short
Short
Adequat
e
Surplu
s
1:3,500,000

!P
!P
!P
!P
!.
!.
!.
!.
!P
!.
!.
!.
!.
"
!P
!P
!.
!P!P
!P
!.
!P
!.
"
!.
!.
!P
!.
!.
!.
Scott
Elbow
Leader
Regina
Watrous
Outlook
Weyburn
Melfort
Nipawin
Tisdale
Wynyard
Yorkton
EstevanCoronach
Rosetown
Moose Jaw
Val Marie
Broadview
Saskatoon
Hudson Bay
Spiritwood
Kindersley
Assiniboia
Maple Creek
Indian Head
Meadow Lake
Lloydminster
Swift Current
Prince Albert
North Battleford
Geomatics Services, Ministry of Agriculture
Data Source: Moisture - Ministry of Agriculture, Crop Report Database IDW interpolation (power 2.5, fixed radius 300 km)
© 2018 Government of Saskatchewan
Projection: UTM Zone 13 Datum: NAD83 ±0 50 100 150 20025
Kilometers
Hay and Pasture Topsoil Moisture Conditions
NOTE: Since techniques used to smooth the transition between zones can affect the values in localized areas,this map should be used for regional analysis only.
September 19, 2018
September 17, 2018
Moisture Conditions
Very
Short
Short
Adequat
e
Surplu
s
1:3,500,000
!P
!P
!P
!P
!.
!.
!.
!.
!P
!.
!.
!.
!.
"
!P
!P
!.
!P!P
!P
!.
!P
!.
"
!.
!.
!P
!.
!.
!.
Scott
Elbow
Leader
Regina
Watrous
Outlook
Weyburn
Melfort
Nipawin
Tisdale
Wynyard
Yorkton
EstevanCoronach
Rosetown
Moose Jaw
Val Marie
Broadview
Saskatoon
Hudson Bay
Spiritwood
Kindersley
Assiniboia
Maple Creek
Indian Head
Meadow Lake
Lloydminster
Swift Current
Prince Albert
North Battleford
Geomatics Services, Ministry of Agriculture
Data Sources: Temperature data - Saskatchewan Ministry of Environment (Wildfire Management Branch) and Environment Canada. Temperature data compiled and quality controlled by Agriculture and Agri-Food Canada IDW interpolation (power 3.5, fixed radius 300 km)
© 2018 Government of Saskatchewan
Projection: UTM Zone 13 Datum: NAD83 ±0 50 100 150 20025
Kilometers
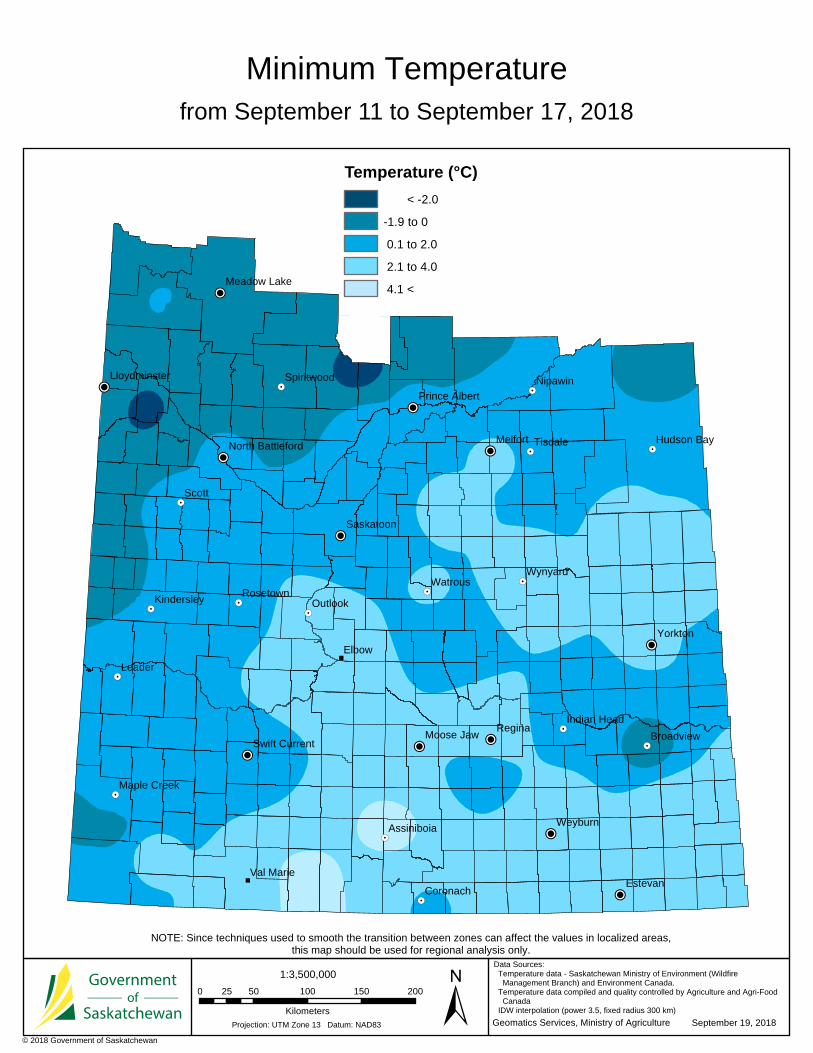
Minimum Temperature
NOTE: Since techniques used to smooth the transition between zones can affect the values in localized areas,this map should be used for regional analysis only.
September 19, 2018
from September 11 to September 17, 2018
Temperature (°C)
< -2.0
-1.9 to 0
0.1 to 2.0
2.1 to 4.0
4.1 <
1:3,500,000
!P
!P
!P
!P
!.
!.
!.
!.
!P
!.
!.
!.
!.
"
!P
!P
!.
!P!P
!P
!.
!P
!.
"
!.
!.
!P
!.
!.
!.
Scott
Elbow
Leader
Regina
Watrous
Outlook
Weyburn
Melfort
Nipawin
Tisdale
Wynyard
Yorkton
EstevanCoronach
Rosetown
Moose Jaw
Val Marie
Broadview
Saskatoon
Hudson Bay
Spiritwood
Kindersley
Assiniboia
Maple Creek
Indian Head
Meadow Lake
Lloydminster
Swift Current
Prince Albert
North Battleford
Geomatics Services, Ministry of Agriculture
Data Sources: Temperature data - Saskatchewan Ministry of Environment (Wildfire Management Branch) and Environment Canada. Temperature data compiled and quality controlled by Agriculture and Agri-Food Canada IDW interpolation (power 3.5, fixed radius 300 km)
© 2018 Government of Saskatchewan
Projection: UTM Zone 13 Datum: NAD83 ±0 50 100 150 20025
Kilometers
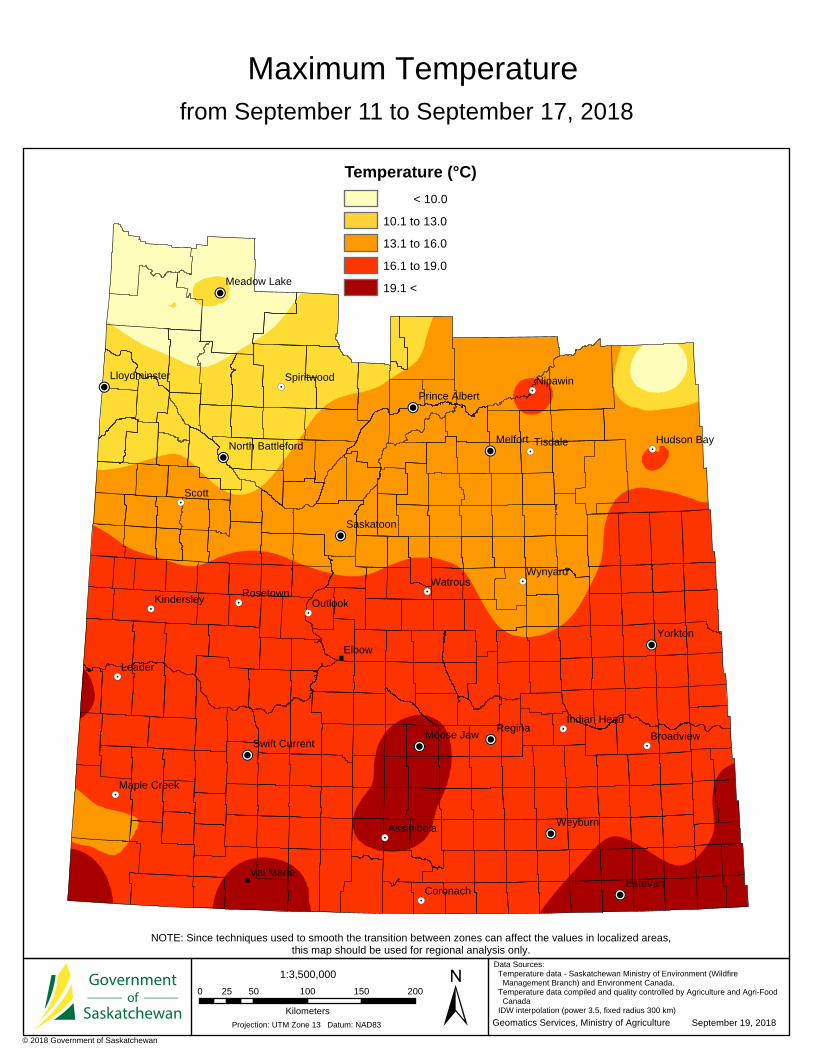
Maximum Temperature
NOTE: Since techniques used to smooth the transition between zones can affect the values in localized areas,this map should be used for regional analysis only.
September 19, 2018
from September 11 to September 17, 2018
Temperature (°C)
< 10.0
10.1 to 13.0
13.1 to 16.0
16.1 to 19.0
19.1 <
1:3,500,000