Embed Size (px)
Citation preview

Cronfa - Swansea University Open Access Repository
_____________________________________________________________
This is an author produced version of a paper published in :
Trees
Cronfa URL for this paper:
http://cronfa.swan.ac.uk/Record/cronfa33203
_____________________________________________________________
Paper:
Levani, T., Griar, J., Gagen, M., Jalkanen, R., Loader, N., McCarroll, D., Oven, P. & Robertson, I. (2009). The climate
sensitivity of Norway spruce [Picea abies (L.) Karst.] in the southeastern European Alps. Trees, 23(1), 169-180.
http://dx.doi.org/10.1007/s00468-008-0265-0
_____________________________________________________________ This article is brought to you by Swansea University. Any person downloading material is agreeing to abide by the
terms of the repository licence. Authors are personally responsible for adhering to publisher restrictions or conditions.
When uploading content they are required to comply with their publisher agreement and the SHERPA RoMEO
database to judge whether or not it is copyright safe to add this version of the paper to this repository.
http://www.swansea.ac.uk/iss/researchsupport/cronfa-support/

1 of 26
1 The climate sensitivity of Norway spruce (Picea abies (L.) Karst.) in the southeastern
2 European Alps.
3
4 Tom Levanič1*
, Jožica Gričar1, Mary Gagen
3, Risto Jalkanen
2, Neil J. Loader
3, Danny
5 McCarroll3, Primož Oven
4, Iain Robertson
3
6
7 1 Slovenian Forestry Institute, Večna pot 2, SI-1000 Ljubljana, SLOVENIA.
8 2 Metla Rovaniemi Research Unit, Eteläranta 55, FIN-96300 Rovaniemi, FINLAND.
9 3 Department of Geography, Swansea University, Singleton Park, Swansea SA2 8PP, UK.
10 4 University of Ljubljana, Biotechnical Faculty, Department of Wood Science and Technology, Rožna
11 dolina, cesta VIII/34, SI-1000 Ljubljana, SLOVENIA.
12
13
14 *corresponding author
15 e-mail of the corresponding author: [email protected]
16 Tel: 386 1 200 78 00
17 Fax: 386 1 257 35 89
18
19

2 of 26
1 Abstract
2 To investigate the potential of Norway spruce (Picea abies L. Karst) as a palaeoclimate
3 archive in the southeastern European Alps, tree ring chronologies were developed from trees
4 growing at two sites in Slovenia which differed in their ecological and climatological
5 characteristics. Ring width, maximum latewood density, annual height increment and
6 latewood cellulose carbon isotope composition were determined at both sites and the
7 resulting time-series compared with and verified against instrumental climate data for their
8 common period (AD1960-AD2002). Results indicate that ring width sensitivity to summer
9 temperature is very site-dependent, with opposing responses at alpine and lowland sites.
10 Maximum density responds to September temperatures, indicating lignification after cell
11 division has ceased. Stable carbon isotopes have most potential, responding strongly to
12 summer temperature in both alpine and lowland stands. Height increment appears relatively
13 insensitive to climate, and is likely to be dominated by local stand dynamics.
14
15 Key words: wood formation, height increment, latewood density, stable carbon isotope,
16 southeastern Alps
17
18

3 of 26
1 Introduction
2
3 Norway spruce (Picea abies (L.) Karst.) is a long-lived tree (up to 400 years) and one of the
4 most widespread conifers in Europe, extending naturally from the Arctic Circle in the north to
5 the southwest and western range of the Alps, the Carpathians and Balkans, and to the
6 extreme north of Greece. Today, it is even more widespread as a significant proportion of
7 Norway spruce forests grow as monocultures beyond the boundaries or at lower elevations
8 than their natural distribution. Mature spruce stands on shallow soils are more vulnerable to
9 insects outbreaks, diseases, wind throws and other natural and human induced stresses
10 (Jakša, 2007).
11 A comprehensive study of the influence of climate on tree-ring widths and maximum latewood
12 density of Picea abies (L.) Karst., Larix decidua Mill., Pinus cembra L. and Abies alba Mill.
13 has been conducted for the central and western Alps (Frank and Esper, 2005), but the
14 southeastern part of the European Alps was not taken into consideration. Similarly, in a study
15 on spruce growth along a transect from Southern Germany to the spruce arctic timberline
16 (Mäkinen et al., 2002), sites in the southeastern part of the Alps (SE Alps) were excluded.
17 Norway spruce does, however, have potential as a palaeoclimate archive in this region
18 (Lindner, 2000; Stanovnik, 1998). The trees are relatively long-lived (up to 400 years), very
19 widespread and the timber has been used in old buildings (Čufar et al., 1995; Levanič, 2004).
20 Despite this potential, little is known about Norway spruce response to climate in the
21 southeastern part of the Alps. A detailed multi-parameter approach based on intra- and inter-
22 annual monitoring of the growth of trees and climatic data might greatly improve knowledge
23 on tree response to climate and help to predict future responses. Here we perform such a
24 study, at two contrasting sites, recording radial and height growth, latewood density and the
25 stable carbon isotope ratios of the latewood as well as monitoring cambial activity and cell
26 growth over three years.
27 Our aims are:
28 (i) to examine how climate has influenced spruce trees growing under different
29 conditions in the southeastern European Alps using a range of growth proxies;

4 of 26
1 (ii) to evaluate whether the multi-parameter approach to dendroclimatology is
2 applicable to spruce in this region;
3 (iii) to use high-resolution analysis of cambial dynamics (pinning) to investigate the
4 seasonal dynamics of wood formation and its connection with local climate and
5 (iv) to investigate the potential of spruce as a palaeoclimate archive in the
6 southeastern Alpine region.
7
8 Materials and Methods
9 Experimental site and trees
10 For the study we selected Norway spruce trees growing at a typical lowland plantation
11 (Sorško polje, 350 m a.s.l., N 46°10’31”, E 14°23’22” ) and at a typical natural alpine site
12 (Pokljuka, 1250 m a.s.l., N 46°21’46”, E 13°58’39”) (Figure 1). The average annual
13 temperature at Sorško polje, measured at the nearby meteorological station of Ljubljana (316
14 m a.s.l., 18 km S from the site), is 9.8°C, with January being the coolest (-1.0°C) and July the
15 warmest month (20.0°C). The distribution of precipitation should favour spruce growth, May-
16 September are well supplied with precipitation (47% of 1409 mm annual precipitation falls in
17 this period) (Figure 2a). However, due to the presence of a thick layer of gravel just below the
18 organic horizon, water drains quickly into deeper layers and gets inaccessible to the spruce
19 roots. Trees growing on such shallow, organic soils are therefore subjected to high seasonal
20 oscillations in soil water, resulting in summer water stress, increased bark beetle attacks and
21 Heterobasidion spp. root and butt rot infections (Jakša, 2007).
22 The Alpine site Pokljuka is a typical, natural, sustainably managed sub-alpine spruce forest
23 site (Piceetum subalpinum). The site is characterized by low winter temperatures and high
24 amounts of snow; annual mean temperature measured at Mrzli Studenec meteorological
25 station (1350 m a.s.l, 4 km E from the site) is 3.5°C (Figure 2b). January and February are the
26 coolest and driest months respectively at Pokljuka site (mean monthly minimum temperature
27 and precipitation for January -4.4°C, 117 mm; February -5.2°C, 115 mm). July and August are
28 the warmest months, with monthly mean temperatures of 12.3ºC and 11.9°C, respectively.
29 Precipitation is abundant throughout the year, with September (185 mm), October (193 mm)
30 and November (227 mm) being the wettest months. Precipitation in October and November

5 of 26
1 could also fall as snow. Average annual precipitation at the Pokljuka site is 1978 mm, with an
2 absolute maximum of 2604 mm and minimum of 1351 mm. The site is moist and relatively
3 cool in summer and therefore optimal for Norway spruce growth. Ground vegetation at the
4 site is scarce due to high stand density.
5 At each site, Norway spruce trees with comparable biometric characteristics and age (about
6 70 years) and at least 15 m from skidding trails were selected – see Table 1 for number of
7 trees and samples. The mean diameter at breast height (1.3m) was 44 cm at Sorško polje
8 and 35 cm at Pokljuka. Crowns of the sampled trees were in the stand canopy and normally
9 developed (social position 2 by Kraft’s classification), stems and surface roots were without
10 any visible mechanical damage.
11 Meteorological data
12 The meteorological data sets used originate from the Environmental Agency of the Republic
13 of Slovenia and are validated and corrected for errors. Ljubljana has the longest record in
14 Slovenia, which spans from 1851 for temperature and from 1853 for precipitation till present,
15 with no missing data. In this study, period 1960-2002 was used for both experimental sites.
16 Distance from Ljubljana meteorological station to Sorško polje site is approx. 18 km and to
17 Pokljuka site approx. 40 km. A meteorological station Mrzli studenec, close to the Pokljuka
18 site has a short record (1953-present) with completely missing observations between 1965
19 and 1997 (64% of the whole data set) was therefore used only to check that the Ljubljana
20 records are appropriate. The correlation (Pearson’s r) between long-term monthly
21 temperature values for meteorological stations Ljubljana and Mrzli studenec is 0.99 and for
22 monthly sum of precipitation 0.88.
23
24 Measurements of tree-ring widths (TRW)
25 To build tree-ring width chronologies for each site, we used cross-sections from stem disks of
26 5 trees that were used for pinning and thereafter felled. Moreover, we took two 5 mm
27 diameter cores at 1.30 m from ten additional trees at each plot. All trees were visually
28 assessed before coring, and only healthy trees without any visual injuries to the crown, stem,
29 or root system were selected for sampling. All samples were prepared according to standard
30 dendrochronological procedures (Fritts, 1976; Schweingruber, 1989). Cross-sections and

6 of 26
1 cores were sanded with sanding paper of increasingly higher grade until a perfectly smooth
2 surface was achieved. Tree-ring widths were measured on a LINTABTM
measuring table with
3 a 0.01 mm precision (www.rinntech.com) equipped with an OLYMPUS binocular and
4 polarized light source and further processed with PAST-4 dendrochronological software
5 (www.sciem.com). Synchronisation and verification was done in PAST-4 using both visual
6 comparisons and well established statistical parameters, including tBP (Baillie and Pilcher,
7 1973), GLK% (Eckstein and Bauch, 1969), and Date Index - DI (Schmidt, 1987). Values of tBP
8 greater than 6.0, GLK% values greater than 65% and DI values greater than 100 were
9 considered significant. Quality control using the programme COFECHA was applied to check
10 for measuring mistakes (Grissino-Mayer, 2001; Holmes, 1983). If necessary, measurements
11 were repeated and re-checked with COFECHA and removed from further processing if
12 recognised as unusable. Pointer years, used as an additional cross-check tool, were defined
13 as years where 80% of at least 10 trees reacted with a growth increase or decrease
14 compared to the previous year. All calculations of pointer years were performed on non-
15 standardised (raw) tree-ring series (Schweingruber et al., 1990).
16 Despite the fact that Sorsko polje is a spruce plantation with a thick layer of gravel just below
17 the organic horizon, we did not find any false or missing rings. The only anomalies were
18 narrow rings and, in some trees, compression wood and density fluctuations. Pokljuka site, in
19 contrast, is characterised by a very stable growth rhythm and narrow rings with little width
20 oscillation. No density fluctuation, missing or false rings were detected.
21
22 Analysis of maximum latewood density (MXD)
23 For examination of the tree-ring relative density, a system provided by Walesch electronics
24 (www.walesch.ch) was used. Cores, 12 mm in diameter, or radial sections of stem discs were
25 taken for this purpose from 15 trees per site (30 trees altogether). Samples were prepared on
26 a double bladed saw and resin was extracted using Soxhlet apparatus (see Schweingruber et
27 al., 1978). X-ray images were processed according to the procedures developed at the WSL
28 laboratory, Switzerland (Schweingruber et al., 1978).
29
30 Stable carbon isotope composition (13
C)

7 of 26
1 Radial samples from dated disks were sampled for their stable carbon isotope composition.
2 The latewood from each ring was extracted manually using a scalpel. For each sample α-
3 cellulose was isolated from the slivers of wood through a series of chemical steps using a
4 modified batch processing technique (Loader et al., 1997; Rinne et al., 2005). Between 300
5 and 350μg of dry α-cellulose were weighed into tin foil capsules and combusted on-line to
6 CO2 at 1000°C over chrome(III) oxide using an ANCA Elemental Analyser interfaced to a PDZ
7 Europa 20/20 isotope ratio mass spectrometer. Combustion gases were purified online and
8 the CO2 resolved chromatographically prior to mass spectrometer analysis. Results are
9 presented as per mille deviations from the VPDB standard using the conventional delta δ13
C
10 notation (McCarroll and Loader, 2004). The precision on replicate analyses of an internal
11 cellulose reference material is typically better than 0.1 per mille (n=15).
12
13 Height increment (HI)
14 Height increment was measured as the lengths of the annual shoots in the stem. The dating
15 of the annual shoots was controlled by counting of absolutely dated tree rings in the discs
16 sampled from inter-whorl increments located along the stem (for details see Kurkela and
17 Jalkanen, 1990). Height increments were measured from the same felled trees used in
18 cambial dynamics studies and radial growth measurements and combined into two site
19 chronologies. Altogether there were 13 and 15 trees used for height increment analysis in
20 Sorško polje and Pokljuka respectively. Because of damaged tree top (heavy storm prior to
21 felling) we were not able to analyse height increment on two trees from Sorško polje
22 experimental site, therefore we only took samples for TRW, MXD, 13
C and WFD analysis.
23
24 Wood formation dynamics (WFD)
25 Five spruce trees per stand were pinned weekly between the end of April and end of October
26 in the years 2002, 2003 and 2004. Six pinning holes per stem were set in a semi-helical
27 pattern at the same date, using a 1.75 mm thick needle (Wolter, 1968). The pinning holes
28 were marked and numbered. The pinned trees were felled at the end of the growing season,
29 and samples containing wounded tissue were removed, fixed in FAA (formalin-ethanol-acetic
30 acid solution) and dehydrated in ethanol series (30%, 50% and 70%). Transverse sections of

8 of 26
1 approximately 25 μm thick were prepared using a Leica SM 2000R sliding microtome, stained
2 with safranin and astra blue and finally mounted in Euparal.
3 Microscopic observations and analysis were carried out with a Nikon Eclipse E800 light
4 microscope (bright field or polarized light) and a Lucia G 4.8 image analysis system. We
5 counted the number of cells of the xylem increment formed from the onset of cambial growth
6 to the time of pinning in at least three radial files of tracheids. To calculate relative increments
7 we counted the number of cells on the extreme sides of the cross-sections that were free of a
8 wound response.
9 A Gompertz function was applied to describe the seasonal dynamics of wood formation of the
10 sampled trees at both sites in each year (Rossi et al., 2003).
11
12 Standardisation of the different proxies
13 The ARSTAN programme (Cook, 1985; Cook and Holmes, 1999) was used to remove age
14 trends in the ring width, density and height data and build site chronologies. De-trending was
15 achieved using a negative exponential or linear function. Indices were calculated as ratios
16 between the actual and fitted values. Index values were then prewhitened using an
17 autoregressive model selected on the basis of the minimum Akaike information criterion and
18 combined across all series using bi-weight robust estimation of the mean to exclude the
19 influence of the outliers (Cook, 1985; Cook et al., 1990).
20 Signal strength in the individual, detrended proxy series was tested using EPS – Expressed
21 Population Signal (Briffa and Jones, 1990; Wigley et al., 1984). Only those series with a high
22 common signal (EPS≥0.85) were included in the analysis.
23 The stable isotope series, also yielding EPS>0.85, were mathematically corrected to remove
24 the effect of anthropogenic changes in the δ13
C composition of atmospheric carbon dioxide
25 (McCarroll and Loader, 2004; McCarroll and Loader, 2005). A second correction was
26 employed to conservatively correct for changes in carbon isotope discrimination as a
27 consequence of elevated atmospheric carbon dioxide concentrations (Gagen et al., 2007;
28 Loader et al., in press). The carbon isotope analyses are reported only since 1960 in order to
29 exclude the ‘juvenile effect’ which results in depleted but rising 13
C values in the early
30 decades of tree growth (about 50 years: Gagen et al., 2007; Loader et al., 2007). Having

9 of 26
1 made these corrections, it is not considered necessary to statistically de-trend or index the
2 isotope values (McCarroll and Loader, 2004; McCarroll and Loader, 2005).
3 All proxy chronologies were compared with climate data from Ljubljana meteorological station.
4 Relationships between the climatic variables and the corrected and residual site chronologies
5 were examined by simple regression analysis and Pearson’s correlation coefficient. Measures
6 used to assess the accuracy of statistical predictions, as recommended by the National
7 Research Council (-, 2006) were the mean squared error (MSE), reduction of error (RE),
8 coefficient of efficiency (CE), and the squared correlation (r2). MSE is a measure of how close
9 a set of predictions are to the actual values. It is usually normalized and presented in the form
10 of either the RE statistic (Fritts, 1976) or the CE statistic (Cook et al., 1994). The RE statistic
11 compares the MSE of the reconstruction to the MSE of a reconstruction that is constant in
12 time with a value equivalent to the sample mean for the calibration data. The CE, on the other
13 hand, compares the MSE to the performance of a reconstruction that is constant in time with
14 a value equivalent to the sample mean for the validation data. CE will always be less than RE,
15 and the difference increases as the difference between the sample means for the validation
16 and the calibration periods increases. Where RE and CE statistics are negative or close-to-
17 zero, a reconstruction is likely to have little if any skill. The CE statistic is the most difficult to
18 pass, but the RE statistic is particularly useful for detecting whether or not a proxy responds
19 to lower frequency changes in climate by tracking a shift in the mean value between the
20 calibration and verification periods (Wahl and Ammann, 2007). The squared correlation
21 statistic, denoted as r2, measures the strength of a linear relationship between two variables
22 but is insensitive to differences in the absolute values.
23
24 Results
25 The results for the four proxies for the common period 1960 to 2002, in both raw and
26 corrected or indexed form, are presented in Figure 3. The tree ring widths from the lowland
27 site (Sorško polje) are much more variable (range 0.5 mm – 3.7 mm) than at the alpine site
28 (1.5 mm – 2.7 mm), and the mean ring width is larger at the lowland site Sorško polje
29 compared to high elevation site Pokljuka despite very similar tree ages at the two sites (Table
30 2). The difference in the mean level of the maximum density results is even more striking, with

10 of 26
1 much higher values at the lowland (1.02 g.cm-3
) than on the high elevation site (0.86 g.cm-3
),
2 although the within-site ranges are similar (Table 2). The height increment values are similar
3 in terms of both mean value and range - mean 39.2 cm.year-1
(range 9.9 cm – 64.0 cm.year-1
)
4 on Sorško polje compared to 32.0 cm.year-1
(range 18.1 - 45.4 cm.year-1
) at Pokljuka (Table
5 2). Although the carbon isotope values from the two sites vary around similar means, there is
6 a marked difference in sensitivity, with a much larger range of values at the lowland site
7 Sorško polje; mean 13
C value of –22.75 (range -24.22 to -20.81) compared to the high
8 elevation site Pokljuka with mean 13
C value of –22.27 (range -23.40 to -21.29) (Table 2).
9 The difference in sensitivity is not an artefact of the different sample sizes and is apparent in
10 the individual tree series.
11 The correlations between the proxies within each of the sites (Table 3a,b) are very low, with
12 only that between height increment (lagged 1 year) and ring width at Sorško polje proving
13 significant. The height values are shifted because they respond to conditions in the previous
14 summer, as discussed below. If the sites are combined to give four ‘average’ chronologies
15 (Table 3c), the only marginally significant correlation is between height increment and
16 maximum latewood density. The between-site correlations (Table 4) show that only two of
17 four proxies are significantly correlated – correlation between MXD values is 0.40 (p< 0.05)
18 and between δ13
C 0.67 (p<0.01). Ring widths and height increments are not correlated
19 between the sites and none of the proxies at one site correlate significantly with a different
20 proxy at the other site.
21 When the proxy data are compared with mean temperature and precipitation amount data
22 from Ljubljana, it is clear that only comparison with stable carbon isotope gives high
23 correlation values (Figure 4). For ring widths there are no significant correlations with the
24 temperature or precipitation observed for any single month at either of the sites, nor with
25 combinations of the summer months. There is, however, a clear opposite response of the ring
26 widths to temperature at the two sites. In May, June and July the correlations with
27 temperature at the alpine site are weak and positive, but at the lowland site they are weak
28 and negative (Figure 4).
29 For maximum latewood density the results are more consistent between the sites, giving
30 positive correlations with the temperature of the summer months. The only significant single

11 of 26
1 month is September, showing a positive correlation with temperature and a negative
2 correlation with precipitation. The combination of May to September is also significant for both
3 temperature and precipitation at Pokljuka but not Sorško polje. The correlations between
4 height increment and climate parameters are not statistically significant (p>0.05). The values
5 presented in Figure 4 compare the height increment with the climate of the previous year,
6 because it has been shown for Scots Pine that height growth is controlled by the climate of
7 the year immediately prior to shoot extension (Jalkanen et al., 1995; Jalkanen et al., 1998).
8 However, spruce at both sites did not exhibit any strong correlations with either the climate of
9 the year prior to growth or with the climate of the year of growth.
10 The relationship between the stable carbon isotopes and climate is significant and consistent
11 at both sites. There are strong positive correlations with the temperature of spring (May) and
12 mid-summer (July and August) at both sites, and the best combination of months is the mean
13 of July and August, giving correlations of 0.61 and 0.66 at the lowland and alpine sites
14 respectively. There is a negative correlation with the precipitation of the summer months.
15
16 The potential for using the proxies to reconstruct past climate is tested using a split-period
17 calibration and verification test, run in both directions (Table 5). In the case of MXD the target
18 climate parameter is the mean temperature of September. The percentage of variance
19 explained over the verification periods varies between 29% and 50%. In every case the RE
20 statistics are positive. When the average of the two sites is taken, the correlation with
21 September temperature over the full period is lower than at either of the individual sites. For
22 stable carbon isotopes the climatic target is the mean July and August temperature. Over the
23 full period the correlation is higher for Pokljuka than for Sorško polje, but when the sites are
24 combined as a simple average the correlation is higher (0.68) and it is higher again if the
25 values from the individual sites are standardised to equalise the variance prior to combining
26 them (0.70). In every case the RE statistics are strongly positive. Since there is a difference of
27 1.6°C in the mean July/August temperatures of the two periods, these results confirm that the
28 isotope-based reconstructions are able, to some extent, to track a change in the mean
29 temperature, as well as reflecting the inter-annual variations. The negative CE values,
30 however, demonstrate that the predicted temperature values in the verification periods do not

12 of 26
1 perform as well as the verification mean, because some off-set remains. The best results are
2 obtained when the isotope series are standardised prior to being combined, so that the
3 difference in sensitivity is removed. The calibration and verification statistics for ring widths
4 and height increments are also shown, with July - August (tree-ring widths) and previous
5 August – September (height increment) temperature as the target, but since the correlations
6 over the whole period are low it is unsurprising that the results are poor, with very little of the
7 variance explained (Table 5).
8
9 The investigation of wood formation dynamics over the years 2002-2004 revealed that at
10 Sorško polje, divisions in the cambium in all three years started at the end of April and
11 finished at the end of July (year 2003) or at the end of August (year 2002 and 2004) (Figure
12 5). At Pokljuka, a delay of 2–4 weeks in the beginning of cambial cell divisions was observed,
13 and the production of new cells stopped in the first half of August in all three years. At Sorško
14 polje, the duration of the cambial activity was markedly longer (98–119 days) in 2002 and
15 2004 than in 2003 (77–84 days) (Figure 5). At Pokljuka, the differences in the duration of the
16 cell divisions among years were less expressed (14 days) and the period of cambial activity
17 was shorter, however rate of cell production was higher at Pokljuka (on average 0.46–0.60),
18 than at Sorško polje (on average 0.39–0.42) – Table 6.
19
20 Discussion
21 The large between-site differences in the ring-width chronologies, and the poor fit with climate
22 data are not unexpected. Mäkinen et al. (2003) studied radial growth of Norway spruce on a
23 transect from southern Germany to the spruce northern timberline and stated that tree-ring
24 widths of spruce growing under average climatic conditions respond less strongly to climatic
25 variation than trees growing in extreme conditions. This coincides with our findings of tree-ring
26 response to climate on both sites. Similarly, Frank and Esper (2005) found that in the central
27 and western Alps ring widths in spruce are less sensitive to climate than maximum latewood
28 densities. Spruce in the southeastern Alps is notoriously difficult to cross-date between sites,
29 suggesting that local site factors dominate over the regional climate signal. In this case the
30 difference is so large that the response to temperature at the two sites is even in opposite

13 of 26
1 directions, with the colder alpine site showing positive values of correlation coefficients with
2 the summer months and the lowland site negative values. The lowland site is more sensitive
3 to water stress not because the summers are particularly dry and hot, but because the
4 shallow soils overlie freely draining gravels, reducing the capacity of the thin organic soils to
5 store water accessible by the trees. The shallow-rooted spruce trees are thus prone to
6 periods of water stress, which can be sufficiently severe to terminate growth or to form partial
7 rings. The cambial dynamics data show this effect during the hot summer of 2003, where
8 radial growth was prematurely terminated at Sorško polje, forming a ring that was only 1.1
9 mm wide (normally between 1.6 and 1.7 mm) but enhanced at Pokljuka where a 1.4 mm wide
10 ring was formed (normally between 1.2 and 1.3 mm).
11 For the maximum latewood density results there is a striking difference in the absolute values
12 and sensitivities between the two sites, with much higher densities and smaller variability at
13 the lowland site. This is likely to be linked to the higher site productivity and the longer
14 growing season at lower altitude. Despite these differences there is a significant correlation
15 between the two sites, suggesting that densities are less sensitive to local site factors than
16 radial growth, as was also observed by Sander and Eckstein (2001). The strong and
17 consistent correlation with the temperature of September, which according to the cambial
18 dynamics results falls after radial growth has ceased, can be explained by lignification of the
19 latest formed latewood tracheids, which can continue long after cambial cell division has
20 stopped (Gindl et al., 2000; Gričar et al., 2005).
21 Height increment in spruce, as in pine, is a 2-year process involving the formation of the
22 terminal bud in the first year and shoot elongation in the second year (Doak, 1935), so that
23 summer temperatures of the previous year can control height increment (Salminen and
24 Jalkanen, 2005). Annual height increment of Scots pine (Pinus sylvestris L.) has proven to be
25 one of the strongest palaeoclimate proxies in the northern boreal zone (McCarroll et al., 2003;
26 Salminen and Jalkanen, 2005). In the Giant Mountains of Czech Republic Sander and
27 Eckstein (2001) found a good coherence in spruce between the needle production and height
28 increment, and needle production correlated significantly with the temperatures of the
29 previous March and October. The results presented here, however, indicate that the annual
30 height increment of southern alpine spruce is relatively insensitive to climate. We could find

14 of 26
13
1 no significant relationship between height growth of Norway spruce, and climate of the current
2 or previous growing season. The average height growth at the two sites is similar, despite the
3 large between-site differences in summer temperature and growing season length. The
4 within-site and between-site correlations show some links between height growth and both
5 ring width and density, as expected from a growth proxy, however no significant correlations
6 were found with any of the measured climate parameters. The likely explanation is that in
7 such dense and intensively managed spruce stands, local factors, including thinning,
8 dominate over regional climate.
9 Stable carbon isotope (δ13
C) analysis of tree-rings has demonstrated significant potential in
10 dendroclimatological studies (Gagen et al., 2006; Gagen et al., 2007; McCarroll and Loader,
11 2004). In dry conditions the δ13
C signal is primarily dominated by stomatal conductance to
12 CO2, and δ C accumulated in tree-rings correlates well with factors influencing soil moisture
13 status (and water stress in trees) e.g. vapour pressure deficit, precipitation and relative
14 humidity (Gagen et al., 2004; Robertson et al., 1997). However, under conditions where
15 moisture is not limiting, the internal partial pressure of CO2 is controlled primarily by
16 photosynthetic rate and δ13
C variability relates directly to the amount of light received by the
17 plant for photosynthesis (photon flux) which may be correlated indirectly with temperature and
18 sunshine hours (McCarroll and Pawellek, 2001; McCarroll and Loader, 2004).
19 Stable carbon isotope ratios have not previously been measured from spruce trees in this
20 region, but the results are very encouraging. Despite the differences between the two sites,
21 the carbon isotope results carry the same strong signal of summer temperatures at both sites.
22 The dominance of regional climate over local site conditions is confirmed by the strengthening
23 of the correlation with temperature when the values from the two sites are combined.
24 Although the two site chronologies are strongly correlated, they differ in terms of the range of
25 values, and thus their sensitivities. Some caution is therefore required in combining the data
26 from different sites, and although the δ13
C data do not need to be indexed to remove growth
27 trends, it may be necessary to stabilise the variance. In the example used here, stabilising the
28 variance prior to averaging increased the strength of the correlation with climate and
29 improved the verification statistics.
30

15 of 26
1 Conclusions
2 The results presented here suggest that the sensitivity of spruce trees to climate and climate
3 change is likely to be very variable between sites. Increased temperatures are likely to
4 stimulate growth at cool high altitude sites, which is the natural range of spruce distribution in
5 this area, but to be deleterious at lower altitudes where spruce has been widely planted. With
6 increasing summer temperatures radial growth is likely to decline (Pichler and Oberhuber,
7 2007; Reichstein et al., 2007). Water stress will become more common, increasing
8 susceptibility to other impacts, including insect outbreaks, disease and wind throws (Jakša,
9 2007), which are amongst the most severe threats to forest management in this region.
10 Although spruce is now very widespread in the southeastern alpine region, and covers a wide
11 altitudinal range, it would seem that there is limited potential for extracting a climate signal
12 from the ring widths alone. Local site conditions and different forest management practices
13 can dominate over the regional climate signal, and response to the same climate driver can
14 work in opposite directions at different sites. It would be necessary to choose sites very
15 carefully to maximise response to the signal of choice. Maximum latewood density appears to
16 be a better climate proxy than tree ring widths, responding most strongly to the temperature of
17 September. The pinning results presented here suggest that this is likely to reflect inter-
18 annual variations in lignification after cell division has ceased (Gindl et al., 2000; Gričar et al.,
19 2005). The relationship between maximum density and mean September temperature
20 appears, from the results presented here, to be strong and consistent enough to be useful for
21 palaeoclimate reconstruction. Height increment, in contrast, appears to carry no clear climate
22 signal and at the sites studied is likely to have been dominated by local stand dynamics.
23 The most promising palaeoclimate proxy identified here is the stable carbon isotope ratios of
24 the latewood cellulose. These are strongly correlated with mid summer temperatures
25 (July/August), and the relationship is consistent between sites. These findings are in
26 agreement with studies elsewhere, which suggest that stable isotopes are less sensitive to
27 local site conditions and disturbance than the growth proxies (Gagen et al., 2004; Loader et
28 al., 2007; McCarroll and Pawellek, 2001). An unexpected result here is that, although the
29 dominant climate signal at the two sites was the same, and the two isotope chronologies are

16 of 26
1 strongly correlated, there is a clear difference in sensitivity. This calls for caution in combining
2 stable isotope data from different sites simply on the basis of strong correlations.
3
4 Acknowledgements
5 The work was funded by grants from European Union project (Pine: EVK2-CT-2002-00136
6 and Millennium: 017008). We are grateful to Martin Zupančič and Peter Cunder from the
7 Department of Wood Science and Technology, Biotechnical Faculty, University of Ljubljana;
8 Pekka Närhi and Tarmo Aalto from Metla Rovaniemi research unit for their help in the field
9 and laboratory; Jonathan Woodman-Ralph and Paula Santillo, Swansea University for their
10 dedication and assistance in sample preparation. We are indebted to the Slovenian Forest
11 Service, regional units Bled and Kranj for enabling us to complete the experimental work in
12 the field. N.J. Loader acknowledges support from the UK NERC NE/C511805/1 and
13 NE/B501504/1. T. Levanič acknowledges travel grant from British Council Partnership in
14 Science Program.
15
16 References
17
18 Baillie MGL, Pilcher JR (1973) A simple cross-dating programme for tree-ring research. Tree-
19 Ring Bulletin 33: 7-14
20 Briffa KR, Jones PD (1990) Basic chronology statistics and assessment. In: Cook ER,
21 Kairiukstis LA (eds) Methods of dendrochronology: applications in the environmental
22 sciences. Kluwer academic publishers, Dordrecht, Boston, London, pp 137-152
23 Cook ER (1985) Time series analysis approach to tree ring standardization. University of
24 Arizona, Tucson
25 Cook ER, Briffa K, Shiyatov S, Mazepa V (1990) Tree-Ring Standardization and Growth
26 Trend Estimation. In: Cook ER, Kairiukstis LA (eds) Methods of dendrochronology:
27 applications in the environmental sciences. Kluwer academic publishers, Dordrecht,
28 Boston, London, pp 104-162
29 Cook ER, Briffa KR, Jones PD (1994) Spatial regression methods in dendroclimatology: a
30 review and comparison of two techniques. International Journal of Climatology 14:
31 379-402
32 Cook ER, Holmes RL (1999) Program ARSTAN - chronology development with statistical
33 analysis (users manual for program ARSTAN). Laboratory of Tree-Ring Research,
34 University of Arizona, Tucson
35 Čufar K, Levanič T, Zupančič M (1995) Slovenija, regija za dendrokronoloske raziskave
36 (Slovenia, a region for dendrochronological investigations). Les 47: 133-136
37 Doak CC (1935) Evolution of foliar types, dwarf shoots, and cone scales of Pinus. Illinois
38 Biological Monographs XIII: 106
39 Eckstein D, Bauch J (1969) Beitrag zur Rationalisierung eines dendrochronologischen
40 Verfahrens und zur Analyse seiner Aussagesicherheit. Forstwissenschaftliches
41 Centralblatt 88: 230-250
42 Frank D, Esper J (2005) Characterization and climate response patterns of a high-elevation,
43 multi-species tree-ring network in the European Alps. Dendrochronologia 22: 107-121
44 Fritts HC (1976) Tree rings and climate. Academic Press, London, New York, San Francisco

17 of 26
1 Gagen M, McCarroll D, Edouard JL (2004) Latewood width, maximum density and stable
2 carbon isotope ratios of pine as palaeoclimate indicators in a dry sub-alpine
3 environment in the southern French Alps. Arctic, Antarctic and Alpine Research 36:
4 166-171
5 Gagen M, McCarroll D, Edouard JL (2006) Combining ring width, density, and stable carbon
6 isotope proxies to enhance the climate signal in tree-rings: an example from the
7 southern French Alps. Climatic Change 78: 363-379
8 Gagen M, McCarroll D, Loader NJ, Robertson I, Jalkanen R, Anchukaitis KJ (2007)
9 Exorcising the ‘segment length curse’: summer temperature reconstruction since AD
10 1640 using non-detrended stable carbon isotope ratios from pine trees in northern
11 Finland. The Holocene 17: 435-446
12 Gindl W, Grabner M, Wimmer R (2000) The influence of temperature on latewood lignin
13 content in treeline Norway spruce compared with maximum density and ring width.
14 Trees - Structure and Function 14: 409-414
15 Gričar J, Čufar K, Oven P, Schmitt U (2005) Differentiation of terminal latewood tracheids in
16 silver fir during autumn. Annals of Botany 95: 959-965
17 Grissino-Mayer HD (2001) Evaluating crossdating accuracy: A manual and tutorial for the
18 computer program COFECHA. Tree-Ring Research 57: 205-221
19 Holmes RL (1983) Computer-assisted quality control in tree-ring dating and measurement.
20 Tree-Ring Bulletin 43: 69-78
21 Jakša J (2007) Naravne ujme v gozdovih Slovenije / Natural disasters in Slovenian forests.
22 GozdV 65: 205-227
23 Jalkanen R, Aalto T, Kurkela T (1995) Development of needle retention in Scots pine (Pinus
24 sylvestris) in 1957-1991 in northern and southern Finland. Trees - Structure and
25 Function 10: 125-133
26 Jalkanen R, Aalto T, Kurkela T (1998) Revealing past needle density in Pinus spp. Scand. J.
27 For. Res. 13: 292-296
28 Kurkela T, Jalkanen R (1990) Revealing past needle retention in Pinus spp. Scand. J. For.
29 Res. 5: 481-485
30 Levanič T (2004) Ugotavljanje starosti dreves. In: Brus R (ed) Staro in debelo drevje v gozdu.
31 Biotehniška fakulteta, Oddelek za gozdarstvo in obnovljive gozdne vire, Ljubljana,
32 Slovenia
33 Lindner F (2000) Dendrochronological analysis of Norway spruce (Picea abies Karst.)
34 growing at various sites in Slovenia (Dendrokronološka analiza rasti smreke (Picea
35 abies Karst.) na različnih rastiščih v Sloveniji). University of Ljubljana, Ljubljana
36 Loader NJ, Robertson I, Barker AC, Switsur VR, Waterhouse JS (1997) An improved
37 technique for the batch processing of small wholewood samples to a-cellulose.
38 Chemical Geology 136: 313-317
39 Loader NJ, McCarroll D, Gagen M, Robertson I, Jalkanen R (2007) Extracting climatic
40 information from stable isotopes in tree rings. In: Dawson TE, Siegwolf RTW (eds)
41 Stable isotopes as indicators of Ecological Change. Elsevier Inc., New York, pp 27-48
42 Loader NJ, Santillo PM, Woodman-Ralph JP, Rolfe JE, Hall MA, Gagen M, Robertson I,
43 Wilson R, Froyd CA, McCarroll D (in press) Multiple stable isotopes from oak trees in
44 southwestern Scotland and the potential for stable isotope dendroclimatology in
45 maritime climatic regions. Chemical Geology
46 Mäkinen H, Nöjd P, Kahle H-P, Neumann U, Bjorn T, Mielikäinen K, Rohle H, Spiecker H
47 (2002) Radial growth of Norway spruce (Picea abies (L.) Karst.) across latitudinal and
48 altitudinal gradients in central and northern Europe. Forest Ecology and Management
49 171: 243-259
50 Mäkinen H, Nöjd P, Kahle H-P, Neumann U, Tveite B, Mielikainen K, Rohle H, Spiecker H
51 (2003) Large-scale climatic variability and radial increment variation of (Picea abies
52 (L.) Karst. in central and northern Europe. Trees - Structure and Function 17: 173-
53 184
54 McCarroll D, Pawellek F (2001) Stable carbon isotope ratios of Pinus sylvestris from northern
55 Finland and the potential for extracting a climate signal from long Fennoscandian
56 chronologies. Holocene 11: 517-526
57 McCarroll D, Jalkanen R, Hicks S, Tuovinen M, Pawellek F, Gagen M, Eckstein D, Schmitt U,
58 Autio J, Heikkinen O (2003) Multi-proxy dendroclimatology: a pilot study in northern
59 Finland. The Holocene 13: 829-838

18 of 26
1 McCarroll D, Loader NJ (2004) Stable isotopes in tree rings. Quaternary Science Reviews 23:
2 771-801
3 McCarroll D, Loader NJ (2005) Isotopes in tree rings. In: Leng MJ (ed) Isotopes in
4 palaeoenvironmental research (developments in paleoenvironmental research).
5 Springer, Dordrecht, pp 67-116
6 National Research Council (2006) Surface temperature reconstructions for the last 2,000
7 years. National Academies Press, Washington
8 Pichler P, Oberhuber W (2007) Radial growth response of coniferous forest trees in an inner
9 Alpine environment to heat-wave in 2003. Forest Ecology and Management 242: 688-
10 699
11 Reichstein M, Ciais P, Papale D, Valentini R, Running S, Viovy N, Cramer W, Granier A,
12 Ogée J, Allard V, Aubinet M, Bernhofer C, Buchmann N, Carrara K, Grünwald T,
13 Heimann M, Heinesch B, Knohl A, Kutsch W, Loustau D, Manca G, Matteucci G,
14 Miglietta F, Ourcival JM, Pilegaard K, Pumpanen J, Rambal S, Schaphoff S, Seufert
15 G, Soussana J-F, Sanz M-J, Vesala T, Zhao M (2007) Reduction of ecosystem
16 productivity and respiration during the European summer 2003 climate anomaly: a
17 joint flux tower, remote sensing and modelling analysis. Global Change Biology 13:
18 634-651
19 Rinne KT, Boettger T, Loader NJ, Robertson I, Switsur VR, Waterhouse JS (2005) On the
20 purification of a-cellulose from resinous wood for stable isotope (H, C and O)
21 analysis. Chemical Geology 222: 75-82 22 Robertson I, Switsur VR, Carter AHC, Barker AC, Waterhouse JS, Briffa KR, Jones PD
23 (1997) Signal strength and climate relationship in 13
C/12
C ratios of tree ring cellulose
24 from oak in east England. Journal of Geophysical Research 102: 19507-19516
25 Rossi S, Deslauriers A, Morin H (2003) Application of the Gompertz equation for the study of
26 xylem cell development. Dendrochronologia 21: 33-40
27 Salminen H, Jalkanen R (2005) Modelling the effects of temperature on height increment of
28 Scots pine at high latitudes. Silva Fenica 39: 497-508
29 Sander C, Eckstein D (2001) Foliation of spruce in the Giant Mts. and its coherence with
30 growth and climate over the last 100 years. Annals of Forest Science 58: 155-164
31 Schmidt B (1987) Ein dendrochronologischer Befund zum Bau der Stadtmauer der Colonia
32 Ulpia Traiana. Bonner Jahrbücher 187: 495-503
33 Schweingruber FH, Fritts HC, Bräker OU, Drew LG, Schär E (1978) The X-ray technique as
34 applied to dendrochronology. Tree Ring Bulletin 38: 61-91
35 Schweingruber FH (1989) Tree rings: basics and applications of dendrochronology. Kluwer
36 Academic Publishers, Dordrecht, Boston, London
37 Schweingruber FH, Eckstein D, Serre-Bachet F, Bräker OU (1990) Identification, presentation
38 and interpretation of event years and pointer years in dendrochronology.
39 Dendrochronologia 8: 9-38
40 Stanovnik M (1998) Dendroecological analysis of Norway spruce (Picea abies Karst.) from
41 chill sites in the area of Notranjski Snežnik. University of Ljubljana, Ljubljana
42 Wahl ER, Ammann CM (2007) Robustness of the Mann, Bradley, Hughes reconstruction of
43 Northern Hemisphere surface temperatures: examination of criticisms based on the
44 nature and processing of climate evidence. Climatic Change 85: 33-69
45 Wigley TML, Briffa KR, Jones PD (1984) On the average value of correlated time series, with
46 applications in dendroclimatology and hydrometeorology. Journal of Climate and
47 Applied Meteorology 23: 201-213
48 Wolter EK (1968) A new method for marking xylem growth. Forest Science 14: 102-104
49
50
51

19 of 26
1 List of tables
2
3 Table 1: Number of trees, cores and actual number of samples used in the analysis for each
4 site. TRW=tree-ring width, HI=height increment, MXD=maximum latewood density,
5 13
C=stable carbon isotope composition, WFD=wood formation dynamics.
6
7 Table 2: Mean values and range for all studied proxies for Sorško polje and Pokljuka.
8 TRW=tree-ring width, MXD=maximum latewood density, HI=height increment, 13
C=stable
9 carbon isotope composition.
10
11 Table 3: Inter- and intra-site correlations between proxies of Norway spruce. TRW=tree-ring
12 width, MXD=maximum latewood density, HI=height increment, 13
C=stable carbon isotope
13 composition; statistical significance level: * - 5%; ** - 1%.
14
15 Table 4: Correlations between the averaged proxies of Sorško polje and Pokljuka; statistical
16 significance level: * - 5%; ** - 1%.
17
18 Table 5: Measures of reconstruction accuracy for lowland site Sorško polje and high elevation
19 site Pokljuka and average thereof for both, forward and backward calibration / verification.
20
21 Table 6: Wood formation dynamics (WFD) in Norway spruce at Sorško polje and Pokljuka in
22 the years 2002, 2003 and 2004.
23
24
25

20 of 26
1 Table 1
2
Location Number of Number of cores / cross- Number of samples
trees sections used
SORŠKO POLJE
TRW 15 2 11
HI 15 cross-sections 13
MXD 15 1 13
13
C 5 1 3
WFD* 5 / year 150 samples / year 150 samples / year
POKLJUKA
TRW 15 2 12
HI 15 cross-sections 15
MXD 15 1 13
13
C 5 1 5
WFD* 5 / year 125 samples / year 125 samples / year
3
4 *number of samples in WFD section is calculated as number of weeks of pinning x number of
5 trees; on Sorško polje we did pinning 30 weeks on 5 trees and on Pokljuka 25 weeks on 5
6 trees
7
8

21 of 26
1 2
3 Table 2
4
Sorško polje Pokljuka
mean range mean range
TRW mm 2.3 0.5 – 3.7 2.0 1.5 – 2.7
MxD g.cm-3
1.02 0.91 – 1.15 0.86 0.73 – 0.94
HI cm.year-1
39.2 9.9 – 64.0 32.0 18.1 - 45.4
13
C ‰ –22.75 -24.22 to - –22.27 -23.40 to -
20.81
5
6
21.29

22 of 26
1 Table 3
2
a b c
Within Sorško polje Within Pokljuka Combined proxies
TRW MXD HI TRW MXD HI TRW MXD HI
MXD -0.04 0.06 -0.05 HI 0.32* 0.14 0.22 0.19 0.25 0.32*
13
C -0.14 -0.19 -0.18 0.08 0.10 0.23 -0.10 -0.02 -0.05
3
4
5

23 of 26
1 Table 4
Between-site correlations
s= Sorško polje; p= Pokljuka
2
3
4
TRWs MXDs HIs 13
C s
TRWp 0.10 -0.24 0.12 0.12
MXDp -0.02 0.40* 0.18 0.07
HIp -0.17 0.19 -0.19 0.13
13
C p -0.17 -0.20 -0.15 0.67**

24 of 26
ver
13 13
13 13
1 Table 5
2
FORWARD
Calibration: 2002-1981
Verification: 1982-1960
BACKWARD
Calibration:1982-1960
Verification: 2002-1981
δ13C
3
s
p
avg
inx
JA 0.61 0.30 1.76 0.43 -1.54 0,14 1,97 0,41 -1,01
4 Legend:
5 mse – mean squared error; RE – reduction of error statistics; CE – coefficient of efficiency; R2 – squared correlation
6 of the verification period; TRWs, MXDs, HIs, δ Cs – proxies for Sorško polje; TRWp, MXDp, HIp, δ Cp – proxies for
7 Pokljuka; TRW, MXDavg, HIavg, δ Cavg – combined proxies for Sorško polje and Pokljuka; δ Cinx - indexed
8 isotope proxy – values were standardised to equalise variance and then combined into average for both
9 sites; JA –July-August temperature combination; S –September average monthly temperature; -AS –
10 previous August-September temperature combination
11
12
Target
variable
Pearson’s
r-value R2
ver mse RE CE R2 ver mse RE CE
TRWs JA -0.43 0.12 2.61 0.15 -2.76 0,04 2,36 0,30 -1,41
TRWp JA 0.41 0.01 2.29 0.25 -2.30 0,17 3,70 -0,10 -2,78
TRWavg JA -0.19 0.11 3.76 0.01 -3.41 0,00 3,18 0,05 -2,24
MXDs S 0.61 0.50 1.14 0.45 -0.35 0,29 1,30 0,40 -0,39
MXDp S 0.55 0.42 1.65 0.20 -0.95 0,37 1,75 0,19 -0,87
MXDavg S 0.51 0.52 1.63 0.21 -0.93 0,20 1,95 0,10 -1,08
HIs -AS -0.07 0.09 3.33 -0.20 -3.72 0,09 3,13 0,01 -1,85
HIp -AS 0.14 0.19 3.08 -0.12 -3.37 0,19 3,39 -0,14 -4,03 HIavg -AS 0.03 0.00 2.84 -0.03 -3.03 0,00 3,00 -0,01 -3,45
δ13C JA 0.66 0.12 1.37 0.55 -0.98 0,20 1,52 0,55 -0,55
δ13C JA 0.68 0.32 1.38 0.55 -1.00 0,19 1,46 0,57 -0,49
δ13
C JA 0.70 0.31 1.29 0.58 -0.85 0,21 1,27 0,62 -0,30

25 of 26
1 Table 6
2
3
Average number of
cells in tree-ring
Average tree-ring
width (mm)
Average number of
cells produced per
day during the
Sorško polje Pokljuka
2002 2003 2004 2002 2003 2004
growing season
4
5
6
7
62.7 36.3 50.5 36.1 45.5 41.4
1.73 1.06 1.62 1.23 1.42 1.25
0.39
0.41
0.43
0.46
0.60
0.47

26 of 26
1 List of figures
2
3 Figure 1: Location of the experimental sites Pokljuka and Sorško polje (black circle) and
4 meteorological stations (white square).
5
6 Figure 2: Climate diagram of the meteorological stations Ljubljana, for the period 1900 - 2006
7 used in both Sorško polje and Pokljuka site (a). Meteorological station Mrzli studenec
8 (reference for the Pokljuka site) for the period 1953 - 2002 was not used in calculations
9 because of more than 60% missing values (b).
10
11 Figure 3: Raw and corrected / indexed chronologies of tree-ring width, maximum latewood
12 density, height increment and stable carbon isotopes of Norway spruce for Sorško polje and
13 Pokljuka for the common period 1960 - 2002.
14
15 Figure 4: Correlations between proxies of Norway spruce and mean monthly temperature and
16 monthly sum of precipitation for Sorško polje and Pokljuka for a period 1960-2002.
17 Combinations of months: MJ, JJ, JA, MJJ, JJA, MJJA and MJJAS are combinations of mean
18 temperatures in May, June, July, August and September. Dashed horizontal line represents
19 95% significance level for Pearson’s correlation coefficient at given degrees of freedom.
20
21 Figure 5: Onset, duration and cessation of cambial activity in Norway spruce at Sorško polje
22 (gray bars) and Pokljuka (white bars) in the growing seasons 2002–2004. Error bars indicate
23 one standard deviation of onset and cessation of cambial activity among trees.
24
25
26
27
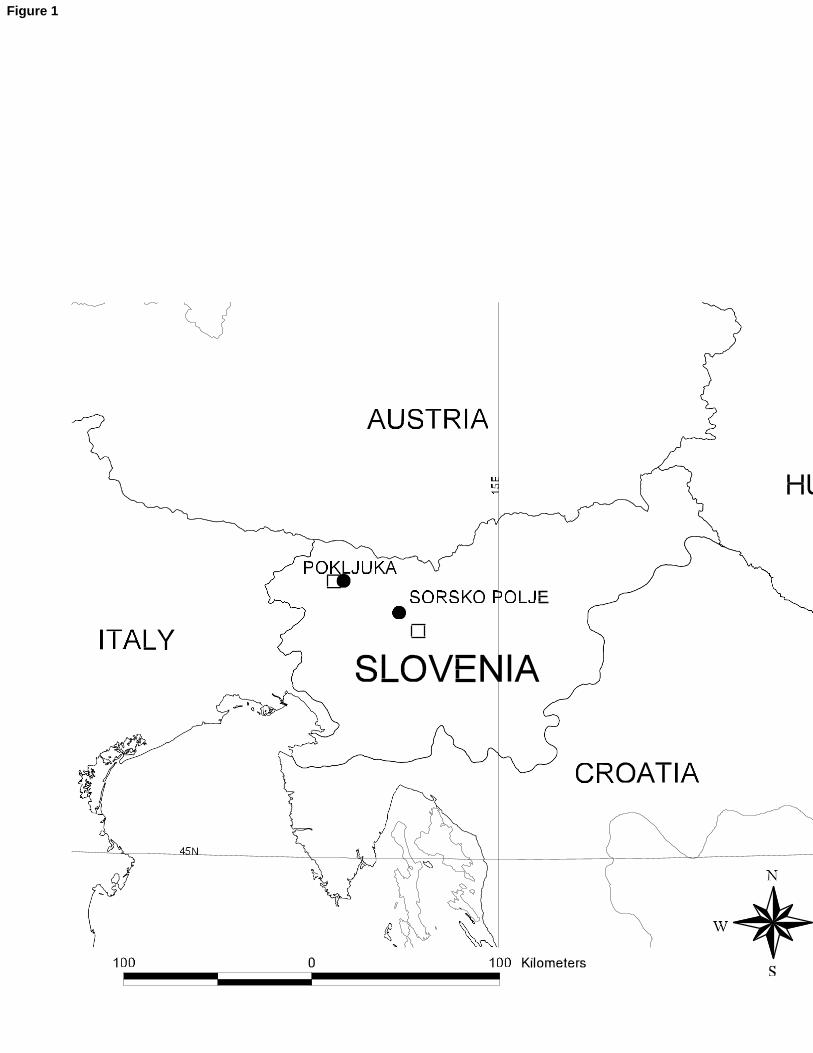
Figure 1

Figure 2

Figure 3
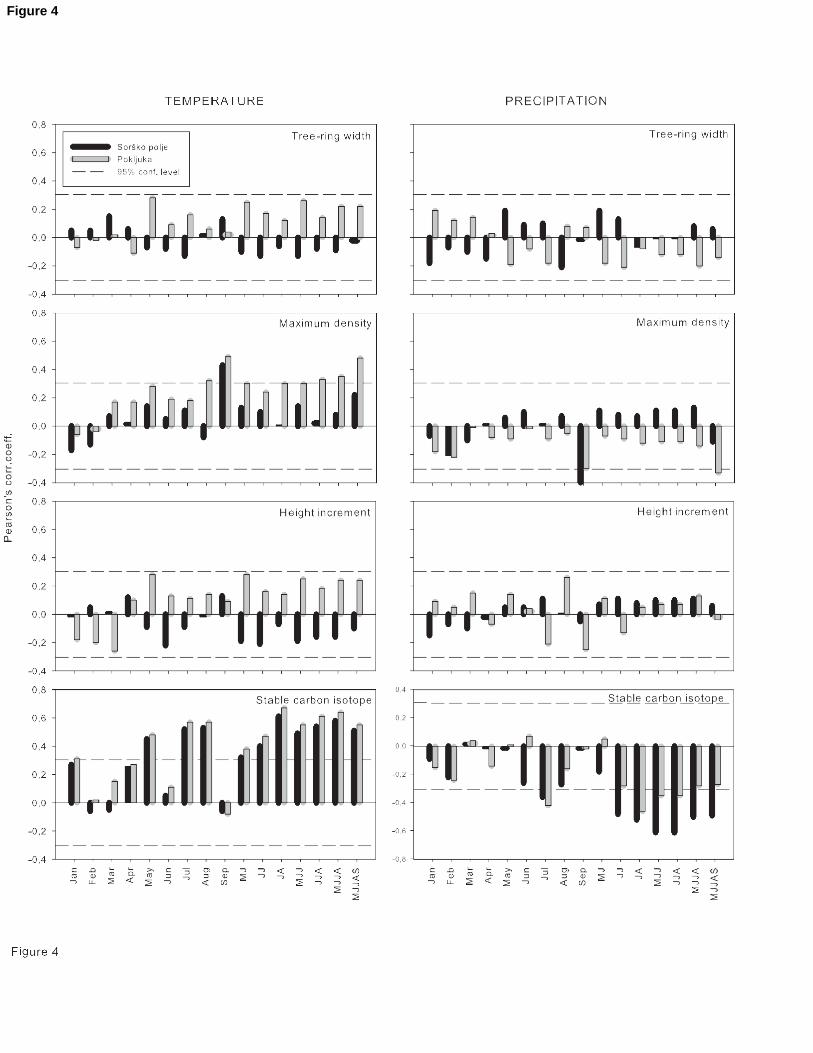
Figure 4

Figure 5


![Cronfa - Swansea University Open Access Repository · ô ½ ·W=m] Y](https://img.dokumen.tips/doc/110x75/5e086d1104eac94d302c30f1/cronfa-swansea-university-open-access-repository-wm-y.jpg)

