Embed Size (px)
Citation preview

ServiceabilityCriteria for LRFD
Composite Floors
Roberto T. Leon
AuthorRoberto T. Leon is associateprofessor in the Department of Civiland Mineral Engineering at theUniversity of Minnesota. Heteaches courses in structural steeldesign, construction materials, andearthquake engineering. Hereceived a bachelor of science incivil engineering from the Univer-sity of Massachusetts at Amherst,a master of science in structuralengineering from Stanford Univer-sity, and a Ph.D. from the Univer-sity of Texas, at Austin. He is aregistered professional engineer inMinnesota and is active on techni-cal committees of the American In-stitute of Steel Construction,American Society of Civil En-gineers, Structural Stability Re-search Council and the AmericanConcrete Institute.
Dr Leon's research interestscenter on behavior of semi-rigidconnections, behavior of com-posite joists, bridge rating andrehabilitation, and serviceabilitycriteria for composite members. Hehas conducted extensive ex-perimental research on compositeand reinforced concrete membersand connections under static anddynamic loads, as well as field testson bridges, buildings and illumina-tion towers.
SummaryThe trend toward limit state designcodes for steel and compositestructures has resulted on an em-phasis of strength requirementsover serviceability requirements,particularly for codes issued in theUnited States. As a result, the Loadand Resistance Factor DesignSpecification (LRFD), can producesubstantial economics in materials(10% to 15%) for LRFD-designedcomposite beams over ASD-designed ones. Many of thesavings, however, come from utiliz-ing very shallow sections over longspans. This raises some questionsas to potential serviceabilityproblems since the LRFDSpecification contains no specificserviceability criteria.
This paper addresses service-ability issues, primarily short andlong-term deflections for compositebeam floors designed to Americanspecifications. It describes theresults of tests conducted to deter-mine the effects of (1) camberingand shoring, (2) creep andshrinkage, and (3) end restraint ondeflections of slender compositegirders. It discusses the pertinentlimit states, and offers recommen-dations and guidance on how tocalculate deflections for compositefloors.
18-1
© 2003 by American Institute of Steel Construction, Inc. All rights reserved.This publication or any part thereof must not be reproduced in any form without permission of the publisher.
SERVICEABILITY CRITERIA FOR LRFD COMPOSITE FLOORS
INTRODUCTION
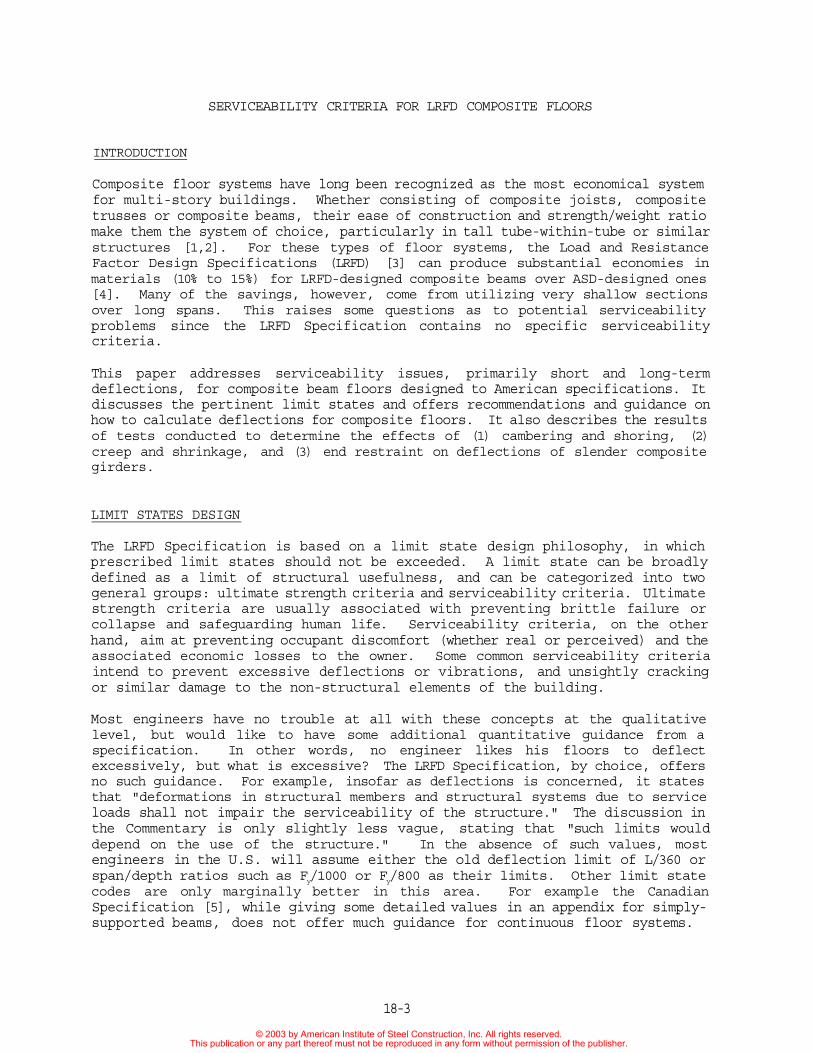
Composite floor systems have long been recognized as the most economical systemfor multi-story buildings. Whether consisting of composite joists, compositetrusses or composite beams, their ease of construction and strength/weight ratiomake them the system of choice, particularly in tall tube-within-tube or similarstructures [1,2]. For these types of floor systems, the Load and ResistanceFactor Design Specifications (LRFD) [3] can produce substantial economies inmaterials (10% to 15%) for LRFD-designed composite beams over ASD-designed ones[4]. Many of the savings, however, come from utilizing very shallow sectionsover long spans. This raises some questions as to potential serviceabilityproblems since the LRFD Specification contains no specific serviceabilitycriteria.
This paper addresses serviceability issues, primarily short and long-termdeflections, for composite beam floors designed to American specifications. Itdiscusses the pertinent limit states and offers recommendations and guidance onhow to calculate deflections for composite floors. It also describes the resultsof tests conducted to determine the effects of (1) cambering and shoring, (2)creep and shrinkage, and (3) end restraint on deflections of slender compositegirders.
LIMIT STATES DESIGN
The LRFD Specification is based on a limit state design philosophy, in whichprescribed limit states should not be exceeded. A limit state can be broadlydefined as a limit of structural usefulness, and can be categorized into twogeneral groups: ultimate strength criteria and serviceability criteria. Ultimatestrength criteria are usually associated with preventing brittle failure orcollapse and safeguarding human life. Serviceability criteria, on the otherhand, aim at preventing occupant discomfort (whether real or perceived) and theassociated economic losses to the owner. Some common serviceability criteriaintend to prevent excessive deflections or vibrations, and unsightly crackingor similar damage to the non-structural elements of the building.
Most engineers have no trouble at all with these concepts at the qualitativelevel, but would like to have some additional quantitative guidance from aspecification. In other words, no engineer likes his floors to deflectexcessively, but what is excessive? The LRFD Specification, by choice, offersno such guidance. For example, insofar as deflections is concerned, it statesthat "deformations in structural members and structural systems due to serviceloads shall not impair the serviceability of the structure." The discussion inthe Commentary is only slightly less vague, stating that "such limits woulddepend on the use of the structure." In the absence of such values, mostengineers in the U.S. will assume either the old deflection limit of L/360 orspan/depth ratios such as Fy/1000 or Fy/800 as their limits. Other limit statecodes are only marginally better in this area. For example the CanadianSpecification [5], while giving some detailed values in an appendix for simply-supported beams, does not offer much guidance for continuous floor systems.
18-3
© 2003 by American Institute of Steel Construction, Inc. All rights reserved.This publication or any part thereof must not be reproduced in any form without permission of the publisher.

It is interesting to note that traditional criteria such as L/360 have servedwell for many years, and probably need not be changed. In general whenserviceability problems arise it is because the deflections were not calculatedcorrectly. Assuming that human error is not involved, the most likely sourceof error is the model used to calculate the deformations. It is the author'scontention that our current models for calculating deflections of compositefloors are inadequate, and are responsible for many of the serviceabilityproblems found in the field. Four key areas where current models are inadequateare (1) the calculation of stresses after the construction loads have beenapplied, (2) the calculation of the moment of inertia to be used, (3) the long-term effects of creep and shrinkage, and (4) the effect of continuity and endrestraint.
In this context it is important to highlight the fact that limit states designtheory considers the violation of a modelling assumption to be a violation ofa limit state. In the particular case of composite beams, for example, thismeans that calculating service load deflections using elastic theory is validonly insofar as the system remains elastic. This may seem like a statement ofthe obvious, but in the LRFD Specification there is no check to insure that thebeam has remained elastic under the service live loads. In the followingsections modelling shortcomings will be discussed in some detail. Thesetheoretical considerations will then be illustrated with the results of someexperimental data generated recently.
INITIAL STRESSES
The ASD Specification contained an equation (Eq. (1.11-2)) which effectivelyassured elastic behavior at service loads for most design situations in unshoredconstruction. This equation:
Eq. [1]
where was the transformed moment of inertia, was the live load moment,was the dead load moment, and was the moment of inertia of the beam alone,effectively limited the section modulus to be used in calculating dead loadstresses if the dead load moment was high. As pointed out before, no similarcheck is required in LRFD. This is an important point because under the LRFDprovisions the selection of a steel section to be used in a composite floor willgenerally be governed by construction loads. Thus the steel beam maybe stressednear yield before the live loads are applied.
To ensure that elastic analysis is applicable to unshored construction, thestress due to the service live load must be less than the differencebetween the actual steel yield stress and the dead load stresses dueto the weight of the concrete and other loads applied before the concretehardened, the stresses due to cambering , and any residual stressespresent after rolling of the beam. This can be written as:
In general it is safe and conservative to assume the nominal as as thematerial supplied will almost always exceed its nominal yield strength. Thecalculation of is not as simple, since it implies an accurate knowledge of
18-4
Eq. [2]
© 2003 by American Institute of Steel Construction, Inc. All rights reserved.This publication or any part thereof must not be reproduced in any form without permission of the publisher.
all dead loads, including partitions and permanent equipment. From the practicalstandpoint is unknown, and only very rough estimates can be made for
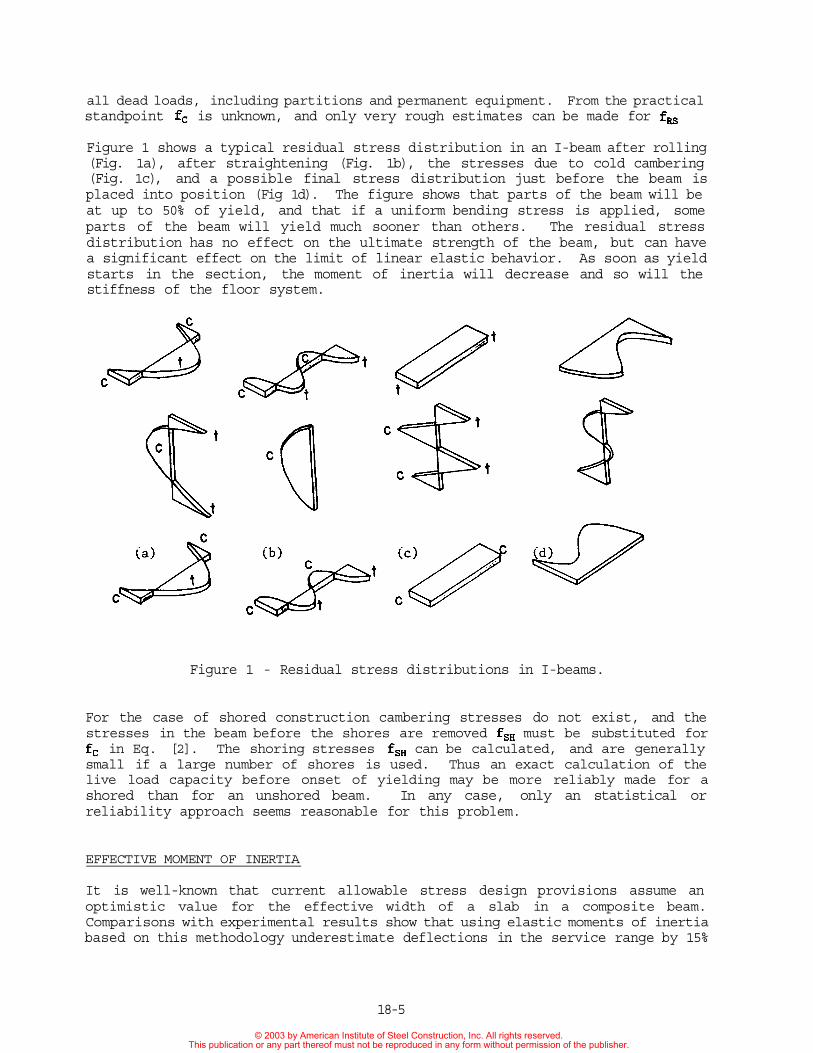
Figure 1 shows a typical residual stress distribution in an I-beam after rolling(Fig. 1a), after straightening (Fig. 1b), the stresses due to cold cambering(Fig. 1c), and a possible final stress distribution just before the beam isplaced into position (Fig 1d). The figure shows that parts of the beam will beat up to 50% of yield, and that if a uniform bending stress is applied, someparts of the beam will yield much sooner than others. The residual stressdistribution has no effect on the ultimate strength of the beam, but can havea significant effect on the limit of linear elastic behavior. As soon as yieldstarts in the section, the moment of inertia will decrease and so will thestiffness of the floor system.
Figure 1 - Residual stress distributions in I-beams.
For the case of shored construction cambering stresses do not exist, and thestresses in the beam before the shores are removed must be substituted for
in Eq. [2]. The shoring stresses can be calculated, and are generallysmall if a large number of shores is used. Thus an exact calculation of thelive load capacity before onset of yielding may be more reliably made for ashored than for an unshored beam. In any case, only an statistical orreliability approach seems reasonable for this problem.
EFFECTIVE MOMENT OF INERTIA
It is well-known that current allowable stress design provisions assume anoptimistic value for the effective width of a slab in a composite beam.Comparisons with experimental results show that using elastic moments of inertiabased on this methodology underestimate deflections in the service range by 15%
18-5
© 2003 by American Institute of Steel Construction, Inc. All rights reserved.This publication or any part thereof must not be reproduced in any form without permission of the publisher.

to 25%. Some of the most recent evidence in this area comes from the work ofVallenilla and Bjorhovde [6] and Taylor [7], A typical figure from the latter(Fig. 2) underscores the problem. Typical results using this procedure can beimproved by accounting for (1) shear deformations [7], (2) the flexibility ofthe studs [7], and/or (3) using a different definition for effective width [6].The former two factors are seldom included in practice, and the latter is onlya convenient method to better fit the data.
Figure 2 - Comparison of measured and calculated deflections [7].
Some of the work cited above, plus earlier evidence, provided impetus for a muchmore conservative approach to the calculation of moments of inertia in the newLRFD specifications. The calculations in the LRFD manual are based on anultimate strength analysis, with a stress block smaller than that assumed inlinear elastic transformed section analysis. In general the LRFD procedurelimits the size of the concrete flange to the smallest of (total force onthe steel section) or to the summation of (total force on shear studs). Whilethis assumption of equivalent concrete flange is entirely reasonable in ultimatestrength calculations, the deflections under service loads will be atsignificantly lower stress levels. Therefore the use of a "plastic" or lowerbound moment of inertia (LBMI) for a computation in the elastic range istheoretically questionable. On the other hand, the procedure typically willresult in better correlation with experimental results, since the plastic momentof inertia will be 15% to 30% lower than the elastic one. However, as is thecase with the use of alternative effective width definitions, we are no closerby using a LBMI to discovering the behavior mechanisms which will explain thediscrepancies between tests and theory.
It should be also noted that most calibrations for effective width have been doneon tests carried out with a single point load at the middle rather than withdistributed loads. Although the yield and ultimate moment capacity are not verysensitive to the load configuration, the deflections can be significantlyaffected by the shear distribution along the beam. This is because the slip andshear deformations, which can be used to explain the differences between themeasured and calculated deflections [7], are a function of the loadingconfiguration. In particular, a concentrated load tends to impose large localuplift forces on the studs changing the distribution of shear stresses along the
18-6
© 2003 by American Institute of Steel Construction, Inc. All rights reserved.This publication or any part thereof must not be reproduced in any form without permission of the publisher.

beam. Near the load point almost 80% of the shear stress is carried by the slab,and there is a significant difference on this distribution if the load is appliedto the top of the slab or to the bottom beam flange [8].
LONG TERM DEFLECTIONS
One of the most common problems encountered in construction is excessivedeflections and cracking of composite floors within 6 to 24 months after the endof construction. The most likely explanation for these problems is the lack ofcalculation of creep and shrinkage effects on the concrete slab.
Creep and shrinkage of concrete are generally treated together because they sharesome basic characteristics. First, the dimensional instabilities know as creepand shrinkage arise from the removal of absorbed water from the cement paste,and are partly reversible. Second, most of the factors that influence creep alsoaffect shrinkage, resulting in very similar the strain vs. time curves for botheffects. Finally, the magnitude of creep and shrinkage strains in unrestrainedconcrete specimens is similar (between 600 and 1000 microstrain).
In many cases deflections due to creep and shrinkage can be ignored if certainspan-to-depth ratios are adhered to or if rigid continuous construction is used.In continuous reinforced concrete construction creep and shrinkage generally actagainst one another, have about the same order of magnitude, and their net effectis to cancel each other and to produce small net deflections. In simply-supportedcomposite construction, on the other hand, the effects of creep and shrinkageare generally additive, have the same order of magnitude, and it is thereforeunconservative to ignore their contribution when spans are long and/or the beamsare shallow.
Shrinkage
When a floor slab is first cast two types of shrinkage, thermal and dryingshrinkage, will occur. Thermal shrinkage is associated with the cooling of themember, while drying shrinkage is associated with the moisture loss. For mostpractical situations in buildings, the thermal shrinkage can be ignored. On theother hand, drying shrinkage can induce appreciable deflections.
Two studies conducted in Canada by Robinson [9] and Brattland and Kennedy [10]indicate that the centerline deflection of typical composite beams and trussesdue to drying shrinkage can approach L/1200 to L/1000. Figure 3 shows some ofthe results by Robinson on a W16x36 with a 5.5 in. slab on 3 in. deck. Thespecimen had a 30 ft. span and a slab width of 7.5 ft, and used normal-weightconcrete. Most of the measured shrinkage took place within the first 40 daysafter casting and amounted to about L/1200.
The amount of drying shrinkage will depend on the mix proportions, the age ofthe concrete, the ambient humidity and the geometry of the member. The two mostcommonly used procedures for estimating drying shrinkage are those proposed byComite Eurointernationale du Beton (CEB) and the American Concrete Institute(ACI) Committee 209 [11].
18-7
© 2003 by American Institute of Steel Construction, Inc. All rights reserved.This publication or any part thereof must not be reproduced in any form without permission of the publisher.
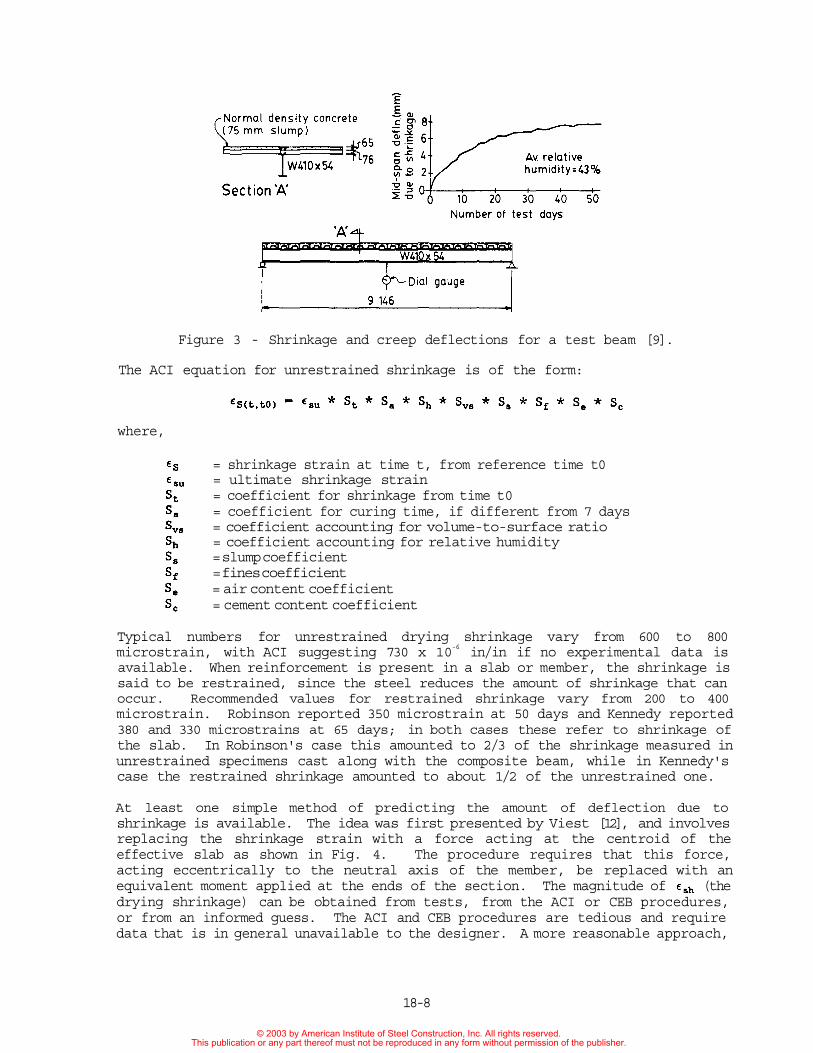
Figure 3 - Shrinkage and creep deflections for a test beam [9].
The ACI equation for unrestrained shrinkage is of the form:
where,
Typical numbers for unrestrained drying shrinkage vary from 600 to 800microstrain, with ACI suggesting 730 x 10-6 in/in if no experimental data isavailable. When reinforcement is present in a slab or member, the shrinkage issaid to be restrained, since the steel reduces the amount of shrinkage that canoccur. Recommended values for restrained shrinkage vary from 200 to 400microstrain. Robinson reported 350 microstrain at 50 days and Kennedy reported380 and 330 microstrains at 65 days; in both cases these refer to shrinkage ofthe slab. In Robinson's case this amounted to 2/3 of the shrinkage measured inunrestrained specimens cast along with the composite beam, while in Kennedy'scase the restrained shrinkage amounted to about 1/2 of the unrestrained one.
At least one simple method of predicting the amount of deflection due toshrinkage is available. The idea was first presented by Viest [12], and involvesreplacing the shrinkage strain with a force acting at the centroid of theeffective slab as shown in Fig. 4. The procedure requires that this force,acting eccentrically to the neutral axis of the member, be replaced with anequivalent moment applied at the ends of the section. The magnitude of (thedrying shrinkage) can be obtained from tests, from the ACI or CEB procedures,or from an informed guess. The ACI and CEB procedures are tedious and requiredata that is in general unavailable to the designer. A more reasonable approach,
18-8
= shrinkage strain at time t, from reference time t0= ultimate shrinkage strain= coefficient for shrinkage from time t0= coefficient for curing time, if different from 7 days= coefficient accounting for volume-to-surface ratio= coefficient accounting for relative humidity= slump coefficient= fines coefficient= air content coefficient= cement content coefficient
© 2003 by American Institute of Steel Construction, Inc. All rights reserved.This publication or any part thereof must not be reproduced in any form without permission of the publisher.
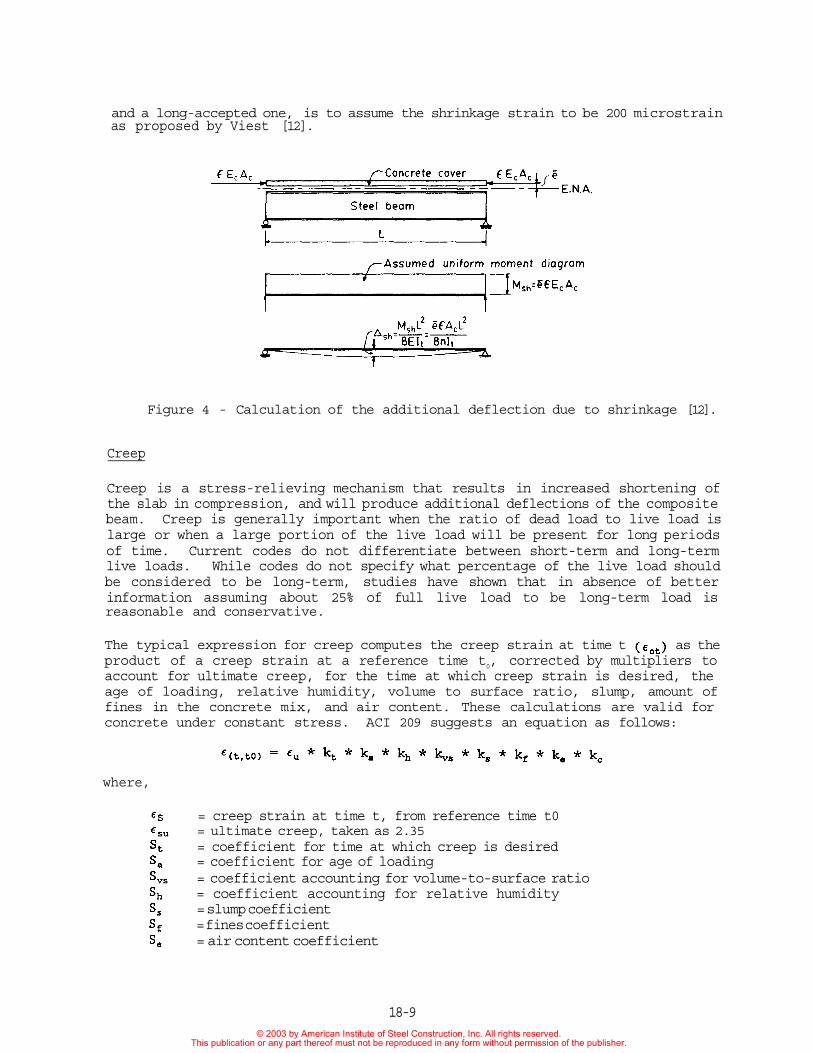
and a long-accepted one, is to assume the shrinkage strain to be 200 microstrainas proposed by Viest [12].
Figure 4 - Calculation of the additional deflection due to shrinkage [12].
Creep
Creep is a stress-relieving mechanism that results in increased shortening ofthe slab in compression, and will produce additional deflections of the compositebeam. Creep is generally important when the ratio of dead load to live load islarge or when a large portion of the live load will be present for long periodsof time. Current codes do not differentiate between short-term and long-termlive loads. While codes do not specify what percentage of the live load shouldbe considered to be long-term, studies have shown that in absence of betterinformation assuming about 25% of full live load to be long-term load isreasonable and conservative.
The typical expression for creep computes the creep strain at time t as theproduct of a creep strain at a reference time t0, corrected by multipliers toaccount for ultimate creep, for the time at which creep strain is desired, theage of loading, relative humidity, volume to surface ratio, slump, amount offines in the concrete mix, and air content. These calculations are valid forconcrete under constant stress. ACI 209 suggests an equation as follows:
where,
18-9
= creep strain at time t, from reference time t0= ultimate creep, taken as 2.35= coefficient for time at which creep is desired= coefficient for age of loading= coefficient accounting for volume-to-surface ratio= coefficient accounting for relative humidity= slump coefficient= fines coefficient= air content coefficient
© 2003 by American Institute of Steel Construction, Inc. All rights reserved.This publication or any part thereof must not be reproduced in any form without permission of the publisher.
= cement content coefficient
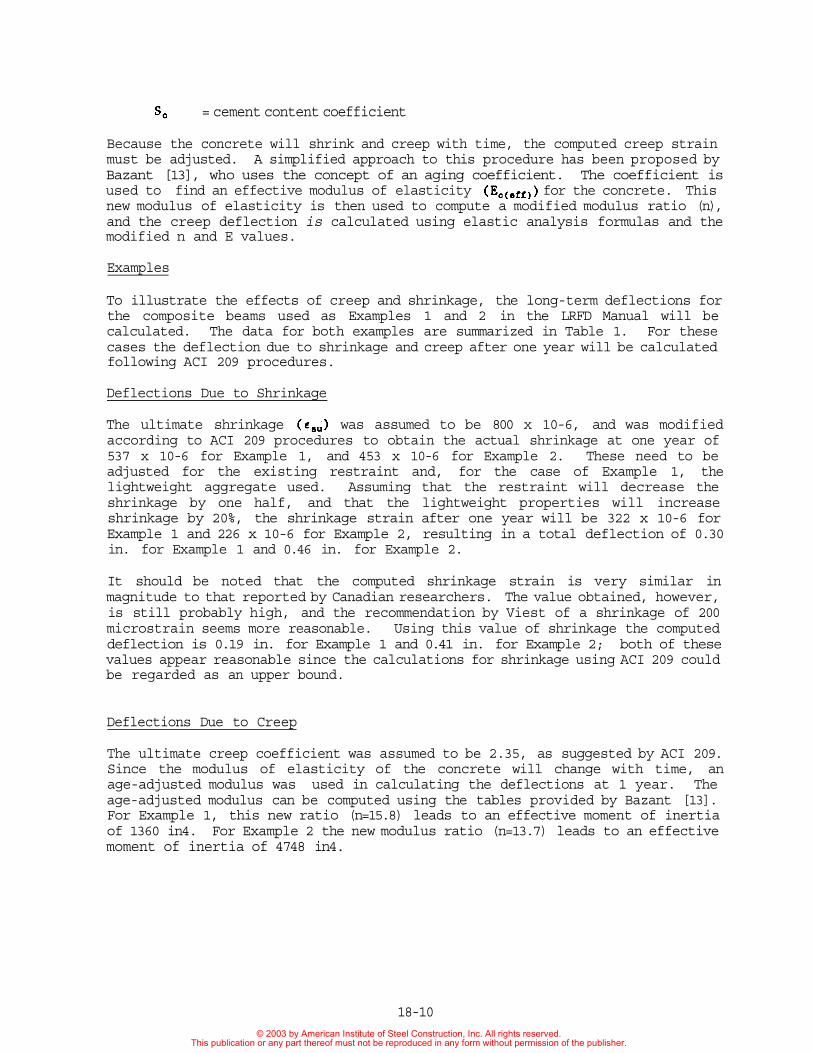
Because the concrete will shrink and creep with time, the computed creep strainmust be adjusted. A simplified approach to this procedure has been proposed byBazant [13], who uses the concept of an aging coefficient. The coefficient isused to find an effective modulus of elasticity for the concrete. Thisnew modulus of elasticity is then used to compute a modified modulus ratio (n),and the creep deflection is calculated using elastic analysis formulas and themodified n and E values.
Examples
To illustrate the effects of creep and shrinkage, the long-term deflections forthe composite beams used as Examples 1 and 2 in the LRFD Manual will becalculated. The data for both examples are summarized in Table 1. For thesecases the deflection due to shrinkage and creep after one year will be calculatedfollowing ACI 209 procedures.
Deflections Due to Shrinkage
The ultimate shrinkage was assumed to be 800 x 10-6, and was modifiedaccording to ACI 209 procedures to obtain the actual shrinkage at one year of537 x 10-6 for Example 1, and 453 x 10-6 for Example 2. These need to beadjusted for the existing restraint and, for the case of Example 1, thelightweight aggregate used. Assuming that the restraint will decrease theshrinkage by one half, and that the lightweight properties will increaseshrinkage by 20%, the shrinkage strain after one year will be 322 x 10-6 forExample 1 and 226 x 10-6 for Example 2, resulting in a total deflection of 0.30in. for Example 1 and 0.46 in. for Example 2.
It should be noted that the computed shrinkage strain is very similar inmagnitude to that reported by Canadian researchers. The value obtained, however,is still probably high, and the recommendation by Viest of a shrinkage of 200microstrain seems more reasonable. Using this value of shrinkage the computeddeflection is 0.19 in. for Example 1 and 0.41 in. for Example 2; both of thesevalues appear reasonable since the calculations for shrinkage using ACI 209 couldbe regarded as an upper bound.
Deflections Due to Creep
The ultimate creep coefficient was assumed to be 2.35, as suggested by ACI 209.Since the modulus of elasticity of the concrete will change with time, anage-adjusted modulus was used in calculating the deflections at 1 year. Theage-adjusted modulus can be computed using the tables provided by Bazant [13].For Example 1, this new ratio (n=15.8) leads to an effective moment of inertiaof 1360 in4. For Example 2 the new modulus ratio (n=13.7) leads to an effectivemoment of inertia of 4748 in4.
18-10© 2003 by American Institute of Steel Construction, Inc. All rights reserved.
This publication or any part thereof must not be reproduced in any form without permission of the publisher.
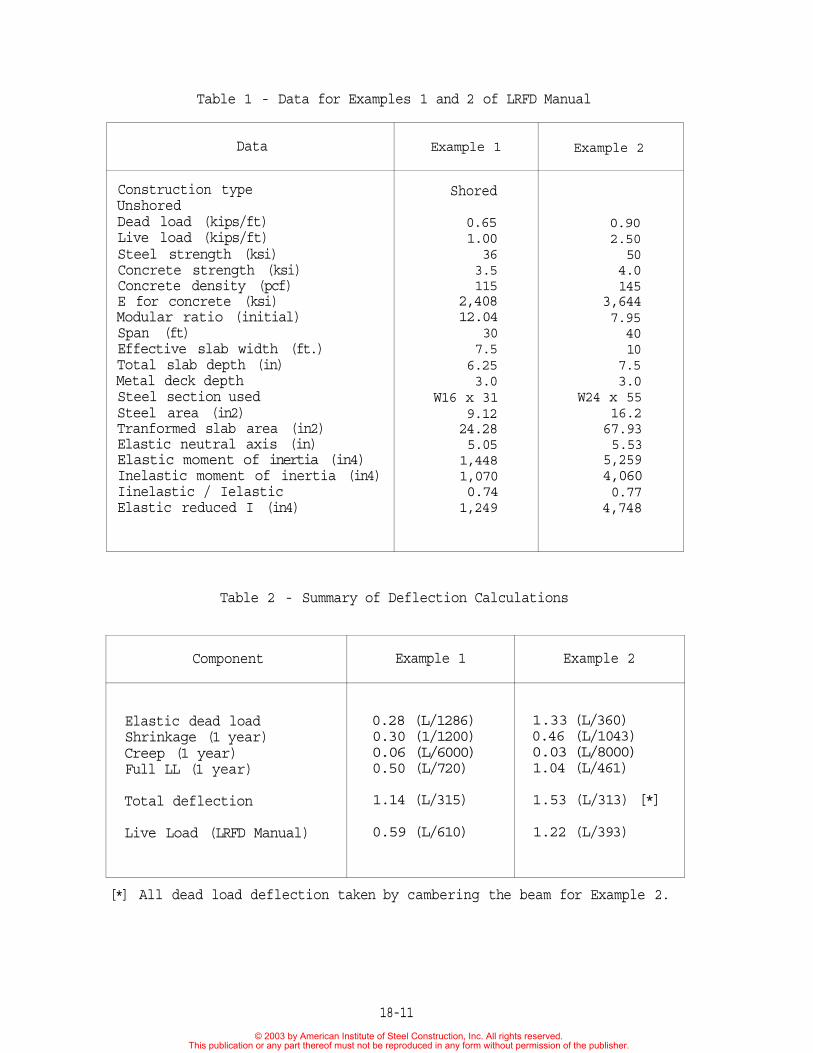
Table 1 - Data for Examples 1 and 2 of LRFD Manual
Data
Construction typeUnshoredDead load (kips/ft)Live load (kips/ft)Steel strength (ksi)Concrete strength (ksi)Concrete density (pcf)E for concrete (ksi)Modular ratio (initial)Span (ft)Effective slab width (ft.)Total slab depth (in)Metal deck depthSteel section usedSteel area (in2)Tranformed slab area (in2)Elastic neutral axis (in)Elastic moment of inertia (in4)Inelastic moment of inertia (in4)Iinelastic / IelasticElastic reduced I (in4)
Example 1
Shored
0.651.00363.5115
2,40812.04
307.56.253.0
W16 x 319.1224.285.051,4481,0700.741,249
Example 2
0.902.50504.0145
3,6447.954010
7.53.0
W24 x 5516.267.935.53
5,2594,0600.774,748
Table 2 - Summary of Deflection Calculations
Component
Elastic dead loadShrinkage (1 year)Creep (1 year)Full LL (1 year)
Total deflection
Live Load (LRFD Manual)
Example 1
0.28 (L/1286)0.30 (1/1200)0.06 (L/6000)0.50 (L/720)
1.14 (L/315)
0.59 (L/610)
Example 2
1.33 (L/360)0.46 (L/1043)0.03 (L/8000)1.04 (L/461)
1.53 (L/313) [*]
1.22 (L/393)
[*] All dead load deflection taken by cambering the beam for Example 2.
18-11
© 2003 by American Institute of Steel Construction, Inc. All rights reserved.This publication or any part thereof must not be reproduced in any form without permission of the publisher.

The calculation of the contribution of creep to total final deflection issensitive to the assumptions of which loads are continuously present. In thecase of a composite beam built using shored construction arguably all the deadload should be used since once the shores are removed the entire load istransferred to the concrete. Assuming that 25% of the live load was presentthroughout the first year for both cases, the deflections due to creep are 0.06in. for Example 1, and 0.03 in. for Example 2.
A very common assumption in order to avoid all the tedious calculations necessaryto find an "exact" age-adjusted modulus is to assume that the effective moduluswould be the initial modulus divided by 2.5. In this case the calculateddeflections for creep increases to 0.10 in for Example 1 and 0.05 in for Example2. In all cases it seems that creep deflections would not be important providedonly a small portion (25%) of the live load is present continuously.
For Example 1 which deals with the design of a shored composite beam, thecomputed creep and shrinkage deflection of 0.36 in. represents L/1000 (see Table2). This represents 72% of the deflection under live load (0.50 in) and about129% of the dead load deflection (0.28 in). The deflection due to shrinkage wasabout five times greater that due to creep. The superposition of the live load,creep, and shrinkage deflections at one year gives a total deformation of 1.14in. or L/315. This is almost twice that predicted by the AISC LRFD procedureusing a very conservative estimate for moment of inertia. For Example 2 whichdeals with an unshored composite beam, the computed creep and shrinkagedeflection of 0.49 in. represents L/980. This deflection represents 47% of thelive load deflection and 37% of the dead load deflections. The deflection dueto shrinkage was about 15 times greater than that due to creep. This indicatesthat we can probably ignore the long and tedious calculations required for creepin unshored construction under most circumstances.
Figure 5 - Effect of end restrain on beam deflections.
18-12
© 2003 by American Institute of Steel Construction, Inc. All rights reserved.This publication or any part thereof must not be reproduced in any form without permission of the publisher.
EFFECT OF END RESTRAINT
The degree of fixity at the end of a beam can have a significant impact on thetotal deflection. There is a large amount of continuity in most compositefloors, including additional reinforcement over the column lines to decrease thesize of cracks. Figure 5 shows the centerline deformations for a composite beamattached to a column given several degrees of semi-rigid end restraint. The beamdimensions for this example are the same as those for the tests described in thenext section. For a connection consisting of double web angles and eight #4rebar in the slab, the reduction in deflection was over 68%. For a connectionmade up of a large seat angle and the same amount of rebar in the slab, thedecrease was close to 72%. Finally, for a connection consisting of a weldedbottom plate, web angles, and the same amount of slab rebar, the reduction indeflection was almost 79%. The maximum reduction, of course, is 80%, the ratioof simply-supported to fixed-end deflection. In these calculationsexperimentally-derived moment-rotation curves were used. The tests also showedthe importance of the torquing of bolts in a connection to obtain dependablemoment-rotation relationships.
EXPERIMENTAL RESULTS
In order to study the issues discussed above, four long composite girders arecurrently being tested at the University of Minnesota. The first two beams weretested to determine differences between shored and unshored construction, whilethe latter two will be used to study the long-term deformations due to creep andshrinkage. The first two tests have been completed, and will be discussed here.While the creep and shrinkage data for these tests refers only to the first sixtydays since casting, it is sufficient to demonstrate some of the points madeabove.
Specimen Description
The composite test specimens consisted of W18x35 beams on 32 ft. spans. Thebeams were nominally A36 steel, and were all from the same lot in order tominimize the influence of material properties on the final results. The unshoredbeam specimen (Beam III) was mechanically cambered approximately 3/4 in. tooffset deflections due to the concrete self-weight. Strains were monitored inthe beam flanges and web during the cambering operations to determine theremaining cambering stresses . The shored beam (Beam IV) was not cambered.Three shores, spaced at 8 ft., were used to support the beam during casting.The shores used consisted of manual jack with a 25 kip load cell mounted on top,and a wood shim between the load cell and the specimen to distribute the load.The shores were removed five days after casting when the concrete strengthexceeded 75% of its specified strength.
The slab was 96 in. wide, cast on 18 gage, 3 in. metal deck. It contained onlynominal shrinkage and temperature reinforcement in the form of 6 x 6 x 10/10welded wire fabric, placed approximately 1 in. from the top of the slab. Readymix normalweight concrete was used for the floor slabs. The concrete had anominal 4.0 ksi strength and 3.0 in. slump at the delivery time. Standardcompression tests on concrete cylinders taken during the casting process andcured in the same manner as the slab demonstrated average concrete compressivestrength of 5.0 ksi at 28 days.
18-13© 2003 by American Institute of Steel Construction, Inc. All rights reserved.
This publication or any part thereof must not be reproduced in any form without permission of the publisher.
The composite action was achieved with 6 in. long 3/4 in Nelson headed studs.The shear studs were welded through the steel deck to the beams top chord atapproximately the same spacing (12 in.). All welds were tested by "sounding"the studs with a hammer, and questionable studs were given a 15 degree bend test.Faulty studs were replaced and retested. The final design called for a totalof 34 studs for both beams. The actual number of studs employed was 38 per beam,allowing for double studs in the two end flutes.
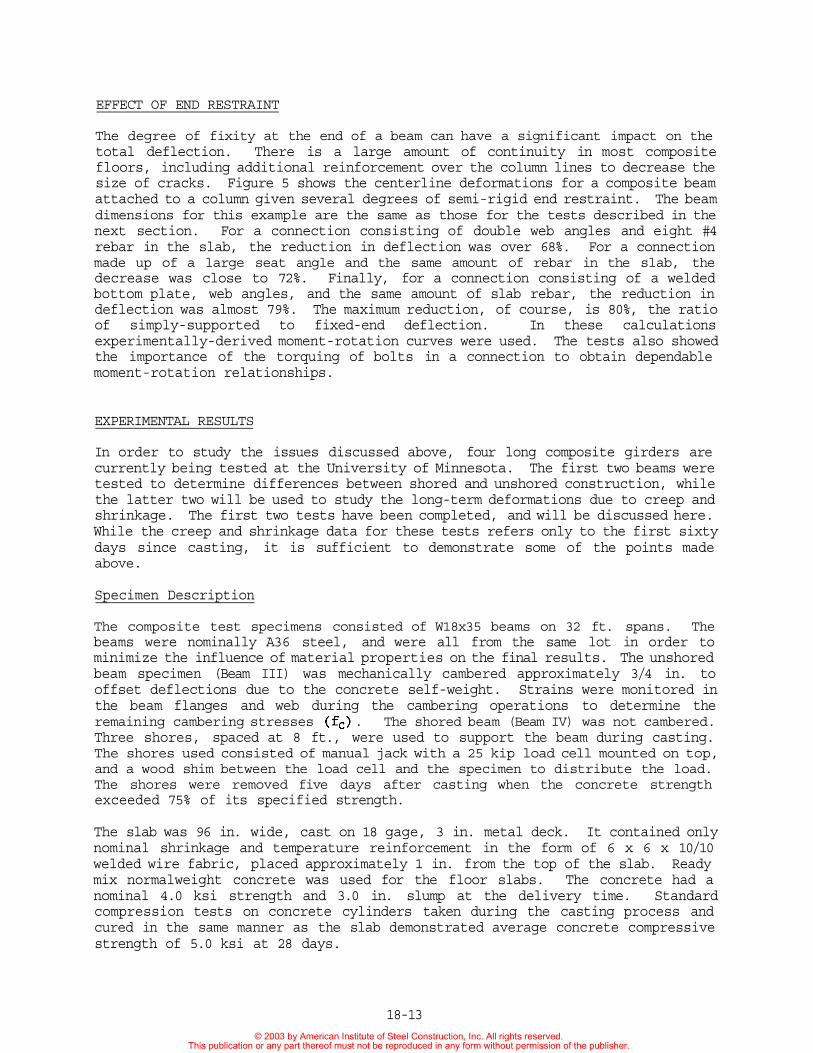
The beam ends were not supported on rollers as for most laboratory tests, asthe simulating the influence of weak but realistic end restraints was a part ofthe program. The end supports for both beams were designed to reproduce thesituation where a secondary beam or a main beam is framing into a floor column.Stub columns 6 ft. long were placed into a 3 ft. deep concrete mold and concretewas then cast. After concrete hardened the concrete block with the stubs werebolted to the rigid floor slab. The steel beams were attached to the flangesof steel column stub by means of double clip angles (L 5x5x1/2) allowing forthree rows of 3/4 in. A325 LeJeune tension control bolts (Fig. 6).
Figure 6 - End supports for test specimens.
The test frame consisted of two 80 K actuators connected to two W12x65 spreaderbeams 50 in. long. This resulted in a four point load configuration, giving amoment diagram very close to that of a distributed load. The contact between
18-14
© 2003 by American Institute of Steel Construction, Inc. All rights reserved.This publication or any part thereof must not be reproduced in any form without permission of the publisher.
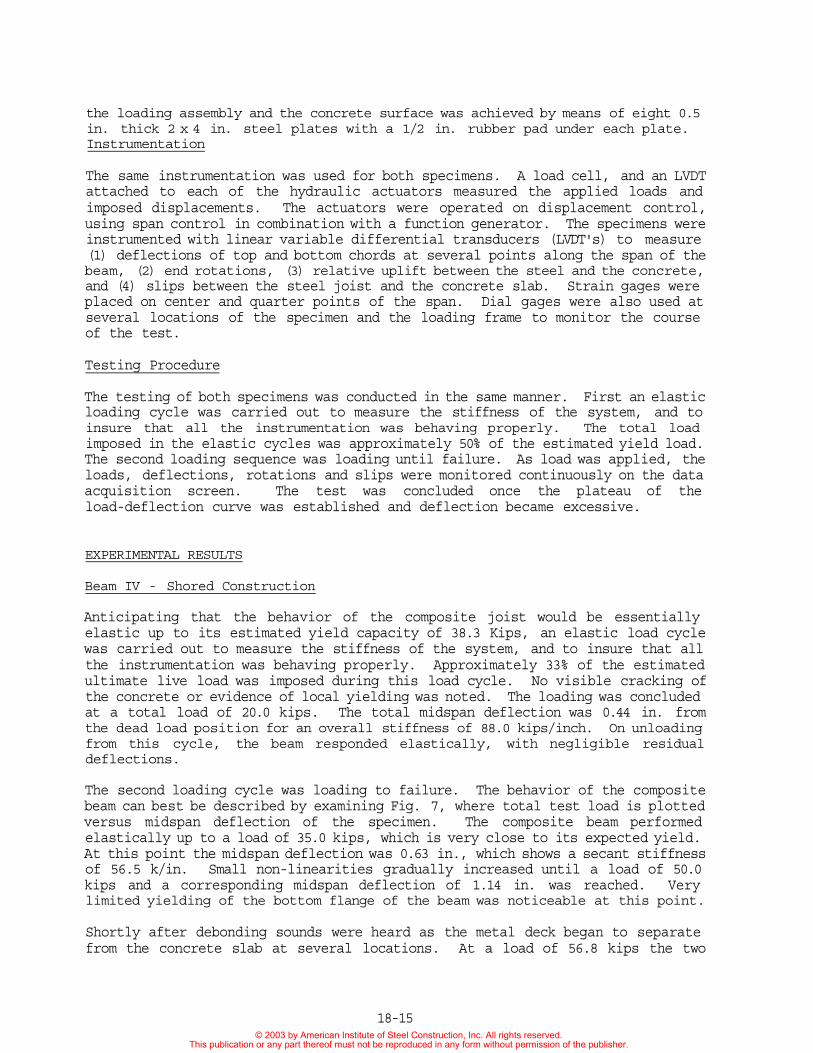
the loading assembly and the concrete surface was achieved by means of eight 0.5in. thick 2 x 4 in. steel plates with a 1/2 in. rubber pad under each plate.Instrumentation
The same instrumentation was used for both specimens. A load cell, and an LVDTattached to each of the hydraulic actuators measured the applied loads andimposed displacements. The actuators were operated on displacement control,using span control in combination with a function generator. The specimens wereinstrumented with linear variable differential transducers (LVDT's) to measure(1) deflections of top and bottom chords at several points along the span of thebeam, (2) end rotations, (3) relative uplift between the steel and the concrete,and (4) slips between the steel joist and the concrete slab. Strain gages wereplaced on center and quarter points of the span. Dial gages were also used atseveral locations of the specimen and the loading frame to monitor the courseof the test.
Testing Procedure
The testing of both specimens was conducted in the same manner. First an elasticloading cycle was carried out to measure the stiffness of the system, and toinsure that all the instrumentation was behaving properly. The total loadimposed in the elastic cycles was approximately 50% of the estimated yield load.The second loading sequence was loading until failure. As load was applied, theloads, deflections, rotations and slips were monitored continuously on the dataacquisition screen. The test was concluded once the plateau of theload-deflection curve was established and deflection became excessive.
EXPERIMENTAL RESULTS
Beam IV - Shored Construction
Anticipating that the behavior of the composite joist would be essentiallyelastic up to its estimated yield capacity of 38.3 Kips, an elastic load cyclewas carried out to measure the stiffness of the system, and to insure that allthe instrumentation was behaving properly. Approximately 33% of the estimatedultimate live load was imposed during this load cycle. No visible cracking ofthe concrete or evidence of local yielding was noted. The loading was concludedat a total load of 20.0 kips. The total midspan deflection was 0.44 in. fromthe dead load position for an overall stiffness of 88.0 kips/inch. On unloadingfrom this cycle, the beam responded elastically, with negligible residualdeflections.
The second loading cycle was loading to failure. The behavior of the compositebeam can best be described by examining Fig. 7, where total test load is plottedversus midspan deflection of the specimen. The composite beam performedelastically up to a load of 35.0 kips, which is very close to its expected yield.At this point the midspan deflection was 0.63 in., which shows a secant stiffnessof 56.5 k/in. Small non-linearities gradually increased until a load of 50.0kips and a corresponding midspan deflection of 1.14 in. was reached. Verylimited yielding of the bottom flange of the beam was noticeable at this point.
Shortly after debonding sounds were heard as the metal deck began to separatefrom the concrete slab at several locations. At a load of 56.8 kips the two
18-15© 2003 by American Institute of Steel Construction, Inc. All rights reserved.
This publication or any part thereof must not be reproduced in any form without permission of the publisher.
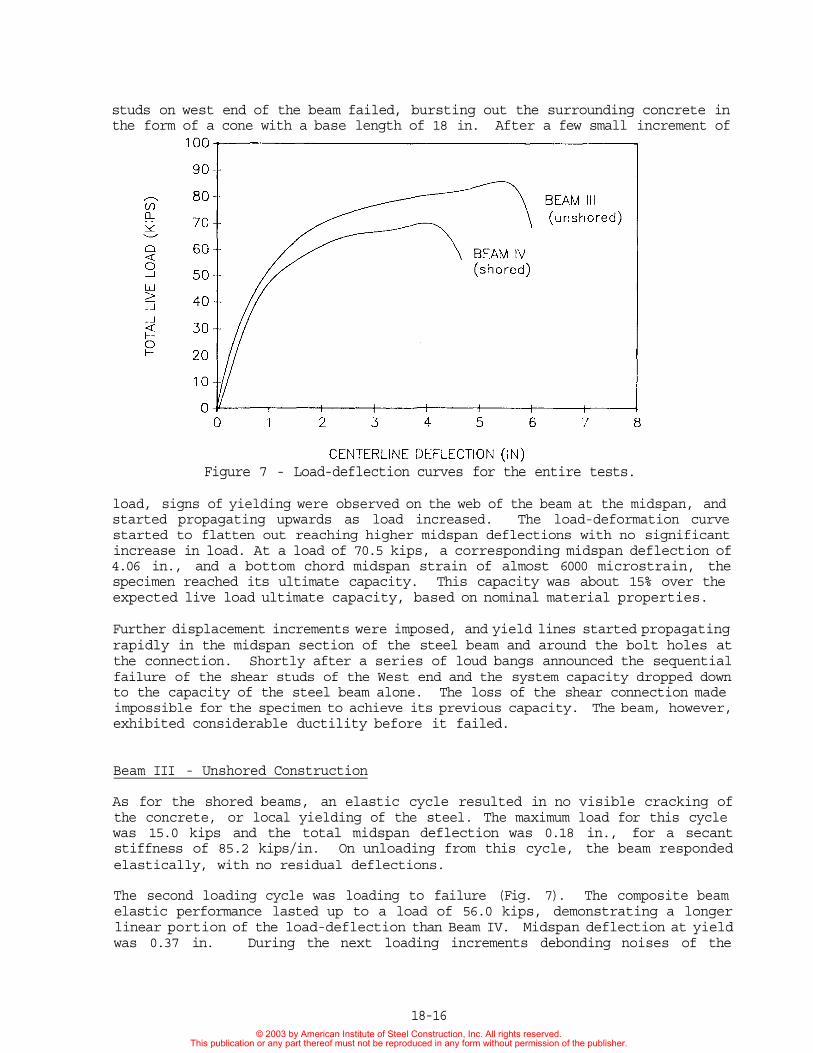
studs on west end of the beam failed, bursting out the surrounding concrete inthe form of a cone with a base length of 18 in. After a few small increment of
Figure 7 - Load-deflection curves for the entire tests.
load, signs of yielding were observed on the web of the beam at the midspan, andstarted propagating upwards as load increased. The load-deformation curvestarted to flatten out reaching higher midspan deflections with no significantincrease in load. At a load of 70.5 kips, a corresponding midspan deflection of4.06 in., and a bottom chord midspan strain of almost 6000 microstrain, thespecimen reached its ultimate capacity. This capacity was about 15% over theexpected live load ultimate capacity, based on nominal material properties.
Further displacement increments were imposed, and yield lines started propagatingrapidly in the midspan section of the steel beam and around the bolt holes atthe connection. Shortly after a series of loud bangs announced the sequentialfailure of the shear studs of the West end and the system capacity dropped downto the capacity of the steel beam alone. The loss of the shear connection madeimpossible for the specimen to achieve its previous capacity. The beam, however,exhibited considerable ductility before it failed.
Beam III - Unshored Construction
As for the shored beams, an elastic cycle resulted in no visible cracking ofthe concrete, or local yielding of the steel. The maximum load for this cyclewas 15.0 kips and the total midspan deflection was 0.18 in., for a secantstiffness of 85.2 kips/in. On unloading from this cycle, the beam respondedelastically, with no residual deflections.
The second loading cycle was loading to failure (Fig. 7). The composite beamelastic performance lasted up to a load of 56.0 kips, demonstrating a longerlinear portion of the load-deflection than Beam IV. Midspan deflection at yieldwas 0.37 in. During the next loading increments debonding noises of the
18-16© 2003 by American Institute of Steel Construction, Inc. All rights reserved.
This publication or any part thereof must not be reproduced in any form without permission of the publisher.
concrete slab beginning to separate from the metal deck were heard at severallocations along the span of the beam. Cracking of the whitewash on the bottomflange of the beam indicated limited yielding. The yield lines startedpropagating through the web as the loading progressed. At a load of 60.0 kipsand a deflection of 1.3 in., the load-deflection curve started to flatten. Atthis stage a thorough inspection of the specimen did not indicate any damage tothe specimen or the connection, or signs of slips or uplift of the deck.
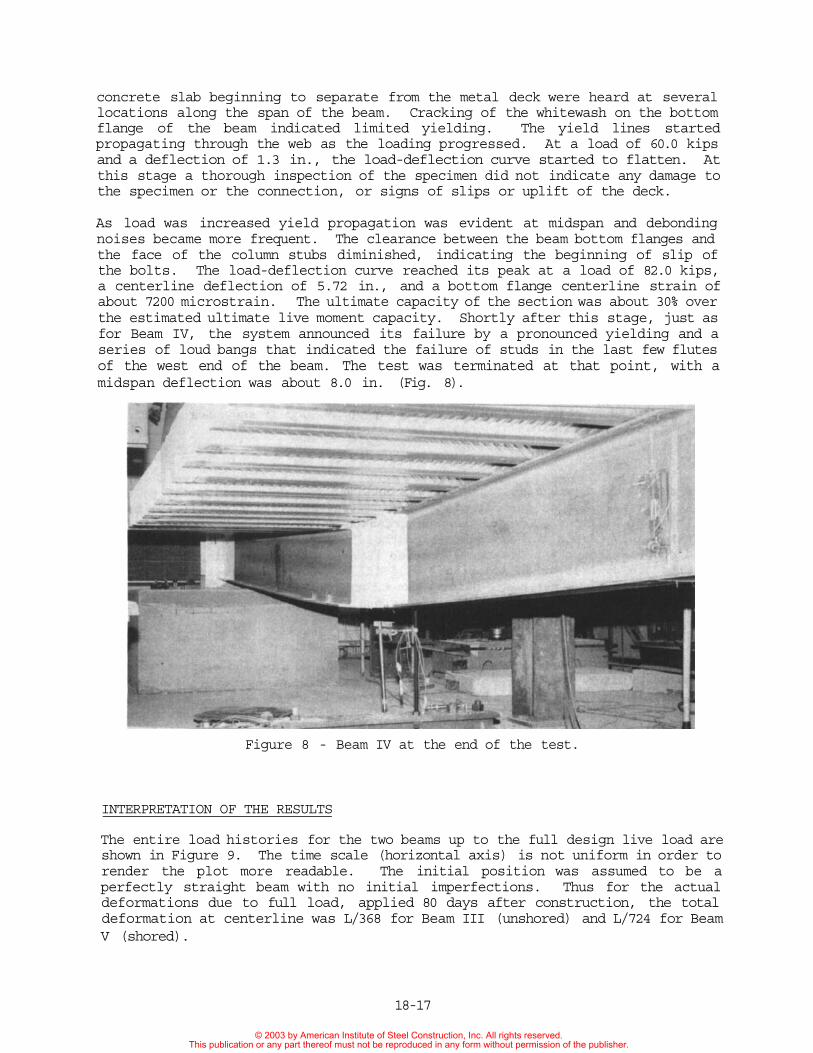
As load was increased yield propagation was evident at midspan and debondingnoises became more frequent. The clearance between the beam bottom flanges andthe face of the column stubs diminished, indicating the beginning of slip ofthe bolts. The load-deflection curve reached its peak at a load of 82.0 kips,a centerline deflection of 5.72 in., and a bottom flange centerline strain ofabout 7200 microstrain. The ultimate capacity of the section was about 30% overthe estimated ultimate live moment capacity. Shortly after this stage, just asfor Beam IV, the system announced its failure by a pronounced yielding and aseries of loud bangs that indicated the failure of studs in the last few flutesof the west end of the beam. The test was terminated at that point, with amidspan deflection was about 8.0 in. (Fig. 8).
Figure 8 - Beam IV at the end of the test.
INTERPRETATION OF THE RESULTS
The entire load histories for the two beams up to the full design live load areshown in Figure 9. The time scale (horizontal axis) is not uniform in order torender the plot more readable. The initial position was assumed to be aperfectly straight beam with no initial imperfections. Thus for the actualdeformations due to full load, applied 80 days after construction, the totaldeformation at centerline was L/368 for Beam III (unshored) and L/724 for BeamV (shored).
18-17
© 2003 by American Institute of Steel Construction, Inc. All rights reserved.This publication or any part thereof must not be reproduced in any form without permission of the publisher.

Initial Stresses
Initially Beam III was given a 0.75 in. camber, which was calculated to offsetdead load deflection. A calculation of the required camber for simply-supportedbeam indicated that 1.00 in. would be required; however, because the endrestraints were included in the calculation, only 3/4 of this camber was actuallyapplied.
The beam was mechanically cambered with a two point load system, and the strainsat the centerline section were monitored. While the residual stresses due torolling and straightening were not measured, some idea of their magnitude canbe inferred from the strains measured during cambering. Figure 10 shows thestrains measured near the flange tips of the top and middle of the top flange(gages 5 and 6) and near the tip of the bottom flanges (gages 1 and 3) as thecambering progressed. The data indicates very uneven yielding across thesection. For example gage 6 shows yielding at only 800 microstrain of tension,indicating a residual tensile stress after rolling and straightening of about18 ksi. On the other hand, gage 3 shows yielding near 1800 microstrain,indicating an initial residual compressive stress of 12 ksi. After cambering,gage 6 showed a residual stress near zero, while gage 3 showed a compressiveresidual stress of 18 ksi in tension.
Casting
When the concrete was cast, Beam III was observed to sag approximately 0.76 in.This was very close to its calculated deflection, and taking up all the camberin the beam. Beam III, which was supported on three jacks with a wooden shimon top, was observed to have compressed those wooden blocks by 0.25 in. as thewood crept. When the shores were removed five days after casting, Beam IV wasobserved to deflect by an additional 0.15 in. of midspan deflection due to itsself-weight. Thus the total deformations for this stage were 0.76 in. for theunshored beam and 0.40 in. for the shored one.
Creep and Shrinkage
The creep and shrinkage deformations were measured for a period of approximatelysixty days after casting. For Beam IV (shored), the creep deformations referonly to the time after the shores were removed. In total Beam III deflected bya total of about 0.24 in., while Beam IV deflected by 0.22 in. It should benoted that while the changes in deflection with time were becoming smaller atthis stage, they had by no means reached their ultimate values.
The strains on the concrete slab were measured using embedment gages, and showeda significant amount of initial plastic shrinkage even though the specimens werekept wet and covered. For the purposes of discussion the creep and shrinkagestrains were zeroed at three days to eliminate these initial effects. Beam IIIshowed an average change of 460 microstrain at the top centerline of the slab,and 450 microstrain at the quarter points after 63 days. For Beam IV, theaverage at centerline was 190 microstrain, and 390 microstrain at the quarterpoints. Local measurements of creep and shrinkage vary considerably, of course,but the values reported seem very reasonable when compared to those of otherresearchers [9,10].
18-18
© 2003 by American Institute of Steel Construction, Inc. All rights reserved.This publication or any part thereof must not be reproduced in any form without permission of the publisher.
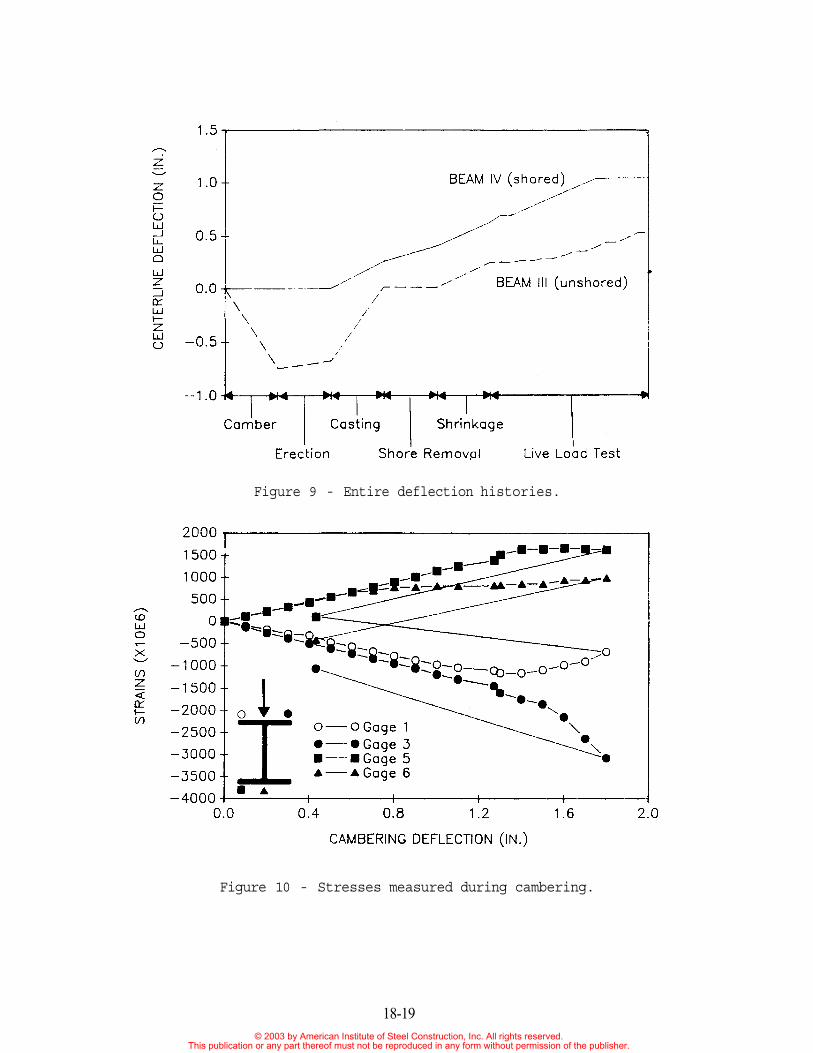
Figure 9 - Entire deflection histories.
Figure 10 - Stresses measured during cambering.
18-19© 2003 by American Institute of Steel Construction, Inc. All rights reserved.
This publication or any part thereof must not be reproduced in any form without permission of the publisher.

End Restraint
The degree of end restraint provided by the double angle web connection isdifficult to quantify. Although formulas can be found in the literature forinitial stiffness and ultimate moment capacity for these connections, the scatterin the data is very large. For Beam III, calculation of the ratio of centerlineto end moments during the casting sequence indicate that 76% of the moment wentas positive moment at the center and 24% as negative moment to the connection.Recalling that for a fixed-fixed beam the ratio of positive to negative momentsis 2:1, the ratio of about 3.2:1 measured implies a large degree of initial endfixity. Similar calculations for Beam IV for the removal of the shores indicatesa much smaller amount of end restraint, with the ratio being about 5.0:1.
Behavior under Service Loads
Figure 11 shows the stiffness of the system during live loading. As can be seen,Beam IV showed a slightly larger stiffness initially, although the systemstiffness is very similar for both specimens with an offset of about 0.08 in.between the two. The important point to notice is that the stiffnesses decreasedconsistently, and that by the time L/360 (1.07 in.) is reached the beams aredefinitely performing non-elastically. The initial stiffness corresponding toa simply-supported beam would have been about 82 kip/in for the elastic momentof inertia (2370 in4) and 62 kip/in for the lower bound moment of inertia inLRFD (Fig. 12).
Behavior at Ultimate
The ultimate strength of the beam was governed by the shear studs. In the designof the beams nominal values for stud resistance (21.9 kips/stud) and steel yieldstrength (36 ksi) were used. The 19 studs provided on each side of centerlinecorrespond to 416.1 kips of horizontal shear resistance at the steel-concreteinterface. The total without a factor was 370.8 kips. However, becausethe actual steel yield strength was 43.3 ksi, the latter number was actuallycloser to 445.9 kips. Thus the shear studs were weaker and, as described in aprevious section, were the source of failure at ultimate. The ultimate capacityof the beam should have been about 83.3 kips (without any factors), while thefailure occurred at a load of 70.5 ksi for Beam IV and 82.0 ksi for Beam III.
The slip began immediately with the application of the first load, and at firstappears to have a linear relationship with the applied load. However, in generalthe linear relationship quickly becomes nonlinear as the amount of slip increasedrapidly with small increments of load. The slip was extremely large near thesupports, indicating that the end shear connectors are subjected to more shearforce than those near the center (Figure 13).
An examination of the slip data clearly shows that both specimens did not behavein a fully composite manner. The relative movement between two adjacentsurfaces, as is the case for incomplete interaction, makes it necessary that theuse of the elastic theory be modified to take into account the straindiscontinuity in evaluating the strength and service characteristics of suchmembers.
18-20© 2003 by American Institute of Steel Construction, Inc. All rights reserved.
This publication or any part thereof must not be reproduced in any form without permission of the publisher.
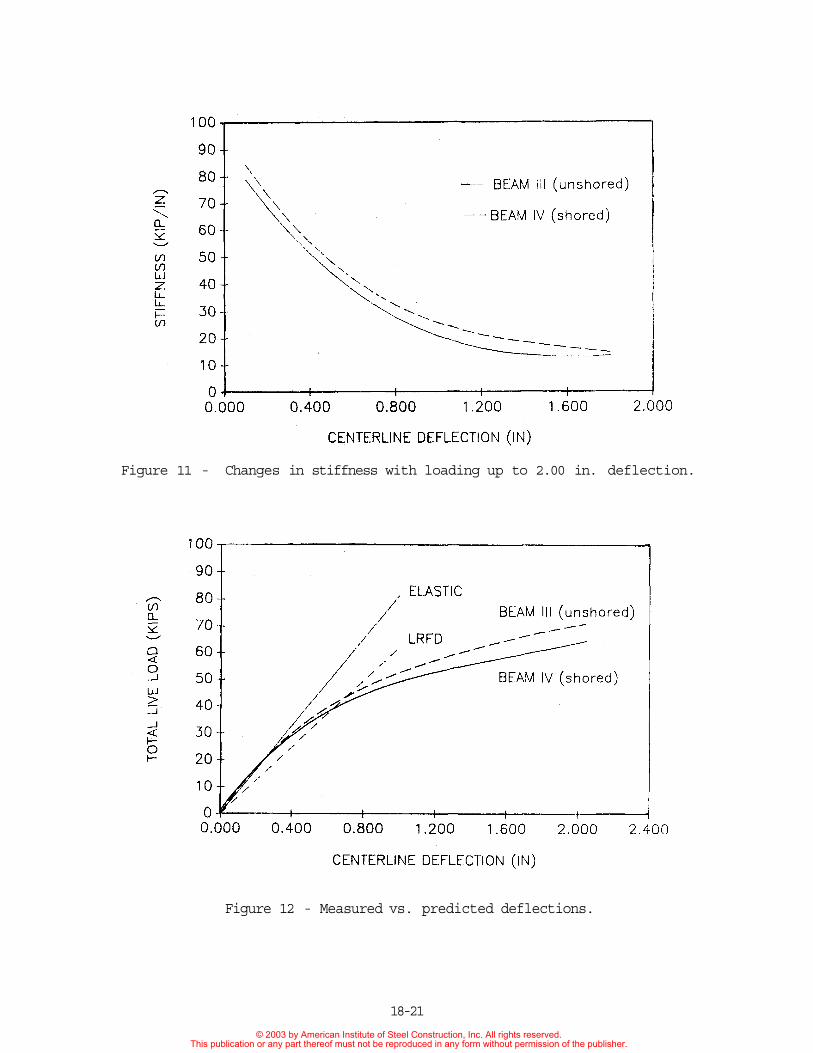
Figure 11 - Changes in stiffness with loading up to 2.00 in. deflection.
Figure 12 - Measured vs. predicted deflections.
18-21
© 2003 by American Institute of Steel Construction, Inc. All rights reserved.This publication or any part thereof must not be reproduced in any form without permission of the publisher.
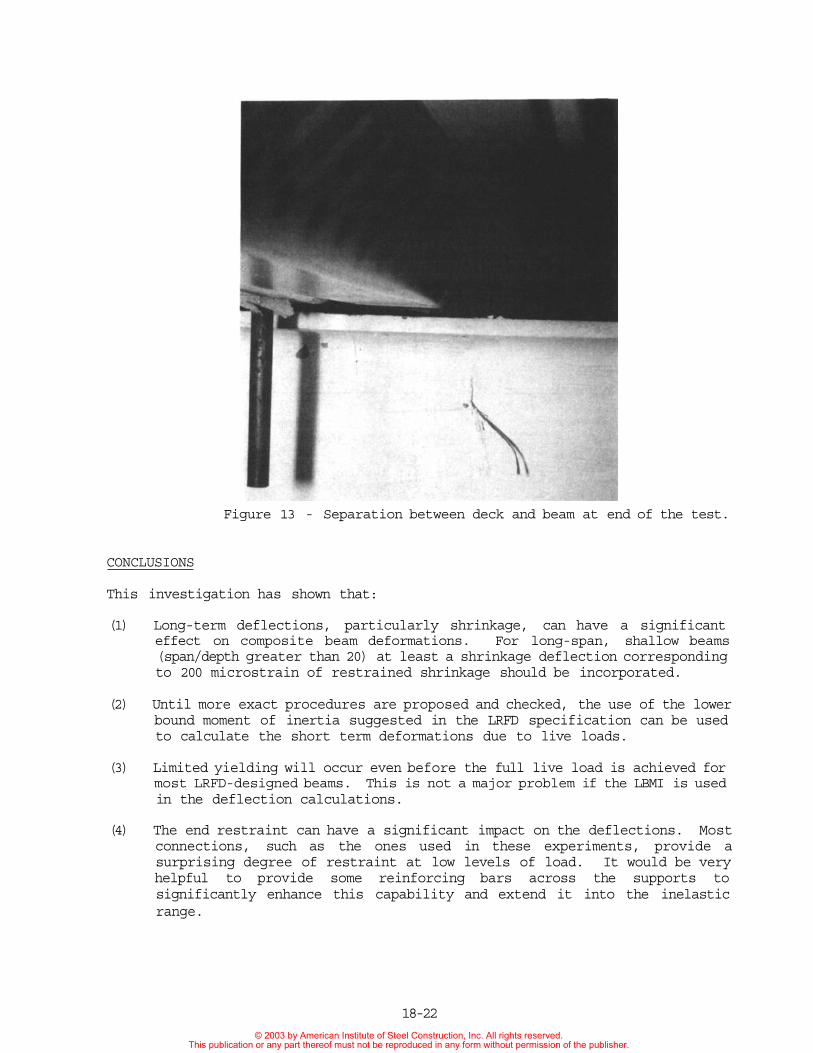
Figure 13 - Separation between deck and beam at end of the test.
CONCLUSIONS
This investigation has shown that:
(1) Long-term deflections, particularly shrinkage, can have a significanteffect on composite beam deformations. For long-span, shallow beams(span/depth greater than 20) at least a shrinkage deflection correspondingto 200 microstrain of restrained shrinkage should be incorporated.
(2) Until more exact procedures are proposed and checked, the use of the lowerbound moment of inertia suggested in the LRFD specification can be usedto calculate the short term deformations due to live loads.
(3) Limited yielding will occur even before the full live load is achieved formost LRFD-designed beams. This is not a major problem if the LBMI is usedin the deflection calculations.
(4) The end restraint can have a significant impact on the deflections. Mostconnections, such as the ones used in these experiments, provide asurprising degree of restraint at low levels of load. It would be veryhelpful to provide some reinforcing bars across the supports tosignificantly enhance this capability and extend it into the inelasticrange.
18-22
© 2003 by American Institute of Steel Construction, Inc. All rights reserved.This publication or any part thereof must not be reproduced in any form without permission of the publisher.

REFERENCES
1. Moore, W.P., "Mixed Systems, Past Practice, Recent Experience and FutureDirection," in Composite and Mixed Construction (C. Roeder, ed.), Proceedingsof the U.S./Japan Joint Seminar, ASCE, New York, 1985, pp. 138-149.
2. Ritchie, J.K., and Chien, E.Y.L., "Construction of Composite Floor Systemsin Buildings," in Composite Construction (C. Dale Buckner and Ivan M. Viest,eds.), Proceedings of an Engineering Foundation Conference, ASCE, New York,1988, pp. 358-373.
3. AISC, "Manual of Steel Construction," 8th Edition, American Institute ofSteel Construction, Chicago, 1980.
4. AISC, "Manual of Steel Construction - LRFD," American Institute of SteelConstruction, Chicago, 1986.
5. CSA, "CAN3-S16.1-M84 - Steel Structures for Buildings (Limit States Design),"Canadian Standards Association, Rexdale (Toronto), Canada, December, 1984.
6. Vallenilla, C. and Bjorhovde, R., "Effective Width Criteria for CompositeBeams," AISC Engineering Journal, Vol. 22, No. 4, 1985, pp. 169-175.
7. Taylor, A.W., "A Study of the Behavior of Simply-Supported Composite Beams,"M.S. Thesis, Dept, of Civil Engineering, U. of Washington, Seattle, 1985,130 pp.
8. Robinson, H., and Narieane, K.S., "Slip and Uplift Effects in CompositeBeams," in Composite Construction (C. Dale Buckner and Ivan M. Viest, eds.),Proceedings of an Engineering Foundation Conference, ASCE, New York, 1988,pp. 487-497.
9. Chien, E.Y.L., and Ricthie, J.K., Composite Floor Systems, Canadian Instituteof Steel Construction, Willowdale, Ontario, CANADA, 1984, 333 pp.
10. Brattland, A., and Kennedy, D.J.L., "Shrinkage and Flexural Tests of TwoFull-Scale Composite Trusses," Structural Engineering Report No. 143, TheUniversity of Alberta, Edmonton, Alberta, December, 1986, 264 pp.
11. ACI Committee 209, "Prediction of Creep, Shrinkage and Temperature Effectsin Concrete Structures," in SP-27: Designing for the Effects of Creep,Shrinkage, and Temperature in Concrete Structures, American ConcreteInstitute, Detroit, Michigan, 1971, pp. 51-93.
12. Viest, I., Fountain, R.S., and Singleton, R.C., Composite Construction inSteel and Concrete for Bridges and Buildings, McGraw-Hill, New York, 1958,176 pp.
13. Bazant, Z.P., "Prediction of Concrete Creep Effects by the Age-AdjustedModulus Method," J. ACI, Vol. 69, No. 4, April 1972, pp. 212-217.
18-23
© 2003 by American Institute of Steel Construction, Inc. All rights reserved.This publication or any part thereof must not be reproduced in any form without permission of the publisher.